Article

The Dry Deposition Effect of PM2.5 in Urban Green Spaces of Beijing, China

1
Institute of Forestry and Pomology, Beijing Academy of Agriculture and Forestry Sciences, Beijing 100093, China
2
Beijing Yanshan Forest Ecosystem Research Station, National Forest and Grassland Administration, Beijing 100093, China
3
College of Forestry, Shenyang Agricultural University, Shenyang 110866, China
*
Authors to whom correspondence should be addressed.
These authors contributed equally to this work.
Sustainability 2025, 17(21), 9608; https://doi.org/10.3390/su17219608 (registering DOI)
Submission received: 1 September 2025 / Revised: 4 October 2025 / Accepted: 16 October 2025 / Published: 29 October 2025
(This article belongs to the Special Issue Air Quality Characterisation and Modelling—2nd Edition)

Abstract

As an important part of the urban ecological environment, urban green space plays a crucial and irreplaceable role in improving air quality, promoting sustainable development, and enhancing residents’ quality of life. This study takes Beijing’s urban green space as the research object. Based on Landsat series satellite remote sensing images, the land use distribution of Beijing is obtained through supervised classification. Combined with data such as PM2.5 concentration and wind speed, the dry deposition efficiency of PM2.5 is quantitatively analyzed. The results show that: (1) Beijing’s urban green space has significant advantages in PM2.5 dry deposition. In terms of dry deposition flux, the order of annual average deposition of different land types is: forest land > farm land > grassland > impervious surface > water body = unutilized land. Among them, forest land has the best dry deposition effect, with an annual average dry deposition of 1.13 g/m2, which is 188.41 times that of impervious surface; cultivated land and grassland are 0.22 g/m2 and 0.19 g/m2 respectively, which are 37.13 times and 32.34 times that of impervious surface. (2) From 2000 to 2020, the PM2.5 removal rate of green space continued to rise, but the reduction amount showed a trend of first increasing and then decreasing. There are significant seasonal differences. The reduction amount is the highest in autumn (reaching 449.90 tons in October), followed by summer, spring, and winter (the lowest in August, at 190.27 tons). (3) In terms of spatial distribution, the high-value areas of dry deposition are concentrated in the suburbs, showing a “southwest-northeast” axial distribution, while the low-value areas are mainly located in the outer suburbs, reflecting the imbalance of green space layout and the regional differences in PM2.5 reduction. Combined with the current situation of green space in Beijing, the study puts forward targeted optimization suggestions, providing theoretical support and scientific basis for the construction of Beijing as a “garden city”.

1. Introduction

Since the year 2000, the accelerated pace of urbanization has led to increasingly severe air pollution issues, with PM2.5 (atmospheric particulate matter with a diameter of ≤2.5 μm) identified as a major source of urban air pollution. This poses a serious threat to the ecological environment, economic development, and human health [1,2,3], presenting significant challenges in megacity clusters such as the Beijing-Tianjin-Hebei region, the Yangtze River Delta, and the Pearl River Delta. Compared to gaseous pollutants, PM2.5 remains in the atmosphere for longer periods, posing greater risks to human health [4], thereby constraining the high-quality, sustainable development of urban ecological and health-oriented growth. In recent years, China has implemented a series of measures to control PM2.5 at its source, achieving notable results [5], though these efforts have also to some extent constrained urbanization. Therefore, how to address PM2.5 pollution through natural-economic synergistic measures has become a significant issue in the global ecological and environmental field [6,7,8].
Urban green spaces refer to all vegetation within cities, including forests, farmland, and grasslands [9]. As an essential component of the urban environment, they not only meet people’s daily needs for leisure, exercise, and social interaction but also play a crucial role in improving urban ecological environments [10], maintaining regional carbon cycles [11], regulating local urban climate [12], improving residents’ mental health, and promoting urban sustainable development [13,14]. Research indicates that air quality in urban vegetation areas is generally superior to non-vegetation areas, primarily due to plants’ strong ability to adsorb and retain atmospheric particulate matter [15], effectively reducing PM2.5 and other particulate matter concentrations in the air.
The diversification of urban land use has led to the formation of distinct landscape patterns, which to some extent reflect differences in the intensity of particulate matter emissions such as PM2.5 resulting from human activities. Among these, urban green spaces serve as “sinks” for PM2.5 within the urban ecosystem, and their landscape patterns significantly influence PM2.5 concentrations [16,17], with forests exhibiting the strongest reduction capacity. Numerous studies have confirmed that increasing urban green spaces is an effective way to mitigate air pollution [18,19,20], particularly through the process of dry deposition occurring on plant surfaces [21,22,23]. In 2015, the average winter dust retention volume in cities across North China was 1017.91 t, and the summer dust retention volume was 524.64 t [24]; In 2016, the total amount of PM2.5 removed by green spaces in Taipei was approximately 17.61 tons [25]. Studies in North China show that the annual PM2.5 dry deposition flux of urban woodlands is 0.8–1.2 g/m2, and individual trees (e.g., poplar trees) can remove 1.2–2.5 kg of PM2.5 per year [26].
From a global perspective, similar conclusions have been verified in studies conducted in various regions: In Boston, USA, Nowak et al. [27] found that urban woodlands, accounting for 28% of the city’s area, remove approximately 12.7 tons of PM2.5 annually, with a removal capacity of 0.35 tons per hectare per year; In Tokyo, Japan, Lee et al. [21] pointed out that road greenbelts dominated by evergreen shrubs can reduce the surrounding PM2.5 concentration by 8–10% during the dry season, with a PM2.5 dry deposition flux of 0.12–0.15 g/m2. Similarly, a study on Rio de Janeiro, Brazil, compared the entrance of the Rebouças Tunnel (with sparse vegetation) with the Rio de Janeiro Botanical Garden (with high vegetation coverage). From September 2017 to March 2018, high-volume samplers (LVS) were used to collect PM2.5 samples. The results showed that the PM2.5 concentration in the botanical garden was approximately 33% lower than that at the tunnel entrance, which further confirms the PM2.5 reduction effect of high vegetation coverage [28]; A study on the optimization of green space layout in Yerevan, Armenia constructed a main model of air pollution dynamics and combined heuristic algorithms to solve the Pareto optimal solution. On the basis of considering the absorption of pollutants by trees and the diffusion effect of emission sources, the optimal strategy for planting diverse trees around emission sources was determined under budget constraints, providing a specific path for green space configuration [29]. The above studies confirm that vegetation dry deposition is a low-cost and long-term effective method to reduce atmospheric particulate matter, providing a natural, green and cost-effective way to mitigate air pollution [30]. Therefore, the removal of PM2.5 and other particulate matter by urban green spaces has garnered significant attention in ecology.
As China’s capital and an international megacity, Beijing is committed to enhancing urban high-quality development and further showcasing the capital’s prestige and contemporary character. The “Beijing Garden City Special Plan (2023–2035)” proposes: “To build Beijing into a garden city with blue skies, clear waters, lush forests, orderly beauty, and harmonious livability”—under this vision, improving urban air quality has become a key priority. Related studies indicate that PM2.5 concentrations in urban air exhibit significant spatial variations [31]. Investigating the impact of urban green space landscape patterns on PM2.5 dry deposition is of great significance for accurately understanding the role of green spaces in improving air quality, scientifically formulating urban greening strategies, optimizing land use structures, and enhancing residents’ well-being.
Therefore, this study aims to quantitatively analyze PM2.5 dry deposition in Beijing, reveal the mechanisms and quantitative effects of urban green space landscape patterns on PM2.5 dry deposition, and provide theoretical support and practical guidance for Beijing’s garden city construction. This will help optimize the urban ecological environment, enhance ecological service functions, and create more livable living spaces for residents. Additionally, it is hoped that this study will provide references for related research and practices in other cities, promoting the global development of cities toward green, healthy, and sustainable directions.

2. Materials and Methods

2.1. Study Area

Beijing is the core region of China’s politics, culture, and scientific and technological innovation. Located in the northern part of the North China Plain, it has 16 urban districts, covering an area of approximately 16,410 km2, situated between 115°25′ and 117°30′ east longitude, 39°28′–41°05′ north latitude. It is backed by the Yanshan Mountains, adjacent to Tianjin Municipality and Hebei Province, with a terrain that is higher in the northwest and lower in the southeast. To the west, it borders the Taihang Mountains, to the northeast it connects with the Songliao Plain, and to the southeast it slopes toward the Bohai Sea. The northwestern part of Beijing is primarily mountainous forestland, covering an area of 10,200 km2, while the southeastern plain area spans 6200 km2. The region has a warm-temperate, semi-humid continental monsoon climate, characterized by hot, rainy summers, cold, dry winters, and short springs and autumns. The average temperature from 2017 to 2021 was 13.8 °C, with an annual average precipitation of approximately 548.12 mm [32]. Figure 1 shows the geographical location and administrative divisions of Beijing.

2.2. Data Sources and Processing

2.2.1. Remote Sensing Data

This study utilized Landsat series remote sensing imagery, including Landsat 5 data from 2000, Landsat 7 data from 2005 and 2010, and Landsat 8 data from 2015 and 2020, with a spatial resolution of 30 m and a temporal resolution of 16 days. Due to data strip damage in the 2005 and 2010 Landsat 7 images, the Landsat_gap-fill plugin on the ENVI5.3 platform was used to repair the strips. All images were obtained from the Chinese Academy of Sciences Geospatial Data Cloud Platform (http://www.gscloud.cn, accessed on 21 September 2023). Based on vegetation phenological characteristics, images with cloud cover below 5% during the vegetation growing season (May to October) were selected to ensure data accuracy.
The obtained raster image data were subjected to preprocessing such as correction and cropping. The study area landscape was divided into six landscape types: farmland, forest land, grassland, water, impervious surfaces, and unutilized land. Using ArcGIS software for overlaying and extraction methods, a land use classification map was created.

2.2.2. PM2.5 Concentration Data

The PM2.5 concentration data used in this study were obtained from the National Earth System Science Data Center (NESSDC, http://www.geodata.cn, accessed on 8 October 2023), specifically the 2000–2020 China 1 km resolution daily seamless near-surface PM2.5 concentration dataset. This dataset was developed by the research group led by Associate Professor Bai Kaixu from the School of Geographic Sciences at East China Normal University [33], employing a series of advanced data fusion and analysis methods, including multi-source heterogeneous data fusion, missing information reconstruction, and deep learning modeling.
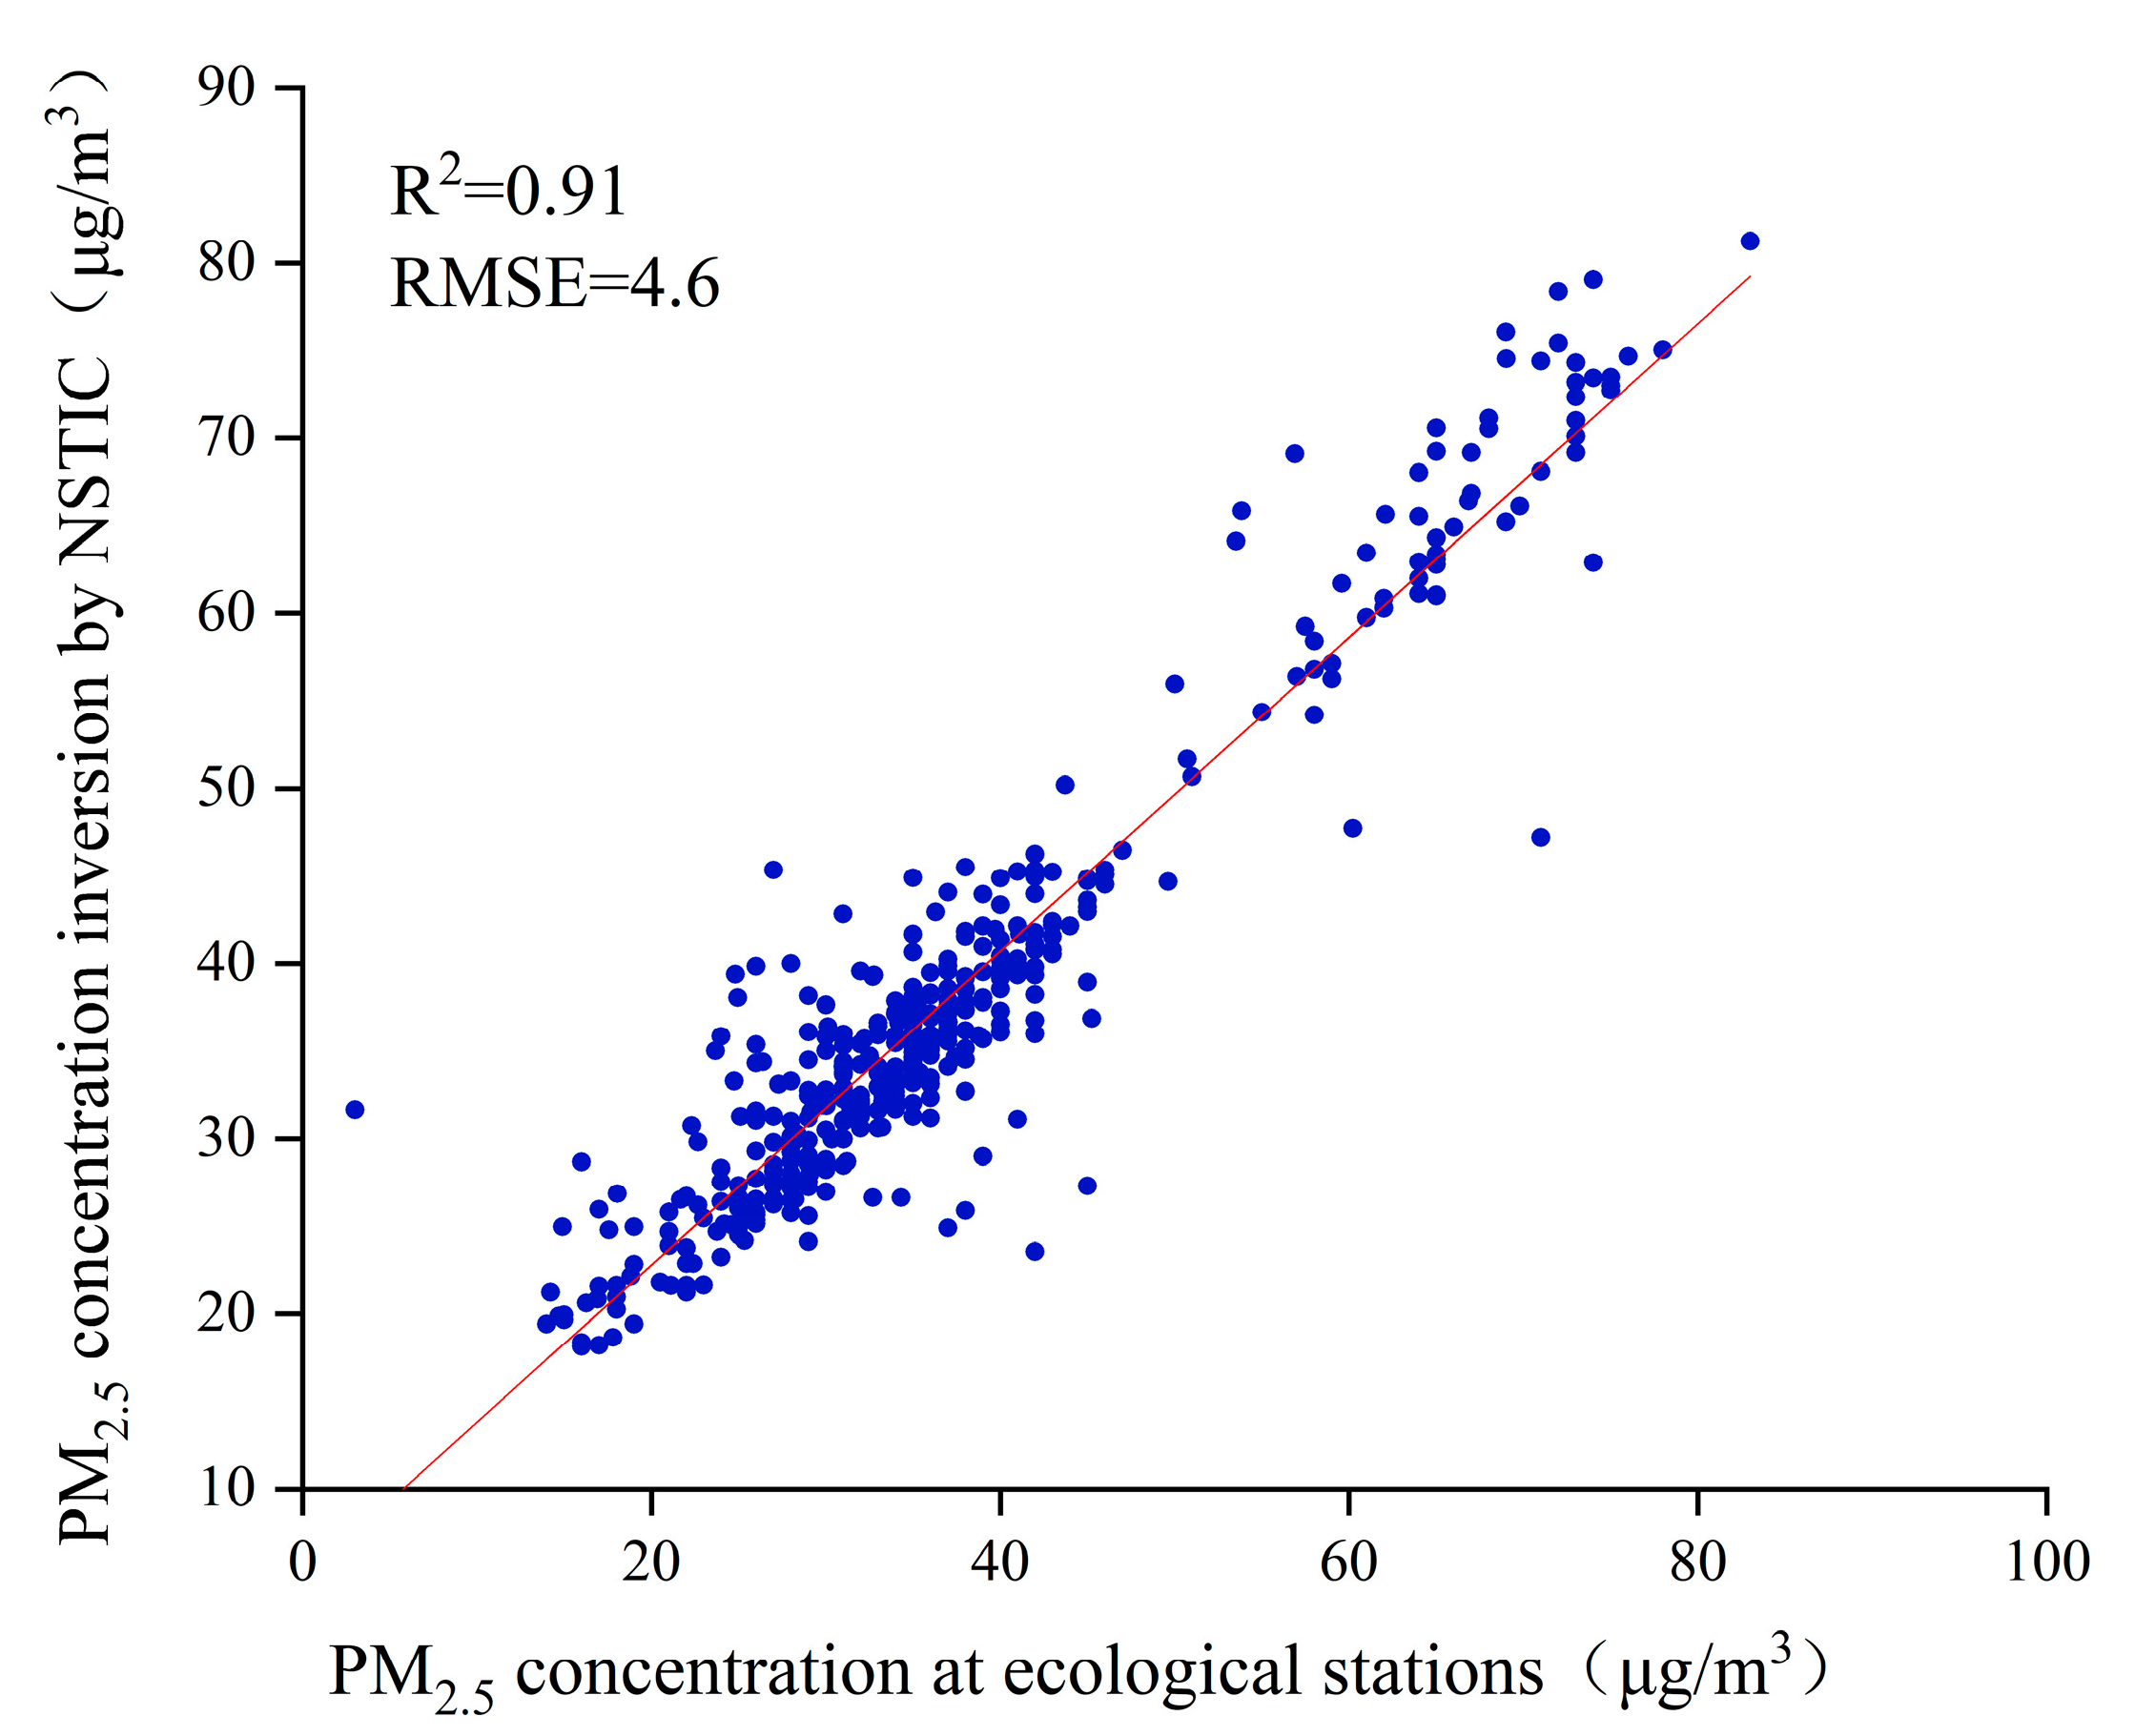
To validate the data accuracy, this study utilized data from 35 ecological stations in Beijing, as shown in Figure 2, and conducted a detailed analysis of the model’s accuracy using the coefficient of determination (R2) and root mean square error (RMSE). The results indicate that the R2 value for the fit between the measured PM2.5 concentrations at the ecological stations and the PM2.5 concentration values downloaded from NESSDC is 0.91, with an RMSE of 4.6 μg/m3, indicating a strong linear correlation between the two. This further validates the accuracy of the downloaded data, demonstrating that the NESSDC-provided 2000–2020 China 1 km resolution daily seamless near-surface PM2.5 concentration dataset can meet the requirements for research use.

2.2.3. Wind Speed and Precipitation Data

Wind speed data are derived from the 2000–2020 China 1 km resolution monthly average wind speed dataset provided by NESSDC (http://www.geodata.cn, accessed on 29 October 2023), with units in m/s. Precipitation data were obtained from the China Surface Climate Data Daily Dataset (V3.0) available on the China Meteorological Data Service Center (National Meteorological Information Center) website (http://data.cma.cn, accessed on 13 January 2024). with units in mm and a temporal resolution of daily. Additionally, during data processing, strict digital processing operation standards were established, and observational data underwent repeated quality checks and control. During this process, a large amount of data was corrected and supplemented, ensuring high-quality and reliable results. Research findings indicate that when daily precipitation exceeds 0.2 mm, all particulate matter captured on leaf surfaces-including PM2.5-can be washed off the leaf surfaces and onto the ground [34]. Therefore, in accordance with the requirements for dry deposition calculations, this study excluded days with precipitation > 0.2 mm and used days with precipitation < 0.2 mm as the number of days (D) during which urban green spaces remove PM2.5, as shown in Table 1. Additionally, considering that the amount of PM2.5 captured by vegetation leaves tends to saturate during prolonged periods without precipitation events, the number of days for PM2.5 removal is limited to <21 days [35]. All these parameters were converted into grid data and resampled to a spatial resolution of 1 km.

2.2.4. Leaf Area Index Data

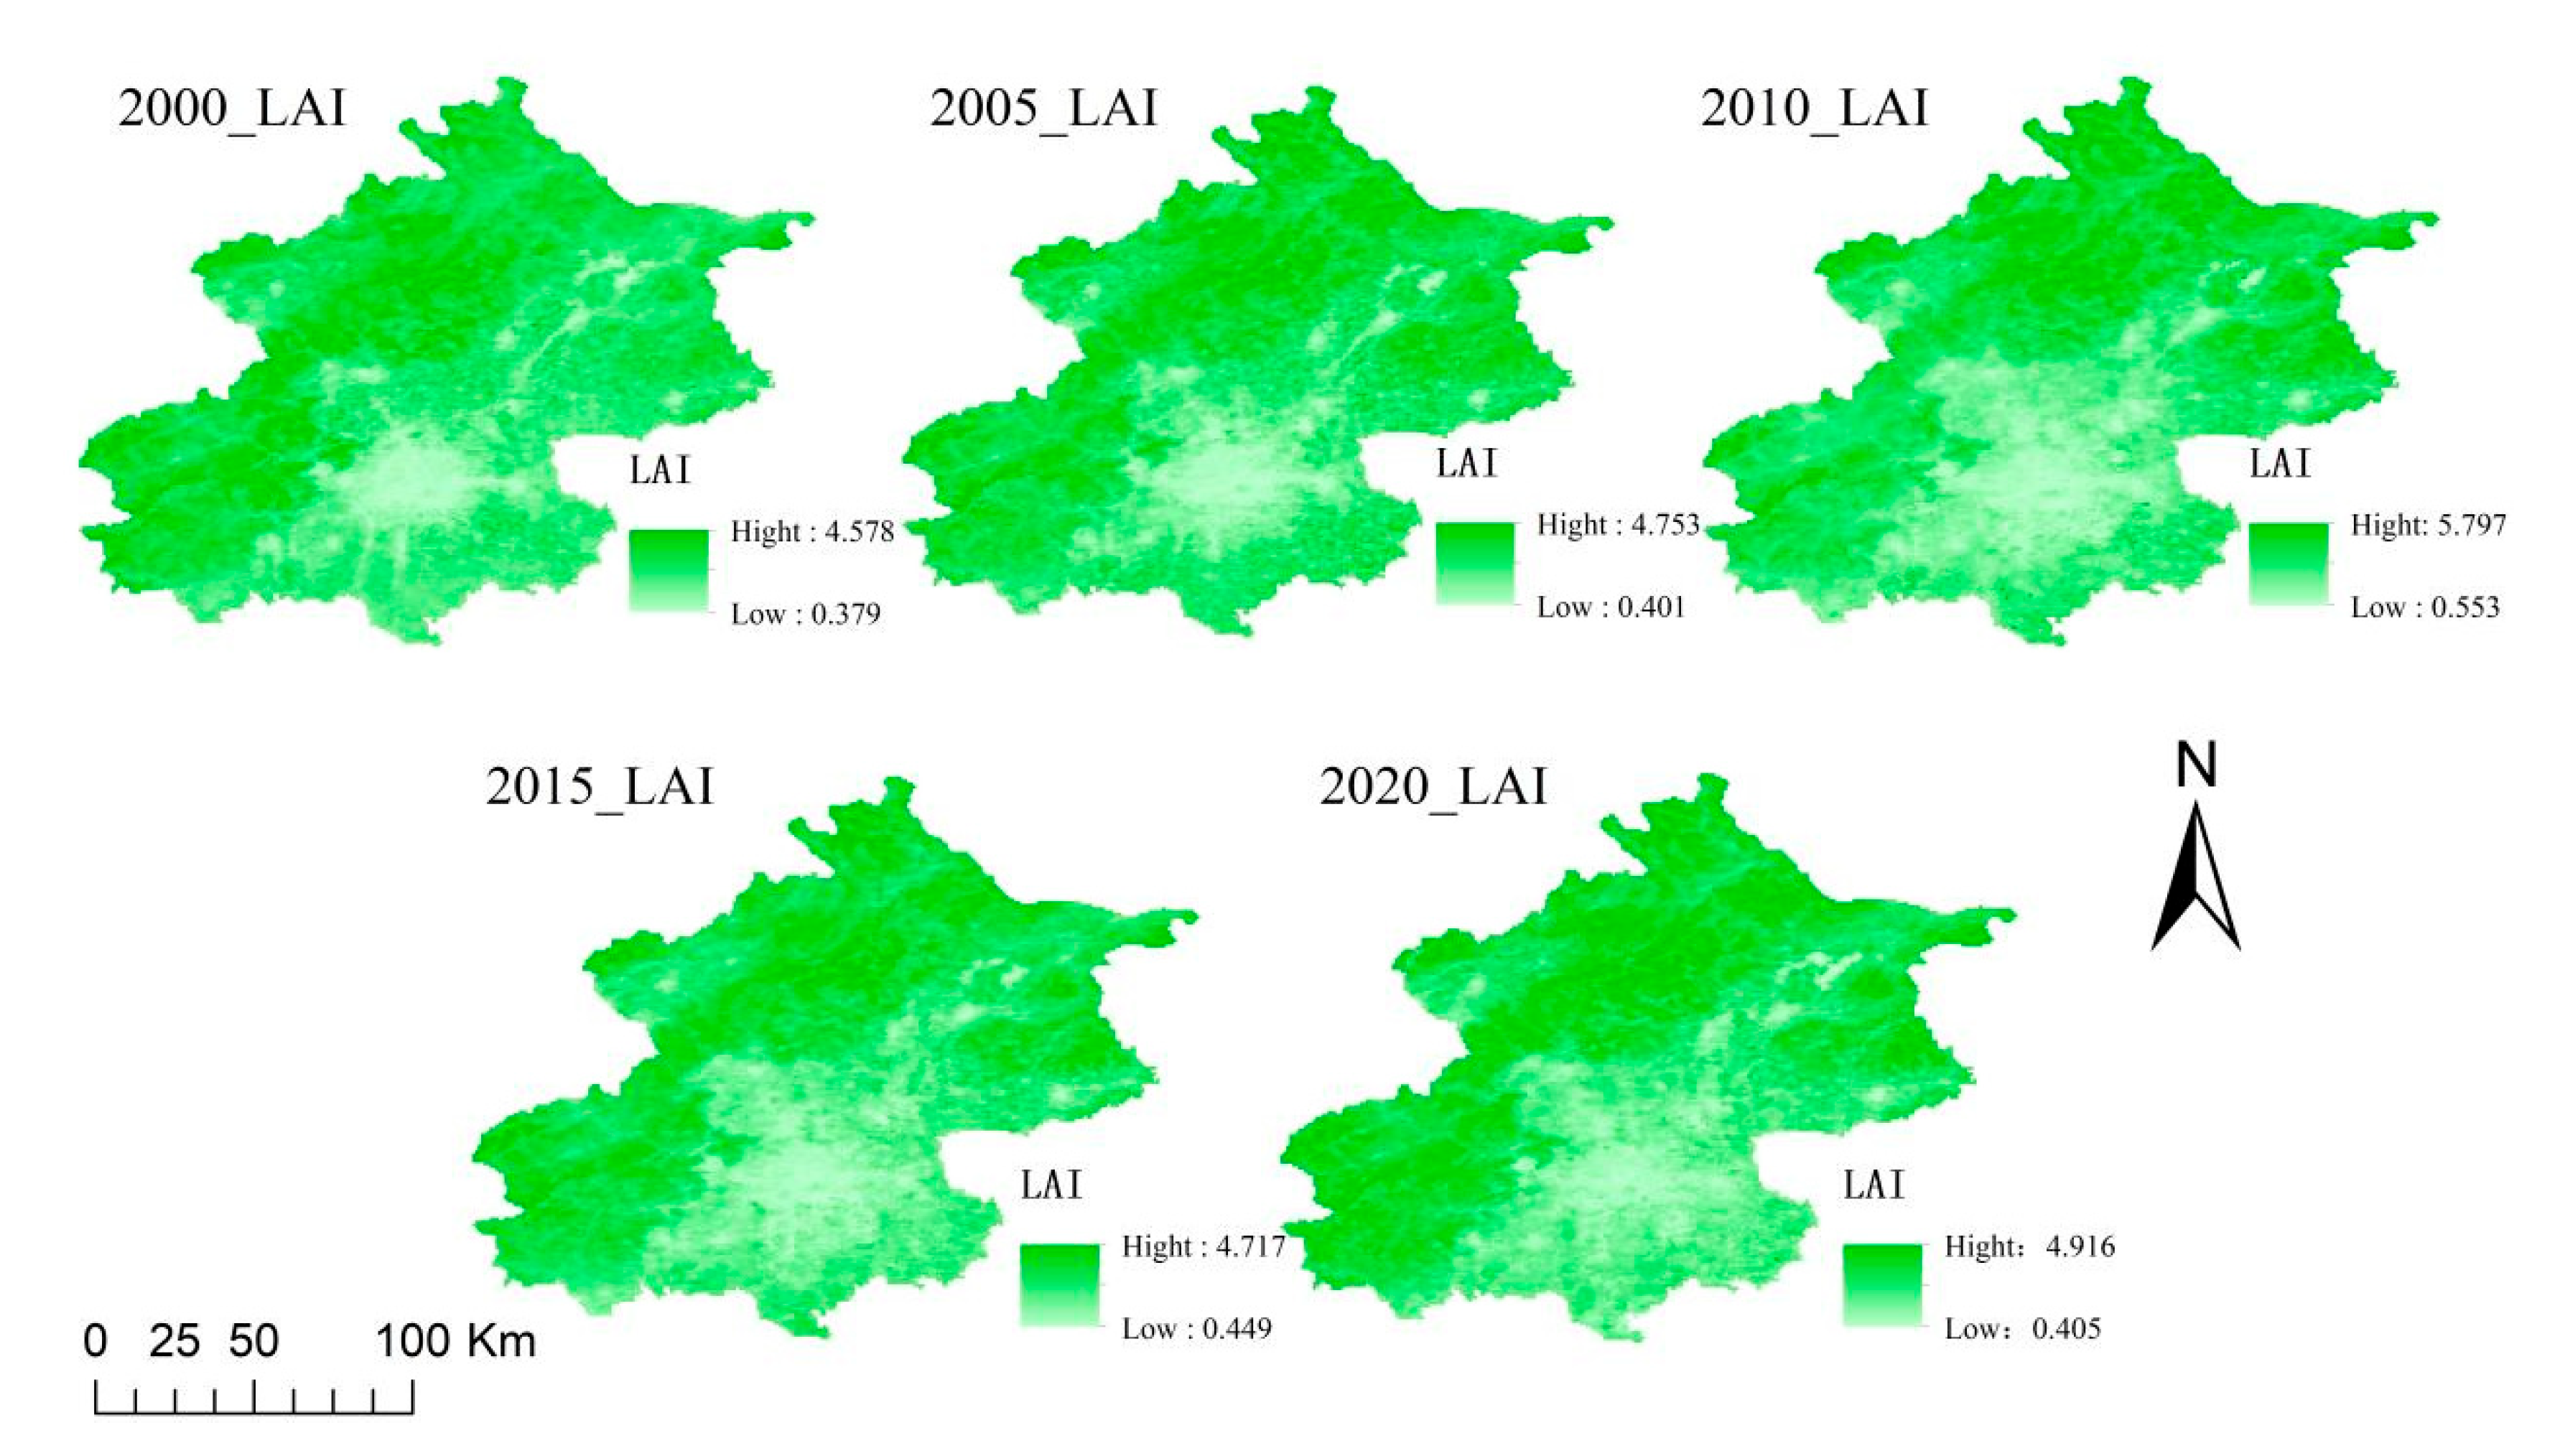
LAI has been shown to be significantly correlated with NDVI (LAI (Leaf Area Index) refers to the ratio of the total one-sided area of all plant leaves to the land area per unit land area, and it is a core indicator for quantifying the density of green spaces. NDVI (Normalized Difference Vegetation Index) is a vegetation index obtained through remote sensing (with a value range of −1 to 1; values close to 1 indicate dense vegetation), which reflects the growth status and coverage of vegetation). Therefore, it can be estimated based on the quantitative relationship between them. This study uses the regression relationship between NDVI and LAI estimated for urban green spaces in Changchun, Northeast China, and performs remote sensing inversion calculations using NDVI values from the study area [36]. To calculate the LAI of Beijing’s urban green spaces, atmospheric-corrected TM (“Thematic Mapper”, It is a multispectral remote sensing sensor carried by the U.S. Landsat satellite series). data were first processed in ENVI 5.3 using band operations via Band Math, calculated according to the NDVI formula, converted to the appropriate data type, and band-specified, followed by execution of the operation and saving of the results. NDVI values range from −1 to 1 and are used to assess surface vegetation cover. The NDVI raster data for the study area were obtained, with NDVI calculated as per Formula (1):
N D V I = N I R R N I R + R ,
In the formula, NDVI is the normalized difference vegetation index, which can detect the growth status of vegetation; NIR is the near-infrared band (nm), and R is the red light band (nm).
Then, the LAI was calculated using the raster calculation tool in ArcGIS 10.7 software, as shown in Formula (2): The LAI data results for the study area are shown in Figure 3.
L A I = 0.57 × e 2.33 × N D V I ,

2.3. Research Methods

This study is based on the UFORE (Urban Forest Effects Model) atmospheric pollution dry deposition model [37], combining dry deposition rates and resuspension rate parameters to estimate the dry deposition flux, total dry deposition, and annual removal rate of PM2.5 pollutants for six land use types.

2.3.1. Dry Deposition Estimation Method for Forested and Grassland Areas

Referring to previous studies, the removal capacity of PM2.5 is measured by the cumulative value of PM2.5 dry deposition flux and vegetation leaf area index over time. Based on the dry deposition model, the calculation of PM2.5 dry deposition for forested areas is as shown in Formula (3):
Q = v × d × L A I × ( 1 r ) × T × 3600 × 24 × 1 0 9 ,
In the equation: Q represents the PM2.5 deposition flux, (specifically referring to the total mass of PM2.5 deposited on the unit area of vegetation surface via dry deposition, not ordinary deposition flux), (g/m2); v denotes the Deposition velocity of PM2.5 on leaf surfaces (adapted to different wind speed conditions, with specific values based on land cover types) (m/s), where 0.09 m/s applies to forested areas and 0.018 m/s to grasslands [38]; d is the background concentration of PM2.5 (referring to the ambient PM2.5 concentration in the study area that has not been affected by vegetation purification before dry deposition occurs) (μg/m3); r is the resuspension rate of PM2.5 (referring to the proportion of PM2.5 deposited on leaf surfaces that is re-suspended into the atmosphere due to wind disturbance and other factors) (%); T is Effective dry deposition days.
V O D = 0.0002 × e x p ( 0.4314 × W i n d S p e e d ) ,
In the calculation of dry deposition flux, the deposition velocity and resuspension rate of particulate matter such as PM2.5 are closely related to natural factors. A model is constructed based on the relationship between dry deposition velocity (VOD), resuspension rate (Re), and wind speed (Windspeed) to estimate the dry deposition velocity and resuspension rate. The correlation coefficient R2 of this model is above 0.98 [26]. The specific calculation methods are shown in the following formulas:
According to Formulas (4) and (5), based on wind speed data for different months, the corresponding dry deposition velocity and resuspension rate values for that month are calculated.
R e = 0.0158 × W i n d S p e e d ,

2.3.2. Estimation Methods for PM2.5 Particle Deposition Rates on Farmland

In this study, to estimate the PM2.5 particle deposition rate on cropland in the study area, we reviewed numerous methods proposed by scholars for estimating deposition rates for different cropland types. After analysis and integration, we ultimately determined that the calculation should primarily utilize the gravitational deposition rate of PM2.5, aerodynamic resistance above the canopy, LUCC empirical parameters, and particle friction velocity. The specific calculation method is shown in Formula (6).
V d ( P M 2.5 ) = V g ( P M 2.5 ) + 1 R a + 1 / ( a 1 u ) ,
In the equation: Vd(PM2.5) represents the dry deposition rate of PM2.5 on cropland (m/s); Vg(PM2.5) represents the gravitational settling velocity of PM2.5 (m/s); Ra represents the aerodynamic resistance above the canopy (s/m); a1 is based on LUCC empirical parameters; u is the friction velocity (m/s); This method can be used to estimate the dry deposition rate of cultivated land [39,40]. Given that the study area is located in northern China, primarily consisting of dryland, and referencing the research findings and computational models of relevant scholars in similar regions, the dry deposition rate of cultivated land in this experiment was set at 3.7 × 10⁻⁵ m/s [41].

2.3.3. Estimation Methods for Dry Settling Rates of Water, Impervious Surfaces, and Unutilized Land

Existing studies have limited research on dry deposition rates for water bodies, impervious surfaces, and unutilized land (Unutilized land types” refers to land in Beijing that does not serve clear purposes such as agricultural production, urban construction, or ecological green space, and is characterized by idleness, a vegetation coverage of less than 10%, and scattered spatial distribution), and the estimated results also exhibit significant regional variations. This experiment compared the research findings of multiple scholars, considering the dry deposition rates, particulate matter concentration values, and suspension rates [42] for water bodies, impervious surfaces, and unutilized land. In summary, this study established separate dry deposition rates for water bodies, impervious surfaces, and unutilized land by comprehensively considering the geographical location, natural environmental conditions, and characteristics of different surfaces in the study area. Corresponding formulas for dry deposition flux and total dry deposition were also established. These formulas provide a foundation for subsequent data analysis and estimation of dry deposition quantities. Based on this, the formula for the total dry deposition quantity of water bodies in the study area is Formula (7):
Q = v × d × ( 1 r ) × T × 3600 × 24 × 10 6
In the equation, the dry settling rates (v) of the water body and the impermeable surface layer are set to 7 × 10⁻³ m/s and 6.8 × 10⁻³ m/s, respectively, while the dry settling rate for unutilized land may vary due to factors such as surface cover and soil moisture. However, for simplicity in this study, it is also temporarily set to the same value, with the dry settling rate estimated to be slightly lower than that of water bodies and impervious surfaces, at 6.4 × 10⁻³ m/s [43]. Additionally, by applying the corresponding formulas, the resuspension rates for impervious surfaces and unutilized land can be calculated, as shown in Formula (8). Due to the unique properties of water bodies, the resuspension rate is set at 1 m/s [38,44].
y = 0.01 x 2 + 0.017 x   ( R 2 = 0.91 ,   p < 0.001 )

2.3.4. Removal Efficiency Estimation Method

The retention rate refers to the ratio of PM2.5 dry deposition to total PM2.5, the retention rate P, which is used to effectively reflect PM deposition. The following equation is used to calculate the removal efficiency of different surfaces [42,45]: The calculation method is shown in Formula (9):
P = Q Q + E ,
In the formula: P is the removal rate (%), Q is the dry deposition amount (t), and E represents the regional atmospheric PM2.5 background value (μg/m3). The calculation method for E can be referenced in Formula (10):
E = C × T × H M L H × S ,
In the equation, C represents the particulate matter concentration value, T represents the dry deposition time (s); HMLH represents the height of the atmospheric mixing boundary layer in the study area (m); S represents the land area. Based on the elevation characteristics of the study area and the results of relevant literature studies, this paper uses 697 m as the height of the atmospheric mixing layer in the study area [46].

3. Results

3.1. PM2.5 Data Accuracy Validation

The R2 value for the fit between the PM2.5 dry deposition values from the ecological station and the PM2.5 dry deposition estimates derived from remote sensing data is 0.99, with an RMSE of 0.0007 g/m2, as shown in Figure 4. This high correlation and low error validate the reliability of the downloaded data, indicating that remote sensing data exhibit extremely high accuracy in estimating PM2.5 dry deposition. Given this, the PM2.5 remote sensing data provided by NESSDC can serve as a reliable alternative data source, effectively applicable to research fields such as regional atmospheric environment modeling, evaluation of pollution control policy effectiveness, and quantification of ecological and environmental damage, providing scientific support for refined environmental management decision-making.

3.2. PM2.5 Deposition Efficiency by Land Type

Based on statistical data on the dry deposition effects of PM2.5 for six land use types in Beijing from 2000 to 2020 (Table 2), the study found that vegetation cover has a significant reduction effect on PM2.5. From the perspective of dry deposition flux characteristics, the annual average deposition rates are as follows: forest land > farmland > grassland > impervious surfaces > water bodies = unutilized land. Among these, forest land reaches 1.13 g/m2, which is 5.2 times that of farmland (0.220 g/m2) and 5.9 times that of grassland (0.19 g/m2). Water bodies, impervious surfaces, and unutilized land exhibit low deposition fluxes, with an average of only 0.006 g/m2 across the three land types, differing by less than 0.001 g/m2.
In terms of PM2.5 removal efficiency, significant gradient differences were observed among different land types: forest land led with a removal rate of 0.209%, followed by farmland (0.024%), grassland (0.002%), and impervious surfaces (0.0004%). Water bodies and unutilized land showed virtually no removal effect (approaching 0). Since the removal efficiencies of impervious surfaces, water bodies, and unutilized land are far lower than those of the top three vegetation-covered land types, they will no longer be the focus of discussion in subsequent analyses.

3.3. Characteristics of Changes in PM2.5 Dry Deposition Time in Urban Green Spaces

3.3.1. Interannual Variation Characteristics of PM2.5 Dry Deposition in Urban Green Spaces

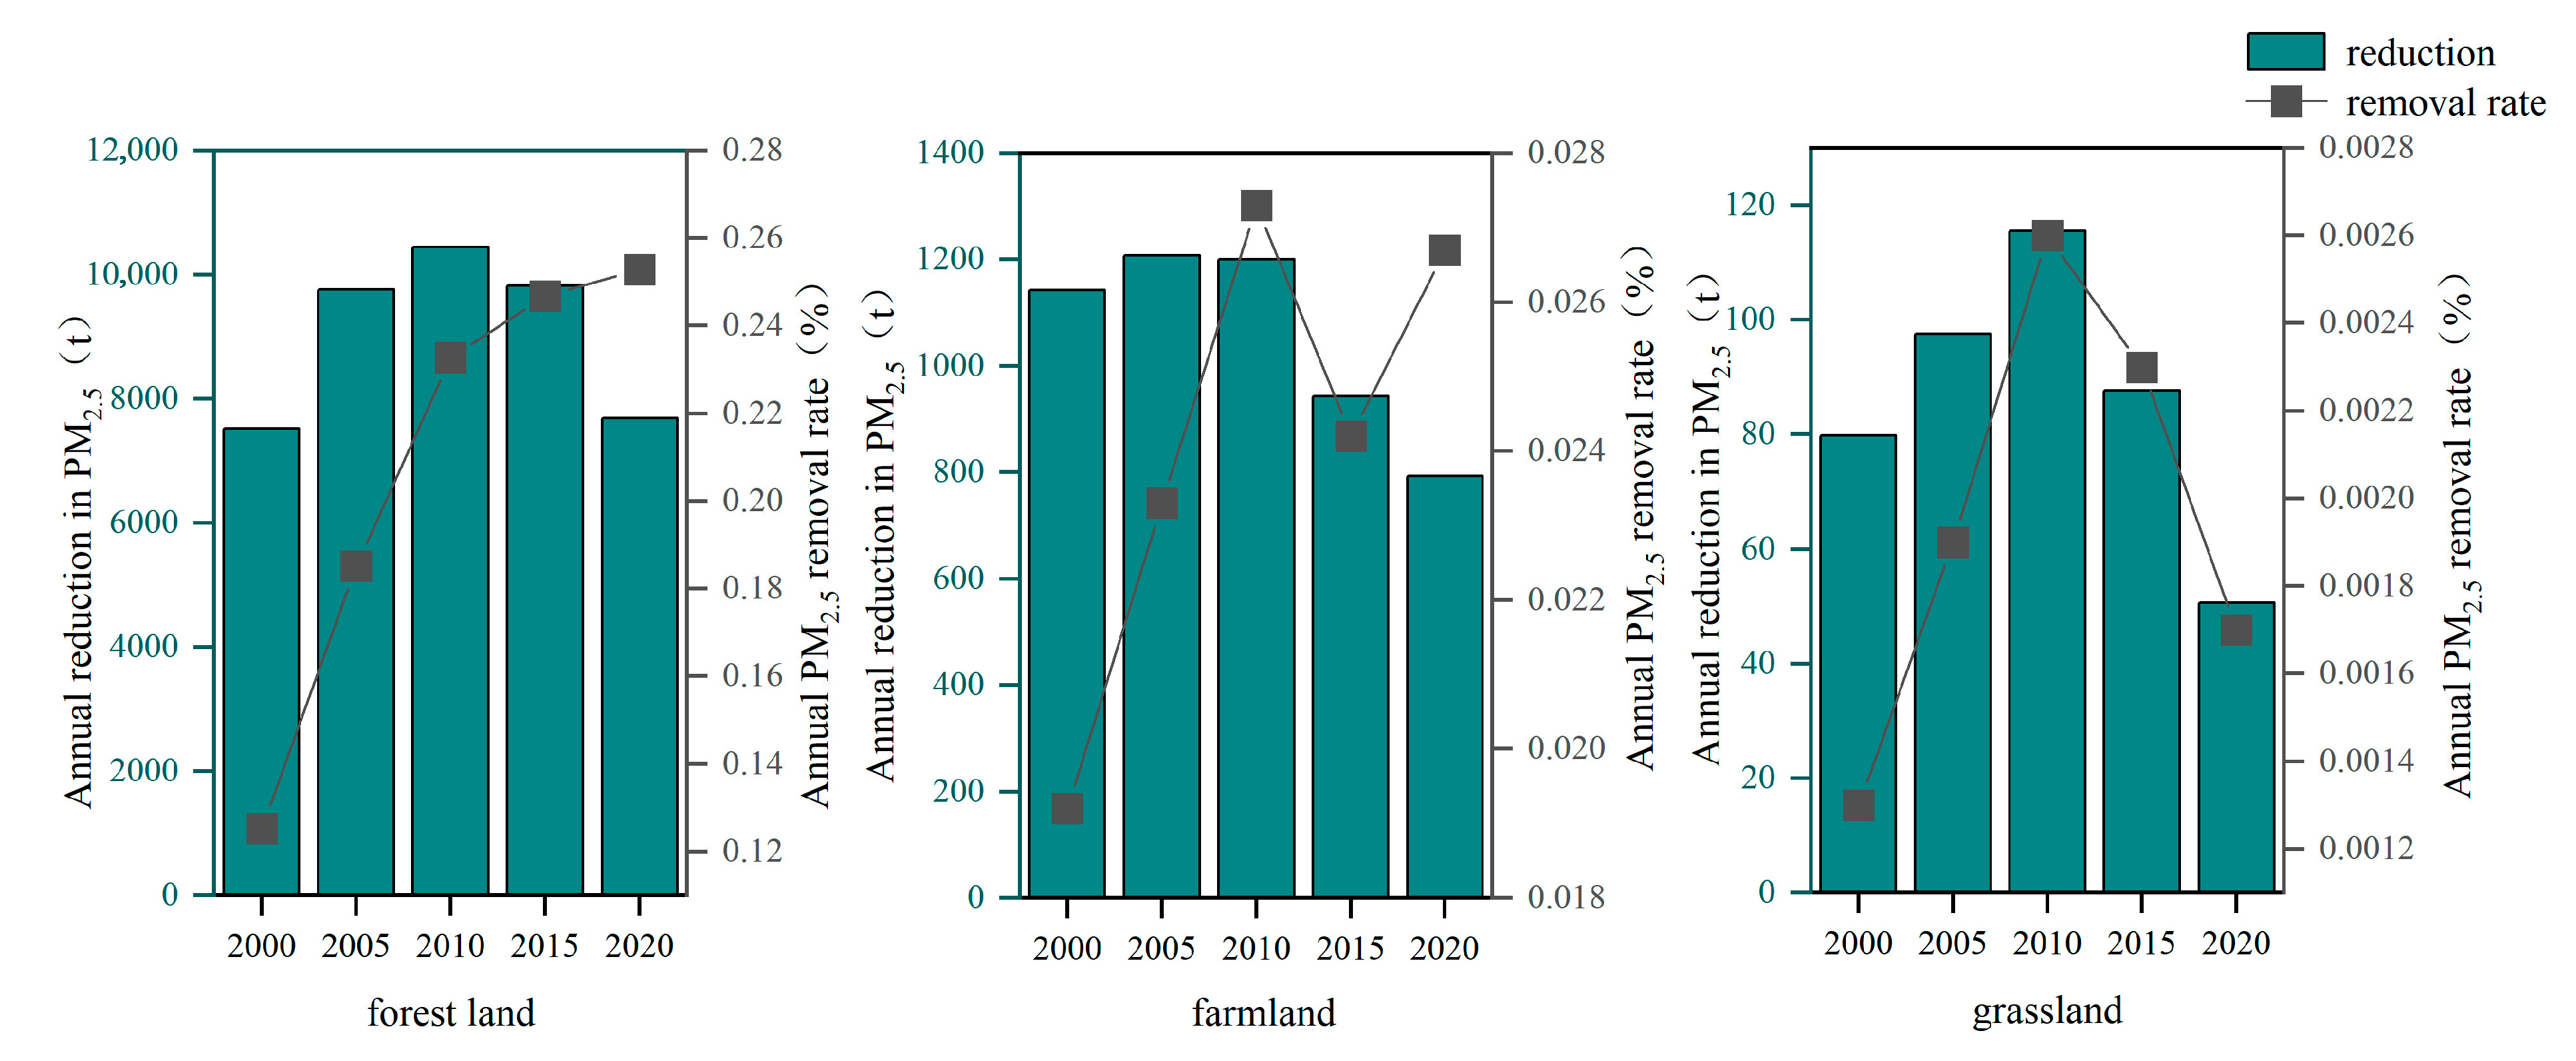
Between 2000 and 2020, the total reduction in PM2.5 levels in Beijing’s urban green spaces showed a trend of first increasing and then decreasing, with values of 8741 t, 11,068 t, 11,760 t, 10,856 t, and 8529 t, respectively: In 2010, the reduction increased by 35% compared to 2000, reaching a peak; and a 37% decrease from 2010 to 2020. In contrast, the PM2.5 removal rate continued to rise, reaching 1.46%, 2.10%, 2.63%, 2.73%, and 2.81%, respectively, indicating that the PM2.5 reduction effect of urban green spaces on the atmosphere is continuously strengthening. Among these, forest land contributed more than 85% of the total, serving as the core carrier of the ecological functions of urban green spaces.
As shown in Figure 5, different land types in Beijing exhibit significant temporal differences in PM2.5 dry deposition. As the primary reduction agent, forest land reduction quantities follow an inverted U-shaped trend: 7518.76 tons in 2000, rising to 9762.24 tons in 2005 (a 30% increase from 2000 to 2005) due to the afforestation policy; Although it began to decline after 2010, it still increased by 2.18% compared to 2000 by 2020. In contrast, the reduction in cultivated land showed an overall downward trend, decreasing from 1142.53 t in 2000 to 792.60 t in 2020, a decrease of 30.6%. The reduction in grassland area remained relatively low, showing an inverted V-shaped trend: it continued to rise from 2000 to 2010, peaking at 115.54 t in 2010 (accounting for only 1.11% of the reduction in forest land during the same period); it then decreased significantly by 25.27% from 2010 to 2020.
In terms of removal efficiency, forest land demonstrated the highest PM2.5 removal efficiency, showing an overall upward trend. The increase was particularly rapid from 2000 to 2010, rising from 0.13% in 2000 to 0.18% in 2010, with an average annual growth rate of 3.50%. From 2010 to 2020, the removal rate continued to rise slowly to 0.25%, with an increase of 7.93%. This improvement is closely related to the enhancement of vegetation community structure, as the increase in leaf area index has strengthened vegetation’s ability to intercept PM2.5.
The removal rate of farmland exhibits an “N-shaped” trend: between 2000 and 2010, the removal rate increased from 0.019% to 0.027%, a rise of 42.10%, reaching a peak; it then decreased by 11.24% in 2015, followed by an increase of 11.23% between 2015 and 2020. This abnormal trend stems from the fact that the rate of reduction in arable land area exceeded the decline in PM2.5 deposition flux, leading to an increase in removal rate per unit area. The removal rate of grassland is positively correlated with the reduction rate, both showing an inverted “V-shaped” trend, with the removal rate consistently below 0.003%. After reaching a peak of 0.003% in 2010, it continued to decline to 0.002% in 2020, a decrease of 35.14%.
In summary, forest land in urban green spaces has the highest PM2.5 removal efficiency, while grassland performs the weakest. This finding provides important reference for optimizing the ecological functions of urban green spaces.

3.3.2. Seasonal Variations in PM2.5 Dry Deposition in Urban Green Spaces

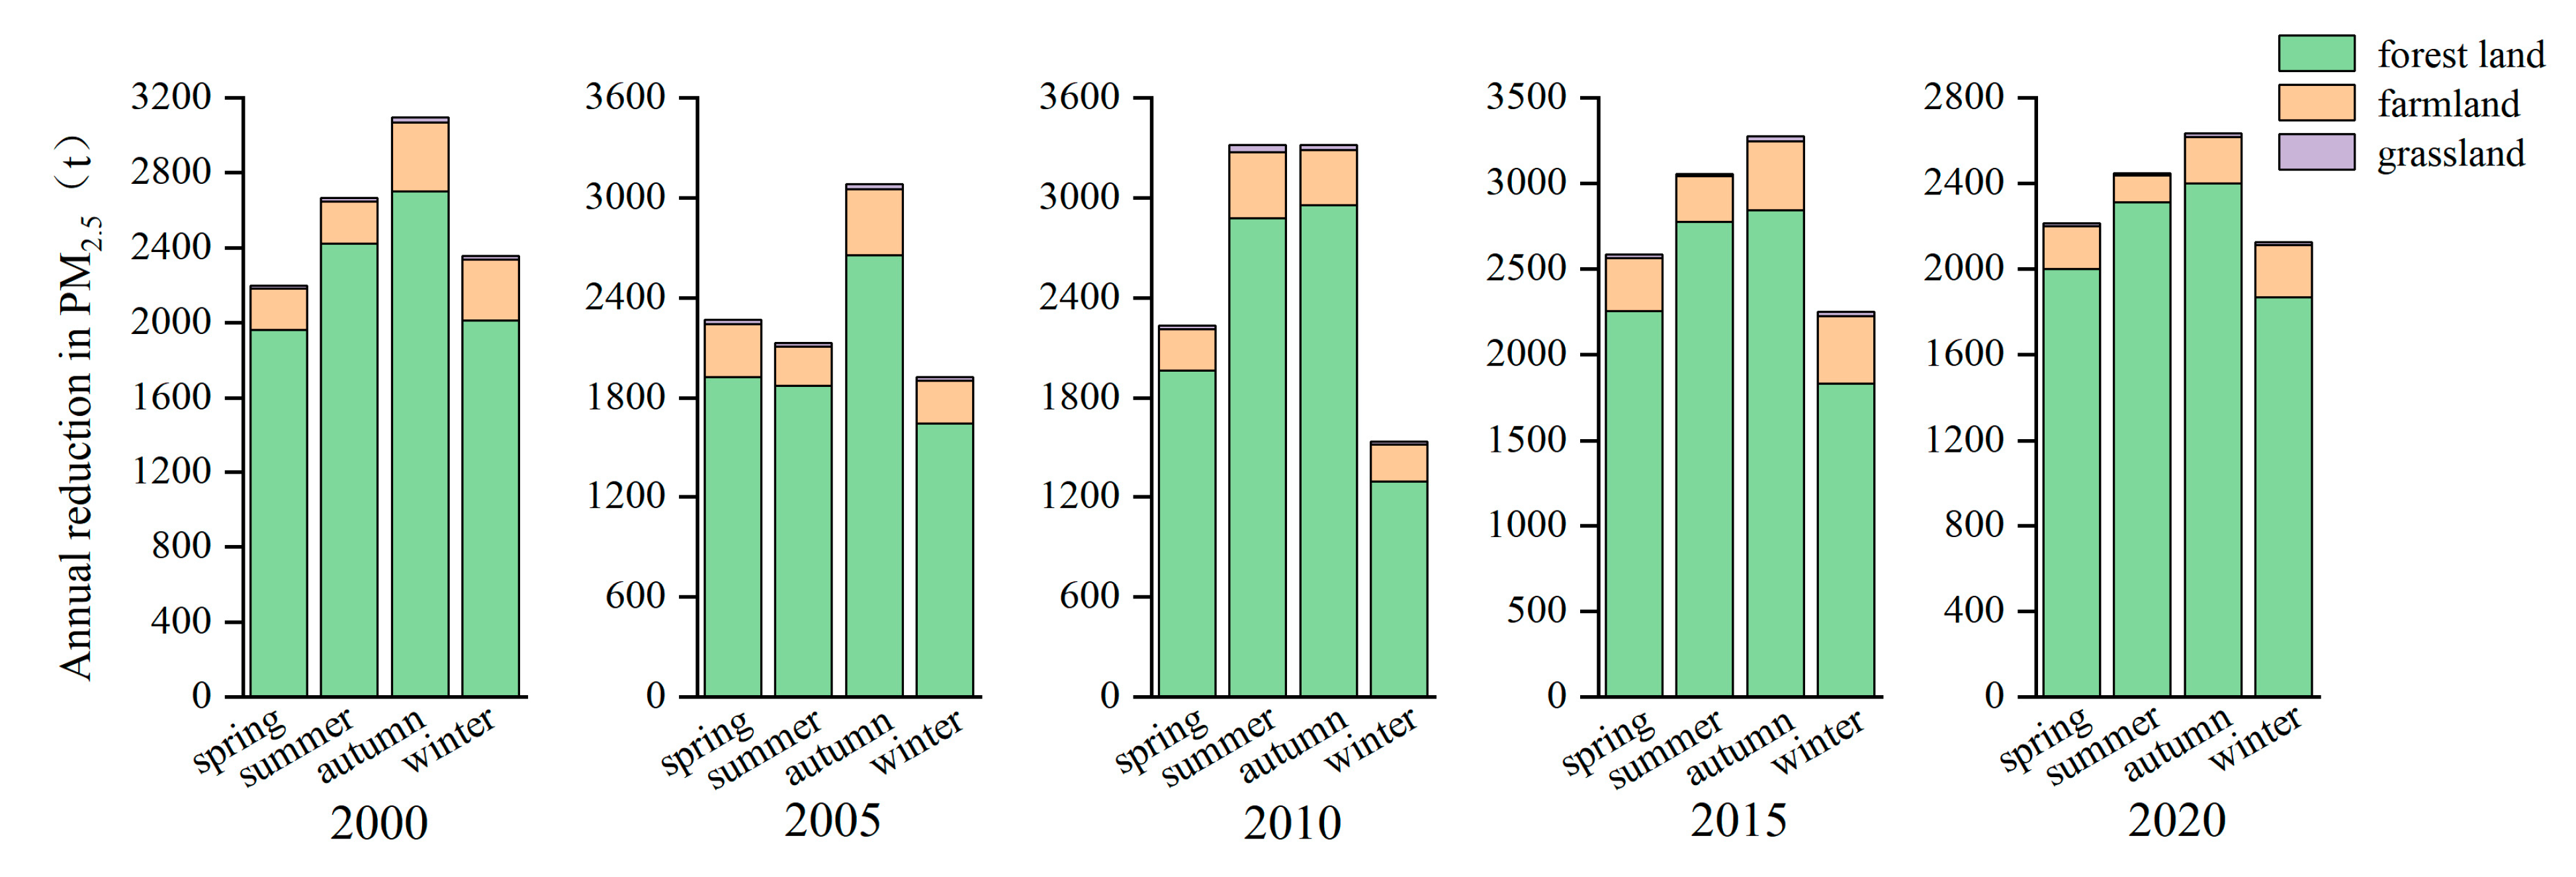
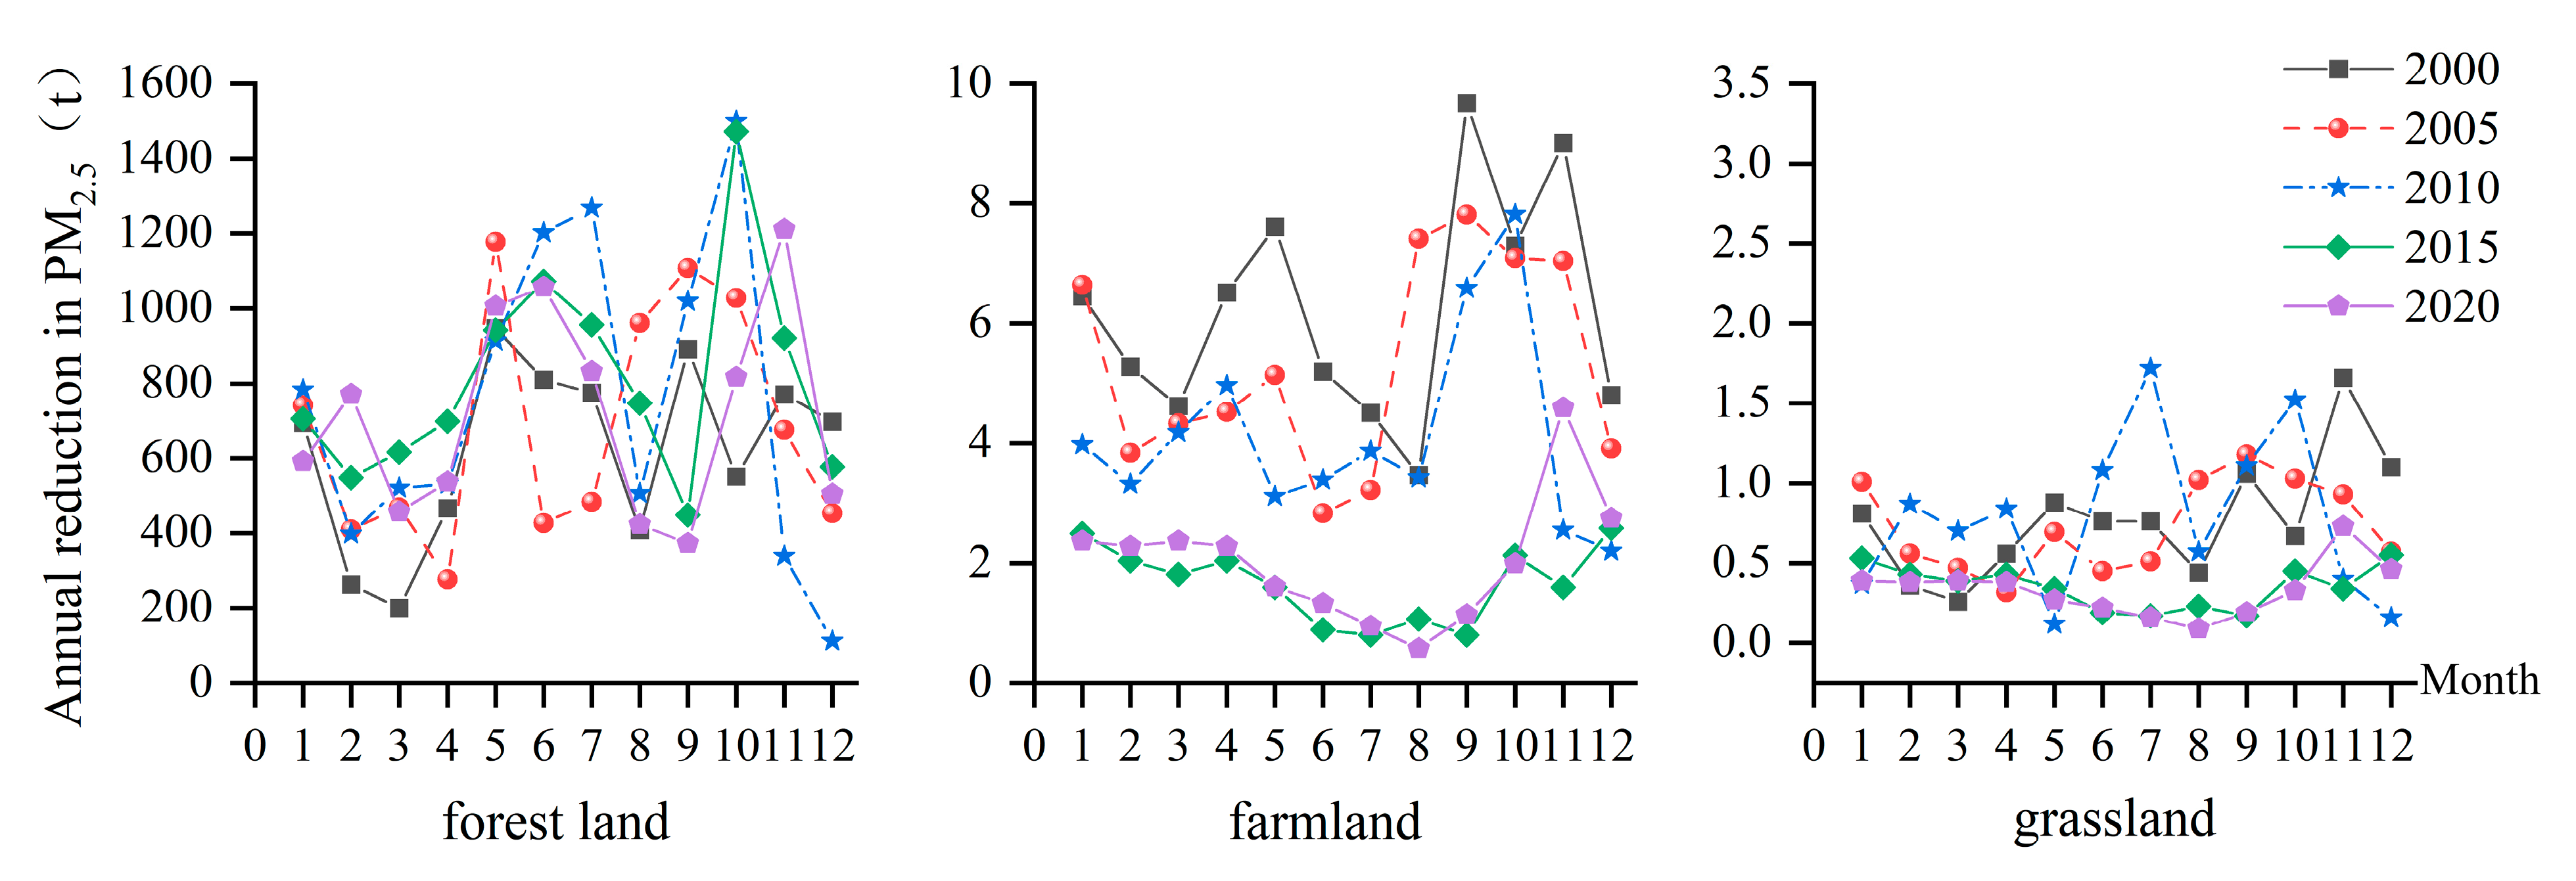
As shown in Figure 6, the PM2.5 reduction effects of urban green spaces in Beijing from 2000 to 2020 exhibit significant seasonal differences, with forest areas demonstrating the most pronounced dry deposition effects, far exceeding those of farmland and grassland.
Looking at forested areas, the seasonal reduction amounts follow a stepwise distribution of “autumn > summer > spring > winter”: the average reduction in autumn reaches 2722.45 t, which is 1.57 times that of winter (1729.90 t). This characteristic is closely related to the structural features of Beijing’s forested areas, which are dominated by deciduous tree species and have fewer evergreen tree species—deciduous tree species have denser foliage during the vigorous growth seasons of autumn and summer, resulting in stronger interception capabilities, while leaf shedding in winter leads to a weakened reduction effect.
The annual seasonal reduction quantities for farmland are ranked as follows: autumn (344.15 t) > winter (289.80 t) > spring (259.70 t) > summer (250.43 t), with the autumn reduction quantity being 1.37 times that of summer. From a year-to-year comparison, the lowest reduction occurred in 2010 (224.76 t), while the highest was in winter 2015 (394.90 t). This trend indirectly reflects the growth cycle characteristics of Beijing’s crops, which are primarily autumn and winter crops.
Grassland reduction levels were generally low, with the annual seasonal ranking as follows: autumn (24.96 t) > summer (21.43 t) > winter (19.97 t) > spring (19.89 t). From the perspective of annual fluctuations, seasonal reduction anomalies are evident: the highest value was recorded in summer 2010 (43.56 t), while the lowest value was observed in summer 2020 (9.16 t).
Overall, the annual average reduction rates for different seasons in Beijing’s urban green spaces are ranked as follows: autumn (3091.56 t) > summer (2711.50 t) > spring (2300.73 t) > winter (2039.67 t), indicating that seasonal factors significantly influence the PM2.5 reduction effects of urban green spaces.

3.3.3. Monthly Variation Characteristics of PM2.5 Dry Deposition in Urban Green Spaces

As shown in Figure 7, the dry deposition effect of PM2.5 in Beijing’s urban green spaces exhibited significant monthly variation patterns from 2000 to 2020. Among these, forest areas demonstrated the most pronounced monthly variation in PM2.5 dry deposition, exhibiting a distinct “double peak and double valley” variation pattern. February marks the first trough, with a reduction of 199.16 t; the reduction then gradually increases, reaching the first peak of 415.27 t in May; it then begins to decrease, dropping to the second trough of 253.86 t in August; finally, it rapidly increases, reaching the second peak of 447.38 t in October.
The monthly reduction in arable land shows a certain similarity to that of forest land, exhibiting a distinct “double peak” trend. The first peak occurs in April, with a reduction of 1.69 t; the second peak occurs in October, with a reduction of 2.19 t. This variation is primarily influenced by the crop growth cycle in Beijing.
The monthly reduction in grassland area showed no obvious pattern, but relatively high reductions occurred in November (0.34 t), October (0.33 t), and June and September (both 0.31 t). This is mainly because grasslands are often artificially selected, and their leaf-falling period is later than that of trees.
In summary, the monthly average reduction in Beijing’s urban green spaces is ranked as follows: October (449.90 t) > May (417.07 t) > June (382.11 t) > July (361.03 t) > November (328.84 t) > September (322.39 t) > January (295.03 t) > August (255.39 t) > April (211.08 t) > February (200.78 t) > December (196.97 t) > March (190.27 t). This result indicates that the dry deposition effect of urban green spaces on PM2.5 is significantly influenced by natural environmental factors, with notable differences in reduction capacity across different months.

3.4. Spatial Variation Characteristics of PM2.5 Dry Deposition in Urban Green Spaces

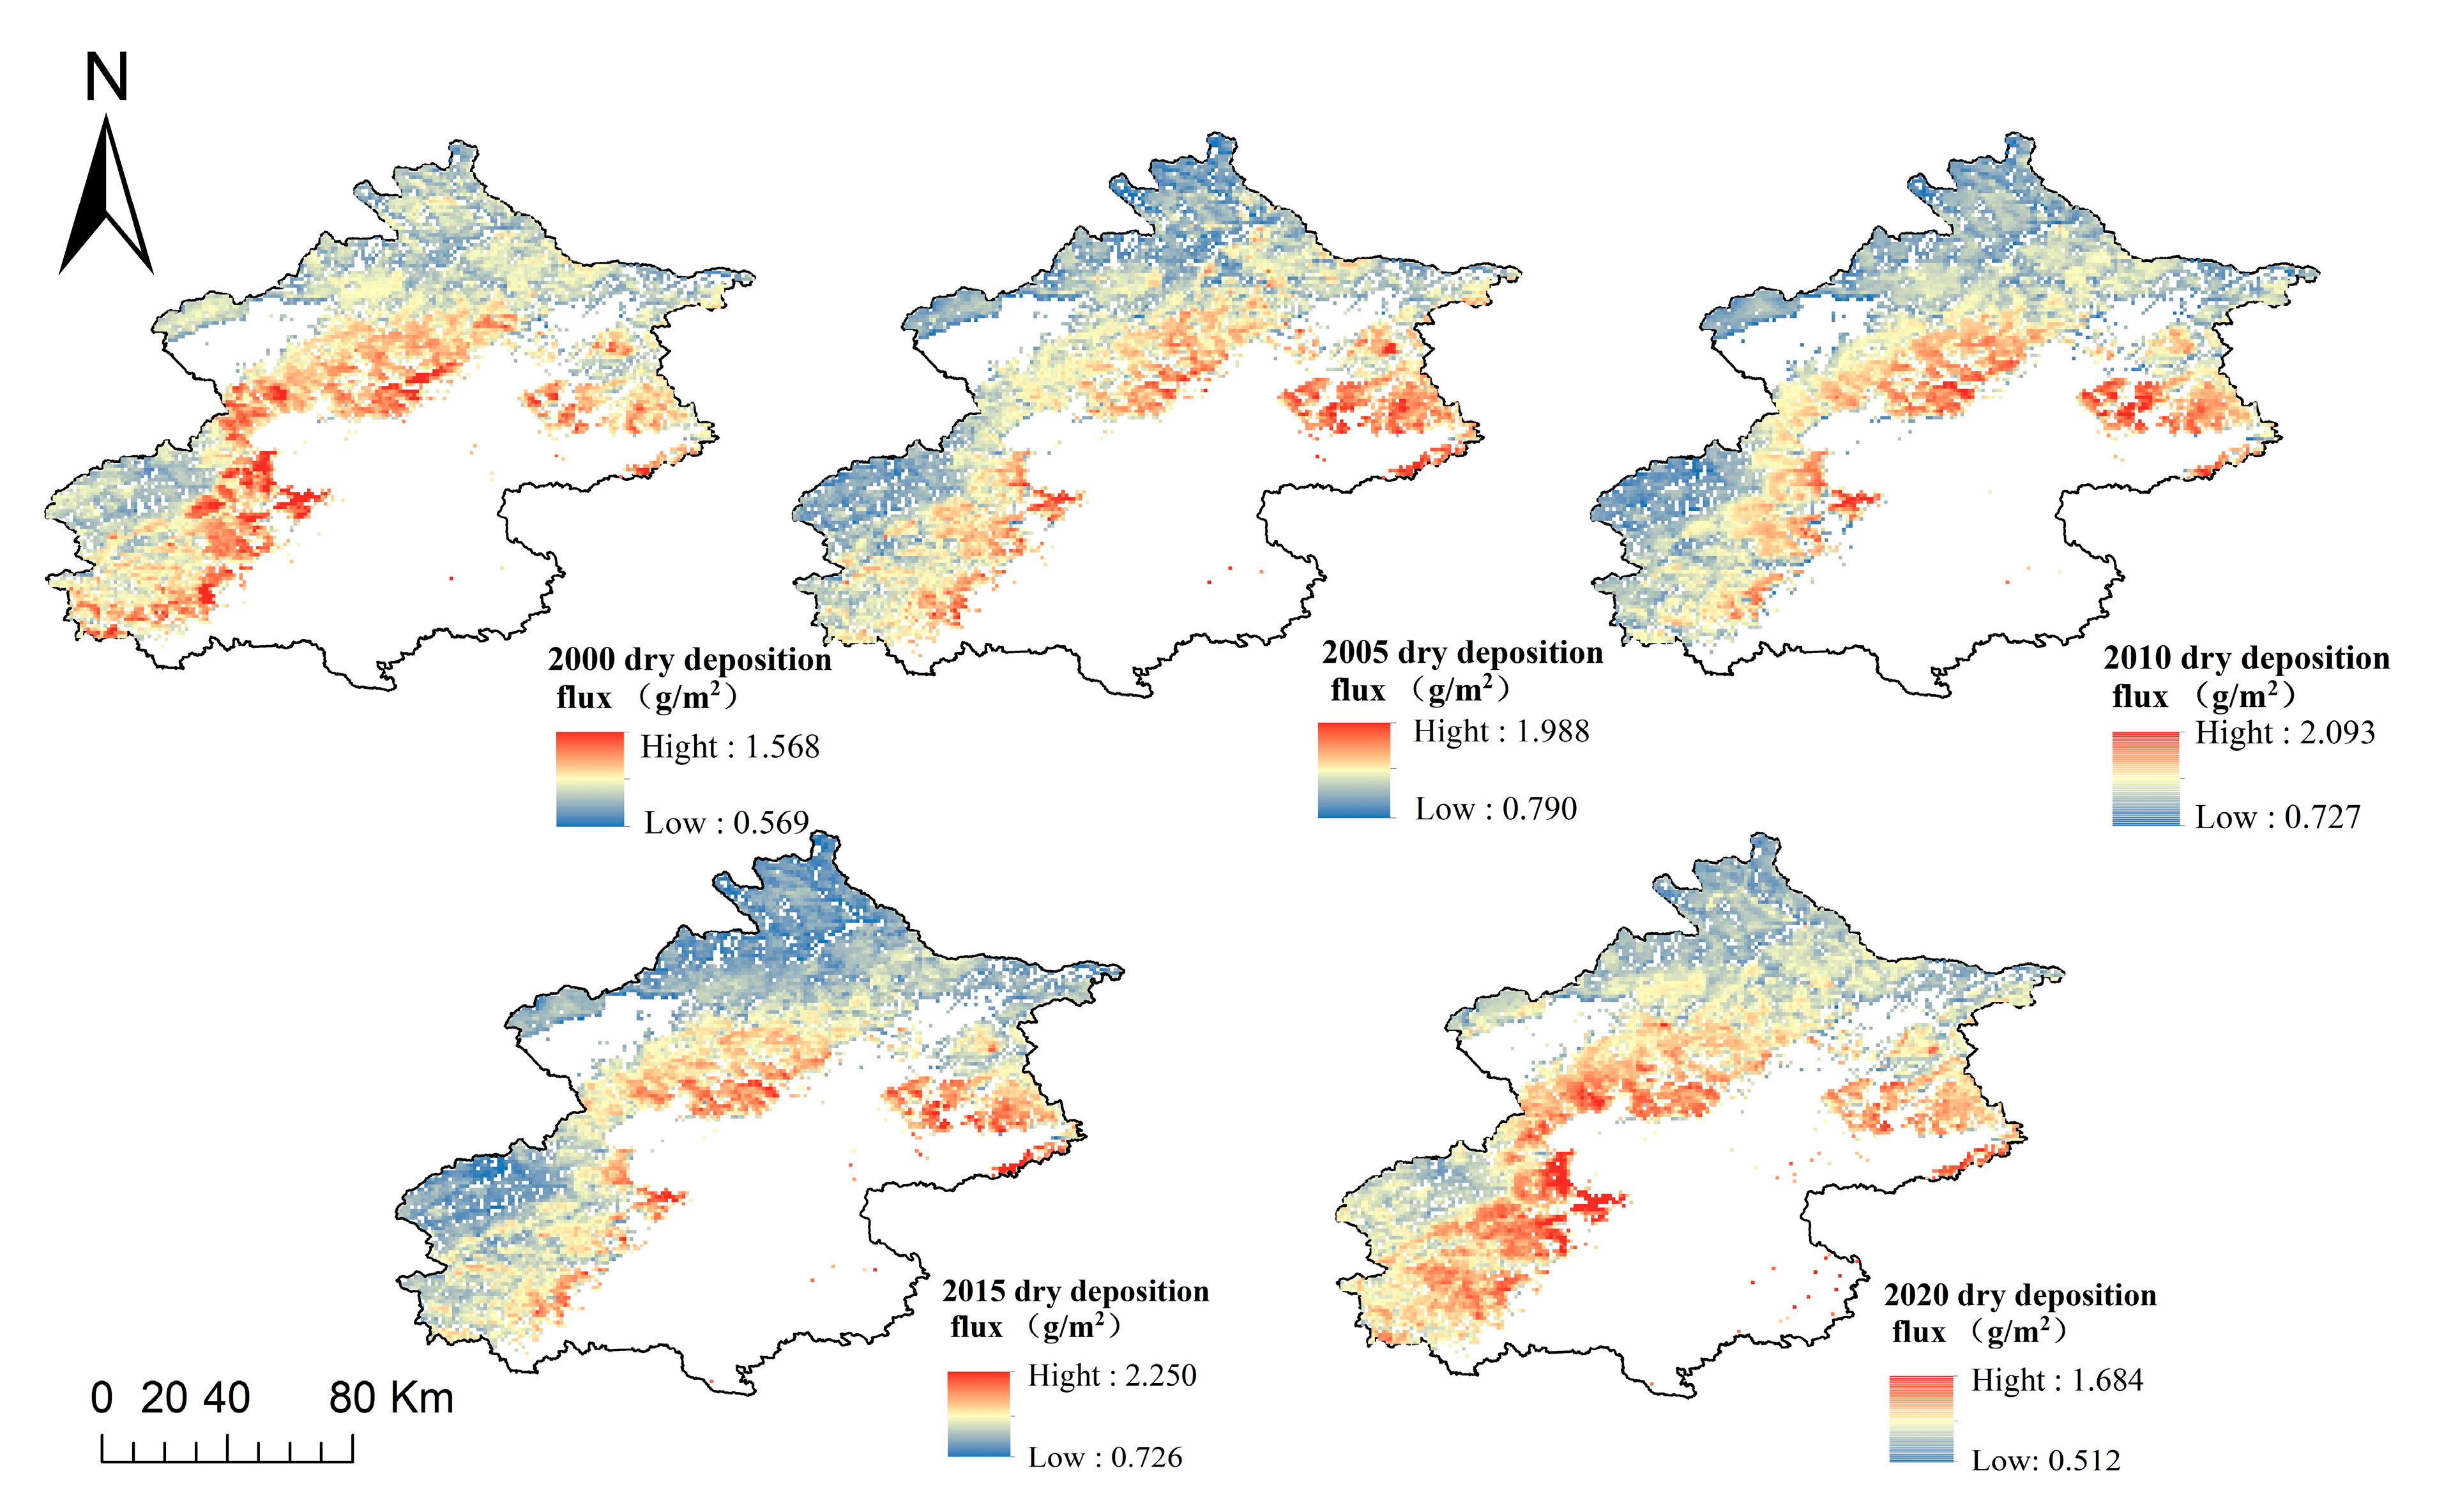
Based on an analysis of the spatial variation characteristics of dry deposition in Beijing’s forest areas over the past 20 years, the study area exhibits significant spatial heterogeneity and dynamic variation patterns. As shown in Figure 8, during the 2000–2010 period, high-value dry deposition zones were primarily distributed along the “southwest–northeast” axis: the eastern part of Mentougou District and the western part of Haidian District formed the core aggregation zone, where the high forest coverage and mature vegetation communities resulted in significantly higher dry deposition flux per unit area compared to surrounding areas; The northwestern part of Changping, the southern part of Huairou, and the northeastern part of Pinggu form secondary high-value zones, where mountainous terrain and ecological conservation policies have helped maintain relatively intact forest ecosystems.
With the acceleration of urbanization, the spatial pattern of dry deposition underwent significant changes by 2015: the peak intensity zones shifted northeastward, with the central-southern part of Miyun and the northeastern part of Pinggu becoming new high-value centers, with the highest dry deposition flux reaching 2.25 g/m2. This was directly related to the enhanced ecological restoration and expanded forest area initiatives implemented in these regions at the time. Meanwhile, earlier high-value areas such as the eastern part of Mentougou and the northwestern part of Changping experienced a sustained decline in dry deposition flux after 2010 due to urban expansion leading to forest fragmentation.
Spatial comparisons show that rapidly urbanizing areas such as Shijingshan, Miyun, and Yanqing have consistently remained in low-value zones for dry deposition, forming a significant gradient difference with the central urban area. Among these, Shijingshan District has long had low dry deposition capacity due to a high proportion of industrial land and fragmented forest patches; while Miyun and Yanqing, although located in ecological conservation zones, have seen their dry deposition contribution limited by the encroachment of forest land in some urban expansion areas. This spatial differentiation reflects both the squeeze effect of urbanization on the ecological functions of forest land and the functional differences that have emerged in different regions as a result of the trade-off between ecological protection and economic development.
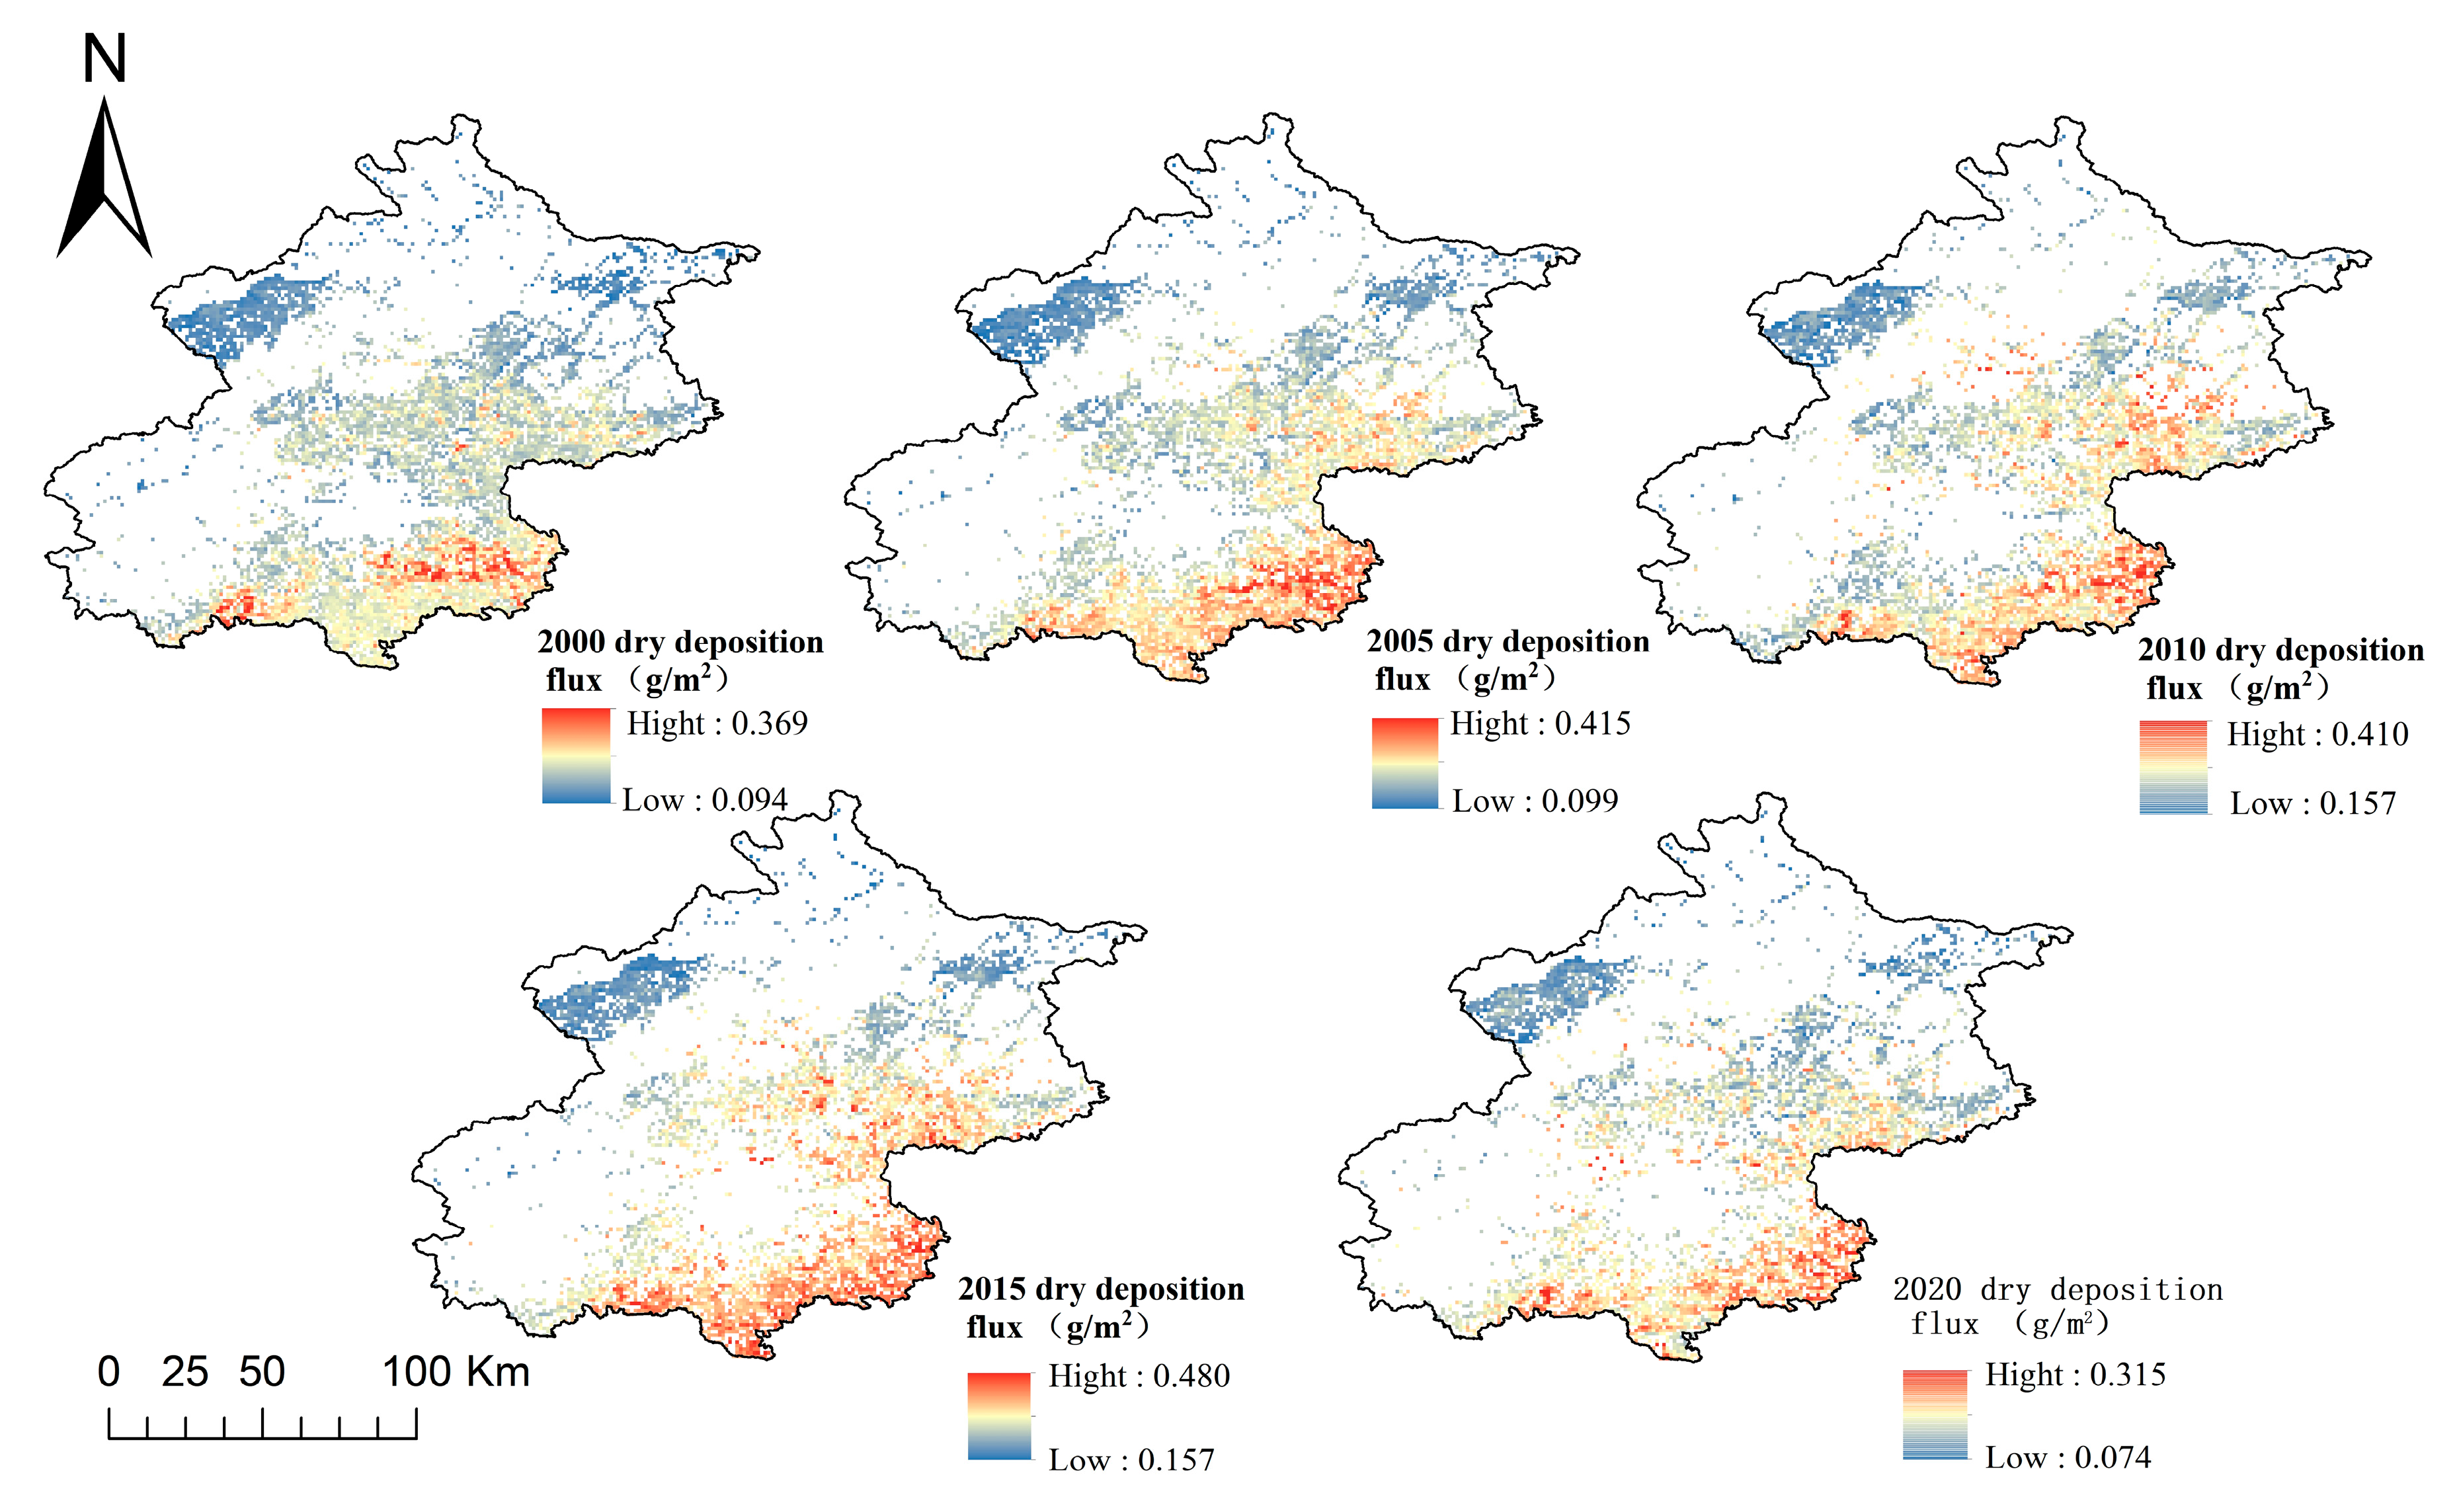
Based on the spatiotemporal evolution characteristics analyzed in Figure 9, the dry subsidence of farmland in the study area exhibited a stable “south high, north low” gradient distribution pattern between 2000 and 2020. This spatial differentiation is closely related to the endowment of farmland resources and the intensity of agricultural production activities.
In terms of spatial distribution, Tongzhou District in the south consistently maintained the highest subsidence intensity, forming the core zone of dry subsidence along with the high-value areas in Shunyi, Fangshan, and Pinggu. These regions feature contiguous farmland distributions and mature farming systems, with high leaf coverage during the crop growth cycle, resulting in significant PM2.5 interception and subsidence effects. In contrast, the northern regions, characterized by mountainous terrain and fragmented farmland, exhibit relatively lower dry subsidence rates.
In terms of temporal evolution, in the early 2000s, Tongzhou, as a secondary urban development center, relied on large areas of contiguous farmland to achieve the highest dry deposition rate of 0.369 g/m2. However, with the restructuring and expansion of urban space during the urbanization process, farmland resources were gradually encroached upon, leading to a noticeable axial shift in high-value dry deposition zones: After 2010, the subsidence hotspots expanded southeastward to the areas surrounding the Daxing New Town, forming a radial decay pattern bounded by the Sixth Ring Road—within the Sixth Ring Road, urban development squeezed out farmland, leading to a decline in dry subsidence capacity, while the farmland retained outside the Sixth Ring Road became the new main contributor to subsidence.
This spatiotemporal change not only reflects the direct impact of the spatial displacement of arable land resources on dry subsidence functions during the urbanization process but also reveals the dynamic balance differences between maintaining agricultural ecological functions and meeting urban development needs across different regions, providing key insights for optimizing the layout of arable land protection and ecological construction.
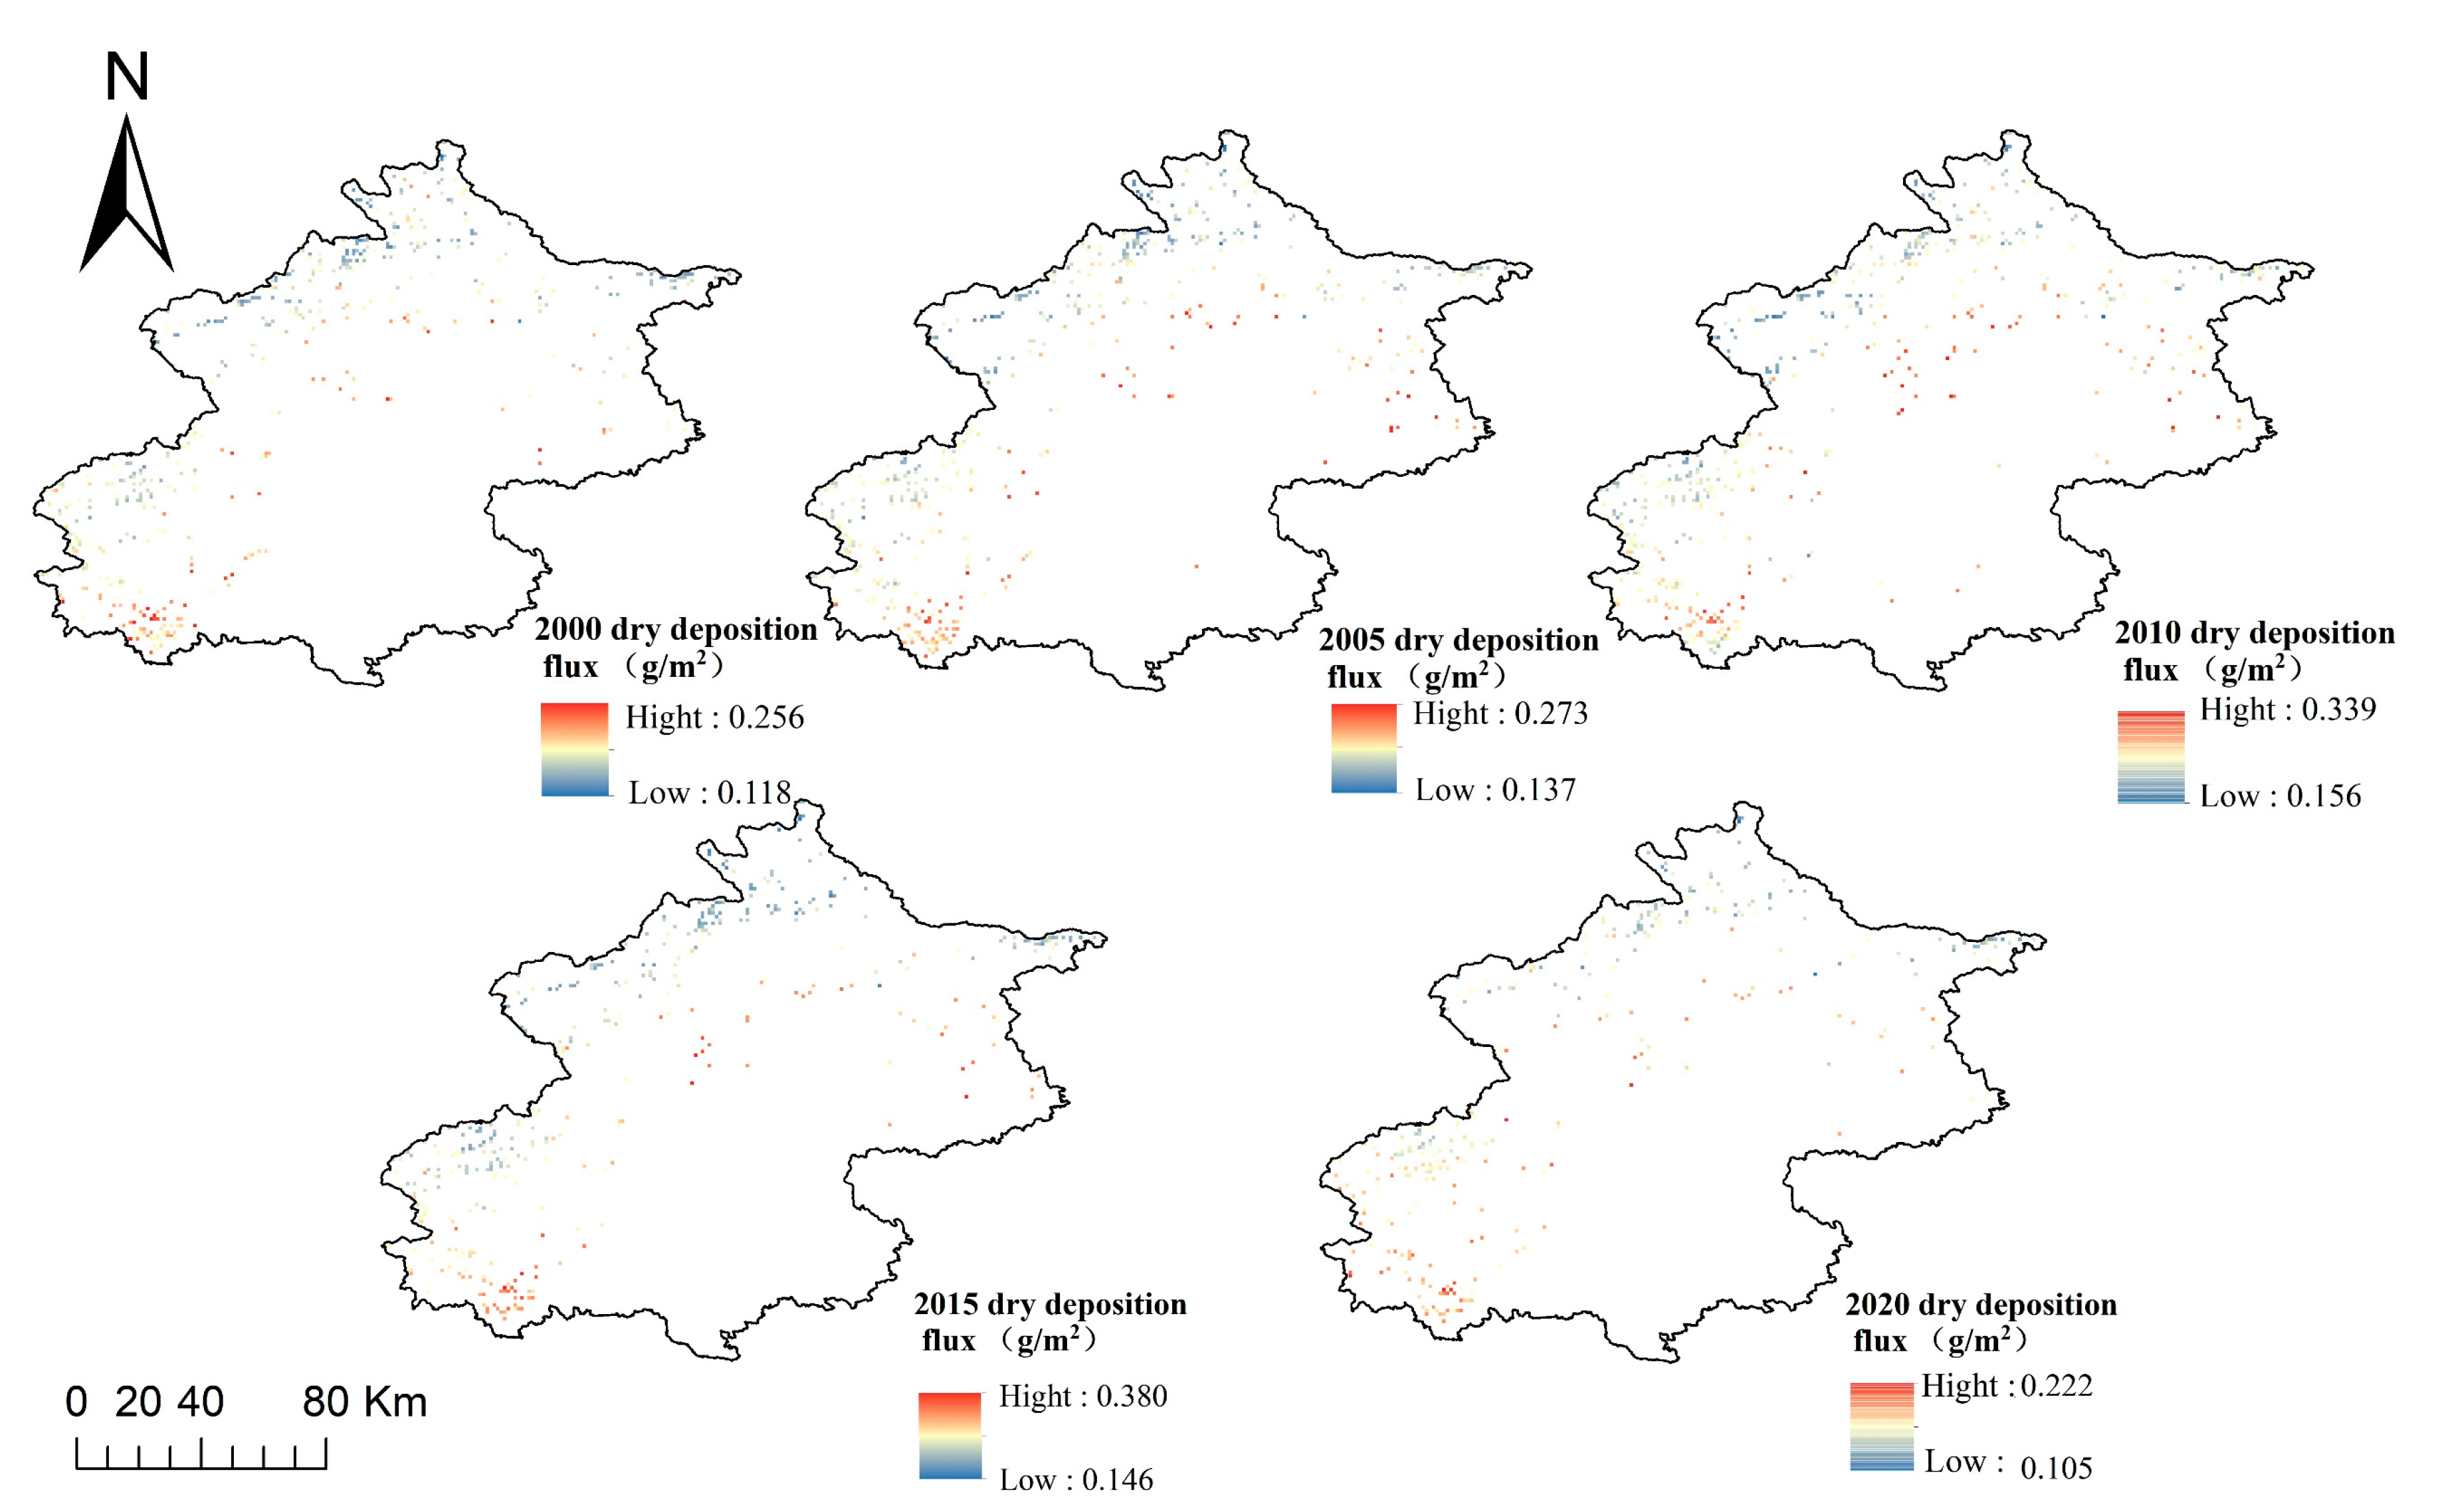
As shown in Figure 10, the dry deposition of grasslands in the study area exhibited a “southwest-northeast” semi-enclosed distribution pattern between 2000 and 2020. This spatial pattern is closely related to grassland type, vegetation cover, and human management intensity.
In terms of spatial variation, the southwest region of Fangshan had the highest deposition flux value, reaching 0.245 g/m2, while southern regions such as Changping, Shunyi, and Pinggu also had relatively high PM2.5 deposition fluxes, at 0.219 g/m2. These areas are predominantly artificial grasslands or urban green spaces, characterized by vigorous vegetation growth, high coverage, and frequent human maintenance, resulting in significant PM2.5 interception and deposition effects. In contrast, the western part of Mentougou, Yanqing, Huairou, and the southern part of Miyun are mostly natural grasslands or located in ecologically fragile areas, with relatively poor vegetation growth and lower dry deposition rates, averaging 0.156 g/m2.
Time series analysis shows that the evolution of grassland dry deposition rates during the study period exhibits a “two-stage” characteristic. From 2000 to 2010, there was a sustained increase, with the deposition flux in Fangshan rising from 0.256 g/m2 to 0.339 g/m2 and Huairou and Miyun regions also showing a significant increase from 0.213 g/m2 to 0.264 g/m2. This was closely related to the intensified urban greening efforts, expansion of grassland areas, and improved maintenance standards during this period. From 2010 to 2020, the region entered a rapid decline phase, with the highest dry deposition value dropping to 0.222 g/m2, a decrease of 34.51%. This was primarily due to accelerated urbanization, which led to the encroachment of some grasslands, as well as the impact of climate change and other factors, which inhibited the growth of grassland vegetation.
In summary, Beijing’s urban green spaces exhibit a pronounced spatial aggregation effect in terms of dry deposition. Forest areas have the highest dry deposition capacity and are concentrated in the outlying suburbs, followed by farmland in the inner suburbs, while grasslands, distributed between forest areas, have the lowest dry deposition capacity. This result indicates that the dry deposition effect of urban green spaces on PM2.5 is significantly influenced by natural environmental factors such as topography and climate. Additionally, different vegetation types exhibit significant differences in their PM2.5 reduction capabilities due to their distinct biological characteristics. This provides important evidence for optimizing the layout of urban green spaces and enhancing overall ecological benefits in a targeted manner.

4. Discussion

4.1. Urban Green Spaces Exhibit a Significant Temporal Effect on PM2.5 Dry Deposition

This study investigated the PM2.5 dry deposition efficiency of different land use types in Beijing, focusing on the spatiotemporal characteristics of PM2.5 dry deposition in urban green spaces. The results indicate that urban green spaces exhibit the best PM2.5 dry deposition efficiency, consistent with the PM2.5 reduction effects of green infrastructure in the built-up areas of the Yangtze River Midstream Urban Agglomeration from 2000 to 2020 [47].
From a temporal perspective, the total PM2.5 reduction by urban green spaces exhibits an inverted U-shaped trend, first increasing and then decreasing, while the removal rate continues to rise, indicating that the ecological functions of urban green spaces are gradually strengthening through structural optimization. This contradictory phenomenon can be attributed to two key processes: on the one hand, afforestation and reforestation projects significantly increased the leaf area index (LAI) and vegetation coverage of forested areas, enhancing the canopy’s efficiency in intercepting PM2.5 [48]. on the other hand, after 2013, the baseline concentration of PM2.5 in Beijing decreased significantly, leading to a reduction in deposition flux per unit area, resulting in the effect of “total reduction but efficiency improvement.” The contribution of forest land has consistently exceeded 85%, highlighting its central role in urban ecosystem services, consistent with the global urban green space research conclusion that “trees dominate air purification functions” [27]. However, this differs significantly from the reduction totals in Boston in 2008 (12.70 t) and Shanghai in 2013 (442.40 t) [27,35]. This is primarily due to differences in air pollution levels and urban scale across regions, resulting in significant variations in the total PM2.5 reduction capacity of urban green spaces. Compared with similar studies in Beijing, this study found that forests in the study city have a greater PM2.5 reduction capacity, but the removal rate results are similar [49], primarily due to differences in study area scope, with the former study area located in the urban core and having a smaller area.
From a seasonal perspective, the annual average reduction in urban green space from 2000 to 2020, ranked from highest to lowest, was autumn > summer > spring > winter. The reduction in forest areas follows the order of autumn > summer > spring > winter. This seasonal difference is primarily due to the seasonal changes in the leaf area index (LAI) of deciduous trees [50], which reduce the area available for dust deposition. and the stable meteorological conditions in autumn prolong the retention time of aerosols, thereby increasing deposition efficiency. Although vegetation is lush in summer, the high rainfall causes PM2.5 to undergo wet deposition due to rainwater runoff, resulting in a reduction in dry deposition days and consequently a decrease in PM2.5 reduction. The reduction in PM2.5 levels is highest in autumn, followed by winter, spring, and summer. This is related to Beijing’s crop rotation practices, which primarily involve winter wheat followed by summer corn. In autumn, the corn canopy reaches approximately 1.8 m in height, creating a windbreak effect, and the leaf area index increases [26,51], thereby enhancing PM2.5 deposition flux. In summer, the region is in the transition phase between winter wheat harvest and summer corn planting, with bare ground leading to reduced reduction efficiency [52]. The lowest reduction occurred in 2010, while the highest winter reduction was observed in 2015, which may be related to the expansion of facility agriculture increasing winter vegetation coverage. The seasonal fluctuations in grassland reduction are abnormal. This may be due to the relatively small LAI of herbaceous plants, which have a weaker dust-holding capacity [46], and the fact that herbaceous vegetation is easily affected by external environmental factors, especially significant human interference. After 2015, the frequency of lawn mowing in parks increased, directly leading to a sharp decrease in grassland LAI and resulting in abnormal fluctuations in grassland reduction. This contrasts with the findings of Wang Kepu [49], who studied the Beijing urban area and found that winter particulate matter retention was significantly higher than in summer. The primary reason for this discrepancy may be the difference in study areas, as the urban green spaces in this study are primarily located in suburban areas, where PM2.5 background values are far lower than those in urban areas. This seasonal difference is primarily determined by the combined effects of vegetation leaf area index and atmospheric particulate matter concentration, directly reflecting vegetation’s PM2.5 reduction capacity.
From a monthly perspective, the dry deposition effect of urban green spaces on PM2.5 exhibited significant monthly variation patterns from 2000 to 2020, with forest areas showing a “double peak and double valley” trend in PM2.5 dry deposition. This is primarily due to the warming temperatures in March in Beijing, the end of the heating season, reduced particulate matter emission sources, and lower atmospheric pollutant concentrations. Additionally, deciduous plants begin to revive, and the higher wind speeds in spring are unfavorable for PM2.5 concentration accumulation. In summer and autumn, high temperatures and abundant rainfall lead to vigorous plant growth, resulting in a larger vegetation area for particle deposition, stronger atmospheric convection, and fewer dry deposition days, which are unfavorable for the accumulation of atmospheric particles near the ground [26]. Therefore, the reduction rate gradually increases from March to reach the first peak in June, and then significantly decreases around August. After the rainy season, the reduction rate rises sharply, reaching the second peak of the year. Subsequently, as temperatures gradually drop, broad-leaved tree species begin to shed their leaves and enter dormancy. Additionally, PM2.5 concentrations from coal combustion emissions are high in winter, so the reduction rate also decreases from November to February. The monthly reduction rate for farmland shows a certain similarity to that of forest land, primarily due to the influence of crop growth in Beijing. Grassland monthly reduction rates show no obvious patterns, with higher values in October and November. This is primarily because grasslands are often artificially selected and turn yellow later than trees.
The above results confirm the important role of urban green space ecosystems in urban air pollution control. Their well-developed canopy structure and leaf characteristics significantly enhance the adsorption and retention capacity of aerosols. In contrast, non-vegetated surfaces, lacking biological adsorption interfaces, have minimal purification effects on PM2.5. This finding provides an important scientific basis for optimizing the spatial configuration of urban green spaces.

4.2. PM2.5 Dry Deposition in Urban Green Spaces Exhibits Significant Spatial Distribution Characteristics

This study revealed the spatial differentiation characteristics of urban green spaces from 2000 to 2020. In suburban areas, forest ecosystems exhibited superior PM2.5 dry deposition efficiency, a finding consistent with the conclusions of Li et al. [46]. The primary reason is that the topographic gradient in suburban areas is relatively gentle, providing favorable growing conditions for vegetation. Urban green space systems exhibit high landscape aggregation and vegetation coverage indices. Additionally, proximity to urban built-up areas results in significantly higher PM2.5 background concentrations compared to distant suburban areas, enabling sufficient contact between plant organs such as leaves and pollutants, thereby enhancing aerosol adsorption effects [53]. This study’s temporal analysis shows that high dry deposition zones exhibited significant spatial migration characteristics between 2000 and 2010, shifting from the urban suburbs to the western part of Yanqing. This spatial heterogeneity is closely related to urban development [54,55]. On the one hand, industrial relocation and the spread of traffic pollution driven by urban expansion have led to a sharp increase in deposition in the northeastern region. On the other hand, the decline in vegetation coverage and the intensification of the urban heat island effect caused by high-intensity development in the core urban area have jointly weakened the deposition capacity of the traditional ecological barrier zone in the western region.
From the perspective of changes in farmland, the overall deposition efficiency in the study area shows a significant decline trend. This change is significantly correlated with adjustments in urban spatial strategies. The implementation of the “convert farmland to forest” policy in ecological conservation areas and the development of the Tongzhou-Shunyi urban cluster have led to increased farmland fragmentation and reduced vegetation dust retention capacity. Additionally, infrastructure construction such as the Daxing International Airport has induced changes in aerosol diffusion pathways, resulting in a systemic restructuring of the regional deposition pattern. Comparative analysis indicates that the average PM2.5 concentration in farmland landscapes differs significantly from that in forestland systems, particularly in terms of dry deposition flux density. This land-use type difference stems from frequent human disturbances and open canopy structures in farmland systems, which reduce turbulence exchange coefficients and weaken the effective interface contact time during the dry deposition process.
The grassland in the study area exhibits a “southwest-northeast” semi-enclosed distribution pattern, consistent with topography and terrain, such as the pollutant convergence effect on the leeward slope of Fangshan [56]. In terms of time series, the increase in dry deposition from 2000 to 2010 was primarily due to increased pollutant emissions during industrialization; the significant decline after 2010 was directly related to the sharp decrease in PM2.5 concentrations following the implementation of Beijing’s “Clean Air Action Plan,” highlighting the positive impact of policy interventions on regional ecological environments [57]. Notably, the rate of decline in deposition in suburban areas was faster than in mountainous areas, indicating that human-dominated regions are more sensitive to pollution control measures. This study further confirms that dry deposition processes are not only driven by meteorological conditions and vegetation physiological characteristics but also form a dynamic feedback loop with regional-scale land use changes and pollution control policies.

4.3. Optimization Recommendations for Urban Green SpacesUrban Green Space Optimization Strategies and PM2.5 Dry Deposition Effect Prediction

Studies have confirmed that urban green spaces exhibit a significant PM2.5 removal effect. In response to Beijing’s current situation of tight land resources, limited green space, and uneven distribution (localized concentration with limited coverage), and based on the differences in dry deposition efficiency among various green space types (forest land > farmland > grassland > impervious surfaces > water bodies = unutilized land, Section 3.2), targeted optimization recommendations are proposed from three aspects: vegetation configuration, spatial layout, and seasonal adaptation. Additionally, the UFORE model is used to quantitatively predict their effects.

4.3.1. Optimization Recommendations for Urban Green Spaces

(1)
Optimize the Layout of Green Space Types: Prioritize the Configuration of Vegetation with High-Efficiency Deposition
Taking forest land as the core (with an annual average dry deposition flux of 1.13 g/m2 and a removal rate of 0.209%, which is the most effective PM2.5 sink), supplemented by farmland (0.20 g/m2, 0.024%) and grassland (0.19 g/m2, 0.002%), a vegetation system featuring “high-efficiency leadership and multi-element coordination” is constructed.
In areas with high PM2.5 concentrations (such as around industrial zones and near major transportation corridors), the layout of single grassland or farmland should be avoided. These areas need to strengthen interception capabilities, so deciduous broad-leaved forests (e.g., poplars, maples) or “forest land + shrub” mixed communities should be prioritized for configuration. The PM2.5 deposition velocity of forest land reaches 0.09 m/s, which is 5 times that of grassland (0.018 m/s, Section 2.3.1). It can enhance the adsorption efficiency of particulate matter through a higher Leaf Area Index (LAI, annual average of 3.5), thereby alleviating local pollution pressure.
(2)
Refine Spatial Layout, Leverage Spatial Heterogeneity, and Maximize Deposition Efficiency
Based on the land use characteristics and greening shortcomings of different urban districts in Beijing, targeted efforts are made to tap into the increment of green spaces and enhance the overall dry deposition capacity of the region:
(1) Core Urban Area (Within the 3rd Ring Road): Promote Vertical Greening to Unlock the Potential of “Three-Dimensional Space”. The core urban area is a historic old district of Beijing, featuring dense hutongs (e.g., Yaowu Hutong, Cha’er Hutong), a building density exceeding 60%, and a ground green space coverage of less than 12% [58]. Horizontal greening space is basically saturated; however, building walls and rooftops account for 35% of the total area, serving as key “carriers for green space increment.”
The vertical greening model is promoted: For building walls, climbing vines such as Parthenocissus tricuspidata are used (with an annual average LAI of 2.1, accounting for 60% of the LAI of forest land), achieving a dry deposition flux of 0.678 g/m2 (removal rate of 0.125%); for rooftops, a mixed “herb + shrub” model of Sedum lineare and Ilex chinensis is adopted (with an annual average LAI of 1.8, 1.5 times the LAI of grassland (1.2)), resulting in a dry deposition flux of 0.285 g/m2 (removal rate of 0.018%, Section 3.2).
Taking a typical hutong (150 m in length, 8 m in building height, with 20 buildings in total) as an example: The greenable wall area of 20 buildings is 800 m2, with an annual dry deposition amount of 0.542 kg; the total rooftop area is 1200 m2 (with a greening coverage rate of 50%), contributing an annual dry deposition amount of 0.171 kg; a single hutong can reduce PM2.5 by approximately 0.713 kg annually. If the vertical greening model is promoted in approximately 985 similar hutongs within the 3rd Ring Road, the total annual PM2.5 reduction potential will reach 713 kg.
(2) Inner City (3rd to 5th Ring Roads): Construct Small-Scale Green Spaces to Fill “Ecological Gaps”. The inner city is a densely populated area (with a permanent population density of approximately 12,000 people/km2), where impervious surfaces account for over 55%—their dry deposition flux is only 0.006 g/m2, with almost no purification effect (Section 3.2). Additionally, existing green spaces are distributed in a “fragmented and isolated” manner, leading to insufficient contact between pollutants and vegetation, and the dry deposition efficiency of mixed land types in the region is only 0.05%.
Idle land (e.g., corner spaces in old communities, abandoned industrial areas) is used to construct small-scale green spaces (200–1000 m2), adopting a “arbor + shrub” structure of Sophora japonica and Prunus cerasifera (with an annual average LAI of 2.8, accounting for 80% of the LAI of forest land), achieving a dry deposition flux of 0.904 g/m2 (removal rate of 0.167%).
The total area of this region is approximately 600 km2, with 5 km2 of existing idle land (accounting for 1%): After converting all idle land into small-scale green spaces (10,000 green spaces of 500 m2 each), the annual total dry deposition amount reaches 45.2 tons; meanwhile, the removal rate of mixed land use in the region increases from 0.05% to 0.12%. Based on the 2020 PM2.5 background concentration (50 μg/m3), atmospheric mixing layer height (697 m, Section 2.3.4), and Formula (10), the additional reduction amount is calculated to be 252.7 tons, and the total regional reduction potential reaches 297.9 tons.
(3) Outer Ring Urban Area (Beyond the 5th Ring Road): Build Vertical Vegetation Structure to Strengthen “Three-Dimensional Interception”. The outer ring urban area has abundant land resources (with a green space coverage rate of approximately 25%), but most existing green spaces are single-type sparse forests or grasslands, with an LAI of less than 2.0 (1.8 for sparse forests, 1.2 for grasslands) and a dry deposition efficiency of only 0.002–0.024% (Section 3.2).
In newly constructed park recreational forests, focus is placed on building a vertical vegetation structure of “arbor + shrub + groundcover” such as Populus spp. Syringa oblata, and Poa annua: The superposition of multi-layered leaves increases the LAI to 4.5 (1.29 times the LAI of forest land), achieving a dry deposition flux of 1.458 g/m2 (removal rate of 0.270%), while reducing PM2.5 resuspension caused by hard paving (originally accounting for 30%).
The region plans to add 100 km2 (108 m2) of park recreational forests: Compared with single-type sparse forests (dry deposition flux of 1.0 g/m2), the vertical structure achieves an additional annual reduction of 4.58 kg per hectare, with a total additional reduction of 45.8 tons; the proportion of hard paving in parks is reduced from 30% to 10%, and 20% of the area is converted into grasslands (dry deposition flux of 0.19 g/m2), with an annual dry deposition amount of 3.8 tons, resulting in a total regional reduction potential of 49.6 tons.
(3)
Adapt to Seasonal Patterns: Enhance Temporal Matching of Deposition Capacity
In light of the seasonal characteristics of PM2.5 dry deposition in Beijing (autumn > summer > spring > winter, Section 3.3.2), vegetation management is adjusted to align with seasonal patterns, thereby addressing the issues of “low efficiency in peak seasons and functional failure in off-seasons”:
Large-scale pruning of forest land should be avoided. In autumn, the leaves of forest land reach maturity, and the Leaf Area Index (LAI) hits its annual peak (with an LAI of approximately 4.2 for deciduous forests). Preserving leaves during this period helps maintain high dry deposition efficiency—from 2000 to 2020, the average PM2.5 reduction by forest land in autumn was 2722.45 tons, which is 1.57 times that in winter (1729.90 tons, Section 3.3.2), making autumn a critical period for annual pollution reduction.
Evergreen understory shrubs such as Ilex chinensis should be planted in deciduous forests. In winter, deciduous forests shed their leaves, and the LAI drops below 1.0. However, evergreen shrubs can maintain an LAI of 1.5–2.0, offsetting the decline in dry deposition capacity caused by leaf loss and alleviating the pressure of rising PM2.5 concentrations during the winter coal-fired heating period.

4.3.2. Prediction of Optimization Strategy Effects

To verify the practical value of the optimization recommendations, the UFORE atmospheric pollution dry deposition model (consistent with Section 2.3) and core formulas (Formulas (3), (9) and (10)) were used, with 2020 as the baseline year (total PM2.5 reduction: 8529 tons, removal rate: 2.81%, Section 3.3.1). Two scenarios were set to predict the effects in 2030:
(1)
Scenario 1: Status Quo Continuation (No Optimization Measures)
Assumptions: The green space pattern remains unchanged (consistent with the 2020 landscape pattern in Section 3.4); the annual average PM2.5 background concentration decreases by 2 μg/m3 per year (from 50 μg/m3 in 2020 to 30 μg/m3 in 2030); the removal rate increases by 0.05% per year (from 2.81% in 2020 to 3.31% in 2030). Based on Formula (9) and considering the positive correlation between E (regional atmospheric PM2.5 background value, see Formula (10) for details) and PM2.5 concentration, the total 2030 PM2.5 reduction is calculated as follows:
Q 2030 = Q 2020 × P 2030 P 2020 × C 2030 C 2020 ,
It is calculated that the total PM2.5 reduction in 2030 will be 6028 tons.
(2)
Scenario 2: Implementation of Optimization Recommendations
The additional PM2.5 reduction potential comes from three optimization measures: vertical greening in the core urban area (0.713 tons) + small-scale green spaces in the inner city (252.7 tons) + vertical vegetation structure in the outer ring area (49.6 tons), with a total of approximately 303.0 tons. The total PM2.5 reduction in 2030 will be 6331 tons, representing a 5.0% increase compared to Scenario 1. which will further narrow the spatial difference between “high-value areas in the suburbs and low-value areas in the outer suburbs” (Section 3.4) and promote the balanced improvement of PM2.5 dry deposition capacity of urban green spaces in Beijing.
This prediction result confirms that the proposed optimization strategies can effectively make up for the limitation of “declining total reduction under the status quo continuation scenario” (see Section 3.3.1 for details), and provide a feasible path for Beijing to achieve the goal of “garden city construction” and the continuous improvement of air quality.

5. Conclusions

This study focuses on Beijing and uses a PM2.5 grid dataset constructed from multi-source satellite data (as an alternative to traditional ground station data) to analyze the spatiotemporal distribution characteristics of dry deposition in urban green spaces from 2000 to 2020 using the UFORE model. The study specifically examines the impact of different types of green spaces on PM2.5 dry deposition and draws the following conclusions: (1) The dry deposition effect of urban green spaces is significantly superior to that of other land use types. Among these, forested areas performed the best, with an average annual dry deposition rate of 1.13 g/m2; farmland (0.22 g/m2) and grassland (0.19 g/m2) followed, with their rates being 188 times, 37 times, and 32 times that of impervious surfaces, respectively, highlighting the core role of green spaces as a “sink” for PM2.5. (2) Dry deposition effects exhibit a pronounced temporal effect. The PM2.5 removal rate of urban green spaces has continued to rise from 2000 to 2020, indicating that their reduction effect is continuously strengthening; seasonal differences are significant, with higher reduction rates in autumn than in winter, and a notable decline in August. This characteristic further validates that dry deposition effects are regulated by external environmental factors such as climate and vegetation phenology. (3) In terms of spatial distribution, high-value dry deposition zones are distributed along a “southwest-northeast” axis, reflecting the regional correlation between green space layout and ecological functions. In summary, Beijing’s urban green spaces exhibit distinct and regular characteristics in terms of effect, time, and space regarding PM2.5 dry deposition, providing multi-dimensional evidence for a deeper understanding of the ecological role of green spaces.
Based on the above research results to further enhance the PM2.5 dry deposition capacity of Beijing’s urban green spaces, maximizing the PM2.5 reduction efficiency of green spaces can be achieved through the strategy of “prioritizing forest land, optimizing structure, and making dynamic adjustments”. This provides a quantifiable and operable path of support for Beijing’s “garden city” construction.

Author Contributions

Conceptualization, H.L., X.X., S.L. (Shaowei Lu) and B.L.; Data curation, H.L., S.L. (Shaoning Li) and X.X.; Formal analysis, H.L. and X.X.; Funding acquisition, B.L.; Investigation, Y.D.; Methodology, H.L. and B.L.; Resources, B.L.; Software, H.L.; Supervision, S.L. (Shaoning Li) and S.L. (Shaowei Lu); Validation, S.L. (Shaoning Li); Visualization, H.L.; Writing—original draft, H.L.; Writing—review & editing, H.L., S.L. (Shaoning Li), X.X., N.Z., S.L. (Shaowei Lu) and B.L. All authors have read and agreed to the published version of the manuscript.

Funding

This research was funded by Director’s Foundation of Institute of Forestry and Pomology in Beijing Academy of Agriculture and Forestry Sciences (LGSSZJJ202302).

Institutional Review Board Statement

Not applicable.

Informed Consent Statement

Not applicable.

Data Availability Statement

Restrictions apply to the availability of these data. The major data were obtained from China National Earth System Science Data Center (NESSDC) and are available http://www.geodata.cn (accessed on 30 August 2025) with the permission of NESSDC.

Acknowledgments

Thanks to the following units for supporting: Instiyute of Forestry and Pomology, Beijing of Agriculture and Forestry Sciences; Beijing Yanshan Forest Ecosystem Observation and Research Station; and Forestry College of Shenyang Agricultural University.

Conflicts of Interest

The authors declare that they have no known competing financial interests or personal relationships that could have appeared to influence the work reported in this paper.

References

  1. Wang, C.; Hao, L.; Liu, C.; Chen, R.; Wang, W.; Chen, Y.; Yang, Y.; Meng, X.; Fu, Q.; Ying, Z.; et al. Associations between fine particulate matter constituents and daily cardiovascular mortality in Shanghai, China. Ecotoxicol. Environ. Saf. 2020, 191, 110154. [Google Scholar] [CrossRef]
  2. Hutsemékers, V.; Mouton, L.; Westenbohm, H.; Collart, F.; Vanderpoorten, A. Disentangling climate change from air pollution effects on epiphytic bryophytes. Glob. Change Biol. 2023, 29, 3990–4000. [Google Scholar] [CrossRef] [PubMed]
  3. Wang, X.; Dewancker, B.J.; Tian, D.; Zhuang, S. Exploring the burden of PM2.5-related deaths and economic health losses in Beijing. Toxics 2024, 12, 377. [Google Scholar] [CrossRef] [PubMed]
  4. Schwartz, J.; Neas, L.M. Fine particles are more strongly associated than coarse particles with acute respiratory health effects in schoolchildren. Epidemiology 2000, 11, 6–10. [Google Scholar] [CrossRef] [PubMed]
  5. Zhao, Y.Y.; Zhang, X.P.; Chen, M.X.; Gao, S.S.; Li, R.K. Regional variation of urban air quality in China and its dominant factors. Acta Geogr. Sin. 2021, 11, 2814–2829. [Google Scholar] [CrossRef]
  6. Wang, S.; Zhou, C.; Wang, Z.; Feng, K.; Hubacek, K. The characteristics and drivers of fine particulate matter (PM2.5) distribution in China. J. Clean. Prod. 2017, 142, 1800–1809. [Google Scholar] [CrossRef]
  7. Liu, H.; Li, X.M.; Tian, S.C.; Li, S.B.; Gong, Y.L. Study on Spatio-Temporal Evolution and Influencing Factors of Urban Air Quality in China. Ecol. Econ. 2021, 7, 91–96. [Google Scholar]
  8. Perez, P.; Menares, C.; Ramírez, C. PM2.5 forecasting in Coyhaique, the most polluted city in the Americas. Urban Clim. 2020, 32, 100608. [Google Scholar] [CrossRef]
  9. Wang, Z.F.; Wang, X.K.; Xie, X.Q.; Xiao, M.H.; Wu, Y.F.; Liu, X.S. Evolution of Landscape Pattern of Green Space in Fujian Province: Influencing Factors and Spatial Differences Based on GWR Model. J. Northwest For. Univ. 2022, 5, 242–250. [Google Scholar]
  10. Lin, L.; Yan, J.; Ma, K.; Zhou, W.; Chen, G.; Tang, R.; Zhang, Y. Characterization of particulate matter deposited on urban tree foliage: A landscape analysis approach. Atmos. Environ. 2017, 171, 59–69. [Google Scholar] [CrossRef]
  11. Millward, A.A.; Sabir, S. Benefits of a forested urban park: What is the value of Allan Gardens to the city of Toronto, Canada? Landsc. Urban Plan. 2011, 100, 177–188. [Google Scholar] [CrossRef]
  12. Toparlar, Y.; Blocken, B.; Maiheu, B.; Van Heijst, G.J.F. The effect of an urban park on the microclimate in its vicinity: A case study for Antwerp, Belgium. Int. J. Climatol. 2018, 38, e303–e322. [Google Scholar] [CrossRef]
  13. Thompson, C.W.; Roe, J.; Aspinall, P. More green space is linked to less stress in deprived communities: Evidence from salivary cortisol patterns. Landsc. Urban Plan. 2012, 105, 221–229. [Google Scholar] [CrossRef]
  14. Tu, X.Y.; Huang, G.L.; Wu, J.G. Review of the relationship between urban greenspace accessibility and human well-being. Acta Ecol. Sin. 2019, 2, 421–431. [Google Scholar] [CrossRef]
  15. He, D.; Yuan, J.Q.; Gao, Z.F.; Li, C.M.; Lei, K.Y.; Liu, Y.P.; Dong, N.L. Effects of leaf surface microstructure of 13 evergreen shrubs on atmospheric particulate retention capacity in Zhengzhou City. J. Zhejiang AF Univ. 2025, 3, 513–523. [Google Scholar]
  16. Wang, J.; Xu, H.Y.; Yue, F.; Fu, F. Research on the Correlation Between Green Space Layout and PM2.5 in the Central Urban Area of Beijing. J. Beijing Univ. Civ. Eng. Archit. 2023, 1, 44–52. [Google Scholar]
  17. Chen, M.; Yang, C.; Dai, F. Effects of Urban Park Green Spaces and Surrounding Built Environments on PM2.5:A Case Study of Ten Park Green Spaces in Wuhan. Chin. Landsc. Archit. 2023, 10, 104–110. [Google Scholar]
  18. Qiu, L.; Liu, F.; Zhang, X.; Gao, T. Difference of airborne particulate matter concentration in urban space with different green coverage rates in Baoji, China. Int. J. Environ. Res. Public Health 2019, 16, 1465. [Google Scholar] [CrossRef]
  19. Badach, J.; Dymnicka, M.; Baranowski, A. Urban vegetation in air quality management: A review and policy framework. Sustainability 2020, 12, 1258. [Google Scholar] [CrossRef]
  20. Fang, J.; Li, S.; Zhao, N.; Xu, X.; Zhou, Y.; Lu, S. Uptake and distribution of the inorganic components NH4+ and NO3 in PM2.5 by two Chinese conifers. Sci. Total Environ. 2024, 907, 167573. [Google Scholar] [CrossRef] [PubMed]
  21. Lee, A.; Jeong, S.; Joo, J.; Park, C.R.; Kim, J.; Kim, S. Potential role of urban forest in removing PM2.5: A case study in Seoul by deep learning with satellite data. Urban Clim. 2021, 36, 100795. [Google Scholar] [CrossRef]
  22. Zhai, C.; Bao, G.; Zhang, D.; Sha, Y. Urban forest locations and patch characteristics regulate PM2.5 mitigation capacity. Forests 2022, 13, 1408. [Google Scholar] [CrossRef]
  23. Giardina, M.; Donateo, A.; Buffa, P.; Contini, D.; Cervone, A.; Lombardo, C.; Rocchi, F. Atmospheric dry deposition processes of particles on urban and suburban surfaces: Modelling and validation works. Atmos. Environ. 2019, 214, 116857. [Google Scholar] [CrossRef]
  24. Li, J.X.; Han, L.J.; Zhang, Z.M.; Zhou, W.Q.; Li, W.F.; Qian, Y.G. Assessment on the reduction of atmospheric PM2.5 by urban forest and its ratio to the total PM2.5 pollutant in the Chinese major cities. Acta Ecol. Sin. 2023, 7, 2640–2649. [Google Scholar] [CrossRef]
  25. Chen, H.S.; Lin, Y.C.; Chiueh, P.T. High-resolution spatial analysis for the air quality regulation service from urban vegetation: A case study of Taipei City. Sustain. Cities Soc. 2022, 83, 103976. [Google Scholar] [CrossRef]
  26. Yao, J.; Wu, S.; Cao, Y.; Wei, J.; Tang, X.; Hu, L.; Wu, J.; Yang, H.; Yang, J.; Ji, X. Dry deposition effect of urban green spaces on ambient particulate matter pollution in China. Sci. Total Environ. 2023, 900, 165830. [Google Scholar] [CrossRef] [PubMed]
  27. Nowak, D.J.; Hirabayashi, S.; Bodine, A.; Hoehn, R. Modeled PM2.5 removal by trees in ten US cities and associated health effects. Environ. Pollut. 2013, 178, 395–402. [Google Scholar] [CrossRef]
  28. Akopov, A.S.; Beklaryan, L.A.; Saghatelyan, A.K. Agent-based modelling of interactions between air pollutants and greenery using a case study of Yerevan, Armenia. Environ. Model. Softw. 2019, 116, 7–25. [Google Scholar] [CrossRef]
  29. Junior, D.P.M.; Bueno, C.; da Silva, C.M. The Effect of Urban Green Spaces on Reduction of Particulate Matter Concentration. Bull. Environ. Contam. Toxicol. 2022, 108, 1104–1110. [Google Scholar] [CrossRef] [PubMed]
  30. Chen, P.X.P.; Jiao, Y.W.; Pei, T.T.; Zjou, Z.X. The effect of adsorbing fine particulate matter (PM2.5) by garden plants: A review. Chin. J. Ecol. 2014, 9, 2558–2566. [Google Scholar]
  31. Ma, Z.Y.; Xiao, H.W. The Research on A Spatial Differentiation of Influence Factors of Regional PM2.5 in China—The Empirical Analysis Based on Geographically Weighted Regression Model. J. Shanxi Univ. Financ. Econ. 2017, 5, 14–26. [Google Scholar]
  32. Editorial Board of China Statistical Yearbook. China Statistical Yearbook 2021; China Statistics Press: Beijing, China, 2022. [Google Scholar]
  33. Bai, K.; Li, K.; Wu, C.; Chang, N.B.; Guo, J. A homogenized daily in situ PM2.5 concentration dataset from national air quality monitoring network in China. Earth Syst. Sci. Data Discuss. 2020, 2020, 1–30. [Google Scholar] [CrossRef]
  34. Wang, J.; Endreny, T.A.; Nowak, D.J. Mechanistic simulation of tree effects in an urban water balance model. J. Am. Water Resour. Assoc. 2008, 44, 75–85. [Google Scholar] [CrossRef]
  35. She, X.; Gao, J.; Zhang, B. PM2.5 removal service of green spaces in Shanghai based on the dust retention simulation on urban vegetation. Acta Ecol. Sin. 2020, 40, 2599–2608. [Google Scholar] [CrossRef]
  36. Ren, Z.; Du, Y.; He, X.; Pu, R.; Zheng, H.; Hu, H. Spatiotemporal pattern of urban forest leaf area index in response to rapid urbanization and urban greening. J. For. Res. 2018, 29, 785–796. [Google Scholar] [CrossRef]
  37. Saunders, S.M.; Dade, E.; Van Niel, K. An Urban Forest Effects (UFORE) model study of the integrated effects of vegetation on local air pollution in the Western Suburbs of Perth, WA. In Proceedings of the 19th International Congress on Modelling and Simulation, Perth, Australia, 12–16 December 2011; pp. 12–16. [Google Scholar]
  38. Pullman, M. Conifer PM2.5 Deposition and Re-Suspension in Wind and Rain Events. Master’s Thesis, Cornell University, Ithaca, NY, USA, 2008. [Google Scholar]
  39. Zhang, L.; He, Z. An empirical algorithm estimating dry deposition velocity of fine, coarse and giant particles. Atmos. Chem. Phys. 2014, 14, 3729–3737. [Google Scholar] [CrossRef]
  40. Liu, C.Y.; Jin, H.; Fan, J.L. Input Characteristics of Dry Deposition of Atmospheric Particulates and Metals in Farmland in the Suburb of Nanjing. Huan Jing Ke Xue 2023, 44, 1873–1881. [Google Scholar]
  41. Zhao, X.; Yan, H.; Liu, M.; Kang, L.; Yu, J.; Yang, R. Relationship between PM2.5 adsorption and leaf surface morphology in ten urban tree species in Shenyang, China. Energy Sources Part A Recovery Util. Environ. Eff. 2019, 41, 1029–1039. [Google Scholar] [CrossRef]
  42. Nowak, D.J.; Civerolo, K.L.; Rao, S.T.; Sistla, G.; Luley, C.J.; Crane, D.E. A modeling study of the impact of urban trees on ozone. Atmos. Environ. 2000, 34, 1601–1613. [Google Scholar] [CrossRef]
  43. Liu, J.; Mo, L.; Zhu, L.; Yang, Y.; Liu, J.; Qiu, D.; Zhang, Z.; Liu, J. Removal efficiency of particulate matters at different underlying surfaces in Beijing. Environ. Sci. Pollut. Res. 2016, 23, 408–417. [Google Scholar] [CrossRef]
  44. Freer-Smith, P.H.; El-Khatib, A.A.; Taylor, G. Capture of particulate pollution by trees: A comparison of species typical of semi-arid areas (Ficus nitida and Eucalyptus globulus) with European and North American species. Water Air Soil Pollut. 2004, 155, 173–187. [Google Scholar] [CrossRef]
  45. Tallis, M.; Taylor, G.; Sinnett, D.; Freer-Smith, P. Estimating the removal of atmospheric particulate pollution by the urban tree canopy of London, under current and future environments. Landsc. Urban Plan. 2011, 103, 129–138. [Google Scholar] [CrossRef]
  46. Li, K.; Li, C.; Hu, Y.; Xiong, Z.; Wang, Y. Quantitative estimation of the PM2.5 removal capacity and influencing factors of urban green infrastructure. Sci. Total Environ. 2023, 867, 161476. [Google Scholar] [CrossRef]
  47. Fang, Y.H.; Zhao, L.Y.; Dou, B.Y.; Wang, S.X.; Zhou, C. Reduction effect of green infrastructure on PM2.5 in the built-up areas of urban agglomerations in the Yangtze River’s middle reaches. Acta Ecol. Sin. 2024, 1, 117–128. [Google Scholar]
  48. Hu, C.Y.; Wei, W.; Wang, X.F.; Chen, L.D.; Chen, X.N.; Ji, Y.Z. Change in Vegetation Cover as Affected by Grain for Green Project in Gansu. J. Ecol. Rural. Environ. 2016, 4, 588–594. [Google Scholar]
  49. Wang, K.P.; Zhang, Y.K.; Liu, X.H. Modeled Particulate Matters Removal by Urban Green Lands in Beijing. Environ. Sci. Technol. 2020, 4, 121–129. [Google Scholar]
  50. Zeng, X.P.; Zhao, P.; Rao, X.Q.; Cai, X.A. Measurement of leaf area index of three plantations and their seasonal changes in Heshan hilly land. J. Beijing For. Univ. 2008, 5, 33–38. [Google Scholar]
  51. Bo, X.Y.; Xie, D.H.; Wu, M.X.; Yan, G.J.; Mu, X.H. Leaf area index inversion corrected with clumping index of maize canopy. J. Beijing Norm. Univ. (Nat. Sci.) 2024, 2, 217–227. [Google Scholar]
  52. Duan, G.L.; Wang, W.J.; Cheen, W.W.; Wang, L.Y.; Xing, G.Q. Reach on Effect of Conservation Tillage on Suppressing Dustin Seasonal Bare Farmland. Agric. Sci. Technol. Equip. 2021, 5, 112–114. [Google Scholar]
  53. Qi, S.; Wang, C.; Niu, Z.; Liu, Z. SVI and VCI based on NDVI time-series dataset used to monitor vegetation growth status and its response to climate variables. Prog. Geogr. 2004, 23, 91–99. [Google Scholar]
  54. Zhang, Q.; Wu, S.Q.; Yang, X. A Quantitative Comparison on Green Pattern of Megalopolis Central Area: A Case of Beijing, London, Paris and New York. Huazhong Archit. 2017, 6, 16–23. [Google Scholar]
  55. Yang, X.; Zhang, Q.; Wu, S.Q. Comparative Research on Multi-scale and System of Metropolis Green Space Pattern: Case Studies of Beijing, London, Paris and New York. Urban Plan. Int. 2017, 3, 83–91. [Google Scholar] [CrossRef]
  56. Wu, J.S.; Xie, W.D.; Li, W.F.; Li, J. Effects of Urban Landscape Pattern on PM2.5 Pollution—A Beijing Case Study. PLoS ONE 2015, 10, e0142449. [Google Scholar] [CrossRef] [PubMed]
  57. Beijing Municipal Environmental Protection Bureau. Evaluation Report on the Implementation Effect of the Beijing Clean Air Action Plan (2013–2020); Beijing Municipal Environmental Protection Bureau: Beijing, China, 2021.
  58. Beijing Municipal Bureau of Statistics. Beijing Urban Statistical Yearbook 2024; China Statistics Press: Beijing, China, 2024. [Google Scholar]
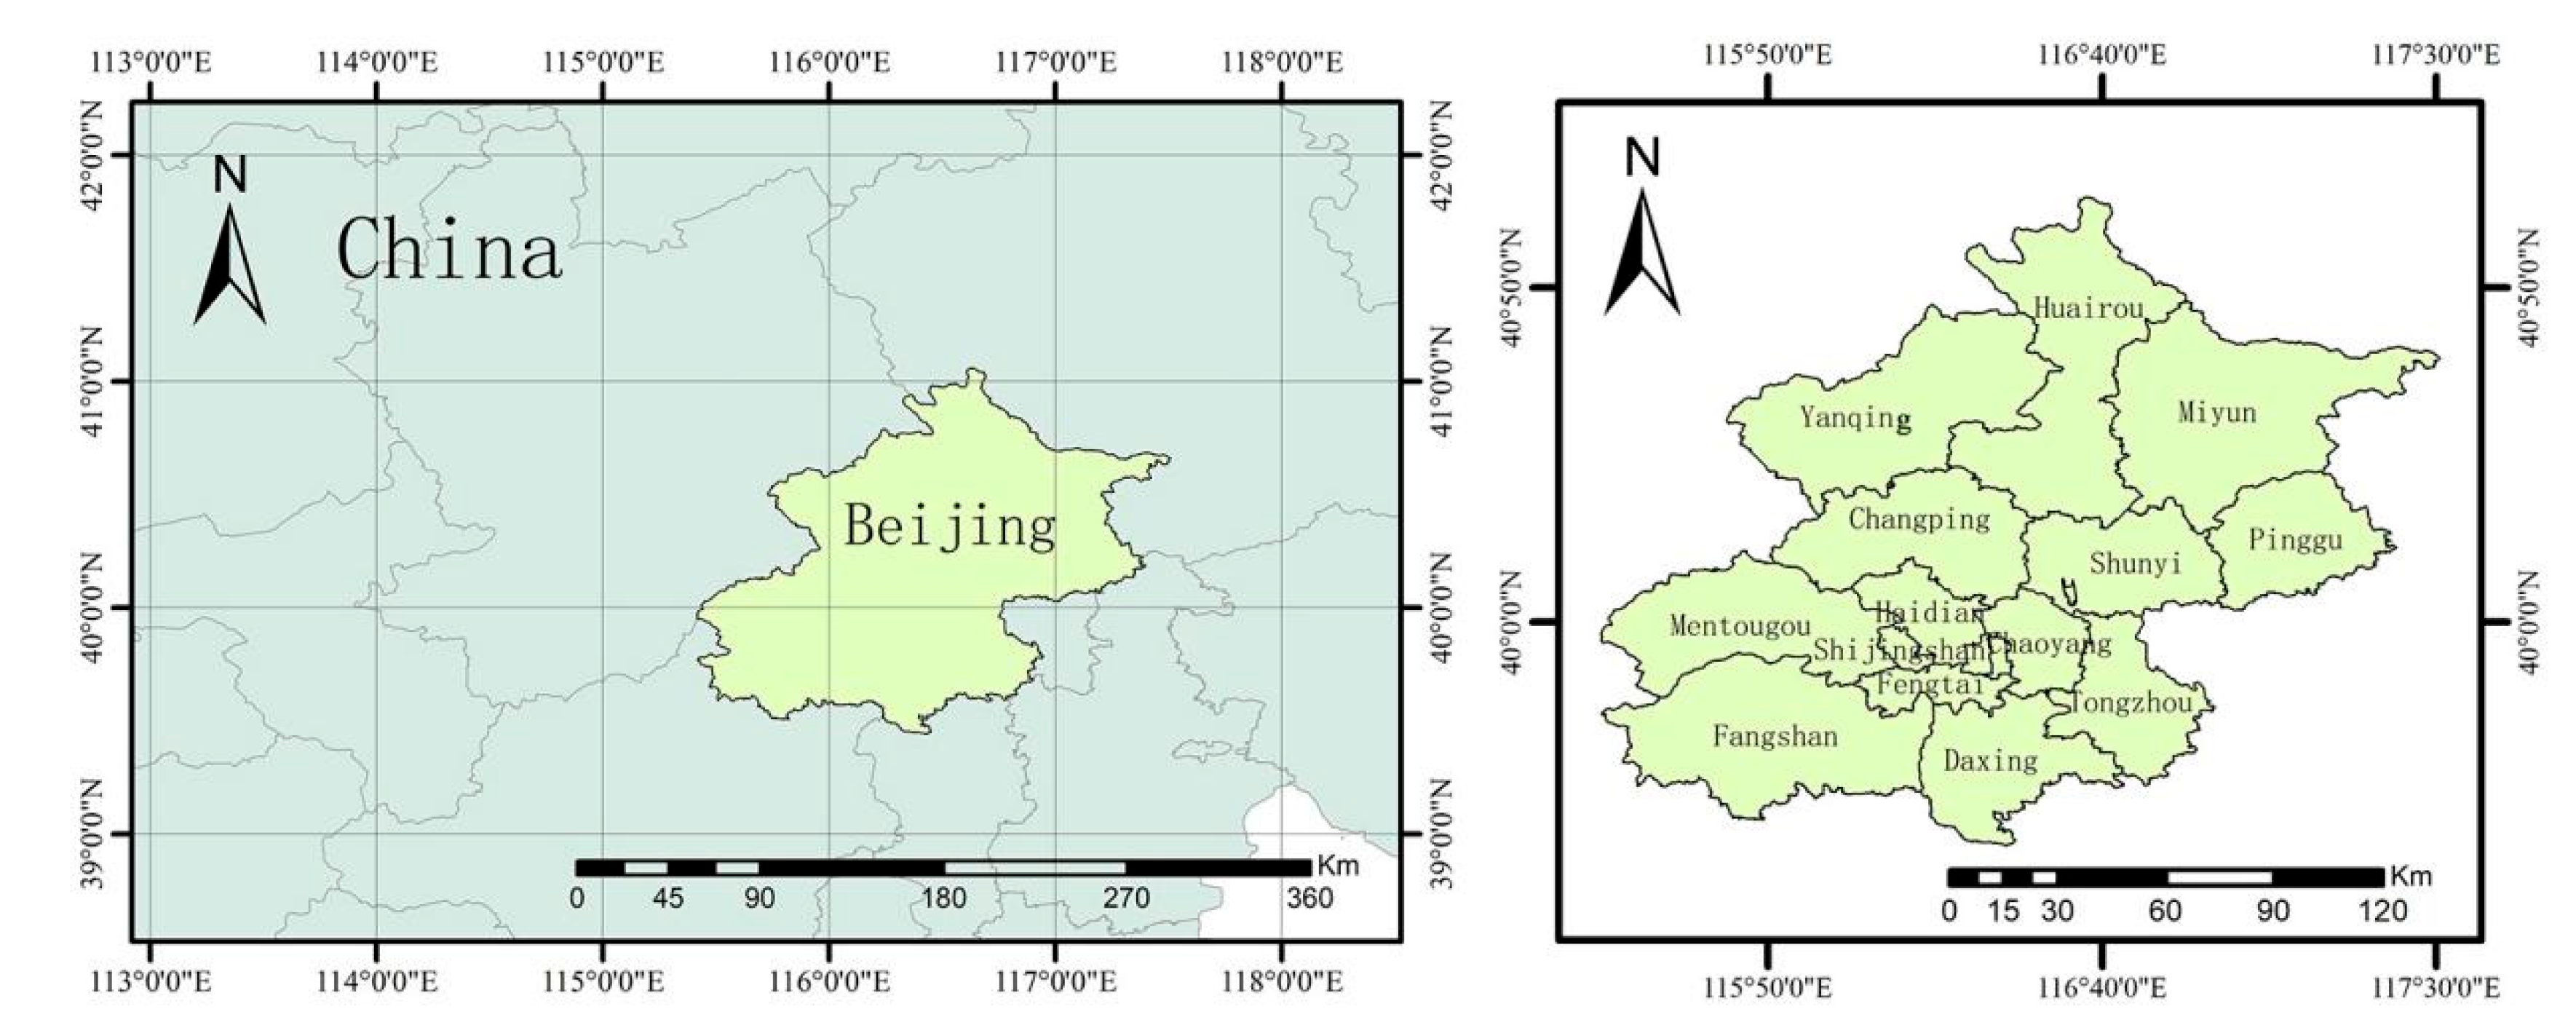
Figure 1. Research area.
Sustainability 17 09608 g001
Figure 2. Scatter plot of PM2.5 NESSDC inversion data and ecological station data validation.
Sustainability 17 09608 g002
Figure 3. Leaf area index distribution in the study area.
Sustainability 17 09608 g003
Figure 4. Scatter plot of PM2.5 download data and ecological station data to estimate dry deposition flux.
Sustainability 17 09608 g004
Figure 5. Annual deposition effects of PM2.5 for each category in Beijing, 2000–2020.
Sustainability 17 09608 g005
Figure 6. Changes in PM2.5 seasonal deposition effects for each category in Beijing, 2000–2020.
Sustainability 17 09608 g006
Figure 7. Changes in the inter-monthly deposition effect of PM2.5 for each category in Beijing, 2000–2020.
Sustainability 17 09608 g007
Figure 8. Spatial Distribution of PM2.5 Dry Deposition in Beijing Forest Land.
Sustainability 17 09608 g008
Figure 9. Spatial Distribution of PM2.5 Dry Deposition on Cultivated Land in Beijing City.
Sustainability 17 09608 g009
Figure 10. Spatial Distribution of PM2.5 Dry Deposition on grassland in Beijing City.
Sustainability 17 09608 g010
Table 1. Days of PM2.5 Dry Deposition from 2000 to 2020.
Dry Precipitation Days (Days)/YearMonth
123456789101112
200023151320161414719192624
20052513232519881017262923
201023202321171515111723157
20152823212318109129241829
202025242524171410612212729
Table 2. The dry deposition efficiency of different land use types in Beijing from 2000 to 2020.
Forest LandFarmlandGrasslandWaterImpervious SurfacesUnutilized Land
abababababab
20000.9520.1250.2040.0190.1650.00140.00600.0050.000020.0050
20051.2340.1850.2360.0230.1920.00190.00700.0070.000030.0060
20101.3140.2330.2560.0270.2250.00260.00700.0070.000050.0060
20151.2190.2470.2170.0240.2210.00230.00700.0070.000060.0070
20200.9470.2530.1890.0270.1610.00170.00500.0050.000060.0060
average value1.1330.2090.2200.0240.1930.0020.00600.0060.000040.0060
Note: a represents PM2.5 deposition flux, with units of g/m2, and b represents PM2.5 removal efficiency (%).
Disclaimer/Publisher’s Note: The statements, opinions and data contained in all publications are solely those of the individual author(s) and contributor(s) and not of MDPI and/or the editor(s). MDPI and/or the editor(s) disclaim responsibility for any injury to people or property resulting from any ideas, methods, instructions or products referred to in the content.