Article

Environmental Regulation, Information Disclosure, and Clean Production in Heavy-Polluting Enterprises: Evidence from China

School of Economics and Management, North China University of Science and Technology, Tangshan 063009, China
*
Author to whom correspondence should be addressed.
Sustainability 2025, 17(21), 9586; https://doi.org/10.3390/su17219586 (registering DOI)
Submission received: 22 September 2025 / Revised: 20 October 2025 / Accepted: 24 October 2025 / Published: 28 October 2025

Abstract

The key to achieving sustainable economic development and mitigating climate change lies in effective green transition governance. This study, based on evolutionary game theory, constructs a game model involving three subjects: heavily polluting enterprises, the government, and environmental information disclosure regulatory authorities, aiming to analyze the clean production decision-making mechanism under multi-subject interaction. It empirically examines the relationship among the three by combining panel data of listed companies in heavily polluting industries on China’s A-share market. The research findings indicate the following: (1) Excessively high environmental technology upgrade and information disclosure costs will hinder enterprises’ clean production. (2) The intensity of regulation is influenced by the government’s benefits and costs. (3) Effective environmental policies require multi-dimensional coordination. (4) Environmental regulations can effectively enhance enterprises’ environmental performance, and by improving the transparency and quality of environmental information disclosure, significantly improve their environmental performance.

1. Introduction

Against the backdrop of intensifying global climate change, the Chinese government has been constantly improving its environmental governance system. The 20th National Congress of the Communist Party of China incorporated “coordinating carbon reduction, pollution control, green transformation and economic growth” into the overall layout of ecological civilization construction. The “Regulations on the Disclosure of Environmental Information by Enterprises” promulgated by the Ministry of Ecology and Environment in 2022 marks the establishment of a comprehensive mandatory information disclosure system. The government work report of the Two Sessions pointed out that by 2025, China will “accelerate the building of a green and low-carbon economy” and “form a green and low-carbon mode of production”. Meanwhile, the EU has set an ambitious goal of achieving carbon neutrality by 2050 through the “European Green Deal”, established a multi-level policy framework, and emphasized a systematic green transformation. In the United States, beyond the federal level, a multi-level, market-driven emission reduction system has been formed, represented by the Regional Greenhouse Gas Initiative (RGGI) and the Chicago Climate Exchange. Existing research on promoting clean production in heavily polluting enterprises has accumulated rich knowledge around various external driving factors. Specifically, these can be sorted from core dimensions such as regulation [1,2], green finance [3,4], and digital technology [5,6]. At the regulatory level, there are both direct constraints from command-and-control policies and indirect guidance from market-based mechanisms. For instance, Gao et al. (2024) found that there is a “political resource curse” effect among heavily polluting enterprises with political connections in China, and environmental regulation can alleviate the suppression of enterprise innovation by strengthening market competition and curbing excessive investment [7]. The empirical analysis by Xu et al. (2025) on heavily polluting enterprises in China’s A-share market from 2012 to 2021 indicates that flawed environmental subsidy designs can suppress green innovation, but stricter environmental law enforcement can reverse this impact [8]; Wang et al. (2024) further confirmed that enhancing environmental regulatory standards can significantly boost enterprises’ R&D investment and promote green transformation through technology absorption and emission reduction [9]. In terms of the application of market-oriented tools, the roles of the carbon market and green finance policies show differentiated characteristics: Gan et al. (2024) proposed that the carbon market, as a market-based environmental tool, can achieve a coordinated reduction in pollution and carbon emissions by optimizing the energy structure and deploying green technologies [10], and Zhang et al. (2024) found through the comparison of policy tools that Market-based carbon policies outperform command-based methods in tolerating data errors, suppressing fraud, controlling total emissions and enhancing social welfare [11]; However, green finance policies have an industry asymmetry impact. Xiao et al. (2024) adopted the method of differences among differences to reveal how green finance policies promote clean production by enhancing energy efficiency and reducing emission intensity [12]. Gong et al. (2024) pointed out that although such policies can promote the transformation of non-heavily polluting enterprises by enhancing their financing capabilities, due to the failure to address financing constraints, they inhibit the transformation of heavily polluting enterprises, resulting in an inter-industry spillover effect that is beneficial to non-heavily polluting enterprises but detrimental to heavily polluting ones [13]. In terms of digital technology empowerment, industrial intelligent technology has become a key driving force for clean production. Relevant research [14,15,16,17] indicates that under regulatory pressure, industrial intelligent technology can reduce the cost of clean production and optimize end-of-pipe treatment through real-time data feedback and dynamic process optimization. Xu et al. (2023) also confirmed that they could drive green transformation through technology spillover and resource optimization [18]. However, Zhang et al. (2025) observed the contradiction of “environmental benefit deficiency” in digital transformation—although it could significantly improve the financial performance of enterprises by enhancing the efficiency of resource allocation, it did not generate obvious environmental benefits [19].
From the perspective of traditional functions, government supervision has always been the primary external pressure compelling enterprises to carry out clean production. Specifically, it encompasses two core mechanisms: The first is the command-and-control type of environmental regulation, which directly restricts enterprises’ pollutant discharge behavior by formulating clear pollution discharge standards, production technology requirements and other hard rules. If enterprises fail to meet the standards, they will face penalties such as fines and production suspension. The second type is market-incentivized environmental regulations such as environmental taxes and pollution discharge fees. By internalizing environmental costs, they guide enterprises to proactively reduce pollution emissions to lower costs. However, there has always been controversy in the academic circle over the effectiveness of government supervision: One view holds that strict supervision would impose a heavy cost burden on enterprises, such as the large amount of capital investment required for purchasing pollution control equipment and adjusting production processes, squeezing research and development and production funds, and significantly affecting the profit margins of heavily polluting enterprises due to environmental protection investment, leading to increased operational pressure. The other side of the view puts forward the “Porter Hypothesis”, which holds that reasonable regulatory pressure can force enterprises to innovate. For instance, by developing cleaner production technologies and optimizing energy utilization methods, they can form new competitive advantages while meeting environmental protection requirements, ultimately achieving a “win-win situation for environmental protection and benefits”.
In the innovation of regulatory tools, the environmental information disclosure system (EID), as an important tool combining marketization and public participation, has gradually drawn attention to its mechanism of action and practical predicaments. The core value of EID lies in enhancing the transparency of enterprises’ environmental behaviors by requiring them to disclose information such as environmental pollutant discharge data, pollution control measures, and environmental protection investments. On the one hand, transparent information enables enterprises to be under multiple supervision from the public and stakeholders—investors can assess enterprise risks and adjust investment decisions based on environmental information. Consumers tend to choose products with better environmental performance, creating market pressure. The media can strengthen social supervision by exposing environmental violation information. On the other hand, this multi-dimensional supervision can provide enterprises with incentives to improve their environmental performance and encourage them to proactively optimize their clean production processes. However, in terms of the Chinese market, the implementation effect of EID is still limited by the actual conditions: The quality of information disclosure in most heavily polluting enterprises is generally low, with problems such as inaccurate data and incomplete content. Moreover, the disclosure behavior is mostly voluntary in nature and lacks mandatory constraints, which leads to the actual promoting effect of EID on the clean production of enterprises not being fully exerted. Its effectiveness still needs more empirical research for verification.
Although existing research has covered the impact of single dimensions such as regulation, green finance, and digital technology on the clean production of heavily polluting enterprises, there are still two key deficiencies: (1) The comprehensive pressures faced by enterprises have not been fully integrated and analyzed. In actual operation, heavily polluting enterprises often simultaneously bear policy pressure from regulatory authorities, market pressure from consumers, and financial pressure from investors. However, existing research mostly focuses on a single source of pressure and fails to clearly explain the synergistic or conflicting impact of the superposition of multiple pressures on enterprises’ clean production decisions. (2) There is insufficient exploration of the interaction among multiple stakeholders, especially a lack of in-depth discussion on the core issue of “under what conditions can these interactions go beyond the scope of simple supervision and transition to a collaborative model guided by regulatory authorities, participated by consumers, and supported by investors”. Based on this, this study raises the core research question: From a multi-regulatory perspective, how do the multiple external pressures faced by heavily polluting enterprises interact with each other, and under what conditions can they drive stakeholders to shift from “supervision” to “collaborative cooperation”, ultimately promoting clean production and green transformation of enterprises? While existing studies have focused on individual regulatory mechanisms, critical gaps remain, specifically in two aspects: (1)They fail to fully integrate and analyze the comprehensive pressures faced by enterprises. Enterprises often confront pressures from three parties—regulatory authorities, consumers, and investors—simultaneously, yet existing studies have not clearly elaborated on how enterprises are actually affected by such multiple pressures. (2) Current exploration into the interactions among multiple stakeholders (i.e., regulatory authorities, consumers, investors, etc.) remains insufficient. In particular, there is a lack of in-depth research on the core question of “under what conditions these interactions can move beyond the scope of mere supervision and transition to genuine cooperation.” This study therefore investigates the cleaner production and green transformation of heavy-polluting enterprises through a multi-regulatory lens. Marginal contributions of this work include: First, we transcend traditional enterprise-government dyads by incorporating third-party environmental disclosure regulators into an evolutionary game framework, revealing strategic interaction mechanisms under multi-stakeholder governance. Second, we pioneer a dual-verification methodology combining evolutionary game theory with econometric regression, establishing a closed-loop analysis of policy transmission mechanisms and implementation efficacy.

2. Construction and Simulation of Evolutionary Game Model

Some scholars analyze the selection of clean production strategies for heavily polluting enterprises through evolutionary game models. Wang Lijuan et al. (2024) constructed a dynamic game model between the government and heavily polluting enterprises and found that strengthening environmental regulations can significantly drive the green and innovative development of enterprises [20]. Xu, R et al. (2019) discovered through the tripartite evolutionary game model of the government, environmental service companies and polluting enterprises that the “public–private partnership” model is the key to environmental governance [21]. Pan Feng et al. (2023) found through a tripartite environmental regulation evolution game model involving the central government, local governments and enterprises that environmental protection policies introducing public participation (such as reporting reward mechanisms) can effectively promote the improvement of pollution control effects, accelerate the realization of systematic balance and enhance governance efficiency [22]. To sum up, although the tripartite evolutionary game model in the existing studies covers the interactions among the government, enterprises and the public [23,24,25], its game subjects are limited to the one-way transmission of government regulatory pressure and enterprises’ passive responses, and environmental information disclosure is only regarded as an exogenous parameter or static compliance indicator. The closed-loop mechanism of “dynamic adjustment of environmental regulations—optimization of enterprise information disclosure strategies—feedback on clean production performance” has not been formed.
This paper constructs a tripartite game model among enterprises, the government and environmental information disclosure regulatory authorities. Taking the production mode selection of heavily polluting enterprises as the entry point, it analyzes the dynamic game relationship among the three parties under multiple factors such as environmental synergy benefits, cooperative transaction costs, regulatory incentives and information disclosure. Under the framework of collaborative governance, enterprises, as the main producers, their choice of production mode directly affects the coordination of the upstream ecosystem. The environmental information disclosure regulatory department is responsible for supervising the timeliness and quality of enterprises’ information disclosure. The government departments supervise and verify the production models of enterprises, encourage enterprises to choose production methods with low environmental damage and punish enterprises with serious pollution. The two departments build a dual regulatory network covering production behavior and information disclosure through information sharing and functional complementarity. The evolution mechanism of the three parties is shown in Figure 1a. Figure 1b presents the process: After the government formulates regulatory strategies, enterprises make production (clean/traditional) and information disclosure (true/false) decisions. The environmental department checks the authenticity of the information. If it is true, the enterprise will receive government incentives; if it is false, it will be punished by the government. Then, the benefits are calculated and the strategies are updated to form a cycle.

2.1. Model Assumptions

Before constructing the three-party game model between the government, heavy-polluting enterprises, and environmental information disclosure regulatory authorities, we made the following assumptions and provided detailed descriptions of the variables involved in the model, as shown in Table 1 below.
Assumption 1.
The three participants in the evolutionary game are the heavy-polluting enterprises (A), the environmental information disclosure regulatory authorities (B), and the local government (C). All three are rational individuals with limited capabilities. The strategic choice space for the heavy-polluting enterprises is (clean production, non-clean production). The strategic choice space for the environmental information disclosure regulatory authorities is (legal regulation, non-legal regulation), and the strategic choice space for the local government is (strict regulation, loose regulation).
Assumption 2.
The probability that the heavy pollution enterprises choose clean production is x, and the probability of choosing non-clean production is 1 - x The probability that the environmental information disclosure regulatory authorities choose legal regulation is y, and the probability of choosing non-legal regulation is 1 - y . The probability that the local government chooses strict regulation is z, and the probability of choosing loose regulation is 1 - z .

2.2. Dynamic Game Analysis

In the game layer, the income matrix combining the government, heavily polluting enterprise groups, and the public was constructed (Table 2).

2.2.1. Replicate the Construction of Dynamic Equations

  • Heavily Polluting Enterprises
Based on the revenue matrix in Table 2, the expected revenue of clean production for heavily polluting enterprises is E 11 , as shown in Formula (1) [26].
E 11 = y z ( e c i   +   φ h c e   +   s )   +   y ( 1 z ) ( e c i   +   φ h c e )   +   z ( 1 y ) ( e c i c e   +   s )   +   ( 1 y ) ( 1 z ) ( e c i c e )
The expected return for heavily polluting enterprises choosing non-clean production is E 12 , as shown in Formula (2) [26].
E 12 = y z e φ t d φ l t g t e   +   y 1 z e φ t d φ l   +   z 1 y ( e t g t e )   +   ( 1 y ) ( 1 z ) e
The average expected revenue of heavily polluting enterprises is E 1 , as shown in Formula (3) [26].
E 1 = x E 11   +   ( 1 x ) E 12
The replication dynamic equation (the replication dynamic equation is actually a dynamic differential equation that describes the frequency of a particular strategy adopted by a species in a population [27] is as shown in Equation (4).
F ( x ) = d x d t = x ( E 11 E 1 ) = x ( x 1 ) ( z ( s   +   t e   +   t g ) ( c i   +   c e )   +   φ y ( l   +   h   +   t d ) )
  • Environmental Regulatory Authorities
The expected revenue from the supervision of the environmental information regulatory department in accordance with the law is E 21 , as shown in Formula (5) [26].
E 21 = x z c d   +   e d y   +   x 1 z c d   +   z 1 x φ t d c d   +   e d y   +   ( 1 x ) ( 1 z ) ( φ t d c d )
The expected returns from illegal supervision by environmental information regulatory authorities are E 22 , as shown in Formula (6) [26].
E 22 = x z ( e d n )   +   z ( 1 x ) ( e d n )
The expected revenue of the environmental information regulatory department is E 2 , as shown in Formula (7) [26].
E 2 = y E 21   +   ( 1 y ) E 22
The replication dynamic equation of the policy selection of the environmental information disclosure regulatory authority is shown in Equation (8) [27].
F ( y ) = dy dt = y ( E 21 E 2 ) = - y ( y - 1 ) ( φ t d ( 1 - x ) - c d   +   z ( e dn   +   e dy ) )
  • Government
The expected return under strict government regulation is E 31 , as shown in Formula (9) [26].
E 31 = x y b g c g e c g d s   +   d g   +   x 1 y b g c g e c g d s d l   +   y 1 x t g   +   t e c g e c g d b l   +   d g   +   ( 1 x ) ( 1 y ) ( t g   +   t e c g e c g d b l d l )
The expected benefit of the government’s lenient regulation is E 32 , as shown in Formula (10) [26].
E 32 = x y b g   +   d g   +   x 1 y b g d l   +   y 1 x d g b l   +   ( 1 x ) ( 1 y ) ( d l b l )
The expected revenue of the government is E 3 , as shown in Formula (11) [26].
E 3 = z E 31   +   ( 1 z ) E 32
The replication dynamic equation for government policy selection is shown in Equation (12) [27].
F ( z ) = dz dt = z ( E 31 E 3 ) = z ( z 1 ) ( c g d   +   c g e ( t e   +   t g )   +   x ( s   +   t e   +   t g ) )

2.2.2. Strategy Stability Analysis

According to the stability theorem of the dynamic equation of replication, for a single game player to be in a stable state, two conditions must be met. (1) Copy the dynamic equation to 0. (2) Copy the first derivative of the dynamic equation to be less than 0. The stability analysis of the three game players is shown in Table 3.
  • Heavily Polluting Enterprises
In order to analyze the equilibrium conditions for a government subject to achieve a stable strategy from the perspective of a single game subject, the following analysis is conducted. Let F ( x ) = 0 find the stability of the strategies chosen by heavily polluting enterprises. Since the positive and negative values of z ( s   +   t e   +   t g ) ( c i   +   c e )   +   φ y ( l   +   h   +   t d ) are uncertain, the following discussion is held:
When ( z ( s   +   t e   +   t g ) ( c i   +   c e )   +   φ y ( l   +   h   +   t d ) ) = 0 , suppose y = ( c i   +   c e ) - z ( s   +   t e   +   t g ) φ ( l   +   h   +   t d ) ) , the following was true:
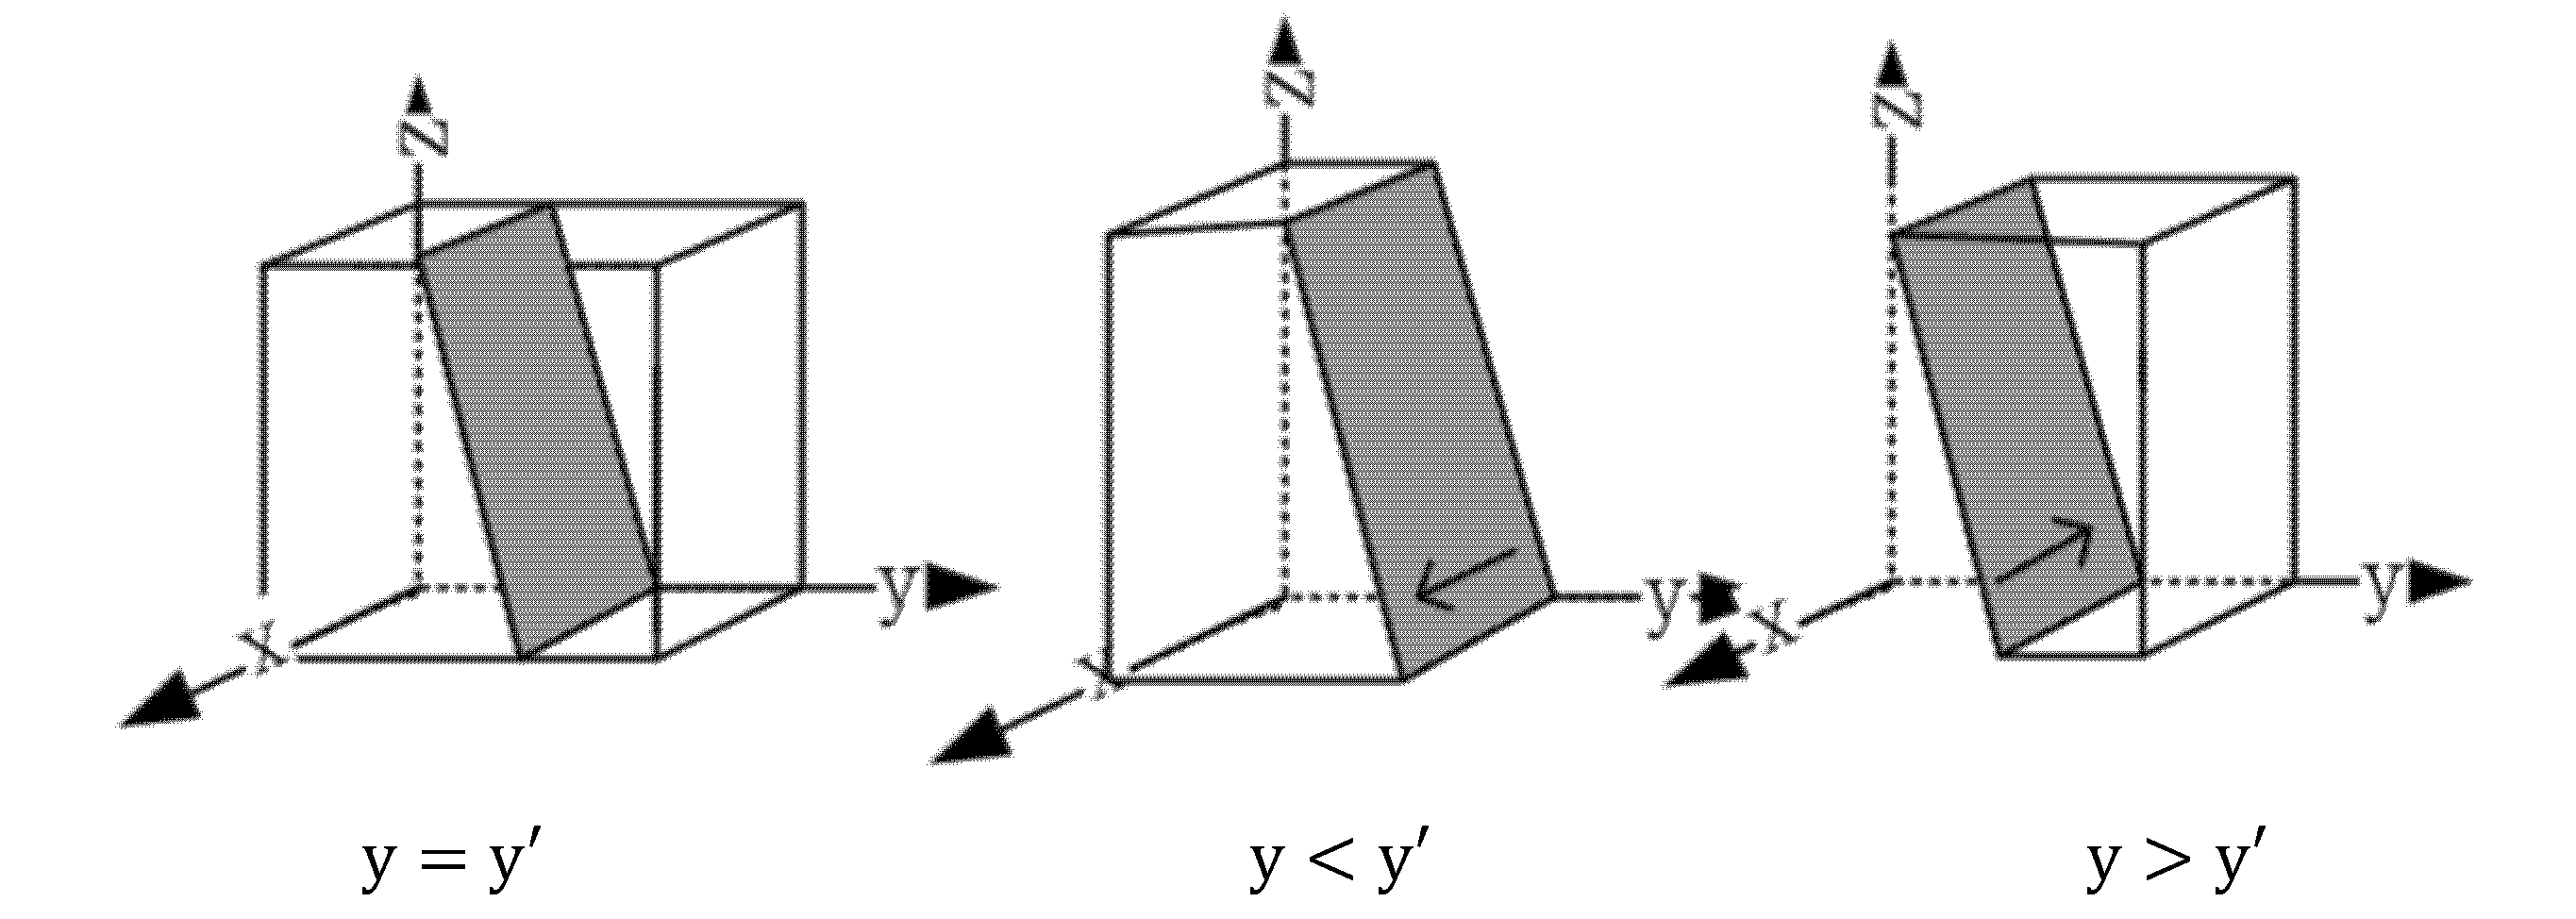
When y = y ′, then F ( x ) = 0 , and thus all x are in an evolutionary steady state, that is, the ratio does not change over time regardless of the initial ratio of “cleaner production” and “non-cleaner production” chosen by heavy polluting enterprises.
When y     y , letting F ( x ) = 0 , we can obtain two possible evolutionary stability points as x = 0 , x = 1 .
When y   <   y , x = 1 is the evolutionary and stable strategy of heavy polluting enterprises.
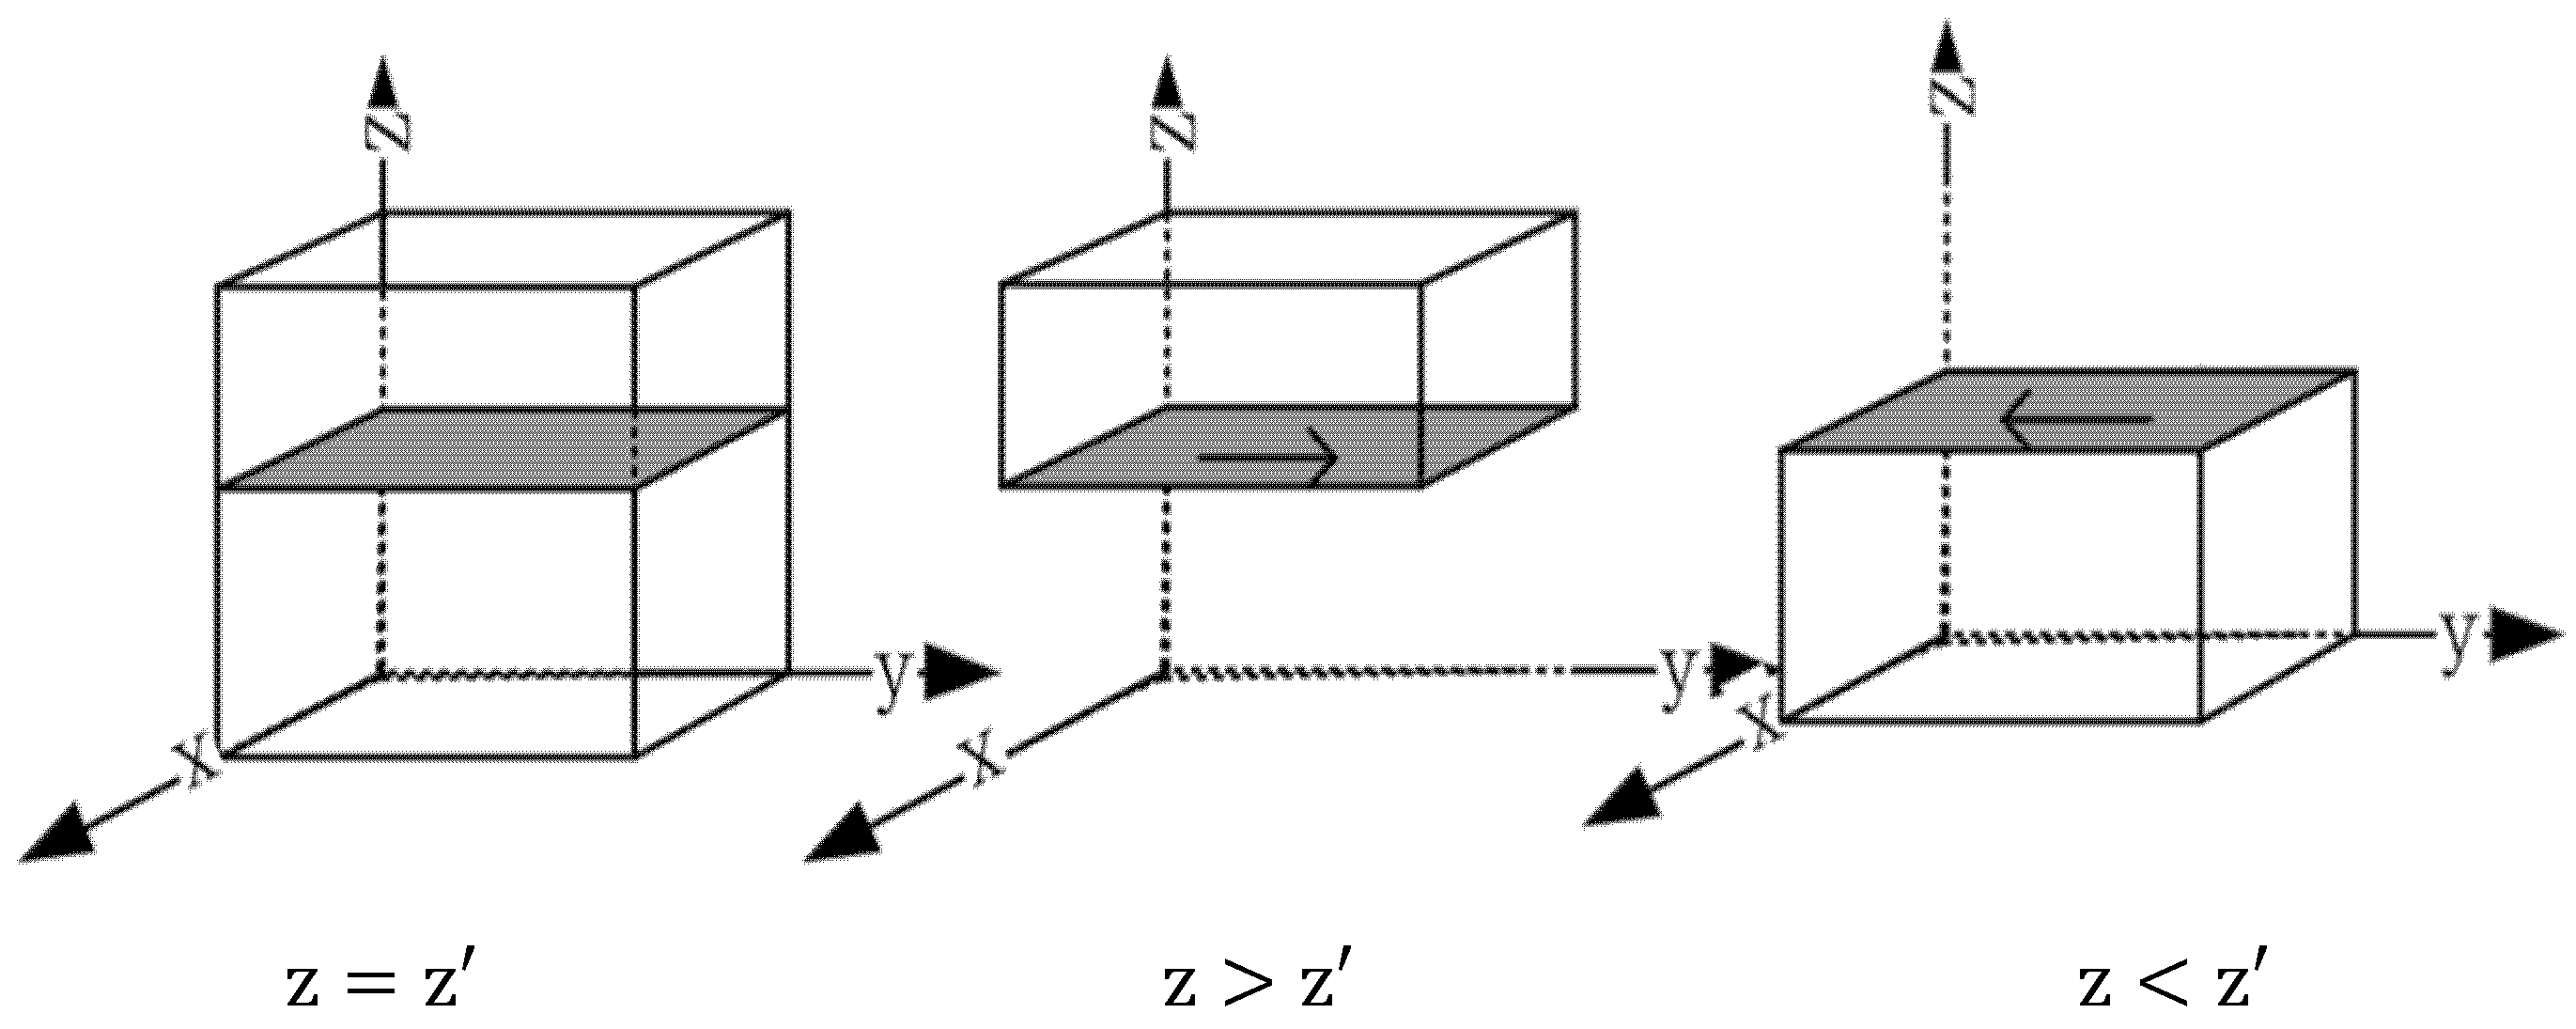
When y   >   y , x = 0 is the evolutionary and stable strategy of heavy polluting enterprises. To present the above conclusion more intuitively, this paper draws the strategy evolution trend chart of heavily polluting enterprises as shown in Figure 2.
  • Environmental Regulatory Authorities
To analyze the equilibrium conditions required for the government to implement a stability strategy from the perspective of a single game player, we conduct the following research. Let F(y) = 0 to determine the stability of the selected strategy for environmental information supervision. Due to the uncertainty of the positive and negative values of ( φ t d ( 1 x ) c d   +   z ( e dn   +   e dy ) ) , the following discussion is carried out:
When ( φ t d ( 1 x ) c d   +   z ( e dn   +   e dy ) ) = 0 , suppose z = c d - φ t d ( 1 - x ) e dn   +   e dy , the following was true:
When z = z F ( y ) = 0 , it means all y values remain in evolutionary stability.
When z     z , letting F ( y ) = 0 , we can obtain two possible evolutionary stability points as y = 0 , y = 1 .
When z   <   z , y = 0 is the evolution and stability strategy of the environmental information disclosure regulatory authorities.
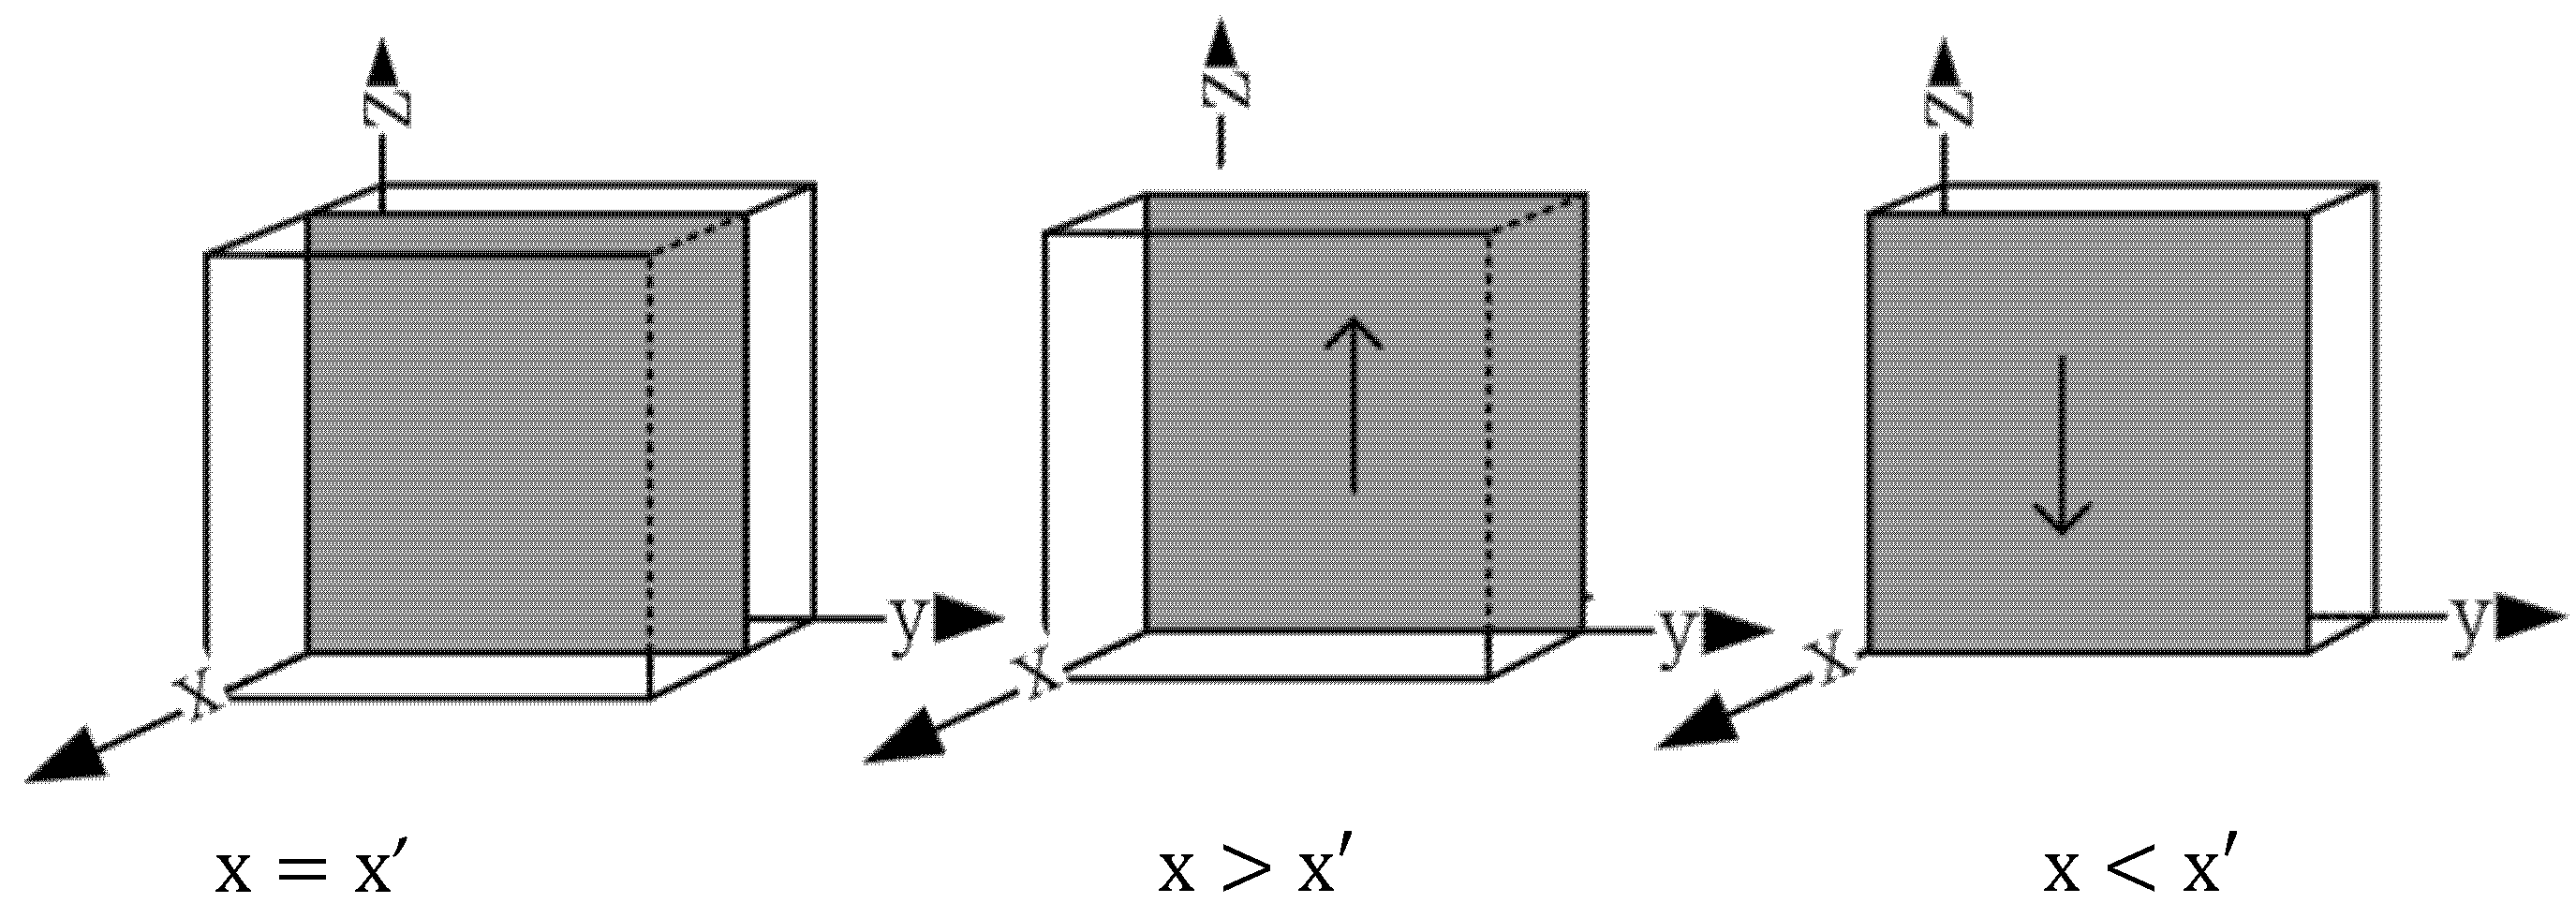
When z   >   z , y = 1 is the evolution and stability strategy of the environmental information disclosure regulatory authorities. To present the above conclusion more intuitively, this paper draws the strategy evolution trend chart of environmental information regulatory authorities as shown in Figure 3.
  • Government
To analyze the equilibrium conditions required for the government to implement a stability strategy from the perspective of a single game player, we conduct the following research. Let F(z)=0 to determine the stability of the strategy chosen by the government. Due to the uncertainty of the positive and negative values of ( c g d   +   c g e - ( t e   +   t g )   +   x ( s   +   t e   +   t g ) ) , the following discussion is carried out:
When ( c g d   +   c g e - ( t e   +   t g )   +   x ( s   +   t e   +   t g ) ) =0, suppose x = ( t e   +   t g ) - ( c gd   +   c ge ) ( s   +   t e   +   t g ) , the following was true:
When x = x ߰, F(z) = 0, so all x are in an evolutionarily stable state
When x     x ’, letting F ( z ) = 0 , two possible evolutionary stability points can be obtained as x = 0 , x = 1 .
When x   <   x , z = 0 is the evolutionary and stable strategy of heavy polluting enterprises.
When x   >   x , z = 1 is the evolutionary and stable strategy of heavy polluting enterprises. To present the above conclusion more intuitively, this paper draws a government strategy evolution trend chart as shown in Figure 4.

2.2.3. Stability Analysis of Equilibrium Points

Construct a replication dynamic system according to Equations (4), (9) and (12),
F ( x ) = x ( x - 1 ) ( z ( s   +   t e   +   t g ) - ( c i   +   c e )   +   φ y ( l   +   h   +   t d ) ) F ( y ) = y ( y - 1 ) ( φ t d ( 1 - x ) - c d   +   z ( e dn   +   e dy ) ) F ( z ) = z ( z - 1 ) ( c gd   +   c ge - ( t e   +   t g )   +   x ( s   +   t e   +   t g ) )
This allows F ( x ) = 0 , F ( y ) = 0 , F ( z ) = 0 to obtain that there are 8 pure strategic Nash equilibrium points in the game process of heavy polluting enterprises, environmental information disclosure regulatory authorities and governments, namely (0,0,0), (0,0,1), (0,1,0), (1,0,0), (1,1,0), (1,0,1), (0,1,1), (1,1,1). Therefore, this section will draw on existing studies to solve the eigenvalues by constructing the Jacobian matrix to judge the asymptotic stability of the equilibrium point. The Jacobian matrix looks like this:
J = F ( x ) / x F ( x ) / y F ( x ) / z F ( y ) / x F ( y ) / y F ( y ) / z F ( z ) / x F ( z ) / y F ( z ) / z = J 11 J 12 J 13 J 21 J 22 J 23 J 31 J 32 J 33
Calculated:
J 11 = ( 1 - 2 x ) ( z ( s   +   t e   +   t g ) - c i - c e   +   φ y ( l + h   +   t d ) )
J 12 = - x ( x - 1 ) φ ( l   +   h   +   t d )
J 13 = - x ( x - 1 ) ( s   +   t e   +   t g )
J 21 = y ( y - 1 ) φ t d
J 22 = ( 1 - 2 y ) ( φ t d ( 1 - x ) - c d   +   z ( e dn   +   e dy ) )
J 23 = - y ( y - 1 ) ( e dn   +   e dy )
J 31 = z ( z - 1 ) ( s   +   t e   +   t g )
J 32 = 0
J 33 = ( 2 z - 1 ) ( c gd   +   c ge - ( t e   +   t g )   +   x ( s   +   t e   +   t g ) )
According to Lyapunov’s first method, when the eigenvalues are negative, the equilibrium point is the stable point; when the eigenvalues are positive, the equilibrium point is the unstable point; when the eigenvalue is positive and negative, it is the saddle point. Table 4 presents the stability analysis of eight equilibrium points.
According to the analysis of the asymptotic stability conditions of the equilibrium point in Table 3, it can be seen that (1, 0, 0), (1, 1, 0), (1, 0, 1), (1, 0, 1) and (1, 1, 1) have positive eigenvalues, so it cannot be an evolutionary stability strategy, and four evolutionary stability points and their conditions are obtained, namely (0, 0, 0), (0, 0, 1), (0, 1, 0), (0, 1, 0), and (0, 1, 1). The stability of these four equilibrium points can be discussed in the following four situations:
Scenario 1: If φ t d   <   c d and ( t e   +   t g )   <   ( c gd   +   c ge ) , only the eigenvalues corresponding to the equilibrium point (0, 0, 0) are negative, so (0, 0, 0) is the evolutionary stability point of the system, and its corresponding evolutionary stability strategy is (non-cleaner production, non-legal supervision, loose supervision). When the environmental information disclosure regulatory department conducts inefficient supervision and the fine imposed by heavy polluting enterprises for failing to disclose environmental information in accordance with regulations is small, and the benefits obtained by the environmental information disclosure regulatory department are less than their regulatory costs, then the environmental information disclosure regulatory department has no motivation to supervise according to law, and will adopt the strategy of non-legal supervision. When the government collects fines less than its cost of verifying enterprises, the government will choose the strategy of loose regulation; when the government is loose supervision and the environmental supervision department is not supervised in accordance with the law, the binding force on the enterprise is reduced, and the enterprise will not be afraid of the penalty received during non-cleaner production, and the enterprise will choose the strategy of non-cleaner production.
Scenario 2: When s   +   t e   +   t g   <   c i   +   c e , φ t d   +   e dn   +   e dy   <   c d , c gd   +   c ge   <   ( t e   +   t g ) , only the eigenvalues corresponding to the equilibrium point (0, 0, 1) are negative, so (0, 0, 1) is the evolutionary stability point of the system, and its corresponding evolutionary stability strategy is (non-cleaner production, non-legal supervision, strict supervision). When the fines imposed on the polluted production of heavy polluting enterprises are verified and the environmental protection tax (pollutant discharge fee) paid by the polluted production of the enterprise is small, the subsidy for the environmental protection
If the production of the enterprise is verified, and the cost of upgrading the technology and equipment of the enterprise’s environmental protection production is higher than the cost of information disclosure by the enterprise according to regulations, then the heavy polluting enterprise will choose the strategy of non-cleaner production. When the income obtained by the regulatory authorities when supervising in accordance with the law and the losses suffered by the regulatory authorities when the regulatory authorities do not supervise in accordance with the law are lower than the supervision costs of the environmental information disclosure regulatory authorities, the environmental regulatory authorities will choose non-legal supervision; When heavy polluting enterprises are not cleaner production and environmental supervision departments are not supervised in accordance with the law, it will not only cause serious environmental pollution, but also seriously damage the general environment of local environmental governance, which is not conducive to the development of local environmental governance, so the local government will tend to increase the fines imposed on enterprises for verifying polluted production and the environmental protection tax (pollutant discharge fee) paid by enterprises for verifying polluted production, so as to promote enterprises to change to cleaner production. At this time the government will choose a stable strategy of strict supervision.
Scenario 3: When φ ( l   +   h   +   t d )   <   c i   +   c e , φ t d   >   c d , ( t e   +   t g )   <   ( c gd   +   c ge ) , only the eigenvalues corresponding to the equilibrium point (0, 1, 0) are negative, so (0, 1, 0) is the evolutionary stability point of the system, and its corresponding evolutionary stability strategy is (non-cleaner production, supervision according to law, loose supervision). At this time, environmental protection subsidies failed to promote the cleaner production of heavy polluting enterprises, but the local government’s rating measures and reward and punishment system for environmental regulatory authorities effectively regulated the behavior of environmental regulatory departments, enabling environmental regulatory authorities to supervise in accordance with the law, thus ensuring that the non-cleaner production of heavy polluting enterprises can be restrained under legal supervision.
Scenario 4: When s   +   t e   +   t g   +   φ ( l   +   h   +   t d )   <   c i   +   c e , φ t d   +   e dn   +   e dy   >   c d , c gd   +   c ge   <   ( t e   +   t g ) , only the eigenvalues corresponding to the equilibrium point (0, 1, 1) are negative, so (0, 1, 1) is the evolutionary stability point of the system, and its corresponding evolutionary stability strategy is (non-cleaner production, supervision according to law, strict supervision). When the fines and negative impact of pollution on non-clean production of heavy polluting enterprises are low, and the cost of upgrading technology and equipment for environmental protection production is higher than the cost of information disclosure by enterprises in accordance with regulations, then heavy polluting enterprises will choose the strategy of non-clean production. However, at this time, the government’s strict supervision of the environmental regulatory authorities ensures that the regulatory authorities supervise heavy polluting enterprises in accordance with the law. Further restraint on heavy polluting enterprises.

2.3. Simulation Analysis

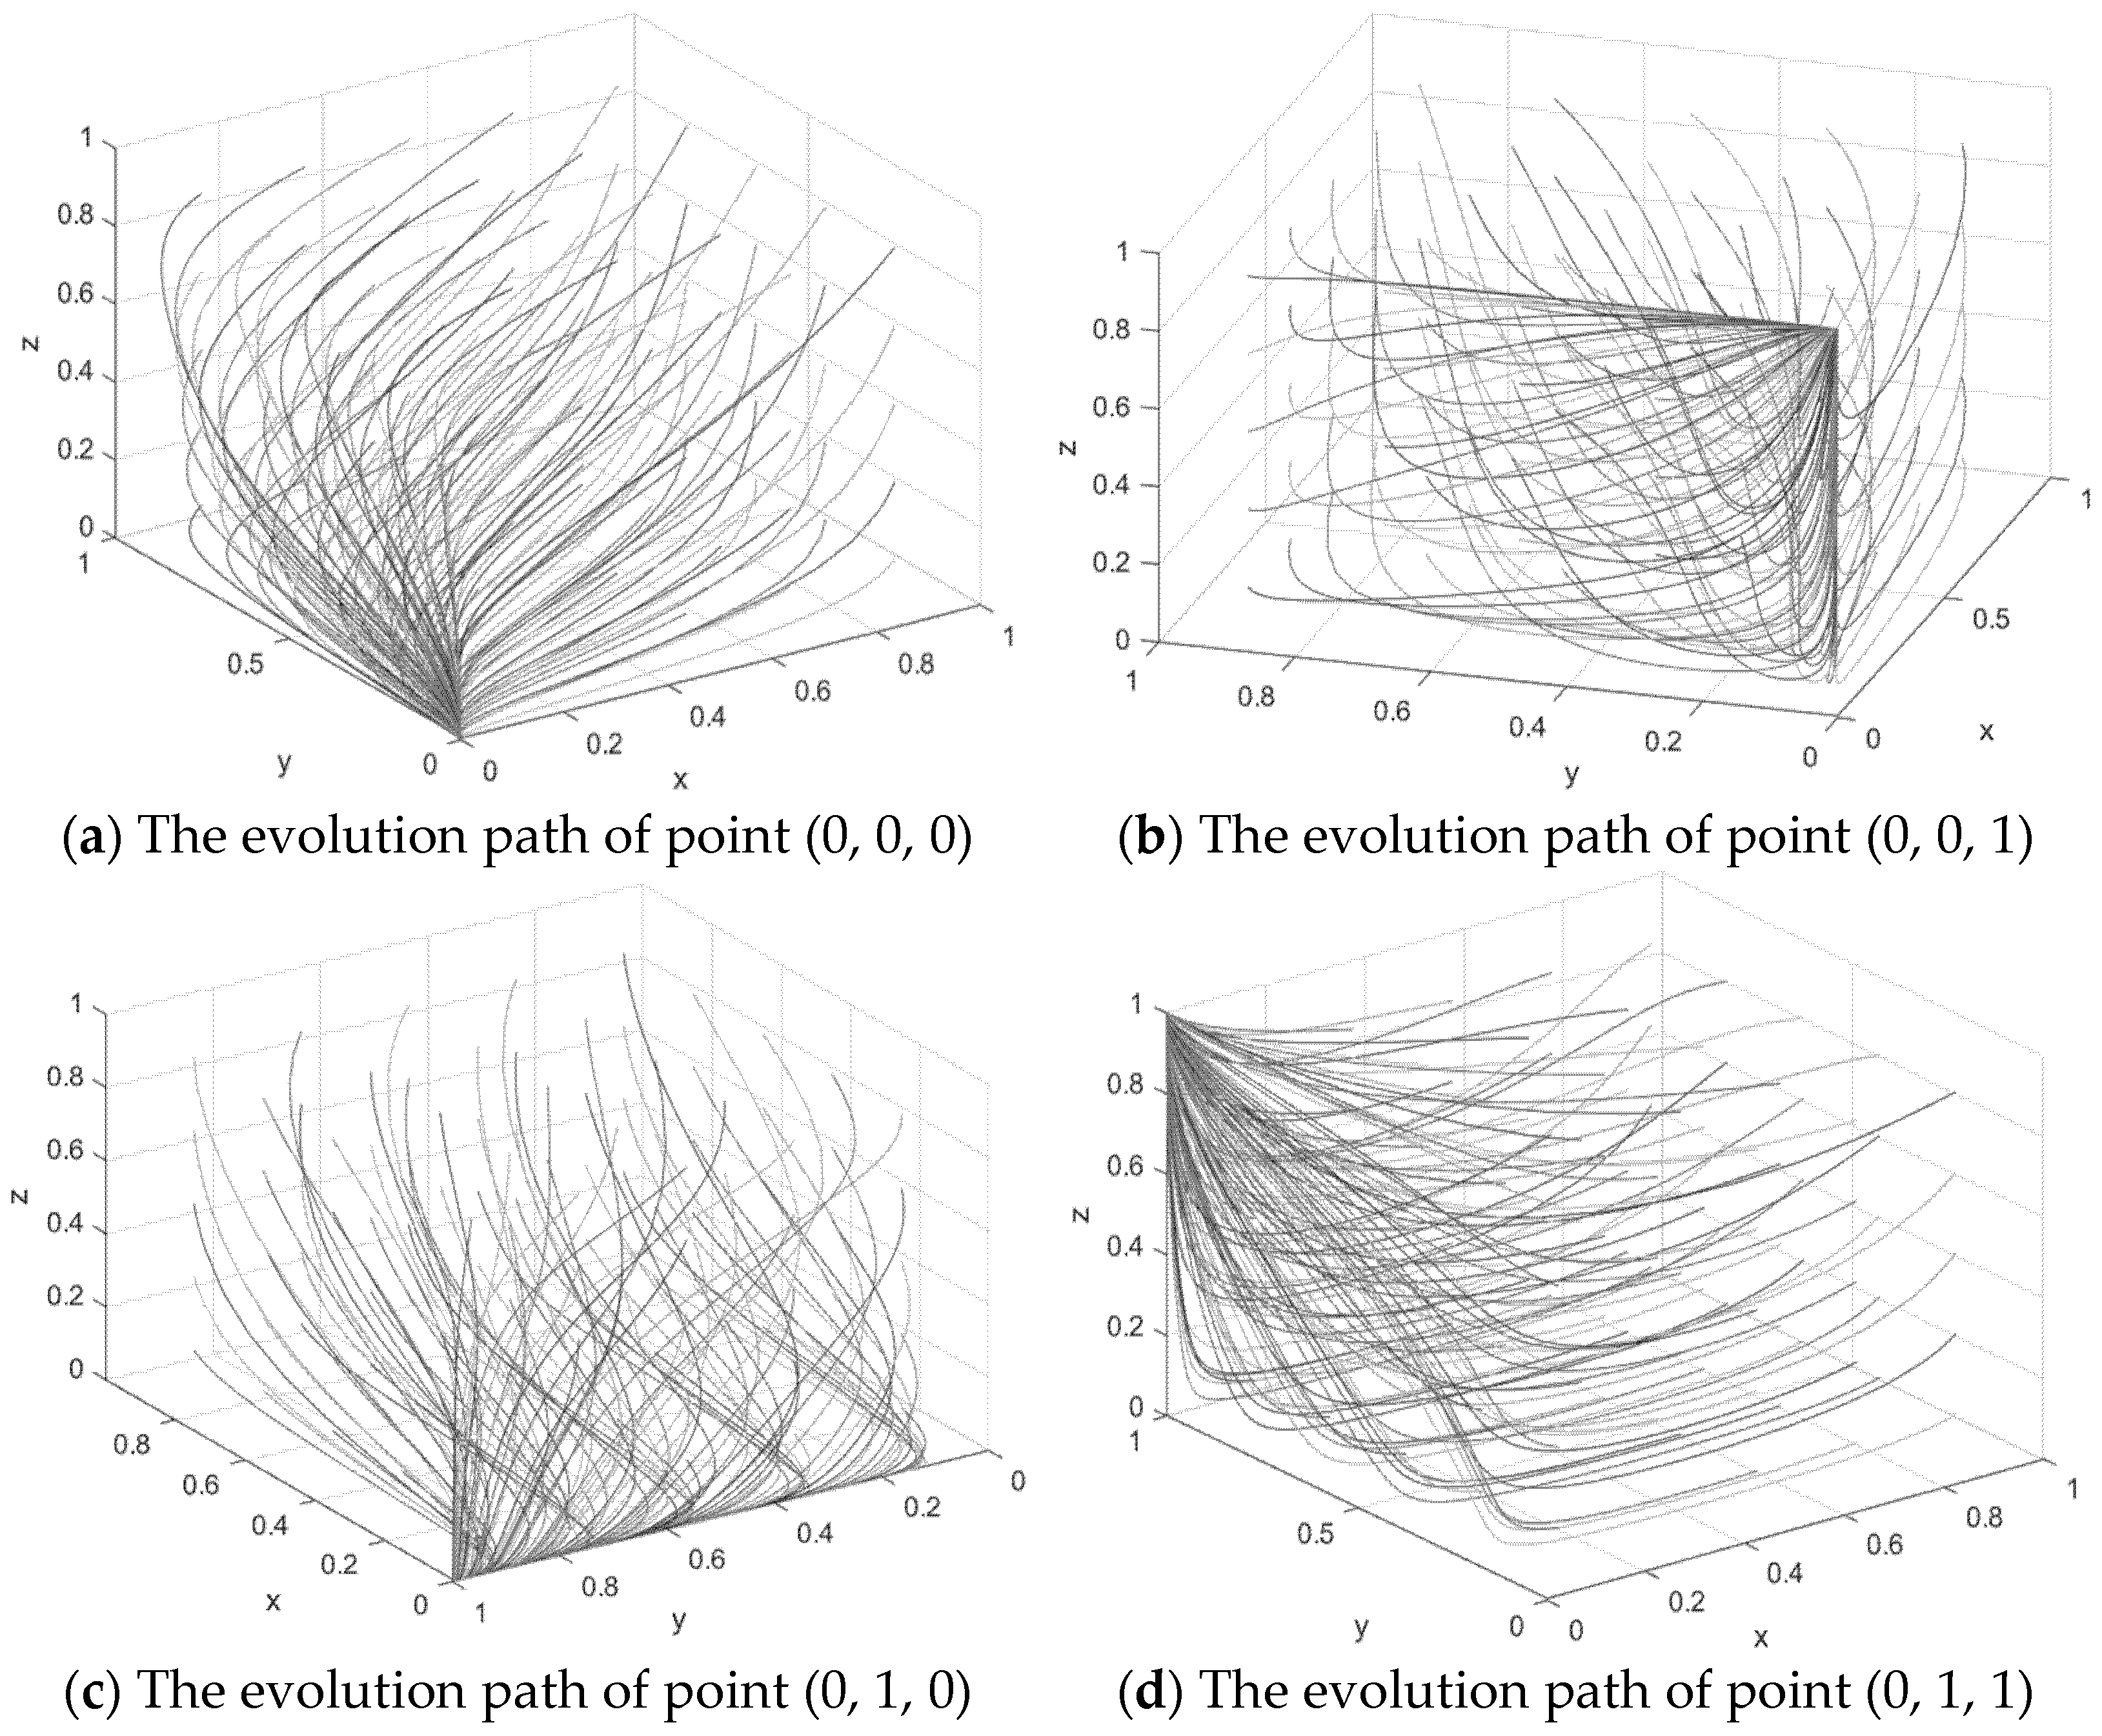
In this section, the four pure policy equilibrium points analyzed earlier were simulated and verified using the R2021a version of Matlab R2023a software, as shown in Figure 5.
The pure strategy equilibrium point (0,0,0) corresponds to Scenario 1: When assuming s = 40 ,   φ = 0.8 , c d = 80 ,   t d = 12 , l = 8 , h = 10 , e d n = 23 , e d y = 55 , t e = 14 , t g = 16 , c g d = 28 , c g e = 32 , c i = 70, c e = 80 , the conditions φ t d   <   c d , ( t e   +   t g )   <   ( c g d   +   c g e ) , are satisfied. This results in a stable state of (0,0,0), indicating “non-compliant production, non-compliant regulation, and lax supervision.” The 50 time-evolved outcomes of different initial strategies are shown in Figure 5a. When φ t d   <   c d , it suggests that environmental information disclosure regulators’ expected benefits from oversight significantly outweigh their regulatory costs, leading them to rationally choose “non-compliant regulation.” Conversely, when ( t e   +   t g )   <   ( c g d   +   c g e ) , it indicates that the combined cost of government-imposed environmental taxes and fines for enterprises falls below the cost of conducting dual inspections by the government itself, resulting in a preference for lax supervision. These new stable states reveal critical flaws in the current policy framework: excessively low penalties coupled with prohibitively high regulatory costs have trapped the system in a “low-level equilibrium” state.
The Pure Strategy Equilibrium point (0, 0, 1) Scenario 2: Given parameters s = 40, s = 40 , φ = 0.8 , c d = 80 , t d = 12 , l = 8 ,   h = 10 , e d n = 12 , e d y = 25 , t e = 28 ,   t g = 32, c g d = 14 , c g e = 16 , c i = 70, c e = 80 , the system satisfies the conditions: s   +   t e   +   t g   <   c i   +   c e , φ t d   +   e d n   +   e d y   <   c d , c g d   +   c g e   <   ( t e   +   t g ) , The stable equilibrium is (0, 0, 1), indicating a scenario of “non-clean production, non-compliant regulation, and strict supervision”. Figure 5b displays 50 time-evolved results across different initial strategies. When s   +   t e   +   t g   <   c i   +   c e , enterprises find that the combined subsidies from eco-friendly production and avoided fines remain below total costs, resulting in insufficient motivation for transformation. When φ t d   +   e d n   +   e d y   <   c d , regulatory authorities ‘expected benefits from oversight fail to cover costs, reducing their supervisory incentives. Finally, when c g d   +   c g e   <   ( t e   +   t g ) , the government’s strict supervision strategy becomes economically viable as the cost of enforcement outweighs potential revenue from penalties. Although the policy system reflected in this stability situation can encourage the government to strictly supervise, it fails to effectively guide the behavior of enterprises and regulatory departments to comply with the law, and the overall governance efficiency is still low.
The pure strategy equilibrium point (0, 1, 0) corresponds to Scenario 3: Given parameters s = 40 , φ = 0.8 , c d = 1 , t d = 12 , l = 8 , h = 10 , e d n = 12 ,   e d y = 25 , t e = 14 ,   t g = 16 , c g d = 28 , c g e = 32 , c i = 70, c e = 80 , the conditions φ ( l   +   h   +   t d )   <   c i   +   c e , φ t d > c d , ( t e   +   t g )   <   ( c g d   +   c g e ) are satisfied. The stable equilibrium is (0, 1, 0), indicating “non-clean production with legal compliance and lenient regulation”. Figure 5c displays 50 time-evolved results from different initial strategies. These findings demonstrate that a rational incentive mechanism can theoretically encourage environmental regulators to enforce compliance. When φ ( l   +   h   +   t d )   <   c i   +   c e , enterprises ‘total benefits from cleaner production remain below their costs, reducing transformation incentives. When φ t d > c d , regulatory authorities’ expected gains (penalty revenue) exceed monitoring costs, incentivizing “legal compliance”. Conversely, when ( t e   +   t g )   <   ( c g d   +   c g e ) , strict government enforcement becomes more costly than penalty revenue, leading to “lenient regulation”. This stabilization scenario enhances regulatory incentives by reducing compliance costs, yet fails to resolve the economic viability of cleaner production in enterprises, highlighting the limitations of policy tool homogeneity.
The pure strategy equilibrium point (0,0,1) corresponds to Scenario 4: Given parameters s = 40 , φ = 0.8 , c d = 1 , t d = 12 , l = 8 , h = 10 , e d n = 12 ,   e d y = 25 , t e = 28 ,   t g = 32 , c g d = 14 , c g e = 16 , c i = 70 , c e = 80 , satisfies the condition: s   +   t e   +   t g   +   φ ( l   +   h   +   t d )   <   c i   +   c e , φ t d   +   e d n   +   e d y > c d , c g d   +   c g e   <   ( t e   +   t g ) . The resulting stable state is (0, 1, 1), indicating “non-cleaner production with strict regulatory enforcement”. The 50 time-evolved results under different initial strategies are illustrated in Figure 5d. When the sum of s   +   t e   +   t g   +   φ ( l   +   h   +   t d )   <   c i   +   c e is less than c i + c e, it indicates that the total benefits from implementing cleaner production remain lower than the total costs, leaving enterprises with insufficient motivation for transformation. When φ t d   +   e d n   +   e d y > c d , it suggests that the expected regulatory benefits (including penalty commissions and reputational gains) surpass the regulatory costs, incentivizing “law-based regulation”. If c g d   +   c g e   <   ( t e   +   t g ) , it demonstrates that the benefits of strict government supervision outweigh the costs, motivating authorities to enhance oversight. These equilibrium conditions reveal that optimizing regulatory costs enhances enforcement incentives for governments and regulators, yet fail to resolve the fundamental issue of economic viability in corporate cleaner production.
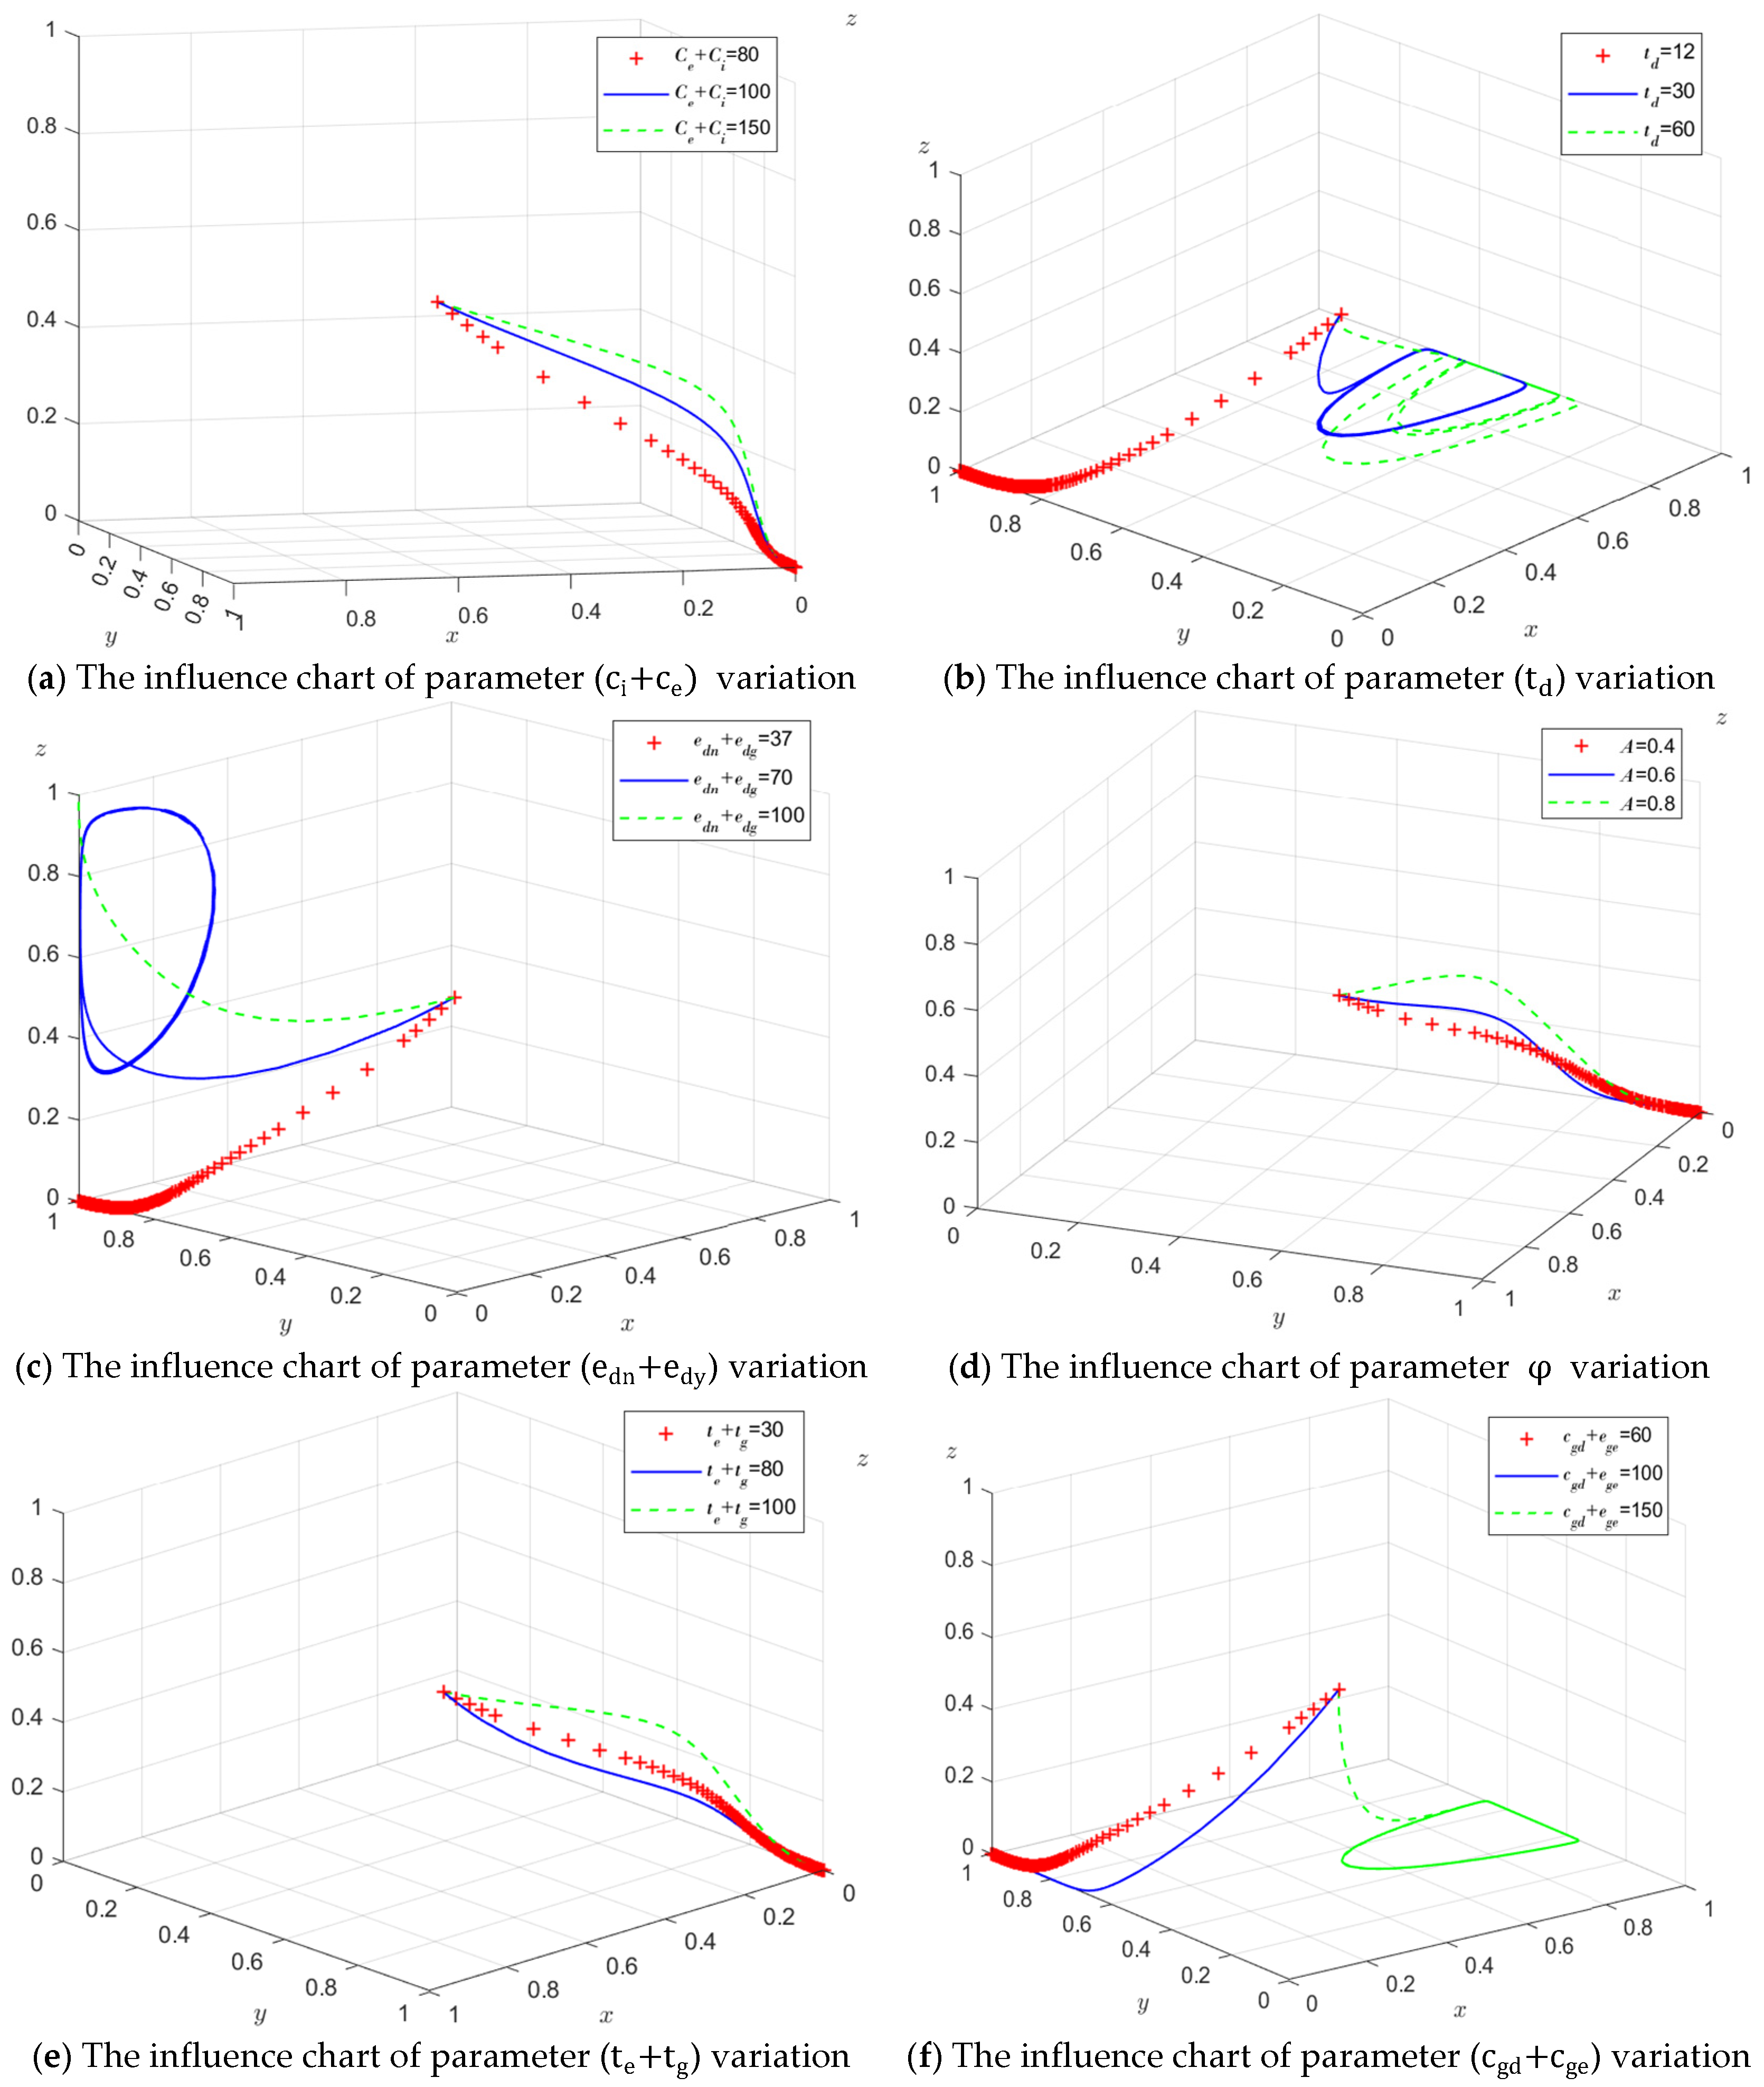
In conclusion, the steady-state equilibrium behavior of each participating entity is determined by the costs and benefits of each participant. However, different values of parameters will have different influences on the convergence speed. Therefore, based on the relevant conditions in Situation 3, analyze the impact of the enterprise’s clean production cost ( c i   +   c e ), environmental information disclosure violation fines ( t d ), the expected benefits of the regulatory authorities’ supervision in accordance with the law ( e dn   +   e dy ), the efficiency of the regulatory authorities’ supervision ( φ ), the pollution production fines and environmental protection taxes paid by heavily polluting enterprises ( t e   +   t g ), and the government’s verification cost ( c gd   +   c ge ) on the evolutionary game process and results. The specific results are shown in Figure 6.
From the analysis of the evolution trajectory in Figure 6, it can be seen that the values of each key parameter in the system will significantly affect the evolution path and convergence speed of the strategies of the government, heavily polluting enterprises, and environmental information regulatory departments. The specific impacts are shown in Table 5.

3. Empirical Analysis

3.1. Theoretical Hypotheses

Environmental regulations are a key measure to promote clean production in heavily polluting enterprises and a crucial approach to achieving their green transformation. In terms of the impact of environmental regulations on the clean environment performance of heavily polluting enterprises, the specific analysis is as follows: Strict command-and-control environmental regulations directly force enterprises to increase investment in environmental protection facilities and upgrade pollution control technologies by raising the environmental governance costs and compliance pressure of enterprises, thereby enhancing performance in the dimensions of environmental treatment (ET) and environmental governance performance (EG). Meanwhile, market-incentivized environmental regulations guide enterprises to internalize environmental costs through economic means, encouraging them to optimize production processes through green technological innovation, reduce pollutant emissions, enhance resource utilization efficiency, and thereby improve environmental management capabilities (EM) and overall environmental performance. Liu, H (2024) et al. found that environmental regulations can significantly improve the environmental performance of heavily polluting enterprises [28]. Researchers Deng, X et al. (2020) analyzed the data of Chinese listed companies from 2008 to 2018 [29]. The results showed that government environmental regulations could significantly improve the environmental performance (CEP) of enterprises [29]. Based on this, this paper proposes Hypothesis 1:
H1. 
Environmental regulations have a significant positive impact on enterprises’ clean environmental performance.
In the analysis of the transmission mechanism based on environmental information disclosure, environmental regulations act on enterprises’ clean environmental performance through mandatory disclosure requirements: As a command-and-control type of environmental regulation, the mandatory environmental information disclosure system implemented by the government first places enterprises’ environmental behaviors under government supervision and public oversight by setting clear disclosure obligations, thus creating external pressure. This pressure prompts enterprises to proactively adjust their internal strategies in order to maintain their legitimacy and reputation, thereby transforming external regulatory pressure into the driving force for internal resource reconstruction. Furthermore, high-quality environmental information disclosure behavior itself will convey a positive “green” signal to the market, which helps enterprises win the favor of green investors, alleviate financing constraints, enhance brand image, and ultimately form a virtuous cycle through market incentive mechanisms. It also promotes the overall improvement of enterprises’ clean environmental performance in dimensions such as environmental treatment (ET), environmental management capacity (EM), and environmental governance performance (EG). Qing L. (2022) et al.‘s research confirmed that environmental information disclosure has a significant positive impact on the environmental performance of Chinese enterprises [30]. The research results of researchers such as Ren S show that although mandatory environmental information disclosure can improve the environmental performance of enterprises by increasing environmental management activities and costs, it will have a long-term positive impact on the economic performance of enterprises. Researchers Ye Y (2023) et al. analyzed the data of A-share listed companies in China [31]. The results showed that this environmental regulation policy could significantly improve the environmental performance of enterprises [31].
Based on this, this paper proposes Hypothesis:
H2. 
The intensity of environmental regulations further positively affects the clean environmental performance of significant enterprises by influencing environmental information disclosure.

3.2. Sample Selection and Data Source

Based on the “Catalogue of Industry Classification Management for Environmental Protection Verification of Listed Companies” issued by the Ministry of Ecology and Environment, this study selected 570 heavily polluting listed companies from 2014 to 2022 as research objects by matching annual report information, covering 16 highly polluting industries such as thermal power, steel, and chemical engineering. This sample covers the most comprehensive group of A-share listed companies in specific heavily polluting industries, ensuring that these enterprises can continuously and completely disclose data during the research period, thereby obtaining high-quality balanced panel data. Moreover, the sample size far exceeds the requirements of conventional econometric methodology, providing sufficient statistical power guarantee for subsequent robust econometric analysis.
During the data organization stage, three operations are carried out: (1) Eliminate ST/*ST enterprises to avoid interference from abnormal transactions; (2) Delete the samples with missing key data, and fill in the missing variables with linear interpolation. (3) All continuous variables should be truncated by 1% to eliminate the influence of extreme values. This study adopted the linear interpolation method when dealing with a small amount of missing data. We have noticed that this method assumes a linear variation among data points, which may introduce deviations. However, given the low missing rate of this dataset and the gentle trend of the variables within a short time window, the impact of this bias on the overall analysis is limited.

3.3. Model Construction

3.3.1. Benchmark Regression Model

In order to test the impact of environmental regulation on the cleaning performance of heavy polluting enterprises, the following model is established:
EP it = β 0   +   β 1 ER it   +   β 2 X it   +   δ t   +   ε it
Among them, i = 1 , 2 30 represents the stock code of the enterprise and t = 2014 ,   2015 2022 represents the year; The interpreted variable EP it represents the cleaning performance of the enterprise; The core explanatory variable ER it represents the government’s environmental regulation. X it is the set of control variables, including: enterprise size b _ s i z e i t , asset-liability ratio g _ r a t i o i t , enterprise Tobin q _ v a l u e i t , total asset turnover ratio t _ a s s e t i t , largest shareholder shareholding ratio s _ r a t i o i t , and operating income growth rate g _ r a t e i t . At the same time, the model controlled the fixed effect of the year δ t , and ε it was the random perturbation term.

3.3.2. Mediation Mechanism Model

In order to explore the role of environmental information disclosure in the process of environmental regulation affecting the environmental performance of enterprises, this paper constructs the intermediary mechanism model as follows.
EP it = β 0   +   β 1 ER it   +   β 2 X it   +   δ t   +   ε it
EIDI = β 0   +   β 1 ER it   +   β 2 X it   +   δ t   +   ε it
EP it = β 0   +   β 1 ER it   +   β 2 EIDI   +   β 3 X it   +   δ t   +   ε it
Among them, it represents the level of environmental information disclosure, and the meaning of the other parameters is the same as that in the basic regression model.

3.3.3. Variable Definition

Environmental Regulation (ER). Xue Lian et al. used the proportion of completed industrial pollution control investment in the secondary industry to represent the intensity of environmental regulation. This study draws on this approach and uses the proportion of completed industrial pollution control investment in the secondary industry to represent environmental regulation [32].
Environmental performance (EP) of heavily polluting enterprises in environmental cleaning. The examination of an enterprise’s environmental performance based on relevant literature mainly includes three dimensions: environmental treatment situation, environmental management capacity and environmental governance performance. The indicator system is shown in Table 6. The measurement of clean environment performance (EP) of heavily polluting enterprises refers to the division of environmental performance dimensions by Ding et al. (2022) and Li et al. (2025), and combines the environmental information disclosure evaluation framework proposed by Wiseman (1982) [33,34,35]. This article conducts a comprehensive examination of an enterprise’s clean environmental performance from three dimensions: environmental treatment situation (ET), environmental management capacity (EM), and environmental governance performance (EG) [35].
The environmental information disclosure index of enterprises. This study, referring to relevant literature and combining the characteristics of environmental information disclosure and clean production of heavily polluting enterprises, constructed the environmental information disclosure index and clean production performance evaluation index system of heavily polluting enterprises as shown in Table 7 [36]. It mainly includes the disclosure of environment-related reports and the disclosure of environmental governance. The entropy method is utilized to assign weights to each indicator in the evaluation index system, and the environmental information disclosure index and clean production performance of heavily polluting enterprises are comprehensively calculated.

3.3.4. Analysis of Regression Results

  • Descriptive Statistics
The descriptive statistical analysis results of each variable are shown in Table 8. In terms of core variables, the average score of the comprehensive evaluation of environmental performance (EP) is 0.090. The mean values of Environmental regulation (ER) and Environmental Information Disclosure Index (EIDI) are 0.260 and 0.220, respectively, and the standard deviations are relatively large, reflecting that there are significant differences in policy pressure and information disclosure levels faced by different enterprises, providing a good variation basis for studying the relationship between variables. Among the control variables, the mean (6594) and median (2950) of the enterprise size (b_size) differ significantly, and the standard deviation (10,182) is relatively large, indicating that the sample covers various types of enterprises from medium and small-sized to large, and the distribution shows a right-skewed characteristic. The mean value of board independence (g_ratio) is 0.410, close to the reasonable ratio recommended by theory; The average value of Tobin Q (q_value) was 2.010 and the median was 1.570, indicating that the market valuation of most enterprises was higher than their book value. Indicators such as asset structure (t_asset), profitability (s_ratio), and growth (g_rate) are all within a reasonable fluctuation range. Overall, the data of each variable have good variability and representativeness, meeting the requirements of subsequent empirical analysis.
  • Benchmark regression results
Table 9 shows the benchmark regression results. It can be concluded that there is a significant positive correlation between the level of environmental regulation (ER) and the environmental performance of enterprises (EP) at the 5% level, indicating that strengthening environmental regulation by the government can effectively improve the environmental performance of enterprises. Thus, Hypothesis 1 is verified. The main reason might lie in the fact that strict environmental regulations, by raising the marginal cost of pollution emissions, exert a direct reverse pressure on enterprises, prompting them to proactively explore and implement green innovation behaviors. Enterprise innovation helps them meet environmental compliance requirements. At the same time, through technological improvements, production process optimization and other paths, it gives rise to an “innovation compensation” effect, enabling enterprises to gain competitive advantages in improving resource allocation efficiency and comprehensive cost control, thereby offsetting or even exceeding the cost pressure caused by environmental regulations. On the other hand, market-incentivized environmental regulations provide economic compensation for enterprises’ environmental protection investments. As the intensity of regulation increases, the reputation and legal risk exposure faced by enterprises’ polluting behaviors are significantly magnified, driving enterprises to incorporate environmental performance into strategic considerations and proactively build environmental management systems to respond to regulatory pressure and social expectations, regarding environmental management capabilities as key strategic resources.
This conclusion is highly consistent with the discussions in the international academic community. For instance, the Porter Hypothesis suggests that well-designed environmental regulations can stimulate enterprise innovation, thereby partially or completely offsetting compliance costs and even enhancing enterprise competitiveness. This provides a classic theoretical support for the “innovation compensation” effect. In developed economies such as the European Union, the strict emissions Trading system (EU ETS) has been confirmed by a large number of studies to effectively promote enterprises (especially the manufacturing industry) to carry out green technological innovation to reduce carbon emissions. Compared with the traditional “command-and-control” type of regulation, market incentive tools often demonstrate higher cost-effectiveness in international practice because they provide enterprises with more flexible options to achieve emission reduction targets. Furthermore, research from Japan’s manufacturing industry also indicates that environmental regulations can help enhance the energy utilization efficiency and technological innovation level of enterprises. International frameworks such as the ecological efficiency measurement guidelines promoted by the World Business Council for Sustainable Development (WBCSD) also emphasize the importance of integrating environmental performance with enterprise value creation.
  • Mediation effect analysis
Table 10 shows the regression results of the mediation mechanism model. Column (1) examines whether the level of environmental regulation can have a significant impact on the environmental performance of enterprises. Columns (2)–(3): To examine whether the level of environmental regulation can have a significant impact on the level of environmental information disclosure, a mediating variable. The regression results show that in column (2), the environmental regulation (ER) coefficient is -0.039, which is significant at the 5% level. This preliminarily indicates that environmental regulation has a significant effect on the level of environmental information disclosure, a mediating variable. After introducing the level of Environmental Information disclosure (EIDI) in Column (3), its coefficient is 0.217, which is significant at the 1% level. Meanwhile, the coefficient of environmental regulation (ER) becomes 0.023 and remains significant. Combined with Column (2), it can be judged that environmental regulation can affect the level of environmental information disclosure, and this level plays a mediating and transmitting role in the relationship between environmental regulation and enterprise environmental performance. That is, environmental regulations can affect the environmental performance of enterprises by acting on the level of environmental information disclosure. Thus, Hypothesis 2 has been verified.
It echoes the research conclusions of the international academic community on environmental regulations, information disclosure and the performance chain, but also highlights the particularity in the Chinese context. From the perspective of the direction of action, the positive impact of environmental regulations on information disclosure differs from that of some international studies. For instance, in regions such as the European Union and the United States where disclosure systems are relatively mature, mandatory environmental regulations often directly prompt enterprises to enhance the comprehensiveness and accuracy of information disclosure. In China, the environmental information disclosure of many heavily polluting enterprises is still mainly voluntary, and the overall quality is relatively low. When confronted with short-term compliance pressure, enterprises may tend to simplify or delay disclosure to evade regulatory attention, leading to a temporary inhibitory effect of environmental regulations on information disclosure. However, after introducing information disclosure as a mediating variable, its significant positive coefficient (0.217) indicates that high-quality disclosure behavior itself remains a key path to promoting the improvement of environmental performance. This discovery is in line with the ecological efficiency framework advocated by the World Business Council for Sustainable Development (WBCSD), which states that transparent disclosure can promote substantial improvements in corporate environmental governance by reducing information asymmetry, strengthening social supervision and optimizing resource allocation.

4. Conclusions and Recommendations

4.1. Conclusions

In the research on the role of environmental regulations in the environmental performance of enterprises, the positive impacts verified by the empirical results are in line with the “Porter Hypothesis”, and this conclusion also echoes international experience—for instance, the European Union promotes green innovation in manufacturing through a carbon emissions trading system, and Japan relies on environmental regulations to enhance energy efficiency. All of them reflect the positive promoting effect of environmental regulations on the environmental performance of enterprises. It is worth noting that the “command and control” style of supervision adopted by China can also effectively force enterprises to transform. The realization of this effect is attributed to the continuous strengthening of environmental protection law enforcement in recent years.
In terms of the mechanism of environmental information disclosure, it shows a mediating effect feature of “short-term inhibition–long-term promotion”, which is different from the model of “direct positive correlation between regulation and disclosure” under the mandatory disclosure system in Europe and the United States. In China, the environmental information disclosure of heavily polluting enterprises is mainly voluntary. In the short term, affected by compliance pressure, some enterprises will simplify the content of information disclosure. However, in the long term, high-quality environmental information disclosure can contribute to the improvement of enterprises’ environmental performance by reducing information asymmetry and strengthening social supervision. This mechanism is also in line with the ecological efficiency framework of the World Business Council for Sustainable Development.
From the perspective of evolutionary game theory, the equilibrium point of this system tends to be “enterprise non-clean production”. The core problem lies in that the total cost of clean production is higher than the benefits it brings, which is consistent with the “cost–benefit” logic in international governance. This also highlights the importance of enhancing regulatory efficiency and designing reasonable fine and subsidy mechanisms. This is in sharp contrast to the practical experience of the US Regional Greenhouse Gas Initiative in improving regulatory efficiency and the EU in stabilizing carbon prices, further confirming the necessity of optimizing regulatory and incentive mechanisms.
Based on the above background, this paper constructs A three-party game model among heavily polluting enterprises, the government and environmental information disclosure regulatory authorities on the basis of evolutionary game theory, and combines the panel data of 570 listed companies in heavily polluting industries in China’s A-share market from 2014 to 2022. Systematically explore the decision-making mechanism and influencing factors of enterprise clean production in multi-agent interaction scenarios, and ultimately draw the following core conclusions:
First, at the evolutionary game level, the strategic choices of the three parties are all dominated by the cost–benefit relationship. Among them, the willingness of heavily polluting enterprises to implement clean production depends on the balance among the costs of environmental protection technology upgrades, information disclosure, subsidies and fines—the relative level of cost and benefit directly determines whether the enterprise is inclined to carry out clean production.
Secondly, when the cost of clean production for enterprises is too high and the relevant incentive and restraint mechanisms are insufficient, enterprises will be more inclined to choose non-clean production strategies. From the perspective of regulatory authorities, environmental information disclosure regulatory departments will only choose to strictly supervise in accordance with the law when the regulatory benefits exceed the regulatory costs. The government will only take strict regulatory measures when the verification cost is lower than the fines and confiscation of gains. Overall, the core bottleneck for heavily polluting enterprises in their strategic choices has always been that the total cost of clean production is higher than its comprehensive benefits.
Thirdly, at the empirical level, environmental regulations have a significant positive impact on enterprises’ clean environmental performance. This result validates Hypothesis H1, indicating that reasonable environmental regulations can enhance environmental performance by increasing the marginal cost of pollution emissions, compelling enterprises to increase their investment in green innovation. Meanwhile, environmental information disclosure plays a mediating role in the relationship between environmental regulations and corporate environmental performance: although environmental laws and regulations may have an inhibitory effect on corporate environmental performance due to compliance pressure in the short term, in the long run, high-quality environmental information disclosure can significantly promote the improvement of corporate environmental performance by reducing information asymmetry and strengthening social supervision. Furthermore, the empirical results also show that the scale of enterprises and the total asset turnover rate have a positive impact on environmental performance, while the Tobin Q value has a negative impact. This phenomenon reflects that short-term environmental protection investment will temporarily squeeze the market valuation of enterprises.

4.2. Recommendations

Based on the above conclusions and research findings, the following policy recommendations are proposed:
(1) The core task in the short term is to build a policy framework and incentive mechanisms for cleaner production, focusing on alleviating cost pressures on enterprises, especially small and medium-sized enterprises (SMEs). The government should establish a special subsidy fund for cleaner production, provide progressive tax reductions for SMEs that actively upgrade their environmental technologies, and reduce compliance costs by simplifying environmental information disclosure procedures and developing a unified digital reporting platform. Meanwhile, pilot programs for cleaner production audits should be launched in key industries such as metallurgy and chemical engineering, as well as in industrial parks, promoting a “subsidized audits and voluntary agreements” model. Enterprises that proactively disclose environmental data should be rewarded with credit rating bonuses or one-time incentives to initially establish a motivation mechanism for voluntary participation. Furthermore, the applicability of environmental taxes and fines across different industries should be dynamically assessed, implementing differentiated penalties for highly polluting enterprises to avoid excessive burdens on businesses caused by a “one-size-fits-all” approach.
(2) In the medium term, the focus should be on expanding the coverage of cleaner production and strengthening inter-departmental coordination. On one hand, cleaner production practices should be extended from the industrial sector to agriculture, construction, and services, establishing a comprehensive industrial evaluation indicator system and promoting innovation in green financial instruments. On the other hand, a “heterogeneous enterprise classification and governance mechanism” should be constructed: large enterprises should be mandatorily required to formulate mid-to-long-term environmental governance roadmaps, linking emission reduction targets with ESG ratings; for enterprises with high market valuation, the disclosure of environmental risks should be strengthened and linked to refinancing qualifications. Simultaneously, a regional collaborative mechanism for cleaner production should be established to unify standards and jointly promote technologies, achieving cross-regional joint prevention and control of pollution. The long-term goal is to foster endogenous motivation for green and low-carbon development through legislative improvement and societal co-governance. Supporting regulations should be revised to incorporate requirements for carbon emission reduction and resource recycling into the legal framework. A dynamic evaluation and remediation mechanism for corporate environmental credit should be established, rewarding enterprises that demonstrate continuous performance improvement. The development of a green consumer market should be promoted, and public participation in supervision should be encouraged by regularly disclosing corporate environmental data and government regulatory reports, forming a positive feedback loop of “disclosure-improvement-incentive.” Cleaner production should be deeply integrated into the national “Dual Carbon” strategy, leading the industrialization of cleaner production technologies and equipment through scientific and technological innovation, and ultimately building a sustainable development pattern supported by the collaboration of government, enterprises, and society.

4.3. Research Limitations and Future Research Directions

This study combines evolutionary game theory with econometrics to explore the impact of environmental regulations on clean production in heavily polluting enterprises. In terms of theoretical contributions, this study provides a formal framework, demonstrating that the stability of the tripartite regulatory system is highly sensitive to the relative cost–benefit structure of the relevant parties. Theoretically, it has been established that environmental information disclosure is an important intermediary mechanism for supervision to influence the environmental performance of enterprises. In terms of practical contributions, the research results provide policymakers with feasible insights. The effectiveness of environmental regulations depends on the severity of penalties and also on a carefully calibrated system that can both reduce compliance costs and ensure reliable law enforcement. It is emphasized that the government needs to formulate precise and targeted policies rather than adopt a one-size-fits-all approach.
Although this study provides valuable insights, there is still room for improvement. Firstly, although the current model incorporates the tripartite interaction among the government, enterprises and regulatory authorities, it fails to adequately depict the heterogeneity of the degree of limited rationality of each subject. Secondly, the empirical aspect is mainly based on data from heavily polluting industries. In the future, it can be expanded to the analysis of light-pollution industries.

Author Contributions

Conceptualization, Z.Z. and M.W.; methodology, M.W.; software, M.W.; validation, Z.Z.; formal analysis, Z.Z.; investigation, M.W.; resources, Z.Z.; data curation, Z.Z.; writing—original draft preparation, M.W.; writing—review and editing, Z.Z.; visualization, Z.Z.; supervision, Z.Z.; project administration, M.W.; funding acquisition, M.W. All authors have read and agreed to the published version of the manuscript.

Funding

This research was funded by the National Natural Science Foundation of China (72072054).

Institutional Review Board Statement

Not applicable.

Informed Consent Statement

Not applicable.

Data Availability Statement

The data presented in this study are available on request from the corresponding author.

Conflicts of Interest

The authors declare no conflicts of interest.

References

  1. Guo, M.; Wang, H.; Kuai, Y. Environmental regulation and green innovation: Evidence from heavily polluting firms in China. Financ. Res. Lett. 2023, 53, 103624. [Google Scholar] [CrossRef]
  2. Song, Y.; Zhang, Z.; Song, J. How green credit policy empowers corporate green innovation. Financ. Econ. 2023, 6, 84–96. [Google Scholar]
  3. He, M.; Zhu, X.; Li, H. How carbon emissions trading scheme affects steel enterprises’ pollution control performance: A quasi-natural experiment from China. Sci. Total Environ. 2023, 858, 159871. [Google Scholar] [CrossRef]
  4. Zhu, Y.L.; Zhang, Q.F.; Yao, Y. Does carbon emissions trading policy promote corporate green ambidextrous innovation? J. Dalian Univ. Technol. (Soc. Sci.) 2025, 46, 65–76. [Google Scholar]
  5. Chen, C.W.; Zheng, J.; Chang, T.C.; Sadiq, M.; Tufail, B. Green finance policy and heavy-pollution enterprises: A supply chain and signal transmission of green credit policy for the environment—Vietnam perspective. Environ. Dev. Sustain. 2025, 27, 2317–2335. [Google Scholar] [CrossRef]
  6. Cheng, Q.Q.; Liu, Z.M. The impact of green finance policies on ESG performance of polluting enterprises: Evidence from Chinese industrial firms. Acad. Res. 2024, 2, 101–109. [Google Scholar]
  7. Gao, D.; Li, Y.; Tan, L. Can environmental regulation break the political resource curse: Evidence from heavy polluting private listed companies in China. J. Environ. Plan. Manag. 2024, 67, 3190–3216. [Google Scholar] [CrossRef]
  8. Xu, Z.; Wang, Y.; Shi, X.; Qiu, Y.; Su, C.; He, D. The impact of environmental subsidies and enforcement on green innovation: Evidence from heavy-polluting enterprises in China. Sustainability 2025, 17, 1280. [Google Scholar] [CrossRef]
  9. Wang, Y.Y.; Cai, Z.W.; Luo, L.T. How environmental regulation costs affect green transformation of polluting enterprises?—A perspective of technology learning and absorption. Financ. Research. 2024, 4, 11–25. [Google Scholar]
  10. Gan, T.; Zhou, Z.; Li, S.; Tu, Z. Carbon emission trading, technological progress, synergetic control of environmental pollution and carbon emissions in China. J. Clean. Prod. 2024, 442, 141059. [Google Scholar] [CrossRef]
  11. Zhang, Y.L.; Cai, Z.; Yu, Y.J. Information asymmetry, carbon data quality and carbon reduction policy choices: Also on high-quality development of China’s carbon market. J. Financ. Res. 2024, 9, 114–133. [Google Scholar]
  12. Xiao, B.; Guo, X.; Guo, X.; Wang, J. How does green finance policy in China help reduce pollution emissions? Energy efficiency improvement or green innovation. J. Clean. Prod. 2024, 467, 142933. [Google Scholar] [CrossRef]
  13. Gong, J.J.; Lan, X.J.; Hu, Z.N.; Wen, C. Effectiveness, limitations and policy optimization of green finance in promoting corporate green transformation: Evidence from the Yangtze River Economic Belt. South China J. Econ. 2024, 10, 28–52. [Google Scholar]
  14. Wang, A.; Luo, K.; Nie, Y. Can artificial intelligence improve enterprise environmental performance: Evidence from China. J. Environ. Manag. 2024, 370, 123079. [Google Scholar] [CrossRef] [PubMed]
  15. Li, R.; Chen, Y. The influence of a green credit policy on the transformation and upgrading of heavily polluting enterprises: A diversification perspective. Econ. Anal. Policy 2022, 74, 539–552. [Google Scholar] [CrossRef]
  16. Huang, Y.; Bai, F.; Shang, M.; Liang, B. Catalyst or stumbling block: Do green finance policies affect digital transformation of heavily polluting enterprises? Environ. Sci. Pollut. Res. 2023, 30, 89036–89048. [Google Scholar] [CrossRef]
  17. Kugee, A.S.H.; Sarkar, B. Reducing carbon emissions of a multi-stage smart production for biofuel towards sustainable development. Alex. Eng. J. 2023, 70, 93–113. [Google Scholar] [CrossRef]
  18. Xu, Y.; Yang, C.; Ge, W.; Liu, G.; Yang, X.; Ran, Q. Can industrial intelligence promote green transformation? New insights from heavily polluting listed enterprises in China. J. Clean. Prod. 2023, 421, 138550. [Google Scholar] [CrossRef]
  19. Zhang, X.E.; Yu, Y.B. Impact of digital transformation on sustainable performance of heavily polluting enterprises. Sci. Technol. Prog. Policy 2025, 42, 82–92. [Google Scholar]
  20. Wang, L.J.; He, S.L. Green innovation development of heavily polluting enterprises under environmental regulation: An empirical analysis based on evolutionary game. Inn. Mong. Stat. 2024, 3, 26–30. [Google Scholar]
  21. Xu, R.; Wang, Y.; Wang, W.; Ding, Y. Evolutionary game analysis for third-party governance of environmental pollution. J. Ambient Intell. Humaniz. Comput. 2019, 10, 3143–3154. [Google Scholar] [CrossRef]
  22. Pan, F.; Liu, Y.; Wang, L. Evolutionary game analysis of central-local-enterprise environmental regulation from public participation perspective. Oper. Res. Manag. Sci. 2023, 32, 104–110. [Google Scholar]
  23. Wei, J.; Li, Y.; Liu, Y. Tripartite evolutionary game analysis of carbon emission reduction behavior strategies under government regulation. Environ. Dev. Sustain. 2024, 27, 1–33. [Google Scholar] [CrossRef]
  24. Lv, Y.; Wan, L.; Zhang, N.; Wang, Z.; Tian, Y.; Ye, W. Research on the green transition path of airport development under the mechanism of tripartite evolutionary game model. Sustainability 2024, 16, 8074. [Google Scholar] [CrossRef]
  25. Zhang, S.; Li, P.Z. Research on “greenwashing” behavior of transition enterprises in green financial market: Simulation based on quadrilateral evolutionary game. Financ. Econ. 2024, 12, 37–49. [Google Scholar]
  26. Sharpe, W.F. Capital asset prices: A theory of market equilibrium under conditions of risk. J. Financ. 1964, 19, 425–442. [Google Scholar]
  27. Friedman, D. On economic applications of evolutionary game theory. J. Evol. Econ. 1998, 8, 15–43. [Google Scholar] [CrossRef]
  28. Liu, H.; Liu, S. Environmental regulation and environmental performance of enterprises: Quasi-natural experiment of the new environmental protection law. Int. Stud. Econ. 2024, 19, 406–430. [Google Scholar]
  29. Deng, X.; Li, L. Promoting or inhibiting? The impact of environmental regulation on corporate financial performance—An empirical analysis based on China. Int. J. Environ. Res. Public Health 2020, 17, 3828. [Google Scholar] [CrossRef]
  30. Qing, L. The impact of environmental information disclosure on Chinese firms’ environmental and economic performance in the 21st century: A systematic review. IEEE Eng. Manag. Rev. 2022, 50, 203–214. [Google Scholar] [CrossRef]
  31. Ye, Y.; Yang, X.; Shi, L. Environmental information disclosure and corporate performance: Evidence from Chinese listed companies. Heliyon 2023, 9, e22400. [Google Scholar] [CrossRef]
  32. Xue, L.; Huang, Y. Can Environmental Regulations Boost High-Quality Regional Economic Development: Empirical Evidence from the Yangtze River Economic Belt. Jianghan Forum 2021, 3, 37–44. [Google Scholar]
  33. Ding, J.; Lu, Z.; Yu, C.H. Environmental information disclosure and firms’ green innovation: Evidence from China. Int. Rev. Econ. Financ. 2022, 81, 147–159. [Google Scholar] [CrossRef]
  34. Li, X.; Tian, Z.; Chang, B. Environmental information disclosure and green innovation: Examining the connection. Manag. Decis. 2025, 1–36. [Google Scholar] [CrossRef]
  35. Wiseman, J. An evaluation of environmental disclosures made in corporate annual reports. Account. Organ. Soc. 1982, 7, 53–63. [Google Scholar] [CrossRef]
  36. Clarkson, P.M.; Li, Y.; Richardson, G.D.; Vasvari, F.P. Revisiting the relation between environmental performance and environmental disclosure: An empirical analysis. Account. Organ. Soc. 2008, 33, 303–327. [Google Scholar] [CrossRef]
Figure 1. Three-way evolution mechanism diagram.
Sustainability 17 09586 g001
Figure 2. The evolutionary trend of the heavy pollution enterprises’ strategies.
Sustainability 17 09586 g002
Figure 3. Phase diagram of the environmental regulatory department.
Sustainability 17 09586 g003
Figure 4. Government phase map.
Sustainability 17 09586 g004
Figure 5. Evolutionary path diagram.
Sustainability 17 09586 g005
Figure 6. Tripartite evolution trajectory under different conditions.
Sustainability 17 09586 g006
Table 1. Parameter Explanation of the Game between the Government, Environmental Information Disclosure Regulatory Authorities and Enterprises.
Parameters or VariablesExplain
c a ( a = i , e , d , g e , g d )Enterprises disclose environmental information according to regulations, upgrade technologies and equipment for environmentally friendly production, the regulatory departments supervise environmental information disclosure, the government checks whether enterprises are producing cleanly, and the government verifies whether the regulatory departments are managing according to the law.
t a   ( a   =   d , g , e )The company failed to disclose environmental information according to regulations, the company’s pollution production has been verified, and the fines paid for the verified pollution production as well as the environmental protection tax (pollution discharge fee).
e a   ( a   =   dy , dn )The profits obtained by the regulatory authorities during legal supervision (such as government rating income) and the losses incurred by the regulatory authorities when not supervising legally (such as downgrade losses)
b a   ( a   =   g , l )The social benefits that the government can obtain from environmentally friendly production by enterprises, and the social benefits lost by the government from pollution-producing enterprises.
d a   ( a   =   g , l )The social benefits obtained by the government when the regulatory authorities conduct oversight in accordance with the law, and the social benefits lost by the government when the regulatory authorities fail to conduct oversight in accordance with the law.
h The social benefits gained from companies disclosing environmental information according to regulations.
l The company did not disclose the negative impact it has brought on itself according to regulations.
e The economic benefits produced by enterprises under normal circumstances.
s The company’s environmentally friendly production has been verified and received subsidies.
φ The efficiency of regulatory authorities in conducting supervision.
Note 1: Heavily polluting enterprise implementing clean production are required to disclose environmental information in accordance with regulations, while others are not. Note 2: The government’s verification of enterprises incorporates the verification by the environmental information regulatory authorities.
Table 2. Profit Matrix.
GovernmentEnvironmental Information Disclosure Regulatory AuthoritiesHeavy Polluting Enterprise
Clean   Production   ( x ) Non-Clean Production ( 1 - x )
Keep under strict supervision ( z )Regulation in accordance with the law (y) e - c i   +   φ h - c e   +   s
- c d   +   e dy
b g - c ge - c gd - s   +   d g
e - φ t d - φ l - t g - t e
φ t d - c d   +   e dy
t g   +   t e - c ge - c gd - b l   +   d g
Unregulated   by   law   ( 1 y ) e - c i - c e   +   s
- e dn
b g - c ge - c gd - s - d l
e - t g - t e
- e dn
t g   +   t e - c ge - c gd - b l - d l
Loose regulation ( 1 z ) Regulation in accordance with the law (y) e - c i   +   φ h - c e
- c d
b g   +   d g
e - φ t d - φ l
φ t d - c d
d g - b l
Unregulated   by   law   ( 1 y ) e - c i - c e
0
b g d l
e
0
- d l - b l
Table 3. Analysis of the Stability of Game Players.
Game SubjectThe Conditions to Be Met
Heavily Polluting Enterprises F ( x ) = - x ( x - 1 ) ( z ( s   +   t e   +   t g ) - ( c i   +   c e )   +   φ y ( l   +   h   +   t d ) ) = 0 ,
d F ( x ) d x = ( 1 2 x ) ( z ( s   +   t e   +   t g ) ( c i   +   c e )   +   φ y ( l   +   h   +   t d ) )   <   0 ,
Environmental Regulatory Authorities F ( y ) = - y ( y - 1 ) ( φ t d ( 1 - x ) - c d   +   z ( e dn   +   e dy ) ) = 0
d F ( y ) d y = ( 1 2 y ) ( φ t d ( 1 x ) c d   +   z ( e d n   +   e d y ) )   <   0
Government F ( z ) = z ( z - 1 ) ( c g d   +   c g e - ( t e   +   t g )   +   x ( s   +   t e   +   t g ) ) = 0
d F ( z ) d z = ( 2 z 1 ) ( c g d   +   c g e ( t e   +   t g )   +   x ( s   +   t e   +   t g ) )   <   0
Table 4. Eigenvalues and evolutionary stability of equilibrium points.
Equilibrium PointEigenvalueStability
(0, 0, 0) λ 1 = - c i - c e
λ 2 = φ t d - c d
λ 3 = ( t e   +   t g ) - ( c gd   +   c ge )
If   φ t d   <   c d , ( t e   +   t g )   <   ( c gd   +   c ge ) is established, it is an evolutionary stability point.
(0, 0, 1) λ 1 = ( s   +   t e   +   t g ) - c i - c e
λ 2 = φ t d - c d   +   e dn   +   e dy
λ 3 = c gd   +   c ge - ( t e   +   t g )
If   s   +   t e   +   t g   <   c i   +   c e , φ t d   +   e dn   +   e dy   <   c d , c gd   +   c ge   <   ( t e   +   t g ) is established, it is an evolutionary stability point.
(0, 1, 0) λ 1 = - c i - c e   +   φ ( l   +   h   +   t d )
λ 2 = - ( φ t d - c d )
λ 3 = ( t e   +   t g ) - ( c gd   +   c ge )
If   φ ( l   +   h   +   t d )   <   c i   +   c e ,   φ t d   >   c d , ( t e   +   t g )   <   ( c gd   +   c ge ) is established, it is an evolutionary stability point.
(1, 0, 0) λ 1 = c i   +   c e
λ 2 = - c d
λ 3 = - ( c gd   +   c ge   +   s )
Unstable point
(1, 1, 0) λ 1 = c i   +   c e - φ ( l   +   h   +   t d )
λ 2 = c d
λ 3 = - ( c gd   +   c ge   +   s )
Unstable point
(1, 0, 1) λ 1 = c i   +   c e - ( s   +   t e   +   t g )
λ 2 = - c d   +   e dn   +   e dy
λ 3 = c gd   +   c ge   +   s
Unstable point
(0, 1, 1) λ 1 = ( s   +   t e   +   t g ) - c i - c e   +   φ ( l   +   h   +   t d )
λ 2 = - ( φ t d - c d   +   e dn   +   e dy )
λ 3 = c gd   +   c ge - ( t e   +   t g )
If   s   +   ( t e   +   t g )   +   φ ( l   +   h   +   t d )   <   c i   +   c e ,   φ t d   +   e dn   +   e dy   >   c d , c gd   +   c ge   <   ( t e   +   t g ) is established, it is an evolutionary stability point.
(1, 1, 1) λ 1 = - ( s - c i - c e   +   ( t e   +   t g )   +   φ ( l   +   h   +   t d ) )
λ 2 = - ( - c d   +   e dn   +   e dy )
λ 3 = c gd   +   c ge   +   s
Unstable point
Table 5. Stability Analysis Table.
ParameterConvergence RateSpecific Explanation
( c i   +   c e ) As the parameter increased from 80 to 150, the probability of heavy polluting enterprises choosing non-clean production showed an upward trend.The cost of cleaner production will hinder the evolution speed of cleaner production. The reason is that the increase in cost will compress the profit space of enterprises, and then hit the motivation of cleaner production.
t d When the parameter is 12, the policy trajectory shows a linear convergence featureThe increase in environmental information disclosure violation penalty can restrain the tendency of enterprises to pollute, accelerate the steady state convergence process of the system, and promote enterprises to reach the Pareto optimal equilibrium of clean production in a shorter time.
When the parameter is increased to 30, the evolution trajectory of the system gradually forms a closed ring structure and the amplitude expands with the increase in the parameter.
When the parameter is increased to 60, the probability of heavy polluting enterprises choosing non-clean production shows a monotonically decreasing trend, and the evolution speed of their clean production strategies increases significantly.
( e d n   +   e d y ) When the parameters are initial values, the strategy selection tends to be (0,1,0)The expected return of regulatory authorities to regulate according to law will affect the evolution speed of the system, and the larger the value is, the more likely the government is to strictly regulate.
When the parameter is increased to 70, the strategy evolution shows a slow convergence in a spiral shape and tends to approach the stable point after several oscillations.
When the parameter is increased to 100, the government tends to be more stringent.
φ As the supervision efficiency increases from 0.4 to 0.8, the evolution speed of the system decreases.In the process of system evolution to the steady state, the efficiency of supervision by regulators will affect the evolution speed of the system.
( t e   +   t g ) When the parameter is increased to 80, the evolution rate of the system increases, but when the parameter is further increased to 100, the evolution rate of the system shows a downward trend.It shows that when the pollution production fines and environmental protection taxes paid by heavy polluting enterprises are too high, it will hinder the production and operation of enterprises to some extent. Unreasonably high fines will lead to the phenomenon that enterprises will not clean up even if they are fined.
( c g d   +   c g e ) When the parameter is increased from 60 to 100, the evolution rate of the system increases, but when the parameter is further increased to 150, the evolution of the system will no longer approach (0,1,0).When the cost of strict government regulation is too high, it will cause difficulties in government supervision, which is not conducive to effective government supervision.
Note: In matlab software, “ φ ” cannot be input. Therefore, in the figure, let φ = A.
Table 6. Performance Index System for Clean Production of Heavily Polluting Enterprises.
VariableFirst-Level IndicatorSecondary Indicators
Environmental performance of heavily polluting enterprises EPEnvironmental treatment statusETHandling of environmental petition cases
The handling of environmental violations
handling of sudden environmental accidents
Environmental management capacity EMEnvironmental education and training
Environmental honors or awards
“Three simultaneous” system
Environmental governance performance EGImplementation of cleaner production
Solid waste utilization and disposal
Exhaust gas emission reduction and treatment
Wastewater emission reduction and treatment
dust and soot control
Table 7. Environmental Information Disclosure Index System for Heavily Polluting Enterprises.
VariableFirst-Level IndicatorSecondary Indicators
Environmental Information Disclosure Index EIDIEnvironmental regulatory certification ESCWhether it is S09001 certified
Whether it is certified by S014001
Whether pollutant emissions meet the standards
0
6
Environmental related reporting disclosure status ERREnvironmental protection information disclosure in the annual report
Social responsibility report on environmental protection information disclosure
Disclosure of separate environmental reports
Environmental governance disclosure EPGWhether it has an environmental protection concept
Whether to set environmental goals
Whether the environmental protection management system is complete
Whether the emergency response mechanism for environmental incidents is sound
The development of special environmental protection actions
Table 8. Descriptive Statistics of Key Indicators.
VariableSample SizeMeanMedianStandard DeviationMinimum ValueMaximum Value
EP47940.09000.08000.080000.330
ER47940.2600.2100.21000.880
EIDI47940.2200.1700.21000.930
b _ s i z e 47946594295010,18225764,794
g _ r a t e 47940.4100.4000.1900.05000.860
q _ v a l u e 47942.0101.5701.3100.8108.330
t _ a s s e t 47940.6500.5700.4100.09002.470
s _ r a t i o 479434.3332.2714.889.08074.57
g _ r a t i o 47940.1300.07000.390−0.6502.160
Note: EP represents the environmental cleanliness performance of heavily polluting enterprises, ER represents the level of environmental regulation, b_size represents the enterprise scale, g_rate represents the asset-liability ratio, q_value represents the Tobin q value of the enterprise, t_asset represents the total asset turnover rate, s_ratio represents the shareholding ratio of the largest shareholder, and g_rate represents the growth rate of operating income.
Table 9. Benchmark regression results.
Variable(1)(2)(3)(4)(5)(6)(7)
ERCoefficientsCoefficientsCoefficientsCoefficientsCoefficientsCoefficientsCoefficients
0.015 **0.019 ***0.020 ***0.018 ***0.017 ***0.018 ***0.017 ***
T-statisticT-statisticT-statisticT-statisticT-statisticT-statisticT-statistic
(2.47)(3.44)(3.53)(3.18)(2.99)(3.16)(3.06)
b _ s i z e CoefficientsCoefficientsCoefficientsCoefficientsCoefficientsCoefficients
0.000 ***0.000 ***0.000 ***0.000 ***0.000 ***0.000 ***
T-statisticT-statisticT-statisticT-statisticT-statisticT-statistic
(21.75)(19.81)(19.22)(18.26)(16.80)(16.55)
g _ r a t i o CoefficientsCoefficientsCoefficientsCoefficientsCoefficients
0.028 ***0.016 **0.011 *0.011 *0.011 *
T-statisticT-statisticT-statisticT-statisticT-statistic
(4.67)(2.57)(1.72)(1.71)(1.79)
q _ v a l u e CoefficientsCoefficientsCoefficientsCoefficients
(−0.005 ***−0.005 ***−0.005 ***−0.005 ***
T-statisticT-statisticT-statisticT-statistic
(−4.94)(−5.56)(−5.50)(−5.48)
t _ a s s e t CoefficientsCoefficientsCoefficients
0.023 ***0.022 ***0.022 ***
T-statisticT-statisticT-statistic
(8.43)(8.17)(7.90)
s _ r a t i o CoefficientsCoefficients
0.000 **0.000 **
T-statisticT-statistic
(2.35)(2.34)
g _ r a t e Coefficients
−0.005 *
T-statistic
(−1.78)
ConstantCoefficientsCoefficientsCoefficientsCoefficientsCoefficientsCoefficientsCoefficients
0.075 ***0.060 ***0.049 ***0.063 ***0.051 ***0.045 ***0.046 ***
T-statisticT-statisticT-statisticT-statisticT-statisticT-statisticT-statistic
(20.31)(16.52)(11.39)(12.04)(9.60)(7.54)(7.69)
R20.01640.10530.10900.11350.12650.12750.1280
Observations4860485948594793479347934791
Note: EP represents the environmental cleanliness performance of heavily polluting enterprises, ER represents the level of environmental regulation, b_size represents the enterprise scale, g_rate represents the asset-liability ratio, q_value represents the Tobin q value of the enterprise, t_asset represents the total asset turnover rate, s_ratio represents the shareholding ratio of the largest shareholder, and g_rate represents the growth rate of operating income. *** p < 0.01, ** p < 0.05, * p < 0.10.
Table 10. Regression results of mediating effects.
Variables(1)(2)(3)
EPEPEP
ERCoefficientsCoefficientsCoefficients
0.017 ***−0.039 **0.023 ***
T-statisticT-statisticT-statistic
(3.06)(−2.54)(5.15)
b_sizeCoefficientsCoefficientsCoefficients
0.000 ***0.000 ***0.000 ***
T-statisticT-statisticT-statistic
(16.55)(5.46)(8.10)
g_ratioCoefficientsCoefficientsCoefficients
0.011 *0.074 ***−0.000
T-statisticT-statisticT-statistic
(1.79)(4.40)(−0.07)
q_valueCoefficientsCoefficientsCoefficients
−0.005 ***−0.005 *−0.005 ***
T-statisticT-statisticT-statistic
(−5.48)(−1.94)(−7.21)
t_assetCoefficientsCoefficientsCoefficients
0.022 ***0.015 *0.010 ***
T-statisticT-statisticT-statistic
(7.90)(1.95)(4.42)
s_ratioCoefficientsCoefficientsCoefficients
0.000 **0.001 ***0.000
T-statisticT-statisticT-statistic
(2.34)(5.01)(0.80)
g_rateCoefficientsCoefficientsCoefficients
−0.005 *0.025 ***−0.001
T-statisticT-statisticT-statistic
(−1.78)(3.02)(−0.54)
EIDI Coefficients
0.217 ***
T-statistic
(48.70)
ConstantCoefficientsCoefficientsCoefficients
0.046 ***0.144 ***0.038 ***
T-statisticT-statisticT-statistic
(7.69)(10.64)(9.14)
Observations479147194791
R20.0010.0730.001
Note: EP represents the environmental cleanliness performance of heavily polluting enterprises, ER represents the level of environmental regulation, b_size represents the enterprise scale, g_rate represents the asset-liability ratio, q_value represents the Tobin q value of the enterprise, t_asset represents the total asset turnover rate, s_ratio represents the shareholding ratio of the largest shareholder, and g_rate represents the growth rate of operating income. *** p < 0.01, ** p < 0.05, * p < 0.10.
Disclaimer/Publisher’s Note: The statements, opinions and data contained in all publications are solely those of the individual author(s) and contributor(s) and not of MDPI and/or the editor(s). MDPI and/or the editor(s) disclaim responsibility for any injury to people or property resulting from any ideas, methods, instructions or products referred to in the content.