Abstract
The hybridization of photovoltaic (PV) and concentrated solar power (CSP) technologies offers a viable solution to enhance dispatchability and reduce energy costs in solar power systems. This study analyzes two CSP-PV hybrid configurations—parabolic trough and solar tower—in diverse Brazilian climatic conditions. Particular focus is given to Bom Jesus da Lapa, identified as the most favorable location in terms of solar resource and system performance. The CSP subsystem includes a two-tank direct thermal energy storage system with molten nitrate salts and a 50 MWe gross Rankine cycle. System performance and techno-economic metrics are assessed using the System Advisor Model (SAM). A parametric analysis investigates the impact of solar irradiation, solar multiple (SM), and thermal storage duration on annual energy output and levelized cost of energy (LCOE). Results indicate that the hybrid system consistently surpasses standalone PV and CSP in both performance and cost-effectiveness. In the solar tower configuration, capacity factors reach up to 90% with an SM of 3.5 and 12 h of storage. This work provides the first techno-economic assessment of PV/CSP hybrid plants tailored to Brazilian conditions, combining multi-city simulations with solar multiple and storage parametric analysis. Among all evaluated sites, Bom Jesus da Lapa presents the highest energy yield and lowest LCOE, supporting its potential suitability for hybrid CSP-PV deployment.
1. Introduction
The need to explore innovative solutions for energy generation through renewable and sustainable sources is increasingly evident in the face of environmental challenges and growing demands for electricity worldwide. Solar energy is typically converted to power generation through two technologies: photovoltaic (PV) and concentrated solar power (CSP) [1]. Although CSP technology offers advantages such as thermal energy storage and enhanced generation stability, its contribution to the global energy matrix remains below 1%, according to the International Energy Agency. In 2023, CSP accounted for ~0.1% of global electricity, versus ~6.9% for PV; installed CSP capacity was ~7 GW compared with ~2200 GW for PV [1]. It is significantly outpaced by photovoltaic and wind energy sources, which together account for over 90% of the installed renewable energy capacity worldwide. CSP concentrates the sun’s rays using mirrors, allowing heat transfer using a heat transfer fluid. A steam turbine is driven and powered by the high-temperature heat generated [2]. In this context, the combined use of CSP and PV technologies emerges as a promising and efficient solution, as it leverages the complementarity between photovoltaic generation during daylight hours and the thermal energy storage capabilities of CSP systems. This hybridization enables continuous and dispatchable power supply, even during periods of low solar irradiance or after sunset, thereby enhancing grid reliability and supporting the integration of renewable energy into the energy mix.
Recent advances in renewable energy systems have increasingly emphasized the role of hydrogen as a complementary vector for decarbonization and energy storage. As highlighted by Babay et al. [3], the integration of solar-driven hydrogen production technologies—such as photothermal reforming of methanol—offers promising pathways for sustainable fuel generation and grid flexibility. These developments underscore the strategic importance of hybrid systems that combine dispatchable solar generation with emerging hydrogen applications, particularly in regions with high solar potential like Brazil.
Photovoltaic solar energy has experienced remarkable growth in Brazil, driven by supportive public policies and a geographic location that naturally favors this form of energy generation [2,4]. However, hybrid photovoltaic energy with a CSP system is becoming increasingly present in literature. In 2023, Brazil rose in the world ranking of installed photovoltaic solar generation capacity, occupying 6th place with 37.4 GW, only behind China (609.3 GW), the United States (137.7 GW), Japan (87.1 GW), Germany (81.7 GW) and India (72.7 GW).
1.1. Literature Review on Hybrid PV/CSP Systems
According to EPE (Energy Research Company) [5], hybrid plants combine multiple energy sources to generate electricity. These systems, especially those integrating renewable sources like solar, wind, and biomass are gaining importance due to their higher reliability and capacity factor, despite potentially higher initial costs. Technologies like CSP also offer flexibility by allowing the use of alternative fuels to enhance performance.
Cocco & Petrollese [6] demonstrated that an improvement in power dispatch ability can be achieved with an appropriate integration of concentrated solar power (CSP) and photovoltaic (PV) plants to mitigate the effects of solar power variability and intermittency. This hybridization can increase the overall capacity factor of the plant by allowing thermal energy to be stored while the PV plant is in production and thus help achieve a fully dispatchable solar electricity generation system.
In another work, Giaconia and Grena [7] presented a CSP system with thermal storage coupled to a PV system without storage. They concluded that the PV field provides most of the electricity needed during the day and that the CSP provides energy, especially at night, exploring storage.
Pilotti et al. [8] state that projects carried out with stand-alone technologies (only CSP or PV plus battery) show that hybrid solutions can achieve similar or better dispatch levels with a lower electricity cost (LCOE reduction between 30% and 50%). Other forms of hybridization with CSP have already been studied, such as wind [9], biomass [10,11], nuclear [12], and geothermal [13], but there is a gap when we apply these installations to the current tariff market of each country, in the case of this work, Brazil.
Economic assessments of hybrid solar plants consider seasonal generation, costs, and revenues from energy sales. Financial viability requires covering CAPEX and OPEX with returns evaluated using discounted cash flow, Net Present Value (NPV), and Levelized Cost of Energy (LCOE) [14,15,16,17,18].
In a study for the decarbonization of LNG (Liquefied Natural Gas) plants using heat and power from hybrid CSP/PV plants in locations with DNI (Direct Normal Irradiation) values greater than 2000 kWh/m2/year, Hasni & Platzer [19] conducted a techno-economic assessment considering the price of electricity in Australia and Qatar. The results indicate that purchasing electricity would be more expensive for Australia than investing in a PV/CSP plant. In Qatar, the LCOE range of US$93–110/MWh is not competitive with the price of electricity, mainly due to energy subsidies.
Seeking to investigate the feasibility of CSP in Tanzania by modeling parabolic trough and solar tower CSP technologies, Aly et al. [20] the LCOE for solar tower plants ranges from 11.6 to 12.5 ¢/kWh, and for parabolic trough plants from 13.0 to 14.4 ¢/kWh. Higher interest rates significantly increase LCOE, reaching up to 25.9 ¢/kWh in private-sector projects. Therefore, CSP project viability in the country relies heavily on favorable financing conditions and supportive political mechanisms to lower investment risk.
Boreti & Castelleto [21] and Ziyati et al. [22] compared PV and CSP plants over 100 MW in the U.S. and showed that PV dominates due to lower costs and more mature technology, while CSP, particularly solar tower systems, remains less common. Their study also used model predictions to explore the optimal long-term complementary use of both technologies.
Hassani & Mezrhab [23] conducted a parametric study examining the effects of varying tilt angles, solar multiples (SM), and thermal storage durations on annual energy output and the levelized cost of energy (LCOE). Their technical and economic analysis indicated that fixing solar PV panels at a 30° tilt yields optimal performance, delivering higher annual energy generation alongside a reduced LCOE. Moreover, as anticipated, the findings reveal that hybrid power plants enable more flexible energy dispatch and achieve a lower LCOE compared to concentrated solar power (CSP) systems. Notably, when the solar multiple exceeds 3.5 and thermal storage extends beyond 16 h—given its significantly lower cost relative to battery storage—the system’s capacity factor can surpass 90%.
By investigating two Saudi Arabian cities with hybrid CSP/PV plants with three different operating strategies, Sumayli et al. [24], show that for a target capacity factor of 79%, the hybrid concept with a PV plant added to the original CSP baseload plant shows a reduction in LCOE of 18% for Riyadh and 7% for Tabuk. Thus, the LCOE was reduced by hybridization in both locations. Therefore, it is important to study hybridization for an individual city based on its meteorological data.
The sizing of grid-connected photovoltaic systems through energy cost indicators was evaluated by Aguilar et al. [14] in Mexico. It presents an operational and economic study that compares the hybrid system to that used in the microgrid. The results show that the levelized cost of energy (LCOE) for the PV/CSP hybrid system is USD 0.524/kWh, only 2% higher than the LCOE of the photovoltaic battery, which is USD 0.51/kWh. However, in a scenario where the PV/CSP system is deployed in a community with a 50% increase in energy demand, the levelized cost of energy (LCOE) rises to USD 0.506/kWh. Conversely, if the community’s energy demand surpasses 500 kW, the LCOE of the PV-CSP system decreases by 26%, highlighting the economic advantage of scaling up the system.
Hasni & Platzer [19] investigated a new concept for supplying heat and power from a hybrid PV and CSP plant to meet the energy demand of an LNG export terminal. The results indicate that the hybrid PV/CSP plant significantly accelerates the decarbonization of the energy supply to the “all-electric” LNG plant.
Although environmental assessments of CSP technologies remain limited, key studies such as Gasa et al. [25] and Klein & Rubin [26] have demonstrated that thermal energy storage significantly reduces life cycle greenhouse gas emissions and enhances dispatchability. These findings, while not the focus of this techno-economic assessment, underscore the broader sustainability potential of CSP systems. Additionally, policy analyses by Kumar et al. [27], Pan & Dinter [28], and Ling-Zhi et al. [16] highlight how national incentive programs influence CSP adoption, offering context for future integration strategies.
Caldas & Santos [2] state that current regulations, such as REN (Normative Resolution) 687 [4] are partially adequate to support the growth of the solar energy market in Brazil. There is a need for regulatory improvements aimed at reducing costs and improving financing conditions in the implementation of distributed generation systems in the residential, commercial, and industrial markets, as well as greater freedom and flexibility so that the consumer can effectively become a customer in the Brazilian energy market.
In Brazil, there are no studies that deal with hybrid CSP/PV plants; only studies on hybridization with CSP appear, those by Soria et al. [10] and Fichter et al. [29], both of which use biomass in the country’s semiarid region. According to Soria et al. [10], the hybridization of biomass in a CSP plant with a solar multiple (SM) of 1.2 and a biomass fill fraction of 30% can generate electricity at 110 USD/MWh.
1.2. SAM—System Advisor Model
The System Advisor Model (SAM) is software developed by National Renewable Energy Laboratory—NREL [30], a laboratory of the United States Department of Energy (DOE), with over 35 years of experience in energy efficiency and renewable energy. SAM collaborates with Sandia National Laboratories on photovoltaic modeling and has collaborated with the University of Wisconsin on concentrated solar power (CSP) modeling.
SAM performs annual cash flow and performance analyses based on user-defined parameters. It uses TRNSYS, a time-series simulation tool developed by the University of Wisconsin, to calculate hourly energy generation for PV, CSP, and other renewable sources based on local solar resource data. Through SAM, it is possible to simulate photovoltaic, wind, biomass, geothermal, and water heating plants, various CSP technologies, and a generic model where it is possible to combine results from two or more technologies in a single plant to obtain results from hybrid plants [30].
Elbeh & Sleiti [31] reviewed concentrated solar power (CSP) technology to design and optimize a CSP tower plant for arid climate regions such as Qatar. SAM was used to validate technical and financial data from a solar power tower project, confirming the plant’s feasibility. Key findings showed peak energy production in July (3,621,950 kWh) and the highest energy surplus in March (2,946,965 kWh).
Your works by Soria et al. [32] and Parent et al. [33] used SAM to analyze the influence of variation in the storage capacity of heat and hybridization on the levelized cost of energy (LCOE), the capacity factor, and the annual energy production in a solar thermal power generation system, respectively.
Liaqat et al. [34] presented the design of a hybrid power plant using CSP and PV technologies in Pakistan, a country with high solar capacity. A 150 MW hybrid system (100 MW CSP and 50 MW PV) with 12 h thermal storage showed an 18.5% reduction in LCOE compared to stand-alone CSP, while maintaining dispatchability. The system was modeled using SAM.
In Brazil, Malagueta et al. [35] using SAM and an optimization model, the study assessed CSP potential in Brazil and its long-term integration by 2040. It concluded that CSP is not yet competitive without tariff support, though future cost reductions and international incentive programs suggest promising prospects.
The data used in SAM for the solar plant simulations described in the literature are presented in Table 1.

Table 1.
Work with simulations in SAM.
The CSP and PV plants simulated in this study are based on the solved physical models by mathematical equations, which serve as the basis for the standard arrangement present in SAM version 2021.12.2 and the variations made possible by the software.
The novelty of this study lies in providing a Brazil-focused techno-economic benchmark for PV/CSP hybrids, filling a gap in the literature that has so far addressed hybridization mainly in other regions, and by explicitly comparing parabolic trough and solar tower configurations under local solar resource and financial assumptions.
Although this study focuses on Brazil, the modeling setup was designed to be flexible. By separating hourly solar data and financial inputs by country, the same SAM-based approach can be easily adapted to other Latin American regions with similar solar potential.
1.3. CSP Generation in Brazil
Unlike the generation of photovoltaic energy that is growing, supported by REN 687/2015, CSP energy is not yet present in Brazilian soil when it comes to electrical energy. However, for heat generation, we have the company Kraft Foods in its subsidiary in Recife, where a parabolic cylinder solar field can provide pressurized water at temperatures of 110 °C, used for cooking, cleaning, drying, and pasteurizing food [36].
Aiming at the dissemination of knowledge and development of CSP technology in Brazil, ANEEL (National Electric Energy Agency) developed a strategic research and development project, which resulted in public call no. 19/2015—Strategic Project for the Development of National Technology for Solar Thermal Generation of Electric Energy [36]. In this call, the Regulatory Agency observed that the country’s existing industrial capacities offered good conditions for insertion into the global production chains of geothermal technology. Thus, its main objective was to identify technical and commercial arrangements for generating electricity through this technology, in addition to seeking public policy designs capable of driving the nationalization of technology and component manufacturing. The call anticipated that projects could include the installation of pilot plants or parts of a solar thermal installation.
Among other requirements, it required the implementation of an irradiation measurement campaign and recommended the carrying out of exchanges with international experts. In total, 5 projects were selected to participate in ANEEL’s Strategic PD program, as shown in Table 2. As published by the publisher Brasil Energia, all envisaged the installation of pilot projects of CSP plants. Although some of the projects are already in the final stage, none have yet managed to complete the installation of the plants, with CESP (São Paulo Energy Company, Sao Paulo, Brazil) being the most advanced to date.

Table 2.
PD Projects of Public Call ANEEL 019/2015 [36].
CSP technology provides firm power, ancillary services, and zero emissions, but is undervalued in Brazil’s cost-focused auctions, making it currently uncompetitive. Therefore, evaluating the economic viability of CSP, especially hybrid systems and modeling their impact on the electricity matrix and tariffs, is essential for future competitiveness.
1.4. CSP Technologies
The parabolic cylindrical solar collector uses concave mirrors and an absorber tube through which a thermal fluid heated by the sun’s rays circulates, which subsequently generates steam for the Rankine cycle. The central tower CSP plant uses heliostats to reflect sunlight to a receiver on a tower, heating the thermal fluid. Fresnel concentrators use flat mirrors, reflecting sunlight to a fixed tube, which is less expensive but also less efficient. Parabolic disk concentrators use independent mirrors that concentrate heat at a focal point to operate a Stirling engine and are efficient, but with power limited to small generators [37]. Table 3 provides a comparative overview of the two technologies within the CSP family.

Table 3.
Comparison between CSP technologies [10].
Clearly, from a technological perspective, Sumayli et al. [24] emphasize the importance of analyzing hybridization strategies tailored to the specific meteorological conditions of each city. They argue that integrating photovoltaic (PV) systems into concentrated solar power (CSP) plant designs should be considered universally, as this approach can significantly reduce the cost of solar-based baseload energy supply.
Although they have already been made in Saudi Arabia [24], Iran [38], India [27,39], Spain [18,33], Egypt [40], Morocco [23], Malaysia [41], Mexico [14], Chile [42,43], China [16], Ghana [44], Tanzania [20], and Pakistan [34], there is no detailed estimate in the literature of an economic analysis of hybrid CSP/PV plants in Brazil considering different solar multiples (SM) and different thermal storages, even with the country’s large solar potential.
This study addresses a gap in the literature by evaluating different solar plant scenarios across various Brazilian regions, considering their climatic and solar potential. Using PV and multiple CSP configurations, it aims to identify the optimal hybrid setup based on energy generation and LCOE.
2. Methodology
2.1. Location Selection and Its Potential
Although Brazil exhibits diverse climatic conditions, the annual average of global solar irradiation remains relatively uniform across the country, with consistently high values nationwide. The maximum value of annual global irradiation—2500 kWh/m2—occurs in the north of the state of Bahia, near the border with the state of Piauí. This area has a semi-arid climate with low precipitation throughout the year and the lowest annual average cloud [45,46].
The lowest annual global solar irradiation—1500 kWh/m2—occurs on the northern coast of Santa Catarina, characterized by the occurrence of precipitation well distributed throughout the year. The annual global solar irradiation values incident on most of the Brazilian territory (1500–2500 kWh/m2) are higher than those of most countries in the European Union, such as Germany (900–1250 kWh/m2), France (900–1650 kWh/m2) and Spain (1200–1850 kWh/m2), where projects for the use of solar resources, some with strong government incentives are widespread [45].
CSP plant installation is advisable in areas where direct normal irradiation (DNI) levels exceed 6 kWh/m2/day, or 2000 kWh/m2/year [35,45].
Figure 1 shows the average annual solar energy potential by region, in which the Northeast region has the greatest availability. Energy is followed by the Central-West and Southeast regions.
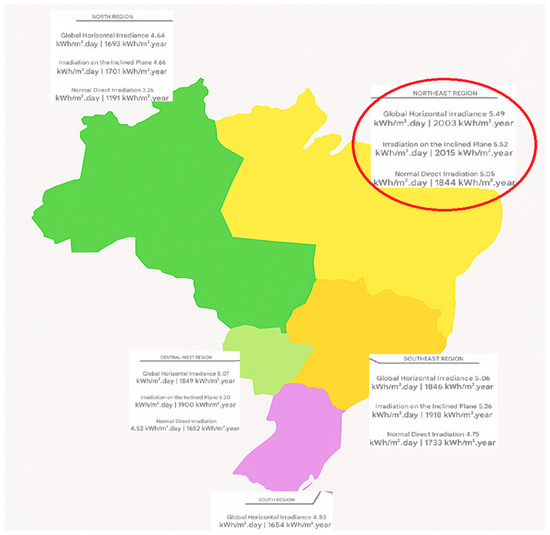
Figure 1.
Solar irradiation by region of Brazil [47].
The cities Belo Horizonte, Bom Jesus da Lapa, Cuiabá, Manaus, and Porto Alegre were selected for their representative regional locations and high solar radiation. While Belo Horizonte and Bom Jesus da Lapa have strong year-round solar potential, Cuiabá benefits from favorable climate conditions. Manaus faces cloud cover challenges but has potential in dry periods, and Porto Alegre offers excellent summer solar radiation despite seasonal variation. In this article, we will use climate data obtained by INPE [47] modeled by SAM for each of the cities as shown in the table below.
2.2. Model for Establishing Assumptions and Evaluating Arrangements
Bom Jesus da Lapa stands out among the cities analyzed, offering the highest solar resource levels—GHI of 5.85 and DNI of 5.87 kWh/m2/day (Table 4). Its semi-arid climate and the use of dry-cooling make it especially well-suited for CSP deployment. The presence of local PV projects also suggests existing grid access, reinforcing its technical viability.

Table 4.
Polarimetric data of cities.
The study used the physical model in SAM to simulate the technical performance of PV and CSP plants (solar tower and parabolic trough) with varying solar multiples and storage durations. Results were integrated into an economic model to calculate the LCOE and assess different solar technology combinations.
2.2.1. CSP System
The CSP model is subdivided into 2 main blocks in SAM: the solar field and the power block. The CSP solar field consists of collectors and the heat transfer fluid (HTF) and can also be composed of a thermal storage system, and/or a backup system based on various fuels. It simply compares the size of the solar field with that of the power block, in terms of thermal energy.
The solar multiple is defined as the ratio between the thermal output of the solar field and the thermal capacity of the power block at the design point, as shown in Equation (1). This parameter effectively compares the scale of the solar field to that of the power block in terms of thermal energy. Solar multiple is characterized as the ratio between the thermal power of the solar field and the thermal power of the power block at the design point, as described in Equation (1). It compares the dimension of the solar field with that of the power block, in terms of thermal power.
where
- Qsf: thermal energy from the solar field.
- Qpb: thermal energy of the power block.
The SAM thermal storage system uses two tanks (hot and cold) and can operate as direct (same fluid) or indirect (different fluids with a heat exchanger). The power block follows a Rankine cycle, where steam generated by heating drives a turbine connected to a generator, with steam subsequently cooled and recycled. Table 5 presents the technical data used to simulate the CSP plant with a parabolic trough.

Table 5.
CSP parameters with parabolic trough.
The system adopts dry cooling to minimize water consumption, with residual water use limited to mirror and heliostat cleaning
2.2.2. CSP System with Solar Tower
The solar tower plant uses a direct thermal storage system with two tanks containing a molten salt mixture (60% NaNO3, 40% KNO3). Sunlight is concentrated by heliostats onto a central receiver to heat the salt, which is stored or used immediately to generate electricity via a 50 MWe Rankine cycle power block. The main design parameters of the tower, receiver, and heliostats of this CSP plant are listed in Table 6.

Table 6.
CSP parameters with solar tower.
2.2.3. Photovoltaic System
For the photovoltaic system model, the modules must be dimensioned and must form series and parallel arrangements to be connected to the inverters. This combination is individual for each plant because current and voltage data must not exceed the specifications of the inverters to which they are connected. Table 7 details the equipment used in the simulation of the photovoltaic system in SAM.

Table 7.
Photovoltaic Plant Data.
The amount of energy generated by a photovoltaic system is greatly impacted by several factors, such as the orientation of the solar modules, the operating temperature of the cells, the presence of total or partial shade, accumulation of dirt, among others. The equation used to calculate the energy produced at the output of the photovoltaic system is:
Ps(t) = η × A × Rs (t)
- Ps (t) = Power generated;
- η = Total system efficiency;
- A = Area of the solar panel;
- Rs (t) = Incident solar radiation, as a function of time.
2.3. Capacity Factor
The capacity factor is a metric that expresses the relationship between the amount of energy generated by a power generation plant and the maximum amount of energy that could be produced if the plant operated continuously at its nominal capacity for a specific period, usually one year. This factor is influenced by variables such as resource availability, system efficiency, and operating conditions. It is an important indicator for evaluating the performance and economic viability of different power generation technologies [44]. The capacity factor (CF) equation is given by the following expression:
2.4. Levelized Cost of Energy (LCOE)
The Levelized Cost of Electricity (LCOE) is a widely adopted metric for assessing the economic viability of various power generation technologies and evaluating grid parity in the context of renewable energy development. It represents the minimum electricity price required for a project’s revenues to match its total costs over its lifetime. Therefore, when the market price of electricity exceeds the LCOE, the project yields a positive return on investment; conversely, if the price falls below the LCOE, the return diminishes and may even result in financial losses [16,23,43,48,49].
Figure 2 shows that between 2010 and 2023, the global weighted average LCOE for CSP plants dropped 70%, driven by a 37% decrease in installed costs, 82% increase in capacity factors, and 48% reduction in operation and maintenance costs. Despite limited plant commissioning in recent years, total installed costs reached USD 6589/kW amid growing energy storage capacities [50].
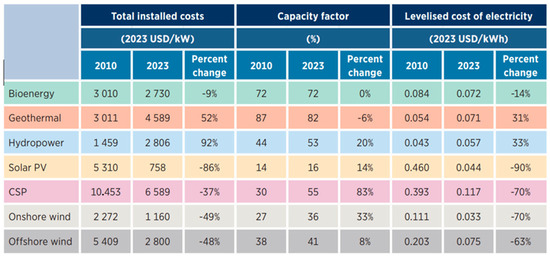
Figure 2.
Installation cost, capacity factor, and LCOE of renewable sources [50].
For combining CSP and PV, the LCOE of the PV/CSP hybrid system is given by the following formula [43]:
- ICCSP—Initial capital cost of the CSP system (USD)
- ICPV—Initial capital cost of the PV system (USD)
- ACCSP—Annual operating and maintenance cost of the CSP system (USD/year)
- ACPV—Annual operating and maintenance cost of the PV system (USD/year)
- ECSP—Annual energy output of the CSP system (MWh/year)
- EPV—Annual energy output of the PV system (MWh/year)
- dCSP—Degradation rate of the CSP system (% per year)
- dPV—Degradation rate of the PV system (% per year)
- i—Discount rate (% per year)
- n—Project lifetime (years)
The financial assumptions used in this analysis reflect realistic market conditions in Brazil. According to the latest regulatory guidelines from ANEEL (Despacho No. 882/2025) [51], the real weighted average cost of capital (WACC) for power generation projects is set at 7.72%. Inflation projections, based on current economic scenarios, range between 3% and 7%, as shown in Figure 3. These values were used to test how sensitive the levelized cost of energy (LCOE) is to shifts in financing conditions, helping to ground the results in a credible and locally relevant context.
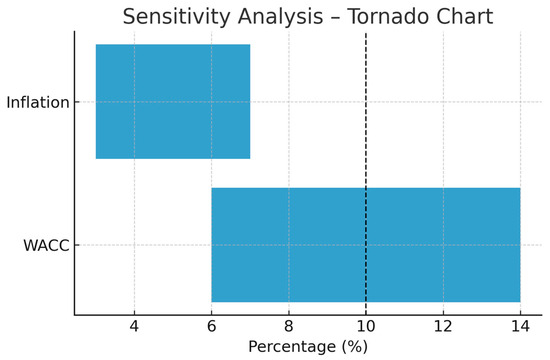
Figure 3.
Sensitivity of LCOE to financial parameters.
3. Results and Discussion
The next section analyzes key parameters like solar multiple and thermal storage capacity to assess their impact on performance and capacity. It also compares power generation and LCOE between a standalone CSP with thermal energy storage and a hybrid CSP-PV system under different configurations.
A default PV degradation rate of 0.5%/year was set across all sites, in line with SAM standards and industry norms. Sensitivity checks using typical ranges (0.2–0.8%/year) showed no significant impact of LCOE in a hybrid system relative to standalone CSP.
3.1. Case A—Purely Photovoltaic System
Table 8 summarizes the model costs and key financial input parameters associated with the photovoltaic plant utilized in this simulation.

Table 8.
Cost of photovoltaic system.
The analysis of solar power generation data in the cities of Belo Horizonte, Bom Jesus da Lapa, Cuiabá, Manaus, and Porto Alegre, presented in Figure 4, shows significant variations according to local climate conditions. Belo Horizonte and Bom Jesus da Lapa have relatively stable power generation throughout the year, with peaks in the summer months. However, Bom Jesus da Lapa stands out for its greater annual constancy, while Belo Horizonte has a slight drop in the winter months.
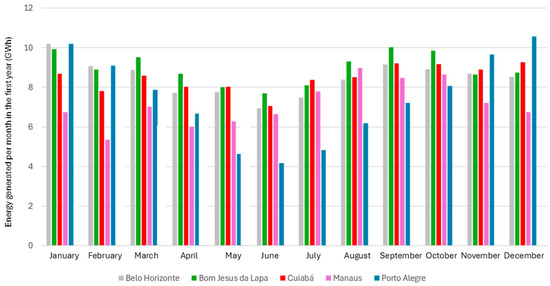
Figure 4.
Result of monthly photovoltaic energy generation by city.
Cuiabá also presents a constant generation, with mild seasonal variations and good performance throughout the year. Manaus, on the other hand, presents the worst performance among the cities analyzed, with great variation and lower generation levels, influenced by the high cloud cover and the humid tropical climate of the Amazon region.
Porto Alegre stands out for its high generation in the summer months, but suffers a sharp drop during the winter, reflecting the climatic characteristics of southern Brazil. In general, cities that receive more direct sunlight and less variation in cloud cover throughout the year present better results in terms of solar energy generation.
The graph in Figure 5 reveals differences in LCOE among five Brazilian cities. Bom Jesus da Lapa has the lowest power generation cost, at 5.73¢/kWh, while Belo Horizonte and Cuiabá have LCOEs of 6.05¢/kWh. Manaus has the highest LCOE, at 7.16¢/kWh, possibly due to logistical challenges. Porto Alegre has an intermediate LCOE of 6.9¢/kWh. Thus, Bom Jesus da Lapa is the most cost-competitive, while Manaus faces the highest power generation costs.
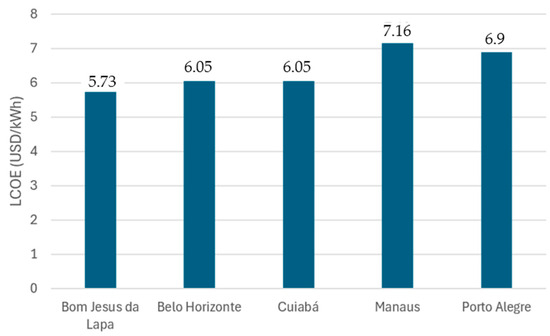
Figure 5.
LCOE of the PV system by city.
3.2. Case B—CSP System with Parabolic Trough
Table 9 presents the costs associated with a parabolic trough-type concentrated solar power (CSP) system. It details the main investment and operating components of the system. These costs range from the installation of the solar field and the thermal energy storage (TES) system to maintenance and operating expenses over the life of the plant.

Table 9.
Direct costs of parabolic trough.
Figure 6 illustrates the potential for energy to be stored and utilized after sunset, particularly during peak demand hours. As both the solar multiple (SM) and thermal energy storage (TES) capacity increase, a noticeable decline in the levelized cost of electricity (LCOE) is observed. This is because a larger solar field represented by a higher SM generates more thermal energy, while the TES system enhances operational efficiency by enabling energy dispatch during periods without solar input. A solar multiple of 4 combined with 12 h of thermal storage minimizes LCOE to 11.66¢/kWh by maximizing daytime excess energy use and extending CSP plant operation into the night, enhancing efficiency, reducing downtime, and lowering costs.
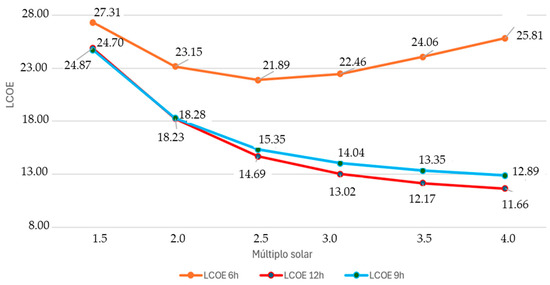
Figure 6.
Variation in LCOE (¢/kWh) as a function of SM and storage hours.
3.3. Case C—CSP System with Solar Tower
The graph in Figure 7 shows the impact of SM and storage capacity (6 h, 9 h, and 12 h) on the LCOE. We can observe that the lowest LCOE is recorded for the solar multiple of 2.5 with 12 h of storage, resulting in 10.22¢/kWh. This value reflects a more efficient use of the generated energy, with greater storage capacity to cover periods without sun, while the highest LCOE is observed for the solar multiple of 4.00 with 6 h of storage, reaching 17.94¢/kWh. This suggests that, despite a higher solar multiple, the lower storage capacity decreases efficiency in the use of the energy generated, increasing the costs defined in Table 10.
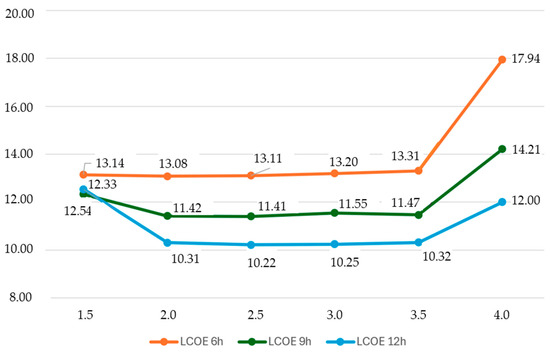
Figure 7.
LCOE results for the solar tower.

Table 10.
Cost of solar tower system.
The analysis shows that system efficiency and LCOE vary significantly with changes in solar multiple and thermal storage capacity. Different combinations of these parameters impact annual energy production, enabling evaluation of each CSP configuration’s performance in terms of energy output and operational costs.
Figure 8 explores the impact of varying technologies, solar multiple (SM) values, and thermal energy storage (TES) durations. The analysis reveals that increasing both SM and TES capacity leads to a substantial rise in annual energy production. Under identical conditions, hybrid CSP/PV configurations consistently outperform standalone CSP systems, primarily due to the additional energy contribution from the PV component. Notably, hybrid setups with an SM between 2.5 and 3.0 combined with moderate thermal storage can generate more energy than CSP-only plants operating with higher SM values (3.5–4.0).
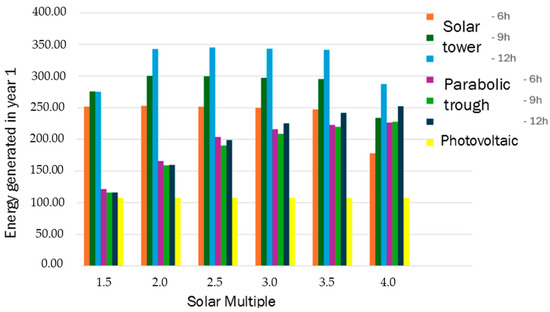
Figure 8.
First-year electricity generation (GWh) according to technology, SM, and TES.
Solar tower technology stands out in power generation due to its superior capacity factor compared to parabolic troughs, reaching up to 345.4 GWh with a solar multiple of 2.5 and 12 h of storage. This is due to the use of heliostats that concentrate sunlight at a single point at the top of the tower, increasing the efficiency of converting heat into electricity. In addition, solar tower plants usually have thermal storage systems, such as molten salt, which allow continuous generation of electricity, even at night or on cloudy days. The capacity factors of solar tower plants range between 40% and 70%, while parabolic troughs reach between 25% and 45%, resulting in significantly higher energy production and making the solar tower a more efficient and competitive option in concentrated solar power.
3.4. CASE D—HYBRID PV/CSP System
After individually dimensioning each solar power plant using SAM software, the next step is to focus on integrating them. First, the nominal electrical output of the CSP/PV hybrid plant must be clearly defined. Since the power generation of the PV plant is variable and occurs only during the hours of sunlight, the projected nominal output must always be related to the CSP plant. The primary goal of optimizing CSP plants is to reduce the LCOE value. To this end, the need to define the solar multiple becomes essential to optimize a CSP plant.
Figure 9 shows solar radiation to a receiver at the top of a tower. In optimized configurations, with a solar multiple of 3, solar tower technology can achieve a capacity factor of up to 89%, which stands out compared to parabolic trough technology, which generally has lower capacity factors. This higher performance makes solar towers more effective at continuous electricity production, especially when combined with thermal storage.
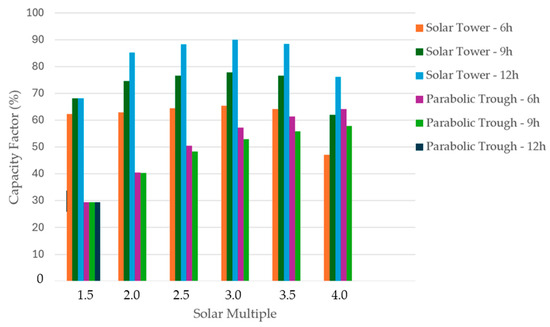
Figure 9.
Variation in CSP capacity factors.
The graph shown in Figure 10 compares different solar energy technologies, revealing significant variations in terms of LCOE and capacity factors. PV technology has the lowest LCOE of 5.73¢/kWh but with the lowest capacity factor of 24.5%. Concentrated solar power (CSP) technologies show higher capacity factors, with the solar tower achieving 89.9%, but with higher LCOEs. Hybrid PV/CSP configurations offer an interesting balance, with the PV/CSP combination with solar tower presenting an LCOE of 9.17¢/kWh and a capacity factor of 51.4%, demonstrating the potential for optimizing costs and operational efficiency in solar energy systems.
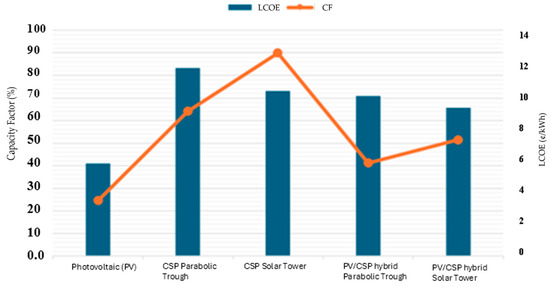
Figure 10.
Summary of capacity factors and LCOE for each configuration.
PV + BESS configurations may outperform CSP in scenarios with short storage durations (typically 2–6 h) and under conditions of accelerated battery cost reductions. A full simulation of PV + BESS systems is planned for future work to assess their comparative performance under Brazilian market conditions.
We didn’t model future market designs, but they could boost the competitiveness of PV + CSP (TES). Auctions that reward firm energy, time-based pricing for evening delivery, and policies that value capacity or carbon all help. These tools improve revenue during post-sunset hours—where thermal storage really matters.
4. Conclusions
This study analyzed the economic feasibility of hybrid PV/CSP plants in five Brazilian cities, highlighting Bom Jesus da Lapa as the best-performing site. Various configurations with parabolic trough and solar tower technologies were simulated, showing that combining CSP with PV can optimize energy generation, reduce costs, and enhance competitiveness in high solar potential regions. The technical and economic results revealed the following:
- ➢
- The analysis of the CSP plant evaluates how variations in solar multiple (SM) and thermal energy storage (TES) duration affect annual electricity generation and the levelized cost of energy (LCOE) across different configurations. The lowest LCOE is achieved with a solar multiple of 2.5 combined with 12 h of thermal storage, resulting in 10.22¢/kWh using the solar tower technology, while parabolic trough with a solar multiple equal to 4 and a thermal storage of 12 h, the LCOE reaches its lowest value, of 11.66¢/kWh;
- ➢
- Within the cities studied, (Belo Horizonte, Bom Jesus da Lapa, Cuiabá, Manaus, and Porto Alegre) Bom Jesus da Lapa presented the best results, with the total energy supplied by the PV/CSP hybrid plant throughout the year of 452 GWh with solar tower technology and the LCOE equal to 9.17¢/kWh.
The results demonstrate the techno-economic viability of the proposed hybrid CSP/PV configuration within the Brazilian context, based on local solar resource data, cost structures, and financial parameters. The analysis indicates that combining both technologies can reduce the levelized cost of energy (LCOE) and improve the generation profile throughout the day. Furthermore, the integration of CSP and PV technologies enables a more balanced and resilient energy supply. While PV provides cost-effective generation during peak sunlight hours, CSP—with thermal energy storage—ensures dispatchable power during periods of low irradiance or after sunset. This complementarity enhances grid reliability and supports the transition to low-carbon energy systems. The techno-economic performance of the hybrid system also aligns with Brazil’s renewable energy targets and regulatory framework, highlighting its potential to inform future investment strategies and policy design aimed at increasing renewable penetration and system flexibility.
In Brazil’s Northeast, where sunshine is abundant and the need for reliable energy continues to grow, dispatchable power has become increasingly important in energy planning. Public auctions already reflect this shift, and hourly market prices (PLD) in the region can exceed US$47,32/MWh during high-demand periods. In this context, hybrid systems like CSP/PV with thermal storage offer a smart and adaptable solution—delivering energy when it’s most needed and helping build a cleaner, more balanced, and resilient energy mix.
Limitations and Future Work
The study presents relevant limitations, such as its focus on a single region, simplified cost estimates, and the absence of a comprehensive environmental life cycle assessment. In addition, a detailed comparison with photovoltaic systems combined with battery storage (PV + BESS) was not conducted, nor were hourly dispatch modeling or metrics related to water and land use included. Policy and grid integration aspects were mentioned but not quantitatively modeled. For future work, we suggest exploring dynamic policy scenarios, more comprehensive environmental analyses, advanced storage strategies, and comparative studies in other regions with high solar potential to assess broader applicability. Acknowledging these limitations enhances the transparency of the study and opens paths to deepen knowledge, foster interdisciplinary collaboration, and support more effective decision-making in the energy transition.
In a future outlook, integrating green hydrogen could enhance sector coupling and enable long-duration energy storage; however, this assessment falls outside the scope of the present study, which focuses on PV + CSP systems.
Author Contributions
Conceptualization, T.d.P.C.; methodology, T.d.P.C.; software, T.d.P.C.; validation, T.d.P.C. and F.A.T.; formal analysis, T.d.P.C.; investigation, T.d.P.C.; resources, T.d.P.C.; data curation, T.d.P.C.; writing—original draft preparation, T.d.P.C.; writing—review and editing, T.d.P.C. and F.A.T.; visualization, T.d.P.C. and F.A.T.; supervision, M.S.S., E.A.T. and F.A.T.; project administration, M.S.S., E.A.T. and F.A.T. All authors have read and agreed to the published version of the manuscript.
Funding
This research received no external funding.
Institutional Review Board Statement
Not applicable.
Informed Consent Statement
Not applicable.
Data Availability Statement
No new data were created or analyzed in this study.
Acknowledgments
The authors thank the support of FAPESB PIE 008/2022 for the support.
Conflicts of Interest
The authors declare no conflict of interest.
Glossary
| Symbols | |
| ¢ | cents |
| °C | degree Celsius |
| m2 | Square meter |
| η | total system efficiency |
| $ | dollar |
| i | discount rate |
| N | The plant is expected to live a useful life |
| Nomenclatures | |
| Qpls | thermal energy from the solar field |
| Qpb | thermal energy of the power block |
| MWt | thermal megawatt |
| NaNO3 | sodium nitrate |
| KNO3 | potassium nitrate |
| Ps (t) | generated power |
| A | solar panel area |
| Rs (t) | incident solar delay, as a function of time |
| ICCSP | Initial capital cost of the CSP system (USD) |
| ICPV | Initial capital cost of the PV system (USD) |
| ACCSP | Annual operating and maintenance cost of the CSP system (USD/year) |
| ACPV | Annual operating and maintenance cost of the PV system (USD/year) |
| ECSP | Annual energy output of the CSP system (MWh/year) |
| EPV | Annual energy output of the PV system (MWh/year) |
| dCSP | Degradation rate of the CSP system (% per year) |
| dPV | Degradation rate of the PV system (% per year) |
| i | Discount rate (% per year) |
| n | Project lifetime (years) |
| Abbreviations | |
| CSP | Concentrated solar power |
| PV | Photovoltaic |
| GW | Gigawatt |
| EPE | Energy Research Company |
| LCOE | Levelized Cost Of Energy |
| O&M | Operation and Maintenance |
| CAPEX | CAPital EXPenditure |
| OPEX | Operational Expenditure |
| NPV | Net Present Value |
| LNG | Liquefied Natural Gas |
| DNI | Direct Normal Irradiation |
| USD | United States Dollar |
| kWh | Kilowatt hour |
| SM | Solar Multiple |
| REN | Normative Resolution |
| SAM | System Advisor Model |
| NREL | National Renewable Energy Laboratory |
| TRANSYS | Transient System Simulation Tool |
| MW | MEGAWATT |
| MWe | MEGAWATT equivalent |
| ANEEL | National Electric Energy Agency |
| CESP | Sao Paulo Energy Company |
| GHG | Greenhouse Gases |
| MWhyr | MEGAWATT hour per year |
| INMET | National Institute of Meteorology |
| HTF | Heat Fluid |
| FC | Capacity Factor |
| TES | Thermal Energy Storage |
References
- International Renewable Energy Agency. Renewable Capacity Statistics 2023, Statistiques de Capacité Renouvelable 2023, Estadísticas de Capacidad Renovable 2023; International Renewable Energy Agency: Abu Dhabi, United Arab Emirates, 2023.
- Caldas, T.D.P.; Santos, A.Á.B. Proposal for revision of Brazilian resolution 687/15 to expand distributed generation through photovoltaic systems. World Rev. Sci. Technol. Sustain. Dev. 2022, 18, 213. [Google Scholar] [CrossRef]
- Babay, A.M.; Adar, M.; Chebak, A.; Mabrouki, M. Forecasting green hydrogen production: An assessment of renewable energy systems using deep learning and statistical methods. Fuel 2025, 381, 133496. [Google Scholar] [CrossRef]
- Agência Nacional de Energia Elétrica—ANEEL, Resolução Normativa N° 1.059. 2023. Available online: https://www2.aneel.gov.br/cedoc/ren20231059.pdf (accessed on 26 June 2025).
- Empresa de Pesquisa Energética. Estudos de planejamento da expansão—Usinas Híbridas. 2018. Available online: https://www.epe.gov.br/sites-pt/publicacoes-dados-abertos/publicacoes/PublicacoesArquivos/publicacao-232/topico-393/NT%20EPE-DEE-NT-011-2018-r0%20%28Usinas%20h%C3%ADbridas%29.pdf (accessed on 10 June 2025).
- Petrollese, M.; Cocco, D. Optimal design of a hybrid CSP-PV plant for achieving the full dispatchability of solar energy power plants. Sol. Energy 2016, 137, 477–489. [Google Scholar] [CrossRef]
- Giaconia, A.; Grena, R. A model of integration between PV and thermal CSP technologies. Sol. Energy 2021, 224, 149–159. [Google Scholar] [CrossRef]
- Pilotti, L.; Colombari, M.; Castelli, A.; Binotti, M.; Giaconia, A.; Martelli, E. Simultaneous design and operational optimization of hybrid CSP-PV plants. Appl. Energy 2022, 331, 120369. [Google Scholar] [CrossRef]
- Yang, Y.; Guo, S.; Liu, Q.; Li, R. Day-ahead scheduling for a new wind-CSP hybrid system. Energy Procedia 2019, 158, 6254–6259. [Google Scholar] [CrossRef]
- Soria, R.; Portugal-Pereira, J.; Szklo, A.; Milani, R.; Schaeffer, R. Hybrid concentrated solar power (CSP)–biomass plants in a semiarid region: A strategy for CSP deployment in Brazil. Energy Policy 2015, 86, 57–72. [Google Scholar] [CrossRef]
- Gutiérrez-Alvarez, R.; Guerra, K.; Haro, P. Market profitability of CSP-biomass hybrid power plants: Towards a firm supply of renewable energy. Appl. Energy 2023, 335, 120754. [Google Scholar] [CrossRef]
- Qiu, B.; Li, G.; Wei, X.; Liu, M.; Yan, J. System design and operation optimization on the hybrid system with nuclear power, concentrated solar, and thermal storage. Ann. Nucl. Energy 2023, 189, 109862. [Google Scholar] [CrossRef]
- Tranamil-Maripe, Y.; Cardemil, J.M.; Escobar, R.; Morata, D.; Sarmiento-Laurel, C. Assessing the Hybridization of an Existing Geothermal Plant by Coupling a CSP System for Increasing Power Generation. Energies 2022, 15, 1961. [Google Scholar] [CrossRef]
- Aguilar-Jiménez, J.; Velázquez, N.; Acuña, A.; Cota, R.; González, E.; González, L.; López, R.; Islas, S. Techno-economic analysis of a hybrid PV-CSP system with thermal energy storage applied to isolated microgrids. Sol. Energy 2018, 174, 55–65. [Google Scholar] [CrossRef]
- Li, F.; Li, C.; Sun, K.; Zhang, J.; Li, H. Capacity configuration of hybrid CSP/PV plant for economical application of solar energy. Chin. J. Electr. Eng. 2020, 6, 19–29. [Google Scholar] [CrossRef]
- Ling-Zhi, R.; Xin-Gang, Z.; Yu-Zhuo, Z.; Yan-Bin, L. The economic performance of concentrated solar power industry in China. J. Clean. Prod. 2018, 205, 799–813. [Google Scholar] [CrossRef]
- Petrollese, M.; Cocco, D. Techno-economic assessment of hybrid CSP-biogas power plants. Renew. Energy 2020, 155, 420–431. [Google Scholar] [CrossRef]
- Miguel, G.S.; Corona, B. Economic viability of concentrated solar power under different regulatory frameworks in Spain. Renew. Sustain. Energy Rev. 2018, 91, 205–218. [Google Scholar] [CrossRef]
- Hasni, S.; Platzer, W.J. Case study on decarbonization strategies for LNG export terminals using heat and power from CSP/PV hybrid plants. Sol. Energy Adv. 2023, 3, 100041. [Google Scholar] [CrossRef]
- Aly, A.; Bernardos, A.; Fernandez-Peruchena, C.M.; Jensen, S.S.; Pedersen, A.B. Is Concentrated Solar Power (CSP) a feasible option for Sub-Saharan Africa? Investigating the techno-economic feasibility of CSP in Tanzania. Renew. Energy 2019, 135, 1224–1240. [Google Scholar] [CrossRef]
- Boretti, A.; Castelletto, S. Cost and performance of CSP and PV plants of capacity above 100 MW operating in the United States of America. Renew. Energy Focus 2021, 39, 90–98. [Google Scholar] [CrossRef]
- Ziyati, D.; Dollet, A.; Flamant, G.; Volut, Y.; Guillot, E.; Vossier, A. A multiphysics model of large-scale compact PV–CSP hybrid plants. Appl. Energy 2021, 288, 116644. [Google Scholar] [CrossRef]
- Hassani, S.E.; Ouali, H.A.L.; Moussaoui, M.A.; Mezrhab, A. Techno-Economic Analysis of a Hybrid CSP/PV Plants in the Eastern Region of Morocco. Appl. Sol. Energy 2021, 57, 297–309. [Google Scholar] [CrossRef]
- Sumayli, H.; El-Leathy, A.; Danish, S.N.; Al-Ansary, H.; Almutairi, Z.; Al-Suhaibani, Z.; Saleh, N.S.; Saeed, R.S.; Alswaiyd, A.; Djajadiwinata, E.; et al. Integrated CSP-PV hybrid solar power plant for two cities in Saudi Arabia. Case Stud. Therm. Eng. 2023, 44, 102835. [Google Scholar] [CrossRef]
- Gasa, G.; Lopez-Roman, A.; Prieto, C.; Cabeza, L.F. Life Cycle Assessment (LCA) of a Concentrating Solar Power (CSP) Plant in Tower Configuration with and without Thermal Energy Storage (TES). Sustainability 2021, 13, 3672. [Google Scholar] [CrossRef]
- Klein, S.J.W.; Rubin, E.S. Life cycle assessment of greenhouse gas emissions, water and land use for concentrated solar power plants with different energy backup systems. Energy Policy 2013, 63, 935–950. [Google Scholar] [CrossRef]
- Kumar, A.; Prakash, O.; Dube, A. A review on progress of concentrated solar power in India. Renew. Sustain. Energy Rev. 2017, 79, 304–307. [Google Scholar] [CrossRef]
- Pan, C.A.; Dinter, F. Combination of PV and central receiver CSP plants for base load power generation in South Africa. Sol. Energy 2017, 146, 379–388. [Google Scholar] [CrossRef]
- Fichter, T.; Soria, R.; Szklo, A.; Schaeffer, R.; Lucena, A.F. Assessing the potential role of concentrated solar power (CSP) for the northeast power system of Brazil using a detailed power system model. Energy 2017, 121, 695–715. [Google Scholar] [CrossRef]
- National Renewable Energy Laboratory—NREL. System Advisor Model (SAM); NREL: Golden, CO, USA, 2022. Available online: https://sam.nrel.gov/download.html (accessed on 22 June 2025).
- Elbeh, M.B.; Sleiti, A.K. Analysis and optimization of concentrated solar power plant for application in arid climate. Energy Sci. Eng. 2021, 9, 784–797. [Google Scholar] [CrossRef]
- Soria, R.; Schaeffer, R.; Szklo, A. Configuração para operação de plantas heliotérmicas CSP com armazenamento de calor e hibridização no Brasil com o software SAM. Rev. Bras. Energ. Sol. 2014, 5, 1–10. Available online: https://rbens.emnuvens.com.br/rbens/article/view/102/102 (accessed on 29 June 2025).
- Parent, P.-A.; Mirzania, P.; Balta-Ozkan, N.; King, P. Post subsidy conditions: Evaluating the techno-economic performance of concentrating solar power in Spain. Sol. Energy 2021, 218, 571–586. [Google Scholar] [CrossRef]
- Liaqat, K.; Ordonez, J.C.; Schaefer, L.; Zolan, A.J. Design and Techno-Economic Analysis of a 150-MW Hybrid CSP-PV Plant. In Proceedings of the 2023 IEEE Conference on Technologies for Sustainability (SusTech), Portland, OR, USA, 19–22 April 2023. [Google Scholar] [CrossRef]
- Malagueta, D.; Szklo, A.; Soria, R.; Dutra, R.; Schaeffer, R.; Borba, B.S.M.C. Potential and impacts of Concentrated Solar Power (CSP) integration in the Brazilian electric power system. Renew. Energy 2014, 68, 223–235. [Google Scholar] [CrossRef]
- Companhia Hidro Elétrica do São Franciso—CHESF. 2016. Available online: https://www.chesf.com.br/pdi/Documents/ComoParticipar/ChamadaPublica022016/Edital_CHESF_PD_para_Chamada_19_ANEEL_DTG__finalissima.pdf (accessed on 29 June 2025).
- Wagner, M.J.; Zhu, G. A Generic CSP Performance Model for NREL’s System Advisor Model. 2011. Available online: https://www.nrel.gov/docs/fy11osti/52473.pdf (accessed on 20 June 2025).
- Mohammadi, K.; Khorasanizadeh, H. The potential and deployment viability of concentrated solar power (CSP) in Iran. Energy Strategy Rev. 2019, 24, 358–369. [Google Scholar] [CrossRef]
- Gakkhar, N.; Soni, M. Techno-economic Parametric Assessment of CSP Power Generations Technologies in India. Energy Procedia 2014, 54, 152–160. [Google Scholar] [CrossRef]
- Shouman, E.R.; Khattab, N. Future economic of concentrating solar power (CSP) for electricity generation in Egypt. Renew. Sustain. Energy Rev. 2015, 42, 1119–1127. [Google Scholar] [CrossRef]
- Islam, T.; Huda, N.; Saidur, R. Current energy mix and techno-economic analysis of concentrating solar power (CSP) technologies in Malaysia. Renew. Energy 2019, 140, 789–806. [Google Scholar] [CrossRef]
- Zurita, A.; Mata-Torres, C.; Valenzuela, C.; Cardemil, J.M.; Escobar, R.A. Techno-economic analysis of a hybrid CSP + PV plant integrated with TES and BESS in Northern Chile. AIP Conf. Proc. 2018, 2033, 180013. [Google Scholar] [CrossRef]
- Elfeky, K.E.; Wang, Q. Techno-environ-economic assessment of photovoltaic and CSP with storage systems in China and Egypt under various climatic conditions. Renew. Energy 2023, 215, 118930. [Google Scholar] [CrossRef]
- Agyekum, E.B.; Velkin, V.I. Optimization and techno-economic assessment of concentrated solar power (CSP) in South-Western Africa: A case study on Ghana. Sustain. Energy Technol. Assess. 2020, 40, 100763. [Google Scholar] [CrossRef]
- de Souza, L.E.V.; Cavalcante, A.M.G. Concentrated solar power depolyment in emerging economies: The cases of China and Brazil. Renew. Sustain. Energy Rev. 2017, 72, 1094–1103. [Google Scholar] [CrossRef]
- Jannuzzi, G.d.M.; de Melo, C.A. Grid-connected photovoltaic in Brazil: Policies and potential impacts for 2030. Energy Sustain. Dev. 2013, 17, 40–46. [Google Scholar] [CrossRef]
- Pereira, E.B.; Martins, F.R.; Gonçalves, A.R.; Costa, R.S.; Lima, F.J.L.; Ruther, R.; Abreu, S.L.; Tiepolo, G.M.; Pereira, S.V.; Souza, J.G. Atlas Brasileiro de Energia Solar; Instituto Nacional de Pesquisas Espaciais—INPE: São José dos Campos, Brazil, 2017; p. 88. Available online: http://mtc-m21b.sid.inpe.br/col/sid.inpe.br/mtc-m21b/2017/08.15.18.20/doc/thisInformationItemHomePage.html (accessed on 20 August 2025).
- Rodríguez-Gallegos, C.D.; Liu, H.; Gandhi, O.; Singh, J.P.; Krishnamurthy, V.; Kumar, A.; Stein, J.S.; Wang, S.; Li, L.; Reindl, T.; et al. Global Techno-Economic Performance of Bifacial and Tracking Photovoltaic Systems. Joule 2020, 4, 1514–1541. [Google Scholar] [CrossRef]
- Shimura, S.; Herrero, R.; Zuffo, M.K.; Grimoni, J.A.B. Production costs estimation in photovoltaic power plants using reliability. Sol. Energy 2016, 133, 294–304. [Google Scholar] [CrossRef]
- International Renewable Energy Agency—IRENA. Renewable Power Generation Costs in 2023; IRENA: Abu Dhabi, United Arab Emirates, 2023. [Google Scholar]
- Agência Nacional de Energia Elétrica—Aneel, Despacho no 1.296, de 23 de Abril de 2024. Available online: https://www2.aneel.gov.br/cedoc/dsp20241296ti.pdf (accessed on 20 August 2025).
Disclaimer/Publisher’s Note: The statements, opinions and data contained in all publications are solely those of the individual author(s) and contributor(s) and not of MDPI and/or the editor(s). MDPI and/or the editor(s) disclaim responsibility for any injury to people or property resulting from any ideas, methods, instructions or products referred to in the content. |
© 2025 by the authors. Licensee MDPI, Basel, Switzerland. This article is an open access article distributed under the terms and conditions of the Creative Commons Attribution (CC BY) license (https://creativecommons.org/licenses/by/4.0/).