Article

Ozonation of Reverse Osmosis Concentrate from Municipal Wastewater Reclamation Processes: Ozone Demand, Molecular Weight Distribution, UV/Fluorescence Characteristics, and Microalgal Growth Potential

by
Yuchang Chi
1,†,
Zibin Xu
2,† and
Nan Huang
1,*
1
National Engineering Laboratory for Advanced Municipal Wastewater Treatment and Reuse Technology, College of Environmental Science and Engineering, Beijing University of Technology, Beijing 100124, China
2
Liaoning Transportation Research Institute, Shenyang 110000, China
*
Author to whom correspondence should be addressed.
These authors contributed equally to this work.
Sustainability 2025, 17(21), 9564; https://doi.org/10.3390/su17219564
Submission received: 24 September 2025 / Revised: 16 October 2025 / Accepted: 19 October 2025 / Published: 28 October 2025

Abstract

To address the challenge of treating reverse osmosis concentrate (ROC) in municipal wastewater reclamation processes, this study systematically investigated changes in ozone demand, organic compound molecular weight distribution, UV/fluorescence characteristics, and microalgal growth potential during ozone treatment of ROC. The ROC contained fast-reacting substances and had an instantaneous ozone demand of 6.3 mg/L. The chemical oxygen demand (COD) and total organic carbon were partially removed, and the COD/five-day biochemical oxygen demand ratio increased slightly during the ozonation process. The molecular weight components shifted considerably during ozonation: the 300 Da–1000 Da components became dominant (51.6–72.3%), while the 1000 Da–4000 Da and <300 Da components were partially or completely removed. The maximum absorbance of the ROC peaked at 270 nm. At an ozone dosage of 84 mg/L, the UV254 and UV270 removal rates reached 76.9% and 86.5%, respectively. The three-dimensional fluorescence spectra showed that ozone effectively removed tryptophan-type aromatic proteins, fulvic acid-type substances, aromatic proteins, soluble microbial metabolites, and humic acid-type substances from the concentrate (84.6–88.9%), but only removed a minimal amount of the tyrosine-type aromatic protein (7.4%). The UV254 at different molecular weights and the fluorescence area integrals across regions declined rapidly initially, then slowed gradually, correlating with the rapid reaction of UV/fluorescence chromophore-containing substances in ROC. Studies on microalgal growth potential indicate that ozonation increased the maximum algal density (K) in ROC (48.9–91.7%), while ozone/coagulation effectively reduced K (35.1–76.6%). This occurs because ozone converts organic phosphonate antiscalants in ROC into more readily absorbable inorganic phosphorus, whereas ozone/coagulation effectively removes total phosphorus from water. These results can guide the safe disposal of ROC and facilitate sustainable reclamation of municipal wastewater.

1. Introduction

In recent years, rising demands for reclaimed water quality have driven the widespread adoption of membrane technology. Among these, reverse osmosis (RO) technology effectively removes suspended solids, dissolved organic matter, and inorganic salts from water. Consequently, it is extensively employed in applications requiring high-quality reclaimed water, such as potable reuse [1,2], boiler feedwater [3], and water for the electronics industry [4]. When wastewater enters the RO system, it produces approximately 75% permeate and 25% concentrate [5,6]. This reverse osmosis concentrate (ROC) is difficult to treat and represents a major challenge for RO technology.
The ROC derived from RO of municipal secondary effluent is known for its high pollutant concentrations, high chemical oxygen demand (COD) (generally higher than 100 mg/L) [7,8,9], and high total organic carbon (TOC) (up to 40 mg/L) [10]. It is also known for its high salinity, with total dissolved solids (TDS) concentrations frequently exceeding 1000 mg/L [9,10,11], and ranging up to tens of thousands of mg/L [12,13]. Because the RO feedwater has already undergone biological treatment, most biodegradable pollutants have been removed. Consequently, the resulting concentrate has limited biodegradability and resists further degradation. It has high biotoxicity, and Tang et al. [14] reported that the ROC from a reclaimed water plant had a genotoxicity that was between 3.5 and 5 times greater than that of its feedwater. Furthermore, the genotoxicity per unit dissolved organic carbon (DOC) was nearly 1.5 times greater than that of the feedwater. The high toxicity is attributed to the concentration of feedwater contaminants in the ROC and chemicals (e.g., non-oxidizing antimicrobials and antiscalants) added to maintain the stability of the RO system [14].
Various chemical oxidation techniques are widely used in wastewater treatment processes, including ozonation. A mature technology, ozonation is extensively applied in industrial wastewater treatment [15,16,17], municipal wastewater advanced treatment [18,19], and leachate treatment [20] because of its strong oxidation capabilities and ability to remove color and odor. The reaction between the ozone and the substances in the ROC involves two pathways, namely direct oxidation by ozone molecules and indirect oxidation by hydroxyl radicals. Ozone molecules are selective oxidizing agents. The •OH radicals generated during the ozonation process are non-selective oxidizing agents with exceptionally strong oxidizing capacity, and higher redox potentials than ozone molecules. Ozonation changes the structure and properties of pollutants, and enhances their biodegradability and bioavailability [21]. Consequently, researchers have developed combined ozone technologies, including ozone/coagulation, to achieve improved removal of pollutants like organic matter, nitrogen, and phosphorus [22].
Ozonation technology has potential for treating ROC. While studies of ROC ozonation have already provided useful information about successful removals of COD and the five-day biochemical oxygen demand (BOD5), there are still gaps in the research. For example, the ozone demand of ROC has not been systematically evaluated. The instantaneous ozone demand (IOD) and the transferred ozone dosage (TOD) represent the concentrations of fast- and slow-reacting substances in water, and may be used to assess the treatability of wastewater by ozonation and predict the ozone dosage. There is limited research about how the distribution of the molecular weight of organic matter might change during ozonation. This is important because this distribution directly influences the selection and operational efficiency of processes that follow, particularly coagulation treatment and activated carbon adsorption. Furthermore, the changes in the UV/fluorescence of ROC during ozonation processes have not been systematically analyzed. Research in this area would be useful as UV/fluorescence signatures can identify pollutant types and highlight migration and transformations. They also correlate with water quality safety.
Organic phosphonate antiscalants are employed to maintain the stability of RO systems and prevent inorganic scaling of RO membranes [14,23,24]. Therefore, the changes in the microalgal growth potential during ozonation or combined ozone processes should be examined. Organic phosphonate antiscalants offer advantages over inorganic polyphosphate antiscalants in that they are more chemically stable, resistant to hydrolysis, tolerant of high-temperatures, and have a high capacity to inhibit scale [25,26]. However, organic phosphonate antiscalants are entirely transferred into the ROC, leading to high organic phosphorus concentrations that provide nutrients for microalgal growth. So, although ozonation can remove COD from ROC, it converts organic phosphonates into bioavailable inorganic phosphates, causing an increase in the microalgal growth potential in the ROC, and potentially exacerbating the risk of eutrophication. Therefore, the microalgal growth potential in ROC treated by ozonation and ozone/coagulation treatments should be explored in detail.
This study investigates the removal and transformation characteristics of organic matter in ROC by ozonation. Key parameters examined include the ozone demand (TOD, IOD) of ROC, changes in COD, BOD5, and TOC during the ozonation process, and shifts in the molecular weight distribution of organic compounds. Additionally, studies were conducted on changes in organic compounds containing chromophores (UV254, UV270) and those exhibiting fluorescence signals. To assess changes in eutrophication risk, the study investigated alterations in microalgal growth potential after ozone treatment and ozone/coagulation treatment of ROC containing organic phosphonate antiscalants.

2. Materials and Methods

2.1. Chemicals and Materials

Sodium sulfate (Na2SO4) was purchased from the Lanyi Chemical Products Co., Ltd. (Beijing, China). Anhydrous potassium dihydrogen phosphate (KH2PO4) was purchased from the Merial Chemical Technology Co., Ltd. (Shanghai, China). Polysulfone with molecular weights of 4.3 kDa, 6.5 kDa, 11 kDa, and 35 kDa was purchased from Scientific Polymer Products Inc., Ontario, NY, USA. A 50% aqueous solution of 2-Phosphonobutane-1,2,4-tricarboxylic acid (PBTCA) was purchased from the Tokyo Chemical Industry Co., Ltd. (Tokyo, Japan). A 60% aqueous solution of 1-Hydroxyethane-1,1-diphosphonic acid (HEDP) was purchased from the Bailingwei Technology Co., Ltd. (Beijing, China).
We sourced the ROC for this study from a reclaimed water plant in Beijing that uses a microfiltration-reverse osmosis process and treats secondary effluent from a municipal wastewater treatment plant. A flow diagram of the plant’s processes is shown in Figure 1. The main water quality parameters of the ROC used in this study are shown in Table 1.

2.2. Experimental Procedure

2.2.1. Semi-Continuous Ozonation Experiment

Ozone gas was generated from high-purity oxygen using an ozone generator (Beijing Shanmei Shuimei Environmental Protection High-Tech Co., Ltd., Beijing, China) at a rate of 20 g/h. The ozone gas was sequentially passed through a flow meter, an ozone inlet concentration monitor, a 1 L aeration reaction column, an anhydrous CaCl2 desiccant, an ozone outlet concentration monitor, and an exhaust gas treatment unit at a flow rate of 1.0 L/min.

2.2.2. Coagulation Experiment

The coagulant in the coagulation experiment was polyaluminium chloride (PAC) at a dose of 50 mg/L. The coagulation experiment was conducted using a six-cell coagulation mixer (Wuhan Meiyu Instrument Co., Ltd., Wuhan, China, model MY3000-6N), following the method described by Xu et al. [22].

2.2.3. Microalgae Growth Potential Experiment

We measured and evaluated the microalgae growth potential in ROC that contained two organic phosphonate antiscalants (PBTCA and HEDP) before and after ozonation and ozone/coagulation treatment.
We chose Scenedesmus sp. LX1 (CGMCC 3036) and Chlorella sp. ZTY4 (CGMCC 12521) as the algal species for this experiment as they are common in eutrophic aquatic environments, can adapt and grow in the water treatment environment, and were reported previously as the main algal species in ROC [27,28]. The microalgae culture media and cultivation conditions are described in detail by Huang et al. [29].
Wu et al. [30] observed that microalgae exhibit excessive phosphorus uptake during cultivation, and can continue growing under phosphorus-deprived conditions by utilizing endogenous phosphorus. To avoid interference, this experiment maintained microalgae at the logarithmic growth phase and continued cultivation under phosphorus-deficient conditions for two days to eliminate the influence of endogenous phosphorus.
A logistic model (Equation (1)) was used to determine the maximum algal density that the water samples could support.
N t = K 1 + e a r t
where Nt represents the algal density (cells/mL) at time t, and t represents the culture duration. K represents the maximum algal density (cells/mL) the water sample can support, a represents a model parameter, and r represents the intrinsic growth rate (d−1).

2.3. Analytical Method

The total mass of ozone transferred into a unit volume of water is known as the transferred ozone dose (TOD). It equals the sum of the mass of ozone dissolved, consumed, and decomposed in a unit volume of water [31]. All the ozone dosages in this paper refer to the TOD. The TOD is calculated with Equation (2) from data for the ozone inlet concentration, the ozone outlet concentration, the ozone gas flow rate, and the volume of the reaction solution that are recorded during the semi-continuous ozonation reaction. The ozone inlet and outlet concentrations were recorded with a data logger (Zibo Zhipu Automation Technology Co., Ltd., Zibo, China, model ZP5000-4) at 12 s intervals. The flow rate of the ozone gas was 1 L/min. The volume of the aeration reactor was 1 L. In a batch liquid-phase ozone reaction, the TOD corresponds to the ozone concentration in the solution in the initial liquid phase.
T O D = 0 T C O 3 , i n C O 3 , o u t · q O 3 V · d t
where TOD represents the ozone dosage (mg/L), T represents the reaction time (s), C O 3 , i n represents the ozone inlet concentration at any point during the reaction (mg/L), C O 3 , o u t represents the ozone outlet concentration at any point during the reaction (mg/L), q O 3 represents the ozone gas flow rate (L/s), and V represents the volume of the aeration reaction (L).
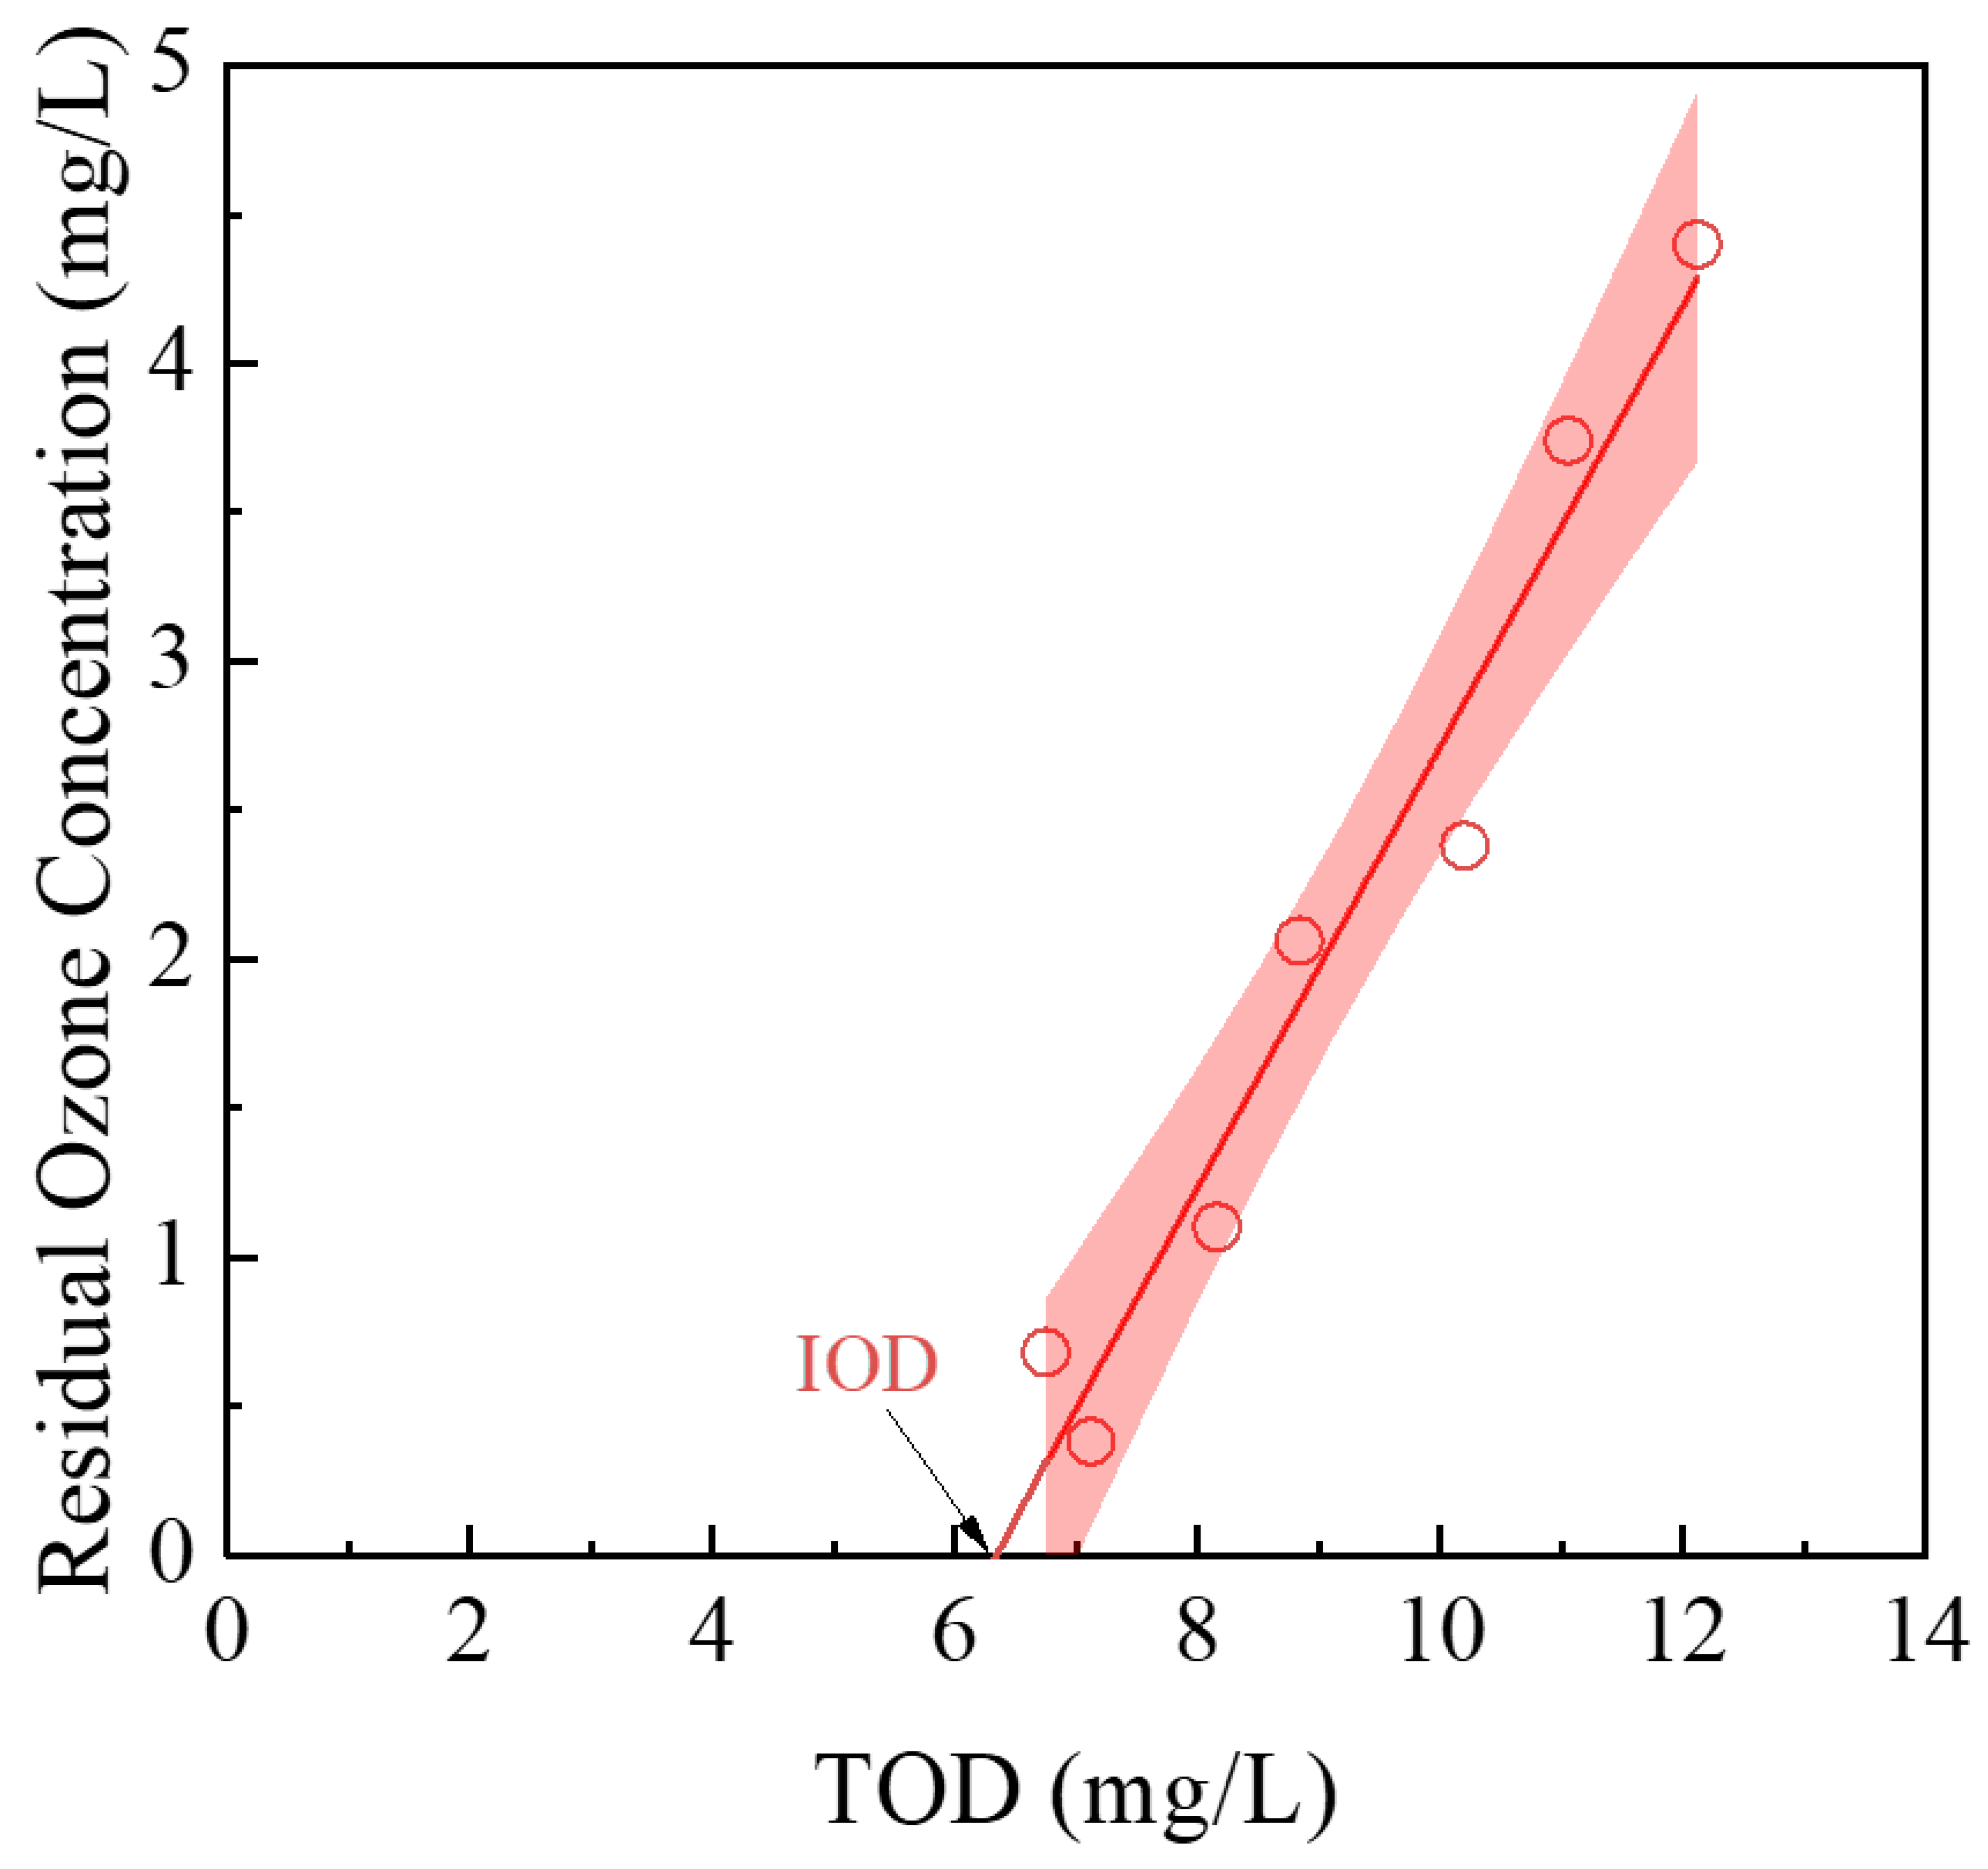
The IOD value of the ROC was determined to quantify the contaminants in ROC that reacted rapidly with ozone, using a method based on Xi et al. [32]. An ozone liquid-phase concentration as high as 40–45 mg/L water (0.83–0.94 mmol/Lwater) can be achieved in an ozone-saturated solution by injecting ozone gas into water continuously for one hour under ice bath conditions. A quantity of ROC was placed into a conical flask and liquid-phase ozone solutions with different concentrations were added. After reacting for 5 s, the residual liquid-phase ozone concentration in the solution was measured promptly. The resulting data points were plotted on a graph with TOD as the x-axis and the residual liquid-phase ozone concentration as the y-axis. The IOD value of the ROC was the value at the point where the fitted straight line intersected the x-axis.
The COD and BOD5 values were determined as described in National Environmental Protection Standards of the People’s Republic of China HJ 828-2017 and HJ 505-2009 [33,34]. The TOC was determined using a total organic carbon analyzer (Shimadzu Corporation, Kyoto, Japan). The total and inorganic phosphorus concentrations were determined using the molybdenum-antimony spectrophotometric method. The UV absorption spectra of the ROC were measured using a UV-visible spectrophotometer (Shimadzu Corporation, Japan). The three-dimensional fluorescence spectra of the organic compounds were determined using a fluorescence spectrophotometer (Hitachi, Ltd., Tokyo, Japan), Japan. Both the molecular weight distribution of TOC and the molecular weight distribution of UV-absorbing organic compounds in the ROC were determined using a high-performance liquid gel chromatography system (Shimadzu Corporation, Japan).
The peaks on the curves of the molecular weight distribution of the TOC and of the UV-absorbing organic compounds in the ROC were separated using Peakfit software (version 4.12), so that the changes in the components of the organic compounds with different molecular weights could be quantified. The distribution curves were divided into multiple sub-peaks using specific parameter settings from a previous study [27].

3. Results and Discussion

3.1. Ozone Demand of ROC

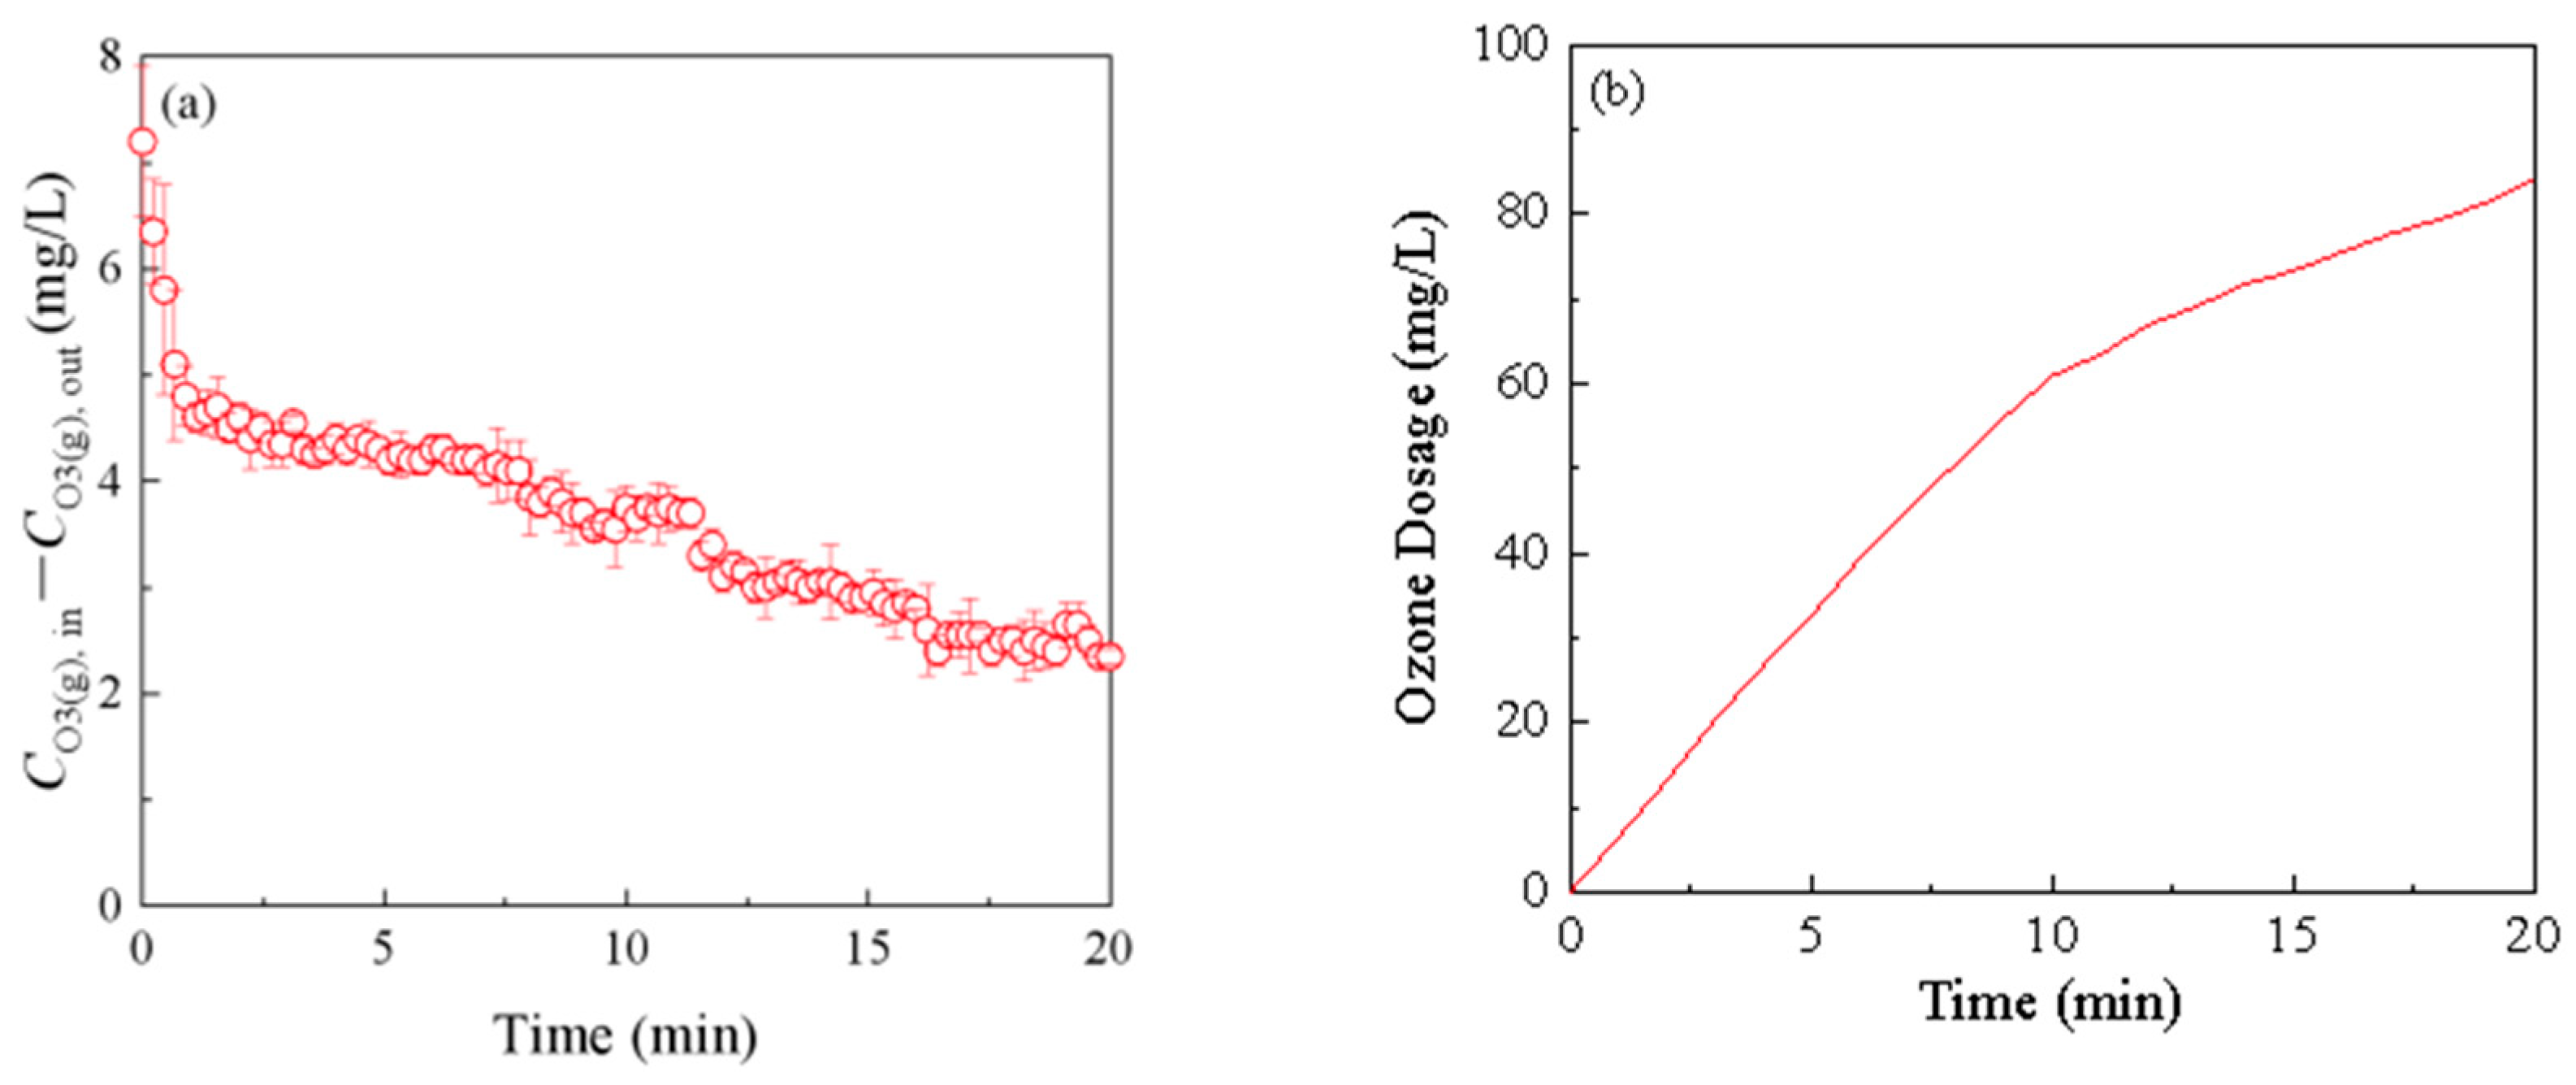
The TOD and IOD reflect the concentrations of substances in water that react slowly or rapidly with ozone and are used as indicators of the ozone demand of ROC. The gas-phase ozone concentrations on entering and exiting the reactor during the ozonation of ROC are shown in Figure 2a. When ozone was first added to the ROC, there was a difference of 7.2 mg/L between the gas-phase ozone concentrations entering and exiting the reactor. The difference between the concentrations was approximately 4.6 mg/L after 1 min, and was 2.4 mg/L at the end of the reaction. This indicates that, during the initial reaction phase, some of the organic compounds in the ROC reacted rapidly with ozone and consumed large quantities of ozone in a short time. However, as the oxidation reaction progressed, the quantity of these organic compounds decreased rapidly, and the remaining organic compounds reacted with ozone at a slower rate. Similar results were also found by Deng [35]. We then examined the variation in the TOD with time (Figure 2b). When the ozonation time was between 0 and 10 min, the TOD per unit time (dTOD/dt) increased at a rate of 6.1 mg/L. When the ozonation time was between 10 and 20 min, the dTOD/dt value was 2.3 mg/L.
The IOD represents the substances that react rapidly with the ROC. Here, the IOD value of ROC was 6.3 mg/L (Figure 3). Elsewhere, researchers reported average and median IOD values of 4.2 mg/L and 4.5 mg/L in water samples from secondary wastewater effluent from over 20 wastewater treatment plants in Beijing, respectively. The IOD value in this study was significantly higher than that of the secondary effluent, possibly because RO technology concentrates the organic matter in the feedwater, thereby increasing the concentration of organic compounds that react rapidly with ozone.
As discussed in Section 3.4 and Section 3.5, organic compounds exhibiting UV absorption and fluorescence signals undergo both rapid and slow reaction phases during ozonation. This demonstrates that certain organic compounds possessing UV chromophores and fluorescent signals can rapidly consume ozone. Compounds exhibiting rapid ozone consumption are present across high molecular weight (>1000 Da), medium molecular weight (300~1000 Da), and low molecular weight (<300 Da) ranges. Rapid ozone-consuming compounds may include molecules containing aromatic rings and conjugated structures, such as tryptophan-containing aromatic proteins, fulvic acid-type humic substances, certain macromolecular humic substances, and soluble microbial metabolic polymers. The specific properties of compounds causing rapid ozone consumption warrant further investigation.

3.2. Changes in COD and BOD5

The COD, BOD5, and BOD5/COD ratios of organic matter in the ROC are shown in Figure 4. For an ozone dosage of 84 mg/L, the initial and final concentrations of COD were 141 mg/L and 95 mg/L, respectively, which represents a removal rate of 32.6%. The rate of change in the COD relative to the ozone dosage (dCOD/dTOD) gradually decreased. At the start of the reaction, the dCOD/dTOD was relatively high, because of substances that reacted rapidly with ozone. The dCOD/dTOD value decreased through the reaction as the reaction rate between the organic compounds in the ROC and the ozone slowed.
UV/H2O2 and electro-oxidation treatments for ROC have also been reported. Lee et al. [36] employed a UV/H2O2 process to treat 100 mL ROC. Under conditions of 600 mJ/cm2 UV dose and 5 mM H2O2, COD removal rates comparable to this study were achieved. Guvenc et al. [37] treated 200 mL ROC samples via electro-oxidation using a Ti/IrO2 anode. Under optimal operating parameters (pH: 5; current density: 22.5 mA/cm2; inter-electrode distance: 3 cm), comparable COD removal rates to this study were achieved after 10 min. However, residual H2O2 from UV/H2O2 treatment may interfere with disinfection processes, necessitating removal of residual H2O2. ROC contains high concentrations of chloride ions. electro-oxidation may generate chlorinated inorganic/organic byproducts. Additionally, it is also necessary to consider the impact of water quality parameters on the long-term operation of UV/H2O2, as well as electrode passivation, corrosion, and fouling. Future work should compare different oxidation technologies for ROC by integrating pollutant removal, byproduct generation, energy consumption, and operation costs.
The initial and final concentrations of BOD5 were 30 mg/L and 22.6 mg/L, representing a removal rate of 24.7%, respectively. The BOD5/COD ratios were 0.21 at the start of the reaction and 0.24 at the end of the reaction for an ozone dosage of 84 mg/L. Without ozonation, the organic matter in ROC resists breakdown, and shows only a limited improvement after ozone treatment. It is noteworthy that despite treatment with a relatively high ozone dosage, the biodegradability of the ROC showed only a slight increase. This indicates that ozonation has a very limited effect on enhancing the biodegradability of this ROC. In a previous study, 84.1% of the COD and 99% of the color were removed from ROC treated by Fe0/PS/O3. Ji et al. [38] observed an increase of 0.24 in the BOD5/COD ratio (from 0.01 at the start of the reaction to 0.25 at the end), indicating a significant improvement in the biodegradability. These results contrast markedly with the results of the present study. It is worth remembering that the efficacy of the ROC treatment may be influenced by variations in the treatment processes, differences in the ROC water quality, and changes in the optimal experimental conditions, such as the catalyst type and ozone aeration rate.

3.3. Changes in TOC and Molecular Weight Distribution of Organic Compounds

The TOC values of ROC subjected to ozonation are presented in Figure S1. The initial TOC value was 41 mg/L and the end value was 36 mg/L, representing a removal of 12.2%. This rate was only 37% of the concurrent COD removal rate, and indicates that, while ozone can mineralize some ROC organic compounds into CO2, its overall mineralization capacity is relatively poor.
The molecular weight distribution of TOC in the ROC was examined at various ozone doses to understand how different organic compounds were removed and transformed (Figure S2). The molecular weights of the organic compounds in the ROC were all below 4000 Da, and the highest concentration was between 600 Da and 800 Da. As the ozone dosage increased, the TOC signal intensity decreased across all molecular weight ranges, indicating that ozone effectively removed organic compounds at various molecular weights. Significance analysis revealed that the differences in TOC molecular weight distribution under varying ozone doses were statistically significant at the 0.05 level (Table S1).
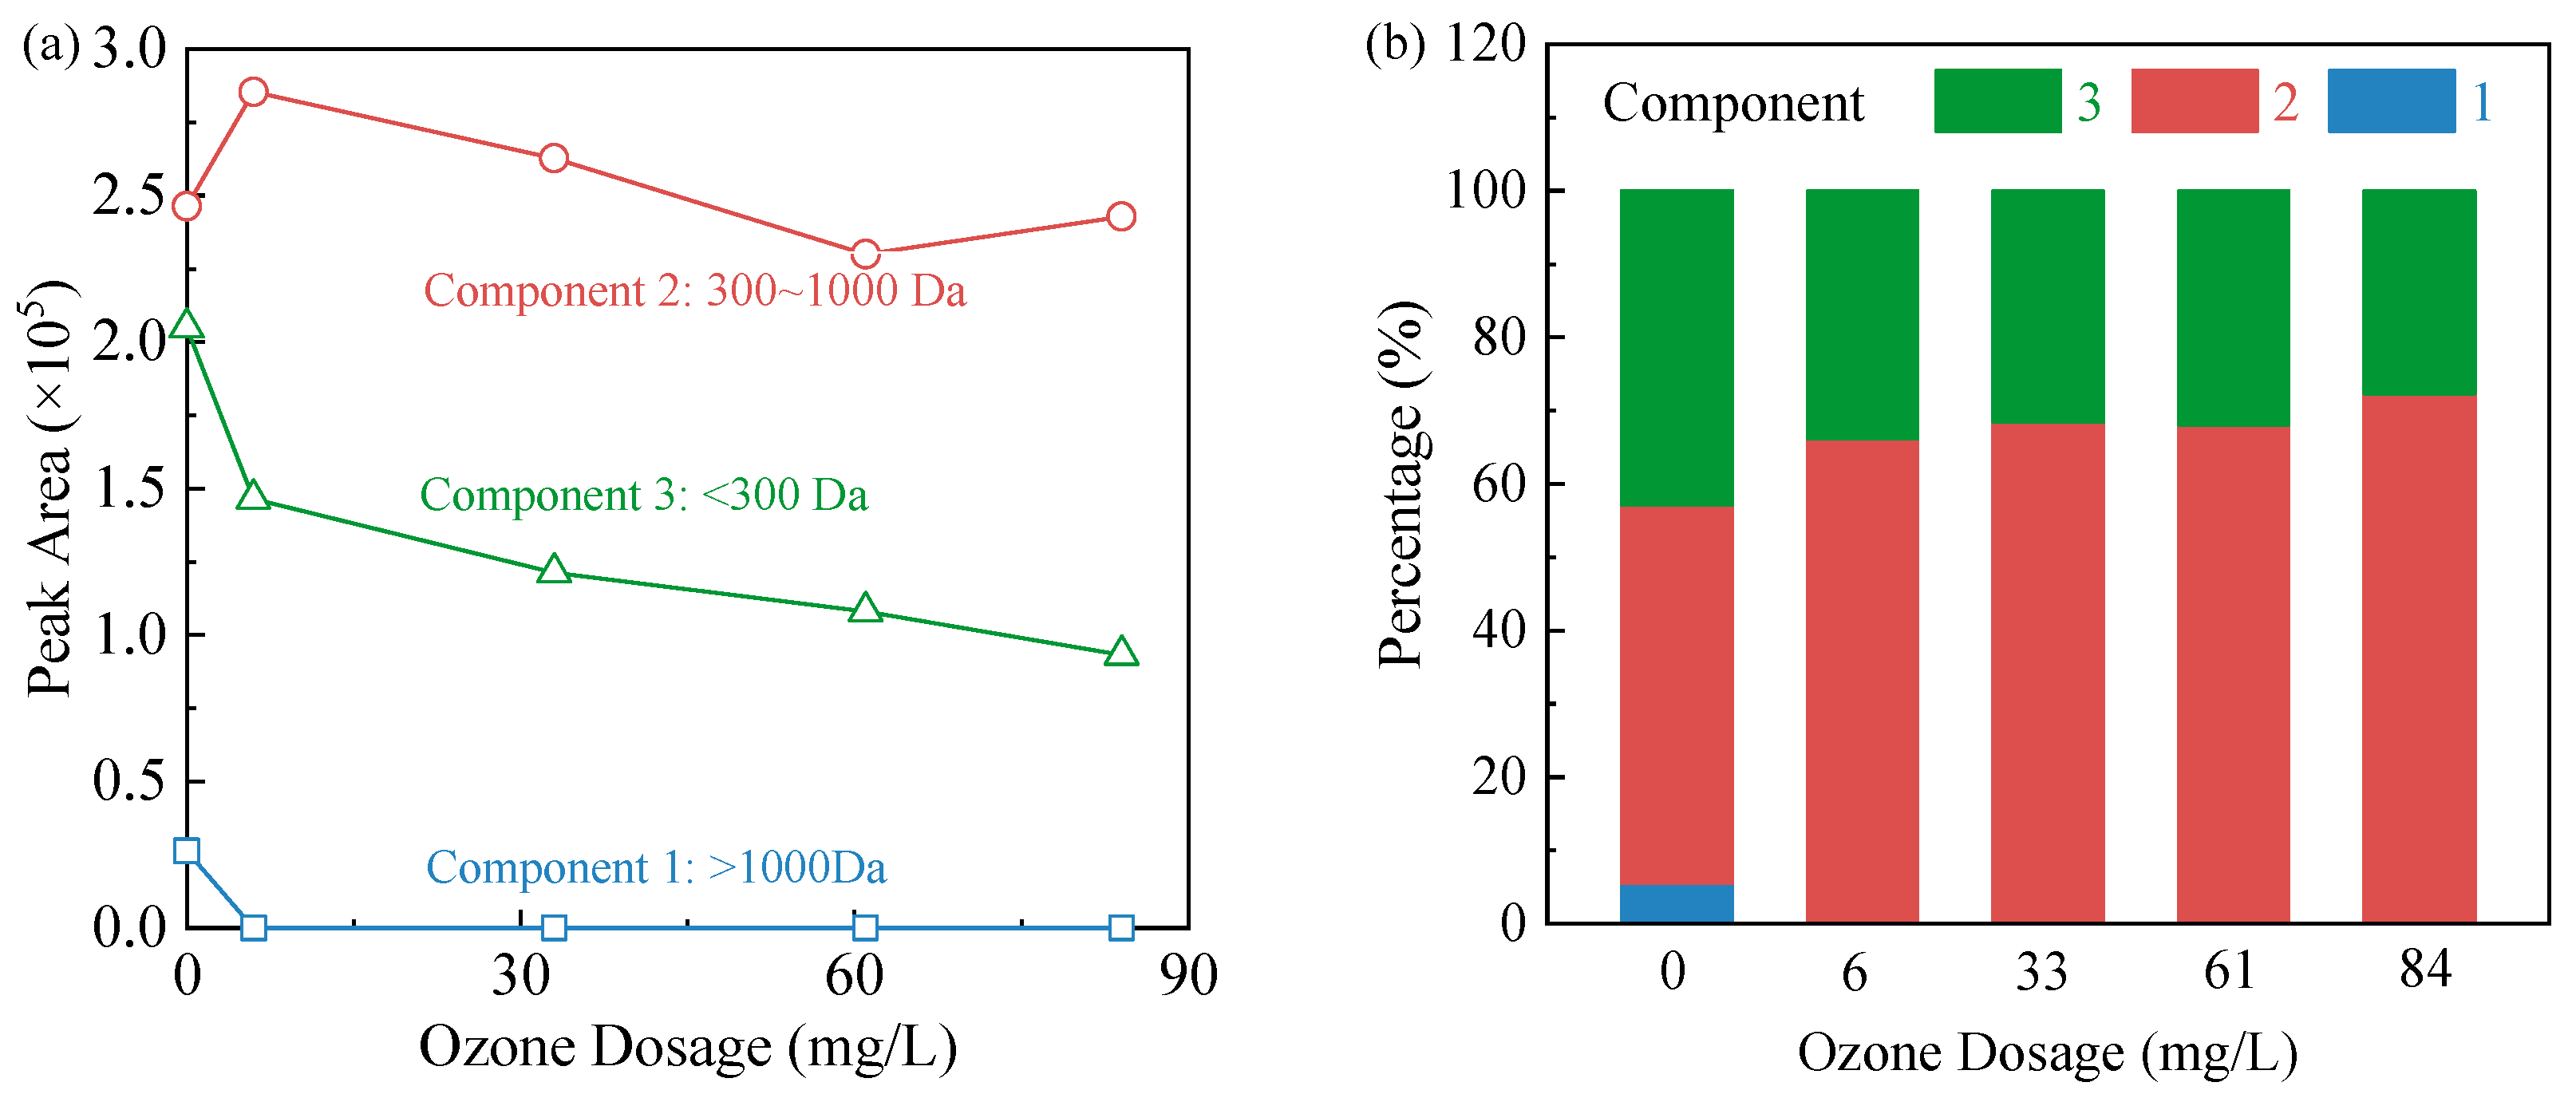
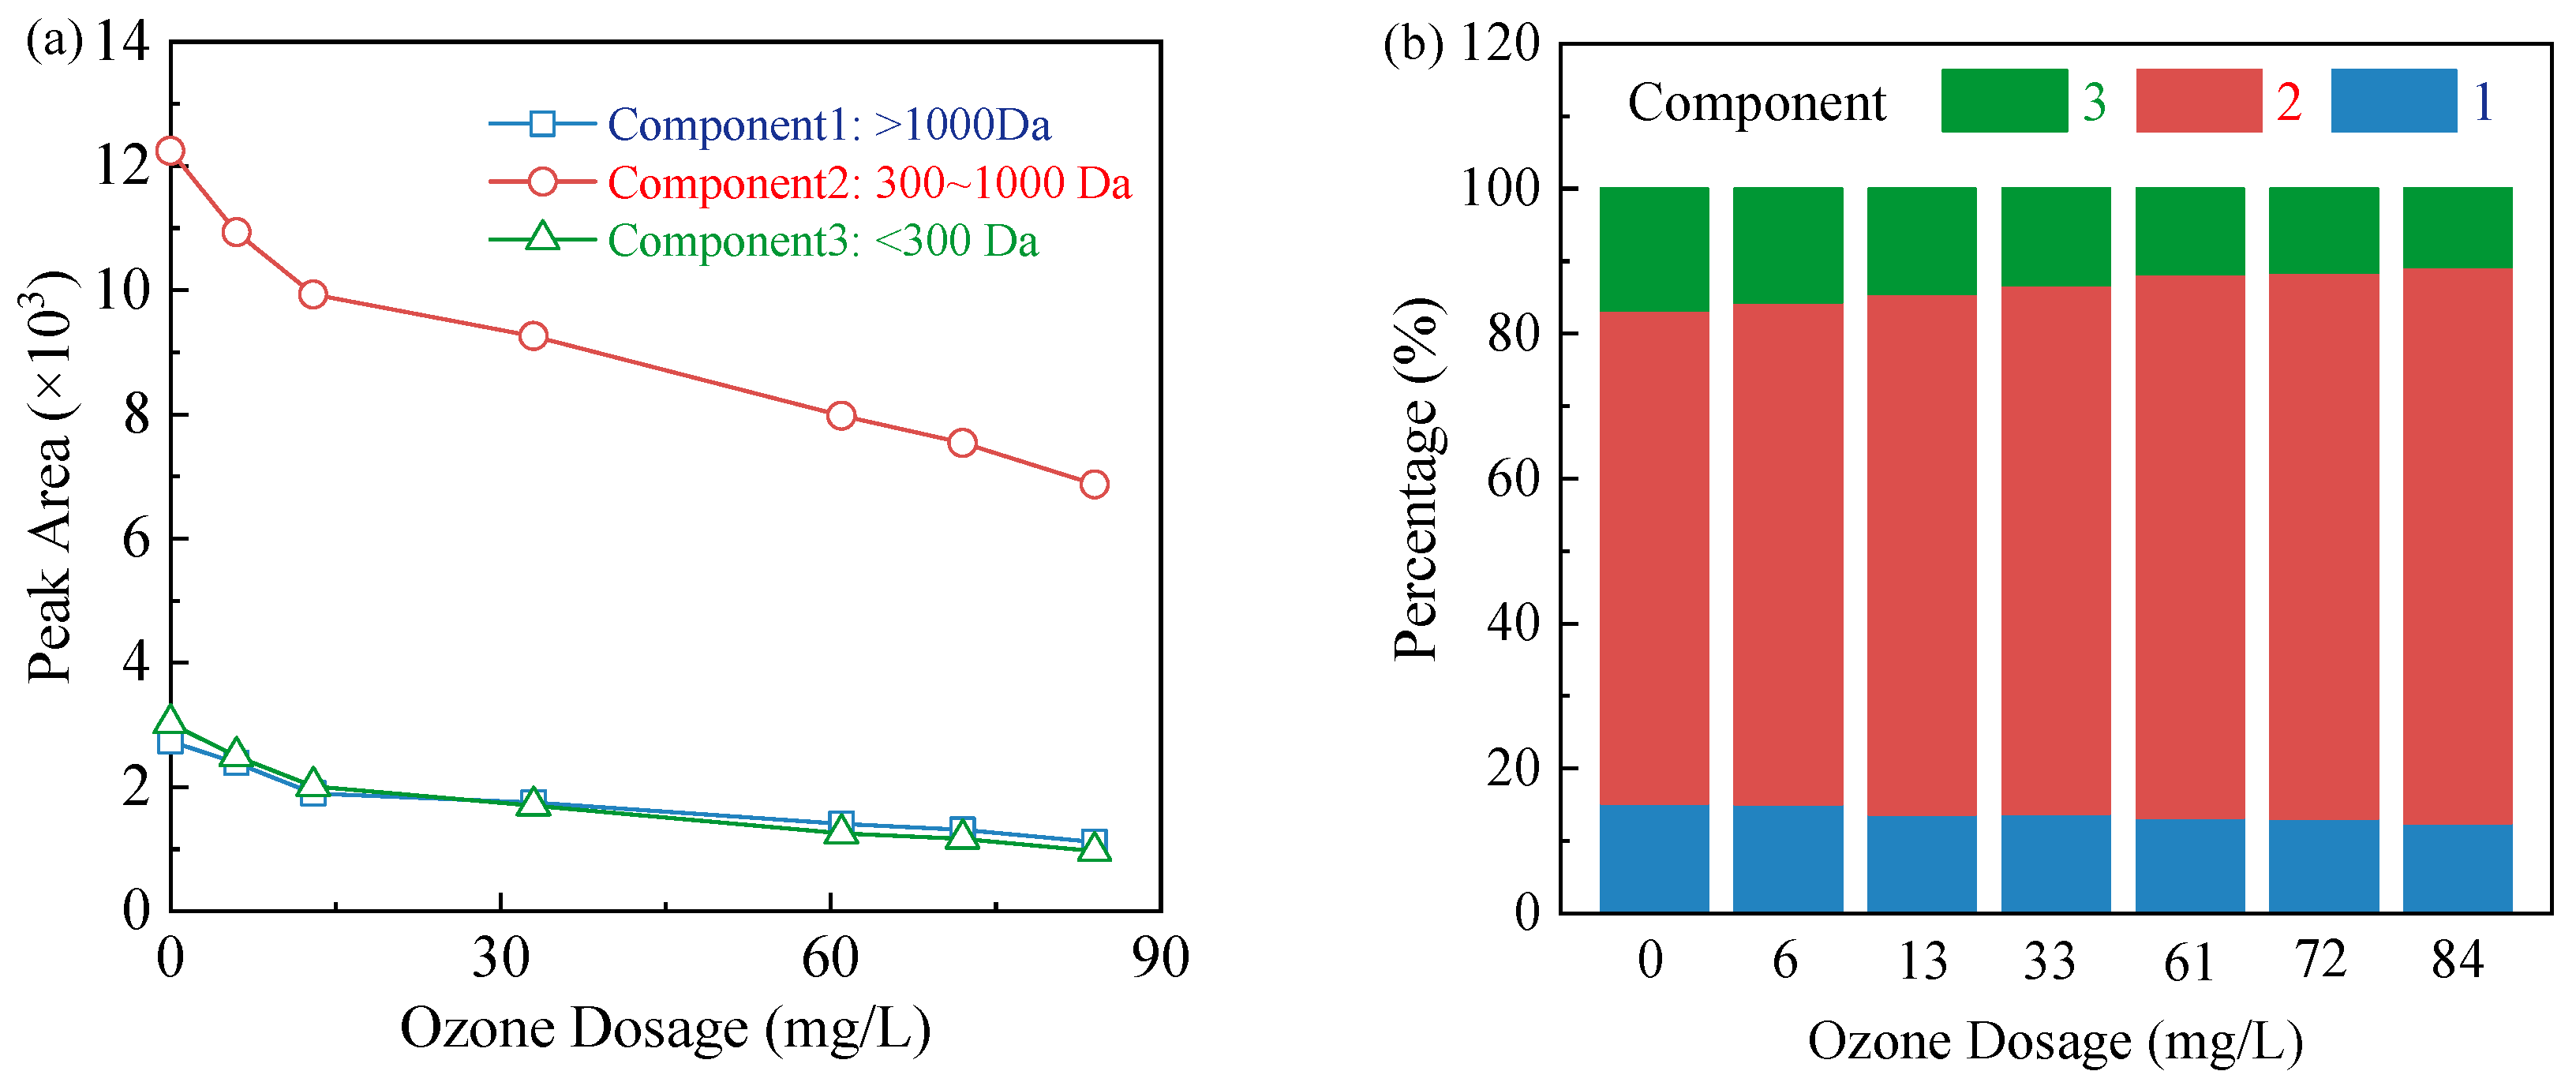
While observing a decrease in TOC signal intensity across all molecular weights following ozonation, it was also noted that the peaks on the TOC signal intensity-molecular weight curve shifted to the left as ozone dosage increased. To examine the transformations between components, the peaks for the different ozone dosages were subjected to peak resolution analysis using Peakfit software (version 4.12), as shown in Figure S2. The organic compounds in the ROC were divided into three components based on their molecular weight. Component 1 corresponded to organic compounds with molecular weights between 1000 and 4000 Da. Component 2 corresponded to organic compounds with molecular weights between 300 Da and 1000 Da, and Component 3 corresponded to organic compounds with molecular weights below 300 Da. The peak areas for these three groups at different ozone dosages are shown in Figure 5a.
The peak area of group 1 (1000–4000 Da) in ROC without ozonation was 2.6 × 10⁴ (Figure 5a). After oxidation with 6 mg/L ozone, the peak area decreased to 0, which indicates that ozone removed this component. Component 2 (300–1000 Da) had an initial peak area of 2.5 × 10⁵. After ozonation at 6 mg/L, the peak area had increased to 2.9 × 10⁵. At this point, Component 1 had been completely removed, which suggests that Component 1 may have been converted into Component 2 during the ozonation process.
As the ozone dosage was increased further, the peak area began to decrease slowly, and was 2.4 × 10⁵ at the end of the reaction. Component 3 (<300 Da) had an initial peak area of 2 × 10⁵. After 6 mg/L ozonation, its peak area was 1.5 × 10⁵, which represented a 25% reduction rate. As the ozone dosage increased further, the peak area gradually decreased and was 9.3 × 10⁴ at the end of the reaction. This indicates that this component could be removed with ongoing increases in the ozone dosage, but at a slower removal rate. It is speculated that the organic compounds in this component capable of reacting rapidly with ozone have already been removed, resulting in a slower reaction rate between the remaining organic compounds and ozone compared to the initial stage of the reaction.
The proportions of each component in the ROC at different ozone dosages are shown in Figure 5b. Components 1, 2, and 3 accounted for 5.5%, 51.6%, and 42.9% of the total components in the ROC, respectively, which indicates that the molecular weights of most of the organic compounds in the ROC were below 1000 Da. As the ozone dosage increased, Component 1 was completely removed, Component 2 increased, and Component 3 decreased. At the end of the reaction, Components 2 and 3 accounted for 72.3% and 27.7% of the total, respectively. Component 2 had the highest proportion at all reaction stages, which confirms that it was the primary organic compound in the ROC.
The changes in molecular weight distribution are due to the combined effects of hydroxyl radical oxidation and ozone molecule oxidation. •OH reacts non-selectively with most functional groups via electrophilic addition, hydrogen abstraction, and electron transfer. Moreover, •OH oxidation can further lead to the degradation of methoxylated compounds with relatively lower molecular weight. In contrast, O3 oxidation is more selective than •OH oxidation and involves electrophilic oxygen addition and Criegee-type reactions, with benzoquinone and muconic acid as the main products [39]. Zeng et al. [40] found that during •OH oxidation of natural organic matter, high molecular weight components exhibit higher decomposition rates. This is attributed to their typically greater aromaticity and higher number of active sites compared to low molecular weight components, coupled with the inertness of oxidation intermediates formed from polymeric organic components toward radical oxidation. High molecular weight components undergo depolymerization and ring-opening to form lower molecular weight components, which can subsequently be removed through mineralization.

3.4. Changes in Chromophoric Organic Compounds

Besides bulk organic compound indicators, ROC also contains organic compounds that exhibit UV absorption (containing chromophores) and fluorescent signals. These organic compounds generally have unsaturated bonds in their structures, such as benzene rings, C=C bonds, and amide groups. Furthermore, the concentrations of these organic compounds are closely linked to biotoxicity [41,42]. We therefore considered the changes in the UV absorption spectra and the three-dimensional fluorescence spectra of characteristic organic compounds in the ROC during the ozonation treatment process.
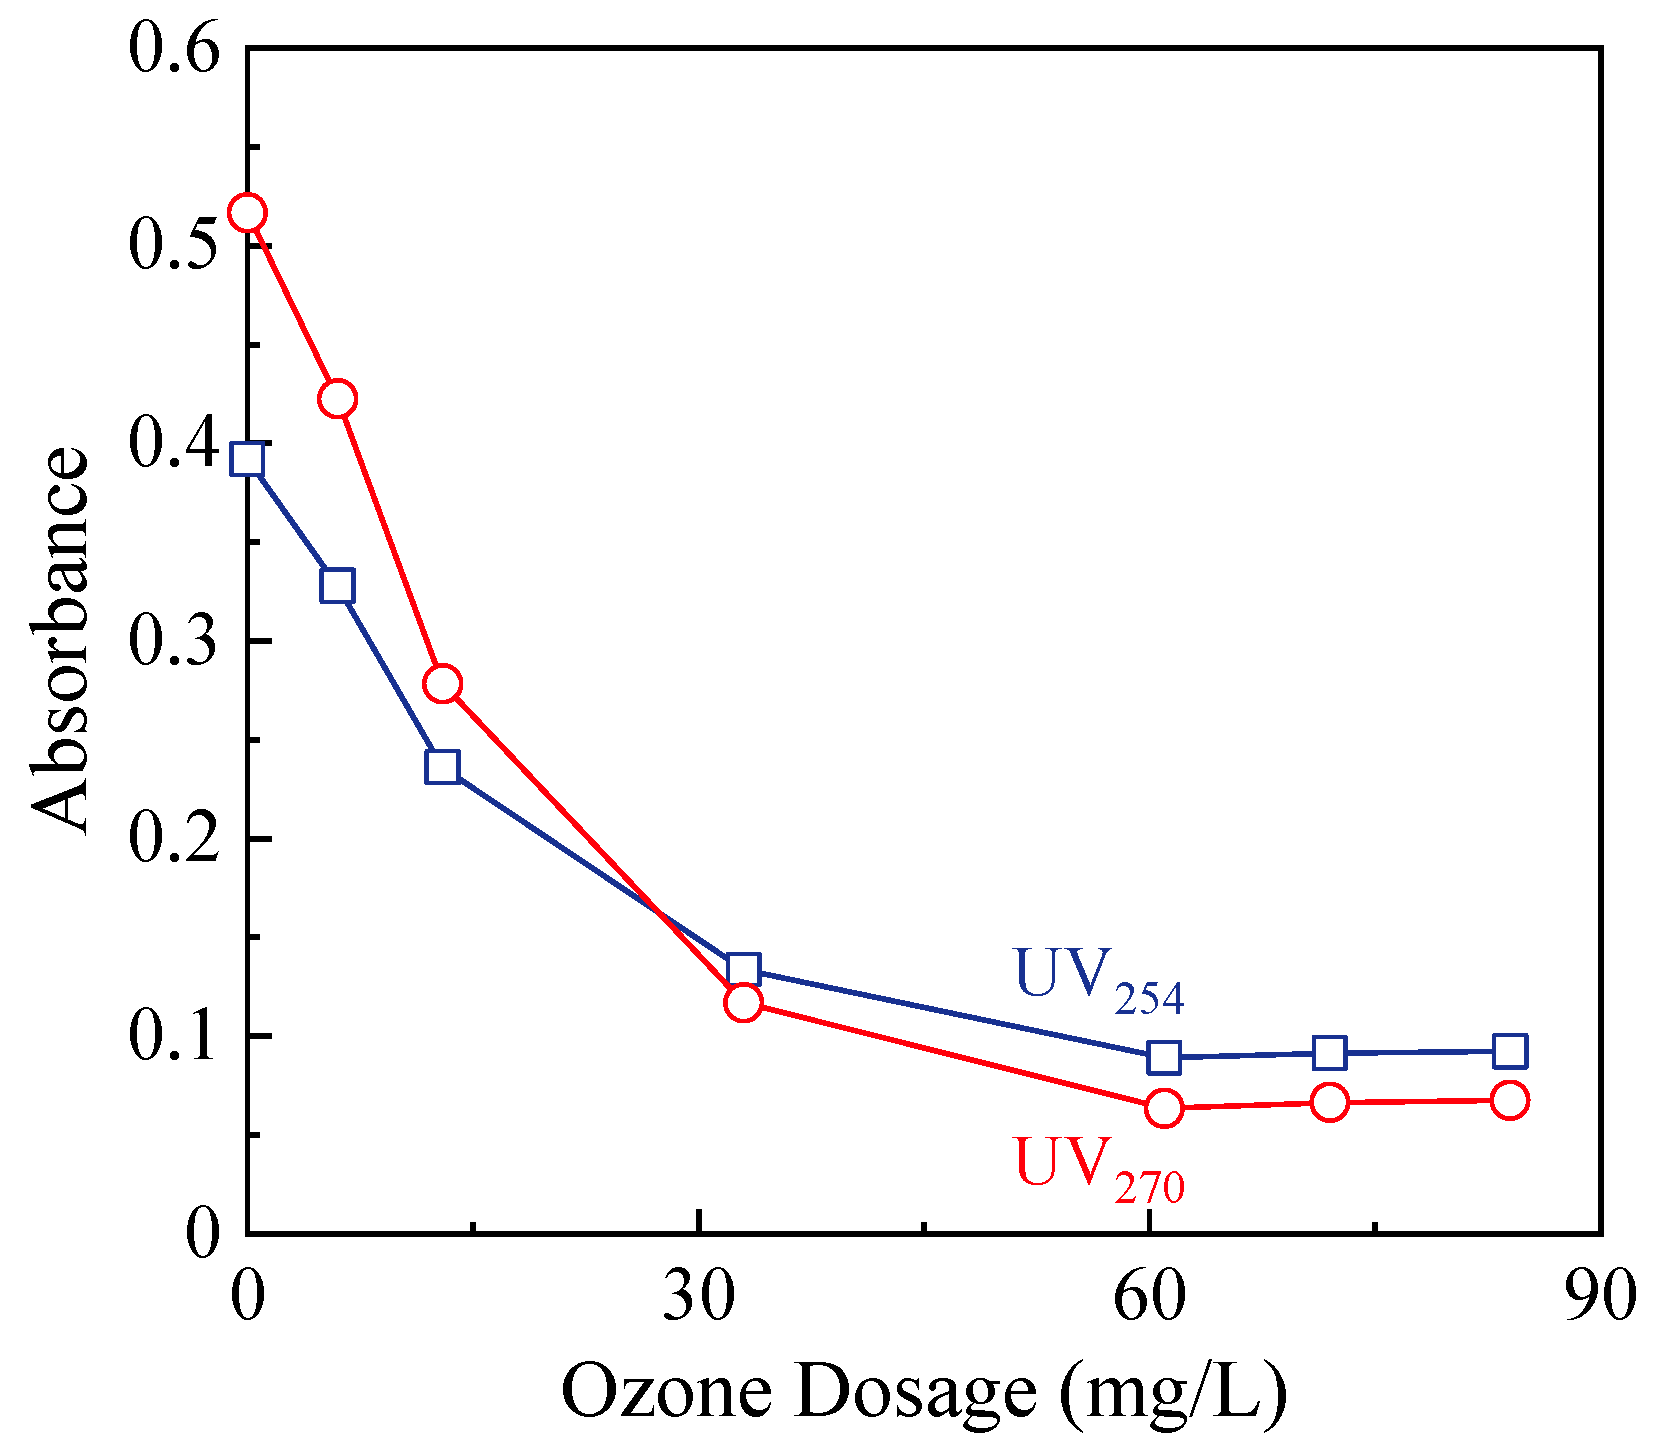
The UV absorption spectra of organic compounds in ROC under different ozone dosages are shown in Figure S3. Significance analysis indicated that the curves in Figure S3 were significantly different at the 0.05 level (Table S2). The organic compounds in the ROC had a maximum absorbance at 270 nm, and ozone significantly reduced the absorbance across the wavelengths. The absorbance values of the organic compounds at 254 nm and 270 nm (UV254 and UV270) at various ozone dosages are shown in Figure 6. At the start of the reaction, the absorbance values at 254 nm and 270 nm (UV254 and UV270) were 0.39 and 0.52, respectively. At the end of the reaction with an ozone dosage of 84 mg/L, the absorptions at UV254 and UV270 were 0.09 and 0.07, which represented removal rates of 76.9% and 86.5%, respectively.
The molecular weight distribution of the chromophoric organic compounds in the ROC and the ozone-mediated removal of these substances were examined by analyzing the UV254 signal of organic matter with different molecular weights in the ROC, measured as a function of the ozone dosage (Figure S4). Significance analysis revealed that the curves in Figure S4 were significantly different at the 0.05 level (Table S3). The data show that the chromophoric organic compounds in the ROC had molecular weights less than 3000 Da. As the ozone dosage increased, the UV absorption signal intensity of the chromophoric organic compounds at each molecular weight decreased significantly. These findings indicate that ozone removed chromophoric organic compounds across all molecular weight ranges.
The ozone-mediated removal of chromophoric organic compounds at different molecular weights was examined after the peaks at various ozone dosages were deconvoluted (using Peakfit software, version 4.12) (Figure S4). To facilitate comparison, the chromophoric organic compounds in ROC were grouped into three molecular weight-based fractions that were consistent with the molecular weight-TOC plot (Figure 5a). The peak areas for these three fractions at different ozone dosages are shown in Figure 7a.
The peak areas of the three components decreased as the ozone dosage increased (Figure 7a). The decreases showed two distinct stages. Before ozonation, the peak areas of components 1, 2, and 3 in the ROC were 2.7 × 10³, 1.2 × 10⁴, and 3.0 × 10³, respectively. After oxidation with an ozone dosage of 13 mg/L, the peak areas of components 1, 2, and 3 were 1.9 × 10³, 9.9 × 10³, and 2.0 × 10³, respectively. The peak areas of the components decreased at rates of 178 L/(mg O3), and 78 L/(mg O3) for an ozone dosage of 65 L/(mg O3). With further increases in the ozone dosage until the reaction endpoint, the peak areas of the three components decreased to 1.1 × 10³, 6.9 × 10³, and 9.6 × 10², respectively. The rates of decrease in the peak areas of components 1, 2, and 3 per ozone dosage were 11 L/(mg O3), 43 L/(mg O3), and 15 L/(mg O3), which were considerably less than the rates of decrease of 83.1%, 75.8%, and 80.8% reported for the previous stage, respectively.
The results from this experiment are similar to those reported by Weijun et al. [43] who found that, using fourier transform infrared spectroscopy analysis, ozonation extensively disrupted and converted unsaturated groups and aliphatic structures into more C-O structures with increased hydrophilicity and lower molecular weights. The results in Figure 5a show that certain components in the three groups reacted rapidly with ozone during the initial reaction phase. However, as the ozonation progressed, the fast-reacting substances within these three groups were either removed or structurally altered, resulting in a decrease in the ozone reaction rates. This explains the significant difference in the rates of decrease in the peak areas for the same dosage in the two stages.
The percentages of each component of the chromophoric organic compounds in the ROC at different ozone dosages are shown in Figure 7b. Components 1, 2, and 3 accounted for 15.2%, 68.0%, and 16.8% of the total components, respectively. The molecular weights of the chromophoric organic compounds in the ROC ranged from 300 Da to 1000 Da. As the ozone dosage increased, the proportions of components 1 and 3 decreased and the proportion of component 2 increased. At the end of the reaction, components 1, 2, and 3 accounted for 12.4%, 76.8%, and 10.8% of the total, respectively. Consistent with the results in Figure 5b, component 2 had the highest proportion at all reaction stages, which confirms that it dominated the chromophoric organic compounds in the ROC.

3.5. Changes in Fluorescent Organic Compounds

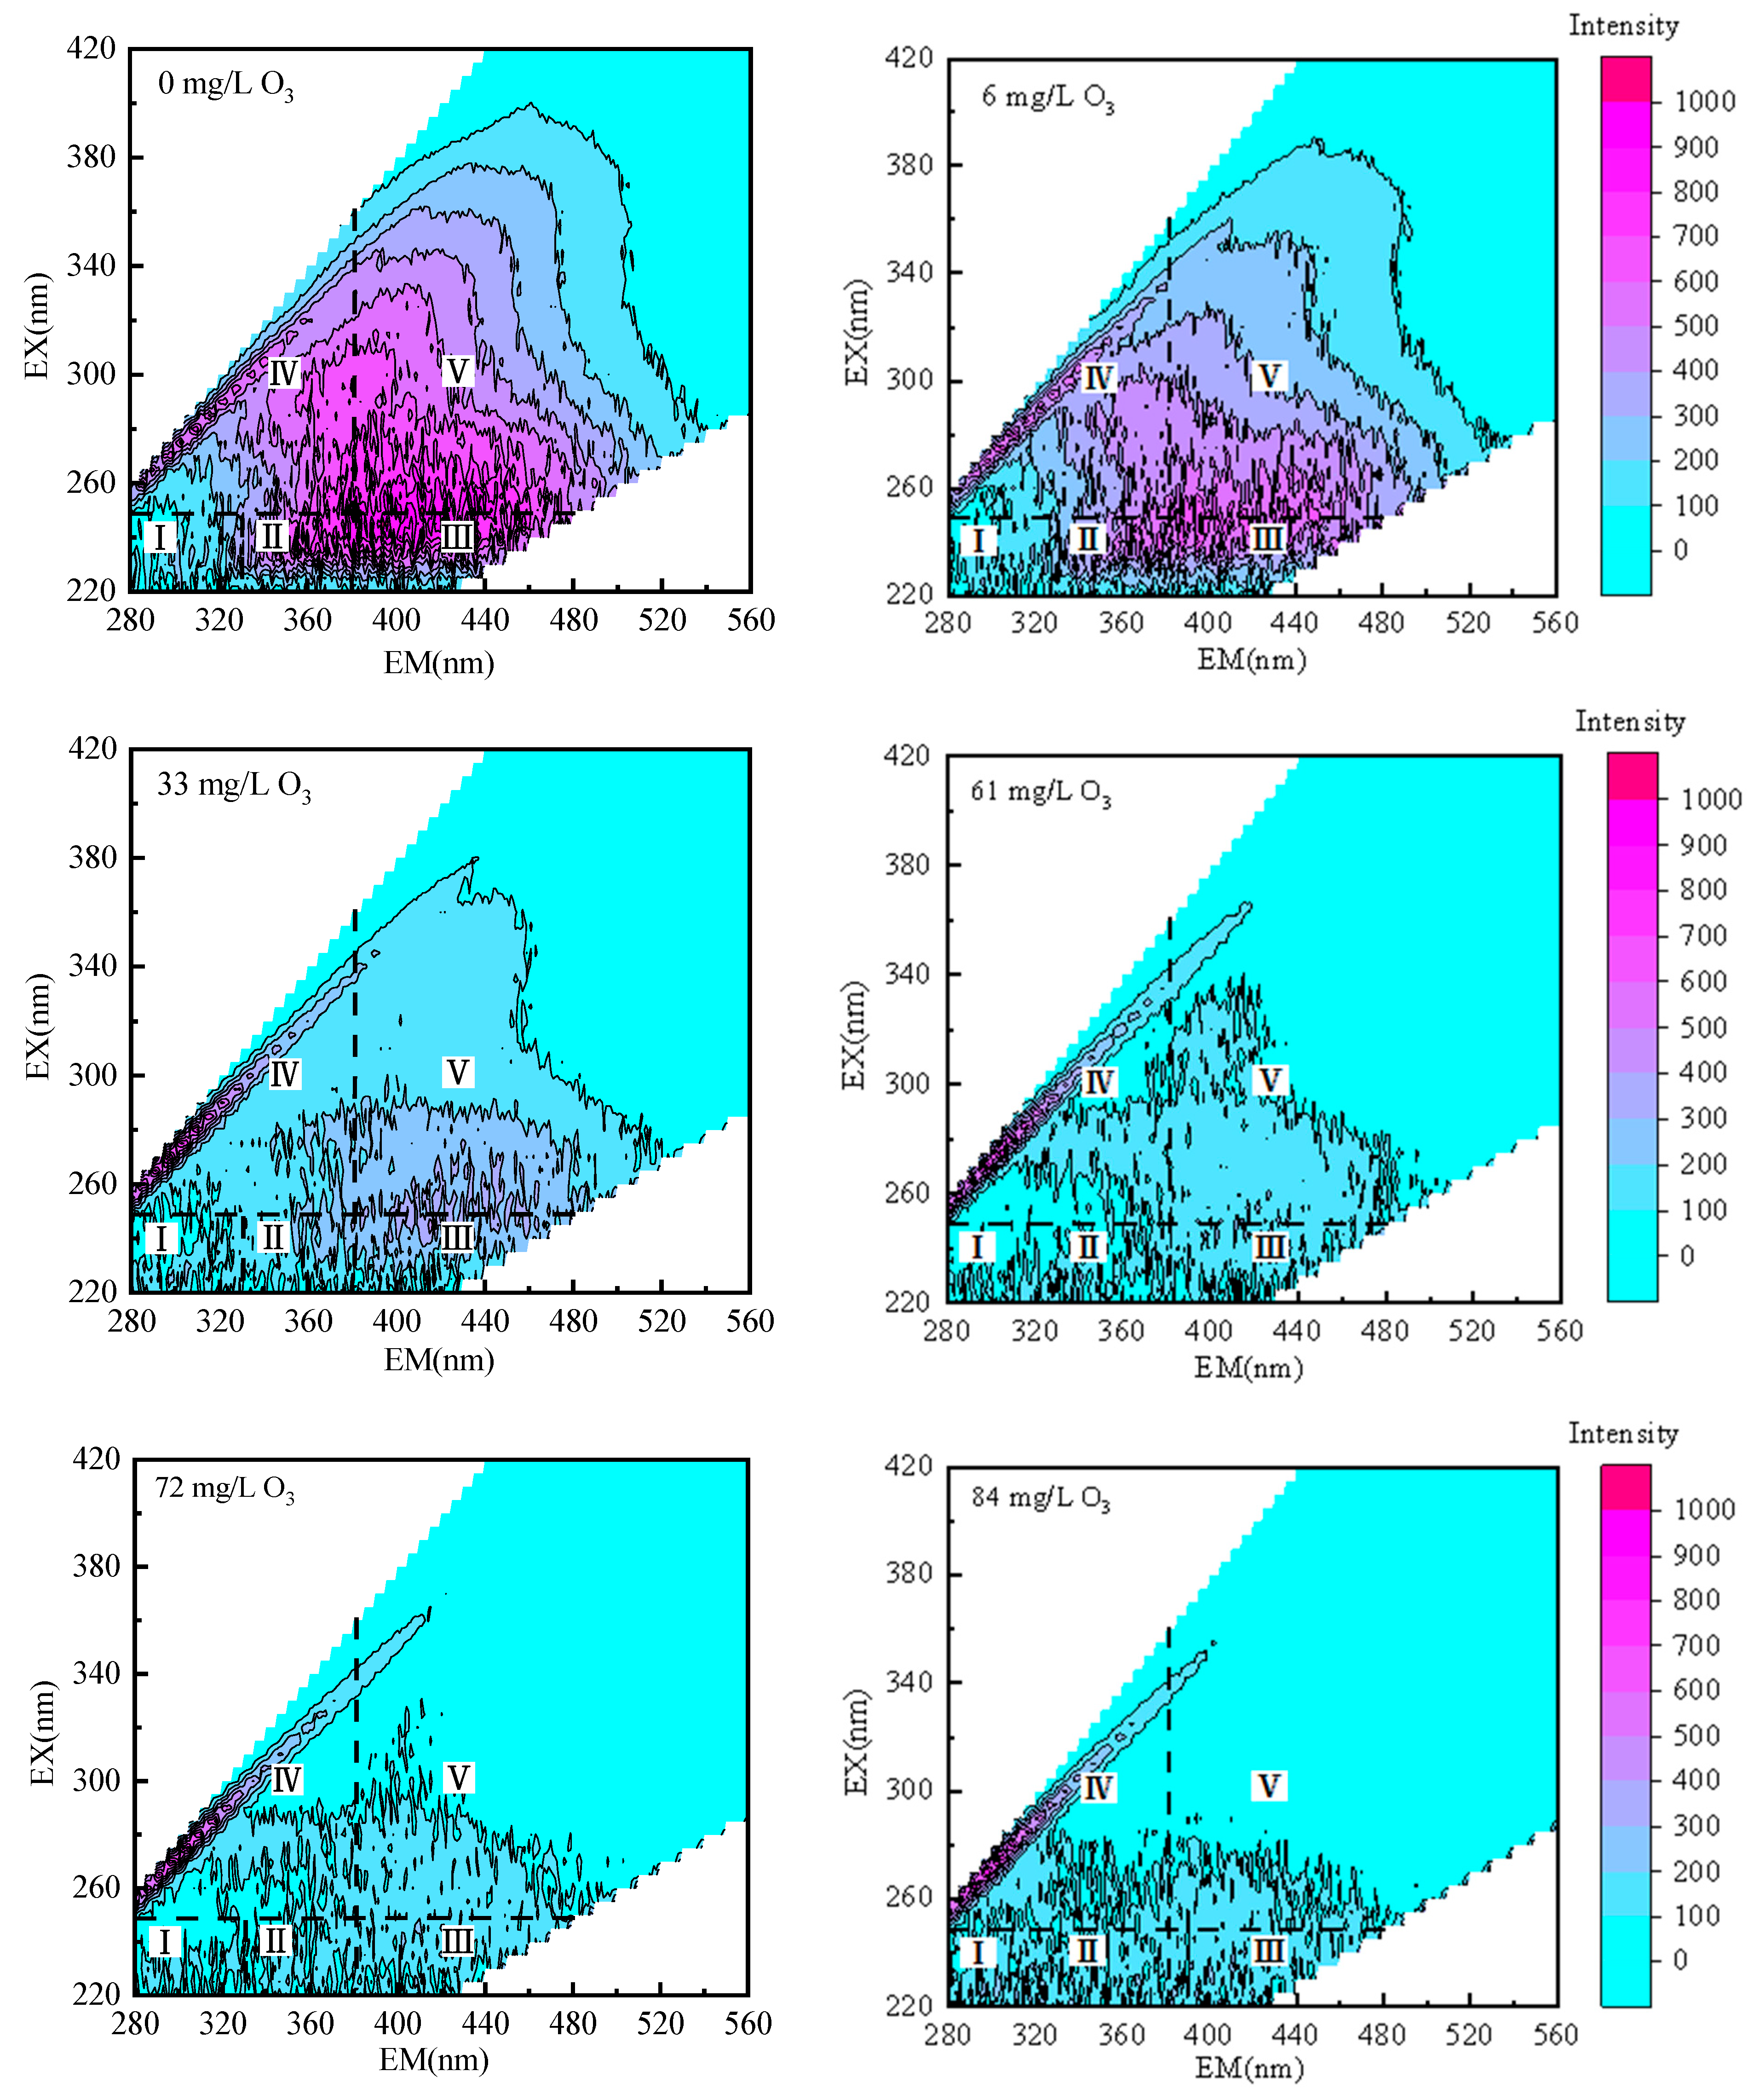
In addition to chromophoric organic compounds, the organic matter in ROC also includes a significant amount of fluorescent organic compounds. The changes in the three-dimensional fluorescence spectra under different ozone dosages are shown in Figure 8. As shown in Figure S5, the ozone caused the total fluorescence regional integration of the three-dimensional fluorescence spectrum of the organic compound in the ROC to decrease from 6.8 × 10⁷ nm2 to 2.2 × 10⁷ nm2, which represented a removal rate of 67.6%.
The three-dimensional fluorescence spectrum was divided into five regions to examine changes in the organic compounds, as shown in Table 2. The variations in the fluorescence regional integration across the five regions that related to different ozone dosages were quantified (Figure 9a). The ozone removed fluorescent organic compounds from four regions, including tryptophan-type aromatic proteins (region II), fulvic acid-type substances (region III), soluble microbial metabolites and aromatic proteins (region IV), and humic acid-type substances (region V). When the ozone dosage was 84 mg/L, the removal rates of the Region II, III, IV, and V substance types reached 71.6%, 76.2%, 68.8%, and 85.3%, respectively. Loh et al. [44], using liquid chromatography-organic carbon detection data and fluorescence excitation-emission matrix spectra, confirmed that humic substances constituted the primary organic matter in ROC, and that they could be removed from the original ROC during ozone pretreatment. This finding is consistent with the results of this experiment.
The removal process was divided into two stages. For ozone dosages between 0 mg/L and 13 mg/L, the fluorescence regional integration for the Region II, III, IV, and V substance types decreased at rates of 6.8 × 10⁵ L·nm2/(mg O3), 4.9 × 10⁵ L·nm2/(mg O3), 4.5 × 10⁵ L·nm2/(mg O3), and 3.7 × 10⁵ L·nm2/(mg O3) as the ozone dosage increased. When the ozone dosage was between 13 mg/L and 84 mg/L, the rates of decrease for the Region II, III, IV, and V substance types were 7.7 × 10⁴ L·nm2/(mg O3), 7.6 × 10⁴ L·nm2/(mg O3), 6.5 × 10⁴ L·nm2/(mg O3), and 5.7 × 10⁴ L·nm2/(mg O3), which represented reductions of 88.9%, 84.6%, 85.7%, and 84.6%, respectively. These results indicate that the four types of substances reacted relatively readily with ozone during the initial reaction phase. However, as the ozone reaction continued, the reaction rate between these substances and the ozone gradually slowed down. Before and after the ozone treatment, there was little change in the fluorescence of tyrosine-containing aromatic proteins (region I), and the removal rate at the reaction endpoint was only 7.4%.
The percentages of the fluorescence regional integration in each region at different ozone dosages are shown in Figure 9b. Studies have reported significant reductions in the humic acid-like and fulvic acid-like substances in dissolved organic matter, and increases in the fluorescence regional integration of soluble microbial products, when treated with ozone [43]. The fluorescence regional integration of regions I, II, III, IV, and V in the ROC accounted for 9.5%, 29.8%, 22.8%, 22.5%, and 15.4%, respectively, which indicates that tryptophan-containing aromatic proteins dominated the fluorescent organic compounds in the ROC. As the ozone dosage increased, the proportion of the fluorescence regional integration in region I increased, the proportions of regions III and V decreased, and the proportions of regions II and IV showed little change. At the end of the reaction, the proportion of the fluorescence regional integration in region I reached 27.4%, which was the highest. This shows that the tyrosine-containing aromatic proteins, region I, were more difficult to remove by ozone than the substances associated with the other regions.

3.6. Changes in the Microalgae Growth Potential of ROC by Ozone/Coagulation

Reverse osmosis concentrate often contains organic phosphonate antiscalants. The phosphorus in the ROC can cause eutrophication of water bodies and lead to algal blooms if left untreated [46,47,48]. We therefore investigated the microalgal growth potential during ozone and ozone/coagulation treatment of ROC containing organic phosphonate antiscalants. Two commonly used organic phosphonate antiscalants, PBTCA and HEDP, were added to the ROC at a dosage of 15 mg/L. Scenedesmus sp. LX1 and Chlorella sp. ZTY4 were used to test the microalgal growth potential.
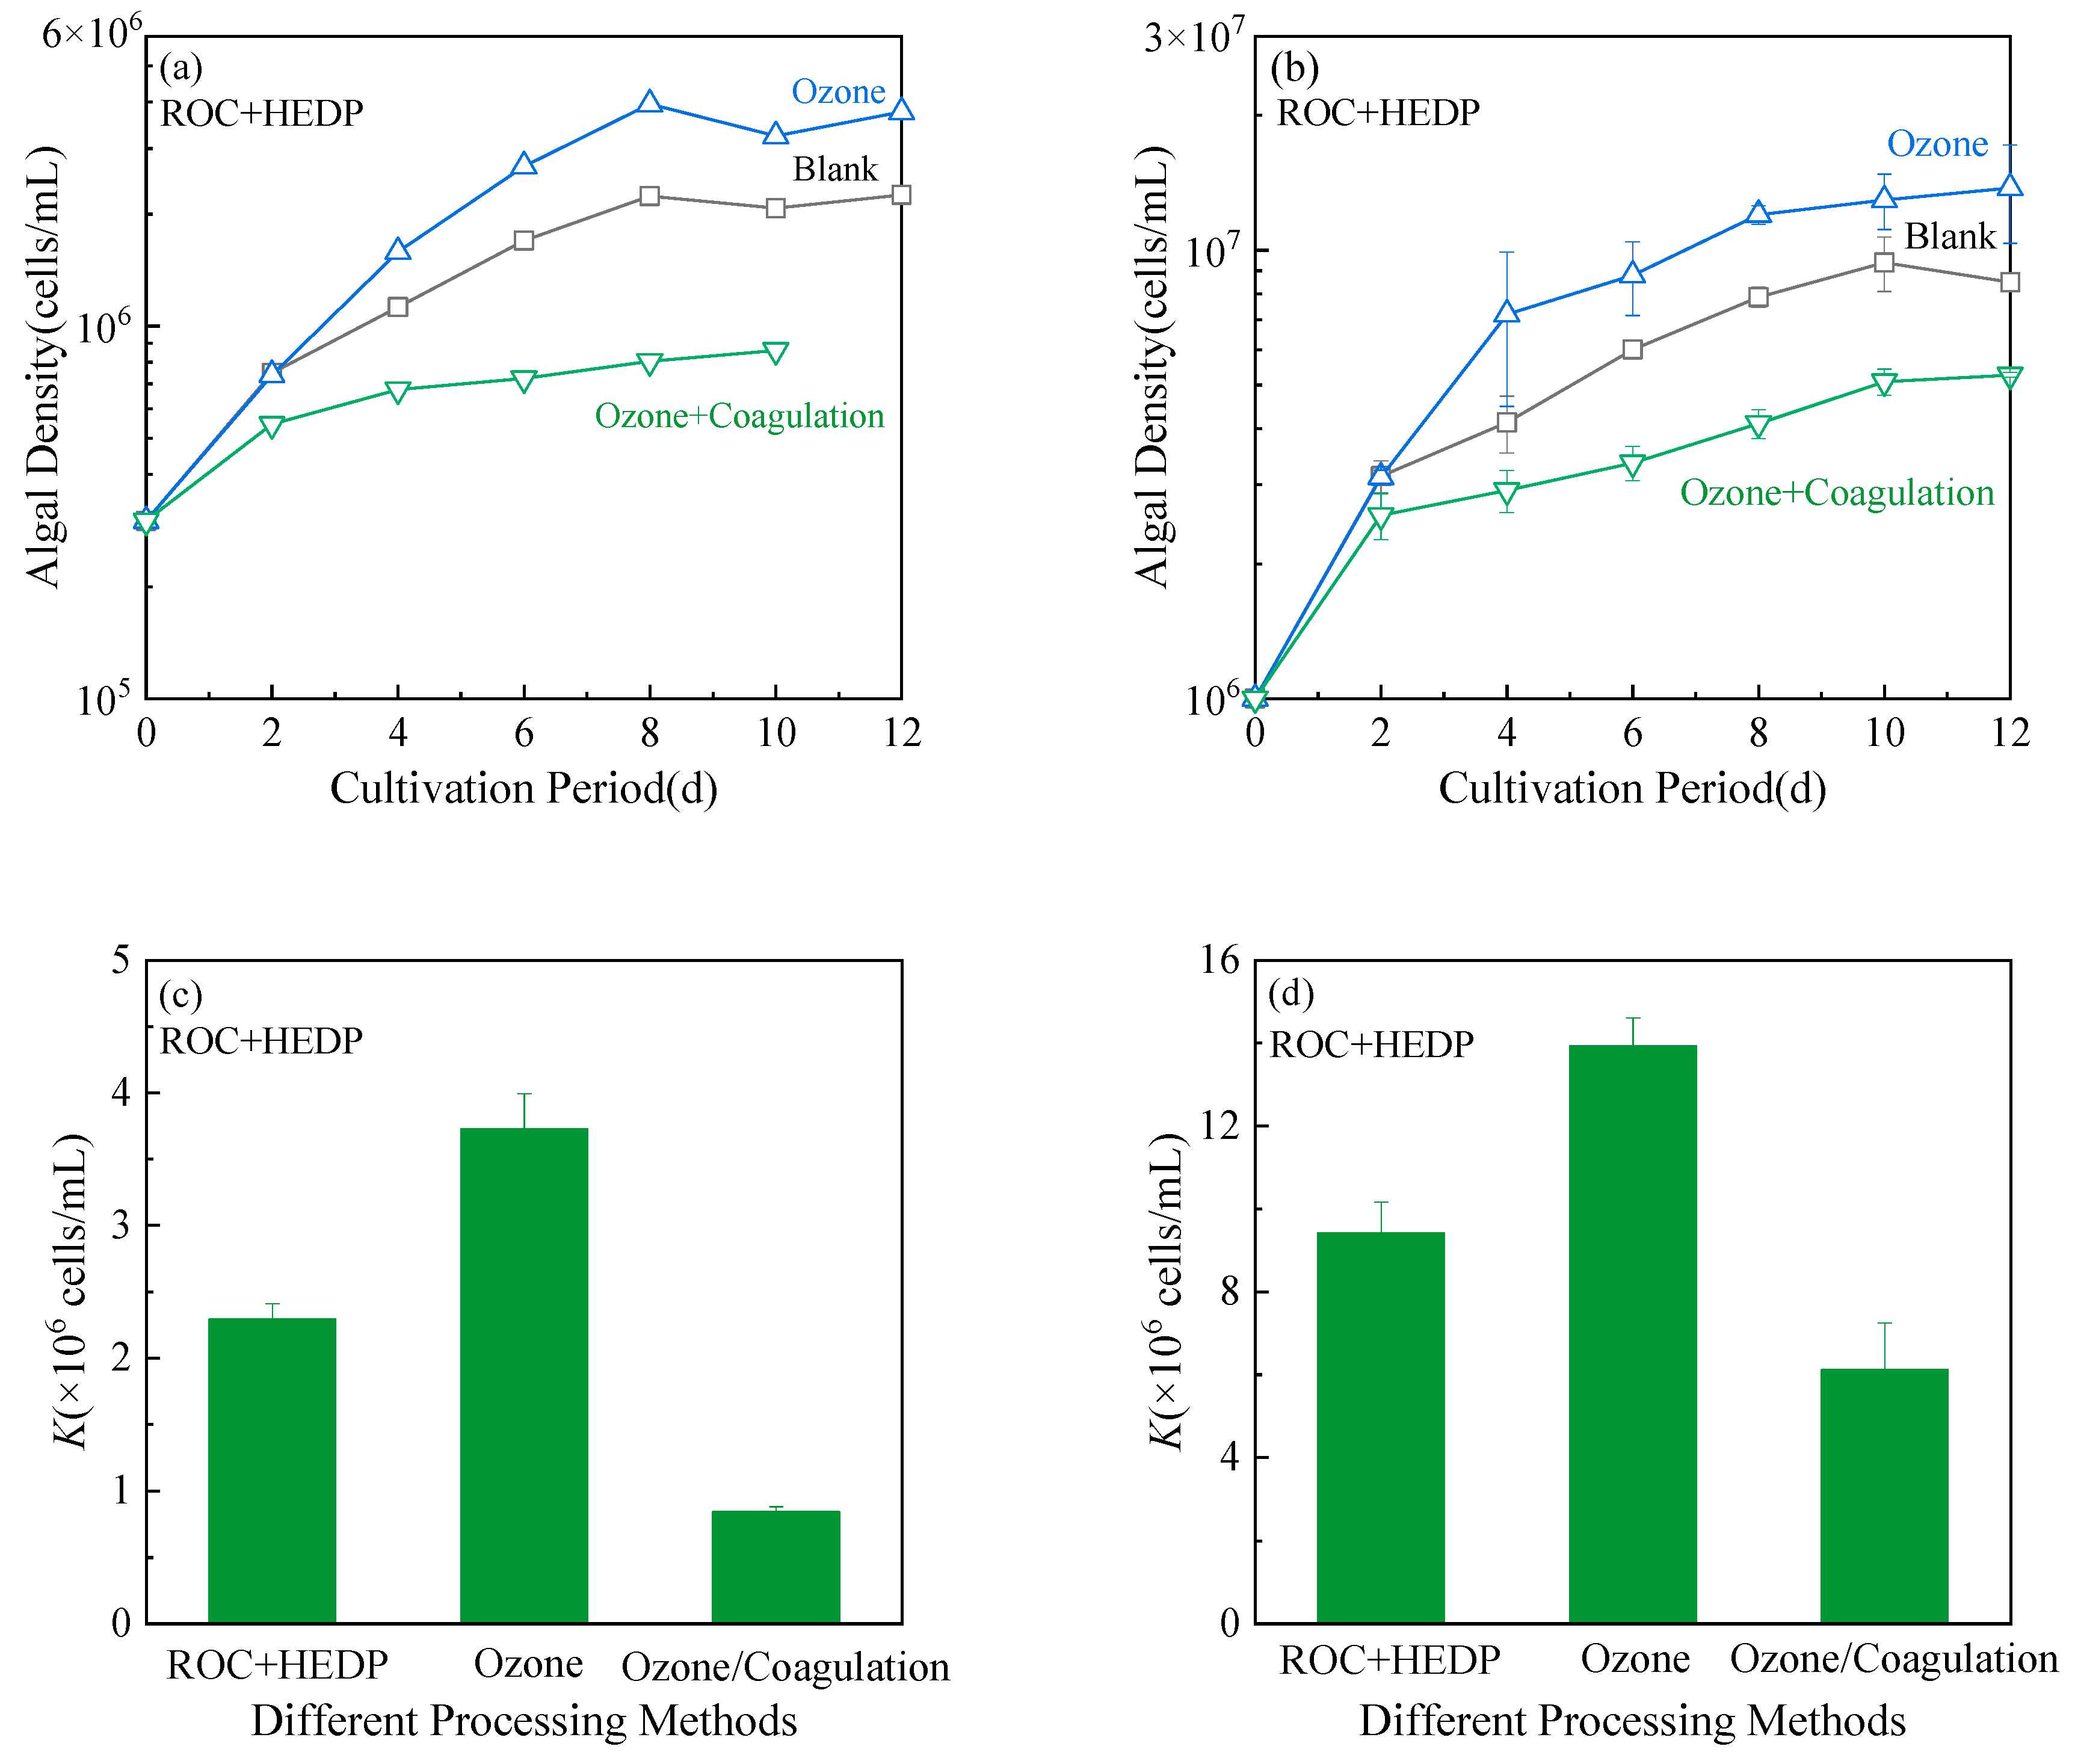
The K values in the ozone-treated ROC were consistently the highest, with values of 8 × 10⁶ cells/mL for Scenedesmus sp. LX1 and 2.3 × 10⁷ cells/mL for Chlorella sp. ZTY4 (Figure 10). The K values in the untreated ROC ranked second of the three methods, with 4.6 × 10⁶ cells/mL for Scenedesmus sp. LX1 and 1.2 × 10⁷ cells/mL for Chlorella sp. ZTY4. The K values in the ozone/coagulation-treated ROC were the lowest of the three methods, with values of 1.1 × 10⁶ cells/mL for Scenedesmus sp. LX1 and 2.8 × 10⁷ cells/mL for Chlorella sp. ZTY4. Compared to the untreated ROC, the K values for Scenedesmus sp. LX1 and Chlorella sp. ZTY4 decreased by 76.6% and 57.1%, respectively, after ozone/coagulation treatment.
Similarly, the K values were highest in the ROC containing HEDP after ozone treatment. The values for the Scenedesmus sp. LX1 and Chlorella sp. ZTY4 were 3.7 × 10⁶ cells/mL and 1.4 × 10⁷ cells/mL, respectively. The K values in the mixture of ROC and HEDP also decreased after the ozone/coagulation treatment, as shown in Figure 11. The K values for Scenedesmus sp. LX1 and Chlorella sp. ZTY4 were 63.5% and 35.1% lower in the ozone/coagulation-treated ROC than in the untreated ROC, respectively.
After adding the phosphonate antiscalant PBTCA, the concentrations of total phosphorus, organic phosphorus, and inorganic phosphorus in the concentrate were 2 mg/L, 1.7 mg/L, and 0.3 mg/L, respectively. During the ozonation process, 29% of the organic phosphorus was converted to inorganic phosphorus. After ozone/coagulation, the concentrations of total phosphorus and inorganic phosphorus decreased to 0.85 mg/L and 0.07 mg/L, respectively. Similarly, the addition of HEDP increased both organic phosphorus and total phosphorus in the ROC by 1.1 mg/L. After ozonation, 26% of organic phosphorus was converted to inorganic phosphorus, and total phosphorus concentration remained unchanged. Following ozone/coagulation treatment, total phosphorus and inorganic phosphorus concentrations in the concentrate decreased to 0.95 mg/L and 0.14 mg/L, respectively.
Wang et al. [49] compared the growth of Scenedesmus sp. LX1 and Chlorella sp. ZTY4 in the ROC and the control medium. The control medium was added with NaNO3 and K2HPO4 to maintain equivalent levels of total nitrogen and total phosphorus with ROC, while other nutrients were set at 50% of the BG11 medium. They found that both algae grew well in ROC, exhibiting intrinsic growth rates higher than the control group, with maximum algal densities reaching 51%~59% of the control. The higher intrinsic growth rates were attributed to ROC’s higher inorganic carbon. The reduced maximum algal density was linked to antiscalants in ROC, which impaired photosynthetic activity by chelating iron [50]. The effects of other organic carbon components, like assimilable organic carbon (AOC), were not reported. This study observed an increase in medium molecular weight fractions (300~1000 Da) and a decrease in low molecular weight fractions (<300 Da) during the ozone oxidation process. Whether organic carbon affects microalgal growth warrants further investigation.
During the ozonation process, phosphonate antiscalants were decomposed, converting the organic phosphorus to inorganic phosphorus. It is inferred that the increase in inorganic phosphorus and the decomposition of antiscalants led to the higher microalgal growth potential [50]. The ozone-followed PAC coagulation treatment effectively removes inorganic phosphorus and total phosphorus from ROC containing antiscalants. It also reduces the maximum algal density of the Scenedesmus sp. LX1 and the Chlorella sp. ZTY4, thereby lowering the risk of water eutrophication. Similar results were observed in previous experiments using ATMP organic phosphonate antiscalants [29].
The ozone dosage is closely correlated with the molecular weight distribution of organic compounds in the ROC. Higher ozone dosages result in more thorough removal of high molecular weight substances (>1000 Da), while the proportion of medium molecular weight components (300~1000 Da) increases accordingly. Notably, coagulation is effective for removing high molecular weight organic compounds. Excessive ozone dosage may overly convert high molecular weight organic compounds into smaller molecules, inhibiting coagulation efficacy. Insufficient ozone dosage may limit removal efficiency for COD and organophosphorus antiscalants. Further research is needed to investigate the impact of ozone dosage on ozone/coagulation processes, determine the optimal ozone dosage range, and provide parameter references for practical ROC treatment.
Hogard et al. [51] demonstrated that ozone readily forms disinfection byproducts such as bromate, aldehydes, and nitrosamines. Higher concentrations of precursor compounds in ROC may increase the risk of generating such byproducts. Some byproducts can be biodegraded, while bromate can be controlled by adding chlorine/ammonia or hydrogen peroxide. Further attention should be given to byproducts and their control measures to ensure the ecological safety of treated ROC water.

4. Conclusions

As the ozone reaction time increased, the increase in the TOD per unit time (dTOD/dt) gradually decreased. This indicates that there were fast-reacting substances in the ROC during the initial reaction phase, and the IOD value was 6.3 mg/L.
The removal rate of TOC by ozone was one-third of the removal rate of COD. During the ozone oxidation process, the biodegradability (BOD5/COD5) increased slightly (from 0.21 to 0.24). Organic compounds with molecular weights <300 Da were progressively removed through ozone oxidation, while organic compounds with molecular weights between 1000 and 4000 Da were converted by ozonation into organic molecules with molecular weights between 300 Da and 1000 Da.
Ozone removed chromophoric and fluorescent organic compounds from ROC. The removal rate was rapid at the start of the reaction but then decreased gradually, reflecting fast-reacting chromophoric and fluorescent organic substances in the ROC at the start of the reaction. The three-dimensional fluorescence spectra showed that ozone removed tryptophan-type aromatic proteins, fulvic acid-type substances, aromatic proteins and soluble microbial metabolites, and humic acid-type substances from concentrate water, but that there was only limited removal of tyrosine-type aromatic proteins.
The risk of eutrophication from ROC increased after the ozone treatment, reflecting the conversion of organic phosphonate antiscalants in ROC into easily absorbed inorganic phosphorus. The eutrophication risk and the maximum algal density of Scenedesmus sp. LX1 and Chlorella sp. ZTY4 declined after PAC-coagulation post-treatment, reflecting the removal of total phosphorus. Ozone and coagulation treatments together may be suitable for controlling the eutrophication risks in ROC.

Supplementary Materials

The following supporting information can be downloaded at: https://www.mdpi.com/article/10.3390/su17219564/s1, Figure S1. Removal of total organic carbon and chemical oxygen demand in ROC by ozonation. Figure S2. Changes in TOC-molecular weight distribution during ozonation of reverse osmosis concentrate (ROC). Figure S3. Changes in UV absorption spectra during ozonation of ROC. Figure S4. UV254 signal intensities of organic matter with different molecular weights and their changes under various ozone dosages. Figure S5. Effect of ozone dosage on total fluorescence regional integration in three-dimensional fluorescence spectra of ROC. Table S1. Significance Test for Figure S2. Table S2. Significance Test for Figure S3. Table S3. Significance Test for Figure S4.

Author Contributions

Conceptualization, N.H.; Data curation, Z.X.; Formal analysis, Y.C. and Z.X.; Funding acquisition, N.H.; Investigation, Y.C. and Z.X.; Methodology, Z.X.; Supervision, N.H.; Validation, Y.C.; Visualization, Z.X.; Writing—original draft, Y.C.; Writing—review and editing, N.H. All authors have read and agreed to the published version of the manuscript.

Funding

This study was supported by the Major Program of National Natural Science Foundation of China (No. 52293440, No. 52293442), and the National Natural Science Foundation of China (No. 52100051).

Institutional Review Board Statement

Not applicable.

Informed Consent Statement

Not applicable.

Data Availability Statement

The original contributions presented in this study are included in the article/Supplementary Materials. Further inquiries can be directed to the corresponding author.

Conflicts of Interest

Author Zibin Xu was employed by Liaoning Transportation Research Institute. The remaining authors declare that the research was conducted in the absence of any commercial or financial relationships that could be construed as a potential conflict of interest.

References

  1. Szczuka, A.; Huang, N.; MacDonald, J.A.; Nayak, A.; Zhang, Z.; Mitch, W.A. N-Nitrosodimethylamine formation during UV/hydrogen peroxide and UV/chlorine advanced oxidation process treatment following reverse osmosis for potable reuse. Environ. Sci. Technol. 2020, 54, 15465–15475. [Google Scholar] [CrossRef]
  2. Li, G.; Li, H.; Zhang, S.; Mi, X.; Guo, Y.; Song, Z.; Liu, Y.; Pan, H.; Wang, B.; Liu, Y.; et al. Effect of confined Mn oxides on regulating capability of activated coke for persulfate-based oxidation of a sweetener acesulfame. Water Cycle 2024, 5, 247–258. [Google Scholar] [CrossRef]
  3. Wise, B. Combining Ultrafiltration and Reverse Osmosis Technologies Key to Producing Pure Water for Power Plant Boilers [N/OL]. Available online: https://www.power-eng.com/emissions/combining-ultrafiltration-reverse-osmosis-technologies-key-producing-pure-water-power-plant-boilers/#gref (accessed on 24 September 2025).
  4. Lee, H.; Jin, Y.; Hong, S. Recent transitions in ultrapure water (UPW) technology: Rising role of reverse osmosis (RO). Desalination 2016, 399, 185–197. [Google Scholar] [CrossRef]
  5. Peters, T.A. Purification of landfill leachate with reverse osmosis and nanofiltration. Desalination 1998, 119, 289–293. [Google Scholar] [CrossRef]
  6. van de Lisdonk, C.A.C.; van Paassen, J.A.M.; Schippers, J.C. Monitoring scaling in nanofiltration and reverse osmosis membrane systems. Desalination 2000, 132, 101–108. [Google Scholar] [CrossRef]
  7. Van Hege, K.; Verhaege, M.; Verstraete, W. Electro-oxidative abatement of low-salinity reverse osmosis membrane concentrates. Water Res. 2004, 38, 1550–1558. [Google Scholar] [CrossRef] [PubMed]
  8. Van Hege, K.; Verhaege, M.; Verstraete, W. Indirect electrochemical oxidation of reverse osmosis membrane concentrates at boron-doped diamond electrodes. Electrochem. Commun. 2002, 4, 296–300. [Google Scholar] [CrossRef]
  9. Westerhoff, P.; Moon, H.; Minakata, D.; Crittenden, J. Oxidation of organics in retentates from reverse osmosis wastewater reuse facilities. Water Res. 2009, 43, 3992–3998. [Google Scholar] [CrossRef]
  10. Ersever, I.; Ravindran, V.; Pirbazari, M. Biological denitrification of reverse osmosis brine concentrates: I. Batch reactor and chemostat studies. J. Environ. Eng. Sci. 2007, 6, 503–518. [Google Scholar]
  11. Badruzzaman, M.; Oppenheimer, J.; Adham, S.; Kumar, M. Innovative beneficial reuse of reverse osmosis concentrate using bipolar membrane electrodialysis and electrochlorination processes. J. Membr. Sci. 2009, 326, 392–399. [Google Scholar] [CrossRef]
  12. Hajbi, F.; Hammi, H.; M’Nif, A. Reuse of RO desalination plant reject brine. J. Phase Equilibria Diffus. 2010, 31, 341–347. [Google Scholar] [CrossRef]
  13. Ji, X.; Curcio, E.; Al Obaidani, S.; Di Profio, G.; Fontananova, E.; Drioli, E. Membrane distillation-crystallization of seawater reverse osmosis brines. Sep. Purif. Technol. 2010, 71, 76–82. [Google Scholar] [CrossRef]
  14. Tang, F.; Hu, H.-Y.; Wu, Q.-Y.; Tang, X.; Sun, Y.-X.; Shi, X.-L.; Huang, J.-J. Effects of chemical agent injections on genotoxicity of wastewater in a microfiltration-reverse osmosis membrane process for wastewater reuse. J. Hazard. Mater. 2013, 260, 231–237. [Google Scholar] [CrossRef]
  15. Mainardis, M.; Buttazzoni, M.; De Bortoli, N.; Mion, M.; Goi, D. Evaluation of ozonation applicability to pulp and paper streams for a sustainable wastewater treatment. J. Clean. Prod. 2020, 258, 120781. [Google Scholar] [CrossRef]
  16. Yang, Y.-C.; Zeng, S.-S.; Ouyang, Y.; Sang, L.; Yang, S.-Y.; Zhang, X.-Q.; Huang, Y.-Y.; Ye, J.; Xiao, M.-T.; Zhang, N. An intensified ozonation system in a tank reactor with foam block stirrer: Synthetic textile wastewater treatment and mass transfer modeling. Sep. Purif. Technol. 2021, 257, 117909. [Google Scholar] [CrossRef]
  17. Liu, J.; Bai, X.; Bai, Y. Exploration and case analysis of treatment processes and reuse pathways for industrial brine wastewater in China. Water Cycle 2024, 5, 278–285. [Google Scholar] [CrossRef]
  18. Granzoto, M.R.; Seabra, I.; Malvestiti, J.A.; Cristale, J.; Dantas, R.F. Integration of ozone, UV/H2O2 and GAC in a multi-barrier treatment for secondary effluent polishing: Reuse parameters and micropollutants removal. Sci. Total Environ. 2021, 759, 143498. [Google Scholar] [CrossRef] [PubMed]
  19. Kharel, S.; Stapf, M.; Miehe, U.; Ekblad, M.; Cimbritz, M.; Falås, P.; Nilsson, J.; Sehlén, R.; Bregendahl, J.; Bester, K. Removal of pharmaceutical metabolites in wastewater ozonation including their fate in different post-treatments. Sci. Total Environ. 2021, 759, 143989. [Google Scholar] [CrossRef] [PubMed]
  20. Wang, F.; Huang, Y.; Zhuo, X.; He, C.; Li, Q. Molecular-level transformation characteristics of refractory organics in landfill leachate during ozonation treatment. Sci. Total Environ. 2020, 749, 141558. [Google Scholar] [CrossRef]
  21. Shi, X.; Chen, Z.; Lu, Y.; Shi, Q.; Wu, Y.; Hu, H.-Y. Significant increase of assimilable organic carbon (AOC) levels in MBR effluents followed by coagulation, ozonation and combined treatments: Implications for biostability control of reclaimed water. Front. Environ. Sci. Eng. 2021, 15, 68. [Google Scholar] [CrossRef]
  22. Xu, Z.B.; Wang, W.L.; Huang, N.; Wu, Q.Y.; Lee, M.Y.; Hu, H.Y. 2-Phosphonobutane-1,2,4-tricarboxylic acid (PBTCA) degradation by ozonation: Kinetics, phosphorus transformation, anti-precipitation property changes and phosphorus removal. Water Res. 2019, 148, 334–343. [Google Scholar] [CrossRef]
  23. Lee, H.-J.; Halali, M.A.; Baker, T.; Sarathy, S.; de Lannoy, C.-F. A comparative study of RO mem-brane scale inhibitors in wastewater reclamation: Antiscalants versus pH adjustment. Sep. Purif. Technol. 2020, 240, 116549. [Google Scholar] [CrossRef]
  24. Yu, W.; Song, D.; Chen, W.; Yang, H. Antiscalants in RO membrane scaling control. Water Res. 2020, 183, 115985. [Google Scholar] [CrossRef] [PubMed]
  25. Gryta, M. Polyphosphates used for membrane scaling inhibition during water desalination by membrane distillation. Desalination 2012, 285, 170–176. [Google Scholar] [CrossRef]
  26. Lin, Y.-P.; Singer, P.C. Inhibition of calcite crystal growth by polyphosphates. Water Res. 2005, 39, 4835–4843. [Google Scholar] [CrossRef] [PubMed]
  27. Wang, W.; Zhang, X.; Wu, Q.; Du, Y.; Hu, H. Degradation of natural organic matter by UV/chlorine oxidation: Molecular decomposition, formation of oxidation byproducts and cytotoxicity. Water Res. 2017, 124, 251–258. [Google Scholar] [CrossRef]
  28. Zhu, Z.; Jiang, X.; Ji, X.; Yin, J.; Shi, B.; Li, Y.; Qi, F. Effect of phosphorus on the performance of sulfur autotrophic denitrification. Water Cycle 2024, 5, 137–145. [Google Scholar] [CrossRef]
  29. Huang, N.; Xu, Z.; Wang, W.L.; Wang, Q.; Wu, Q.Y.; Hu, H.Y. Elimination of amino trimethylene phosphonic acid (ATMP) antiscalant in reverse osmosis concentrate using ozone: Anti-precipitation property changes and phosphorus removal. Chemosphere 2022, 291, 133027. [Google Scholar] [CrossRef]
  30. Wu, Y.; Yu, Y.; Li, X.; Hu, H.; Su, Z. Biomass production of a Scenedesmus sp. under phosphorous-starvation cultivation condition. Bioresour. Technol. 2012, 112, 193–198. [Google Scholar] [CrossRef]
  31. Zhang, F.; Xi, J.; Huang, J.J.; Hu, H.Y. Effect of inlet ozone concentration on the performance of a micro-bubble ozonation system for inactivation of Bacillus subtilis spores. Sep. Purif. Technol. 2013, 114, 126–133. [Google Scholar] [CrossRef]
  32. Xi, J.; Zhang, F.; Lu, Y.; Hu, H.-Y. A novel model simulating reclaimed water disinfection by ozonation. Sep. Purif. Technol. 2017, 179, 45–52. [Google Scholar] [CrossRef]
  33. HJ 828-2017; Water Quality—Determination of the Chemical Oxygen Demand-Dichromate Method. Ministry of Ecology and Environment of People’s Republic of China: Beijing, China, 2017.
  34. HJ 505-2009; Water Quality—Determination of Biochemical Oxygen Demand after 5 Days (BOD5) for Dilution and Seeding Method. Ministry of Ecology and Environment of People’s Republic of China: Beijing, China, 2009.
  35. Deng, H. Ozonation mechanism of carbamazepine and ketoprofen in RO concentrate from municipal wastewater treatment: Kinetic regimes, removal efficiency and matrix effect. Sci. Total Environ. 2020, 717, 137150. [Google Scholar] [CrossRef] [PubMed]
  36. Lee, M.Y.; Wang, W.L.; Du, Y.; Wu, Q.Y.; Huang, N.; Xu, Z.B.; Hu, H.Y. Comparison of UV/H2O2 and UV/PS processes for the treatment of reverse osmosis concentrate from municipal wastewater reclamation. Chem. Eng. J. 2020, 388, 124260. [Google Scholar] [CrossRef]
  37. Guvenc, S.Y.; Bayat, M.E.; Can-Gueven, E.; Varank, G. Hybrid and combined electro-oxidation and peroxi-coagulation processes in effective treatment of textile reverse osmosis concentrate. Chem. Eng. Sci. 2024, 298, 120365. [Google Scholar] [CrossRef]
  38. Ji, F.; Zhang, H.; Li, J.; Lai, B. Treatment of reverse osmosis (RO) concentrate from an old landfill site by Fe0/PS/O3 process. J. Chem. Technol. Biotechnol. 2017, 92, 2616–2625. [Google Scholar] [CrossRef]
  39. Wang, W.L.; Lee, M.Y.; Du, Y.; Zhou, T.H.; Yang, Z.W.; Wu, Q.Y.; Hu, H.Y. Understanding the influence of pre-ozonation on the formation of disinfection byproducts and cytotoxicity during post-chlorination of natural organic matter: UV absorbance and electron-donating-moiety of molecular weight fractions. Environ. Int. 2021, 157, 106793. [Google Scholar] [CrossRef]
  40. Zeng, Z.J.; Wu, Y.P.; Ye, B.; Wu, D.X.; Lee, M.Y.; Wu, Q.Y.; Wang, W.L. Molecular weight fraction-specific transformation of natural organic matter during hydroxyl radical and sulfate radical oxidation. Chem. Eng. J. 2024, 498, 155397. [Google Scholar] [CrossRef]
  41. Tang, X.; Wu, Q.-Y.; Zhao, X.; Du, Y.; Huang, H.; Shi, X.-L.; Hu, H.-Y. Transformation of anti-estrogenic-activity related dissolved organic matter in secondary effluents during ozonation. Water Res. 2014, 48, 605–612. [Google Scholar] [CrossRef] [PubMed]
  42. Tang, X.; Wu, Q.Y.; Du, Y.; Yang, Y.; Hu, H.Y. Anti-estrogenic activity formation potential assessment and precursor analysis in reclaimed water during chlorination. Water Res. 2014, 48, 490–497. [Google Scholar] [CrossRef]
  43. Tang, W.; Zhang, H. Exploring the Reaction Mechanism for Ozone Oxidation of Petrochemical Reverse Osmosis Concentrate by Resin Adsorption Chromatography. In Proceedings of the AASRI International Conference on Industrial Electronics and Applications (IEA 2015), London, UK, 27–28 June 2015; Atlantis Press: Dordrecht, The Netherlands, 2015; pp. 700–706. [Google Scholar]
  44. Loh, W.H.; Cai, Q.Q.; Li, R.; Jothinathan, L.; Lee, B.C.; Ng, O.H.; Guo, J.; Ong, S.L.; Hu, J.Y. Reverse osmosis concentrate treatment by microbubble ozonation-biological activated carbon process: Organics removal performance and environmental impact assessment. Sci. Total Environ. 2021, 798, 149289. [Google Scholar] [CrossRef] [PubMed]
  45. Chen, W.; Westerhoff, P.; Leenheer, J.A.; Booksh, K. Fluorescence excitation-Emission matrix regional integration to quantify spectra for dissolved organic matter. Environ. Sci. Technol. 2003, 37, 5701–5710. [Google Scholar] [CrossRef] [PubMed]
  46. Chen, Z.; Fang, F.; Shao, Y.; Jiang, Y.; Huang, J.; Guo, J. The biotransformation of soil phosphorus in the water level fluctuation zone could increase eutrophication in reservoirs. Sci. Total Environ. 2021, 763, 142976. [Google Scholar] [PubMed]
  47. Li, X.; Shen, S.; Xu, Y.; Guo, T.; Dai, H.; Lu, X. Application of membrane separation processes in phosphorus recovery: A review. Sci. Total Environ. 2021, 767, 144346. [Google Scholar] [CrossRef] [PubMed]
  48. Tanjung, R.H.R.; Indrayani, E.; Agamawan, L.P.; Hamuna, B. Water quality assessment to determine the trophic state and suitability of Lake Sentani (Indonesia) for various utilisation purposes. Water Cycle 2024, 5, 99–108. [Google Scholar] [CrossRef]
  49. Wang, X.X.; Wu, Y.H.; Zhang, T.Y.; Xu, X.Q.; Dao, G.H.; Hu, H.Y. Simultaneous nitrogen, phosphorous, and hardness removal from reverse osmosis concentrate by microalgae cultivation. Water Res. 2016, 94, 215–224. [Google Scholar] [CrossRef]
  50. Wang, X.X.; Zhang, T.Y.; Dao, G.H.; Xu, Z.B.; Wu, Y.H.; Hu, H.Y. Assessment and mechanisms of microalgae growth inhibition by phosphonates: Effects of intrinsic toxicity and complexation. Water Res. 2020, 186, 116333. [Google Scholar] [CrossRef]
  51. Hogard, S.; Pearce, R.; Gonzalez, R.; Yetka, K.; Bott, C. Optimizing ozone disinfection in water reuse: Controlling bromate formation and enhancing trace organic contaminant oxidation. Environ. Sci. Technol. 2023, 57, 18499–18508. [Google Scholar] [CrossRef]
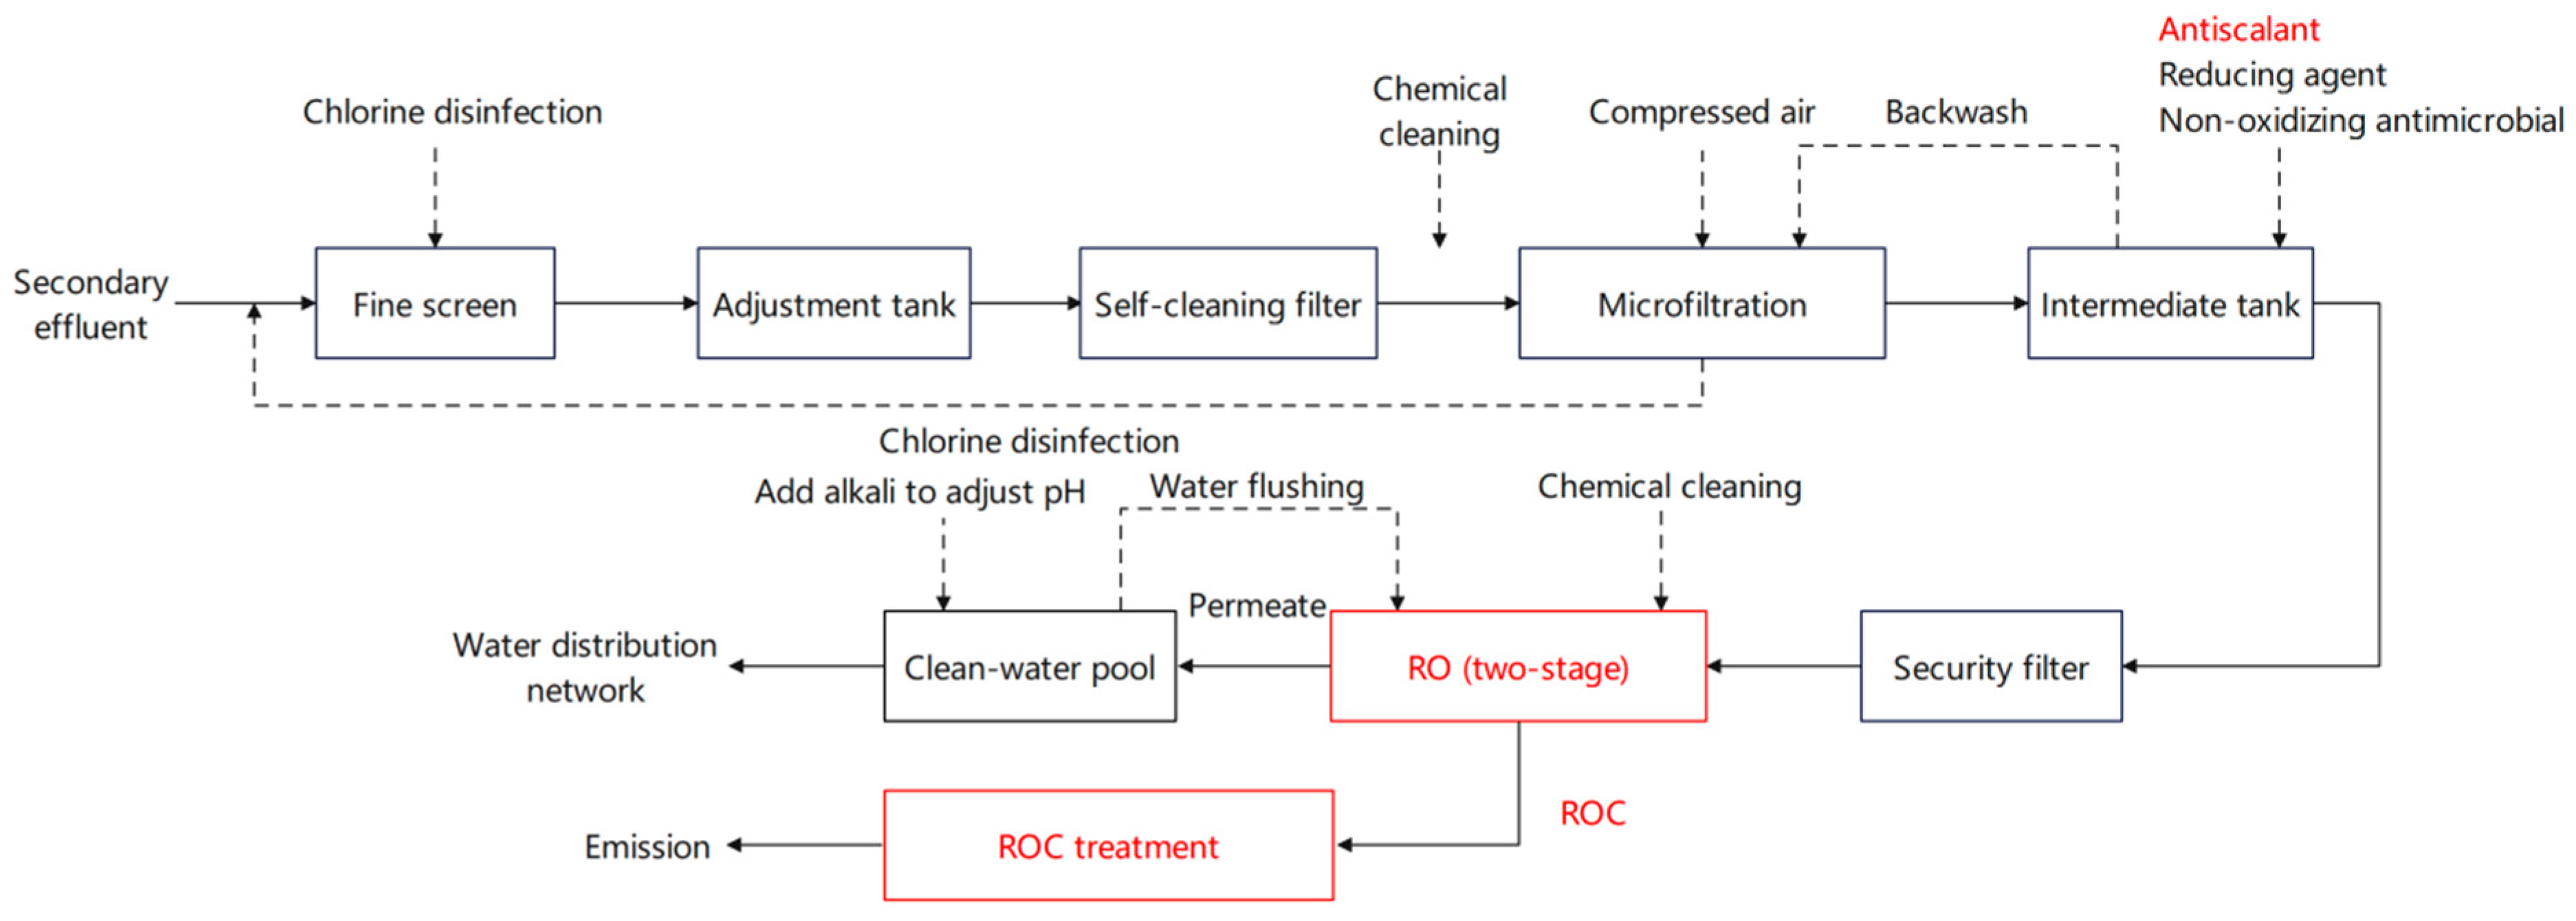
Figure 1. Process flow diagram of the reclaimed water treatment plant in Beijing.
Sustainability 17 09564 g001
Figure 2. Time-dependent variation in (a) the concentration difference in gaseous ozone entering and exiting the aeration reactor column; (b) transferred ozone dosage (TOD) over time during ozonation of reverse osmosis concentrate (ROC).
Sustainability 17 09564 g002
Figure 3. Instantaneous ozone demand (IOD) in ROC.
Sustainability 17 09564 g003
Figure 4. Changes in (a) COD, BOD5, and (b) BOD5/COD ratios in ROC under different ozone dosages.
Sustainability 17 09564 g004
Figure 5. Removal of organic compounds with different molecular weights in the ROC by ozonation (a) peak areas of organic compounds (b) percentage of each component.
Sustainability 17 09564 g005
Figure 6. Changes in UV254 and UV270 values during ozonation of ROC.
Sustainability 17 09564 g006
Figure 7. Effect of ozone dosage on chromophore-containing organic compounds with different molecular weights in the ROC. (a) peak area; (b) percentage of each component.
Sustainability 17 09564 g007
Figure 8. Effect of ozone dosage on three-dimensional fluorescence spectra of ROC.
Sustainability 17 09564 g008
Figure 9. Effect of ozone dosage on organic compounds in different regions of the three-dimensional fluorescence spectrum of ROC. (a) fluorescence regional integration, (b) percentage of fluorescence regional integration.
Sustainability 17 09564 g009
Figure 10. Changes in algal density and maximum algal density K in ROC containing PBTCA by ozonation and ozone/coagulation (a,c) Scenedesmus sp. LX1, (b,d) Chlorella sp. ZTY4. ([PBTCA]0 = 15 mg/L, ozonation time = 20 min, [PAC]0 = 50 mg/L).
Sustainability 17 09564 g010aSustainability 17 09564 g010b
Figure 11. Changes in algal density and maximum algal density K in ROC containing HEDP by ozonation and ozone/coagulation (a,c) Scenedesmus sp. LX1 (b,d) Chlorella sp. ZTY4 ([PBTCA]0 = 15 mg/L, ozonation time = 20 min, [PAC]0 = 50 mg/L).
Sustainability 17 09564 g011
Table 1. Water Parameters of ROC.
ParametersConcentration (mg/L)ParametersConcentration (mg/L)
COD141Na+285
BOD529.7K+65
TOC41Ca2+338
Alkalinity607Mg2+104
Acidity3.8NH4+1.2
Total Nitrogen37Cl652
Total phosphorus0.5SO42−365
Inorganic phosphorus0.3NO3113
Table 2. Substance types corresponding to each region in the three-dimensional fluorescence spectrum [45].
RegionCorresponding Substance
ITyrosine-containing aromatic proteins
IITryptophan-containing aromatic proteins
IIIFulvic acid humic substances
IVAromatic proteins, soluble microbial metabolites
VHumic acid-type humus
Disclaimer/Publisher’s Note: The statements, opinions and data contained in all publications are solely those of the individual author(s) and contributor(s) and not of MDPI and/or the editor(s). MDPI and/or the editor(s) disclaim responsibility for any injury to people or property resulting from any ideas, methods, instructions or products referred to in the content.