Abstract
While existing literature has explored the effects of financial technology on CO2 emissions, there has been limited research examining how variations in financial technology itself influence its impact on emissions. To supplement the shortness of existing literature, this paper empirically investigates the dynamic effects of economic growth, urbanization, and four dimensions of financial technology—mobile cellular technology, financial development, market development, and institutional development on CO2 emissions in the Gulf Cooperation Council (GCC) countries. The study utilizes annual time series data covering 24 years, from 2000 to 2023. To achieve the research objectives, a robust Auto-regressive Distributed Lag (ARDL) method was employed. The findings reveal a bidirectional causal relationship between CO2 emissions and economic growth, as well as between CO2 emissions and urbanization. Conversely, a one-way causal relationship was identified between financial development and financial institutions, and CO2 emissions. Based on these results, the study recommends that GCC countries promote renewable energy sources and low-carbon industries while gradually reducing reliance on fossil fuels. Additionally, this study suggested that policymakers focus on developing financial technology within their governments to facilitate the growth of a green economy and guide it towards an ecologically sustainable trajectory.
1. Introduction
The path to carbon neutrality appears distant for Gulf Cooperation Council (GCC) countries. These countries continue to experience rising carbon dioxide emissions due to oil production and various human activities [1]. Additionally, higher economic growth often leads to increased emissions. However, carbon intensity reductions in emissions per unit of GDP can help lower overall emissions. Historically, spikes in oil prices during the early 2000s and again in 2021–2022 have boosted export revenues, resulting in significant nominal GDP growth in GCC economies.
Economic growth and energy demand are tightly linked, with energy essential for economic progress [2]. Thus, a policy question remains regarding how GCC countries can formulate their economic strategies to address energy consumption, manage carbon dioxide emissions, and monitor environmental indicators. Moreover, economic growth in the GCC countries has prompted rural residents to migrate to cities for better earning opportunities. Additionally, the influx of foreign workers has led to rapid urbanization, increasing the demand for construction, transportation, housing, education, and employment. This expansion has led to higher energy consumption, urban air pollution, and increased carbon dioxide emissions [3]. GCC governments should therefore strategically address the needs of a growing population and slow urbanization to reduce carbon dioxide emissions and promote sustainable development. Financial technology effectively reduces carbon dioxide emissions and promotes sustainability [4]. As a result, GCC governments are encouraged to embrace green energy initiatives and foster the development of Fin-Tech to support the growth of a green economy.
Overall, economic growth, more people moving to cities, and rising energy use have worsened pollution and environmental issues in the GCC countries. In this study, however, we hypothesized that economic growth positively impacts carbon dioxide emissions in GCC countries. Given the strong connection between GDP and urbanization, we also hypothesized that urbanization positively affects carbon dioxide emissions. In the specific context of the Gulf Cooperation Council (GCC) countries, investments are still primarily associated with fossil fuel-based activities and high-carbon infrastructure, which requires the introduction of Fin-Techs in this environment since the latter are considered relevant and participatory tools to boost and transform more fluid financial markets that respond to a less polluting environment. In this context, innovations such as mobile payment systems, digital platforms or digital payments, blockchain-based solutions, the reduction in transaction costs through the phenomenon of digitalization, crowdfunding channels and direct loans without intermediaries expand access to digital financing and strengthen the transparency of financial activities. These mechanisms play a key role in directing investments towards emerging sectors, including renewable energy and low-carbon industries, improving the efficiency of capital allocation to invest in non-polluting projects such as services and creating new opportunities to redirect capital flows towards more sustainable sectors by reducing CO2 emissions and strengthening the resilience of the green economy.
While researchers have sought to explore the impact of financial technology on carbon dioxide emissions by developing a Fin-Tech index, a comprehensive understanding of the financial technology process remains elusive. To examine the significant effects of financial technology on carbon dioxide emissions, this study focuses on four dimensions: mobile cellular subscriptions, financial development, financial markets, and financial institutions. The main objective of this paper is to investigate the relationship between carbon dioxide emissions and three factors GDP, urbanization, and the four metrics of financial technology in the GCC countries, as well as examine their potential contribution to ecological sustainability in the GCC region.
Apart from Section 1, the subsequent sections of this paper are structured in the following order. Section 2 reviews the literature on the determinants of carbon dioxide emissions. Section 3 outlines the methodology and data utilized in the study. Section 4 presents the empirical results, and Section 5 concludes the paper, offering some policy recommendations.
2. Literature Review
The literature review is organized around the pairwise correlation between carbon dioxide (CO2) emissions and three key variables examined in this study: economic growth (GDP), urbanization (URB), and financial technologies (Fin-Tech). The final subsection summarizes the literature on CO2 emissions in relation to these variables, specifically for the study area GCC countries covering the period from 2010 to 2025.
2.1. Economic Growth on Carbon Dioxide Emissions
Over the past two decades, much of the literature has examined the relationship between environmental degradation, using CO2 emissions as a proxy, and economic growth. As a result, reviewing all the existing research can be challenging. However, the following extensive review highlights the most recent and relevant studies, showcasing previous findings and the conclusions drawn from their results. Arguably, the causal nexus between CO2 emissions and economic growth is unclear, due to conflicting empirical findings regarding this relationship. Among these, many recent studies employ the bound test for integration and the Granger Causality test to examine the influence of economic growth and other variables on CO2 emissions. However, these studies yield conflicting results regarding the effect of economic expansion on carbon emissions. For instance, Esso and Keho (2016) in African countries [5], Riti et al. (2017) in China [6], Muhammad (2019) in MENA (Middle East and North Africa) and developed countries [7], and Salari et al. (2021) in the United States found that economic expansion adversely affects the environment, suggesting that increased economic growth leads to reduced CO2 emissions [8]. In contrast, Wang et al. (2016) conducted a study in China that found no evidence supporting a direct relationship between economic growth and CO2 emissions [9]. Additionally, Begum et al. (2015) identified various causal relationships between CO2 emissions and economic growth in Malaysia [10]. They discovered that GDP did not lead to a reduction in environmental degradation, contrary to predictions made by the Environmental Kuznets Curve (EKC) model during the period from 1970 to 1980. These results are confirmed by [11].
Furthermore, the EKC hypothesis was not validated for the period from 1980 to 2009 in Malaysia. This result is supported by [7] in emerging countries. However, in the MENA region and developed countries, the study provides evidence to support the hypothesis that GDP has a positive effect on CO2 emissions. Apart from that, Ahmad et al. (2017) partially supported earlier findings by examining the relationship between GDP and CO2 emissions in Croatia from 1992 to 2011 [12]. Furthermore, Mardani et al. (2019), based on a systematic review of two decades of research from 1995 to 2017, found that economic growth has a bidirectional effect on CO2 emissions [13]. The discrepancies in the results of these studies may arise from the different countries examined, the time periods analyzed, and the methodologies applied. Furthermore, Işık et al. (2024) investigated the relationship between economic growth and CO2 emissions in a sample of 27 OECD countries over the period 2001 to 2020 [14]. Their findings reveal a positive effect, indicating that economic expansion, driven by a heavy reliance on fossil energy, contributes to environmental degradation.
2.2. Urbanization on Carbon Dioxide Emissions
The relationship between CO2 emissions and urbanization has been the subject of investigation by several scholars. A selection of recently published articles in scholarly international journals from the Web of Science database highlights the primary findings regarding this relationship. Most prior studies have used the urbanization rate—the proportion of the urban population to the total population as an index of urbanization [15]. For instance, Cao et al. (2015) employed a threshold method to analyze data spanning from 1979 to 2013, demonstrating that urbanization increases carbon dioxide emissions once a certain threshold is crossed in China [16]. Similarly, Wang and Wang (2021) utilized semi-parametric panel data and an ARDL model to explore the relationship between urbanization and CO2 emissions in OECD countries [17]. Their findings indicate that urbanization significantly contributes to CO2 emissions, revealing consistent effects across OECD nations.
Bai et al. (2018) examined the period from 2006 to 2013 in China, using STIRPAT and two-stage least squares methods [18]. They confirmed that the urban population has a direct influence on CO2 emissions. Furthermore, Wu et al. (2016) focused on developing countries, particularly China, suggesting that a higher urbanization rate, combined with the energy carbon emission coefficient and energy intensity, leads to increased carbon emissions [19]. In a separate analysis, Sheng and Guo (2016) investigated both the long-term and short-term effects of urbanization on CO2 emissions in China, covering the period from 1995 to 2011 [20]. They utilized mean group (MG), pooled mean group (PMG), and dynamic fixed effect (DFE) estimation methods. Their findings reveal that the urbanization rate affects CO2 emissions in both the short and long run; however, the impact is significantly smaller in the short run compared to the long run.
The studies mentioned earlier, as well as previous research examining the effects of urbanization on carbon dioxide emissions, often neglect key dimensions of urbanization, such as land use, economic factors, and social dynamics [15]. These factors can significantly influence CO2 emissions through various urban processes [21]. As a result, some researchers have started to explore the impact of urbanization on CO2 emissions from multiple perspectives. For instance, Ahmad et al. (2017) conducted a study in the Pearl River Delta region from 1990 to 2013 and found noteworthy results when analyzing three dimensions of urbanization [12]. They assert that urbanization has two opposing effects on CO2 emissions: while land and economic urbanization contribute to increased CO2 emissions, population urbanization appears to have an adverse effect on these emissions. Similarly, Ouyang and Lin (2017) performed a comparative study of CO2 emissions between China and Japan, examining various stages of urbanization to identify similarities and differences in the factors influencing CO2 emissions [22]. They found that different stages of urbanization such as infrastructure development, industrial growth, and transportation expansion also lead to increased CO2 emissions. Furthermore, their study supports the Energy Consumption-Kuznets Curve (ECK) hypothesis, indicating that energy intensity, along with GDP, plays a significant role in influencing CO2 emissions in China.
2.3. Financial Technologies on Carbon Dioxide Emissions
Several studies have investigated the impact of financial technologies on carbon dioxide (CO2) emissions and their potential to reduce environmental intensity. Anwar et al. (2024) developed both a green finance index and a Fin-Tech index, utilizing various metrics to provide insights into financial inclusion and technological adoption in Australia from 2000 to 2020 [23]. The authors recommend that the Australian government establish a supportive environment for financial and technological innovations, emphasizing the vital role of Fin-Tech and green finance in achieving Australia’s carbon neutrality targets.
Similarly, financial technologies have been reported to lower CO2 emissions by promoting green finance across Chinese provinces. However, CO2 emissions differ significantly among China’s Eastern, Central, and Western provinces [24]. Zeng and Jiang (2025) examined the relationship between financial technology and urban carbon development in 276 Chinese cities from 2008 to 2023 [25]. Their dual fixed-effects model suggests that green innovation mediates a positive relationship, enabling Fin-Tech to enhance environmental outcomes, particularly in terms of overall energy efficiency. Interestingly, the findings highlight that non-central cities are more effective in utilizing Fin-Tech for environmental enhancements than metropolitan areas. These findings are corroborated by [26], who found that the development of financial markets contributes to lower CO2 emissions, as evidenced by their analysis of China over the period 2005 to 2021.
Zia et al. (2024) employed two measures: credit measured in millions of USD and total investment in environmental protection activities, to assess the effects of Fin-Tech and green finance on CO2 emissions [27]. Their study reveals a significant connection between Fin-Tech, green finance, and energy poverty among EU countries from 2013 to 2020. Consequently, the authors urge EU governments to invest in the Fin-Tech industry, which is crucial for enhancing environmental effectiveness. Sunday et al. (2023) investigated the nexus between CO2 emissions and financial development in MINT countries over the period 1969 to 2019 [28]. By employing a causality test, their study revealed the presence of a unidirectional causal relationship, highlighting the role of financial development in mitigating CO2 emissions in these countries.
More recently, Jiang et al. (2025) investigated the role of internal and external Fin-Tech mechanisms in reducing spatial carbon dioxide emissions in China between 2012 and 2022 [29]. The authors discovered a negative correlation between the Fin-Tech index, the number of companies in each region, and carbon dioxide emissions. Therefore, adopting financial technology can promote innovation in green technologies among regional companies, ultimately lowering CO2 emissions.
Some efforts have been made to evaluate the regional effects of Fin-Tech on carbon dioxide emissions. Wu et al. (2024) conducted a study examining the relationship between China’s green finance index and carbon emissions efficiency from 2006 to 2022 [30]. They found that regional economic development and innovation are crucial pathways through which green finance significantly enhances carbon emissions efficiency.
Against this background, Liu and Song (2020) performed a spatial and temporal analysis to explore the patterns of carbon intensity in China since the global financial crisis [31]. They used the Spatial Durbin Model to assess the impact of financial development on carbon intensity. Their findings revealed that while financial development increases emissions in the local area, it significantly decreases emissions in neighboring regions.
The works emphasize the relevance of financial technology in relation to carbon dioxide emissions. However, much of the existing research primarily relies on proxy indicators to link financial technology with CO2 emissions, neglecting to examine how this overall measure or index affects environmental quality. While numerous studies have investigated the association between financial technology and CO2 emissions, the existing literature often fails to explain how variations in financial technology processes influence these emissions. This limitation hinders the pinpointing of specific contributions of financial technology based on its sources.
However, these studies cannot be directly compared with those conducted in the GCC countries to examine the relationship between Fin-Tech and CO2 emissions. This limitation stems from the specific characteristics of these economies, which are heavily reliant on oil exports. Their distinctiveness is reinforced by structural dependence on hydrocarbons, the high proportion of foreign workers and the resulting rapid urbanization, as well as substantial fossil fuel subsidies. Unlike in industrialized countries, such subsidies encourage firms to increase the consumption of these energy sources, thereby exacerbating environmental degradation and intensifying CO2 emissions. For example, Si and Rahman (2024) highlighted the prominent role of Gulf countries in adopting advanced technologies to enhance export competitiveness [32]. The authors emphasize that technological innovation particularly through the adoption of information and communication technologies plays a crucial role in reducing CO2 emissions. To supplement the shortness of existing literature, this study incorporates economic growth, urbanization, and four aspects of financial technology–mobile cellular subscriptions, the financial development index, the financial markets index, and the financial institutions index, frequently overlooked in prior studies. The objective is to investigate how these factors affect carbon dioxide emissions in Gulf Cooperation Council (GCC) countries from 2010 to 2023, especially since previous works may not provide accurate assessments of financial technology by source.
2.4. Summary of the Existing Literature on CO2 Emissions and Other Variables for GCC Countries (2010–2025)
Previous studies shed light on the complex relationships among several key variables, including carbon dioxide emissions, financial development, renewable energy consumption, economic growth, urbanization, population, Fin-Tech, green finance, innovation, industrialization, and information and communication technology. Many of these studies demonstrate strong correlations between these factors and carbon dioxide emissions. Among those investigating the impact of economic growth on carbon dioxide emissions, conflicting results emerge even within the same region of study. For example, Mahmood et al. (2022) find that economic growth increases carbon dioxide emissions in Kuwait, Oman, Qatar, and Saudi Arabia, while it decreases carbon intensity in Bahrain, Kuwait, and the UAE [33]. In contrast, Dkhili and Ben Dhiab (2019) report no evidence that economic growth causes carbon dioxide emissions in the context of the Gulf Cooperation Council (GCC) countries [34]. This implies that we cannot definitively support the Environmental Kuznets Curve (EKC) hypothesis [35], as some studies have refuted it, and the connection between economic growth and carbon dioxide emissions in GCC countries remains uncertain.
The second variable examined in our study was the urbanization factor, which has been included in many previous studies. Urbanization is associated with an increase in carbon dioxide emissions [33]. A likely explanation for this trend is the heightened energy consumption resulting from transportation and construction activities, both of which contribute to CO2 emissions. The third focus variable, which may be this study’s defining contribution, is the financial technology factor. Unlike previous studies, we analyze four specific metrics rather than relying on a single overall financial technology index. Numerous studies have regressed financial technology against carbon dioxide emissions, demonstrating that this factor contributes to increased environmental carbon intensity [36]. While financial technology has been extensively studied in relation to carbon emissions, few studies have explored its effects based on different sources.
The studies indicate a common criticism concerning data selection. When assessing the impact of financial technology on carbon dioxide emissions, many studies have depended on broad measures or indices that may not effectively capture the impacts of financial technology by source. Another concern is the selection of suitable panel estimation techniques. Nearly all studies employ panel methods that do not account for cross-sectional dependence. To supplement these limitations, this study empirically investigates the dynamic influence of economic growth, urbanization, and four dimensions of financial technology on carbon dioxide emissions in the Gulf Cooperation Council (GCC) countries. These four aspects of financial technology are expected to have different impacts on emissions.
3. Materials and Methods
3.1. Study Area
The member states of the Gulf Cooperation Council (GCC) play a critical role in understanding how economic growth, urbanization, and financial technologies (Fin-Tech) influence CO2 emissions. These countries are heavily reliant on hydrocarbons and rank among the highest in the world for per capita CO2 emissions, which poses significant challenges for their energy transition. Rapid economic growth and urbanization fueled by oil revenues and investments in infrastructure have led to increased energy consumption. Additionally, nations such as the United Arab Emirates, Bahrain, and Saudi Arabia are undergoing a rapid digital transformation through Fin-Tech, which is also affecting energy usage as digital infrastructure expands. Therefore, selecting GCC countries as the study area was due to their characteristics that make them suitable for analyzing the links between CO2 emissions and financial technology (cf. Figure 1).
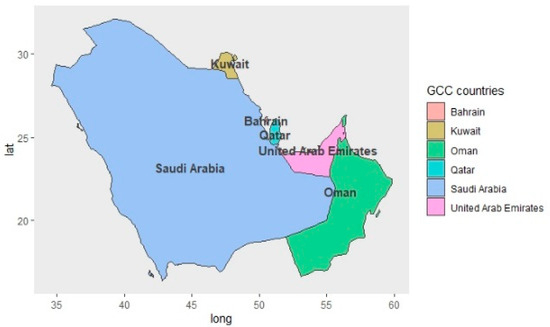
Figure 1.
Study area–GCC countries.
In the following section, we conduct a comparison of the variables used for the Gulf countries to demonstrate the rationale behind focusing our study on this region rather than on other countries (cf. Table 1).

Table 1.
Comparing variables among countries studied (CCG).
Based on the datasets employed in our study (sources: World Bank and WDI), Qatar emerges as the highest CO2 emitter among the countries considered. This observation underscores the necessity of adopting Fin-Tech-driven intervention measures to safeguard its environment, despite the country exhibiting a GDP level comparable to that of other nations in the region.
3.2. Data Collection
The data related to CO2 emissions, economic growth (GDP), urbanization, and Fin-Tech measured by mobile cellular, financial development, market development, and institutional development cover the period from 2000 to 2023, comprising 144 observations across the six Gulf Cooperation Council (GCC) countries. These indicators were extracted from the World Bank Group (WBG) and the World Development Indicators (WDI) database. This study aims to assess the level of CO2 emissions, identify its determinants, and propose strategies to mitigate its impact on environmental degradation in GCC countries, thereby contributing to a reduction in climate change. Urbanization (approximated by total population) was used as a control variable in the analysis. A detailed description of the variables and the sources of the data is presented in the table below (cf. Table 2).
Table 2.
Data description and their sources employed in this study.
3.3. Economic Approach
In this study, we have chosen to employ the Auto-regressive Distributed Lag (ARDL) approach, which is considered the most suitable framework for analyzing the relationship between carbon emissions and their determinants. Therefore, we proceed to investigate the impact of macroeconomic factors, including economic growth, the Financial Development Index, the Financial Institutions Index, the Financial Markets Index, mobile cellular subscriptions, and urbanization, on CO2 emissions. This approach, introduced by [37] and subsequently refined by [38], offers several advantages compared to other cointegration techniques, notably those developed by [39]. In the ARDL model estimation, the dependent variable is explained by its own lagged values as well as by the lagged values of the independent variables. The model incorporates both first-order and zero-order lags, with the optimal lag length determined based on appropriate selection criteria. This heterogeneity in the orders of integration renders classical methods, such as Vector Autoregressive (VAR) and Vector Error Correction Models (VECM), inapplicable, as these approaches require all variables to be integrated of the same order. So, the functional form of the model in this study is expressed as:
By adopting this approach, we can examine both the short-run and long-run effects of the dependent variable and the explanatory variables. To analyze the long-term, the ARDL model can be specified as follows:
wherein:
- α1, α2, … α7: reflect the long run estimates.
- The null hypothesis states that α1 = α2 = α3 = α4 = α5 = α6 = α7 = 0.
- The alternative hypothesis states that α1 ≠ α2 ≠ α3 ≠ α4 ≠ α5 ≠ α6 ≠ α7 ≠ 0.
H0.
The null hypothesis indicates the absence of cointegration; therefore, the variables (MCS, FII, FMI, FDI, GDP, and URB) do not affect CO2.
H1.
The alternative hypothesis suggests the existence of a cointegrating relationship. The relationship linking these variables highlights the impact of GDP, urbanization, and Fin-Tech on CO2 emissions.
To assess the short-term cointegration relationship between CO2 emissions and their determinants, the ARDL model can be specified as follows:
wherein:
- β1, β2, …, β7 reflect the short-run estimates. These coefficients of the first differences (Δ) offer an interpretation in terms of short-run dynamics.
- The null hypothesis (as defined above) indicates that β1 = β2 = β3 = β4 = β5 = β6 = β7 = 0.
- The alternative hypothesis (as defined above) denotes that β1 ≠ β2 ≠ β3 ≠ β4 ≠ β5 ≠ β6 ≠ β7 ≠ 0.
Based on Equations (2) and (3), we found that the specification ARDL model used in this study to examine both the short-run and long-run effects between the dependent variable and the explanatory variables is represented as follows:
wherein:
- represent carbon emissions, GDP growth, Financial Development Index, Financial Markets Index, Financial Institutions Index, Mobile cellular subscriptions, and Urban population, respectively.
- t presents the period, 2000 to 2023.
- The ARDL model is flexible, as it allows for a different number of lags for each variable, optimized using information criteria such as AIC, BIC, or HQC.
According to Table 3, the tests (AIC, HQIC, and BIC) reach their lowest level at lag 1. Thus, we selected lag one as the preferred option for all variables.
Table 3.
Lag length selection test.
4. Statistical Analysis
4.1. Descriptive Statistics
Table 4 presents the descriptive statistics of the variables, showing that CO2 emissions average 26.59, with values ranging from 11.5 to 53.6, indicating considerable disparities across countries. GDP growth records an average of 4.27% and a standard deviation of 4.91%, with rates varying from −5.91% to 26.2%. This substantial variation reflects a marked heterogeneity in the economic conditions of the countries analyzed, with some facing difficulties while others experience significant expansion. Mobile phone use averages 123 subscriptions per 100 inhabitants but remains highly uneven, ranging from 6 to 229.71. This highlights a pronounced disparity in access to and use of mobile telephony across countries, with some enjoying high levels of connectivity while others are far less equipped. Financial development is moderate, with an average of 0.44 and minor differences across countries. Market development shows an average of 0.48, with values ranging between 0.18 and 0.77. Institutional development remains relatively low (mean of 0.38) and homogeneous (0.06). Finally, urbanization is high, with an average urban population of 88.76%, varying moderately between 71.5% and 100%.
Table 4.
Some statistics on the dataset.
4.2. Stationarity Test of Variables
In our study, we employ the Fisher-ADF test, which is based on an approach that combines the p-values of the Augmented Dickey-Fuller (ADF) tests performed individually on each unit of the panel.
The p-values are associated with the various statistics in the Fisher-ADF test. A variable is considered stationary if at least one p-value is less than 0.05. These results indicate that some variables have a unit root, and they are identified as non-stationary, so they need to be differentiated or transformed to avoid misleading results in subsequent regressions. The presence of non-stationarity in certain variables (gdp, mobile_cell, dev_inst, urban_pop) can lead to estimation problems in panel econometrics. For this reason, stationarity tests are an essential step to ensure the robustness of our model (cf. Table 5).
Table 5.
Stationarity test of level variables.
4.3. Stationarity Test at First Difference
The objective of these tests is to determine whether the variables under consideration are stationary at first difference. The test employed here is the Fisher test, based on Phillips–Perron tests applied to panel data. Test hypotheses:
- H0 (null hypothesis): All series contain a unit root (they are non-stationary).
- H1 (alternative hypothesis): At least one series is stationary.
All variables are stationary at first difference (p-value < 0.05 for all tests). This indicates that they can be used in models that require stationary series. Furthermore, the variables analyzed (dgdp_growth, dmobile_cell, ddev_inst, durban_pop) are stationary at first difference. This implies that they were non-stationary at the level and that the first difference successfully removed the stochastic trend. The stationarity analysis was conducted on seven variables using the Fisher test based on the Phillips–Perron procedure. This test allows for determining whether a series is stationary at the level or whether differencing is required to eliminate a stochastic trend. Thus, following these tests, the results show that three variables (CO2, dev_fin, dev_market) are stationary at level I (0), while four variables (gdp, mobile_cell, dev_inst, urban_pop) become stationary after first differencing (I(1)). For more details, see Table 6.
Table 6.
Test at first difference.
4.4. Panel Cointegration Test (Pedroni Test)
For further analysis, it would be relevant to examine the cointegration among the variables to determine whether a long-term equilibrium relationship exists. To analyze the long-term cointegration relationship, three statistics from the Pedroni test were employed (Modified Phillips–Perron t, Phillips–Perron t, Augmented Dickey–Fuller t) to assess the joint significance of the coefficients of the lagged indicators.
The results indicate that the three statistics from the Pedroni test reject the null hypothesis of no cointegration at the 5% significance level, suggesting the existence of a long-term relationship among the variables. This justifies the possibility of adopting the ARDL model (cf. Table 7).
Table 7.
Pedroni cointegration test.
4.5. Cointegration Test: The Pesaran Bounds Test
One of the primary advantages of the ARDL model is its ability to test for the presence of a long-term relationship between variables using the Bounds Test. This test relies on the estimation of an error correction model (ECM) derived from the ARDL model:
where
- X represents the independent variable: .
- γ represents the speed of adjustment towards the long-term equilibrium.
- is the first difference operator.
- θ is the long-term coefficient. The cointegration test involves checking whether Y{t−1} − θ X{t−1} is statistically significant.
5. Results
Given the structure of our data and the need to analyze the dynamic relationships between the variables in both the short and long term, the ARDL model is the most suitable approach for our study. The ARDL model is a powerful tool for analyzing economic relationships when the variables are integrated into different orders. It allows for examining both short-term dynamics and long-term relationships through the cointegration test. Due to its flexibility and efficiency, it constitutes a robust method for our empirical study. The estimation of the ARDL model allows for assessing the dynamics between CO2 emissions and its determinants, such as GDP growth, mobile cellular, dev_fin, dev_market, dev_inst, and urban pop, from 2000 to 2023, applied to the GCC countries (Saudi Arabia, Kuwait, United Arab Emirates, Oman, Qatar and Bahrain).
5.1. The ARDL Estimation Results
By adopting the panel ARDL approach, the results reported in the table below indicate that the estimated model is highly significant, statistically robust, and reliable. It successfully captures the dynamics of CO2 emissions by incorporating explanatory variables that appear relevant in the context of GCC countries, as evidenced by the high coefficient of determination (R2 = 0.9564). Moreover, the F-statistics are significant at the 1% level, which confirms the relevance and suitability of the model in the context under study. The advantage of this method lies in its enhanced efficiency and robustness in identifying both short- and long-run relationships, by highlighting the effects of the independent variables on the dependent variable (cf. Table 8).
Table 8.
ARDL estimation results.
Figure 2 illustrates the trend in CO2 emissions in the Gulf countries. According to the graph, CO2 emissions in Qatar appear to be the most dynamic compared to those of the other countries, which suggests that the government lacks effective environmental protection policies. This situation exacerbates ecological sustainability challenges and consequently contributes to global warming.
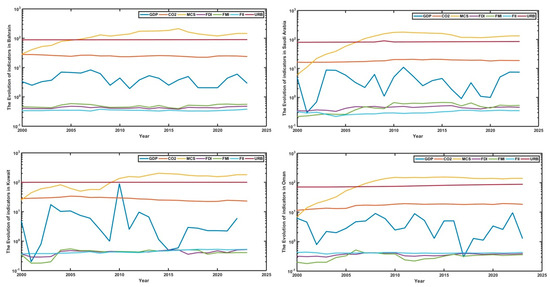
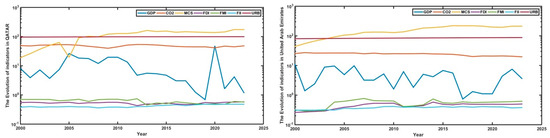
Figure 2.
Trends in Carbon Dioxide Emissions and related variables in GCC Countries (2000–2023).
Figure 2 also depicts the trends of various economic indicators considered in this study. Mobile cellular subscriptions show the most pronounced growth across all countries analyzed. In contrast, the trends in GDP and urbanization closely mirror those of CO2 emissions, suggesting that these two factors are the primary drivers of CO2 emissions.
In several cases, the curves indicate that higher population levels are associated with increased carbon emissions, reflecting the scale effect of population on environmental degradation. However, the strength of these relationships varies by country, pointing to the influence of structural differences in energy use, industrialization levels, and environmental policies.
Overall, these trends support the hypothesis that economic and demographic factors are significant determinants of carbon emissions in the GCC countries. The differences across countries underline the importance of context-specific approaches to sustainable development.
5.2. Granger Causality Test Results
In this section, we examine the existence of a bidirectional relationship between the dependent variable and each of the independent variables individually, by applying the [40] causality test. As shown in the table below, a two-way causal relationship exists between CO2 emissions and economic growth, a finding also supported by [41]. Specifically, economic growth leads to increased CO2 emissions, particularly due to the intensive use of chemical products in industrial enterprises. Conversely, high levels of CO2 emissions can hinder national economic growth, primarily through their contribution to climate change, which adversely affects the agricultural sector, reducing its productivity and, consequently, national output. A bidirectional relationship was also found between CO2 emissions and mobile cellular subscriptions. This bidirectional relationship indicates a complex interplay between digitalization and environmental sustainability, underscoring the need to develop greener communication technologies while aligning with climate objectives.
A one-way direction relationship from financial development to CO2 emissions suggests that improvements in the financial sector, such as increased credit availability, can drive economic activities that lead to higher carbon emissions.
The bidirectional causality detected between CO2 emissions and urbanization indicates a mutually reinforcing dynamic, whereby urban growth contributes to increased carbon emissions through higher energy consumption, transportation demand, and industrial activities, while rising CO2 emissions may, in turn, influence urban development patterns through environmental degradation, climate-related constraints, and shifts in infrastructure planning.
The identification of a unidirectional relationship from financial markets to CO2 emissions suggests that financial market development acts as a driving force behind environmental outcomes, particularly by enabling greater access to capital for investment in economic activities that may be carbon-intensive. This implies that as financial markets expand and become more efficient, they can indirectly contribute to higher emissions through increased industrial output, energy consumption, and infrastructure development. The observed unidirectional causality from financial institutions to CO2 emissions suggests that improvements in financial infrastructure, such as increased access to banking services, enhanced credit availability, or improved financial intermediation, can stimulate economic activities that result in higher carbon emissions. Table 9 displays the nature of the causal relationship between the variables.
Table 9.
Results of Dumitrescu & Hurlin (DH) Granger causality.
6. Discussion
According to the results reported in Table 8, there is evidence of both short- and long-term significance in the relationship between CO2 emissions and the variables under study (GDP, MCS, FII, and URB). More specifically, approximately 91% of the emissions from the previous year continue to influence current emissions. This finding suggests that a large portion of emissions is structural, being tied to carbon-intensive energy infrastructures, which explains why emissions do not decrease rapidly despite the implementation of environmental policies. In the short run, an increase in economic growth leads to higher CO2 emissions, reflecting the classical effect of economic expansion, where intensified industrial and energy activities drive emissions upward. This result highlights the environmental impact of economic growth, which may threaten long-term sustainability.
However, the adverse lagged effect suggests that, in the medium term, productivity gains or a transition toward a greener economy may partially offset the initial increase in emissions. These findings corroborate those of [42], who, based on their analysis of 20 countries, concluded that national production significantly contributes to environmental degradation in the long run. In contrast, in the short run, production has no significant impact on CO2 emissions. In contrast, Cherni and Jouini (2017) and Habib et al. (2021) confirm our results, showing that economic growth leads to an increase in CO2 emissions, as it stimulates the consumption of fossil fuels [43,44].
Regarding the effect of urbanization (URB), the results reveal a positive short-term effect and an adverse lagged effect. In fact, an increase in the urban population leads to higher CO2 emissions, which is consistent with the concentration of industrial activities, transportation, and energy consumption in cities. However, in the long run, the effect turns negative, suggesting that urban density effects and public policies contribute to reducing the carbon footprint of cities. The findings of this study contradict the conclusions of [42], who demonstrated that there is no long-term effect of population on CO2 emissions. In contrast, in the short run, population growth may contribute to a reduction in emissions.
The initial reduction in CO2 emissions following the increase in mobile penetration (MCS) may be attributed to improved connectivity and the digitalization of services, which reduce physical mobility and reliance on traditional energy sources. However, the positive lagged effect suggests that, over time, the environmental costs associated with digital infrastructure, including the energy consumption of data centers, servers, and the production of electronic devices, may offset these initial gains.
Regarding the effect of financial development (FDI), no statistically significant impact on CO2 emissions is observed. This lack of a clear relationship may be attributed to the dual role of financial development: on the one hand, it may foster investment in cleaner and more sustainable infrastructure; on the other hand, it may facilitate access to credit and capital for highly polluting industries. Consequently, these two opposing effects may cancel each other out, explaining the lack of statistical significance. Based on these results, financial markets do not appear to play a decisive role in the energy transition or in reducing CO2 emissions.
As for the effects of institutional development (FII), the results indicate a positive short-term effect and a negative lagged effect. Improvements in institutional quality are associated with an increase in CO2 emissions, possibly due to stronger economic governance and an enhanced capacity to attract investment, including in energy-intensive sectors. However, in the long run, the effect becomes negative, suggesting that stronger institutions subsequently promote the implementation of effective environmental policies and better energy management practices. This finding is consistent with empirical evidence showing that countries with higher-quality institutions tend to adopt strict environmental regulations more rapidly.
7. Conclusions and Recommendations
The objective of this research is to examine the impact of Fin-Tech integration, along with economic growth and urbanization, on carbon dioxide emissions within a panel of Gulf Cooperation Council (GCC) countries, namely Saudi Arabia, Kuwait, Bahrain, Qatar, the United Arab Emirates, and Oman, over the period 2000–2023. By adopting the ARDL approach, which proved to be the most suitable for our analysis, we investigated the existence of a cointegration relationship and Granger causality among the variables. The Granger causality test was employed to identify the presence of short- and long-term causal relationships between them. The main challenge was to assess the influence of economic growth, urbanization, and particularly Fin-Tech on environmental degradation, as measured by CO2 emissions.
According to our findings, economic growth exerts an ambiguous effect on CO2 emissions. While it initially drives emissions upward, a corrective medium-term effect suggests a gradual transition toward a cleaner economy. Institutional development, although it may intensify emissions in the short run, plays a decisive role in their long-term reduction by enabling the implementation of effective environmental policies. Similarly, urbanization follows a “pollute-then-correct” trajectory, highlighting the importance of green infrastructure and sustainable transport policies. Finally, digitalization represented by mobile penetration presents a paradox: it initially contributes to reducing emissions but subsequently generates environmental costs, underscoring the need for targeted policies to steer the digital economy toward greater sustainability.
Considering these results, governments should seek to promote renewable energy sources and low-carbon industries while gradually reducing dependence on fossil fuels. At the same time, they should foster green technological innovation and direct digitalization efforts toward an ecologically sustainable trajectory.
This research could be further enhanced by incorporating additional Fin-Tech variables, such as the penetration rate of electronic wallets or transactions in crypto-assets and blockchain.
Author Contributions
Conceptualization, M.I.A. and F.C.; methodology, F.C.; software, F.C.; validation, M.I.A. and F.C.; formal analysis, F.C.; investigation, M.I.A.; resources, F.C.; data curation, F.C.; writing—original draft preparation, F.C.; writing—review and editing, M.I.A.; visualization, supervision and project administration, M.I.A. All authors have read and agreed to the published version of the manuscript.
Funding
This research received no external funding. The APC was funded by the authors.
Institutional Review Board Statement
Not applicable.
Informed Consent Statement
Not applicable.
Data Availability Statement
Data will be provided upon request, subject to the consent of all authors.
Conflicts of Interest
The authors declare that they have no known competing financial interests or personal relationships that could have appeared to influence the work reported in this paper.
References
- Alharbi, F.R.; Csala, D. Gulf cooperation council countries’ climate change mitigation challenges and exploration of solar and wind energy resource potential. Appl. Sci. 2021, 11, 2648. [Google Scholar] [CrossRef]
- Rafindadi, A.A.; Ozturk, I. Effects of financial development, economic growth and trade on electricity consumption: Evidence from post-Fukushima Japan. Renew. Sustain. Energy Rev. 2016, 54, 1073–1084. [Google Scholar] [CrossRef]
- Ouyang, X.; Shao, Q.; Zhu, X.; He, Q.; Xiang, C.; Wei, G. Environmental regulation, economic growth and air pollution: Panel threshold analysis for OECD countries. Sci. Total Environ. 2019, 657, 234–241. [Google Scholar] [CrossRef] [PubMed]
- Li, H.; Luo, F.; Hao, J.; Li, J.; Guo, L. How does fintech affect energy transition: Evidence from Chinese industrial firms. Environ. Impact Assess. Rev. 2023, 102, 107181. [Google Scholar] [CrossRef]
- Esso, L.J.; Keho, Y. Energy consumption, economic growth and carbon emissions: Cointegration and causality evidence from selected African countries. Energy 2016, 114, 492–497. [Google Scholar] [CrossRef]
- Riti, J.S.; Song, D.; Shu, Y.; Kamah, M. Decoupling CO2 emission and economic growth in China: Is there consistency in estimation results in analyzing environmental Kuznets curve? J. Clean. Prod. 2017, 166, 1448–1461. [Google Scholar] [CrossRef]
- Muhammad, B. Energy consumption, CO2 emissions and economic growth in developed, emerging and Middle East and North Africa countries. Energy 2019, 179, 232–245. [Google Scholar] [CrossRef]
- Salari, M.; Javid, R.J.; Noghanibehambari, H. The nexus between CO2 emissions, energy consumption, and economic growth in the US. Econ. Anal. Policy 2021, 69, 182–194. [Google Scholar] [CrossRef]
- Wang, Q.; Wu, S.-D.; Zeng, Y.-E.; Wu, B.-W. Exploring the relationship between urbanization, energy consumption, and CO2 emissions in different provinces of China. Renew. Sustain. Energy Rev. 2016, 54, 1563–1579. [Google Scholar] [CrossRef]
- Begum, R.A.; Sohag, K.; Abdullah, S.M.S.; Jaafar, M. CO2 emissions, energy consumption, economic and population growth in Malaysia. Renew. Sustain. Energy Rev. 2015, 41, 594–601. [Google Scholar] [CrossRef]
- Tsimisaraka, R.S.M.; Xiang, L.; Andrianarivo, A.R.N.A.; Josoa, E.Z.; Khan, N.; Hanif, M.S.; Limongi, R. Impact of financial inclusion, globalization, renewable energy, ICT, and economic growth on CO2 emission in OBOR countries. Sustainability 2023, 15, 6534. [Google Scholar] [CrossRef]
- Ahmad, N.; Du, L.; Lu, J.; Wang, J.; Li, H.Z.; Hashmi, M.Z. Modelling the CO2 emissions and economic growth in Croatia: Is there any environmental Kuznets curve? Energy 2017, 123, 164–172. [Google Scholar] [CrossRef]
- Mardani, A.; Streimikiene, D.; Cavallaro, F.; Loganathan, N.; Khoshnoudi, M. Carbon dioxide (CO2) emissions and economic growth: A systematic review of two decades of research from 1995 to 2017. Sci. Total Environ. 2019, 649, 31–49. [Google Scholar] [CrossRef]
- Işık, C.; Bulut, U.; Ongan, S.; Islam, H.; Irfan, M. Exploring how economic growth, renewable energy, internet usage, and mineral rents influence CO2 emissions: A panel quantile regression analysis for 27 OECD countries. Resour. Policy 2024, 92, 105025. [Google Scholar] [CrossRef]
- Wang, S.; Li, G.; Fang, C. Urbanization, economic growth, energy consumption, and CO2 emissions: Empirical evidence from countries with different income levels. Renew. Sustain. Energy Rev. 2018, 81, 2144–2159. [Google Scholar] [CrossRef]
- Cao, Z.; Wei, J.; Chen, H.-B. CO2 emissions and urbanization correlation in China based on threshold analysis. Ecol. Indic. 2016, 61, 193–201. [Google Scholar] [CrossRef]
- Wang, Q.; Wang, L. The nonlinear effects of population aging, industrial structure, and urbanization on carbon emissions: A panel threshold regression analysis of 137 countries. J. Clean. Prod. 2021, 287, 125381. [Google Scholar] [CrossRef]
- Bai, Y.; Deng, X.; Gibson, J.; Zhao, Z.; Xu, H. How does urbanization affect residential CO2 emissions? An analysis on urban agglomerations of China. J. Clean. Prod. 2018, 209, 876–885. [Google Scholar] [CrossRef]
- Wu, Y.; Shen, J.; Zhang, X.; Skitmore, M.; Lu, W. The impact of urbanization on carbon emissions in developing countries: A Chinese study based on the U-Kaya method. J. Clean. Prod. 2016, 135, 589–603. [Google Scholar] [CrossRef]
- Sheng, P.; Guo, X. The Long-run and Short-run Impacts of Urbanization on Carbon Dioxide Emissions. Econ. Model. 2016, 53, 208–215. [Google Scholar] [CrossRef]
- Zhou, Y.; Liu, Y.; Wu, W.; Li, Y. Effects of rural–urban development transformation on energy consumption and CO2 emissions: A regional analysis in China. Renew. Sustain. Energy Rev. 2015, 52, 863–875. [Google Scholar] [CrossRef]
- Ouyang, X.; Lin, B. Carbon dioxide (CO2) emissions during urbanization: Acomparative study between China Japan. J. Clean. Prod. 2017, 143, 356–368. [Google Scholar] [CrossRef]
- Anwar, H.; Waheed, R.; Aziz, G. Importance of FinTech and green finance to achieve the carbon neutrality targets: A study of australian perspective. Environ. Res. Commun. 2024, 6, 115007. [Google Scholar] [CrossRef]
- Xu, J.; Chen, F.; Zhang, W.; Liu, Y.; Li, T. Analysis of the carbon emission reduction effect of Fintech and the transmission channel of green finance. Financ. Res. Lett. 2023, 56, 104127. [Google Scholar] [CrossRef]
- Zeng, T.; Jiang, Y. Fintech and low-carbon urban development. Financ. Res. Lett. 2025, 79, 107229. [Google Scholar] [CrossRef]
- Dong, K.; Wang, S.; Hu, H.; Guan, N.; Shi, X.; Song, Y. Financial development, carbon dioxide emissions, and sustainable development. Sustain. Dev. 2024, 32, 348–366. [Google Scholar] [CrossRef]
- Zia, Z.; Zhong, R.; Akbar, M.W. Analyzing the impact of fintech industry and green financing on energy poverty in the European countries. Heliyon 2024, 10, e27532. [Google Scholar] [CrossRef]
- Sunday Adebayo, T.; Saint Akadiri, S.; Haouas, I.; Rjoub, H. A time-varying analysis between financial development and carbon emissions: Evidence from the MINT countries. Energy Environ. 2023, 34, 1207–1227. [Google Scholar] [CrossRef]
- Jiang, Y.; Wang, X.; Wang, W. Financial technology and regional carbon emission reduction: Mediating effect of green technology innovation. Financ. Res. Lett. 2025, 77, 107110. [Google Scholar] [CrossRef]
- Wu, G.; Liu, X.; Cai, Y. The impact of green finance on carbon emission efficiency. Heliyon 2024, 10, e23803. [Google Scholar] [CrossRef]
- Liu, H.; Song, Y. Financial development and carbon emissions in China since the recent world financial crisis: Evidence from a spatial-temporal analysis and a spatial Durbin model. Sci. Total Environ. 2020, 715, 136771. [Google Scholar] [CrossRef] [PubMed]
- Si, H.; Rahman, Z.U. Embracing the digital revolution: Examining the relationship between ICT adoption and carbon emissions in the Persian Gulf. PLoS ONE 2024, 19, e0304088. [Google Scholar] [CrossRef]
- Mahmood, H.; Asadov, A.; Tanveer, M.; Furqan, M.; Yu, Z. Impact of oil price, economic growth and urbanization on CO2 emissions in GCC countries: Asymmetry analysis. Sustainability 2022, 14, 4562. [Google Scholar] [CrossRef]
- Dkhili, H.; Ben Dhiab, L. Management of Environmental Performance and Impact of the Carbon Dioxide Emissions (CO2) on the Economic Growth in the GCC Countries. Mark. Manag. Innov. 2019, 4, 252–268. [Google Scholar] [CrossRef]
- AlKhars, M.A.; Alwahaishi, S.; Fallatah, M.R.; Kayal, A. A literature review of the Environmental Kuznets Curve in GCC for 2010–2020. Environ. Sustain. Indic. 2022, 14, 100181. [Google Scholar] [CrossRef]
- Meero, A.; Ur Rahiman, H.; Abdul Rahman, A.A.; Navaz, N. Fintech and Green Finance: Driving Renewable Energy Growth in GCC. In Sustainable Data Management. Studies in Big Data; Hamdan, R.K., Ed.; Springer: Cham, Germany, 2025; Volume 170. [Google Scholar] [CrossRef]
- Pesaran, M.H.; Shin, Y. An Autoregressive Distributed Lag Modelling Approach to Cointegration Analysis; Department of Applied Economics, University of Cambridge: Cambridge, UK, 1995; Volume 9514, pp. 371–413. [Google Scholar]
- Pesaran, M.H.; Shin, Y.; Smith, R.J. Bounds testing approaches the analysis of level relationships. J. Appl. Econom. 2001, 16, 289–326. [Google Scholar] [CrossRef]
- Johansen, S.; Juselius, K. Maximum likelihood estimation and inference on cointegration—With appucations to the demand for money. Oxf. Bull. Econ. Stat. 1990, 52, 169–210. [Google Scholar] [CrossRef]
- Dumitrescu, E.I.; Hurlin, C. Testing for Granger non-causality in heterogeneous panels. Econ. Model. 2012, 29, 1450–1460. [Google Scholar] [CrossRef]
- Mensah, I.A.; Sun, M.; Gao, C.; Omari-Sasu, A.Y.; Zhu, D.; Ampimah, B.C.; Quarcoo, A. Analysis on the nexus of economic growth, fossil fuel energy consumption, CO2 emissions and oil price in Africa based on a PMG panel ARDL approach. J. Clean. Prod. 2019, 228, 161–174. [Google Scholar] [CrossRef]
- Shaari, M.S.; Abdul Karim, Z.; Zainol Abidin, N. The effects of energy consumption and national output on CO2 emissions: New evidence from OIC countries using a panel ARDL analysis. Sustainability 2020, 12, 3312. [Google Scholar] [CrossRef]
- Cherni, A.; Jouini, S.E. An ARDL approach to the CO2 emissions, renewable energy and economic growth nexus: Tunisian evidence. Int. J. Hydrog. Energy 2017, 42, 29056–29066. [Google Scholar] [CrossRef]
- Habib, Y.; Xia, E.; Hashmi, S.H.; Ahmed, Z. The nexus between road transport intensity and road-related CO2 emissions in G20 countries: An advanced panel estimation. Environ. Sci. Pollut. Res. 2021, 28, 58405–58425. [Google Scholar] [CrossRef] [PubMed]


Disclaimer/Publisher’s Note: The statements, opinions and data contained in all publications are solely those of the individual author(s) and contributor(s) and not of MDPI and/or the editor(s). MDPI and/or the editor(s) disclaim responsibility for any injury to people or property resulting from any ideas, methods, instructions or products referred to in the content. |
© 2025 by the authors. Licensee MDPI, Basel, Switzerland. This article is an open access article distributed under the terms and conditions of the Creative Commons Attribution (CC BY) license (https://creativecommons.org/licenses/by/4.0/).