Abstract
Understanding the coordination between regional carbon sequestration and human activities is essential for achieving ecological sustainability and carbon neutrality. This study explored the spatiotemporal evolution, driving mechanisms, and sustainability of net ecosystem productivity (NEP) and human activity intensity (HAI) in the Zhangjiakou–Chengde (ZC) region of northern China from 2000 to 2023. NEP and HAI were integrated through a coupling coordination framework to assess their dynamic balance and relative development. Results show that the coordination between carbon sinks and human activities has improved continuously over the past two decades, shifting from human-dominated imbalance to a more synergistic pattern. Spatially, higher coordination levels were concentrated in forested mountain areas, while agricultural and transitional zones exhibited instability or lagging development. Land use regulation, vegetation recovery, and terrain conditions were identified as the primary factors shaping this pattern, with interaction effects amplifying spatial disparities. Trend analysis suggests that northeastern and eastern regions will likely sustain their positive trajectories, whereas the agro-pastoral transition belt remains vulnerable. These findings deepen understanding of carbon–human interactions in fragile ecosystems and provide scientific evidence for differentiated land management, ecological restoration, and carbon neutrality planning in northern China and similar regions worldwide.
1. Introduction
Ecosystem carbon sequestration plays a crucial role in regulating the global carbon cycle and mitigating climate change [1]. Net ecosystem productivity (NEP), as a key indicator of terrestrial carbon sinks, reflects the balance between carbon uptake by vegetation and carbon release through respiration [2,3]. Understanding the dynamics of NEP is essential for evaluating ecosystem services and supporting carbon neutrality strategies [4,5]. Meanwhile, human activities exert profound influences on ecosystems: rapid urbanization, agricultural expansion, and industrial development often increase ecological stress, while ecological restoration programs and sustainable land management may enhance ecological resilience [6,7]. Therefore, clarifying the coordination between ecological carbon sinks and human activities has become an urgent scientific challenge with direct implications for regional sustainability and global climate governance [8,9,10].
Numerous studies have investigated NEP as a key indicator of carbon balance at global and regional scales [11]. NEP has been shown to respond strongly to climatic variation, vegetation cover, and land-use change [12,13]. Previous research has demonstrated that rising temperatures, altered precipitation patterns, and increasing drought events substantially affect NEP, while ecological restoration and land-use adjustments enhance carbon uptake [14,15,16,17]. These findings underscore the role of NEP in both regional ecosystem service assessments and global carbon neutrality strategies [18,19]. Parallel to ecological studies, considerable attention has been given to the human activity intensity (HAI), which captures the magnitude and spatial distribution of anthropogenic pressures on ecosystems [20]. Population density, economic output, nighttime light data, and land-use intensity have been widely employed as proxies to characterize socio-economic development and its environmental implications [21,22].
In recent years, increasing efforts have been made to integrate ecological and socio-economic dimensions using coupling coordination models. Applications in the Beijing–Tianjin–Hebei (BTH) region, the Loess Plateau, and other ecologically fragile areas have demonstrated the value of coupling approaches for capturing the balance—or imbalance—between ecosystem services and human development [23,24,25]. These studies provide evidence that regions with stronger ecological restoration measures tend to achieve higher coordination levels, whereas areas dominated by intensive human activities often face coordination deficits [26]. However, despite growing interest, comprehensive assessments of NEP–HAI coordination remain limited. Existing studies have often examined natural or anthropogenic factors separately, overlooking their combined and interactive influences. Furthermore, few studies have evaluated the long-term sustainability of coordination trends, leaving uncertainties about whether observed improvements can persist under future environmental or policy changes.
The Zhangjiakou–Chengde (ZC) region, located in northern Hebei Province, represents a typical agro-pastoral transition zone and a critical ecological barrier for Beijing and Tianjin [27]. It performs multiple ecological functions such as water conservation, wind prevention, and carbon sequestration, yet experiences increasing stress from water scarcity, overgrazing, and rapid socio-economic growth [28]. In recent decades, the region has been the focus of major ecological restoration programs, including the Beijing–Tianjin Sandstorm Source Control Project and the Returning Farmland to Forest Program, which have profoundly altered both land-use patterns and vegetation productivity. Similar human–environment tensions and ecological degradation processes are observed globally in arid and semi-arid transition zones, particularly in Africa and Central Asia, where vegetation dynamics, climate variability, and human adaptation processes are tightly intertwined [29]. These global parallels indicate that the NEP–HAI relationships identified in the ZC region are not unique to northern China but reflect broader mechanisms of ecological restoration and socio-economic coordination under fragile environmental conditions. This broader comparative perspective enhances the theoretical depth and international transferability of the study. It is expected that ongoing restoration and land-use regulation have progressively enhanced the coordination between NEP and HAI, while spatial heterogeneity remains pronounced, with stronger coordination in forested mountains and weaker balance in the agricultural and transition zones. Understanding these processes in a region that simultaneously serves as a carbon sink and a development frontier provides important insights into the mechanisms driving ecosystem-human linkages and their implications for sustainable regional management.
This study aims to provide a comprehensive assessment of NEP–HAI coupling coordination in the ZC region from 2000 to 2023. The objectives are: (1) to evaluate the spatiotemporal evolution of NEP and HAI; (2) to quantify the coupling coordination degree and relative development degree and classify regional coordination types; (3) to identify key driving factors and their interactive effects using the Geodetector model; and (4) to predict future trajectories of coordination through the combined application of the Mann–Kendall trend test and Hurst exponent analysis. By integrating ecological and socio-economic perspectives, this study contributes to a better understanding of ecological–human interactions in fragile agro-pastoral transition zones and provides scientific evidence to support land-use regulation, ecological restoration, and carbon neutrality strategies in the ZC region and beyond.
2. Materials and Methods
2.1. Study Area
The Zhangjiakou–Chengde (ZC) region, located in northern Hebei Province (39°18′–42°37′ N, 113°50′–119°15′ E), covers approximately 7.63 × 10⁴ km2 and functions as a key ecological barrier and water conservation zone for Beijing and Tianjin (Figure 1). The area is characterized by mountains, loess hills, and plateau landscapes, with a temperate continental monsoon climate. Mean annual precipitation ranges from 300 to 700 mm, and mean temperatures vary between −1 °C and 9 °C, creating strong spatial and temporal heterogeneity in ecosystem processes. As a typical agro-pastoral transition zone in northern China, the ZC region provides essential ecosystem services, including water retention, soil conservation, and carbon sequestration. However, the region is ecologically fragile and highly sensitive to environmental stressors. Water scarcity, overgrazing, and land degradation have long constrained ecological stability, while rapid socio-economic development—such as urban expansion, agricultural intensification, and infrastructure construction—has further altered land surface processes. These combined pressures not only affect NEP but also reshape the interaction between ecological functions and human activities.
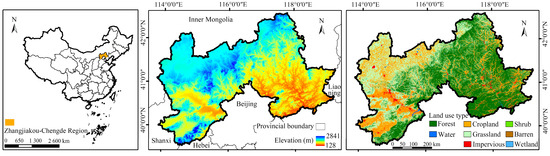
Figure 1.
Study area.
2.2. Data Sources and Processing
Net Ecosystem Productivity (NEP) was derived as the difference between Net Primary Productivity (NPP) and soil heterotrophic respiration (RH). NPP data were obtained from the MODIS MOD17A3HGF product (NASA, Washington, DC, USA) (1 km resolution) through the LAADS DAAC platform (https://ladsweb.modaps.eosdis.nasa.gov, accessed on 7 October 2024), while RH was estimated using empirical models driven by meteorological data. The HAI was constructed to quantify anthropogenic pressures, integrating population density, gross domestic product, nighttime light intensity, and land use intensity.
To identify the drivers of the NEP–HAI coupling coordination, a comprehensive set of environmental and anthropogenic factors was considered (Table 1). All datasets span the period 2000–2023 and were resampled to a uniform spatial resolution of 1 km. A 1 km × 1 km grid was adopted as the evaluation unit, yielding 38,592 cells across the ZC region. For each cell, mean raster values were extracted to ensure spatial comparability and minimize the influence of extreme values. This unified framework provides a consistent basis for quantifying NEP–HAI coupling coordination and assessing its driving mechanisms.

Table 1.
Data sources and variable descriptions.
2.3. Estimation of NEP
NEP represents the net carbon exchange between terrestrial ecosystems and the atmosphere and serves as a direct indicator of the dynamics of ecosystem carbon storage. Within ecosystems, a large proportion of Net Primary Productivity (NPP) contributes to biomass accumulation, while the remainder enters the soil as litterfall. This organic matter is subject to microbial decomposition, during which part of the carbon is respired back to the atmosphere, and part is retained as soil organic carbon. Therefore, NEP can be conceptualized as the balance between carbon input from vegetation production and carbon release through microbial heterotrophic respiration (Rh) [31], as shown in Equation (1):
where denotes the NEP at grid cell x in year t (g C/m2·a); means the NPP at grid cell x in year t (g C/m2·a); and means the Rh at grid cell x in year t (g C/m2·a) [31], as shown in Equation (2):
where is the mean annual temperature (°C) at grid cell x in year t, and is the annual precipitation (mm) at grid cell x in year. The empirical Rh model applied in this study was derived from parameterized relationships validated in previous field-based research conducted in temperate ecosystems of northern China. These studies demonstrated that the model performs well in regions with similar climatic and vegetation conditions, thereby ensuring the reliability of NEP estimation in the ZC region [31,32].
2.4. Estimation of HAI
The HAI was constructed to quantitatively assess the extent of anthropogenic pressures on the ZC region. Considering both data availability and the dominant forms of human disturbance, four representative indicators were selected: PD, GDP, NTL, and LUI. These variables collectively capture demographic, economic, urbanization, and land-use dimensions of human activity. Specifically, PD reflects the degree of population aggregation, GDP characterizes economic development, NTL indicates the intensity of urban construction and infrastructure expansion, while LUI provides a comprehensive measure of human exploitation of land resources through agricultural and construction activities [32].
To ensure comparability across different dimensions, all indicators were first normalized. Subsequently, the entropy weight method was applied to determine the contribution of each factor, thereby minimizing subjectivity in weighting [33]. The HAI for each grid cell was calculated using a weighted summation, as defined in Equation (3):
where HAI denotes the Human Activity Intensity index, represents the weight of indicator i, and is the normalized value of the corresponding indicator. Higher HAI values indicate stronger anthropogenic influence. This index provides the basis for evaluating the coupling coordination between NEP and human activities in the ZC region (Table 2).
Table 2.
Composition and relative significance of indicators used to construct the HAI.
2.5. Coupling Coordination Analysis of NEP and HAI
The coupling coordination degree model (CCDM) provides a systematic framework for characterizing the interaction and developmental balance between ecological and human systems. In this study, it is applied to jointly evaluate the coupling state of NEP and HAI, revealing the overall level and direction of their co-evolution. Compared with simple correlation or regression analyses, the CCDM emphasizes the coordination and integrated development of interrelated subsystems, offering a more comprehensive representation of the dynamic equilibrium between ecological and socio-economic processes [34]. The model first evaluates the coupling degree, which characterizes the interaction strength between NEP and HAI, and then introduces the comprehensive evaluation index to reflect their overall development level. The formulas are expressed in Equations (4)–(6):
where denotes the coupling coordination degree, the coupling degree, and the comprehensive evaluation index. and represent the standardized values of NEP and HAI, respectively. and are the assigned weights of NEP and HAI, both set to 0.5 in this study. This setting reflects the principle that ecological and human subsystems are equally important in achieving sustainable regional development. Giving them equal importance avoids bias toward either environmental or socio-economic dimensions and ensures that the final coordination degree reflects the balance between ecological performance and human activity intensity.
In addition, the relative development degree was calculated to differentiate subsystem dominance [35], as shown in Equation (7):
where denotes the relative development degree, with positive values indicating ecological dominance and negative values indicating human dominance. and are the normalized values of NEP and HAI, respectively.
On the basis of D values and RD directions, the ZC region was classified into six coupling coordination types (Table 3), which provides a framework for identifying ecological priority zones, human-driven zones, and potential mismatch or stress zones.
Table 3.
Classification of Coupling Coordination Types between NEP and HAI.
2.6. Driver Impact Analysis Based on Geodetector
To quantify the spatial heterogeneity of driving factors affecting the coupling coordination degree between NEP and HAI, this study employed the factor detector and interaction detector modules of the Geodetector mode. The coupling coordination degree was selected as the dependent variable, while 14 natural, anthropogenic, and topographic indicators (including PRE, PET, TMP, NDVI, PD, NTL, SPEI, SR, SSM, SHF, VT, LUI, ELV, and SLP) were used as independent variables. Each independent variable was discretized into five categories using the natural breaks method, thereby transforming continuous data into categorical factors suitable for Geodetector analysis.
The factor detector was applied to calculate the explanatory power (q value) of each independent variable for the spatial differentiation of D. A larger q value indicates a stronger explanatory effect, whereas a smaller q value reflects weaker explanatory capacity [36]. Furthermore, the interaction detector was employed to evaluate whether the combined effect of two factors enhances or weakens their individual explanatory power [37]. Based on the relative relationship between q values, five types of interactions were identified (Table 4).
Table 4.
Classification of Interaction Detector Interaction Types.
2.7. Trend and Sustainability Analysis of Coupling Coordination
To assess the temporal evolution and future sustainability of the coupling coordination degree between NEP and HAI, a combined approach integrating the Mann–Kendall (MK) significance test and the Hurst exponent analysis was adopted.
2.7.1. MK Trend Test
The MK test was employed to detect the monotonic trend of D during 2000–2023. To evaluate the statistical significance of the detected trend, the Mann–Kendall test was applied [38]. The test statistic Zₛ was computed using Equations (8)–(10):
where is the standardized test statistic, is the rank-based test statistic, denotes the variance of S, and n = 24 is the number of years in the time series. A significance level of α = 0.05 was adopted. The trend is considered statistically significant at 90%, 95%, and 99% confidence levels when exceeds 1.65, 1.96, and 2.58, respectively. In this study, a threshold of ≥ 1.96 was selected to ensure conservative significance testing.
2.7.2. Hurst Exponent Analysis
To evaluate the long-term sustainability of the identified trends, the Hurst exponent (H) was calculated using the rescaled range (R/S) method [39]. The value of H ranges between 0 and 1, with different intervals reflecting persistence characteristics: strong anti-persistence (0 ≤ H < 0.35), weak anti-persistence (0.35 ≤ H ≤ 0.5), weak persistence (0.5 < H ≤ 0.65), and strong persistence (0.65 < H ≤ 1). It should be noted that the Hurst exponent does not predict specific future values but evaluates the persistence or reversal tendency of historical trends. It reflects the sustainability of the observed trajectory under similar conditions, assuming that no major external disturbances—such as policy or climate changes—occur.
2.7.3. Combined Classification
By integrating the MK test with the Hurst exponent, both the historical trend direction and future sustainability of D can be determined. The classification criteria are summarized in Table 5.
Table 5.
Classification of Coupling Coordination Development Trends Based on MK and Hurst.
3. Results and Analysis
3.1. Spatiotemporal Variations in NEP
The NEP of the ZC region exhibited pronounced spatial heterogeneity and temporal dynamics from 2000 to 2023 (Figure 2). In the early 2000s, large areas in the western and southern zones showed low or even negative NEP values (<0 g C/m2·a), particularly in ecologically fragile regions with intensive human disturbance. By contrast, the northeastern and central mountainous areas maintained relatively high NEP values (>200 g C/m2·a), reflecting stronger vegetation productivity and carbon sequestration capacity. Over time, NEP in the ZC region showed a marked improvement, especially after 2010. Areas with low or negative NEP progressively diminished, while regions with higher NEP (>300 g C/m2·a) expanded, particularly in the northern and eastern ecological zones. This shift suggests significant ecological restoration efforts and improvements in vegetation growth conditions.
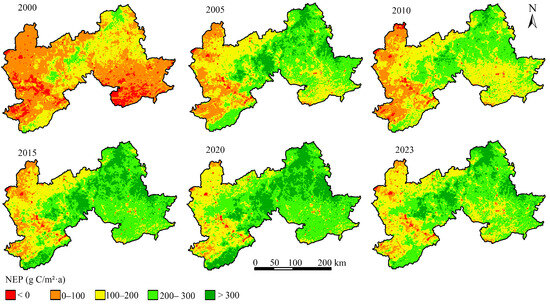
Figure 2.
Spatial distribution of NEP in the ZC region from 2000 to 2023.
The change rate of NEP further confirmed this positive trend (Figure 3a). Most areas exhibited an annual increase of 2–6 g C/m2·a, with hotspots of rapid improvement (>8 g C/m2·a) concentrated in afforestation zones and nature reserves. The interannual series (Figure 3b) revealed a statistically significant upward trend (p < 0.05), with NEP increasing at an average rate of approximately 6.5 g C/m2·a. The fitted linear regression line, accompanied by 95% confidence and prediction bands, indicates a robust improvement trajectory, albeit with interannual fluctuations driven by climatic variability. Overall, these results highlight that the ZC region has experienced substantial ecological recovery and carbon sink enhancement over the past two decades.
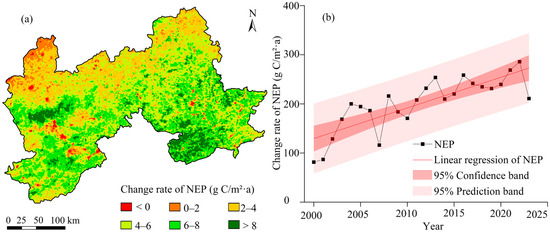
Figure 3.
Temporal trends of NEP in the ZC region: (a) spatial distribution of NEP change rate, and (b) interannual variation and linear regression with 95% confidence and prediction bands.
3.2. Spatiotemporal Variations in HAI
The HAI in the ZC region exhibited a clear upward trajectory from 2000 to 2023, with distinct spatial heterogeneity (Figure 4). In the early 2000s, areas of high HAI (>0.6) were concentrated around major urban centers and transportation corridors, particularly in the southern and southwestern parts of the region, reflecting the influence of dense population and economic activity. Conversely, large areas in the northern and eastern ecological zones maintained relatively low HAI values (<0.4), indicating weaker anthropogenic pressure. Over time, HAI expanded significantly across the region, with intensification in both urban and peri-urban areas. By 2023, zones of high HAI (>0.6) had markedly increased, extending into surrounding agricultural and transitional landscapes, while low-value areas (<0.3) became increasingly fragmented and confined to remote mountainous zones. This spatial expansion underscores the accelerating impacts of urbanization and land-use intensification.
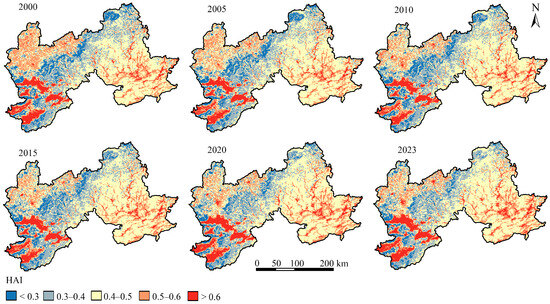
Figure 4.
Spatial distribution of HAI in the ZC region from 2000 to 2023.
Figure 5 visualizes the dynamic transitions among coordination types, where arrow width represents the magnitude of change and color intensity indicates the direction of evolution. This helps illustrate how regions shifted between ecological- and human-dominant states over time. The change rate of HAI (Figure 5a) further highlighted this trend. Most regions exhibited annual increases of 0.1–0.2, with hotspots of rapid growth (>0.2) distributed in urban agglomerations and their hinterlands. The interannual series (Figure 5b) showed a significant upward trend (p < 0.05), with HAI rising from an average of 0.36 in 2000 to approximately 0.58 in 2023. The fitted regression line, accompanied by 95% confidence and prediction bands, confirmed the steady escalation of human activity intensity across the region. Overall, these results indicate that the ZC region has undergone a sustained intensification of human activities over the past two decades.
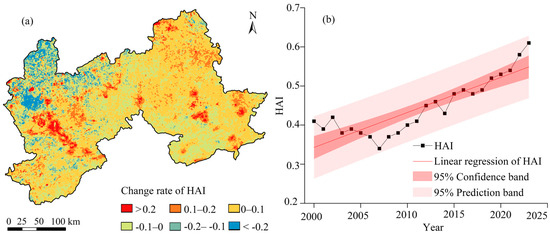
Figure 5.
Temporal trends of HAI in the ZC region: (a) spatial distribution of HAI change rate, and (b) interannual variation and linear regression with 95% confidence and prediction bands.
Overall, NEP exhibited a steady upward trend across the study period, reflecting enhanced ecosystem productivity driven by vegetation recovery, while HAI showed a sharp increase in urban and agricultural zones, indicating intensifying human development pressures.
3.3. Coupling Coordination Between NEP and HAI
The coupling coordination degree between NEP and HAI in the ZC region demonstrated a consistent upward trend during 2000–2023 (Figure 6a). D increased from below 0.1 in 2000 to approximately 0.42 in 2023, with a significant positive correlation (R2 = 0.85). This indicates an overall enhancement of synergy between ecosystem carbon sequestration and human activities. The relative development degree, although fluctuating, exhibited a gradual shift from negative to positive values, suggesting a transition from human-activity dominance toward a more balanced or ecologically favorable state. The D-RD trajectory (Figure 6b) further highlighted this process, revealing that the region moved from the human-dominant quadrant in the early 2000s toward the synergistic and carbon-dominant zones after 2015.
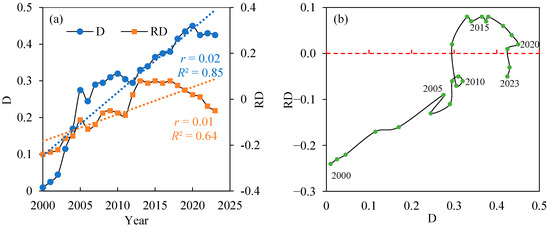
Figure 6.
Temporal evolution of the coupling coordination degree (D) and relative development degree (RD) between NEP and HAI in the ZC region from 2000 to 2023: (a) interannual variations in D and RD, and (b) trajectory of D-RD coupling.
The spatial distribution of coupling coordination types (Figure 7) revealed strong spatial heterogeneity. In 2000, the region was predominantly classified as Human-activity Carbon-stress Regions, widely distributed across the central and southern zones. Over time, these areas significantly contracted, while Synergistic Human-activity-dominant Regions and Potential Human-activity-overshoot Regions gradually expanded. By 2023, large portions of the northern and eastern ecological zones had shifted into Synergistic Carbon-dominant Regions and Potential Carbon-surplus Regions, indicating ecological recovery and improved carbon sequestration in these areas.
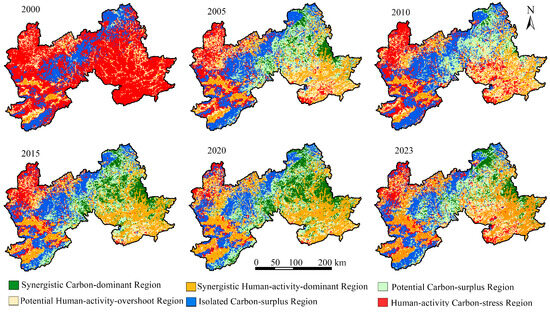
Figure 7.
Spatial distribution of coupling coordination types between NEP and HAI in the ZC region from 2000 to 2023.
The Sankey diagram (Figure 8) quantitatively illustrated the dynamic transfer of coupling coordination types. In 2000, over 65% of the ZC region belonged to Human-activity Carbon-stress Regions, but this proportion declined steadily to below 12% by 2023. Conversely, Synergistic Human-activity-dominant Regions and Synergistic Carbon-dominant Regions showed substantial increases, together accounting for more than 36% of the region by 2023. Notably, the expansion of Potential Human-activity-overshoot Regions reflects transitional areas where rapid NEP growth has yet to be fully matched by human activity adaptation. Overall, these results highlight a marked improvement in the coordination between ecological processes and human activities in the ZC region over the past two decades, while also revealing persistent mismatches in certain subregions.
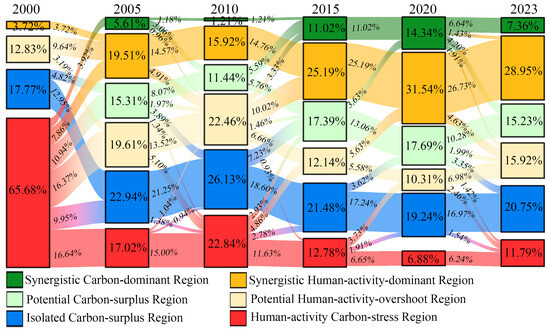
Figure 8.
Sankey diagram illustrating the transfer of coupling coordination types between NEP and HAI in the ZC region from 2000 to 2023.
These results reveal a clear improvement in the coupling coordination degree from west to east, with the eastern forested areas maintaining stable coordination and the western farming–pastoral zones showing gradual recovery from previous imbalance.
3.4. Driving Factors of Coupling Coordination
The explanatory power of different driving factors on the coupling coordination degree between NEP and HAI exhibited both consistent commonalities and notable temporal variations (Figure 9). Across all years, LUI remained the single most influential factor, with q-values generally above 0.30. This result underscores the persistent and dominant role of land-use patterns in determining the spatial differentiation of NEP–HAI coordination. Importantly, although LUI retained its leading position, its explanatory power showed a gradual decline from the early 2000s to 2023, reflecting the increasing role of natural and topographic constraints as ecosystems gradually recovered and human-nature interactions became more balanced.
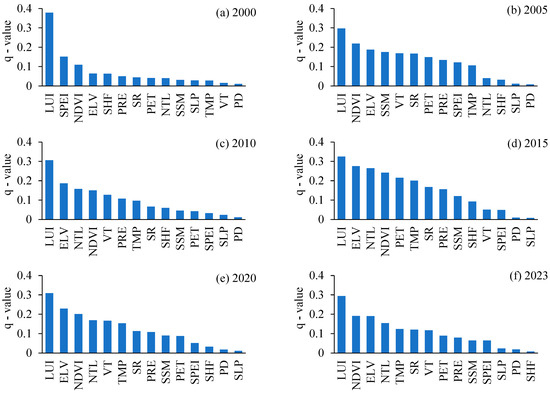
Figure 9.
Explanatory power (q-values) of individual driving factors on the coupling coordination degree between NEP and HAI in the ZC region from 2000 to 2023.
Among natural and ecological variables, ELV, NDVI, and SPEI consistently exhibited relatively high explanatory power (q-values typically 0.15–0.25), though their relative importance shifted over time. In the early stage (2000–2005), SPEI and NDVI were relatively more influential, reflecting the sensitivity of NEP–HAI coordination to drought stress and vegetation conditions during the initial phase of ecological restoration. After 2010, however, the explanatory power of ELV increased steadily, indicating that topographic constraints became more decisive in shaping spatial heterogeneity, especially as ecological recovery progressed in mountainous areas. Meanwhile, NDVI maintained stable explanatory capacity, while SPEI showed fluctuations consistent with episodic drought events in the study period.
Climatic and hydrological variables, such as PET, PRE, SR, and SSM, generally exhibited moderate explanatory power (q ≈ 0.10–0.20), with slight upward trends over time, suggesting that climate variability increasingly influenced spatial differences in NEP–HAI coordination. In contrast, socio-economic factors such as PD and NTL consistently showed lower q-values (<0.10 in most years), indicating their more indirect influence compared to land use and ecological indicators. Notably, PD remained one of the weakest drivers throughout the study period, whereas NTL exhibited a gradual increase in explanatory power after 2010, consistent with the rapid urbanization and infrastructure expansion observed in the region.
The interaction analysis (Figure 10) further revealed that the combined effects of factor pairs were significantly stronger than those of individual variables, with most interactions falling into the category of nonlinear enhancement. Particularly strong effects were observed between LUI and NDVI, LUI and ELV, and LUI and SPEI, which consistently produced q-values much higher than their individual contributions. This highlights the fact that anthropogenic land-use changes and ecological conditions jointly amplify spatial heterogeneity in NEP–HAI coordination. Additionally, several interactions, such as NDVI with PET and SR with SSM, demonstrated bi-directional enhancement, pointing to synergistic relationships between vegetation productivity and climatic–hydrological processes.
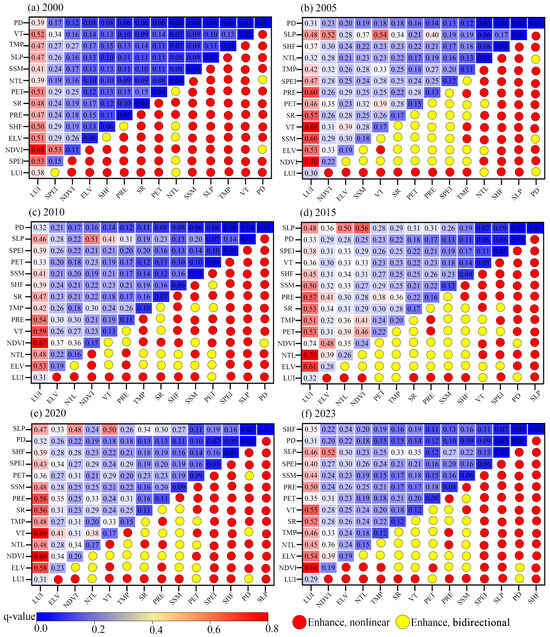
Figure 10.
Interaction effects of driving factors on the coupling coordination degree between NEP and HAI in the ZC region from 2000 to 2023.
Taken together, these results demonstrate that the NEP–HAI coupling coordination in the ZC region is primarily controlled by land-use intensity, while the roles of topography, vegetation, and climate became more pronounced over time. Moreover, multi-factor interactions—especially between human activities and natural conditions—exert a stronger influence than individual factors, amplifying the spatial heterogeneity of coupling coordination.
3.5. Future Trend Prediction of Coupling Coordination
The combined application of the Mann–Kendall (MK) test and the Hurst index provided a comprehensive assessment of both historical trends and future sustainability of the coupling coordination degree between NEP and HAI (Figure 11).
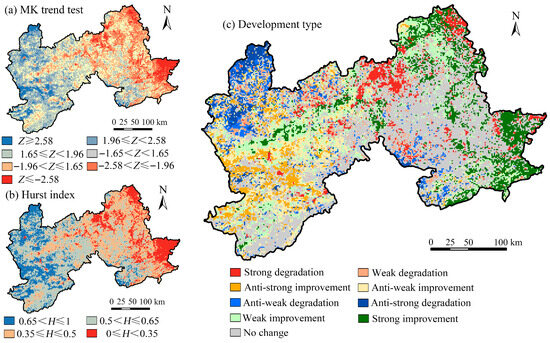
Figure 11.
Future trend prediction of the coupling coordination degree (D) between NEP and HAI in the ZC region based on MK and Hurst analyses: (a) MK trend test results, (b) Hurst index distribution, and (c) combined development types.
The MK results (Figure 11a) revealed significant spatial heterogeneity in past trends. Strongly increasing trends (Z ≥ 2.58) were primarily concentrated in the northeastern and central mountainous zones, reflecting areas of active ecological restoration and enhanced carbon sequestration. In contrast, significantly decreasing trends (Z ≤ −2.58) were observed in portions of the southwestern and eastern urban–agricultural transition zones, suggesting persistent ecological stress induced by intensive human activities. Large parts of the region exhibited non-significant trends (–1.96 < Z < 1.96), indicating relatively stable coupling conditions over the past two decades.
The Hurst analysis (Figure 11b) further indicated the persistence of these trends into the future. Strong persistence (H > 0.65) dominated the northeastern and eastern ecological regions, suggesting that the upward trajectories of D are likely to continue, thereby consolidating ecological advantages. Conversely, strong anti-persistence (H < 0.35) was concentrated in fragmented southern and transitional areas, implying that recent improvements may not be sustained, and future declines remain likely.
By integrating the MK and Hurst results, the combined development types were derived (Figure 11c). Strong improvement areas were mainly distributed in the northeast and parts of the eastern mountain ranges, while weak improvement dominated the central and western zones. Strong and weak degradation clusters were concentrated in the southern agro-pastoral transition belt, highlighting regions where ecological restoration may be insufficient to counterbalance anthropogenic pressures. Additionally, transitional categories such as anti-strong improvement and anti-weak degradation were scattered across central zones, indicating areas with historical improvements but a high probability of future reversal.
Overall, the results suggest that while the ZC region is expected to maintain a generally positive trajectory of NEP–HAI coordination, spatial disparities will persist. Areas with strong ecological resilience are likely to continue improving, whereas human-dominated transitional belts remain vulnerable to degradation, requiring targeted management interventions.
4. Discussion
4.1. Spatiotemporal Dynamics of NEP–HAI Coupling Coordination
The coupling coordination degree and relative development degree between NEP and HAI in the ZC region displayed significant spatiotemporal dynamics over the past two decades. Previous research has consistently shown that ecological restoration programs, such as afforestation and grassland rehabilitation, substantially enhanced vegetation productivity and ecosystem carbon sequestration [40,41,42]. At the same time, rapid urban expansion and industrialization led to a continuous rise in human activity intensity, but targeted eco-compensation schemes and stricter land-use management policies helped to alleviate ecological stress [43,44]. These findings provide important contextual evidence for interpreting the dynamics observed in the ZC region, which is located at the ecological transition zone and plays a critical role as a water conservation and ecological barrier area. In the early 2000s, the ZC region was largely characterized by low coupling coordination degree and predominantly negative relative development degree, indicating that human activities—particularly agricultural expansion and infrastructure construction—exerted a dominant influence over ecosystem processes. This was consistent with the broader trend in northern China at that time, when economic growth often relied on resource-intensive development [45]. However, after 2010, a marked improvement was observed: coupling coordination degree increased steadily, and relative development degree shifted toward positive in many subregions. This transition reflects the growing effectiveness of ecological restoration projects, coupled with national and regional policies emphasizing ecological security, which progressively mitigated the adverse impacts of anthropogenic disturbances [46]. Consequently, several areas, especially in the northeastern and eastern ecological zones, evolved from Human-activity Carbon-stress Regions into Synergistic Human-activity-dominant Regions, and ultimately into Synergistic Carbon-dominant Regions in recent years.
The spatiotemporal evolution of NEP–HAI coordination in the ZC region demonstrates a transition from human-dominated imbalance toward more balanced and ecologically favorable states, driven by the combined effects of ecological restoration, land-use regulation, and gradual climatic improvement. This trend reflects a broader pathway of harmonizing human development with ecological resilience in fragile transition zones. Nevertheless, the persistence of localized imbalances—particularly within agro-pastoral transitional belts—highlights the need for differentiated management strategies that reinforce ecological restoration and balance environmental protection with socio-economic development [47]. This study jointly quantified NEP and HAI dynamics at a fine spatiotemporal resolution, revealing how ecological resilience and human pressure evolve interactively. The findings highlight that the agro-pastoral transition zone exhibits distinctive coordination mechanisms compared with forest or urban ecosystems, contributing new empirical evidence for understanding carbon–human relationships under fragile environmental conditions.
4.2. Driving Mechanisms of Coupling Coordination
The coupling coordination between NEP and HAI in the ZC region is shaped by a complex interplay of human and natural factors, with distinct temporal variations in their relative contributions. Among all factors, LUI consistently exhibited the strongest explanatory power, underscoring its central role in determining the spatial heterogeneity of coordination. Higher q-values associated with LUI reflect that intensive land conversion for agriculture, urbanization, and infrastructure development has long been the most direct driver influencing the balance between ecological carbon sequestration and human activities [48]. Although its explanatory power showed a gradual decline after 2010, it remained the dominant factor, suggesting that land-use regulation continues to be the key leverage point for improving regional coordination. Furthermore, the interaction detector revealed that composite effects of multiple factors often exceeded their individual influences, with most combinations classified as nonlinear or bi-directional enhancement [49]. For instance, the interaction between LUI and NDVI consistently produced higher q-values than either factor alone, highlighting the coupling of land-use patterns with vegetation dynamics. Similarly, the interaction of LUI with ELV or SPEI demonstrated that human activities and natural constraints jointly amplified spatial heterogeneity in NEP–HAI coordination. These nonlinear enhancements emphasize that ecological and anthropogenic processes are not independent but mutually reinforcing in shaping regional outcomes [50]. This strong interaction can be attributed to the reciprocal feedback between land-use change and ecosystem productivity, where intensive human land conversion alters vegetation structure and carbon uptake, while vegetation conditions, in turn, constrain human land-use efficiency and spatial expansion. In addition, the impact of climate change on vegetation productivity shows lagged and cumulative effects [51,52]. The influences of temperature, precipitation, and drought often occur with temporal delays and gradual accumulation, contributing to spatiotemporal variations in NEP, particularly in areas where vegetation recovery lags behind climatic improvement [53]. Future research should further examine these delayed climate–vegetation responses to deepen understanding of NEP–HAI coupling mechanisms.
The spatial differentiation of NEP–HAI coordination reflects not only biophysical drivers but also the influence of regional ecological policies and socio-economic restructuring. The improvement in coordination in eastern mountain zones corresponds to the implementation of national restoration projects such as the Beijing–Tianjin Sandstorm Source Control Project and the Grain for Green Program, while persistent low-coordination areas in the agro-pastoral transition belts indicate regions where policy enforcement and ecological investment remain insufficient. These findings highlight the coupled effects of ecological restoration and socio-economic transformation on the evolution of human–ecosystem relationships in the ZC region.
4.3. Policy Implications
The combined results of MK and Hurst analyses indicate that the ZC region will likely follow a generally positive trajectory of NEP–HAI coupling coordination in the future, though with marked spatial heterogeneity. Strongly improving areas, concentrated in the northeastern and eastern mountainous zones, are expected to maintain ecological advantages through both restoration initiatives and favorable climatic conditions. Weakly improving zones dominate the central and western parts of the region, reflecting moderate but sustainable progress. By contrast, degradation-prone areas remain clustered in the southern agro-pastoral transitional belt, where intensive human pressures and fragile ecological conditions increase the risk of coordination decline. Transitional categories, including anti-persistent improvements, suggest that certain areas with past gains may not sustain upward momentum, highlighting the possibility of future reversals.
From a management and planning perspective, differentiated strategies are essential to strengthen the coordination between ecological and human systems. In areas with persistent imbalance, ecological restoration and strict land-use regulation should remain the primary focus to prevent further degradation. Regions with stable coordination should consolidate resilience through ecological compensation mechanisms, sustainable agricultural transition, and improved landscape connectivity. Transitional zones, where human pressure remains high, require the promotion of low-carbon industrial transformation and optimized spatial structure to harmonize production, living, and ecological functions. Beyond local management, the NEP–HAI coordination framework provides a scientific basis for integrating ecological assessment into regional and national territorial planning. It can support the delineation of ecological conservation zones, inform land-use intensity thresholds, and guide resilience-oriented policies aligned with global sustainability and carbon neutrality goals. These targeted recommendations enhance the policy relevance and transferability of the study’s findings.
The NEP–HAI coordination framework proposed in this study is conceptually consistent with internationally recognized resilience-based ecological assessment systems, such as those adopted in European territorial planning frameworks [54]. Both approaches emphasize integrating environmental information, human activity intensity, and spatial regulation into decision-making processes. Incorporating this perspective demonstrates that the NEP–HAI model is not limited to China but can be adapted to other contexts for evaluating ecological capacity and supporting sustainable territorial governance. Such alignment enhances the robustness and international relevance of the methodology, facilitating its potential application in global ecological management and policy design.
4.4. Limitations and Perspectives
The estimation of NEP relies partly on model-based heterotrophic respiration (Rh) data, which may introduce uncertainties in areas with complex topography or sparse observations. Likewise, the use of interpolated climatic datasets and the equal-weight assumption between NEP and HAI could affect the precision of the coupling coordination index. Moreover, satellite-derived data in rural or low-density regions may contain inherent errors, and socioeconomic indicators such as GDP and population density may not fully reflect informal or seasonal human activities.
Although the findings confirm the positive effects of ecological restoration programs such as the Grain for Green Project, this study did not include explicit counterfactual analyses to explore what might occur in the absence of these interventions or under alternative management scenarios. Future research could incorporate scenario-based modeling and policy simulations to assess how different land-use and restoration strategies influence NEP–HAI coordination under uncertain socio-ecological conditions. Such approaches would enhance the evaluative capacity of the framework and extend its applicability to regions that have not implemented similar ecological policies.
In addition, exogenous factors—including regional policy changes, agricultural subsidy adjustments, and extreme weather events such as droughts or floods—may influence both NEP and HAI but were not explicitly considered in this analysis. These sources of uncertainty highlight the need for future research to incorporate higher-resolution remote sensing products, integrate field-based biophysical and socio-economic data, and explore alternative weighting approaches such as principal component analysis (PCA) or the analytic hierarchy process (AHP) to test the robustness of the HAI index. Future work could also focus on developing dynamic socio-ecological models capable of capturing feedbacks between human and ecological systems, thereby improving the explanatory and predictive capacity of NEP–HAI coordination analyses.
5. Conclusions
This study explored the coupling coordination between NEP and HAI in the ZC region from 2000 to 2023. By integrating multi-source data, spatial analysis, and trend-sustainability modeling, the research provides new insights into how ecological and socio-economic systems co-evolve in fragile agro-pastoral transition zones. The main conclusions are as follows:
- (1)
- NEP and HAI exhibited a coordinated upward trend, indicating that regional ecological restoration and socio-economic development are gradually achieving mutual reinforcement. The coordination pattern evolved from human-dominated imbalance to ecological–social synergy, with high coordination concentrated in the forested eastern mountains and low coordination persisting in agro-pastoral transition belts.
- (2)
- LUI was identified as the dominant driver of spatial heterogeneity in coupling coordination, while natural factors such as vegetation condition (NDVI), drought stress (SPEI), and topography (ELV, SLP) gained increasing importance over time. Interactive effects between anthropogenic and natural factors.
- (3)
- MK and Hurst analyses revealed that the ZC region will likely continue on a positive trajectory of NEP–HAI coordination, though with pronounced spatial differentiation. Strongly improving areas are concentrated in mountainous zones, while degradation-prone areas remain in agro-pastoral transition belts, requiring targeted management.
- (4)
- Targeted management strategies should be adopted according to regional coordination levels. Low-coordination zones require vegetation recovery, soil conservation, and strict land-use regulation; stable coordination areas should strengthen resilience through ecological compensation and sustainable agriculture; and high-pressure transition zones should promote low-carbon development and land-use optimization. These differentiated measures can support the realization of carbon neutrality and ecological security goals in northern China, while offering a reference for sustainable development in similar regions worldwide.
Moreover, the findings of this study align with international sustainability and climate governance frameworks, particularly the United Nations Sustainable Development Goals (SDGs) and the Paris Agreement. By providing a regional pathway toward carbon neutrality and ecosystem resilience, the NEP–HAI coordination framework contributes to SDG 13 (Climate Action) and SDG 15 (Life on Land), and offers a transferable approach for balancing ecological protection with socio-economic development in other semi-arid regions worldwide.
Author Contributions
Conceptualization, Y.W. and A.J.; methodology, Y.W. and A.J.; writing—original draft, Y.W. and A.J.; writing—review and editing, Y.W. and A.J.; visualization, Z.X.; supervision, Y.K.; project administration, Y.Y.; funding acquisition, G.L. All authors have read and agreed to the published version of the manuscript.
Funding
This research was supported by the project of Youth Fund Project for Hebei Minzu Normal University (grant numbers: QN2024002); Hebei Key Laboratory of Mountain Geological Environment (grant numbers: HBKLMGE202403); Higher Education Science and Technology Research Project for Hebei Province (grant numbers: BJK2023105); Science and Technology Special Project for the Construction of the Chengde National Sustainable Development Agenda Innovation Demonstration Area (grant numbers: 202302F006).
Institutional Review Board Statement
Not applicable.
Informed Consent Statement
Not applicable.
Data Availability Statement
The data that support the findings of this study are available from the corresponding authors upon reasonable request.
Conflicts of Interest
The authors declare no conflicts of interest.
References
- Lal, R. Soil carbon sequestration impacts on global climate change and food security. Science 2004, 304, 1623–1627. [Google Scholar] [CrossRef]
- He, B.; Chen, C.; Lin, S.R.; Yuan, W.P.; Chen, H.W.; Chen, D.L.; Zhang, Y.F.; Guo, L.L.; Zhao, X.; Liu, X.B.; et al. Worldwide impacts of atmospheric vapor pressure deficit on the interannual variability of terrestrial carbon sinks. Natl. Sci. Rev. 2022, 9, nwab150. [Google Scholar] [CrossRef]
- Zhang, L.; Ren, X.L.; Wang, J.B.; He, H.L.; Wang, S.Q.; Wang, M.M.; Piao, S.L.; Yan, H.; Ju, W.M.; Gu, F.X.; et al. Interannual variability of terrestrial net ecosystem productivity over China: Regional contributions and climate attribution. Environ. Res. Lett. 2019, 14, 014003. [Google Scholar] [CrossRef]
- Zhu, X.J.; Fan, R.X.; Chen, Z.; Wang, Q.F.; Yu, G.R. Eddy covariance-based differences in net ecosystem productivity values and spatial patterns between naturally regenerating forests and planted forests in China. Sci. Rep. 2022, 12, 20556. [Google Scholar] [CrossRef]
- Wang, N.; Zhao, Y.X.; Song, T.; Zou, X.L.; Wang, E.; Du, S. Accounting for China’s Net Carbon Emissions and Research on the Realization Path of Carbon Neutralization Based on Ecosystem Carbon Sinks. Sustainability 2022, 14, 14750. [Google Scholar] [CrossRef]
- Li, T.; Lu, Y.H.; Fu, B.J.; Comber, A.J.; Harris, P.; Wu, L.H. Gauging policy-driven large-scale vegetation restoration programmes under a changing environment: Their effectiveness and socio-economic relationships. Sci. Total Environ. 2017, 607, 911–919. [Google Scholar] [CrossRef] [PubMed]
- Gilby, B.L.; Olds, A.D.; Brown, C.J.; Connolly, R.M.; Henderson, C.J.; Maxwell, P.S.; Schlacher, T.A. Applying systematic conservation planning to improve the allocation of restoration actions at multiple spatial scales. Restor. Ecol. 2021, 29, 13403. [Google Scholar] [CrossRef]
- Saunois, M.; Stavert, A.R.; Poulter, B.; Bousquet, P.; Canadell, J.G.; Jackson, R.B.; Raymond, P.A.; Dlugokencky, E.J.; Houweling, S.; Patra, P.K.; et al. The Global Methane Budget 2000–2017. Earth Syst. Sci. Data 2020, 12, 1561–1623. [Google Scholar] [CrossRef]
- Mo, L.D.; Zohner, C.M.; Reich, P.B.; Liang, J.J.; de Miguel, S.; Nabuurs, G.J.; Renner, S.S.; van den Hoogen, J.; Araza, A.; Herold, M.; et al. Integrated global assessment of the natural forest carbon potential. Nature 2023, 624, 92–101. [Google Scholar] [CrossRef]
- Padilla, F.M.; Vidal, B.; Sánchez, J.; Pugnaire, F.I. Land-use changes and carbon sequestration through the twentieth century in a Mediterranean mountain ecosystem: Implications for land management. J. Environ. Manag. 2010, 91, 2688–2695. [Google Scholar] [CrossRef] [PubMed]
- Reichstein, M.; Papale, D.; Valentini, R.; Aubinet, M.; Bernhofer, C.; Knohl, A.; Laurila, T.; Lindroth, A.; Moors, E.; Pilegaard, K.; et al. Determinants of terrestrial ecosystem carbon balance inferred from European eddy covariance flux sites. Geophys. Res. Lett. 2007, 34, 101402. [Google Scholar] [CrossRef]
- Yang, S.F.; Li, Y.; Zhao, Y.L.; Lan, A.J.; Zhou, C.F.; Lu, H.X.; Zhou, L.Y. Changes in vegetation ecosystem carbon sinks and their response to drought in the karst concentration distribution area of Asia. Ecol. Inform. 2024, 84, 102907. [Google Scholar] [CrossRef]
- Liu, J.X.; Wang, Z.; Duan, Y.F.; Li, X.R.; Zhang, M.Y.; Liu, H.Y.; Xue, P.; Gong, H.B.; Wang, X.; Chen, Y.; et al. Effects of land use patterns on the interannual variations of carbon sinks of terrestrial ecosystems in China. Ecol. Indic. 2023, 146, 09914. [Google Scholar] [CrossRef]
- Liu, J.C.; Gao, W.C.; Liu, T.Z.; Dai, L.Y.; Wu, L.J.; Miao, H.Y.; Yang, C. A Bibliometric Analysis of the Impact of Ecological Restoration on Carbon Sequestration in Ecosystems. Forests 2023, 14, 1442. [Google Scholar] [CrossRef]
- Li, L.; Huang, X.J.; Yang, H. A new framework for identifying ecological conservation and restoration areas to enhance carbon storage. Ecol. Indic. 2023, 154, 110523. [Google Scholar] [CrossRef]
- Qiu, S.; Yu, Q.; Niu, T.; Fang, M.Z.; Guo, H.Q.; Liu, H.J.; Li, S.; Zhang, J.Y. Restoration and renewal of ecological spatial network in mining cities for the purpose of enhancing carbon Sinks: The case of Xuzhou, China. Ecol. Indic. 2022, 143, 109313. [Google Scholar] [CrossRef]
- Dilling, L.; Failey, E. Managing carbon in a multiple use world: The implications of land-use decision context for carbon management. Glob. Environ. Change-Hum. Policy Dimens. 2013, 23, 291–300. [Google Scholar] [CrossRef]
- Zhang, M.Y.; Wang, K.L.; Liu, H.Y.; Zhang, C.H.; Wang, J.; Yue, Y.M.; Qi, X.K. How ecological restoration alters ecosystem services: An analysis of vegetation carbon sequestration in the karst area of northwest Guangxi, China. Environ. Earth Sci. 2015, 74, 5307–5317. [Google Scholar] [CrossRef]
- Lyu, X.; Li, X.B.; Wang, K.; Zhang, C.H.; Dang, D.L.; Dou, H.S.; Lou, A.R. Strengthening grassland carbon source and sink management to enhance its contribution to regional carbon neutrality. Ecol. Indic. 2023, 152, 110341. [Google Scholar] [CrossRef]
- Chen, B.M.; Jing, X.; Liu, S.S.; Jiang, J.; Wang, Y.G. Intermediate human activities maximize dryland ecosystem services in the long-term land-use change: Evidence from the Sangong River watershed, northwest China. J. Environ. Manag. 2022, 319, 115708. [Google Scholar] [CrossRef]
- Lu, Q.; Fan, H.H.; Zhang, F.Q.; Chen, W.B.; Xia, Y.P.; Yan, B. The dominant role of human activity intensity in spatial pattern of ecosystem health in the Poyang Lake ecological economic zone. Ecol. Indic. 2024, 166, 112347. [Google Scholar] [CrossRef]
- An, Q.M.; Yuan, X.F.; Zhang, X.R.; Yang, Y.; Chen, J.H.; An, J.J. Spatio-temporal interaction and constraint effects between ecosystem services and human activity intensity in Shaanxi Province, China. Ecol. Indic. 2024, 160, 111937. [Google Scholar] [CrossRef]
- Li, M.C.; Mao, C.M. Spatial-Temporal Variance of Coupling Relationship between Population Modernization and Eco-Environment in Beijing-Tianjin-Hebei. Sustainability 2019, 11, 991. [Google Scholar] [CrossRef]
- Kang, S.Z.; Jia, X.; Zhao, Y.H.; Luo, M.Y.; Wang, H.Y.; Zhao, M. The Coupling Coordination Relationship Between Urbanization and the Eco-Environment in Resource-Based Cities, Loess Plateau, China. ISPRS Int. J. Geo-Inf. 2024, 13, 437. [Google Scholar] [CrossRef]
- Liu, Y.; Zhang, Z.X.; Huang, X.J. A novel coupling cloud decision-making framework for investigating population-economy-water consumption nexus in the Inner Mongolia reaches of the Yellow River, China. Environ. Impact Assess. Rev. 2023, 98, 106923. [Google Scholar] [CrossRef]
- Hermoso, V.; Pantus, F.; Olley, J.; Linke, S.; Mugodo, J.; Lea, P. Systematic planning for river rehabilitation: Integrating multiple ecological and economic objectives in complex decisions. Freshw. Biol. 2012, 57, 1–9. [Google Scholar] [CrossRef]
- Li, Q.; Li, W.J.; Wang, S.; Wang, J.F. Assessing heterogeneity of trade-offs/synergies and values among ecosystem services in Beijing-Tianjin-Hebei urban agglomeration. Ecol. Indic. 2022, 140, 109026. [Google Scholar] [CrossRef]
- Zhou, W.; Xi, Y.T.; Zhai, L.; Li, C.; Li, J.Y.; Hou, W. Zoning for Spatial Conservation and Restoration Based on Ecosystem Services in Highly Urbanized Region: A Case Study in Beijing-Tianjin-Hebei, China. Land 2023, 12, 733. [Google Scholar] [CrossRef]
- Herrmann, S.M.; Hutchinson, C.F. The changing contexts of the desertification debate. J. Arid Environ. 2005, 63, 538–555. [Google Scholar] [CrossRef]
- He, N.; Zhou, Y.; Wang, L.; Li, Q.; Zuo, Q.; Liu, J. Spatiotemporal differentiation and the coupling analysis of ecosystem service value with land use change in Hubei Province, China. Ecol. Indic. 2022, 45, 109693. [Google Scholar] [CrossRef]
- Lovett, G.; Cole, J.; Pace, M. Is net ecosystem production equal to ecosystem carbon accumulation? Ecosystems 2006, 9, 152–155. [Google Scholar] [CrossRef]
- Hou, Q.Q.; Yang, H.; Wu, J.S.; Yu, X.J. Carbon budget response to climate change varies with grassland type in Qilian Mountains, China. Glob. Ecol. Conserv. 2023, 47, 2670. [Google Scholar] [CrossRef]
- Sun, Y.X.; Liu, S.L.; Shi, F.N.; An, Y.; Li, M.Q.; Liu, Y.X. Spatio-temporal variations and coupling of human activity intensity and ecosystem services based on the four-quadrant model on the Qinghai-Tibet Plateau. Sci. Total Environ. 2020, 743, 140721. [Google Scholar]
- Zhang, F.T.; Sun, C.C.; An, Y.Z.; Luo, Y.G.; Yang, Q.; Su, W.C.; Gao, L. Coupling coordination and obstacle factors between tourism and the ecological environment in Chongqing, China: A multi-model comparison. Asia Pac. J. Tour. Res. 2021, 26, 811–828. [Google Scholar] [CrossRef]
- Wang, M.M.; Zhu, X.Y.; Yin, S. Spatial-temporal coupling coordination and interaction between digitalization and traditional industrial upgrading: A case study of the Yellow River Basin. Sci. Rep. 2023, 13, 17997. [Google Scholar] [CrossRef]
- Zhu, L.J.; Meng, J.J.; Zhu, L.K. Applying Geodetector to disentangle the contributions of natural and anthropogenic factors to NDVI variations in the middle reaches of the Heihe River Basin. Ecol. Indic. 2020, 117, 106545. [Google Scholar] [CrossRef]
- Liu, W.X.; Xue, Y.; Shang, C. Spatial distribution analysis and driving factors of traditional villages in Henan province: A comprehensive approach via geospatial techniques and statistical models. Herit. Sci. 2023, 11, 185. [Google Scholar] [CrossRef]
- Sicard, P.; Agathokleous, E.; De Marco, A.; Paoletti, E.; Calatayud, V. Urban population exposure to air pollution in Europe over the last decades. Environ. Sci. Eur. 2021, 33, 28. [Google Scholar] [CrossRef]
- Qu, S.; Wang, L.C.; Lin, A.W.; Yu, D.Q.; Yuan, M.X.; Li, C.A. Distinguishing the impacts of climate change and anthropogenic factors on vegetation dynamics in the Yangtze River Basin, China. Ecol. Indic. 2020, 108, 105724. [Google Scholar] [CrossRef]
- Deng, L.; Liu, S.G.; Kim, D.G.; Peng, C.H.; Sweeney, S.; Shangguan, Z.P. Past and future carbon sequestration benefits of China’s grain for green program. Glob. Environ. Change-Hum. Policy Dimens. 2017, 47, 13–20. [Google Scholar] [CrossRef]
- Cai, D.W.; Ge, Q.S.; Wang, X.M.; Liu, B.L.; Goudie, A.S.; Hu, S. Contributions of ecological programs to vegetation restoration in arid and semiarid China. Environ. Res. Lett. 2020, 15, 114046. [Google Scholar] [CrossRef]
- Wang, H.; Liu, G.H.; Li, Z.S.; Wang, P.T.; Wang, Z.Z. Comparative Assessment of Vegetation Dynamics under the Influence of Climate Change and Human Activities in Five Ecologically Vulnerable Regions of China from 2000 to 2015. Forests 2019, 10, 317. [Google Scholar] [CrossRef]
- Asghar, M.; Ayaz, M.; Ali, S. Ecological resilience in crisis: Analyzing the role of urban land use and institutional policies. Land Use Policy 2025, 151, 107492. [Google Scholar] [CrossRef]
- Cao, S.X.; Xia, C.Q.; Xian, J.L.; Guo, H.; Zheng, H.R. Payoff of the Grain for Green policy. J. Appl. Ecol. 2020, 57, 1180–1188. [Google Scholar] [CrossRef]
- Tang, F.L.; Zeng, P.; Guo, Y.Y.; Shen, Y.N.; Wang, L.; Liu, K.X.; Zhang, L.H. Decoding the spatiotemporal dynamics and driving mechanisms of ecological resilience in the Beijing-Tianjin-Hebei urban agglomeration: A deep learning approach. Urban Clim. 2025, 61, 102436. [Google Scholar] [CrossRef]
- Xu, K.P.; Chi, Y.Y.; Wang, J.J.; Ge, R.F.; Wang, X.H. Analysis of the spatial characteristics and driving forces determining ecosystem quality of the Beijing-Tianjin-Hebei region. Environ. Sci. Pollut. Res. 2021, 28, 12555–12565. [Google Scholar] [CrossRef]
- Huang, Z.X.; Li, S.; Peng, J.J.; Ma, X.R.; Ding, H.X.; Cheng, F.Y.; Bi, R.T. Assessing ecosystem service dynamics and drivers for sustainable management in the Agro-pastoral ecotone of northern China: A spatiotemporal analysis. Ecol. Indic. 2024, 165, 112213. [Google Scholar] [CrossRef]
- Zhai, Y.P.; Zhai, G.Q.; Chen, Y.M.; Liu, J.Z. Research on regional terrestrial carbon storage based on the pattern-process-function. Ecol. Inform. 2024, 80, 102523. [Google Scholar] [CrossRef]
- Yan, F.; Guo, X.Y.; Zhang, Y.W.; Shan, J.; Miao, Z.H.; Li, C.Y.; Huang, X.H.; Pang, J.; Chen, Y.H. Analysis of the multiple drivers of vegetation cover evolution in the Taihangshan-Yanshan region. Sci. Rep. 2024, 14, 15306. [Google Scholar] [CrossRef]
- Gao, M.N.; Hu, Y.X.; Shang, G.F.; Li, W. Research on the impact of spatial and temporal changes in ecological product value in Hebei Province based on land use changes. Sci. Rep. 2025, 15, 9571. [Google Scholar] [CrossRef]
- Wen, Y.Y.; Liu, X.P.; Xin, Q.C.; Wu, J.; Xu, X.C.; Pei, F.S.; Li, X.; Du, G.M.; Cai, Y.L.; Lin, K.; et al. Cumulative Effects of Climatic Factors on Terrestrial Vegetation Growth. J. Geophys. Res.-Biogeosciences 2019, 124, 789–806. [Google Scholar] [CrossRef]
- Du, G.M.; Yan, S.H.; Chen, H.; Yang, J.; Wen, Y.Y. Intra-Annual Cumulative Effects and Mechanisms of Climatic Factors on Global Vegetation Biomes’ Growth. Remote Sens. 2024, 16, 779. [Google Scholar] [CrossRef]
- Wen, Y.Y.; Yang, J.; Liao, W.L.; Xiao, J.N.; Yan, S.H. Refined assessment of space-time changes, influencing factors and socio-economic impacts of the terrestrial ecosystem quality: A case study of the GBA. J. Environ. Manag. 2023, 345, 118869. [Google Scholar] [CrossRef] [PubMed]
- Córdoba Hernández, R.; Camerin, F. Assessment of ecological capacity for urban planning and improving resilience in the European framework: An approach based on the Spanish case. Cuad. Investig. Geográfica 2023, 49, 119–142. [Google Scholar] [CrossRef]


Disclaimer/Publisher’s Note: The statements, opinions and data contained in all publications are solely those of the individual author(s) and contributor(s) and not of MDPI and/or the editor(s). MDPI and/or the editor(s) disclaim responsibility for any injury to people or property resulting from any ideas, methods, instructions or products referred to in the content. |
© 2025 by the authors. Licensee MDPI, Basel, Switzerland. This article is an open access article distributed under the terms and conditions of the Creative Commons Attribution (CC BY) license (https://creativecommons.org/licenses/by/4.0/).