Article

Decarbonizing Island Mobility: Energy and Environmental Benefits of Rail Transport in Gran Canaria

by
Wenceslao Berriel Martínez
1,
José Antonio Carta
2 and
Alexis Lozano-Medina
3,*
1
Doctoral School in Chemical, Mechanical and Manufacturing Engineering (QUIMEFA), University of Las Palmas de Gran Canaria, Campus de Tafira s/n, 35017 Las Palmas de Gran Canaria, Spain
2
Department of Mechanical Engineering, University of Las Palmas de Gran Canaria, Campus de Tafira s/n, 35017 Las Palmas de Gran Canaria, Spain
3
Department of Civil Engineering, University of Las Palmas de Gran Canaria, Campus de Tafira s/n, 35017 Las Palmas de Gran Canaria, Spain
*
Author to whom correspondence should be addressed.
Sustainability 2025, 17(21), 9518; https://doi.org/10.3390/su17219518 (registering DOI)
Submission received: 16 September 2025 / Revised: 13 October 2025 / Accepted: 23 October 2025 / Published: 26 October 2025

Abstract

The shift to sustainable mobility is especially challenging for island regions, where limited land, densely populated corridors, and strong reliance on fossil fuels constrain transport options. This study develops a macroscale methodology to estimate reductions in energy use, greenhouse gas emissions, and traffic congestion by replacing fossil-fuel-based public and private road transport with an electric rail system supplied exclusively by dedicated renewable energy sources. Unlike conventional electrification, this approach guarantees genuine decarbonization by ensuring a fully renewable power supply for rail operations. Gran Canaria is employed as a case study, applying the methodology through an intermodal scenario that integrates the rail system with existing public transport services. Results show substantial potential to lower the carbon footprint, improve energy efficiency, and relieve congestion. The analysis focuses on the southeastern metropolitan corridor of the island, where transport demand, population, and economic activities are most concentrated. The proposed framework offers a transferable tool for supporting sustainable mobility strategies in island contexts consistent with global climate goals and policy priorities. Although the case study is specific to Gran Canaria, the methodology provides insights that may be relevant for other territories with comparable mobility and energy challenges, including isolated or weak-grid regions.

1. Introduction

Sustainable mobility is a key pillar for both quality of life and economic development, as it facilitates the movement of people and goods while minimizing environmental impacts [1]. However, island regions face specific challenges in the shift toward more sustainable transportation models, due to limited territory, the high concentration of population and economic activity along certain corridors, and a heavy reliance on fossil fuels for both transportation and energy production.
These factors contribute to severe congestion on main roads [2], high energy consumption, and significant greenhouse gas (GHG) emissions [3]. In high-demand corridors, road infrastructure often operates at or beyond capacity, and expansion options are typically scarce or environmentally unfeasible [4].
At the international level, solutions such as the electrification of public and private transport, the implementation of intermodal systems, and the reorganization of urban mobility have been explored [5]. Examples include the redesign of multimodal corridors in Athens [6], vehicle ownership controls in Singapore [7], and the impacts observed near rail corridors in Los Angeles, all of which demonstrate that integrating guided transport systems can significantly reduce emissions and improve energy efficiency [8]. However, most of these studies have been carried out in continental and urban contexts and rarely consider the territorial and energy-related specificities of island regions.
Moreover, transport electrification is often presented as a key solution for the decarbonization of the sector [9]. However, various studies have shown that electrification alone does not ensure a net reduction in emissions if the electricity used is generated from fossil fuels [10], as this implies that emissions are simply shifted from the transport sector to the power sector. This issue is particularly critical in island territories, where the energy mix often remains heavily dependent on fossil fuels and renewable energy self-sufficiency is limited. In this context, it is essential to develop strategies that guarantee a dedicated renewable energy supply for transportation, so that electrification genuinely contributes to emissions reduction [11].
Gran Canaria, the third largest island in the Canary Islands archipelago, represents a paradigmatic case of the challenges associated with island mobility. With an area of 1560 km2 and a population exceeding 850,000 inhabitants, it ranks as the second most populated island of the archipelago. This high demographic concentration, together with the intense economic activity structured along the Las Palmas de Gran Canaria–tourist south axis [12,13,14], places strong pressure on the transport system, generating high levels of road congestion [15], energy consumption, and pollutant emissions [16].
The island’s high population density, the concentration of economic activity along the eastern corridor, and an energy dependency exceeding 90% on fossil fuels—which the PNIEC plans to reduce by 50% [17]—create a particularly complex scenario for the development of sustainable mobility.
Figure 1 shows the geographical location of the Canary Islands archipelago in the Atlantic context and the main territorial characteristics of Gran Canaria [12]. This corridor handles the highest volume of recurring travel on the island, making it a strategic area for implementing more efficient and sustainable transportation solutions such as the train [18], and an ideal case for assessing the potential impact of a sustainable railway system [8].
In response to this situation, the island authorities have proposed the development of an intermodal [19] rail system [5,20], with dedicated infrastructure and the potential for integration with renewable energy sources [21], as a key tool for reducing emissions, decreasing energy consumption, and improving both environmental quality and the well-being of the population. This approach aligns with broader European goals for climate neutrality [5,20] and with regional goals for climate neutrality and energy transition over the coming decades.

Purpose and Novelty of the Study

This study is set within the broader global context of the transition toward sustainable mobility and the reduction of greenhouse gas emissions [3], with a particular focus on the unique challenges faced by island regions. These regions, characterized by territorial constraints, high population density concentrated in specific corridors, and a strong reliance on fossil fuels, require transportation planning strategies tailored to their specific conditions [7].
The aim of this work is to develop and apply a macroscopic methodology to estimate, in an integrated manner, the energy consumption, greenhouse gas emissions, and traffic congestion impacts generated by public and private transport in high-demand corridors within insular environments. This methodology, based on open data related to traffic volumes, vehicle fleet characteristics, and mobility patterns [22], is presented as a replicable tool to support decision-making in the strategic planning of sustainable transport infrastructure [23].
This methodological framework is applied to the case of Gran Canaria to quantify the achievable reductions in energy use, emissions, and congestion derived from replacing fossil-fuel transport with a renewable-powered rail system.
The main novelty of the study lies in its analysis of the replacement of both public and private fossil-fuel-based transport systems with an electric rail system powered exclusively by renewable energy sources. Although a dedicated wind farm was selected in the case study, the proposed methodology is flexible and can be adapted to other renewable sources depending on the availability of resources in each island region. This approach ensures that the shift toward electric transport results in genuine decarbonization [24], avoiding the common pitfall of merely transferring emissions from the transport sector to the power sector, an issue often encountered in conventional electrification projects.
With this, the study provides scientific and technical evidence that can serve as a foundation for public policies aimed at decarbonization [9], energy efficiency, reduction of road congestion [25], and the sustainable development of transportation in island territories, in alignment with the goals and scope of current international sustainability and climate change agendas [5], and Amending Regulation (EU) [26].
While the application presented here addresses the particular conditions of Gran Canaria, the analytical structure of the methodology makes it adaptable to other contexts with similar constraints. Examples include remote corridors, isolated grids, or metropolitan areas where transport systems can be explicitly coupled to a dedicated renewable supply. In this way, the study combines local policy relevance with methodological insights of broader interest.

2. Methodology

Energy consumption models for transport are important tools for planning [27] and can be applied at the micro-, meso-, or macro-scale, depending on the data available. With the growing availability of open data such as censuses, traffic counts, and vehicle technical characteristics, large-scale modeling of transport energy use has become feasible. Variables typically include the number of trips, vehicle types, distances traveled, and specific consumption. For example, Dingil et al. [28] proposed a method to estimate annual per capita energy consumption based on census and demographic data; Cortés et al. [29] considered vehicle numbers, population, urban area, GDP, and income; Abdelaty et al. [30] employed low-resolution open-source hourly load data; and Manrique et al. [31] established a methodology for suburban contexts. Other approaches include [23,32,33,34]. For instance, Ortego et al. [35] analyzed the Zaragoza tram system, developing an original methodology that considered the effect of implementing a new guided transport mode.
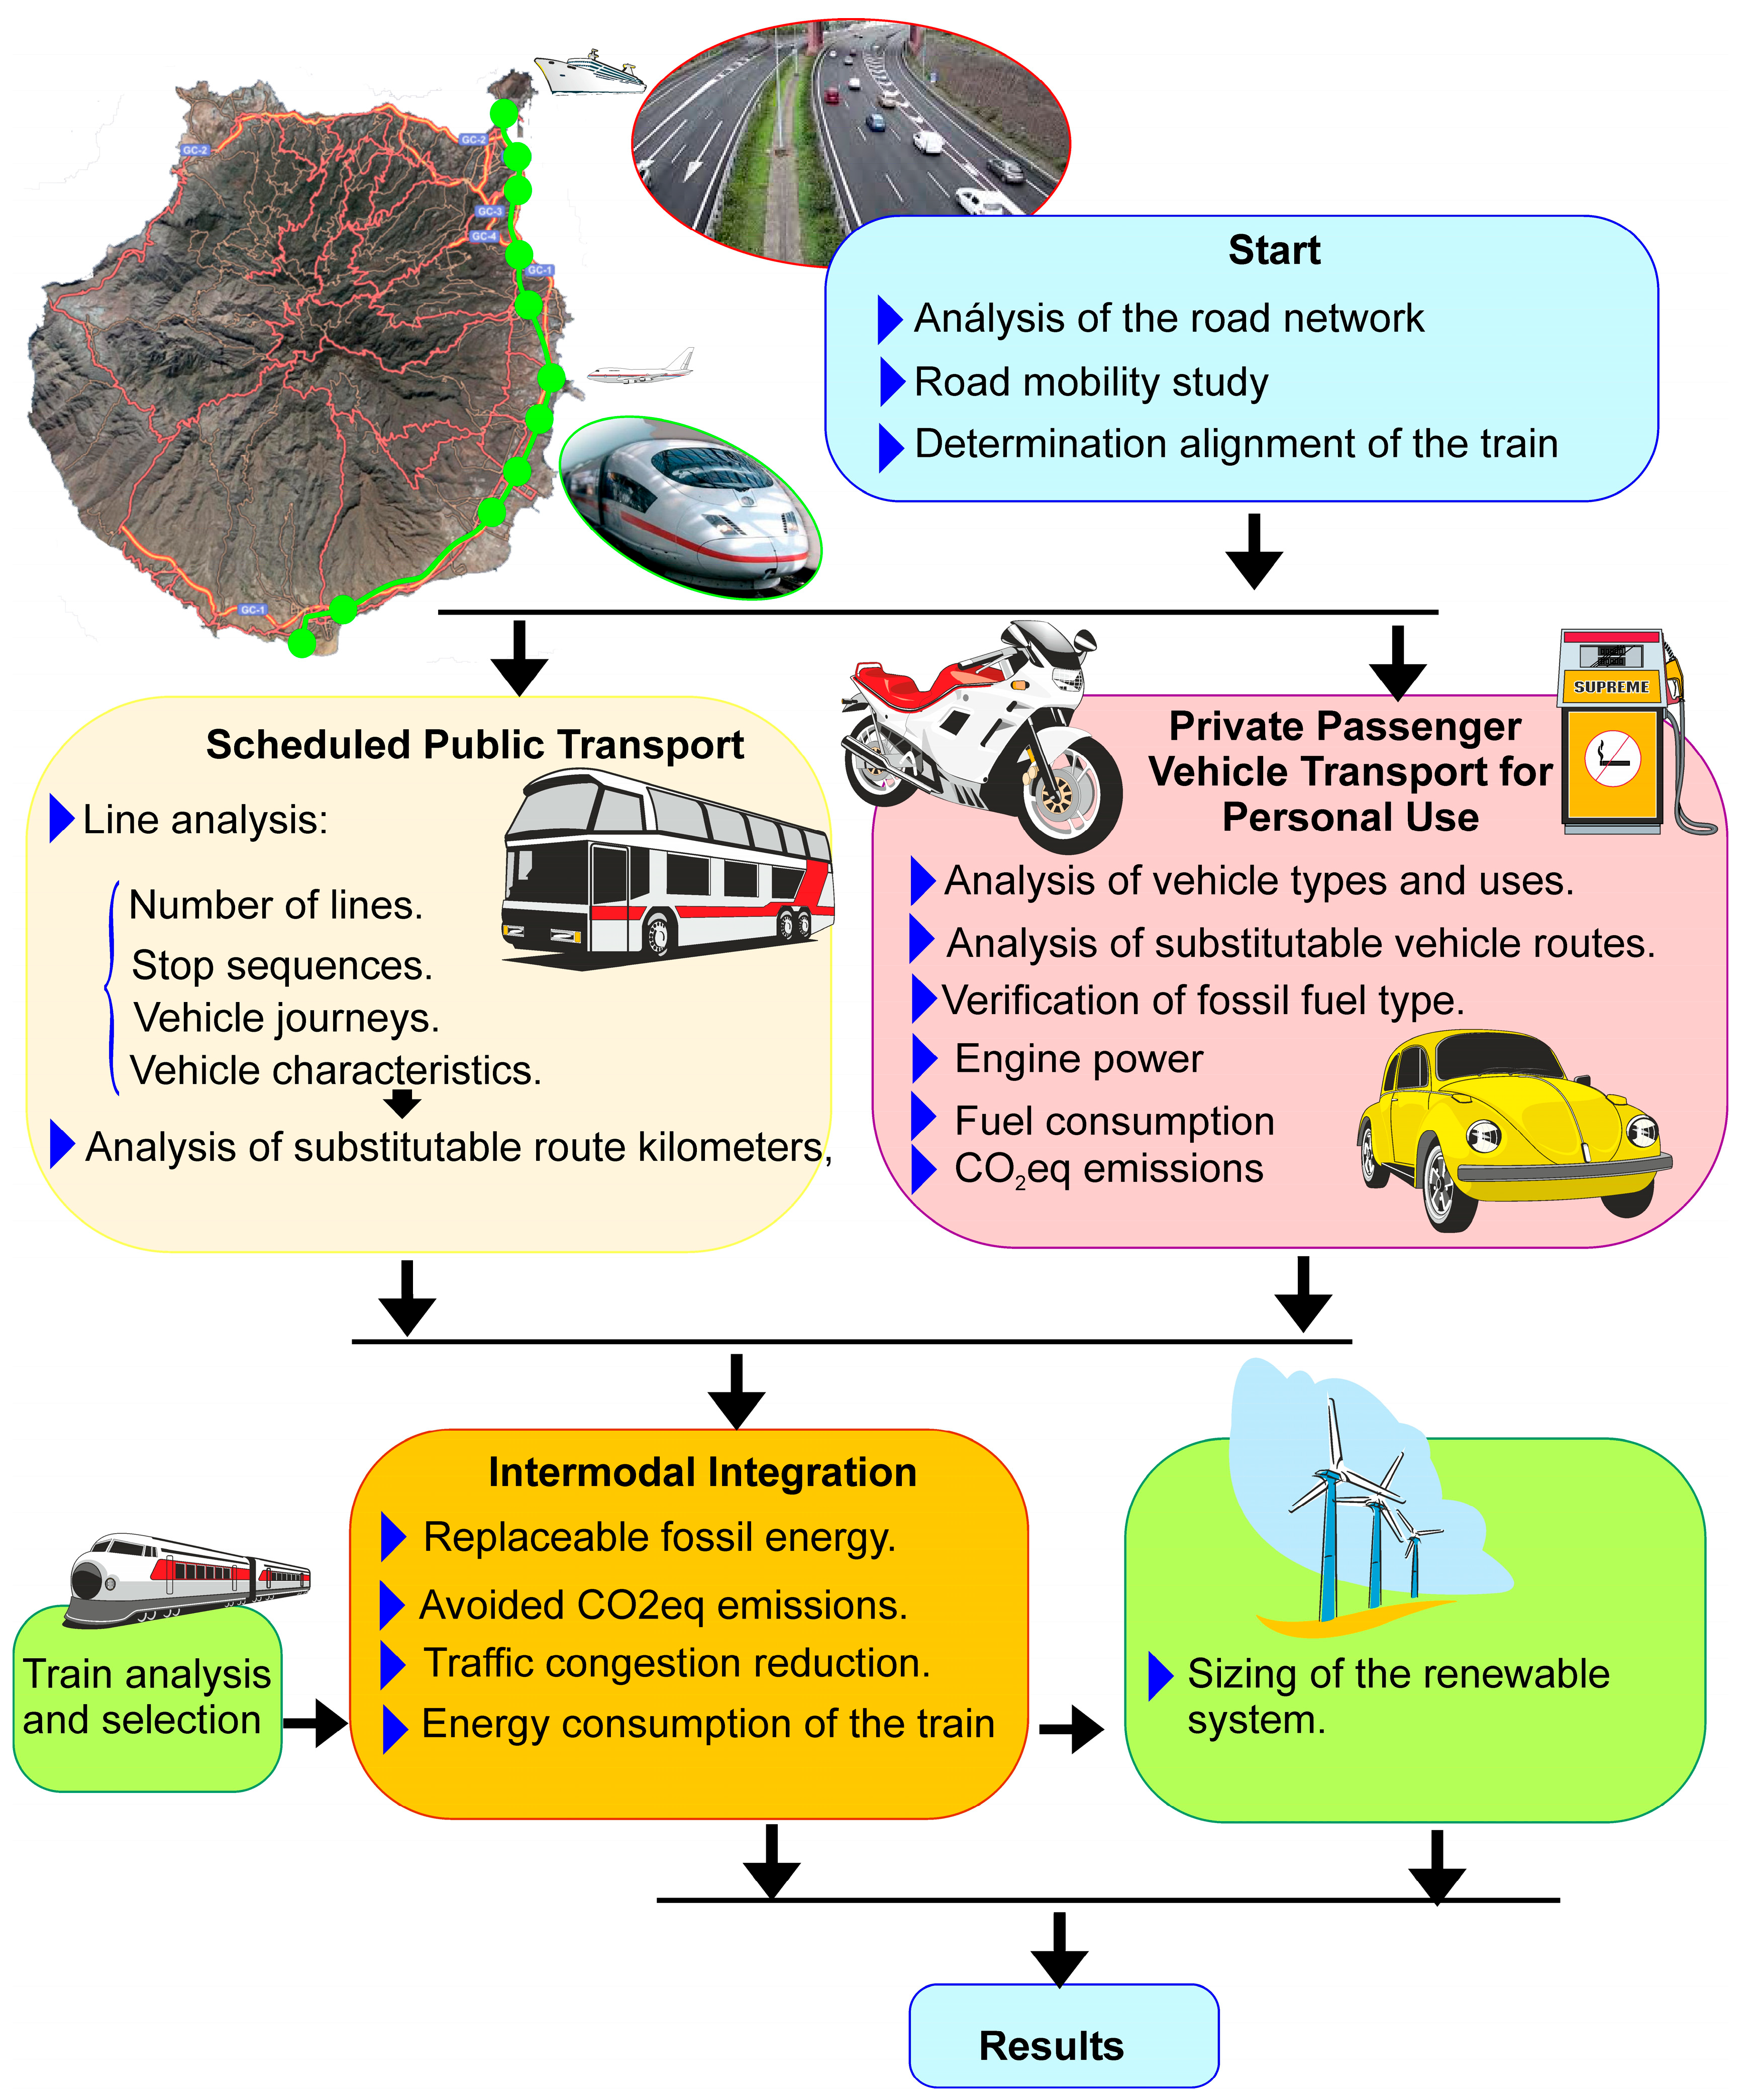
This study develops a macroscopic analytical methodology designed to estimate energy consumption, greenhouse gas (GHG) emissions, and traffic congestion impacts generated by public and private transport in high-demand corridors within island regions. The methodology is structured into three main components: analysis of public transport, analysis of private transport, and integration of results to evaluate intermodal scenarios. The overall structure of the methodology is summarized schematically in Figure 2, which outlines the core analytical blocks and the processes described in the following sections.
The proposed methodology is presented as a replicable tool, suitable for application in other island contexts or territories with similar characteristics, to support strategic planning processes aimed at sustainability [4], energy efficiency, and the transition toward cleaner and more efficient transport systems.
First, collective public transport is analyzed by identifying the existing bus lines within the study corridor. The segments of each line are classified based on their potential for re-placement by a rail system, considering geographic criteria and proximity to intermodal stations. For each line, the number of trips, total distance traveled, and associated energy consumption are quantified, distinguishing between trips with specific vehicle data and those lacking detailed information. The substitutable portion of energy consumption is estimated based on the percentage of kilometers overlapping with the proposed railway alignment. As shown in Figure 3, the analysis of regular public transport follows a three-stage process. Data inputs (stops, nodes, and routes) feed the processing and analysis steps, which identify replaceable segments and fuel consumption. The resulting outputs include replaceable distances and associated energy savings.
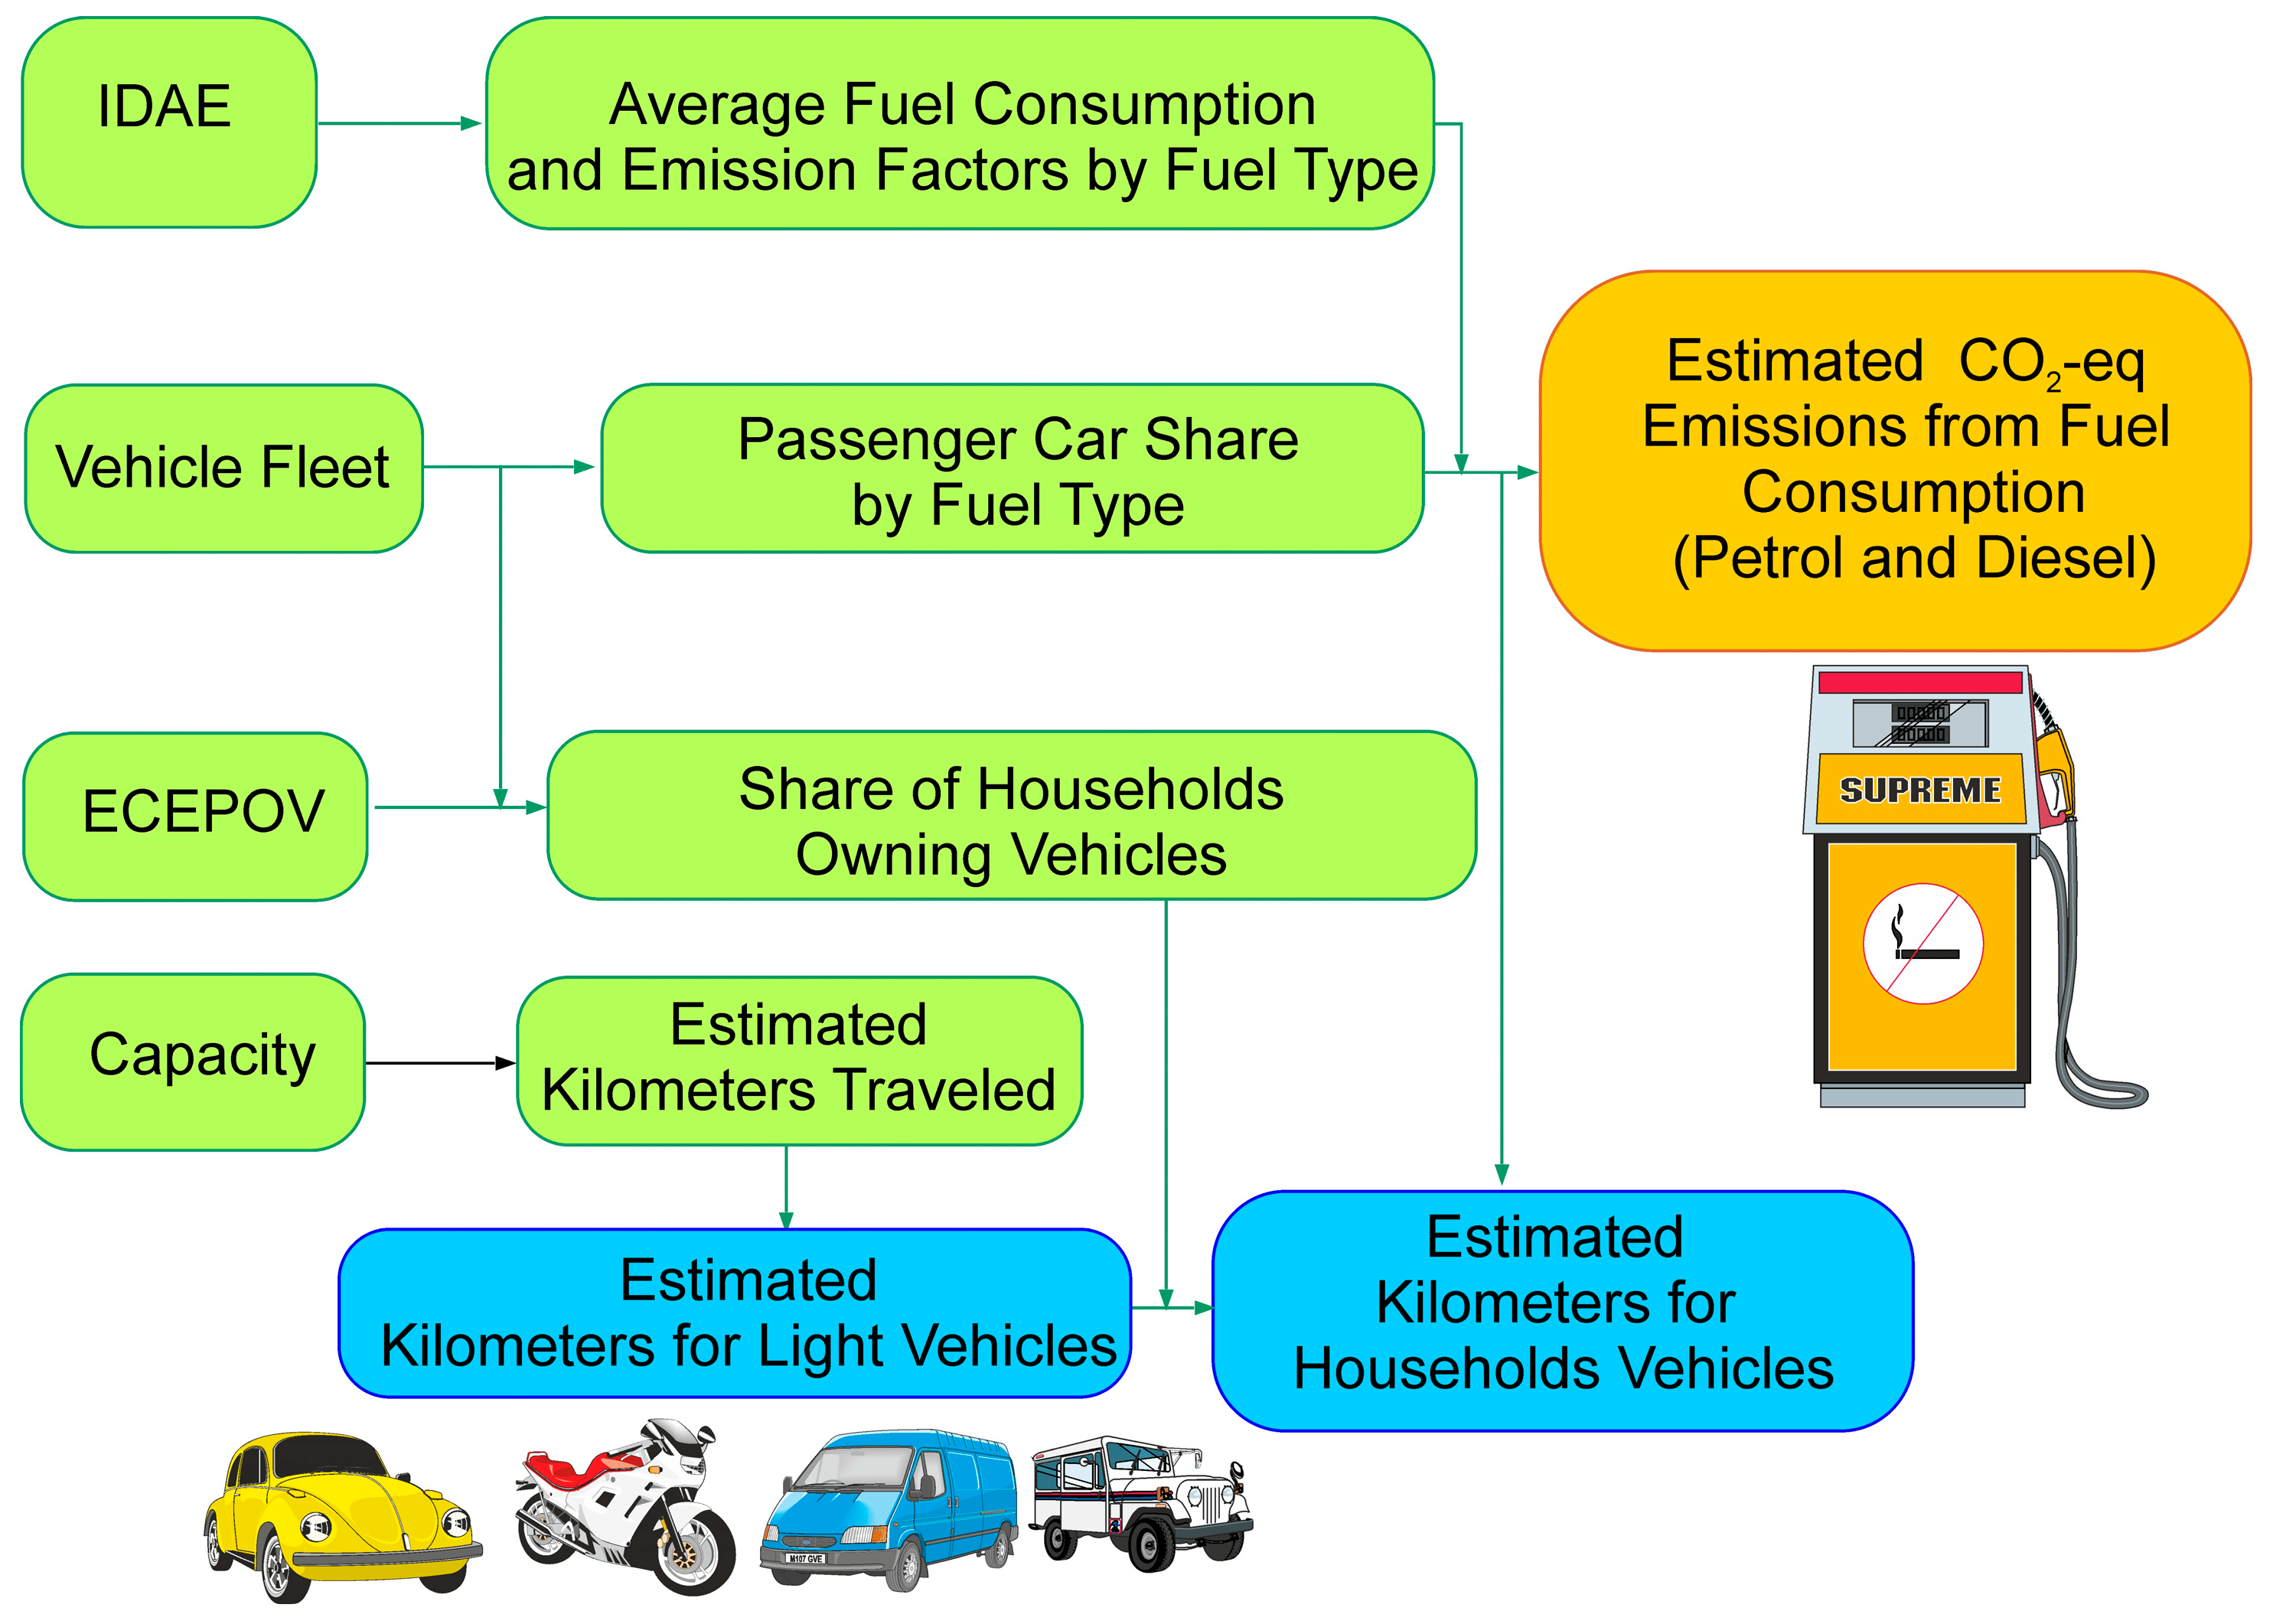
In the case of private transport, the number of light vehicles operating within the corridor is estimated using traffic count data and vehicle fleet composition ratios. Based on these inputs, the average daily mileage and annual fuel consumption are calculated, disaggregated by vehicle type (cars and motorcycles) and fuel type (gasoline or diesel). Emissions are then estimated using weighted average emission factors, considering the distribution of vehicle brands and engine sizes within the local fleet. Figure 4 illustrates the procedure applied to private transport. The process integrates several data inputs, such as fleet composition and household vehicle ownership, to estimate the kilometers traveled and the corresponding emissions from gasoline and diesel vehicles.
Finally, the results from both analytical blocks are integrated to assess the overall impact in terms of energy savings, emissions reduction, and decreased congestion resulting from the implementation of the rail system. A key innovative aspect of this methodology is that it goes beyond the mere electrification of guided transport by considering the exclusive use of energy from dedicated renewable sources, ensuring genuine decarbonization. Although a dedicated wind farm was used as the renewable source in the case study, the methodology is designed to be flexible and can be adapted to other renewable energy sources available in the island region under consideration, such as solar or hydropower.

2.1. Methodology for Public Transport Analysis

The analysis of collective public transport in high-demand corridors focuses on estimating the energy consumption and emissions generated by road-based public transport lines operating within the study corridor, as well as identifying the segments that could potentially be replaced by a rail or guided transport system in an intermodal scenario. The procedure followed these steps:
  • The existing public transport network within the corridor was identified.
  • The segments of each line that may be replaced are delineated [36] based on their geographical overlap with the planned rail route or their proximity to future intermodal stations [37]. This analysis considers reasonable walking distances, typically around 400 m for urban bus stops [38] and up to approximately 800–1000 m for rail stations [39], as reported in various urban mobility studies [39,40].
  • The number of passengers and total kilometers traveled along the identified segments are quantified.
  • The energy consumption and emissions associated with these segments are calculated to estimate the potential savings if they were to be replaced by the proposed rail system.
  • The annual energy consumption of each line is computed as the sum of the energy used by all its trips, distinguishing between trips with known vehicle data and those lacking such information.
For trips where vehicle data were available, energy consumption was estimated using Equation (1).
C E X i , f = K m R i , f · C o n s V i , f
where:
  • C E X i , f is the estimated energy consumption of expedition e i , f (in liters).
  • K m R i , f is the kilometers traveled during expedition e i , f .
  • C o n s V i , f is the vehicle’s fuel consumption per kilometer.
In all equations, the products correspond to scalar multiplications between variables or parameters and are represented by a centered dot “·”.
For expeditions without specific vehicle data, an average energy consumption was assigned, calculated as the mean consumption of expeditions with known vehicle data operating on the same route (Equation (2)). This value was then used to estimate consumption for those trips (Equation (3)).
C o n s E s t i = f E C o n s V i , f E
where:
  • ConsEsti is the estimated average consumption per kilometer for line Li.
  • E is the set of trips on Li with known vehicle consumption data.
  • E∣ is the number of trips in the set E.
Thus, the estimated energy consumption for a trip without specific vehicle data is calculated using Equation (3).
C E X D i , f = K m R i , f · C o n s E s t i
The annual energy consumption of line Li is calculated as the sum of the consumption of all expeditions carried out during the year, including those with known and unknown vehicle data, Equation (4).
C L i = f ϵ Ε C E X i , f + f Ε C E X D i , f
The average consumption per kilometer per line is estimated using Equation (5).
C L i ¯ = C L i f K m R i , f
where f K m R i , f   is the sum of the kilometers traveled in all the expeditions of the Li line.
To estimate the energy consumption replaceable by the implementation of the train we use Equation (6).
C S L i = K m R S i K m L i · C L i
where K m R S i representa represents the kilometers of the replaceable section of the route, and K m L i represents the total kilometers if all stops per line L i completed.
This procedure provides an estimate of the potential savings in fossil fuel consumption and emissions in public transport that could result from the implementation of the rail system. Furthermore, the public transport analysis helps assess the potential impact on road congestion by considering the reduction in the number of trips and kilometers traveled by the lines that would be replaced by the rail system.

2.2. Methodology for Private Transport Analysis

The private transport analysis aims to estimate the fuel consumption and greenhouse gas (GHG) emissions generated by private light-duty vehicles operating in high-demand corridors, as well as to quantify the share that could potentially be shifted to a guided transport system.
To this end, the first step is to estimate the number of private light vehicles present at each traffic count point within the corridor, disaggregated by vehicle type (cars or motorcycles) and fuel type (gasoline or diesel). This estimate is obtained using Equation (7).
N v j k a = N v p R N v l R · n l a · I M D a
where:
  • N v j k a is the number of private light-duty vehicles of type j and fuel type k at point a.
  • N v p R   is the total number of private vehicles in region R.
  • N v l R is the total number of light-duty vehicles in region R.
  • n l a is the proportion of light-duty vehicles in the total traffic at point a.
  • I M D a is the average daily traffic volume at point a.
The average daily mileage traveled by each vehicle type is then calculated using Equation (8).
r ¯ j k = N v k N v   · N v j k a · d p m A 1 , p m A + 1
where:
  • r ¯ j k are the daily kilometers traveled by vehicles of type j and fuel k.
  • N v k is the number of vehicles using fuel k.
  • Nv is the total number of light vehicles in the region.
  • d p m A 1 , p m A + 1   is the average between consecutive traffic count points in the corridor.
The average specific consumption per 100 km for each vehicle and fuel type, weighted by brand m and engine capacity c, is calculated using Equation (9).
c l j k ¯ = m c N v m c   ·   c l j k m c ¯ m , c N v m c
where:
  • c l ¯ j k m c is the average consumption (liters/100 km) of vehicles of type j, fuel k, brand m, and engine capacity c.
  • N v m c is the number of vehicles of brand m and engine capacity c.
Based on these data, the annual fuel consumption is estimated using Equation (10).
C C j k = 365 100   · c l ¯ j k . r ¯ j k
where C C j k represents yearly consumption, in liters, for a type j and fuel k.
To estimate the annual CO2 equivalent (CO2-eq) emissions, an analogous procedure is used, employing average emission factors per 100 km instead of fuel consumption, as shown in Equation (11).
E j k = 365 100   ·   e ¯ j k   ·   r ¯ j k
where:
  • E j k the annual amount of CO2-eq emitted by vehicles of type j and fuel k.
  • e ¯ j k is the average emission factor, in kg CO2-eq per 100 km, calculated using Equation (12).
e ̿ j k = m c   ·   e ̿ j k m c m c N v m c
where e ¯ j k m c is the average emission factor for vehicles of type j, fuel k, brand m, and engine capacity c.
This procedure makes it possible to obtain a detailed estimate of the energy consumption and emissions attributable to private transport in the study corridor, forming the basis for assessing the potential impact of its partial substitution through the implementation of the railway system. Likewise, the methodology allows for quantifying the volume of private traffic that could be transferred to the railway system, which is key to estimating the potential effect on congestion in the analyzed corridor.

2.3. Integration of Results and Intermodal Analysis

Finally, the results of both blocks are integrated to assess the aggregate impact in terms of energy savings, emission reductions, and congestion mitigation derived from the implementation of the railway system.
An innovative aspect of this methodology is the consideration of a dedicated renewable energy supply for the railway system. This integration makes it possible to distinguish between conventional electrification scenarios, in which emissions could be shifted to the electricity sector, and electrification scenarios powered by dedicated renewable energies, thereby ensuring genuine decarbonization of the transport system.
The proposed methodology is presented as a replicable tool, suitable for application in other island contexts or territories with similar characteristics, to support strategic planning processes aimed at sustainability [4], energy efficiency, and the transition toward cleaner and more efficient transport systems.

2.4. Sensitivity Analysis

A sensitivity analysis was carried out to assess the robustness of the results with respect to two critical assumptions: the share of rail users coming from private vehicles (s) and the average car occupancy (o). Under constant total rail demand, the number of cars removed from the road corridor—and thus the associated energy savings, avoided emissions, and congestion reduction—scales with the factor, Equation (13).
F = s s 0 · o 0 o
where s0 and o0 represent the baseline values adopted for the case study. These baseline values are presented in Section 3, which describes the data sources for Gran Canaria.
In addition to the proportional scaling used for private-car energy and emissions, congestion effects were cross-checked using the Bureau of Public Roads (BPR) speed–flow relationship, Equation (14).
t = t 0 · 1 + α · V C β
with the standard parameters α = 0.15 and β = 4, as originally proposed by the U.S. Bureau of Public Roads [41] and widely adopted in traffic assignment studies [42]. These default values continue to be used as reference points in more recent applications [43,44,45]. Reductions in car flow were modeled as, Equation (15).
D V = D V 0   · F
and the congestion reduction was then computed as, Equation (16).
R F = t t t
where t and t are the average travel times before and after the reduction in traffic volume, respectively.
The steps described above collectively form an integrated framework for quantifying energy use, emissions, and congestion impacts under different transport scenarios.

3. Materials

This study is based on a systematic integration of multiple public and private sector data sources, with the aim of characterizing mobility patterns and energy consumption in the southeastern corridor of Gran Canaria, affected by the future implementation of the railway system. The period analyzed corresponds to the year 2023, selected as a representative reference of normal mobility conditions following the recovery of post-pandemic activity. The year 2024 was excluded due to the entry into force of exceptional public transport fare-free measures (art. 74, RD-Law 8/2023), which significantly altered usual demand [46] by oversizing services, and whose continuity is not guaranteed.
To characterize the baseline situation and estimate the potential impact of the new railway system, this section is organized into four blocks. First, the current public transport system is analyzed, considering routes, trips, fuel consumption, and fleet characteristics. Second, the household vehicle fleet and private car mobility are studied, with special attention to the traffic volume along the railway axis and its associated consumption. Third, the energy and environmental analysis is addressed, including projected consumption and the emission factors considered. Finally, the renewable energy resource that would power the railway system is examined, ensuring complete decarbonization. Both public and private transport would benefit from road decongestion through the use of the train.

3.1. Public Transport

Public transport in Gran Canaria consists of an interurban bus network operated by the concessionaire company Global Salcai Utinsa S.A. (GSU), under the coordination of the Gran Canaria Single Transport Authority (AUTGC). The network covers all the island’s municipalities, with a system of high-frequency services along the eastern corridor, which accounts for the largest passenger traffic volume.
For this study, detailed information provided by the company GSU was used. The data include:
  • Georeferencing of the stop and line system. The stop network (n = 660 unique) and its relation to the intermediate arcs between nodes (n = 4954), corresponding to 153 operational lines, were extracted from the operational database and validated against the layout of the planned railway project.
  • The expeditions file containing 377,128 records for the year 2023. It includes information per expedition: line, direction, origin and destination stops, duration, kilometers traveled, commercial speed, vehicle type, seats offered, occupancy, and date. This database enables a dynamic characterization of corridor usage by day of the week and season of the year (school vs. holiday periods). Table 1 shows, as an example, the data in this file for line 055/14.
  • The consumption file with technical information on 259 vehicles, including average consumption (l/100 km), engine type and power (302–316 kW), emission category (Euro 6 B, C, or D), passenger capacity (seated and standing), and fuel type (diesel).
The analyzed fleet is equipped with an advanced onboard management system that enables real-time monitoring and control through GPRS communication, integration with ticketing platforms, inspection, and telemetry. This technological infrastructure allowed for detailed traceability of operations during 2023, the year selected as representative of stabilized mobility conditions following the COVID-19 pandemic.
In addition, georeferenced data on lines and stops were incorporated, with a total of 660 unique physical stops, more than 5000 passage records, and 4954 segments (arcs) defined between consecutive nodes. This network made it possible to accurately assess which current expeditions have a high degree of spatial overlap with the proposed railway alignment and, therefore, which could be fully or partially substituted after its implementation.

3.2. Private Transport

The analysis of private transport focused on characterizing the household vehicle fleet and estimating its potential for modal shift to the railway system.
Data were drawn from the Vehicle Fleet Statistics of the Canary Islands Statistics Institute (ISTAC) and the Spanish Directorate-General for Traffic (DGT), with time series spanning from 1961 to 2023. To characterize the structure of the vehicle fleet (Table 2), data from the years 2013, 2014, and 2015 were used, as these were considered representative of the balance between technological renewal and circulating volume. Only household passenger cars were included, while vans, commercial, institutional, and heavy vehicles were excluded.
In addition, the traffic gauging data provided by the Cabildo de Gran Canaria, located at strategic points of the corridor, especially at the accesses to the future railway stations, were incorporated (Table 3). This information made it possible to identify the most relevant road sections by traffic intensity and to estimate the volume of potentially substitutable vehicles.
To exclude vehicles not affected by modal shift, microdata from the Household Vehicle Module of the Survey on Essential Characteristics of Population and Housing (ECEPOV) of the Spanish National Statistics Institute (INE) were used. This module provides detailed information on the number of vehicles per household, main use (work, study, leisure), travel frequency, and usual mode of transport.
The potential for modal transfer was estimated based on data from the Demand Study prepared by INECO for the AUTGC, as well as academic studies from the University of Las Palmas de Gran Canaria (ULPGC). Both sources agree that 60% of the projected railway system users would come from private vehicles, with an average occupancy of 1.4 persons per car. These values allow for estimating a reduction of up to 42% in the flow of passenger cars circulating along the overlapping sections.
These empirical values (s0 = 0.60 and o0 = 1.4 passengers per vehicle) are used as reference inputs in the sensitivity analysis described in Section 2.4.
To determine the associated energy consumption, the IDAE Passenger Car Guide for vehicles sold in Spain (2016–2023) [47] was used, which details standardized consumption and emissions by model. Table 4 presents a summary of the five main brands.
Technological bias from the most recent models was avoided by averaging the ten best-selling vehicles per year and engine size segment. The average consumptions used in the model were: gasoline 5.48 l100 km and diesel 5.2 l/100 km.

3.3. Energy Consumption and Emissions

This section analyzes the energy consumption and associated emissions of both the current transport system and the projected railway system, allowing for the estimation of potential savings and decarbonization. According to the power study for direct current electrification of the Santa Catalina–Meloneras line [21], the energy consumption of the railway system was estimated for three types of service: island line, shuttle, and express.
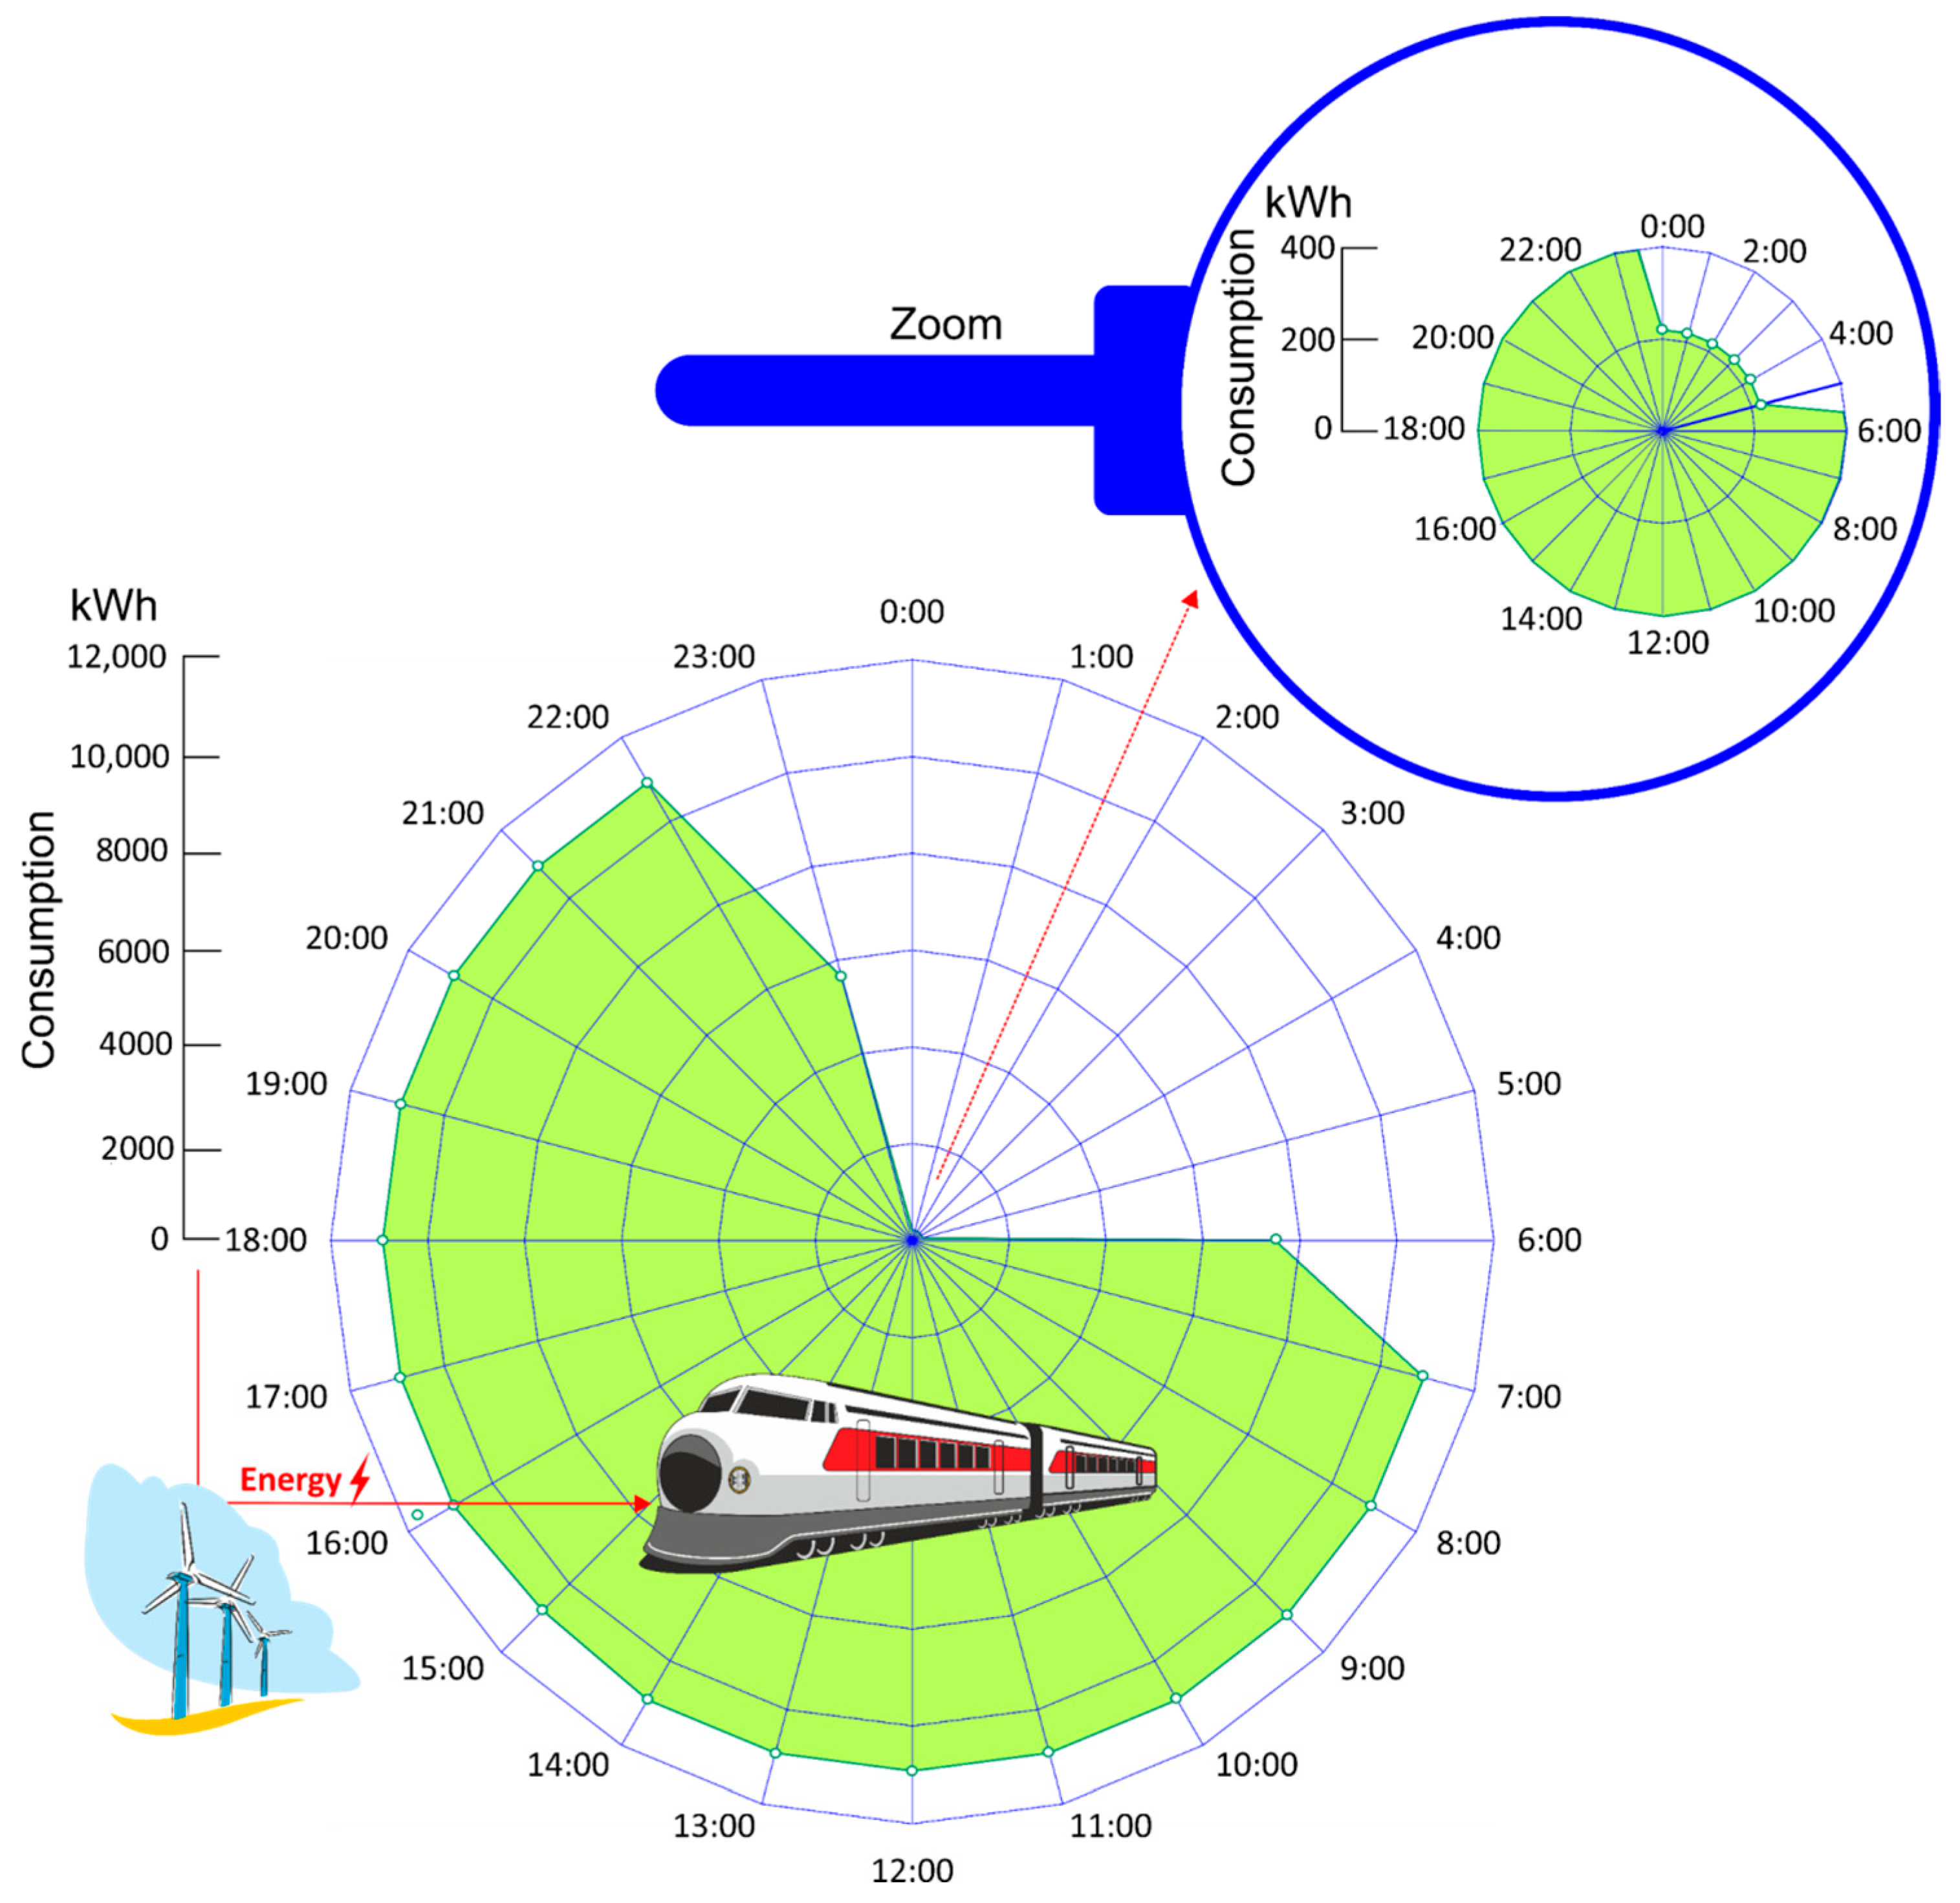
In the planned operating scenario, which considers frequencies of up to 10 min during peak hours, Figure 5 shows the electric energy consumption (kWh) over the 24 h of the day. Higher demand is observed between 7:00 and 23:00, with values exceeding 6000 kWh, and minimum consumption during the early morning (00:00–06:00). The estimated daily electricity consumption is 149.18 MWh/day (Figure 5), which totals 69.73 GWh/year, including traction, air conditioning, lighting, auxiliary facilities, and losses.
The current consumption of the bus system and substitutable private vehicles represents, in energy terms:
  • Buses: 5,251,036 L of diesel, which according to PCI represent 202,706 GJ or 53.6 GWh.
  • Gasoline light vehicles: 22,998,799.41 L, equivalent to 786,558.94 GJ = 218.49 GWh.
  • Diesel light vehicles: 5,449,799.8 L, equivalent to 210,362.27 GJ = 58.43 GWh.
The current system’s total energy consumption amounts to 1,199,627.23 MJ = 333.22 GWh, compared to the 63.73 GWh required by the railway and its facilities.
For the calculation of emissions, standardized emission factors were applied in accordance with the guidelines of the Intergovernmental Panel on Climate Change (IPCC) and Directive 2009/33/EC [48]:
  • Gasoline: 2.3 kg CO2/L
  • Diesel: 2.6 kg CO2/L
Throughout the document, emission figures are expressed in terms of CO2 equivalent (CO2-eq), calculated according to the current global warming potentials (GWP) [49].
In 2023, the subsector with the greatest share of total GHG emissions continued to be transport (32.5%) [50], with the following structure in percentaje:
  • Road transport: 79.6%
  • Passenger cars: 42.5%
  • Trucks and light vehicles: 32.3%
  • Buses: 3.9%
  • and in emissions:
  • Buses: The interurban bus fleet consumed 5,251,036 L of diesel on routes substitutable by the train, resulting in emissions of 13,652.69 t CO2-eq/year.
  • Gasoline light vehicles: 22,998,799.41 L, representing 53,021.21 t CO2-eq/year.
  • Diesel light vehicles: 5,449,799.8 L, representing 14,233.47 t CO2-eq/year.
The total emissions eliminated by the new system amount to 80,907.4 t CO2-eq, ensuring a net-zero emissions balance.
This calculation provided a solid basis for projecting the energy and environmental benefits derived from the partial substitution of the current system by the railway.

Renewable Energy Resource

The railway model analyzed in this study is designed with an exclusively renewable supply, based on a dedicated wind farm that will be connected to the general electricity grid through a specific evacuation and distribution infrastructure, thereby guaranteeing full coverage of the railway system’s needs with renewable energy.
This choice responds to several criteria set out in the PTECan [51]: high availability of wind resources on the island, generation stability, technological maturity of wind turbines, and competitiveness compared to other renewable technologies in the island context.
The wind farm will be located in the Piletas area, municipality of Agüimes (Figure 6). The installation consists of seven wind turbines with a total installed capacity of 26.4 MW. The forecasted annual energy production of the farm, with a capacity factor of 0.35 for the chosen area [52] is 80.94 GWh, which in any case covers the annual energy demand of the railway.
The integration of this renewable source through a dedicated grid connection ensures that the railway system generates neither direct nor indirect emissions associated with electricity consumption, thus meeting the criteria for full decarbonization.

3.4. Traffic Congestion

To assess the points of greatest congestion, traffic count data from the Cabildo of Gran Canaria were used. The most congested point occurs at the junction of the GC-1 and GC-3. Table 5 shows traffic intensity at the four most critical points of the GC-1, broken down into light vehicles (motorcycles, passenger cars, vans, and SUVs) and heavy vehicles (trucks and buses).
From the calculation of light vehicles likely to be replaced by the train, and based on the demand studies conducted by INECO for the AUTGC (Figure 7), it is estimated that 60% of the future users of the train will come from household light vehicles. Considering an average occupancy of 1.4 passengers per vehicle, this represents approximately 42% of the traffic of light vehicles susceptible to being replaced.

4. Results and Discussion

Following the methodological structure described in Section 2, the results are presented in three parts: energy use, greenhouse gas emissions, and congestion reduction.
After assessing the mobility conditions in the study corridor, the routes undertaken, the vehicles operating on them, and the energy and environmental impacts of interurban collective public transport and private transport susceptible to being replaced by guided transport were established. Likewise, the effect on road congestion was determined.
Regarding public transport, Table 6 presents the data comparing the baseline situation with the estimated effects of railway implementation.
The avoidable emissions according to the conversion factor used (2.6 kg CO2/L diesel, IPCC and Directive 2009/33/EC) amount to 13,652.69 t CO2-eq/year. According to the 2023 emissions inventory of the GSU fleet, which reflects an emissions index of 1244.16 t CO2-eq per million km traveled, the avoidable emissions are 13,626 t CO2-eq/year. The small differences between both values are attributed to the different methodological approaches (operating vs. real model).
Regarding private transport, Table 7 presents the comparison between the baseline and the estimated effects of train implementation.
According to the methodology applied, based on the IDAE factor of 5.39 L/100 km, the avoidable emissions for diesel fuel are estimated at 33,889.23 t CO2-eq/year. Using the conversion factor of 2.6 kg CO2/L of diesel, in accordance with the IPCC and Directive 2009/33/EC, the avoidable emissions amount to 33,737.69 t CO2-eq/year.
Similarly, for gasoline vehicles, based on the IDAE factor of 5.94 L/100 km, the avoidable emissions are estimated at 126,241.42 t CO2-eq/year. Using the conversion factor of 2.3 kg CO2/L of gasoline, the avoidable emissions amount to 127,064.19 t CO2-eq/year. The small differences between both values are attributed to the different methodological approaches (operational model vs. real).
Table 8 summarizes the sensitivity analysis for a range of plausible values of modal-shift share (s = 0.40–0.70) and average car occupancy (o = 1.2–1.7). The baseline corresponds to s = 0.60 and o = 1.4, as adopted in the original demand study.
The results confirm that, even under conservative assumptions (s = 0.40 and o = 1.70), the guided rail system reduces congestion by over 23% and avoids more than 50,000 t CO2-eq/year. Under more favorable assumptions (s = 0.70 and o = 1.30), congestion reduction exceeds 50% and avoided emissions approach 100,000 t CO2-eq/year. These findings demonstrate the robustness of the projected benefits across a wide range of plausible conditions.
A non-linear sensitivity check using the BPR formulation (Equations (14)–(16)) confirmed that the estimated congestion reductions remain within the 23–53% range across the tested values of s and o, supporting the validity of the linear approximation used in Table 8.
The sensitivity analysis demonstrates that the magnitude of the projected benefits is not strongly dependent on a single set of behavioral assumptions. While the baseline scenario reflects the best available empirical data, alternative combinations of modal shift and car occupancy still yield substantial reductions in energy use, GHG emissions, and road congestion. This reinforces the applicability of the framework as a robust decision-support tool.
It should be noted that the decongestion benefits estimated in this study represent an upper bound, since the potential rebound effect associated with induced demand has not been explicitly modeled. In the long term, reductions in travel time and congestion could encourage some additional car journeys that are currently deterred by traffic saturation, thereby partially offsetting the gains in road capacity. However, this effect would not alter the magnitude of the reductions in energy consumption and GHG emissions associated with the modal shift from private cars and buses to rail, since those benefits are primarily determined by the substitution of fossil-fuel transport with a renewable-powered rail system. Future extensions of this work could integrate induced-demand models to capture this phenomenon more accurately.
Integrating both transport modes, the guided system powered by renewable energy would result in a total energy saving of 1,199,627.23 MJ = 333.22 GWh and would prevent 80,907.4 t CO2-eq of emissions.
In addition, there would be a decongestion of 42% of household light vehicles and 70% of buses at the most critical traffic count point.

5. Conclusions

This study analyzed the factors conditioning mobility in the southeast of Gran Canaria. It was identified that both the island’s orography and the degree of territorial protection act as restrictions on population settlement and economic development. This corridor, which includes the municipalities of Las Palmas de Gran Canaria, Telde, Ingenio, and Agüimes, concentrates over 80% of the island’s population and economic activity.
This spatial configuration concentrates 81% of the population and 85% of economic activity in the southeastern corridor, along with strategic infrastructures such as the port and the airport.
The results indicate that the implementation of a collective public transport system, with its own infrastructure and guided mode, as proposed by the Cabildo of Gran Canaria, constitutes a viable solution to the current mobility problem and the saturation of the road infrastructure. This new model would contribute to the decongestion of the GC-1, the optimization of energy consumption, and the reduction of CO2 emissions.
The research provides a precise methodology to estimate the energy consumed by the current transport system—both public and private—susceptible to substitution by the new system, as well as the expected degree of decongestion on the island’s main road artery.
In the field of public transport, the detailed analysis of the routes and stops of the affected lines made it possible to identify those that can be efficiently replaced. High-resolution quantitative results have been obtained, which, to date, had not been determined in previous studies.
Regarding private transport, the estimation of the demand transferable to the new system required the integration of multiple sources of information: characteristics of the vehicle fleet, surveys on the use of private cars, and traffic data obtained at specific points along the corridor. This enabled accurate and representative estimates of the potential impact on the main road (GC-1) analyzed.
Additionally, since the proposed transport system allows operation with renewable energy, the substitution of fossil energy and the resulting degree of decarbonization were calculated. The source considered is wind energy; therefore, the study includes an analysis of the estimated production of the wind farm in relation to the energy demand of the guided system, considering its technical characteristics and service frequency.
The sensitivity analysis of the modal shift rate and average car occupancy confirms that the projected benefits are robust. Even under conservative assumptions, the guided rail system achieves substantial reductions in congestion, energy use, and GHG emissions. This strengthens the generalizability of the methodology and supports its applicability to other island or isolated-grid contexts where behavioral and modal-shift parameters may vary. The sensitivity analysis of the modal shift rate and average car occupancy confirms that the projected benefits are robust.
The findings obtained for Gran Canaria are closely linked to the island’s territorial and energy context, but the methodology also offers lessons for other regions with similar challenges. By explicitly linking transport substitution with a dedicated renewable supply, the framework provides guidance for insular territories as well as for isolated or metropolitan contexts seeking to achieve genuine decarbonization rather than apparent local reductions.
Finally, it is proposed that improvements in traffic count systems through smart cameras with automatic visual recognition and computer vision analysis would significantly increase the accuracy of vehicle counts and the occupancy index of private cars. Under the baseline scenario, the proposed guided rail system would reduce road congestion by approximately 42% and avoid about 81,000 t CO2-eq/year, representing a significant contribution to energy efficiency and emission mitigation on the island.
These results provide a robust technical basis for the future development of a comprehensive and intermodal mobility plan in the metropolitan area of southeastern Gran Canaria.
In addition, the framework can support decision-making processes for sustainable mobility and energy planning in insular territories and in other regions with isolated grids. In practical terms, the methodology may be applied to evaluate renewable-powered transport projects, to assess the integration of mobility policies with climate strategies, and to guide infrastructure investments that ensure additionality of renewable supply.
Future research will focus on extending the framework in several directions. First, the incorporation of induced-demand models would allow for a more dynamic assessment of long-term congestion and mobility patterns. Second, the integration of economic and financial analyses would complement the current energy and environmental evaluation, providing policymakers with cost-effectiveness indicators. Third, methodological development could address the coupling of different renewable technologies (solar, offshore wind, storage) with transport systems, thereby enhancing the replicability of the approach in a variety of contexts. These outcomes are consistent with the objectives of the European Green Deal and the United Nations 2030 Agenda, providing evidence-based guidance for transport decarbonization policies.

Author Contributions

Conceptualization, W.B.M., A.L.-M. and J.A.C.; methodology, W.B.M.; software, J.A.C.; validation, A.L.-M. and J.A.C.; formal analysis, A.L.-M.; investigation, W.B.M.; resources, W.B.M.; data curation, W.B.M.; writing—original draft preparation, W.B.M.; writing—review and editing, A.L.-M. and J.A.C.; visualization, J.A.C.; supervision, A.L.-M. and J.A.C.; project administration, A.L.-M.; funding acquisition, A.L.-M. All authors have read and agreed to the published version of the manuscript.

Funding

This research was co-funded with ERDF funds through the INTERREG MAC 2021–2027 programme in the RESMAC project (1/MAC/2/2.2/0011). No funding sources had any influence on study design, collection, analysis, or interpretation of data, manuscript preparation, or the decision to submit for publication.

Institutional Review Board Statement

Not applicable.

Informed Consent Statement

Not applicable.

Data Availability Statement

The data presented in this study are available on request from the corresponding author.

Acknowledgments

The authors gratefully acknowledge the support of the Cabildo de Gran Canaria, the Gran Canaria Single Transport Authority (AUTGC), the Canary Islands Institute of Statistics (ISTAC), and the company Global Salcai Utinsa S.A. (GSU).

Conflicts of Interest

The authors declare no conflicts of interest.

References

  1. Mugion, R.G.; Toni, M.; Raharjo, H.; Di Pietro, L.; Sebathu, S.P. Does the Service Quality of Urban Public Transport Enhance Sustainable Mobility? J. Clean. Prod. 2018, 174, 1566–1587. [Google Scholar] [CrossRef]
  2. Guzman, L.A.; Cardona, S.G. Density-Oriented Public Transport Corridors: Decoding Their Influence on BRT Ridership at Station-Level and Time-Slot in Bogotá. Cities 2021, 110, 103071. [Google Scholar] [CrossRef]
  3. Tayarani, M.; Nadafianshahamabadi, R.; Poorfakhraei, A.; Rowangould, G. Evaluating the Cumulative Impacts of a Long Range Regional Transportation Plan: Particulate Matter Exposure, Greenhouse Gas Emissions, and Transportation System Performance. Transp. Res. Part D Transp. Environ. 2018, 63, 261–275. [Google Scholar] [CrossRef]
  4. Zhang, R.; Matsushima, K.; Kobayashi, K. Can Land Use Planning Help Mitigate Transport-Related Carbon Emissions? A Case of Changzhou. Land Use Policy 2018, 74, 32–40. [Google Scholar] [CrossRef]
  5. European Environment Agency Sustainable and Smart Mobility Strategy: Setting European Transport on Track for the Future. Available online: https://eur-lex.europa.eu/legal-content/EN/TXT/?uri=CELEX%3A52020DC0789 (accessed on 10 June 2025).
  6. Tsigdinos, S.; Nikitas, A.; Bakogiannis, E. Multimodal Corridor Development as a Way of Supporting Sustainable Mobility in Athens. Case Stud. Transp. Policy 2021, 9, 137–148. [Google Scholar] [CrossRef]
  7. Diao, M. Towards Sustainable Urban Transport in Singapore: Policy Instruments and Mobility Trends. Transp. Policy 2019, 81, 320–330. [Google Scholar] [CrossRef]
  8. Houston, D.; Boarnet, M.G.; Ferguson, G.; Spears, S. Can Compact Rail Transit Corridors Transform the Automobile City? Planning for More Sustainable Travel in Los Angeles. Urban Stud. 2015, 52, 938–959. [Google Scholar] [CrossRef]
  9. Du, H.; Chen, Z.; Peng, B.; Southworth, F.; Ma, S.; Wang, Y. What Drives CO2 Emissions from the Transport Sector? A Linkage Analysis. Energy 2019, 175, 195–204. [Google Scholar] [CrossRef]
  10. Wang, Y.; Guan, Z.; Zhang, Q. Railway Opening and Carbon Emissions in Distressed Areas: Evidence from China’s State-Level Poverty-Stricken Counties. Transp. Policy 2023, 130, 55–67. [Google Scholar] [CrossRef]
  11. Kougias, I.; Nikitas, A.; Thiel, C.; Szabó, S. Clean Energy and Transport Pathways for Islands: A Stakeholder Analysis Using Q Method. Transp. Res. Part D Transp. Environ. 2020, 78, 102180. [Google Scholar] [CrossRef]
  12. Cabildo of Gran Canaria. Insular Planning Plan of Gran Canaria. 2023. Available online: https://plan-insular.idegrancanaria.es/ (accessed on 15 September 2025). (In Spanish).
  13. Canary Islands Statistics Institute (ISTAC). Tourist Accommodation Surveys 2023. Available online: https://www.gobiernodecanarias.org/istac/estadisticas/sectorservicios/hosteleriayturismo/oferta/C00065A.html (accessed on 15 September 2025). (In Spanish).
  14. Canary Islands Statistics Institute (ISTAC). Regional Accounts of Spain: Harmonised Island Estimates 2021. Available online: https://www3.gobiernodecanarias.org/istac/statistical-visualizer/visualizer/collection.html?resourceType=collection&agencyId=ISTAC&resourceId=E30014B_000001 (accessed on 15 September 2025). (In Spanish).
  15. Andrés, L.; Padilla, E. Driving Factors of GHG Emissions in the EU Transport Activity. Transp. Policy 2018, 61, 60–74. [Google Scholar] [CrossRef]
  16. Martín-Cejas, R.R.; Sánchez, P.P.R. Ecological Footprint Analysis of Road Transport Related to Tourism Activity: The Case for Lanzarote Island. Tour. Manag. 2010, 31, 98–103. [Google Scholar] [CrossRef]
  17. Blasco Hedo, E. Real Decreto 986/2024, de 24 de Septiembre, Por El Que Se Aprueba La Actualización Del Plan Nacional Integrado de Energía y Clima 2023–2030. Actual. Jurídica Ambient. 2024, 149, 225. Available online: https://research.ebsco.com/linkprocessor/plink?id=c9032cf6-92a1-3dc8-b52d-659e9c52bc1e (accessed on 1 October 2025).
  18. Ullah, S.; Boulanouar, Z.; Meo, M.S.; Ali, K. Navigating Sustainable Mobility: Wavelet Insights into Carbon Emissions in Germany’s Transportation Sector. Transp. Policy 2025, 170, 120–136. [Google Scholar] [CrossRef]
  19. Bąk, M.; Borkowski, P.; Suchanek, M. Effect of Beliefs and Attitudes on Public Transport Users’ Choices. The Moderating Role of Perceived Intermodal Connectivity. Transp. Policy 2024, 159, 120–129. [Google Scholar] [CrossRef]
  20. Cabildo of Gran Canaria. Island Strategy for Adaptation to Climate Change and Promotion of the Low-Carbon Economy. 2025. Available online: https://www.energiagrancanaria.com/descargas/estrategia-de-adaptacion-al-cc-gran-canaria-20212709.pdf (accessed on 15 September 2025). (In Spanish).
  21. Cabildo Insular of Gran Canaria. Railway Infrastructure Project between Las Palmas de Gran Canaria and Maspalomas and Associated Elements. 2025. Available online: https://descargas.grancanaria.com/transportes/ferrocarril_grancanaria/DOCUMENTO%20TECNICO/MEMORIA%20DOCUMENTO%20TECNICO.pdf (accessed on 15 September 2025). (In Spanish).
  22. Cabildo of Gran Canaria. Database of Capacity, Roads and Public Works. 2023. Available online: https://cabildo.grancanaria.com/area-tematica/carreteras-y-obras-publicas (accessed on 15 September 2025). (In Spanish).
  23. Maduekwe, M.; Akpan, U.; Isihak, S. Road Transport Energy Consumption and Vehicular Emissions in Lagos, Nigeria: An Application of the LEAP Model. Transp. Res. Interdiscip. Perspect. 2020, 6, 100172. [Google Scholar] [CrossRef]
  24. Georgatzi, V.V.; Stamboulis, Y.; Vetsikas, A. Examining the Determinants of CO2 Emissions Caused by the Transport Sector: Empirical Evidence from 12 European Countries. Econ. Anal. Policy 2020, 65, 11–20. [Google Scholar] [CrossRef]
  25. Buehler, R.; Pucher, J.; Gerike, R.; Götschi, T. Reducing Car Dependence in the Heart of Europe: Lessons from Germany, Austria, and Switzerland. Transp. Rev. 2017, 37, 4–28. [Google Scholar] [CrossRef]
  26. European Parliament and Council of the European Union. Regulation (EU) 2018/841 of the European Parliament and of the Council of 30 May 2018 on the Inclusion of Greenhouse Gas Emissions and Removals from Land Use, Land-Use Change and Forestry in the Climate and Energy Policy Framework to 2030, and Amending Regulation (EU) n.o 525/2013 and Decision n.o 529/2013/EU (OJ L 156, 19.6.2018, pp. 1–25), n.or 2018/841. Available online: https://eur-lex.europa.eu/legal-content/ES/TXT/?uri=CELEX:32018R0841 (accessed on 15 September 2025).
  27. Kierzkowski, A.; Tubis, A.A. Transportation Systems Modeling, Simulation and Analysis with Reference to Energy Supplying. Energies 2023, 16, 3586. [Google Scholar] [CrossRef]
  28. Dingil, A.E.; Schweizer, J.; Rupi, F.; Stasiskiene, Z. Updated Models of Passenger Transport Related Energy Consumption of Urban Areas. Sustainability 2019, 11, 4060. [Google Scholar] [CrossRef]
  29. Cortés, C.E.; Vargas, L.S.; Corvalán, R.M. A Simulation Platform for Computing Energy Consumption and Emissions in Transportation Networks. Transp. Res. Part D Transp. Environ. 2008, 13, 413–427. [Google Scholar] [CrossRef]
  30. Abdelaty, H.; Mohamed, M. A Framework for BEB Energy Prediction Using Low-Resolution Open-Source Data-Driven Model. Transp. Res. Part D Transp. Environ. 2022, 103, 103170. [Google Scholar] [CrossRef]
  31. Marique, A.-F.; Reiter, S. A Method for Evaluating Transport Energy Consumption in Suburban Areas. Environ. Impact Assess. Rev. 2012, 33, 1–6. [Google Scholar] [CrossRef]
  32. Franco, S.; Ravibabu Mandla, V. Analysis of Road Transport Energy Consumption and Emissions: A Case Study. Int. J. Energy Sect. Manag. 2014, 8, 341–355. [Google Scholar] [CrossRef]
  33. Yin, X.; Chen, W.; Eom, J.; Clarke, L.E.; Kim, S.H.; Patel, P.L.; Yu, S.; Kyle, G.P. China’s Transportation Energy Consumption and CO2 Emissions from a Global Perspective. Energy Policy 2015, 82, 233–248. [Google Scholar] [CrossRef]
  34. Mishalani, R.G.; Goel, P.K.; Landgraf, A.J.; Westra, A.M.; Zhou, D. Passenger Travel CO2 Emissions in US Urbanized Areas: Multi-Sourced Data, Impacts of Influencing Factors, and Policy Implications. Transp. Policy 2014, 36, 231–241. [Google Scholar] [CrossRef]
  35. Ortego, A.; Valero, A.; Abadías, A. Environmental Impacts of Promoting New Public Transport Systems in Urban Mobility: A Case Study. J. Sustain. Dev. Energy Water Environ. Syst. 2017, 5, 377–395. [Google Scholar] [CrossRef]
  36. Guo, Y.; Bigazzi, A.Y.; Chen, X. Potential Greenhouse Gas Emission Reduction from Active Transportation: Comparing Travel Behavior Patterns. Transp. Res. Part D Transp. Environ. 2025, 145, 104835. [Google Scholar] [CrossRef]
  37. Wakenshaw, G.; Bunn, N. How Far Do People Walk? PTRC Transport Practitioners. 2015. Available online: https://rapleys.com/wp-content/uploads/2020/10/CD3.38-WYG_how-far-do-people-walk.pdf (accessed on 15 September 2025).
  38. Burke, M.; Brown, A.L. Distances People Walk for Transport. Road Transp. Res. 2007, 16, 16–29. Available online: https://search.informit.org/doi/abs/10.3316/informit.880016006301032 (accessed on 15 September 2025).
  39. Sarker, R.I.; Mailer, M.; Sikder, S.K. Walking to a Public Transport Station: Empirical Evidence on Willingness and Acceptance in Munich, Germany. Smart Sustain. Built Environ. 2020, 9, 38–53. [Google Scholar] [CrossRef]
  40. Tennøy, A.; Knapskog, M.; Wolday, F. Walking Distances to Public Transport in Smaller and Larger Norwegian Cities. Transp. Res. Part D Transp. Environ. 2022, 103, 103169. [Google Scholar] [CrossRef]
  41. Bureau of Public Roads. Traffic Assignment Manual; U.S. Department of Commerce, Urban Planning Division: Washington, DC, USA, 1964; Available online: https://www.google.es/books/edition/Traffic_Assignment_Manual_for_Applicatio/CXMnAQAAMAAJ (accessed on 15 September 2025).
  42. Patriksson, M. The Traffic Assignment Problem: Models and Methods; Courier Dover Publications: Mineola, NY, USA, 2015; ISBN 978-0-486-78790-9. [Google Scholar]
  43. Kniz, A.; Kocianova, A. Analysis in the Field of Volume-Delay Function Research. Transp. Res. Procedia 2023, 74, 1022–1029. [Google Scholar] [CrossRef]
  44. Gadepalli, R.; Bansal, P.; Tiwari, G.; Bolia, N. A Tactical Planning Framework to Integrate Paratransit with Formal Public Transport Systems. Transp. Res. Part D Transp. Environ. 2024, 136, 104438. [Google Scholar] [CrossRef]
  45. Horowitz, A.J. Delay-Volume Relations for Travel Forecasting: Based on the 1985 Highway Capacity Manual; US Department of Transportation, Federal Highway Administration USA: Washington, DC, USA, 1991; Available online: https://ajhassoc.com/wp-content/uploads/2020/11/SpeedVolume1985HCMReport.pdf (accessed on 15 September 2025).
  46. Real Decreto-Ley 8/2023, of 27 December Adopting Measures to Address the Economic and Social Consequences Arising from the Conflicts in Ukraine and the Middle East, as Well as to Alleviate the Effects of the Drought. 2023. Available online: https://www.boe.es/diario_boe/txt.php?id=BOE-A-2023-26452 (accessed on 15 September 2025). (In Spanish).
  47. Institute for Energy Diversification and Saving, IDAE. CO2 Emission Factors and Energy Consumption of the Transport Sector in Spain; Institute for Energy Diversification and Saving, IDAE: Madrid, Spain; Available online: https://coches.idae.es/historico-emisiones-consumos (accessed on 15 September 2025). (In Spanish)
  48. IPCC Intergovernmental Panel on Climate Change 2025. Available online: https://archive.ipcc.ch/home_languages_main_spanish.shtml (accessed on 15 September 2025). (In Spanish).
  49. El-Geneidy, A.; Grimsrud, M.; Wasfi, R.; Tétreault, P.; Surprenant-Legault, J. New Evidence on Walking Distances to Transit Stops: Identifying Redundancies and Gaps Using Variable Service Areas. Transportation 2014, 41, 193–210. [Google Scholar] [CrossRef]
  50. IDAE. Summary Report on Energy Efficiency Indicators in Spain. 2022. Available online: https://www.idae.es/sites/default/files/estudios_informes_y_estadisticas/Ficha_sintesis_EE_2022_041024_OK_accesib.pdf (accessed on 15 September 2025). (In Spanish).
  51. Government of the Canary Islands. Canary Islands Energy Transition Plan(PTECan-2030). 2023. Available online: https://www.gobiernodecanarias.org/energia/info-publica/PTECan_VersionInicial (accessed on 15 September 2025). (In Spanish).
  52. Government of the Canary Islands. Canary Islands Energy Transition Plan(PTECan-2030). Annex. Plans. 2023. Available online: https://www.gobiernodecanarias.org/energia/descargas/SDE/Portal/PTECan2030_VI/3-AnexosPlanosDINA1_PTECan_diligenciado.pdf (accessed on 15 September 2025). (In Spanish).
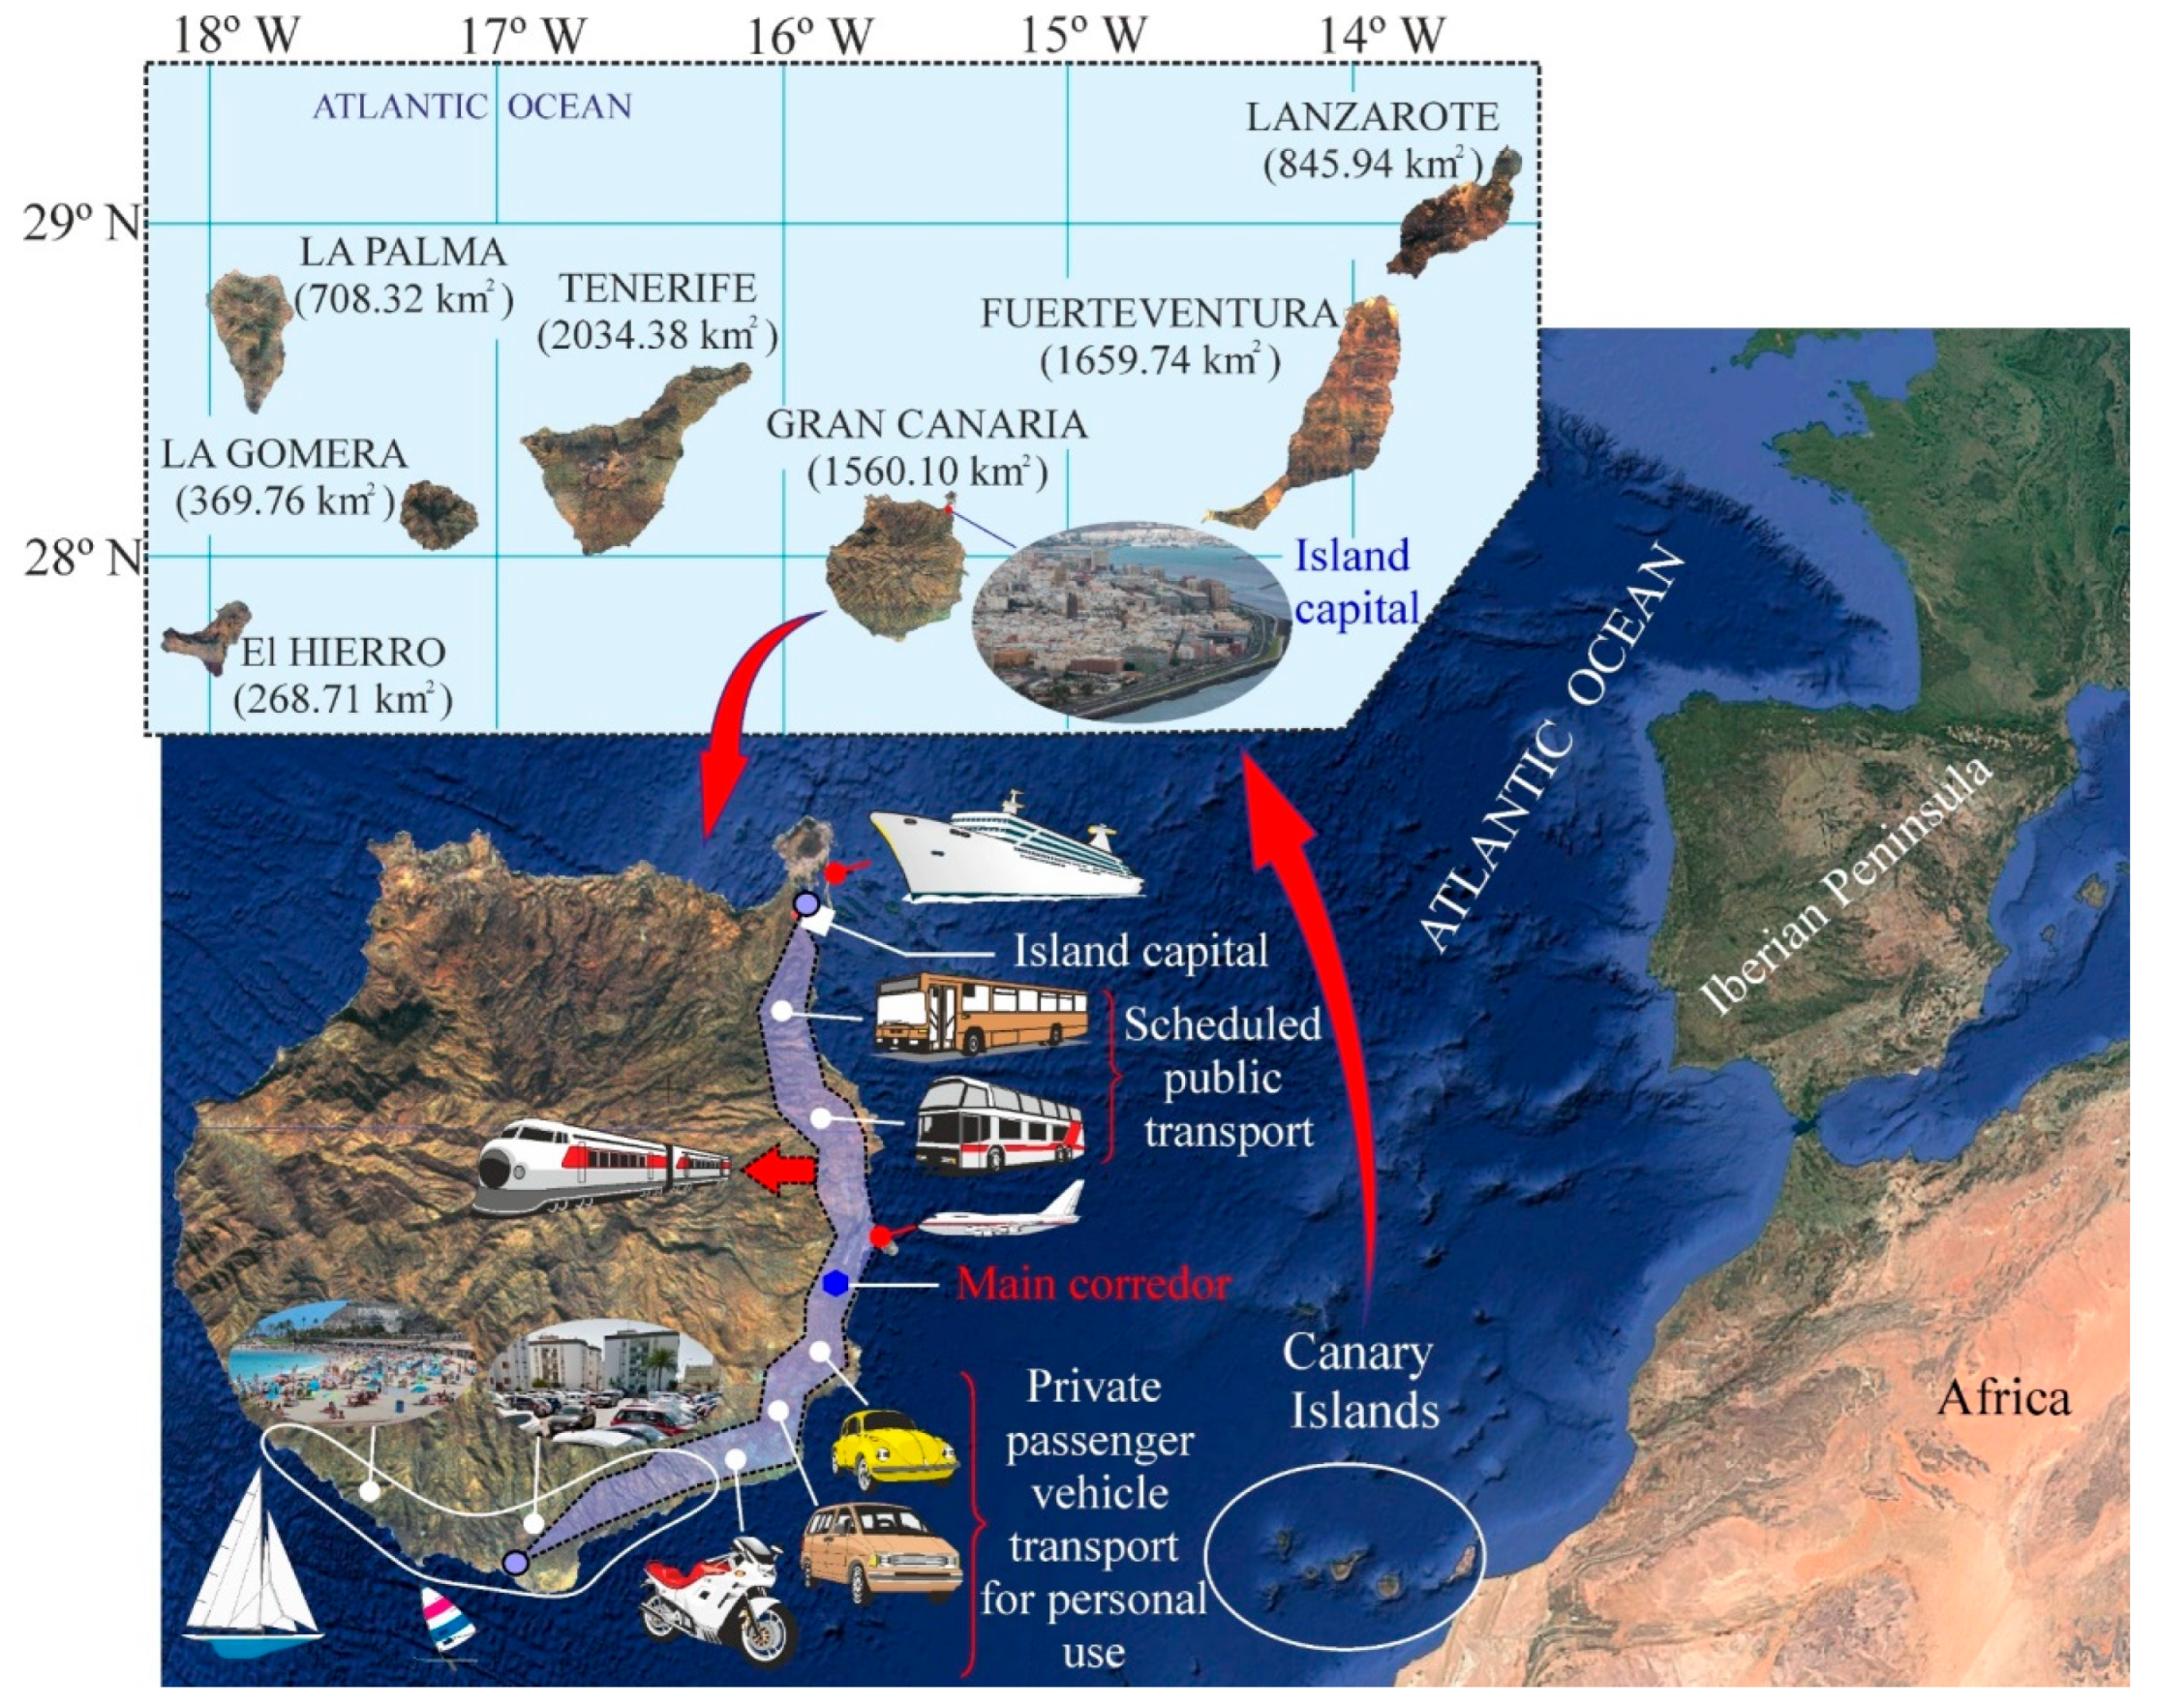
Figure 1. Geographical location of the Canary Islands in the Atlantic context. Source: Authors.
Sustainability 17 09518 g001
Figure 2. Flowchart of the proposed methodology for estimating the energy and environmental impacts of implementing a rail transport system in high-demand island corridors. Source: Authors.
Sustainability 17 09518 g002
Figure 3. Block diagram of the analysis of regular public transport. Source: Authors.
Sustainability 17 09518 g003
Figure 4. Block diagram of the analysis of private transport. Source: Authors.
Sustainability 17 09518 g004
Figure 5. Hourly distribution of daily energy consumption (kWh). Source: Authors.
Sustainability 17 09518 g005
Figure 6. Location of the self-consumption wind farm associated with the railway line. Source: https://grafcan.es/7laYsVT accessed on 15 September and Authors’ elaboration.
Sustainability 17 09518 g006
Figure 7. Vehicles susceptible to being replaced by the train (Source: Authors’ elaboration based on demand studies carried out for AUTGC).
Sustainability 17 09518 g007
Table 1. Example of data in the line shipment file. Source: Authors’ own elaboration. Data extracted by the authors from the expedition records of the company Global Salcai Utinsa S.A. and the AUTGC.
Line055/014
Start year2023
DirectionIDA
Number of expeditions767
Kilometers10,254.79
Consumption4945.72
Average consumption0.48
Km of route13.37
Non-substitutable travel2.87
Replaceable travel10.50
% Non-substitutable21.47%
% replaceable78.53%
Replaceable consumption3884.07
Replaceable kilometers8053.50
Table 2. Cars and mopeds according to vehicle types and engine power. Gran Canaria, 2023. Source: Vehicle Fleet Statistics. Prepared by the author based on vehicle fleet statistics. Canary Islands Institute of Statistics (ISTAC) carried out with data from the Spanish Directorate-General for Traffic (DGT).
TotalPetrol (Except Hybrids)Diesel (Except Hybrids)Alternative Energy (*)Electricity
TOTAL711,572464,787216,90329,8825624
Moped22,87221,1311445296296
Car688,700443,656215,45829,5865328
Motorcycle68,73267,97676680654
Tourism479,090358,40693,46027,2244309
Bus2788202744245
Van31,045522225,420403227
All-terrain19,298406814,3728580
Truck31,323127729,9786820
Adaptable mixed vehicle48,847649242,031324113
Tractor22110221100
Motorhome5366195516650
(*) Includes all engine energy types other than petrol (except hybrids) or diesel (except hybrids), i.e., also includes electric.
Table 3. Traffic recorded in both directions on the GC-1 road network of Gran Canaria (year 2023). ADT = Average Daily Traffic. Source: Cabildo de Gran Canaria. Note: Station code refers to the original numbering system; New code corresponds to the updated classification used by the Cabildo de Gran Canaria [22].
Station CodeNew CodePK (km)Station LocationADT (Vehicles/Day)
001-02,3-C2.25La Laja87,106
001-03,5-C3.475Potabilization Machine77,128
574001-06,8-C6.804El Cortijo162,993
93001-18,3-C18.29Las Puntillas111,967
94001-20,0-C19.95Carrizal99,498
532001-37,4-C37.35Tarajalillo78,080
533001-37,8-C37.865Bahía Feliz74,059
534001-43,1-C43.095Playa del Inglés61,079
535001-46,6-C46.635Tablero Maspalomas46,005
Table 4. Passenger cars in Gran Canaria, year 2023, by engine power, main brands and cylinder capacity. Source: Authors’ elaboration based on the annual reports of the Institute for Energy Diversification and Saving (IDAE).
TotalLess than 1000From 1000 to 1199From 1200 to 1399From 1400 to 1599From 1600 to 19992000 or More
Petrol (except hybrids)358,40671,64966,519111,23062,62131,82014,567
VOLKSWAGEN45,14915,432712212,33868013327129
TOYOTA35,305316787719,64777373634243
SEAT32,34111,669417410,277555066110
OPEL31,8751437786216,06446841635193
RENAULT31,533674112,27571123547181147
(…)
Diesel (except hybrids)93,460109304567435,38034,04717,946
RENAULT11,8770149891822419119
MERCEDES-BENZ903794359415966831
VOLKSWAGEN6661156715094577511
NISSAN630603344797661055
PEUGEOT60859696036291153328
(…)
Table 5. Average vehicle intensity at critical points of the GC-1. ADT = Average Daily Traffic. Source: Cabildo de Gran Canaria.
Capacity in the GC-1Average Daily Vehicle Intensity (ADT)
La LajaEl CortijoLas PuntillasPlaya del Inglés
Distribution of capacity according to the distribution of the vehicle fleet
MOTOR VEHICLES 87,106162,993111,96761,079
LIGHTa78,369148,712100,73654,952
Motorcyclesc900517,08811,5756314
Carsc62,768119,10880,68344,013
Vansc4067771852282852
All-terrain vehiclesc2528479832501773
HEAVYb873714,28111,2316127
Distribution of the estimated capacity of replaceable vehicles (light homes and public transport buses)
MOTOR VEHICLES 58,694110,62074,93841,057
LIGHTd57,939109,94574,47640,627
Motorcyclesf665712,63385584668
Carsf46,40588,05959,65032,539
Vansf3007570638652109
Vansf1869354724031311
HEAVY (BUSES)e755675462430
Legend: Non-replaceable vehicles because they are not light for household or bus use. The upper section shows the average daily traffic intensity on the GC-1 by vehicle type for the years 2013–2015: (a) light vehicles, (b) heavy vehicles, and (c) breakdown of light vehicles by fleet composition. The lower section shows the estimated capacity of replaceable vehicles: (d) household light vehicles, (e) public transport buses estimated from Global expedition data on the lines, affected by the train, and (f) distribution of household light vehicles according to the fleet structure.
Table 6. Effects of the implementation of the train on public transport. Source: authors’ own elaboration based on the study data.
Year 2023
Initial results:
Expeditions carried out336,435
Distance traveled (km)14,365,182
Total diesel consumption (liters)6,915,044
Average consumption (l/km)0.48
Passengers carried20,073,462
Final results:
Replaceable distance (km)10,952,693
Replaceable diesel consumption (liters)5,251,036
Substitutable Power (GJ)202,706
Substitutable Energy (GWh)56.3
Avoidable emissions (t CO2-eq/year)13,652.69
Table 7. Effects of the implementation of the train on private transport. Source: Authors’ own elaboration based on the study data.
Year 2023
PetrolDieselTotal
Current scenario:
Distance traveled (km)2,527,619.45659,116.52
Average consumption [IDAE] (l/100 km)5.945.39
Average emissions [IDAE] (g/km CO2-eq)136.84140.87
Fuel consumed [IDAE] (liters)54,759,046.2112,976,035.18
Emissions [IDAE] (t/year CO2-eq)126,241.4233,889.23160,130.65
Emissions [emission factor] (t/year CO2-eq)127,064.1933,737.69160,801.88
Energy consumed (GJ)1,872,759.39500,875.002,373,634.39
Energy consumed (GWh)520.21139.03659.24
Scenario with rail transport:
Replaceable consumption (liters)22,998,799.415,449,799.80
Substitutable Power (GJ)786,558.94210,362.27996,921.21
Substitutable Energy (GWh)218.4958.43276.92
Emission reduction (t CO2-eq/year)53,021.2114,233.4767,254.68
Table 8. Sensitivity of congestion reduction, avoided emissions, and avoided energy consumption to modal-shift share (s) and average car occupancy (o). Source: Authors’ own elaboration based on the study data.
ScenariosoFCongestion
Reduction (%)
Avoided Emissions
(t CO2-eq/year)
Avoided Energy (GWh/year)
Conservative low0.401.600.58324.552,885217.84
Moderate low0.501.500.77832.765,962271.68
Baseline (central)0.601.401.00042.080,907333.22
High0.701.301.25652.898,152404.23
Worst-case (high occ.)0.401.700.54923.150,577208.33
Low occupancy0.601.201.16749.092,116379.37
Disclaimer/Publisher’s Note: The statements, opinions and data contained in all publications are solely those of the individual author(s) and contributor(s) and not of MDPI and/or the editor(s). MDPI and/or the editor(s) disclaim responsibility for any injury to people or property resulting from any ideas, methods, instructions or products referred to in the content.