Abstract
To overcome the limited accuracy of existing street vitality assessments under dense occlusion and their lack of dynamic, multi-source data fusion, this study proposes an integrated dynamic model that couples an enhanced YOLOv11 with heterogeneous spatiotemporal datasets. The network introduces a two-backbone architecture for stronger multi-scale fusion, Spatial Pyramid Depth Convolution (SPDConv) for richer urban scene features, and Dynamic Sparse Sampling (DySample) for robust occlusion handling. Validated in Yibin, the model achieves 90.4% precision, 67.3% recall, and 77.2% mAP@50 gains of 6.5%, 5.3%, and 5.1% over the baseline. By fusing Baidu heatmaps, street-view imagery, road networks, and POI data, a spatial coupling framework quantifies the interplay between commercial facilities and street vitality, enabling dynamic assessment of urban dynamics based on multi-source data fusion, offering insights for targeted retail regulation and adaptive traffic management. By enabling continuous monitoring of urban space use, the model enhances the allocation of public resources and cuts energy waste from idle traffic, thereby advancing urban sustainability via improved commercial planning and responsive traffic control. The work provides a methodological foundation for shifting urban resource allocation from static planning to dynamic, responsive systems.
1. Introduction
Since the 20th National Congress of the Communist Party of China, the paradigm of urban development has increasingly emphasized new urbanization as a central tenet of social progress. Within this context, streets, as essential components of urban public space, integrate multifaceted attributes—including transportation, commerce, leisure, and social interaction—serving as critical interfaces and primary windows through which urban vitality is manifested and perceived [1,2,3]. The strategic focus of China’s urbanization has notably shifted from outward expansion to inward quality enhancement [4], with the emerging people-centric model prioritizing the improvement of urban livability and residents’ quality of life [5,6].
The rapid advancement of digital technology has positioned street view imagery as a significant medium for urban digitization, demonstrating growing value in fields such as tourism and urban studies [7,8,9]. Leveraging deep learning and computer vision techniques, these images enable intelligent analysis and management of urban infrastructure, street environments, and tourism resources. More importantly, they provide a powerful means to quantitatively evaluate urban vitality, which serves as a key indicator of a city’s functionality and appeal, directly influencing residents’ lived experience and regional tourism competitiveness [10,11,12,13,14,15]. Street vitality, in particular, represents a core dimension of urban spatial quality [16,17].
However, conventional assessment methods for street vitality, often reliant on manual surveys or single-source sensor data, suffer from inherent limitations. These include poor timeliness, high cost, limited spatial coverage, and inadequate adaptability to complex, dynamic urban scenarios [18,19,20]. While recent studies have begun to leverage multi-source big data, significant challenges persist. Current research struggles with the robust integration of heterogeneous spatiotemporal data (e.g., heatmaps, POIs, street-view images) and lacks models capable of maintaining high accuracy under challenging conditions such as dense occlusion and complex backgrounds frequently encountered in real-world street environments [21,22,23,24,25,26,27]. This gap hinders the development of precise, dynamic, and fine-grained understanding of street vitality dynamics.
To address these limitations, this study makes several key contributions by proposing an integrated dynamic assessment model:
- An Enhanced Detection Model: We introduce an improved YOLOv11-based pedestrian detection model. Its architectural innovations include a novel dual-backbone network for enhanced multi-scale feature fusion, the integration of a SPDConv module to enrich feature representation in complex scenes, and a DySample mechanism within the detection head to improve robustness against severe occlusions.
- A Multi-Source Data Fusion Framework: We develop a novel spatiotemporal coupling framework that dynamically integrates the detection results from street view imagery with multi-source geographic data, including Baidu heatmaps, road networks, and POI (Point of Interest) information. This enables a quantitative and dynamic assessment of the interplay between built environment factors and street vitality.
- Empirical Validation and Insights: The proposed model and framework are rigorously validated through a case study in Yibin City, China. The model achieves state-of-the-art performance, and the analysis provides actionable insights into the spatial distribution of street vitality and its drivers, offering a scientific basis for targeted urban management and planning strategies.
2. Study Area and Data Sources
2.1. Study Area
Yibin City, a prefecture-level administrative division in Sichuan Province, occupies a strategic position at the confluence of the Yunnan, Guizhou, and Sichuan Provinces, where the Jinsha, Minjiang, and Yangtze rivers converge. The terrain gradually descends from southwest to northeast within a subtropical humid monsoon climate zone, covering 13,283 square kilometers. This study focuses on the central urban street networks of the Cuiping and Xuzhou Districts—key areas in Southern Sichuan’s urban transformation—to analyze how street spatial–functional configurations couple with population and economic activity densities. By examining variations in street vitality and developmental efficiency, this research provides empirical insights for coordinating old city revitalization and new district development in medium-sized cities across southwestern China.
2.2. Data Sources
2.2.1. Road Network Data
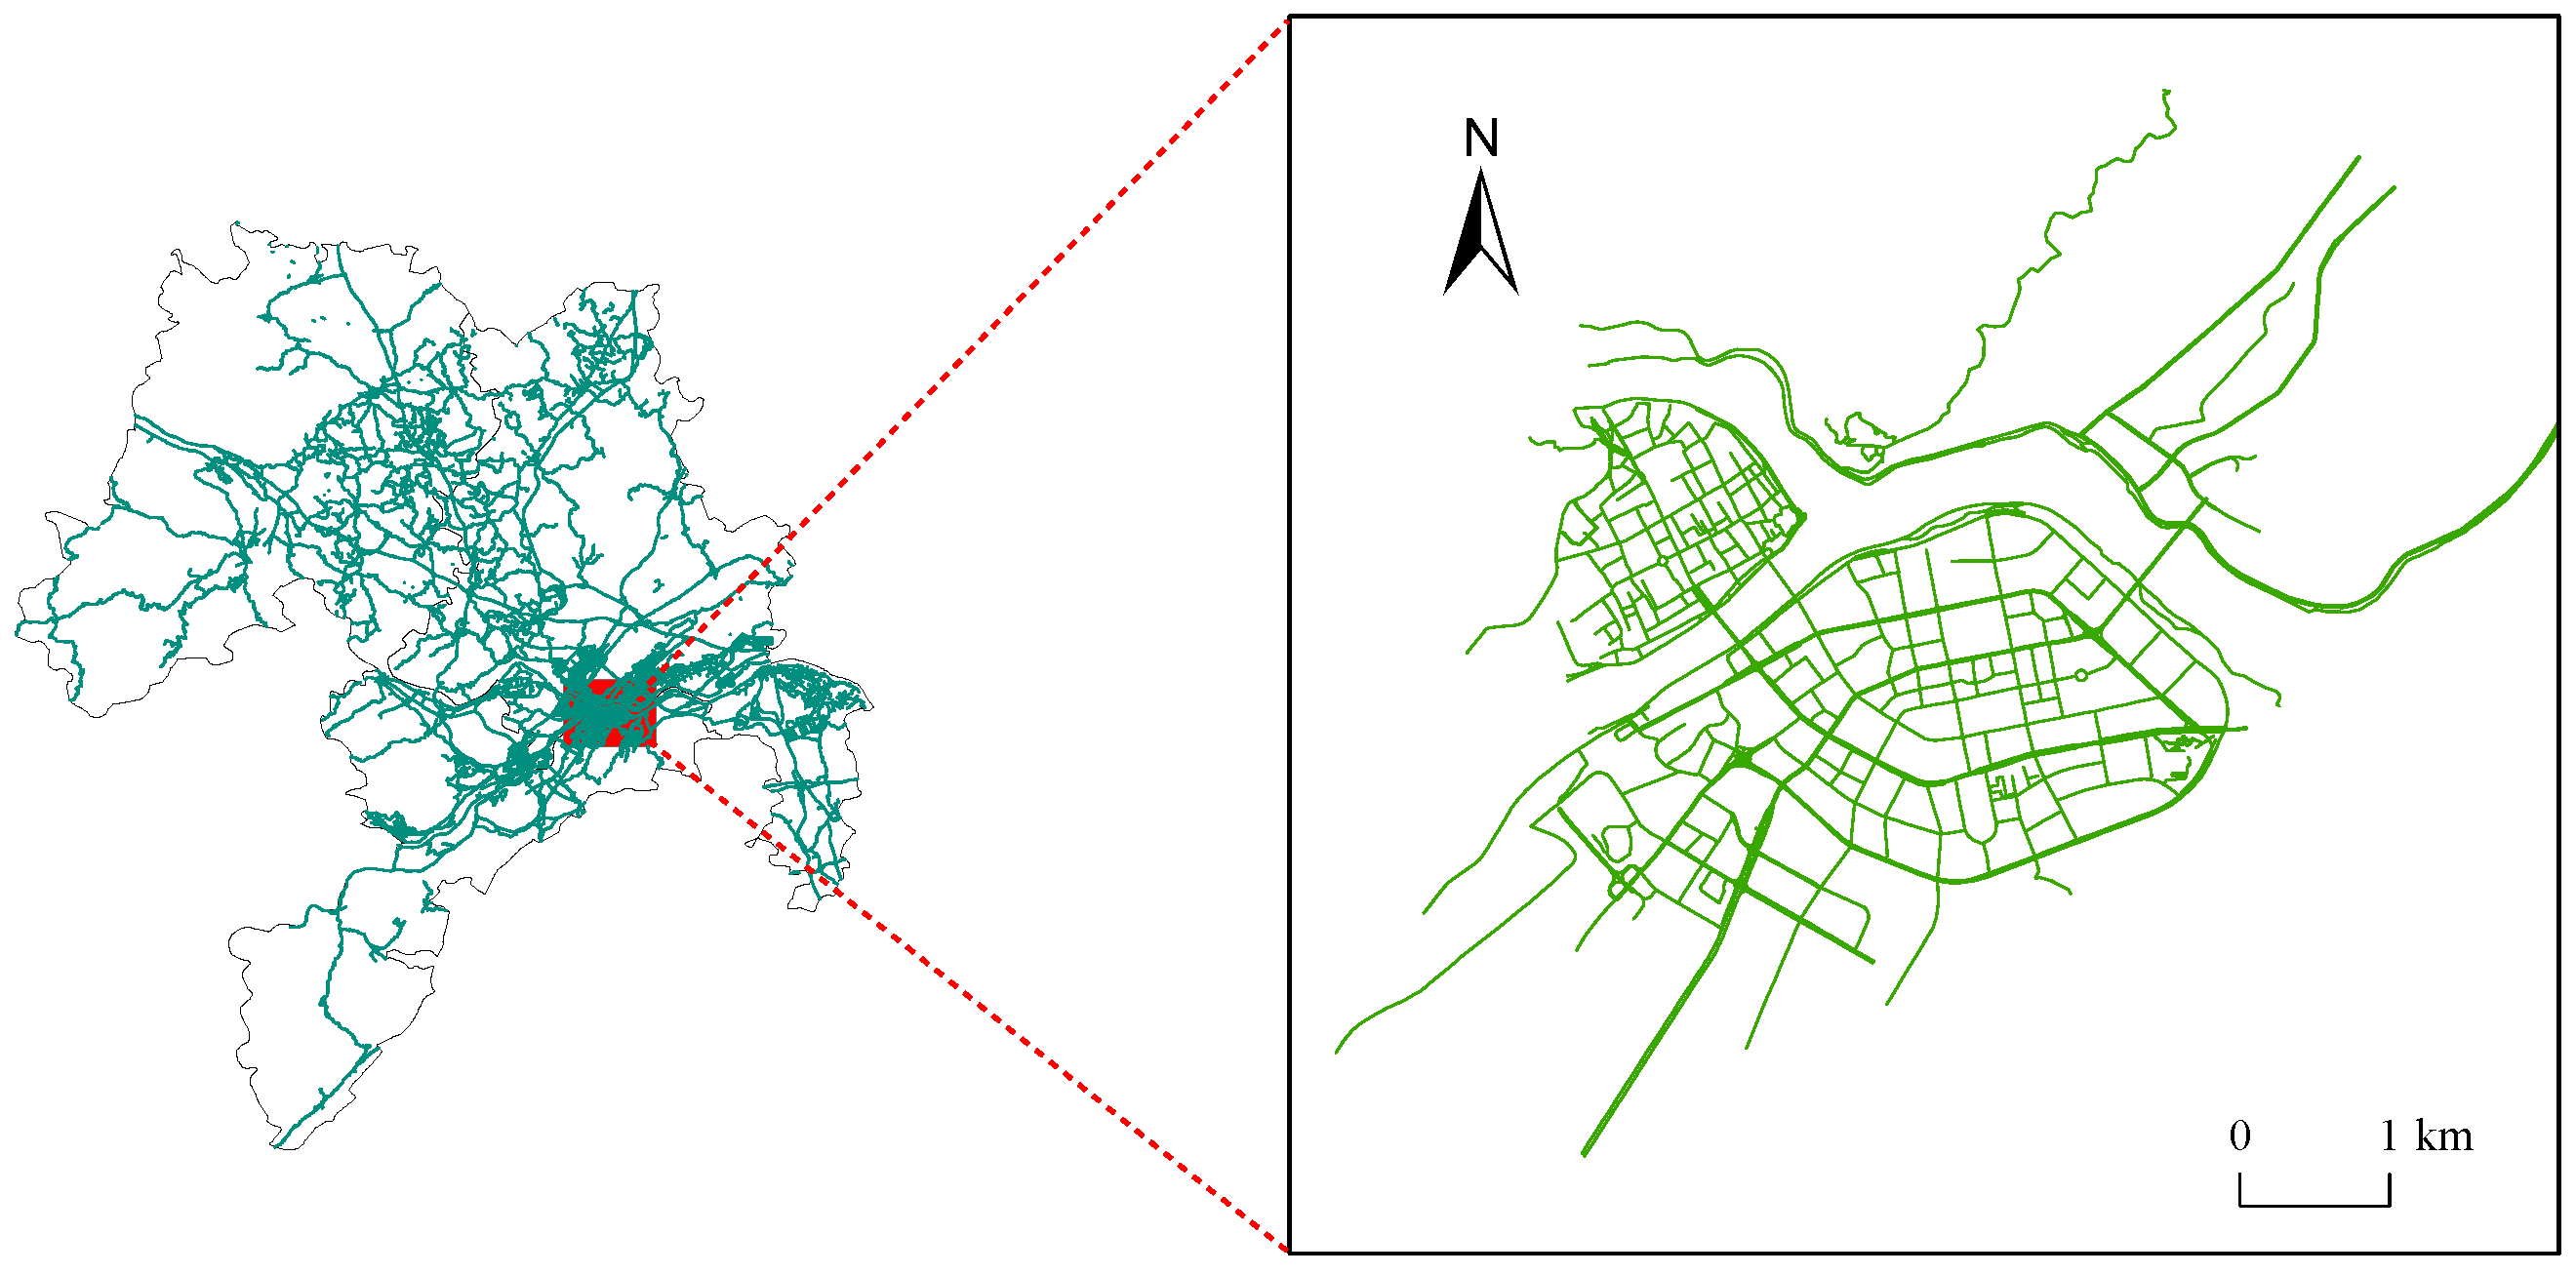
This study employs open-source road network data from OpenStreetMap (OSM), which provides publicly accessible information on diverse road types. For the defined study area of Yibin City, the raw OSM data underwent topological refinement, including the removal of invalid elements such as discontinuous segments and isolated short branches. As illustrated in Figure 1, the resulting coherent road network system offers a reliable foundation for subsequent spatial analysis.
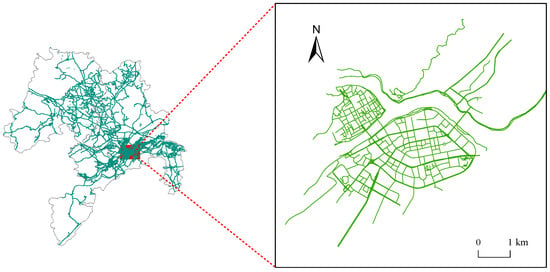
Figure 1.
Road network in the study area.
2.2.2. Baidu Heatmap Data
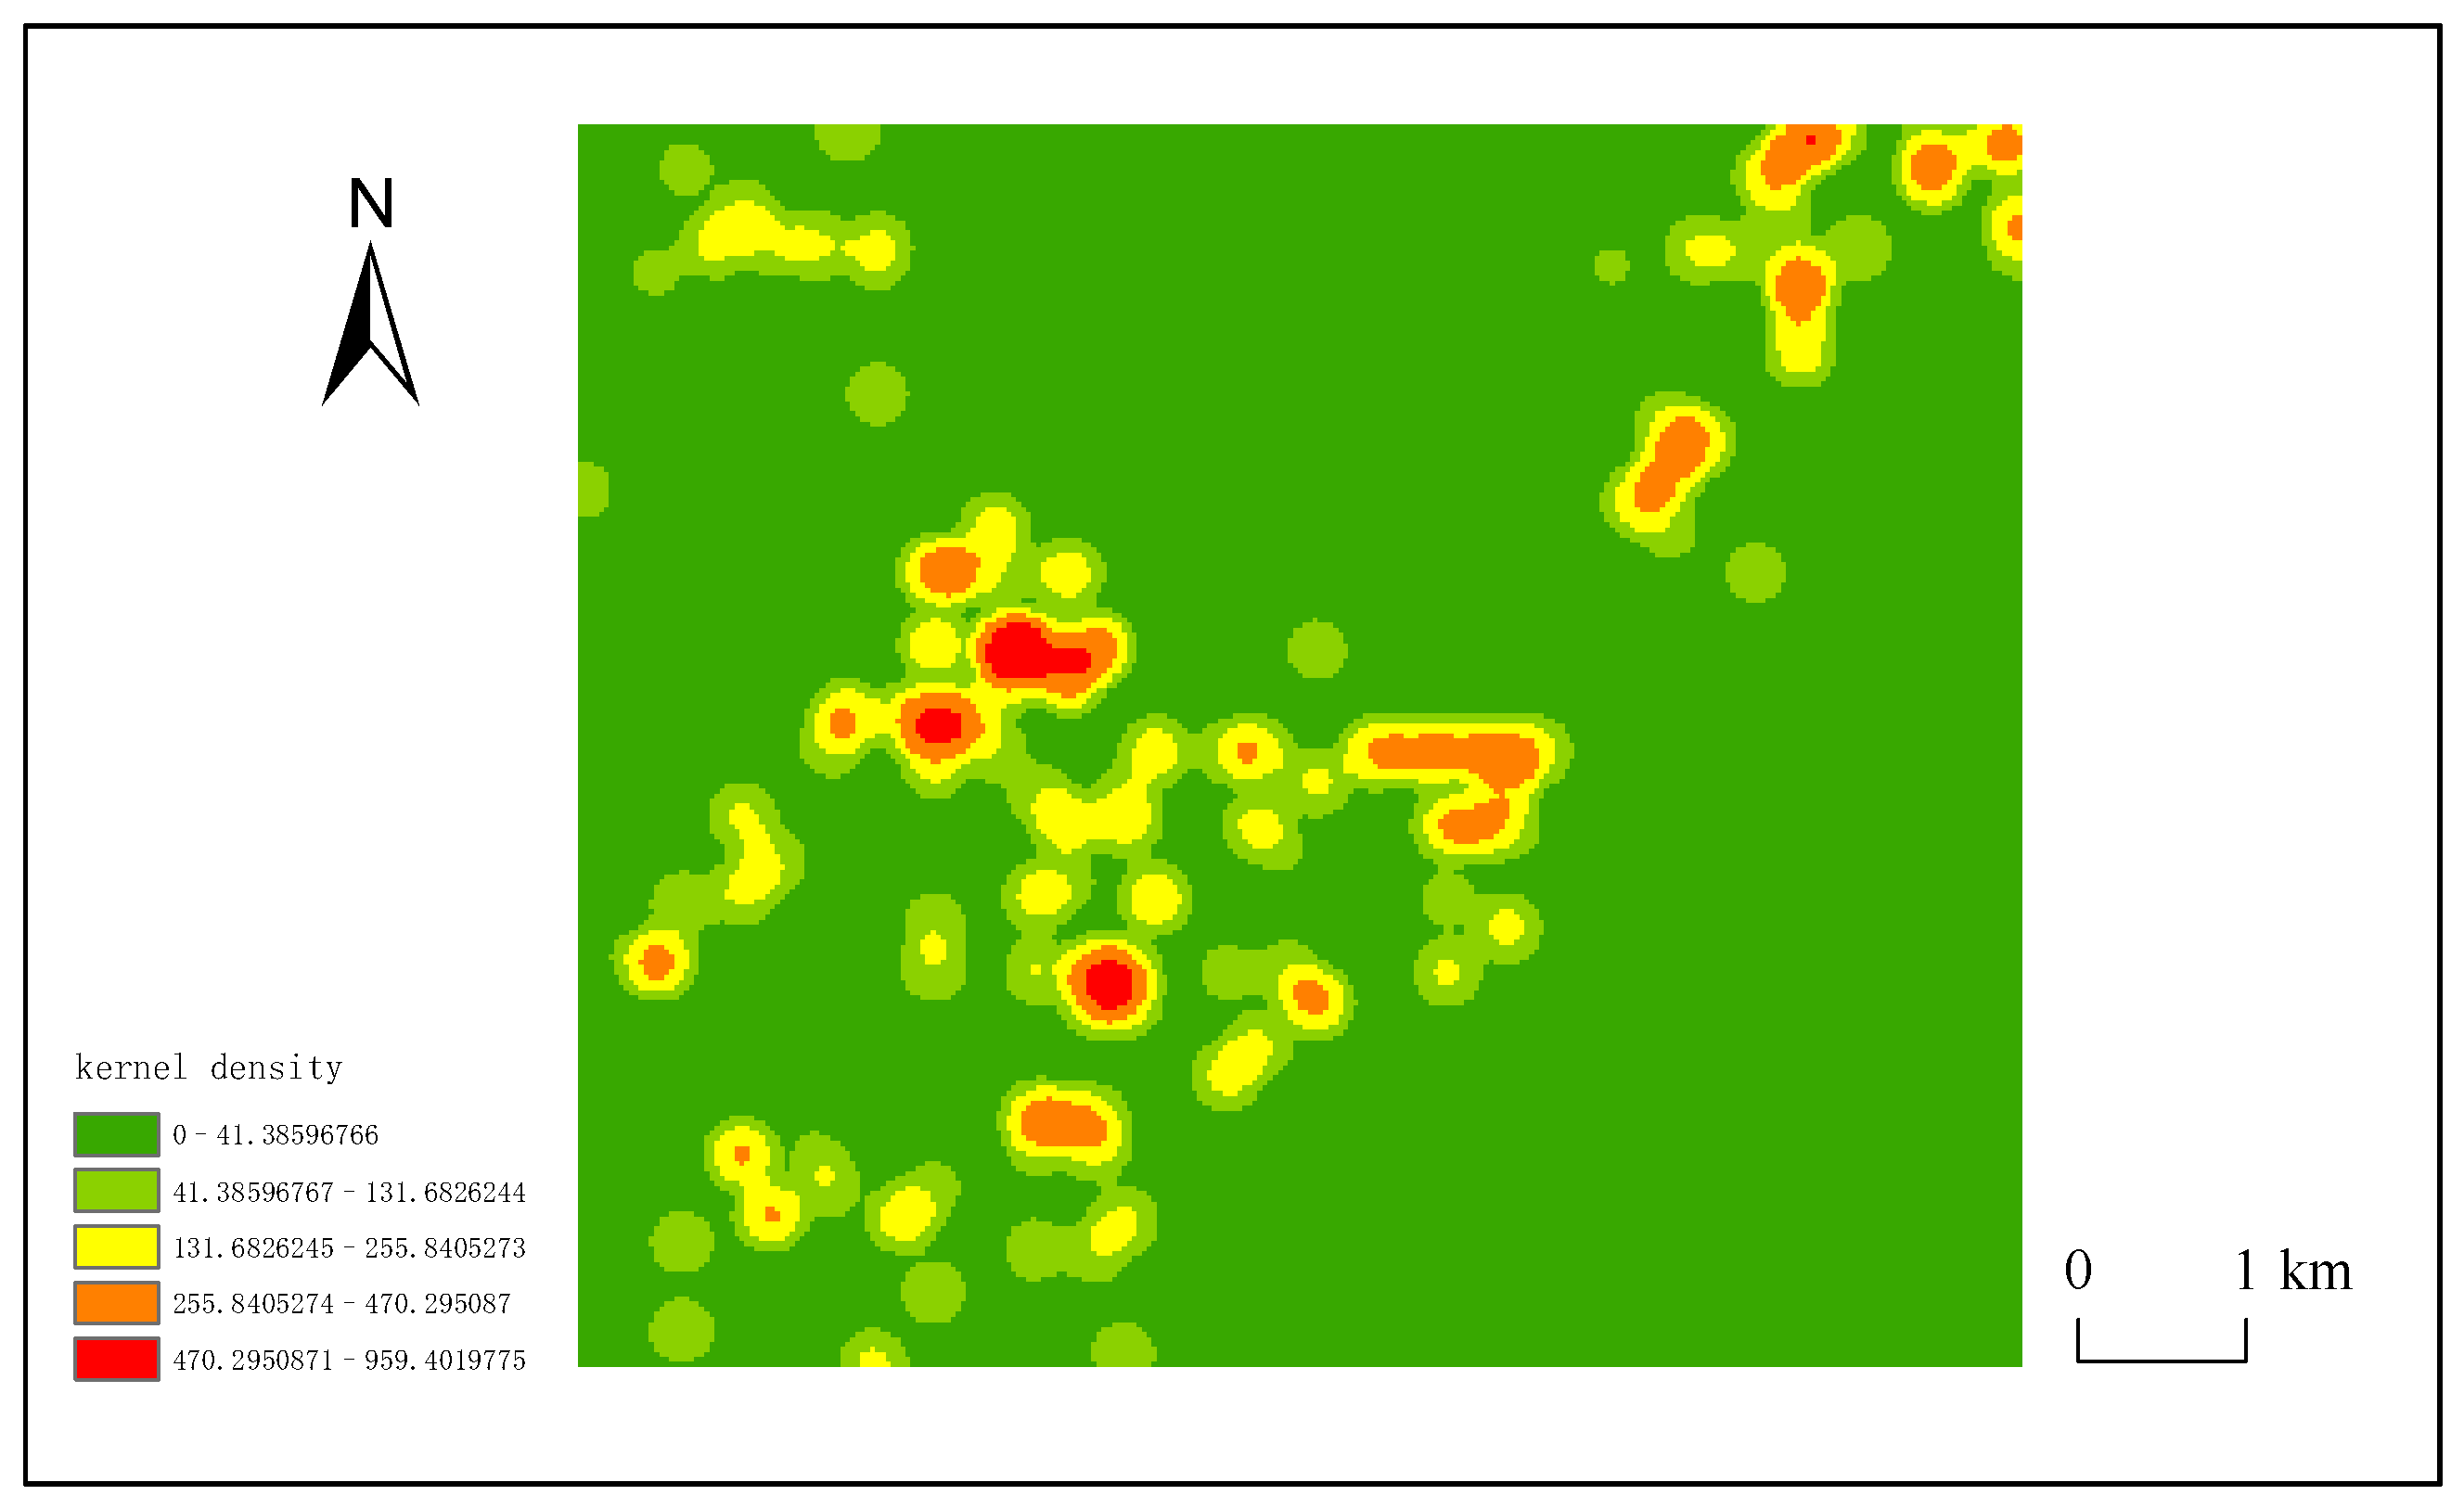
This study uses Baidu heatmap data, derived from mobile device Location-Based Service (LBS) positioning signals as illustrated in Figure 2, to visualize spatial crowd density and distribution as a proxy for street vitality dynamics. Heatmap images were collected hourly over a two-day sampling period from 22–23 March 2025, generating 48 temporal snapshots that provide a robust basis for spatiotemporal analysis of urban vitality.
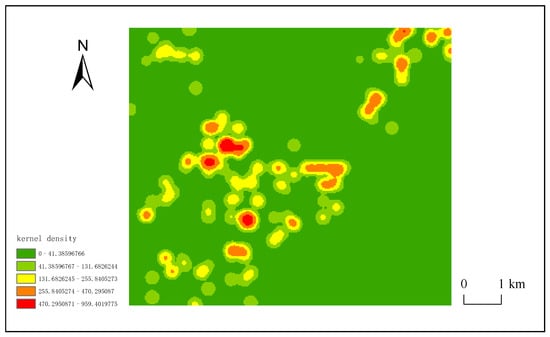
Figure 2.
Thermal data in the study area.
2.2.3. Amap POI Data
The 2025 POI data were obtained through the Amap API (Application Programming Interface), as summarized in Table 1, covering four core functional categories: accommodation, catering, retail, and healthcare services. These categories were selected based on their strong relevance to residents’ daily needs, public space utilization frequency, and neighborhood functional mix, serving as key indicators for measuring the attractiveness of the built environment regarding pedestrian flow. Meanwhile, bus stop density—a direct reflection of public transportation accessibility—together with POI functional density forms a core built environment indicator system for assessing street vitality, providing a quantitative basis for multidimensional analysis of urban spatial characteristics.

Table 1.
POI statistics.
2.2.4. Street View Data
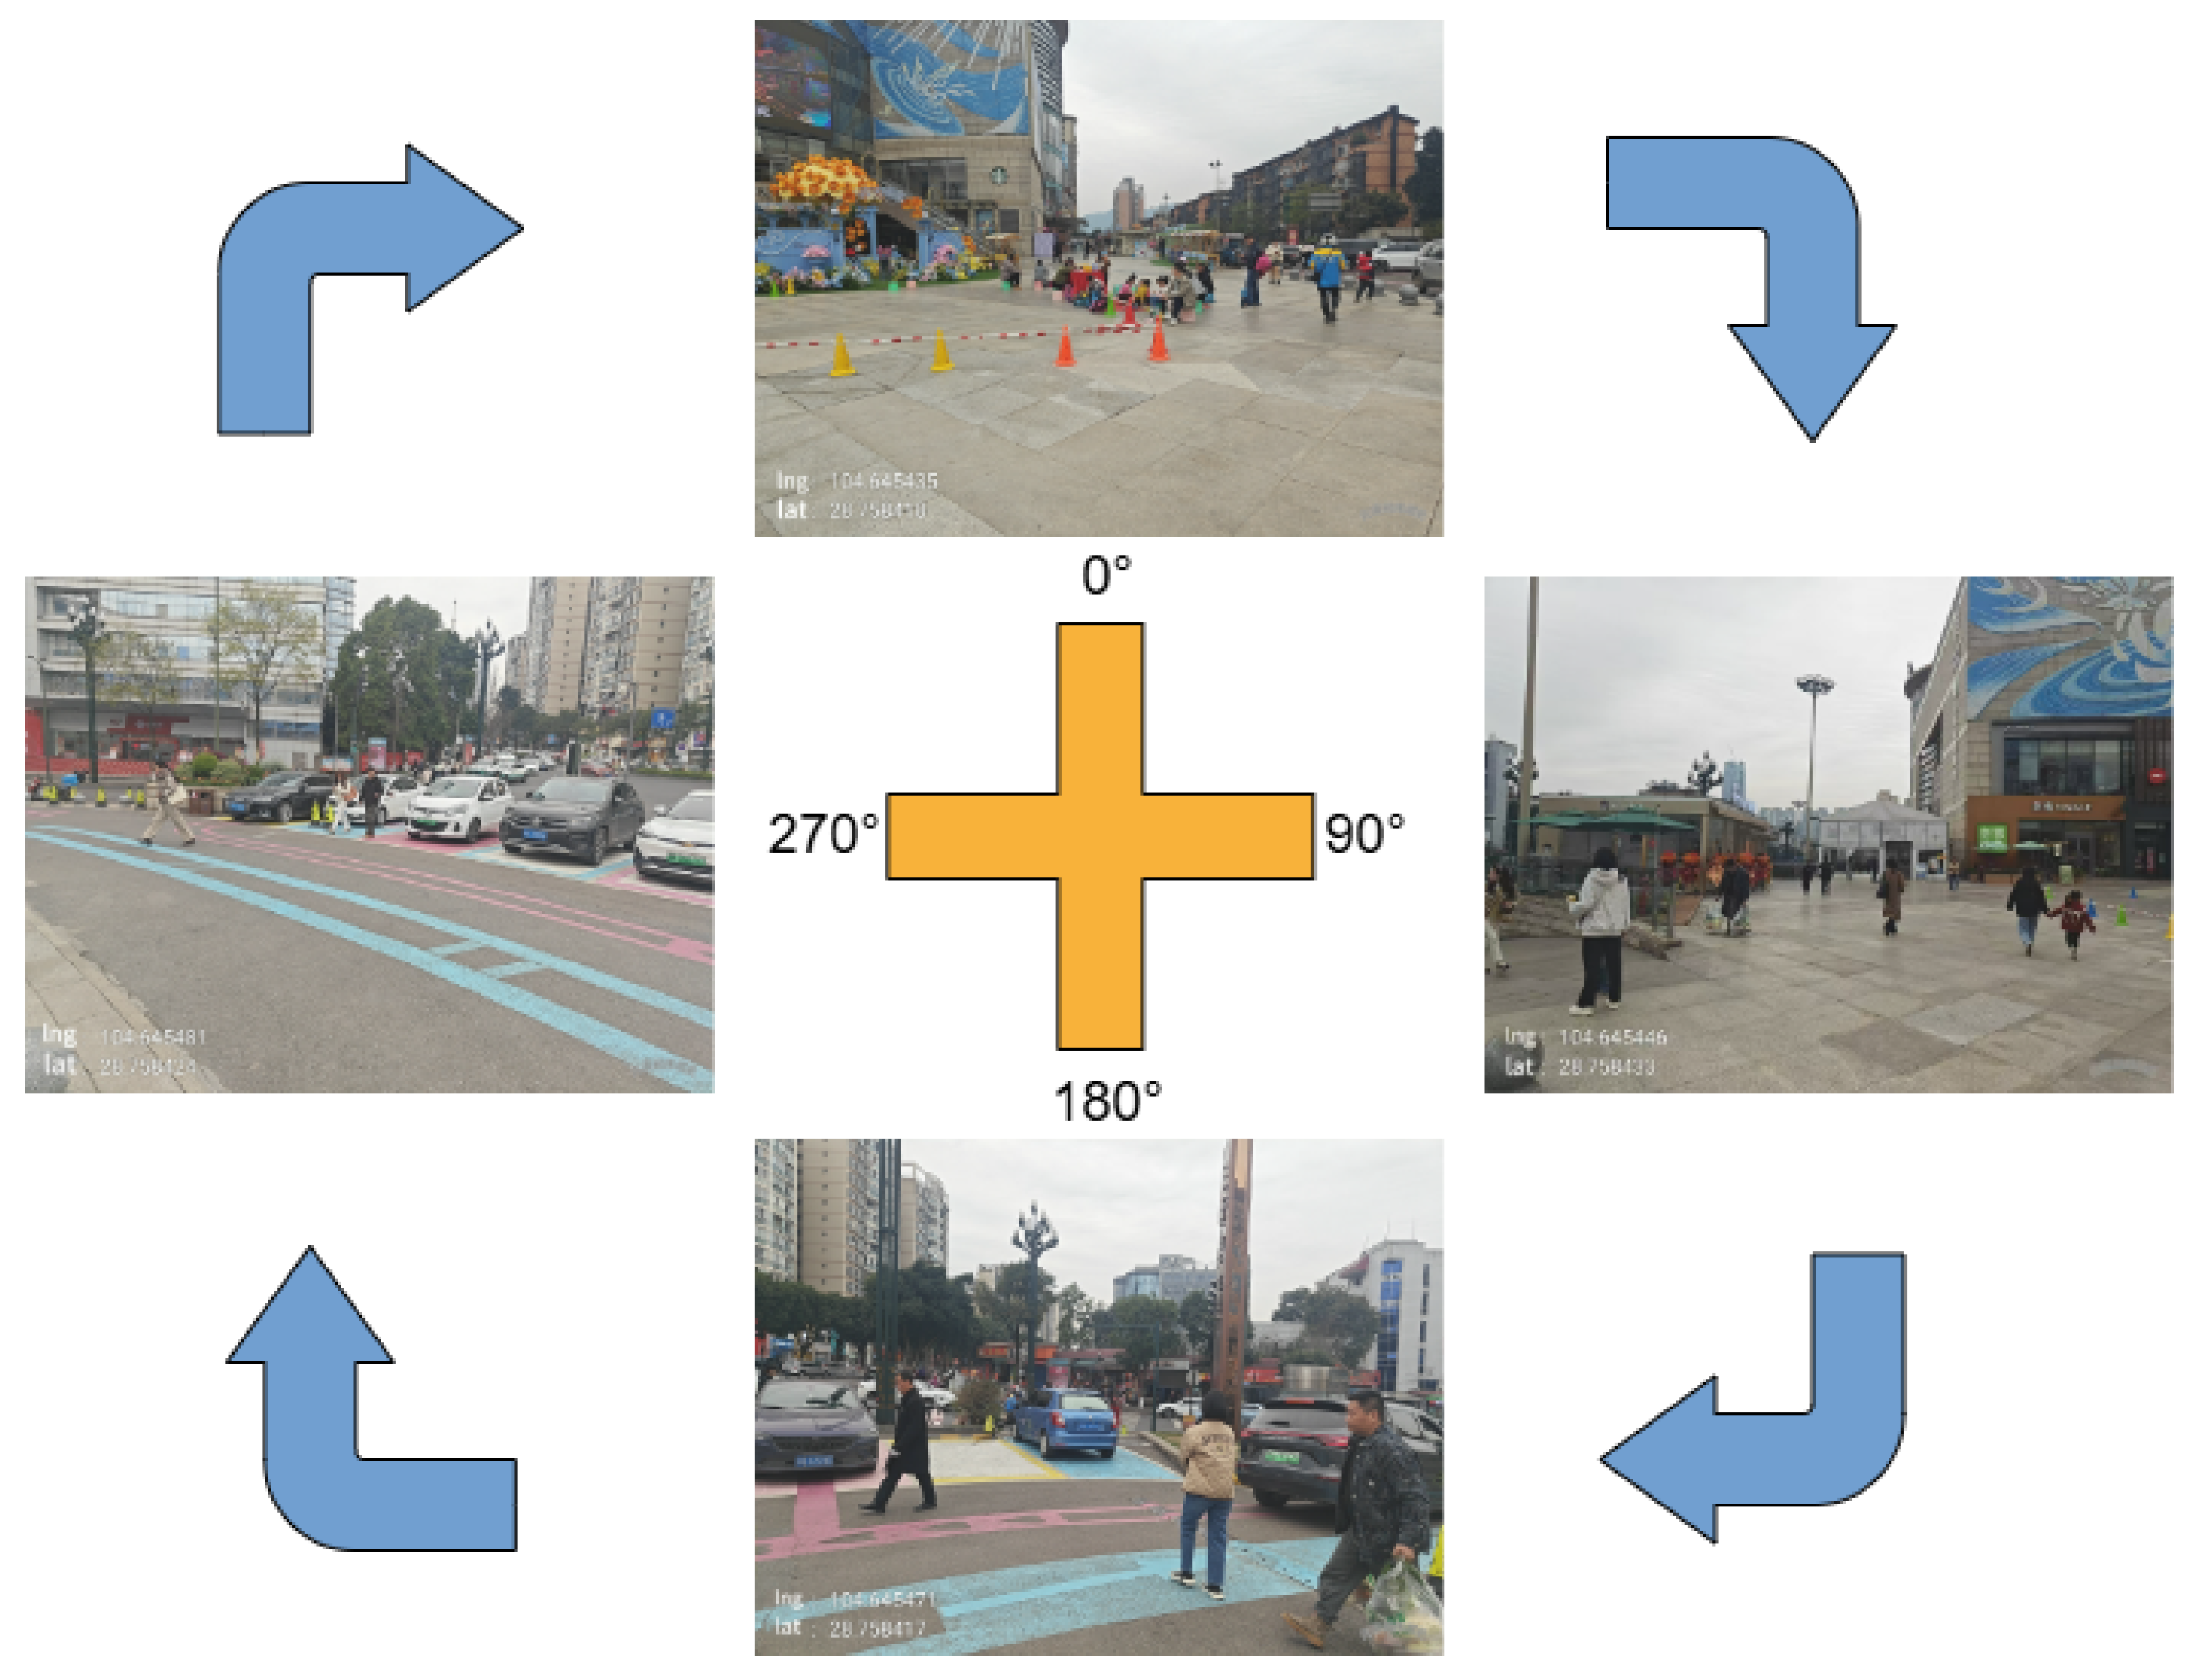
The image recognition dataset integrates both open-source and custom-collected street view imagery, as illustrated in Figure 3. A systematic field survey was carried out from 18–23 March 2025, across central urban areas of the Cuiping and Xuzhou Districts to acquire self-captured street view images using a stratified random sampling strategy based on street functional types and time periods. Geotagged cameras, mounted at a fixed height of 1.5 m, were utilized to capture images at predefined sampling points spaced 100 m apart. The final dataset consists of 2637 meticulously annotated images, of which 2373 were assigned to the training set and 264 to the validation set. Each original image, with a resolution of 1024 × 2048 pixels, was resized to 512 × 512 pixels and augmented to mitigate video memory demands during model training. Validation set performance was used to assess the final model accuracy.
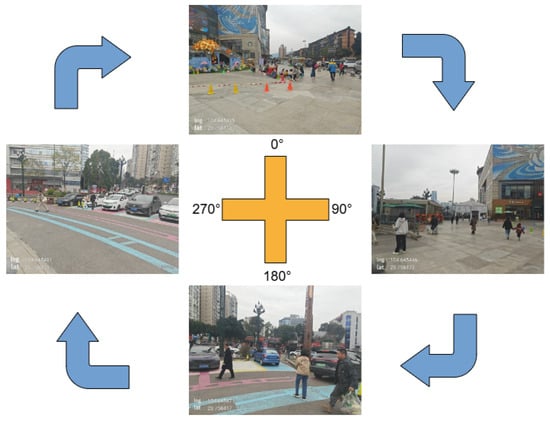
Figure 3.
Street view images.
3. Methodology
3.1. Research Framework
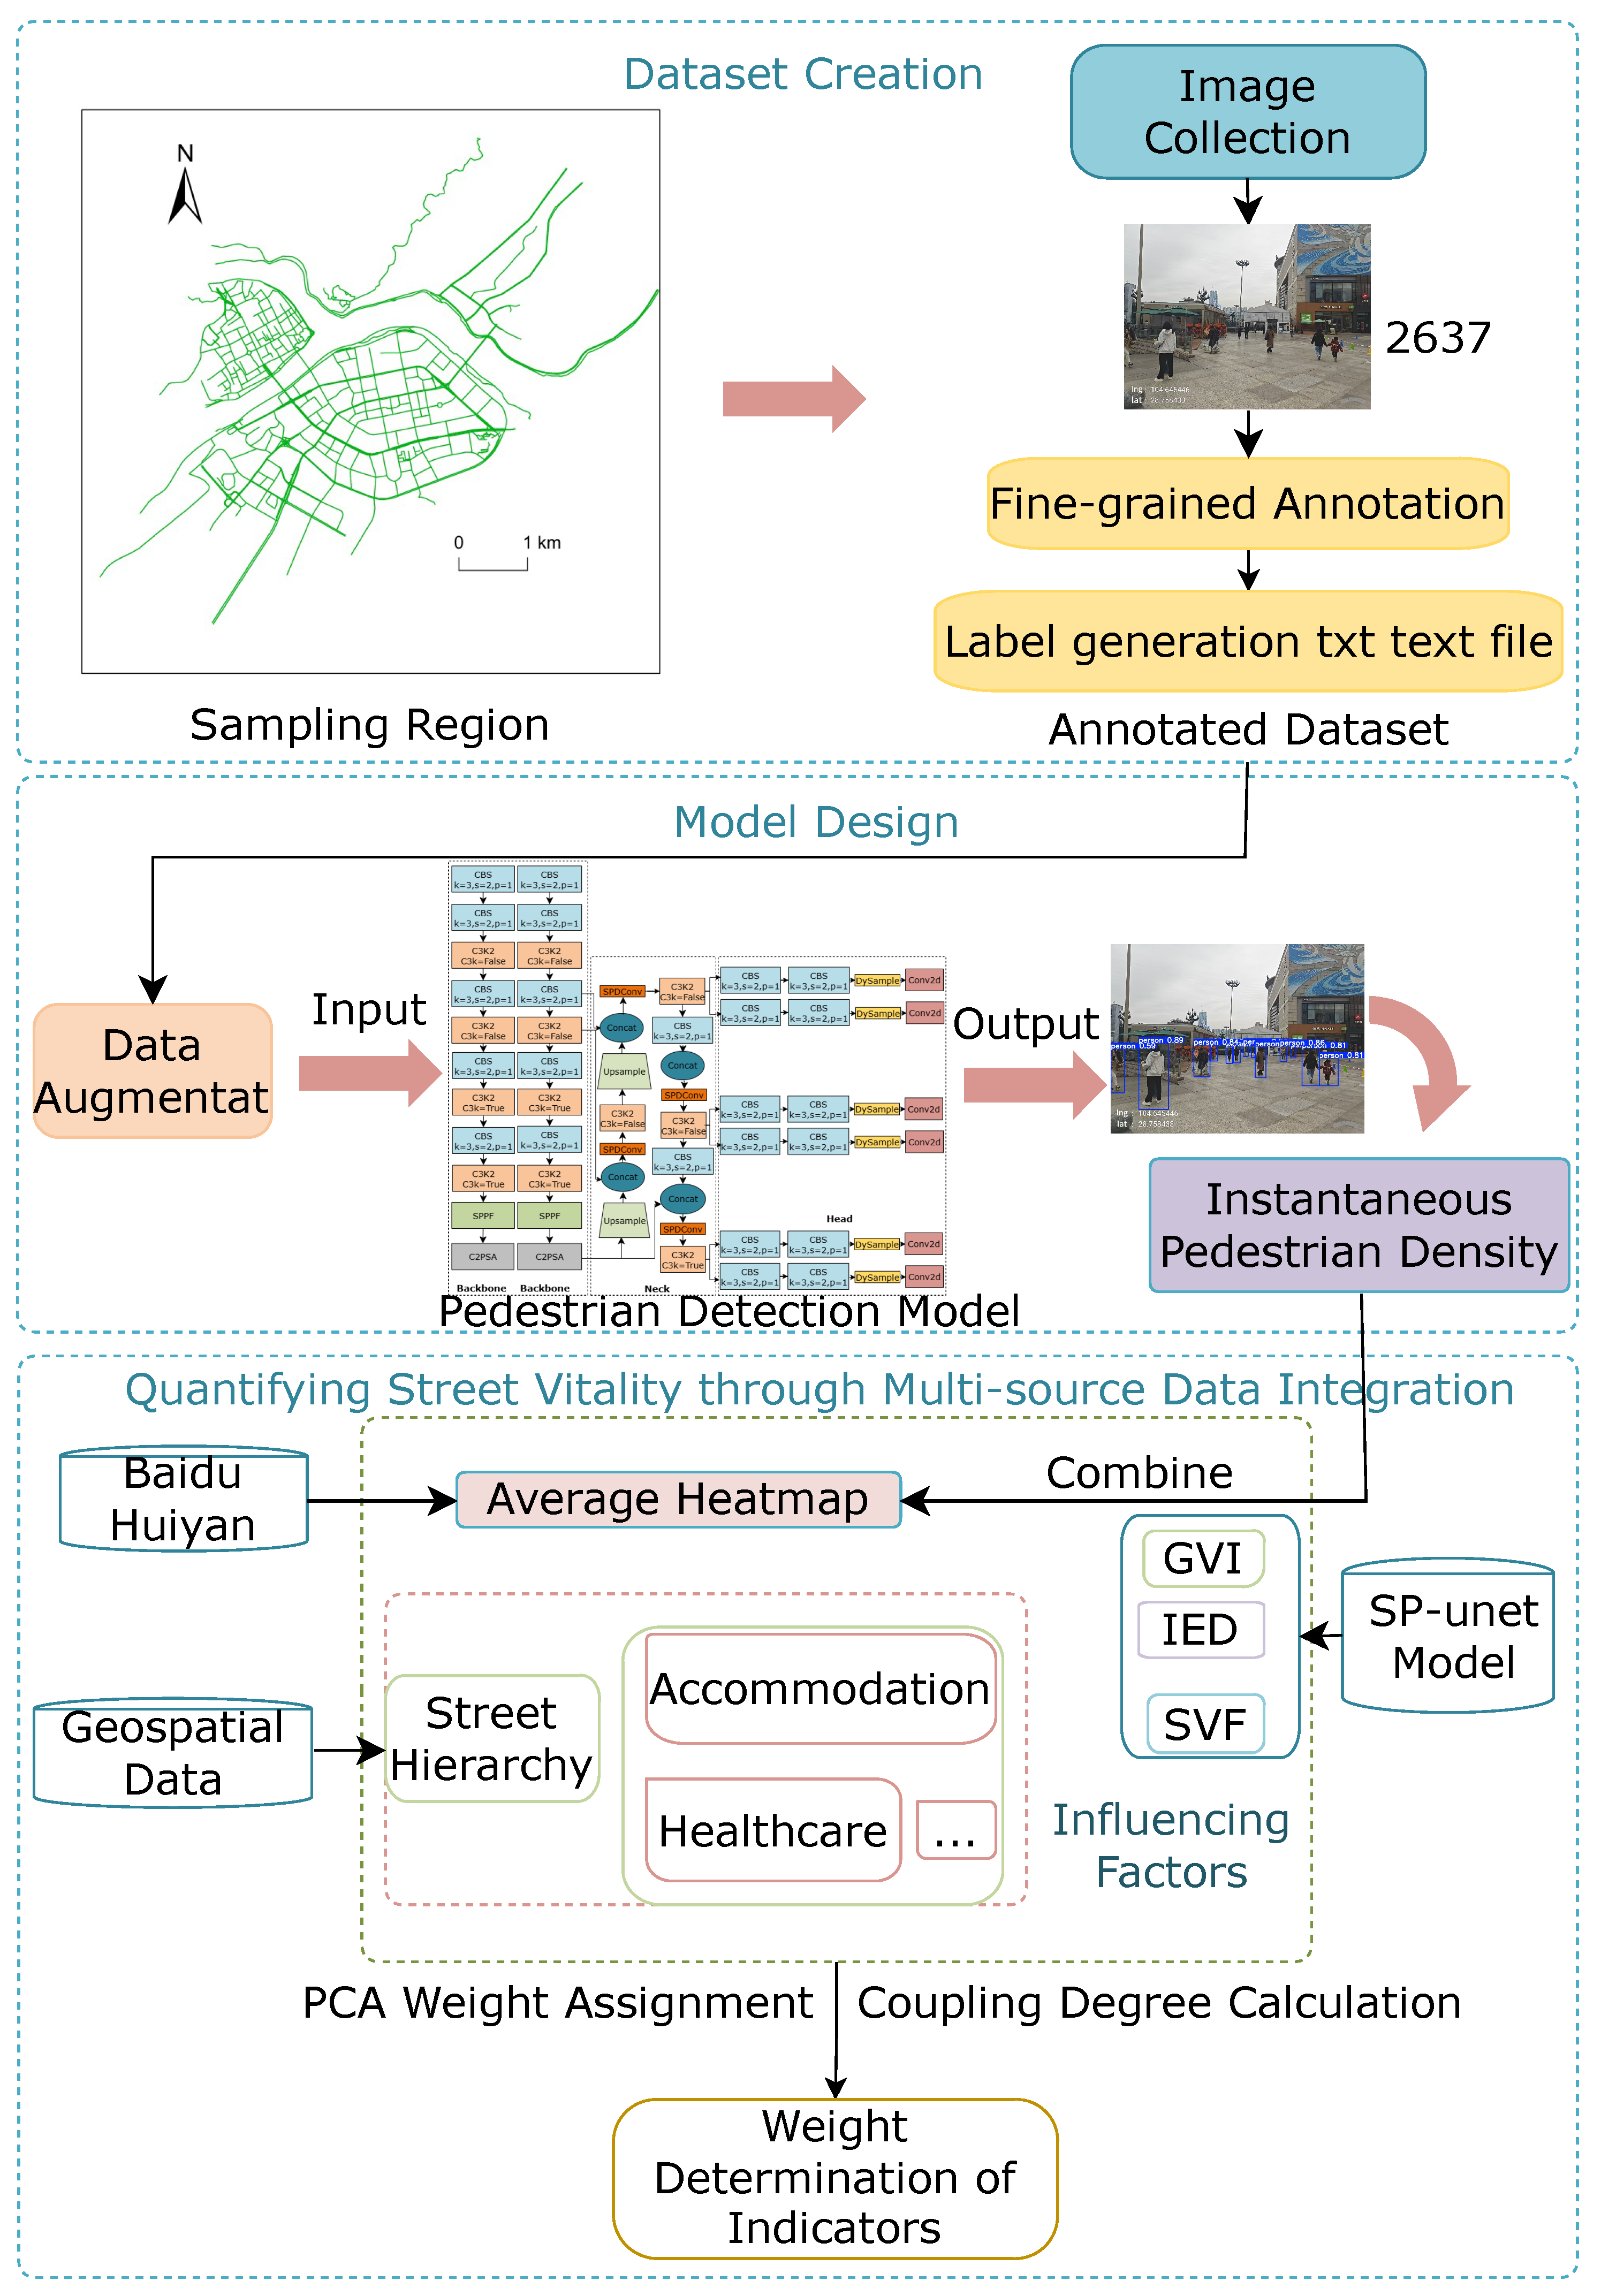
This study employs an enhanced YOLOv11 model for pedestrian detection and integrates multi-source geographic data—including Baidu heatmaps, road networks, and POI information—to establish a quantitative evaluation system for street vitality. Geographic feature indicators were derived through spatial statistics and proximity analysis, with their weights determined via principal component analysis. By incorporating both intrinsic compositional attributes and extrinsic representational factors of streets, the framework generates composite vitality scores for each street segment. The overall research methodology, outlined in Figure 4, provides a scientific basis for data-informed decision-making in street space optimization and urban planning.
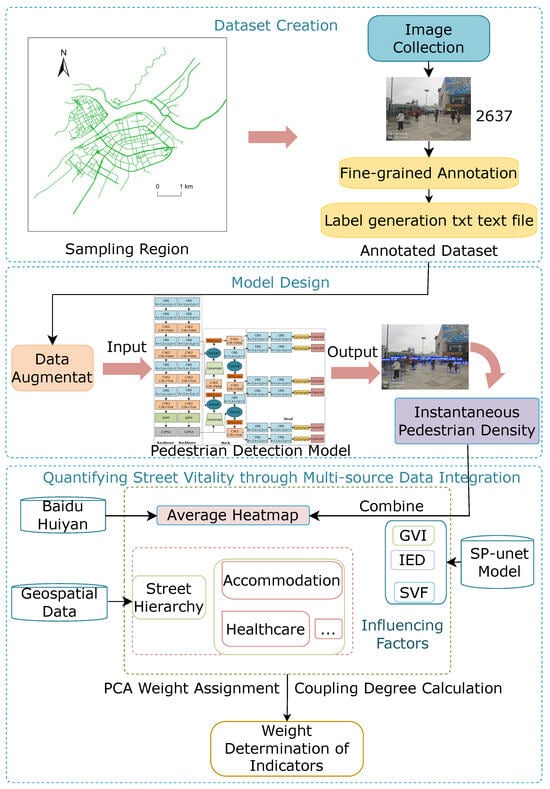
Figure 4.
Research framework.
3.2. Improved YOLOv11 Pedestrian Detection Model
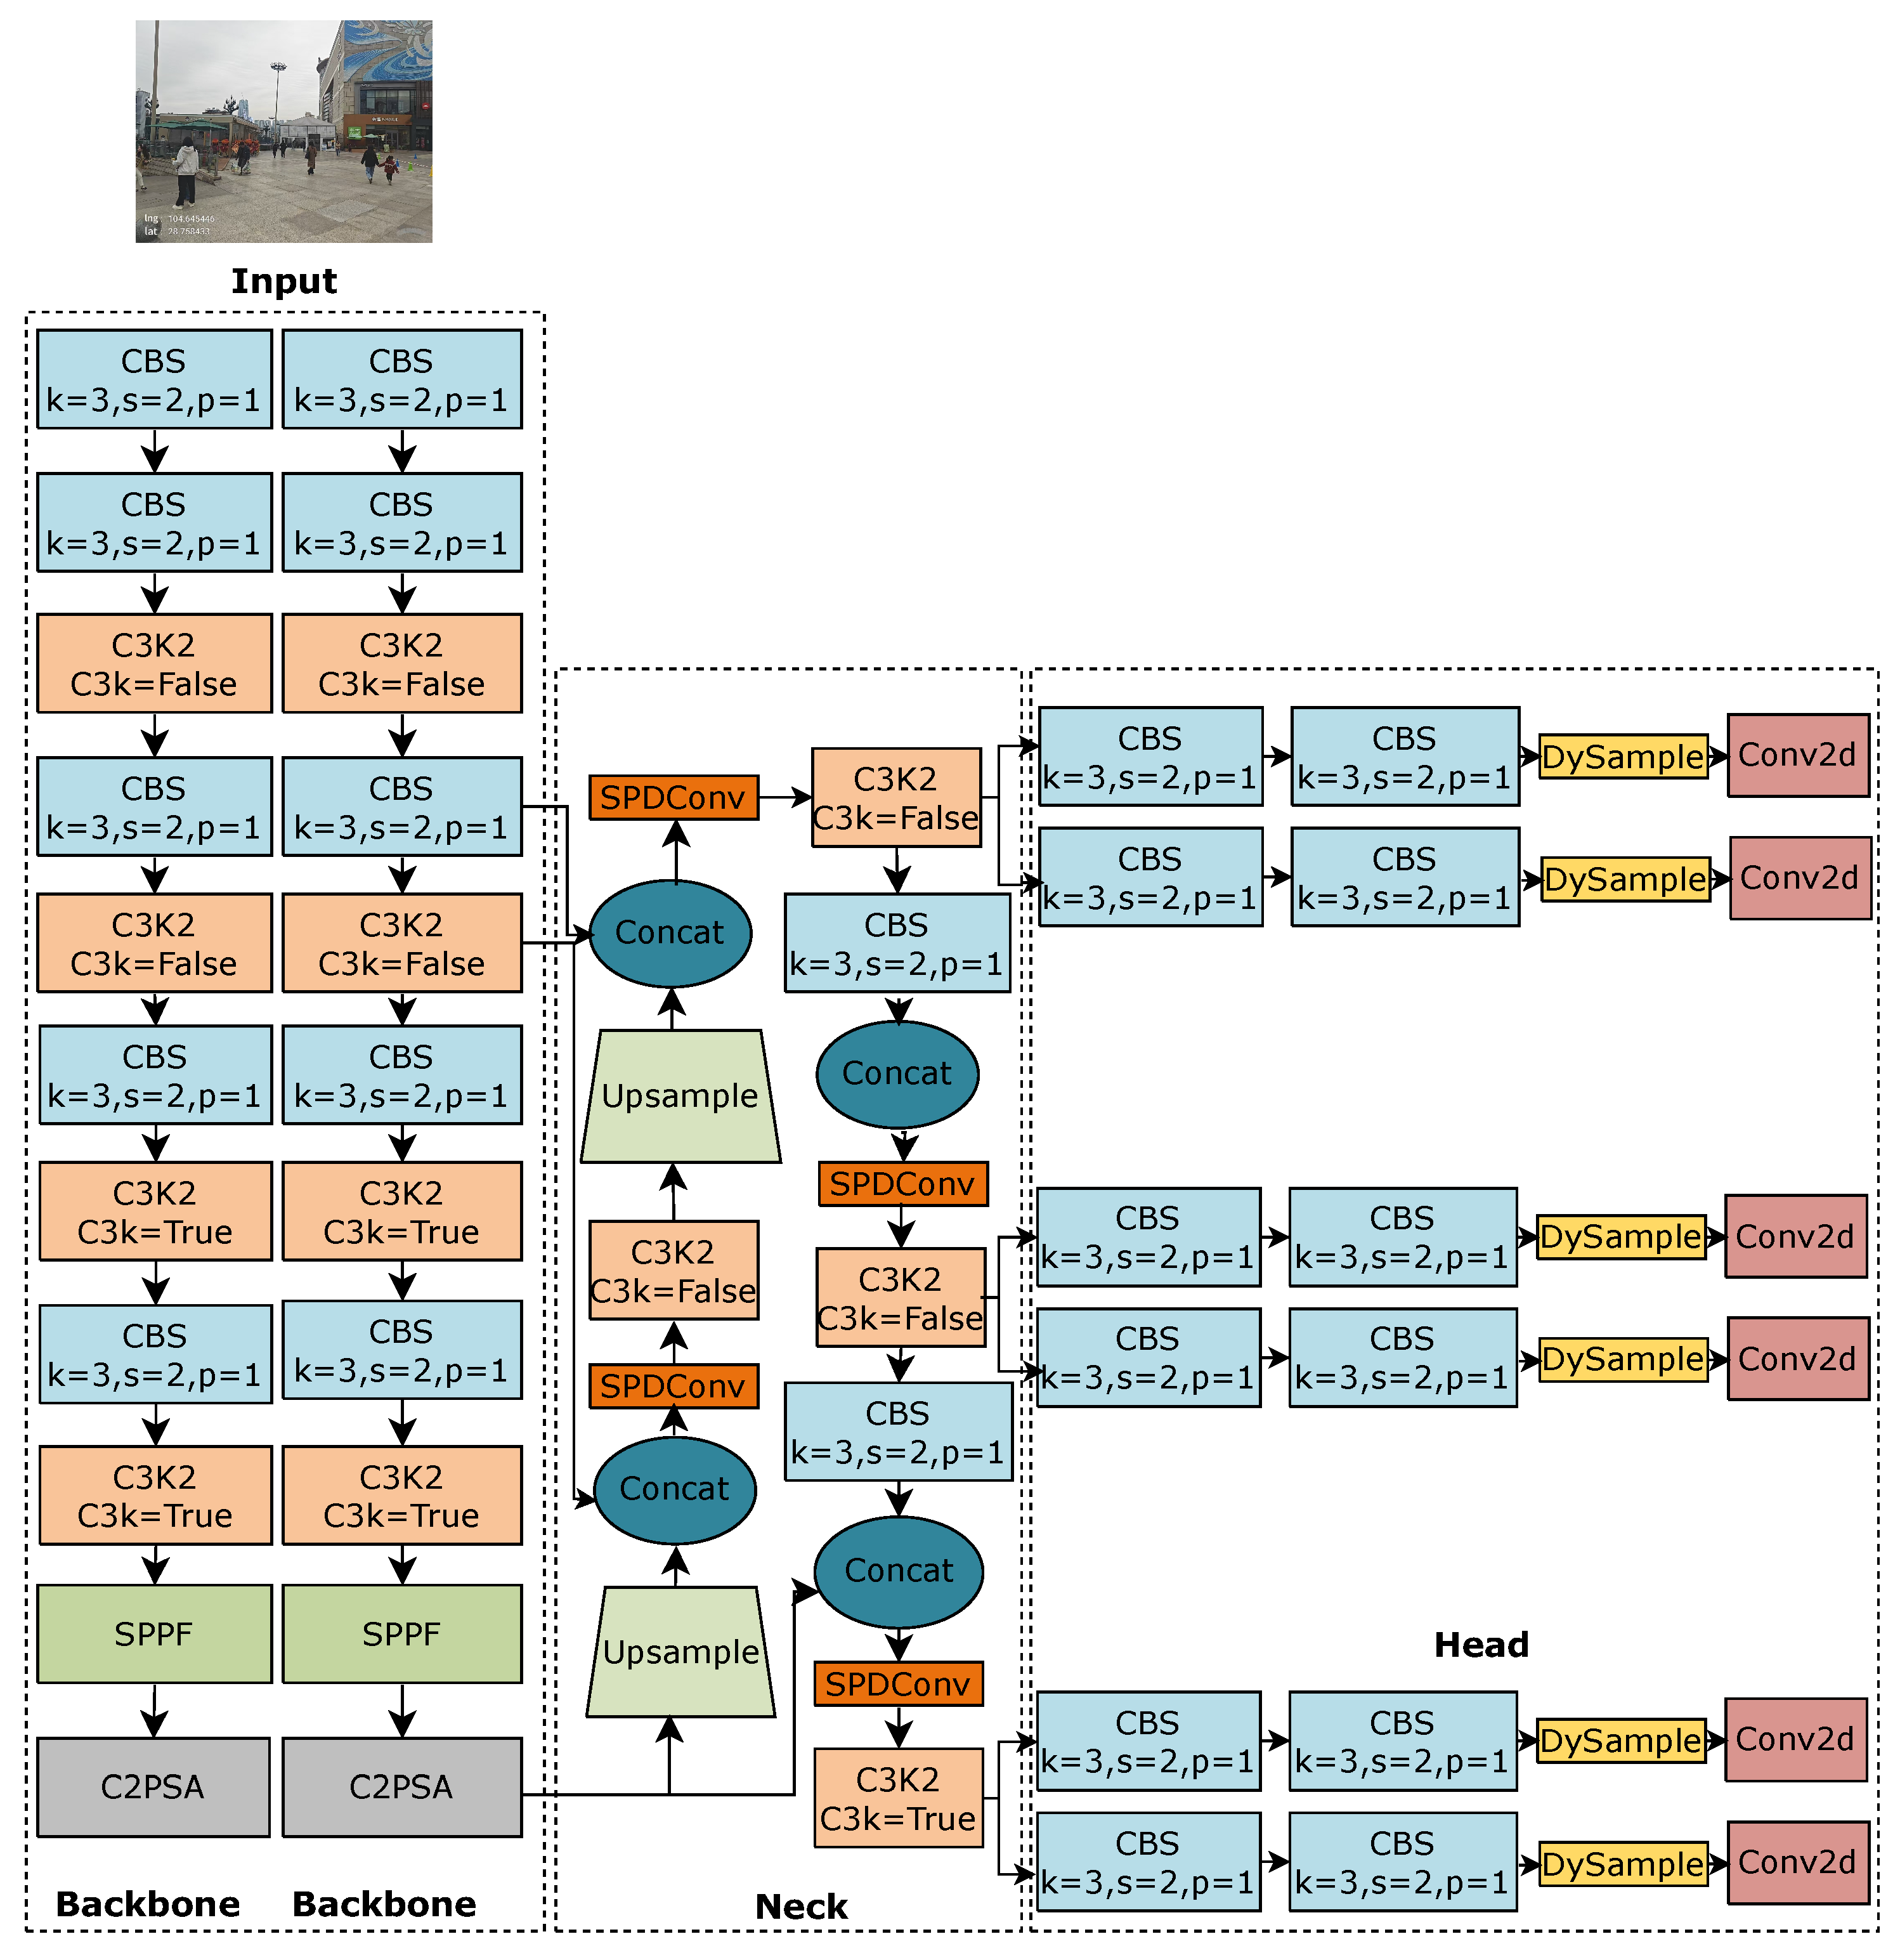
The YOLOv11 model employs a four-level hierarchical framework comprising an input module, backbone, neck, and detection head [28]. Within this configuration, the backbone is responsible for basic feature extraction, the neck facilitates the fusion of multi-scale features through a feature pyramid structure, and the detection head carries out the final classification and localization of objects. On the basis of this standard layout, the present study incorporates a set of architectural refinements and improvements, the overall structure of which is illustrated in Figure 5.
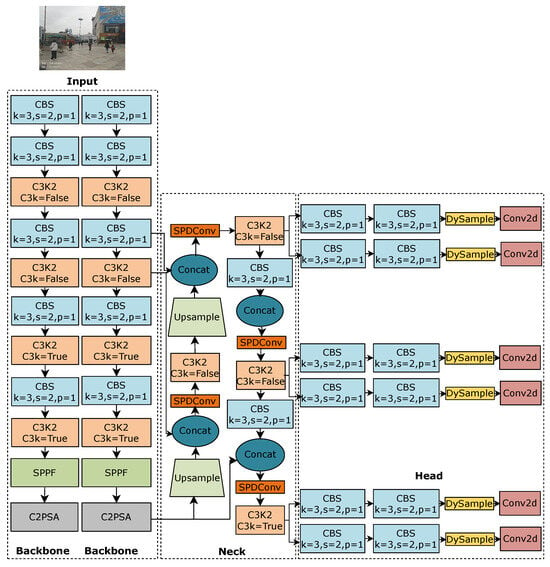
Figure 5.
Improving the YOLOv11 network architecture.
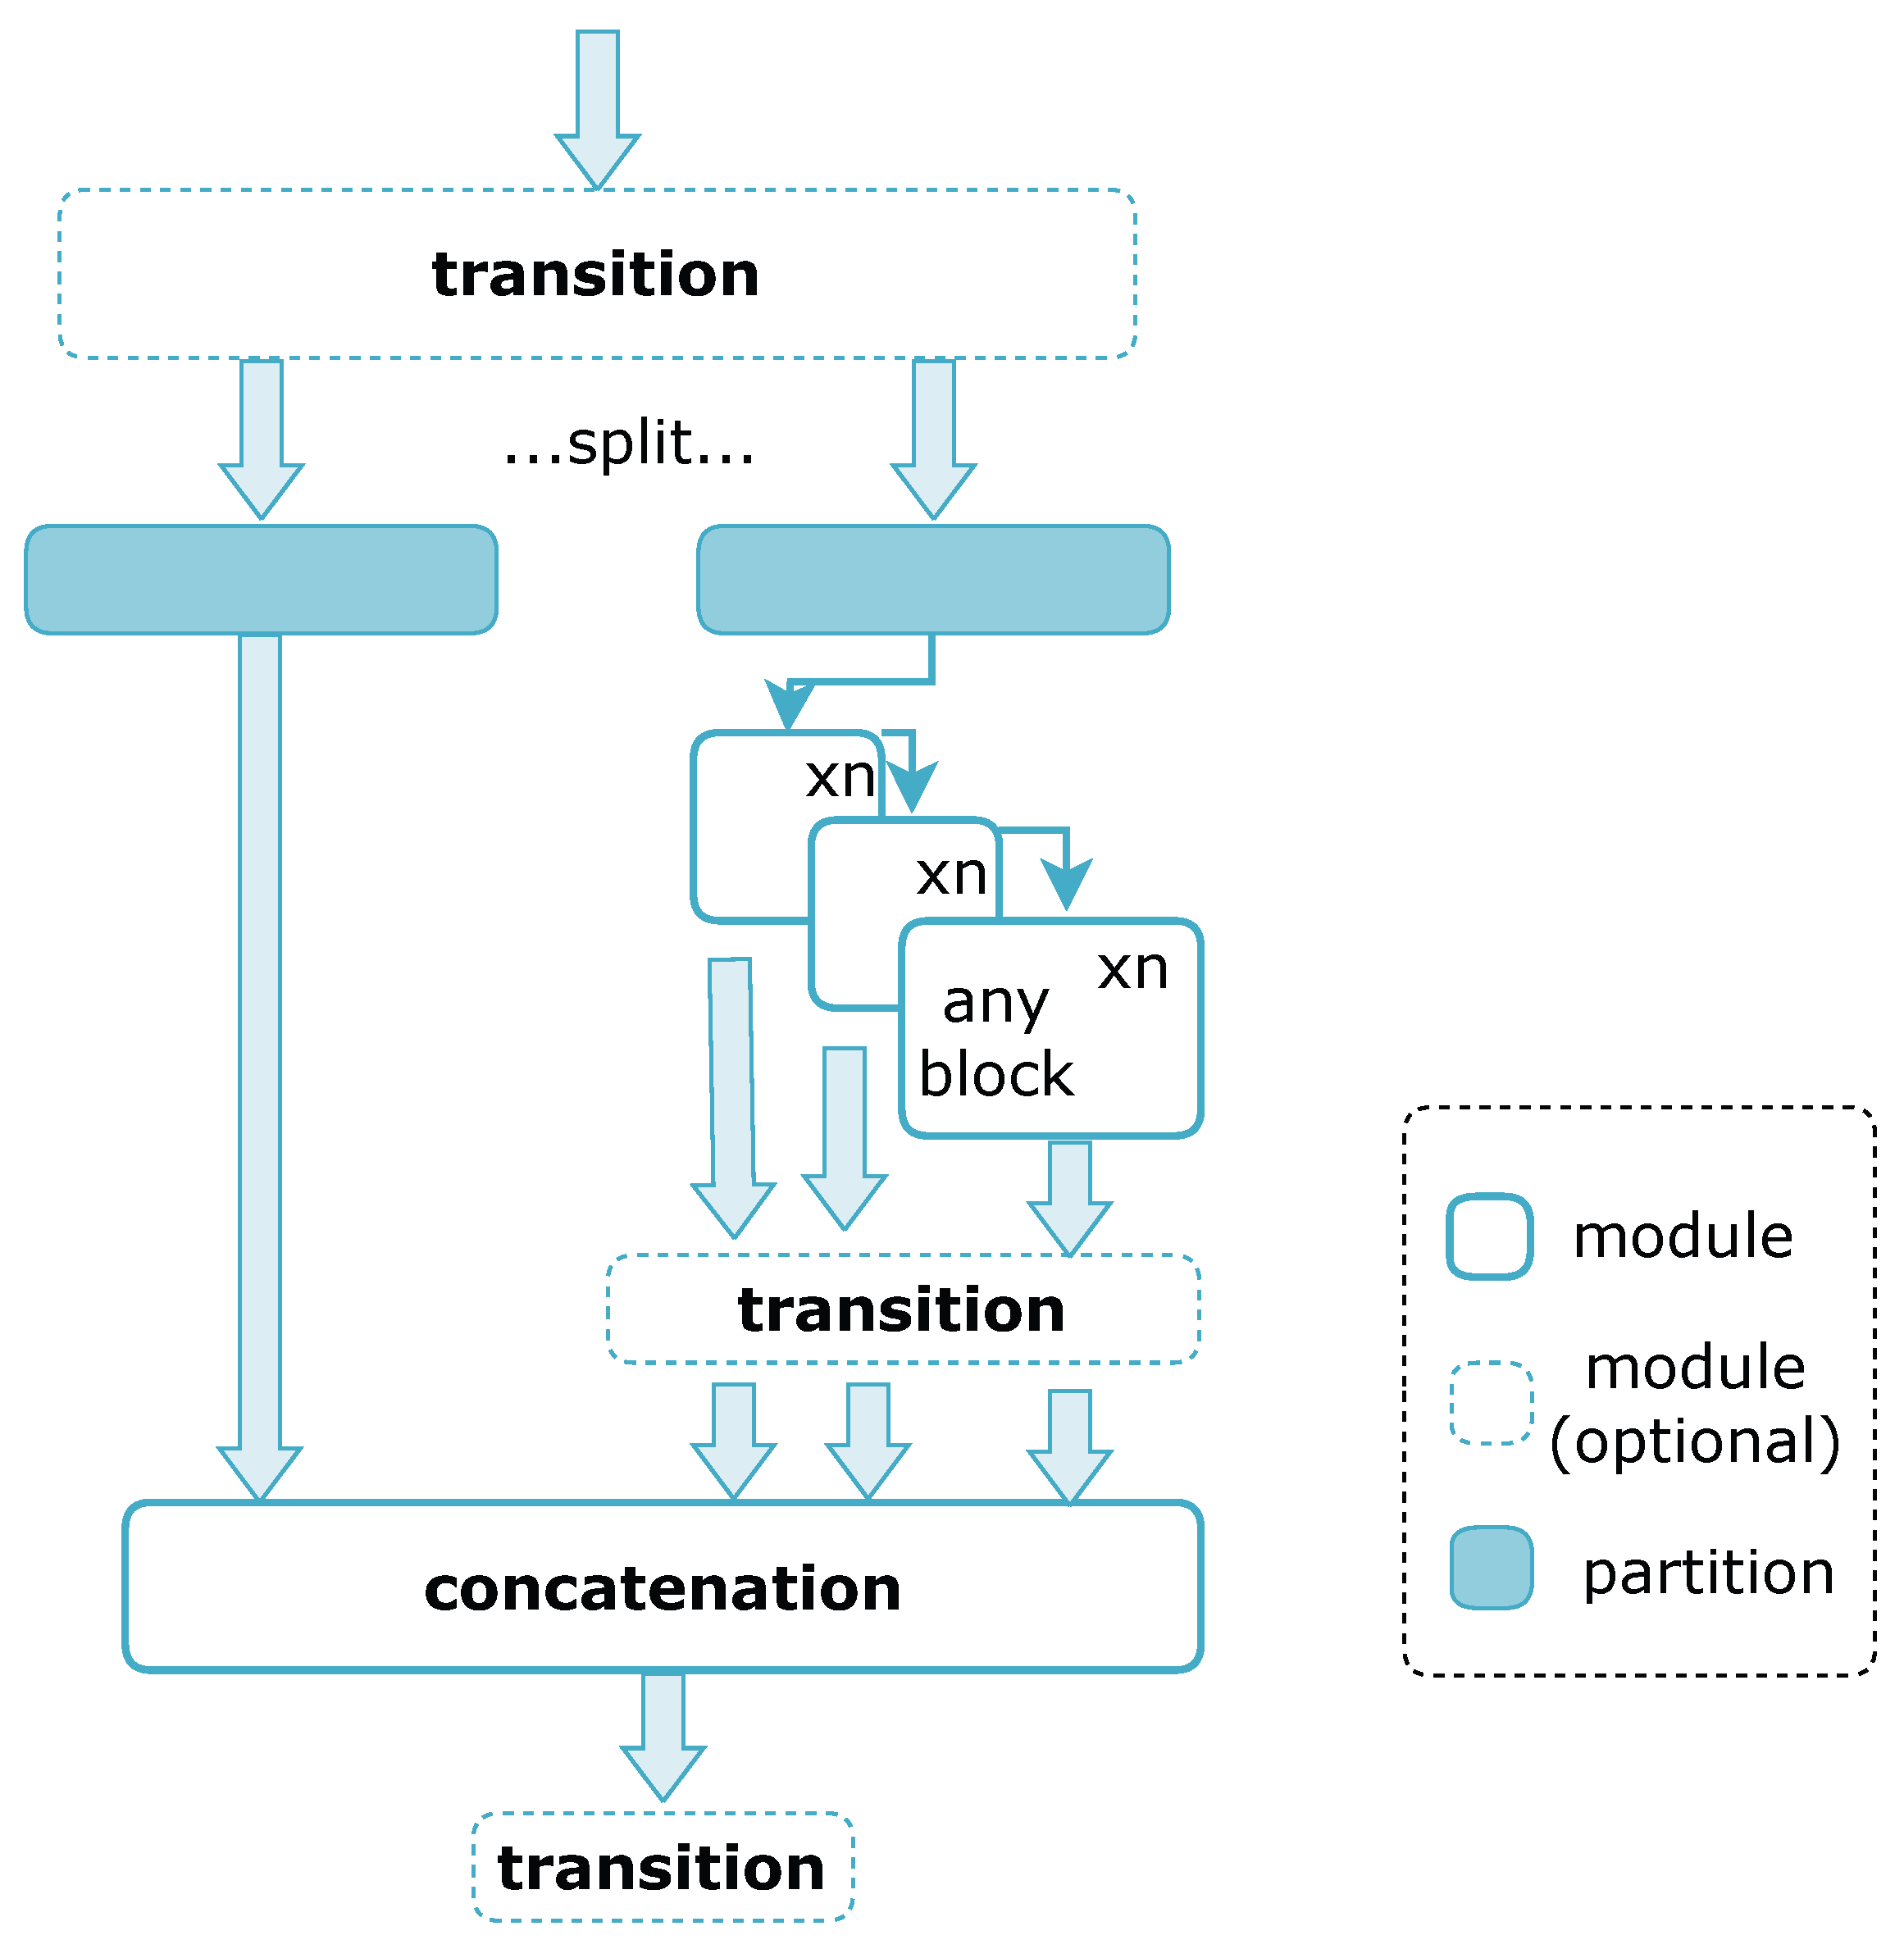
- To address the significant scale variation of pedestrians in street scenes, a two-backbone architecture is proposed, as illustrated in Figure 6. The shallow branch employs a C3k2 module to capture fine-grained features such as pedestrian contours and poses, while the deep branch incorporates a CBFuse module to integrate multi-scale feature representations. Within this framework, the CBLinear module performs channel binding, and the CBFuse module utilizes nearest-neighbor interpolation for feature alignment and weighted fusion. The architecture retains two critical feature scales—1/8 and 1/16—ensures compatibility with pre-trained weights via a Silence module, and enhances feature representation through the incorporation of a C2PSA attention mechanism. This design preserves the computational efficiency of the original YOLOv11 while improving detection performance in occluded and high-density crowd scenarios through its dual-branch CBLinear–CBFuse structure. The experimental results demonstrate a 5.1% improvement in mAP50 compared to the single-backbone configuration.
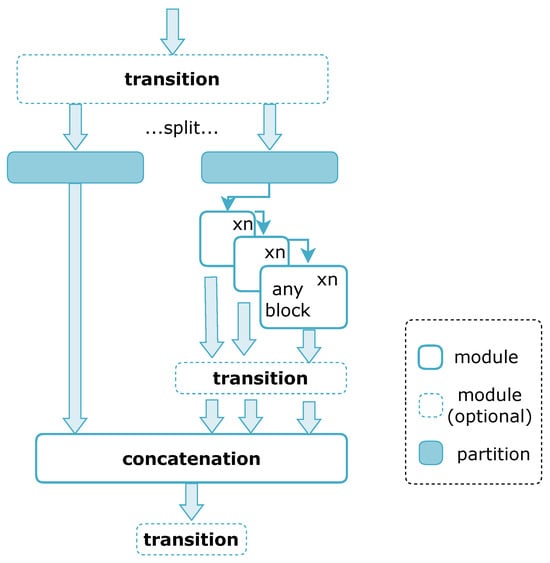 Figure 6. Two-backbone network architecture.
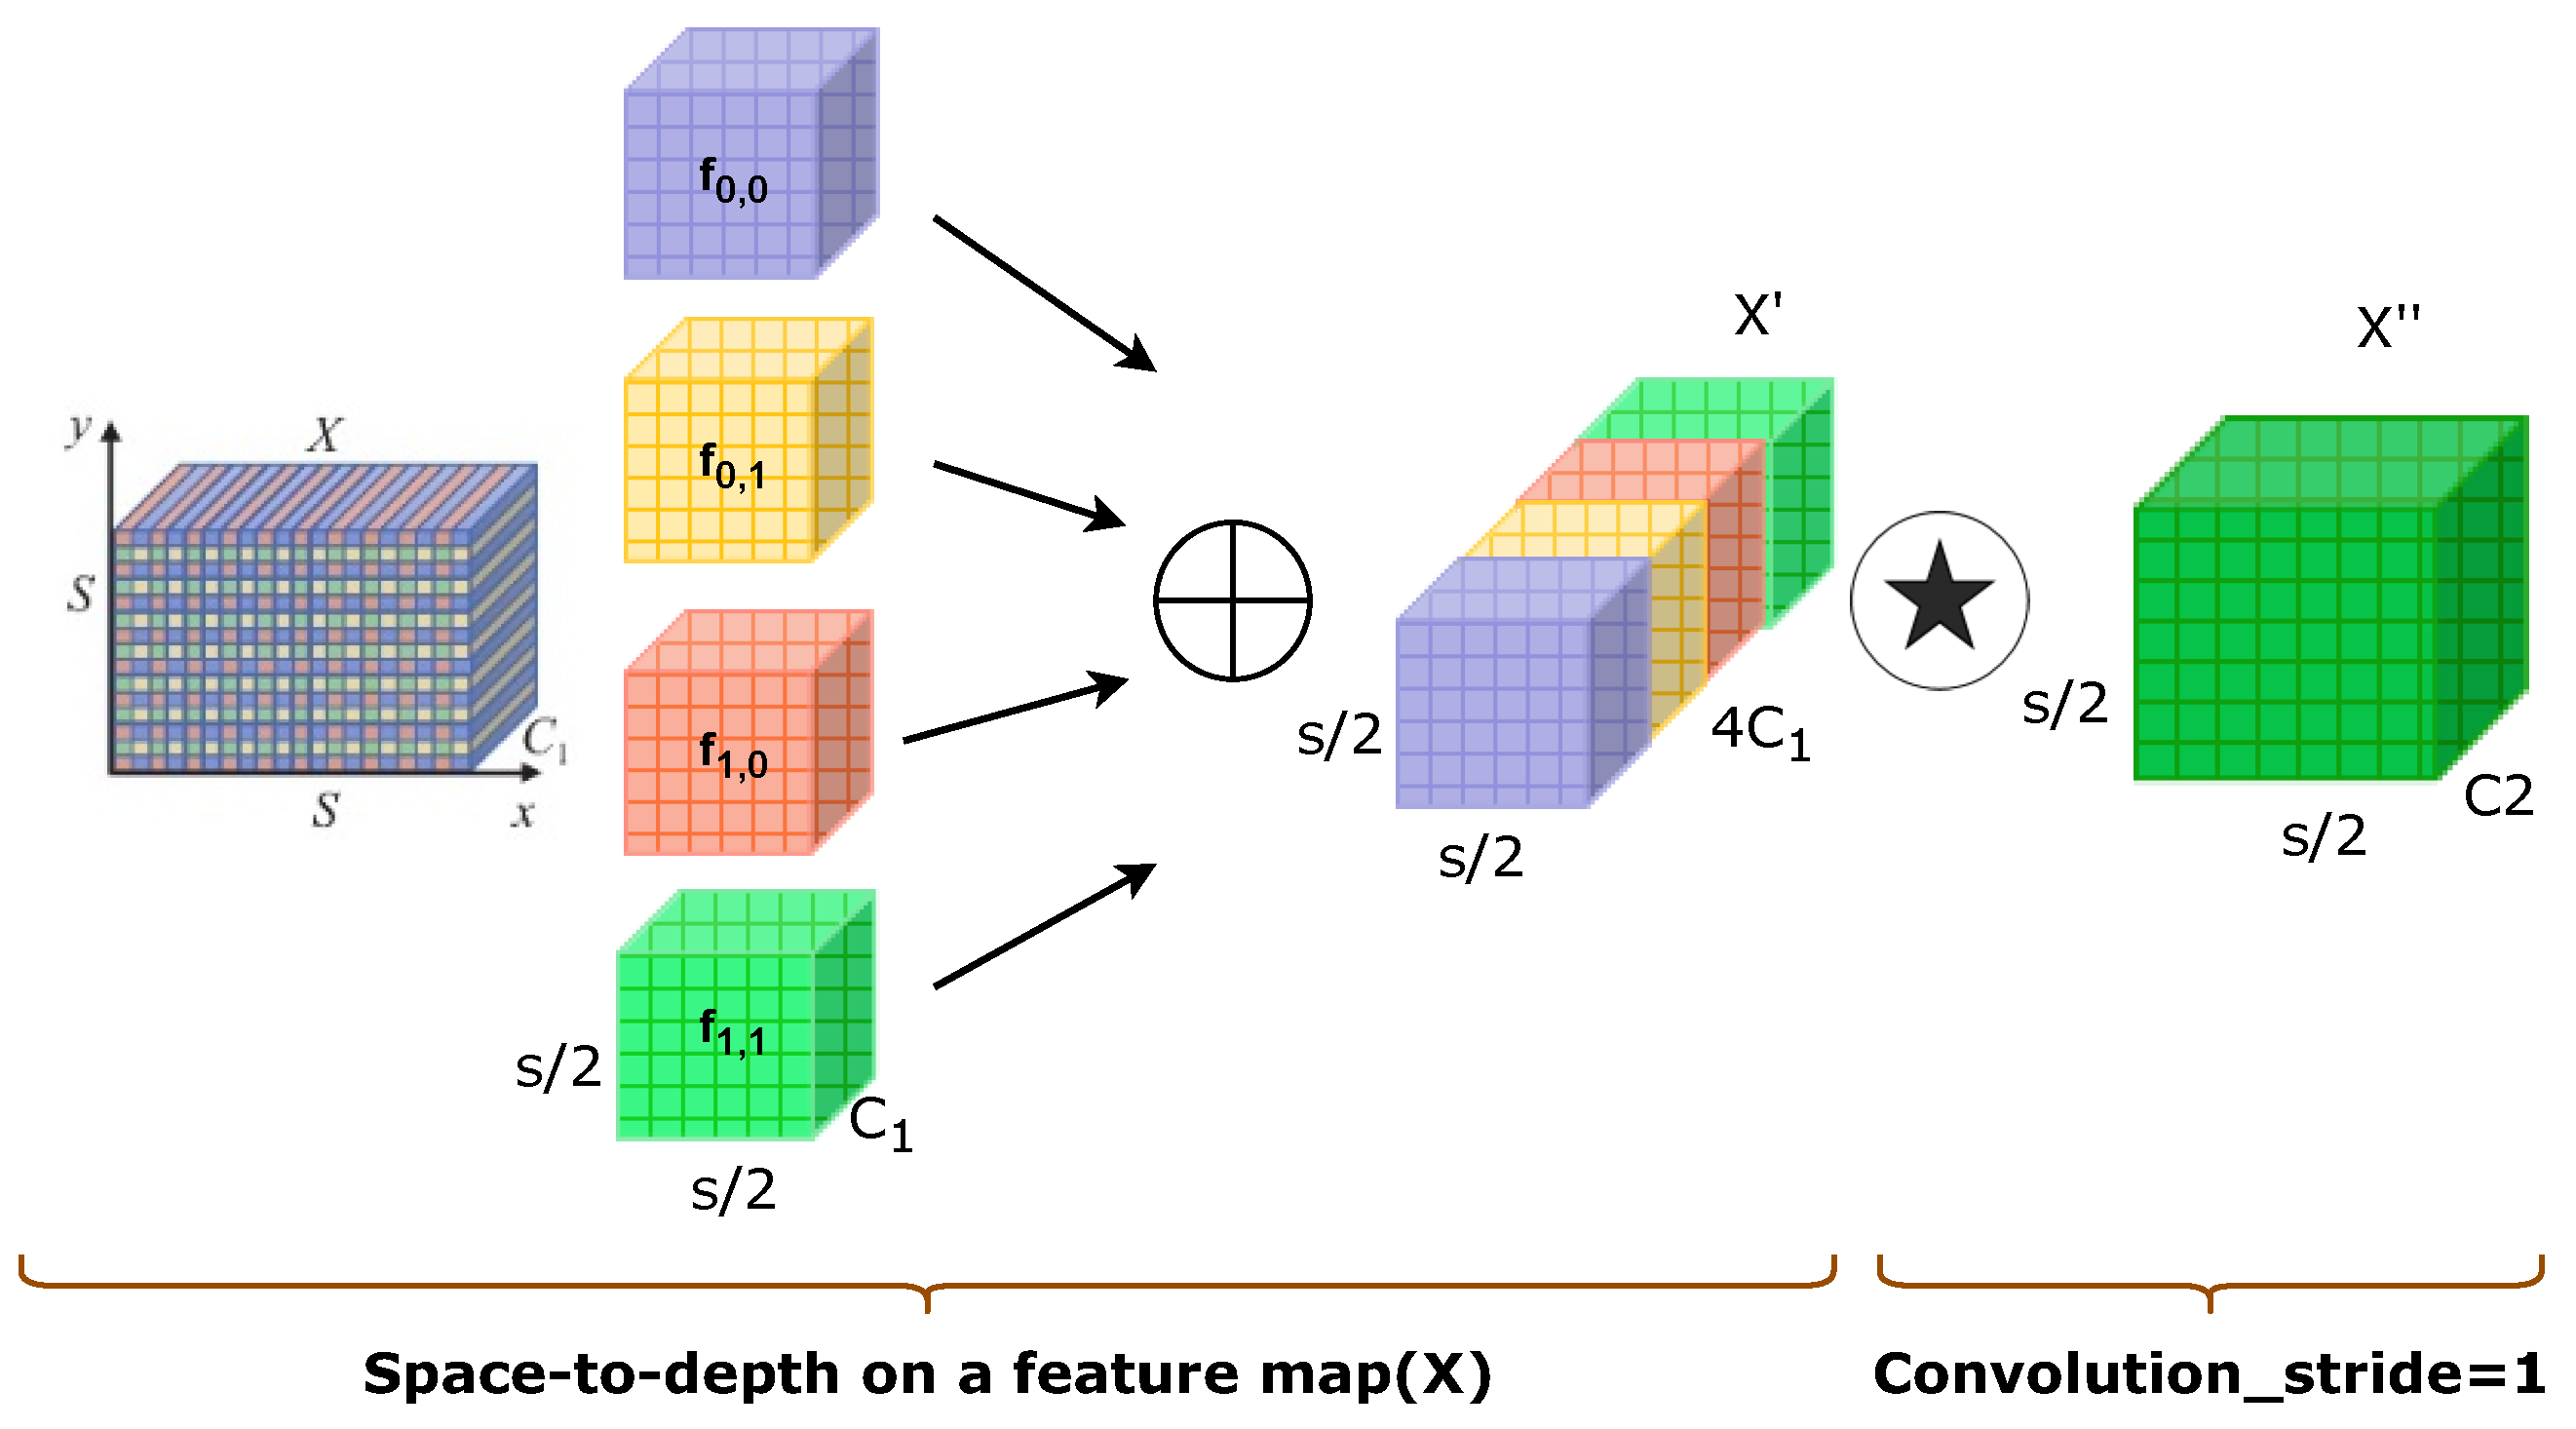
 - To address the challenges of dynamic occlusion and complex backgrounds in street scene detection, this study incorporates a SPDConv module into the YOLOv11 architecture [29], as illustrated in Figure 7. This module employs spatial restructuring of feature maps to reduce resolution while preserving informational integrity and utilizes parallel dilated convolutions with multiple dilation rates to capture multi-scale contextual features. By integrating a channel attention mechanism, it achieves adaptive fusion of local texture details and global semantic information. This design significantly enhances pedestrian detection accuracy in complex environments without compromising real-time performance, thereby offering a reliable quantitative evaluation tool for urban dynamic monitoring.
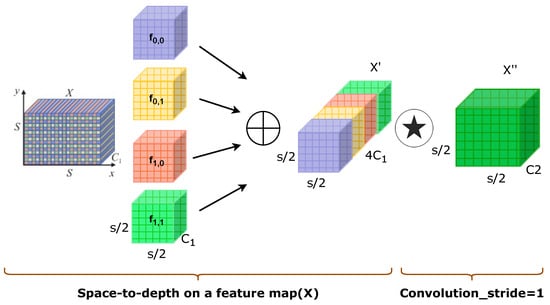 Figure 7. SPDConv network architecture.
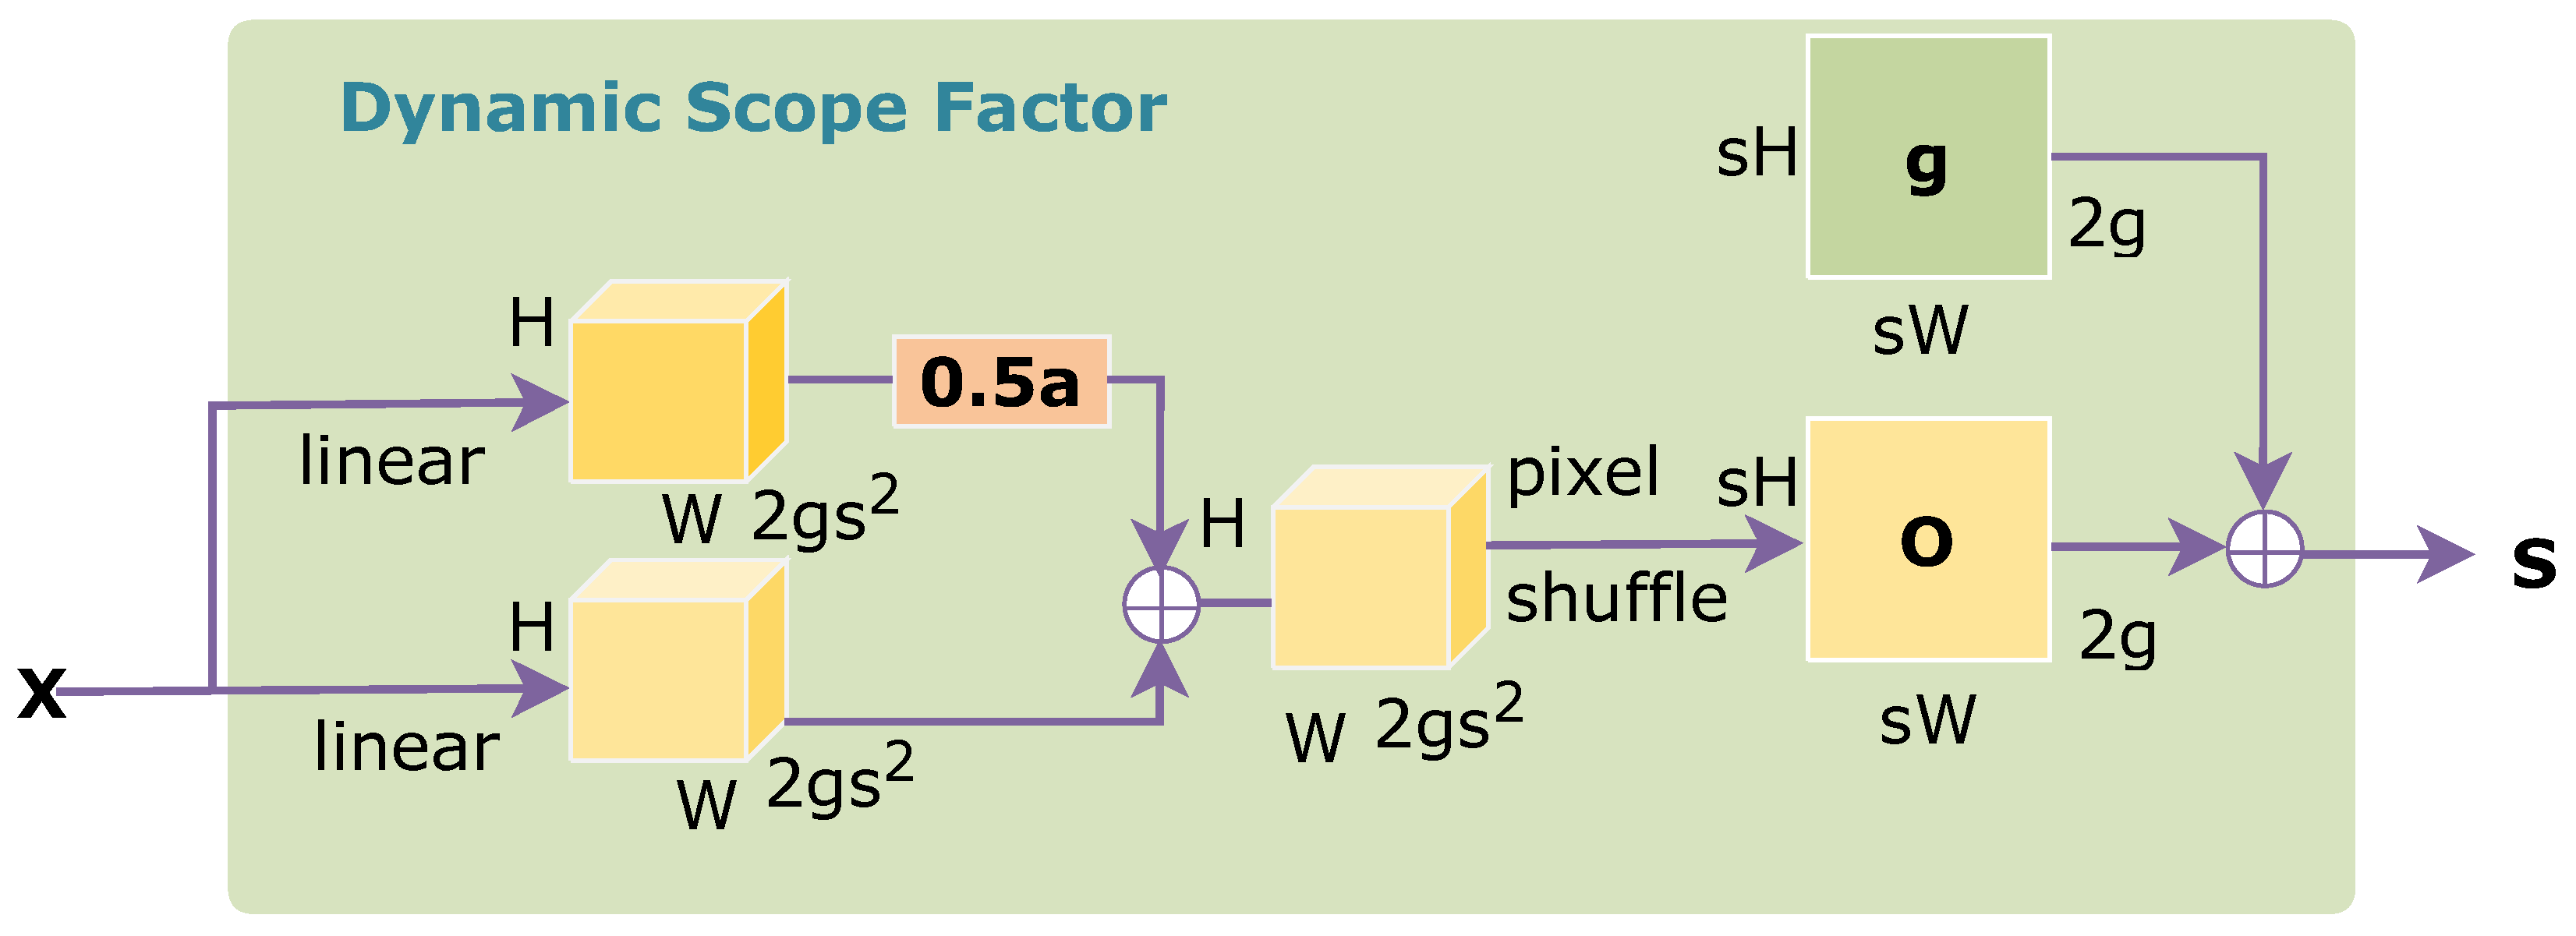
 - To mitigate performance degradation in pedestrian detection caused by severe occlusion in high-density urban street scenarios, a DySample [30] is incorporated into the detection head of YOLOv11, as depicted in Figure 8. In contrast to conventional dynamic convolution methods (e.g., CARAFE, FADE), which rely on dynamic kernels to generate sub-networks, DySample operates through a point-based sampling strategy. Its core mechanism involves decomposing a single point in the input feature map into multiple sampling points. Initially, sampling positions are separated via bilinear initialization. Content-aware offsets are then generated to reconstruct the sampling grid, and standard bilinear interpolation is applied for feature resampling. The dynamic behavior arises from the input-dependent prediction of sampling offsets, eliminating the need for dynamic convolution kernels and requiring only a lightweight coordinate offset prediction module. Sparsity is achieved by locally constraining the offset range, which prevents boundary artifacts caused by overlapping sampling points and effectively mitigates feature loss due to motion blur and occlusion. This lightweight architecture offers a practical solution for continuous street vitality monitoring in complex urban environments.
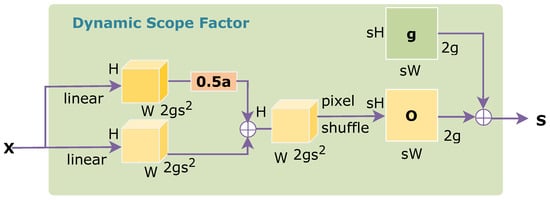 Figure 8. DySample network architecture.
3.3. Construction of a Built Environment Indicator System
A quantitative indicator system was constructed from two dimensions to assess street vitality: external representation and intrinsic composition [31].
- Quantification Method for External Representation of Vitality
- Instantaneous vitality intensity provides a dynamic characterization of street space vitality from the perspective of temporal slices. It refers to the relative density of people present in a street space at a given moment, denoted as Vi.
- The average vitality intensity represents the average level of street space vitality over a 24 h period. The calculation formula is as follows:In the formula, denotes the average vitality intensity value of the street; i represents different time intervals within a given day, where ; and n indicates the number of time intervals included in the calculation.
- Quantification Method for Intrinsic Composition of VitalityIntrinsic composition indicators describe the physical and socio-economic attributes of the street itself. Specific definitions are provided in Table 2.
 Table 2. Built environment indicator system.
3.4. Standardization Framework for Multi-Source Heterogeneous Data and Spatiotemporal Coupling Modeling
This study aims to develop a multi-source spatial data-driven framework for the systematic quantification and comprehensive evaluation of street vitality. The research follows three core steps: First, based on a pre-established indicator system, multi-source spatiotemporal data within the study area are integrated, and the analysis extent and projected coordinate system are unified using the ArcGIS 10.8 platform to complete standardized data preprocessing and ensure spatial reference consistency. Subsequently, a spatial analysis model is constructed, with its core focusing on integrating multi-source data such as heatmaps and POIs to conduct a coupled assessment of the dynamic characteristics of street vitality and built environment elements [33]. Finally, spatial results are expressed and output.
3.4.1. Data Preprocessing and Standardization
All vector and raster data were spatially referenced and unified using the ArcGIS 10.8 platform. To eliminate the influences of varying measurement units and scales across different indicators and to ensure data comparability, all raw indicator values were normalized to the range [0, 1]. We applied the min-max normalization method, which uses the following formula:
In the formula, denotes the raw value of the j-th indicator for the i-th street, while and represent the minimum and maximum values of each indicator, respectively, used to define the value range for normalization.
Missing values resulting from incomplete street view image coverage were filled using the Inverse Distance Weighting (IDW) interpolation method.
3.4.2. Core Algorithms and Spatial Analysis Models
- Spatial Principal Component AnalysisTo reduce multicollinearity among indicators and objectively determine their weights, principal component analysis (PCA) was performed on the standardized multi-dimensional spatial data matrix [34]. Through linear transformation, the original correlated variables are converted into a set of uncorrelated principal components, each being a linear combination of the original variables:In the formula, denotes the weight of the j-th indicator in the k-th principal component, and represents the score of the k-th principal component.
- Comprehensive Environmental ScoreThis metric is used to represent the holistic performance of each spatial unit across multiple environmental factors.In the formula, denotes the principal component weight.
- Coordination DegreeThis metric is used to quantify the balance of development among various environmental elements within the system. A higher coordination degree indicates more synchronized development of the elements and less spatial fluctuation. Its calculation is based on the dispersion degree between the scores of each principal component and their average score:In the formula, denotes the coordination degree of the i-th spatial unit, represents the score value of the k-th principal component for the i-th spatial unit, and signifies the mean value of the m principal component scores within the i-th spatial unit.
3.4.3. Spatial Output and Result Presentation
- On the ArcGIS platform, the Jenks Natural Breaks method was employed to classify the comprehensive score (T) and the coordination degree (C). This classification method determines intervals based on the inherent statistical distribution characteristics of the data, aiming to maximize differences between classes while minimizing variances within each class. Consequently, the generated visual products, such as spatial distribution maps and spatiotemporal change sequence diagrams, can most intuitively reveal the underlying patterns of the urban spatial structure. The specific spatial distribution results of the coupling analysis are detailed in Table 3.
 Table 3. Total variance explained.
 - Principal component analysis was conducted on the standardized street vitality and environmental indicators using SPSS software (SPSS Statistics 27.0.1). Based on the rotated component matrix, the weights of the main factors were obtained, and then the comprehensive score of each street was calculated, as shown in Table 4.
 Table 4. Composite scores of selected streets.
4. Results and Analysis
4.1. Model Performance Evaluation
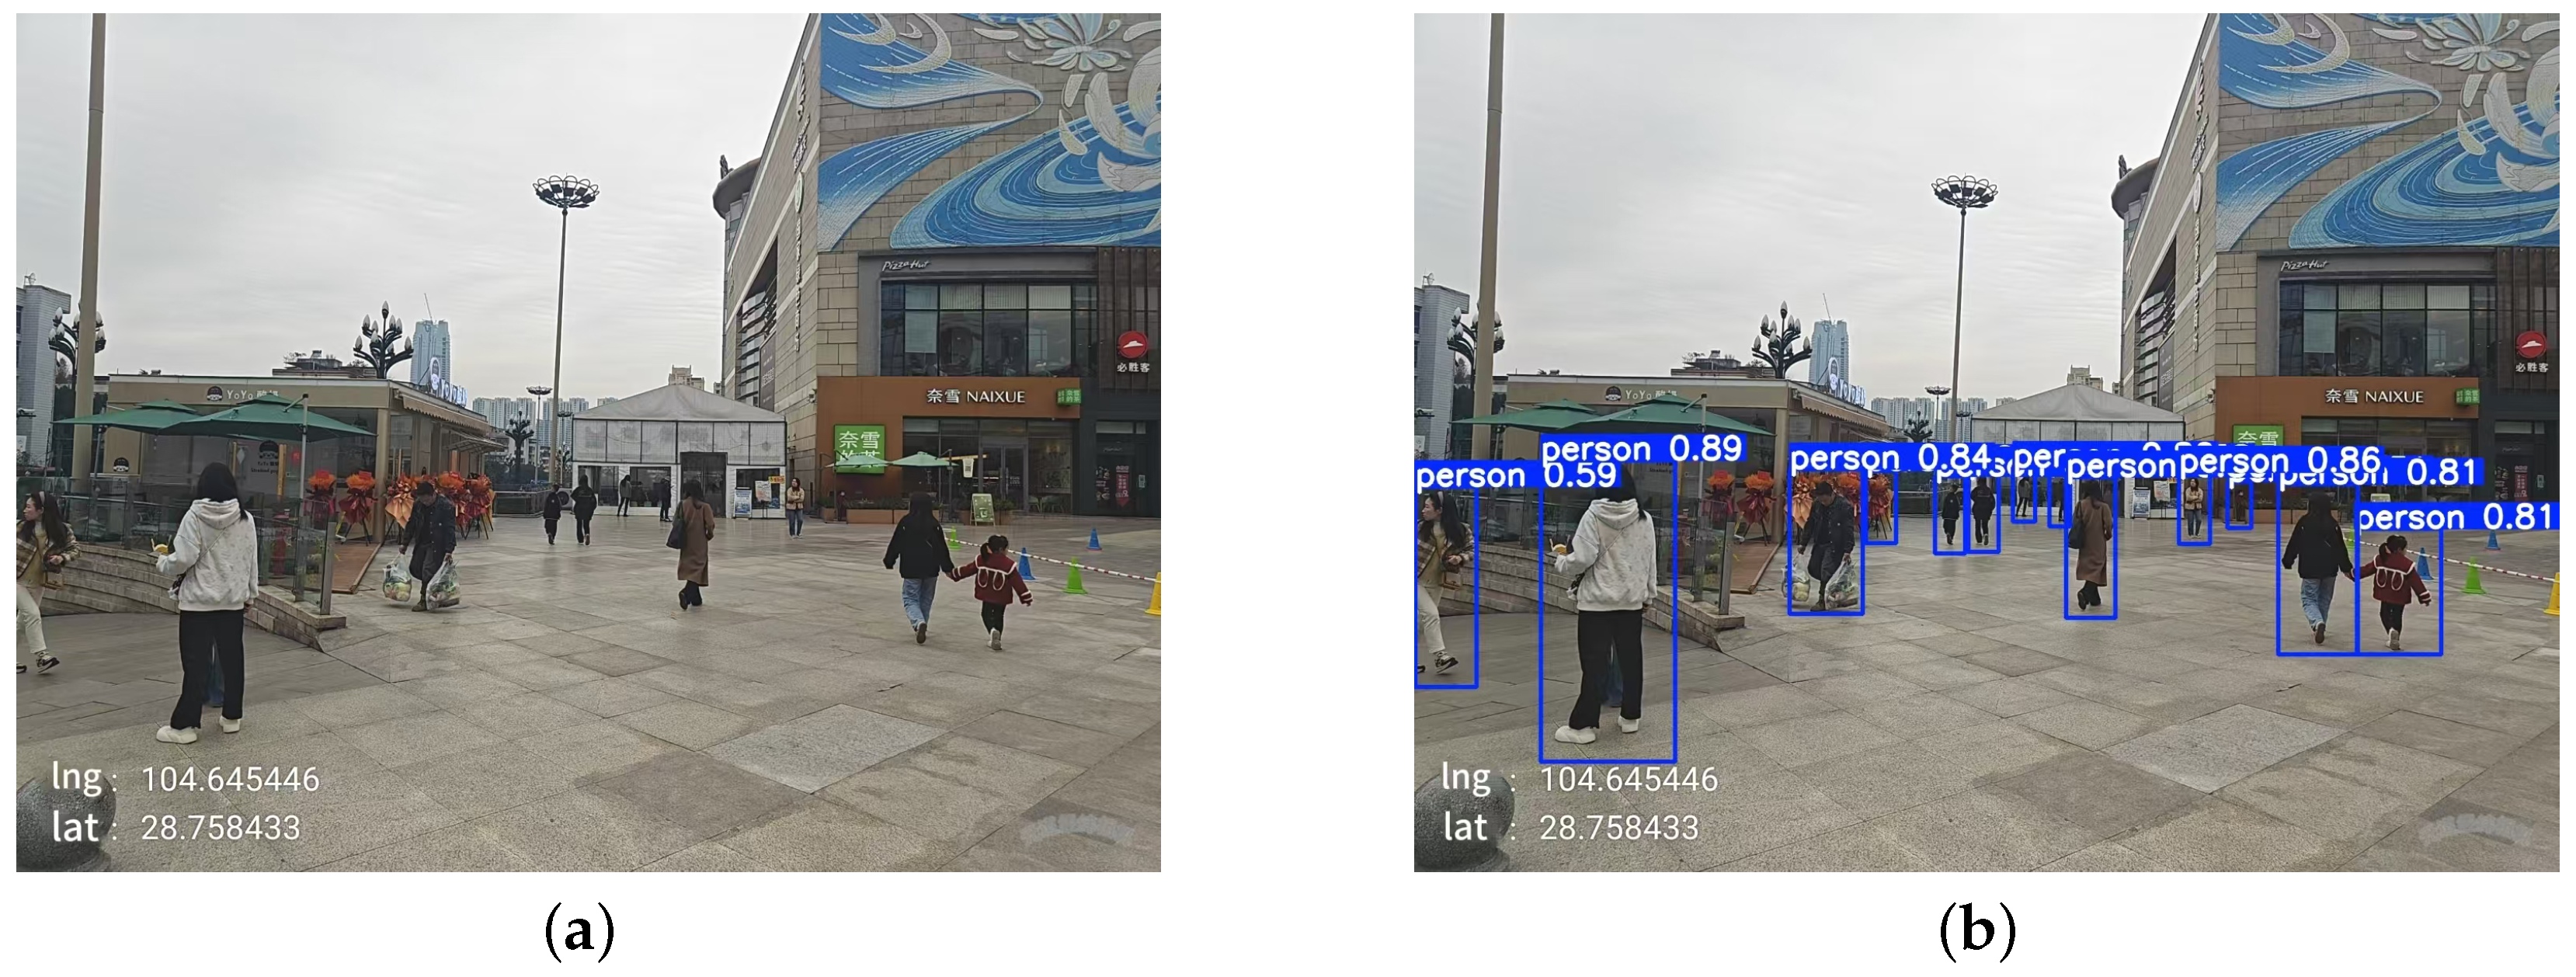
Building upon the established research foundation, this study employs precision, recall, and mAP@50 (mean average precision at 50% intersection over union) as core evaluation metrics [35]. The enhanced YOLOv11 architecture achieves significant performance gains, attaining 90.4% precision (+6.5%), 67.3% recall (+5.3%), and 77.2% mAP@50 (+5.1%) compared to the baseline model. For pedestrian detection in street imagery, the optimized model demonstrates robust recognition capabilities. Figure 9 juxtaposes original street scenes with corresponding detection outputs, qualitatively validating the model’s efficacy in real-world urban environments.
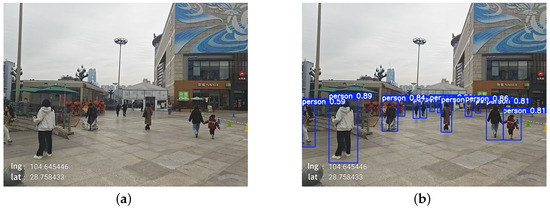
Figure 9.
Pedestrian detection: (a) original image; (b) resulting image.
4.1.1. Ablation Experiment
This study employs systematic ablation experiments to comprehensively evaluate the performance of an enhanced YOLOv11 architecture. As shown in Table 5, using the standard YOLOv11 model as a baseline—which achieved 83.9% precision, 62.0% recall, and 72.1% mAP@50 while demonstrating stable detection capabilities yet significant shortcomings in small-target recognition within complex scenarios—we incrementally integrated three novel modules: two-backbone networks, SPDConv, and DySample. Performance impacts were rigorously quantified using our own urban imagery dataset.

Table 5.
Performance comparison of different YOLOv11 model variants.
The two-backbone module substantially elevated performance to 86.9% precision, 66.9% recall, and 76.2% mAP@50, corresponding to absolute improvements of 3.0%, 4.9%, and 4.1%, respectively. These gains validate its efficacy in enhancing multi-scale feature fusion and contextual information extraction. Subsequent integration of SPDConv yielded 86.3% precision, 65.6% recall, and 74.8% mAP@50, with improvements of 2.4%, 3.6%, and 2.7%. Notably, this module maintained computational efficiency through lightweight architectural design despite modest metric enhancements.
The DySample mechanism exhibited distinctive characteristics, achieving a peak precision of 87.3% with a 3.4% absolute gain while attaining 63.8% recall, reflecting a 1.8% improvement. This indicates optimized feature extraction capabilities with minor trade-offs in boundary target detection accuracy. Synergistic module combinations revealed complementary advantages: the two-backbone network with SPDConv elevated performance to 88.5% precision, 67.1% recall, and 76.3% mAP@50. Crucially, the fully integrated architecture achieved the best performance in our experimental evaluation on the proprietary urban imagery dataset, with results of 90.4% precision, 67.3% recall, and 77.2% mAP@50, representing comprehensive improvements of 6.5%, 5.3%, and 5.1% over the baseline model.
These findings empirically validate both individual module efficacy and the holistic architecture’s superiority in enhancing small-target detection precision and complex scenario adaptability. The ablation study establishes a robust theoretical foundation for model optimization while providing actionable guidance for practical implementations in urban sensing applications.
4.1.2. Comparative Experiment
This study systematically validates the performance advantages of the YOLOv11 model through rigorous comparative experiments. Under identical experimental conditions and parameter settings, we conducted comprehensive benchmarking against leading object detection architectures including YOLOv8, YOLOv6, YOLO10n, and YOLO3-tiny.
As quantified in Table 6, YOLOv11 demonstrates significant superiority across multiple key metrics. The model achieves 83.9% precision, 62.0% recall, and 72.1% mAP@50, exhibiting exceptional performance in localization accuracy and false-positive suppression. The analysis reveals, however, that the model maintains potential for improvement in small-target detection and occlusion handling within complex scenarios.

Table 6.
Performance comparison of different algorithms.
Comparative evaluation reveals distinct performance characteristics: YOLOv8 achieves a higher recall of 64.0% but lags in precision at 82.8% and mAP@50 at 71.7%, indicating limitations in precise localization. YOLOv6 exhibits the weakest performance with 81.7% precision, 60.0% recall, and 70.3% mAP@50, demonstrating notable deficiencies in detecting small and occluded targets. YOLO10n shows comparable performance to YOLOv8 but underperforms relative to YOLOv11 in both recall and mAP@50, suggesting inferior generalization capability. YOLO3-tiny trails behind slightly with 81.0% precision, 59.9% recall, and 66.4% mAP@50, particularly evidenced by its 5.7 percentage-point deficit in mAP@50 relative to YOLOv11, confirming poor adaptability to the studied environments.
Notably, YOLOv11 achieves an average 3.5 percentage-point improvement in mAP@50 over comparative models while maintaining competitive recall rates. The architecture demonstrates marked superiority in multi-scale target detection within complex scenarios, providing a robust solution for high-precision applications while establishing clear pathways for future optimization.
4.2. Spatial Distribution of Street Vitality
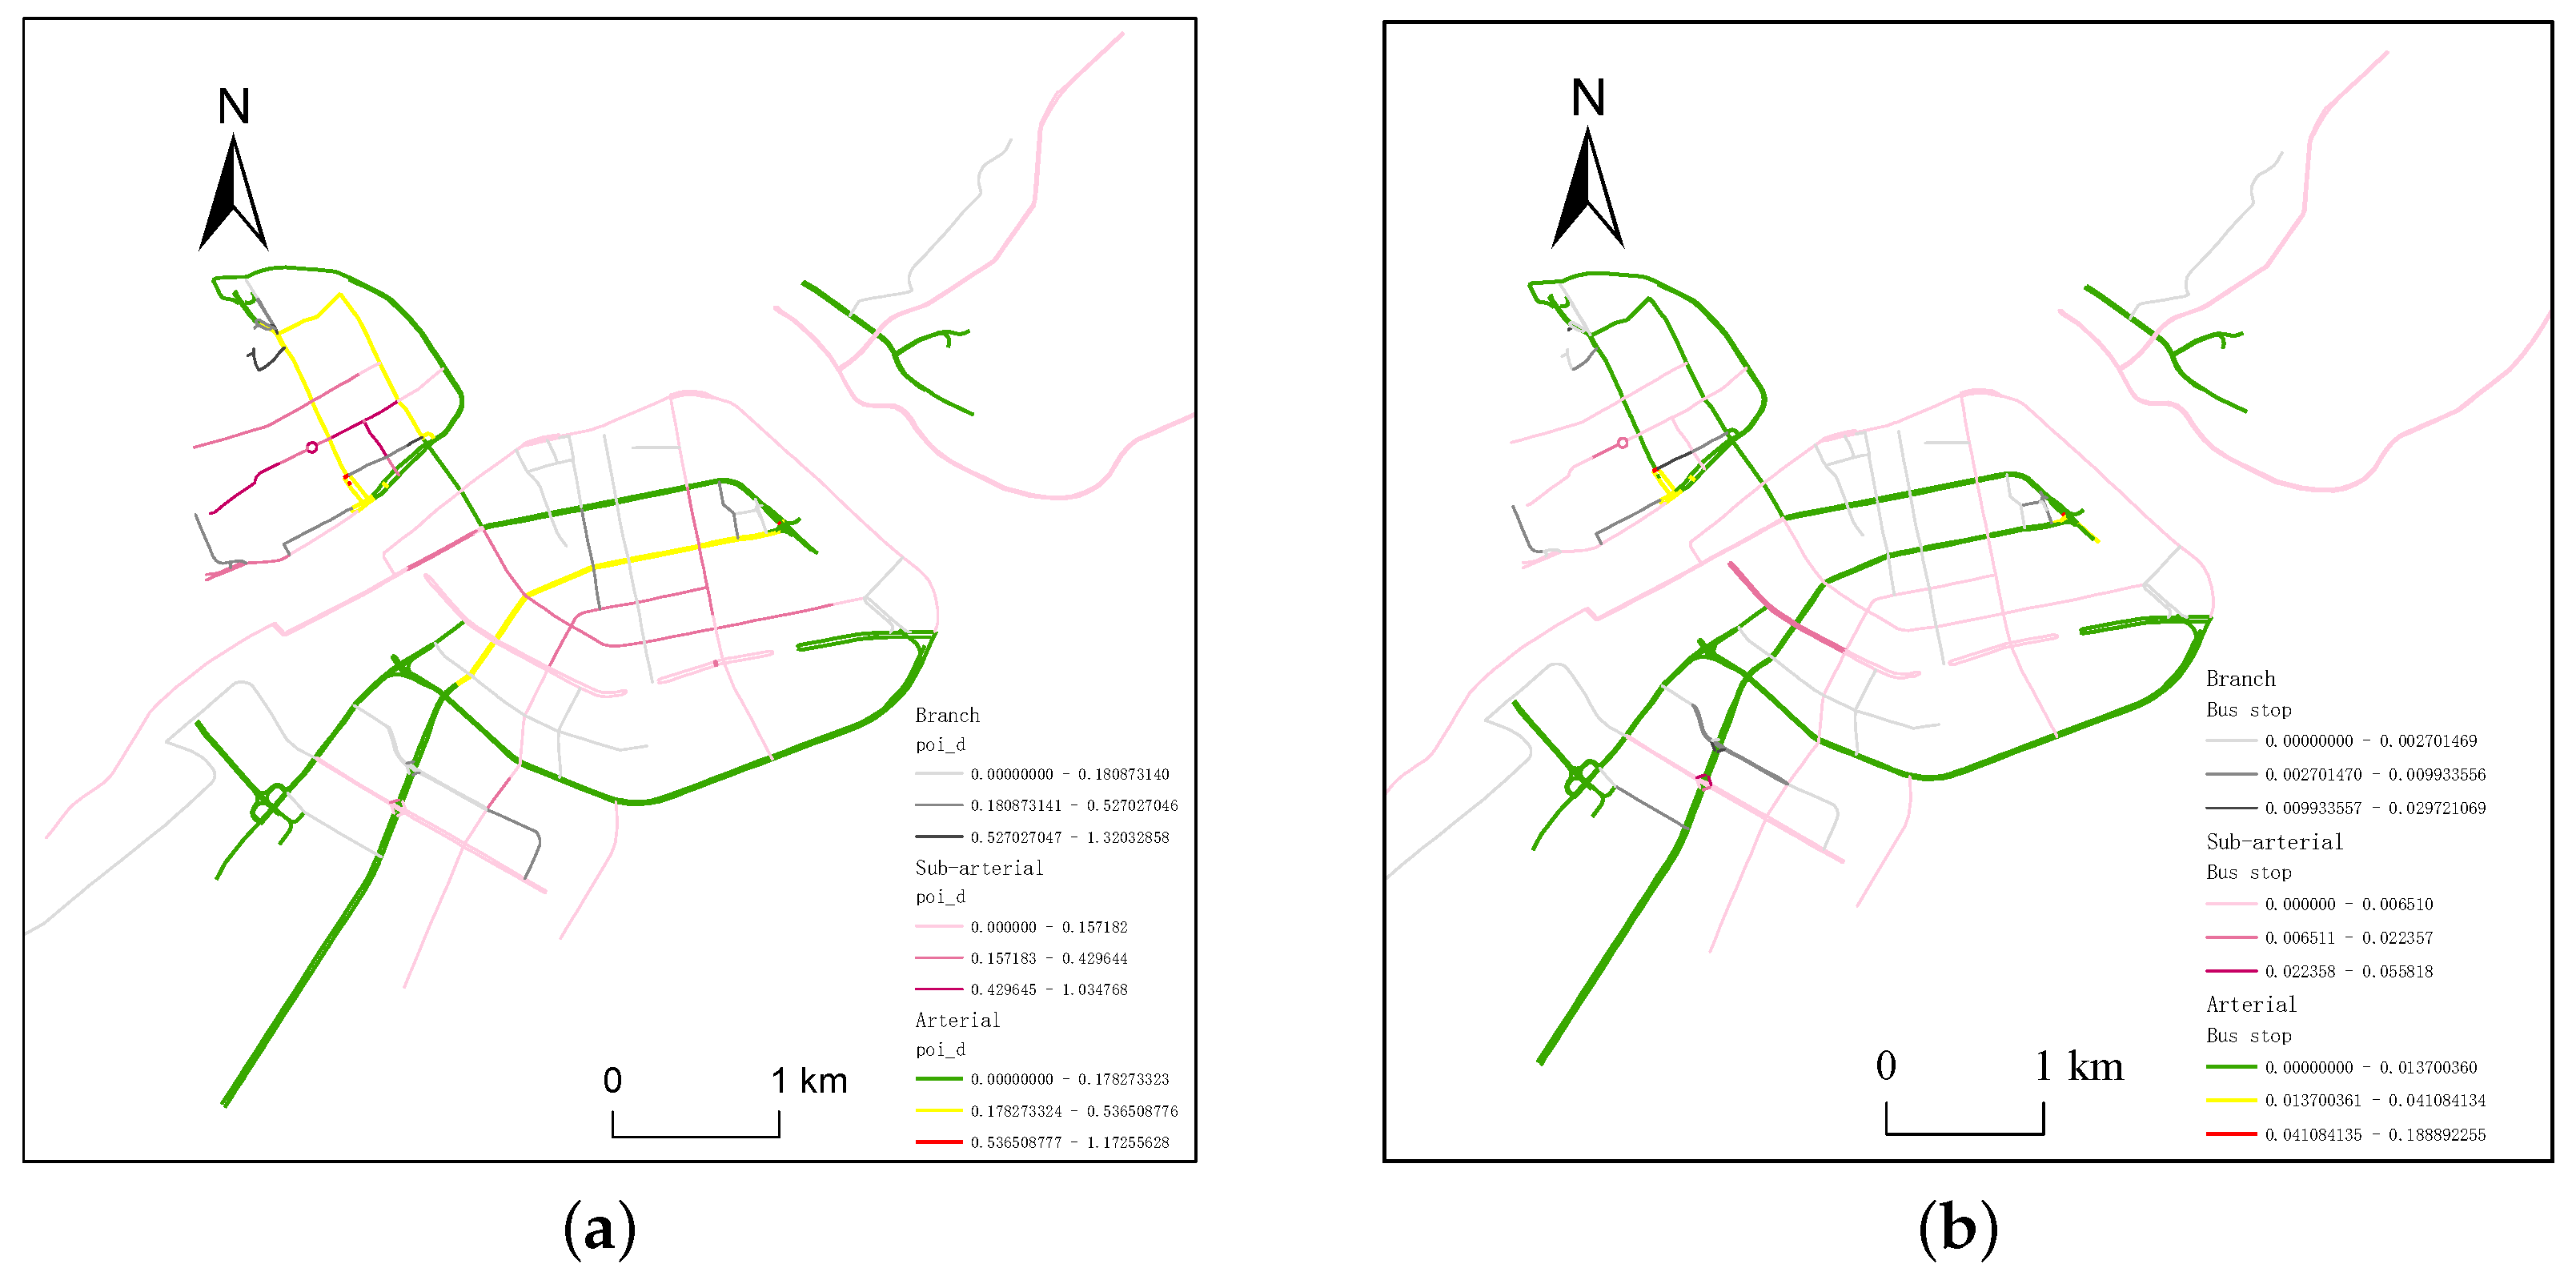
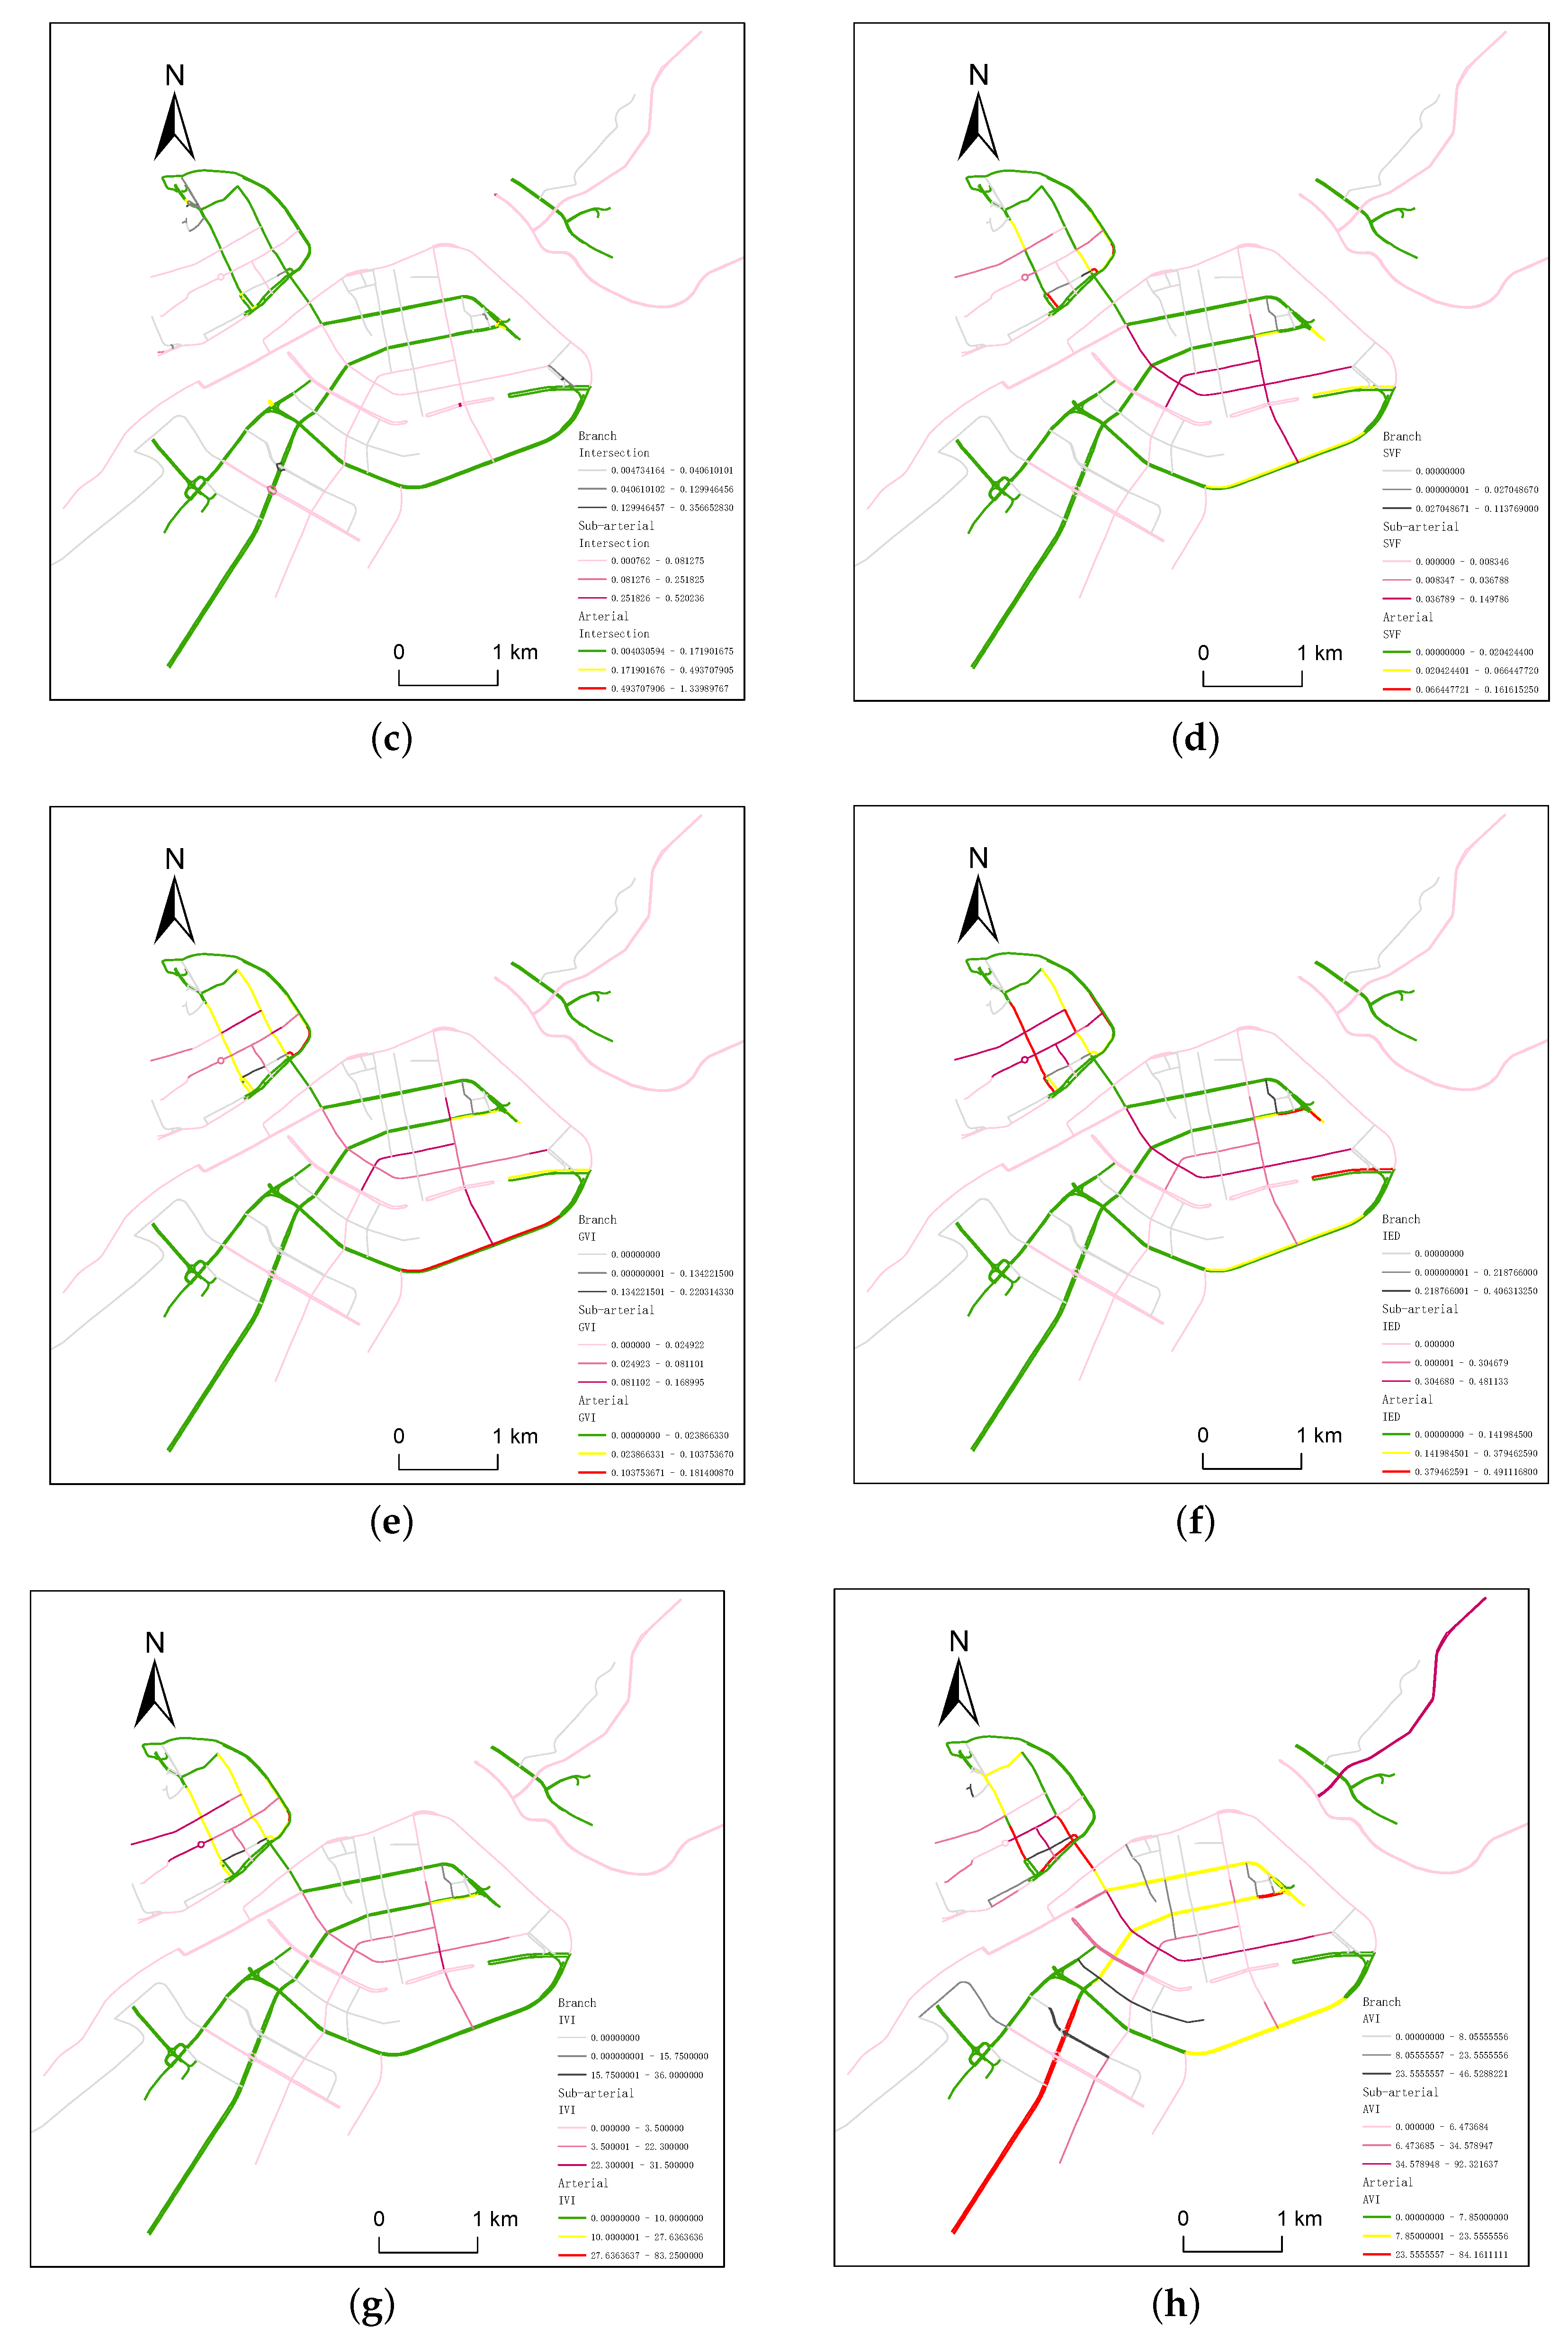
Building on high-precision detection results, this research analyzes street vitality distribution patterns in Yibin City using an integrated spatiotemporal analytical framework. By synthesizing multi-source datasets—encompassing Baidu heatmaps, street view imagery, and POI density—within a unified coupling architecture, the study systematically captures both the spatial heterogeneity and temporal dynamics of urban vitality. The spatial distribution of key influencing factors, including instantaneous vitality intensity, mean vitality intensity, POI density, bus stop density, and Green View Index, is visually summarized in Figure 10.
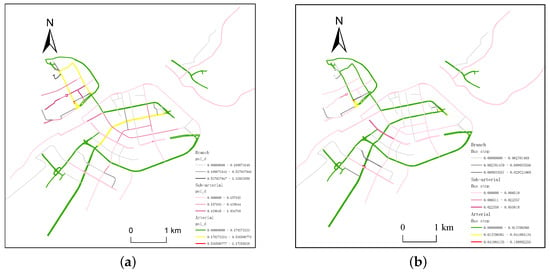
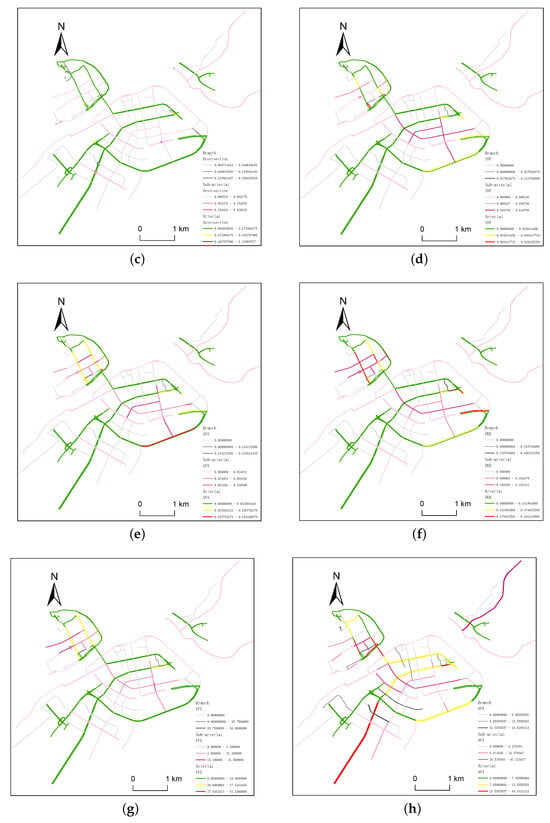
Figure 10.
Spatial distribution of various influencing factors: (a) POI density; (b) bus stop density; (c) intersection density; (d) sky openness; (e) Green View Index; (f) interface enclosure degree; (g) instantaneous vitality intensity; and (h) average vitality intensity.
The analysis reveals distinct spatial differentiation, with the POI of Cuiping District’s core commercial corridor showing high-density POI clustering and a concentrated bus stop distribution, indicating a strong positive correlation between commercial service accessibility and enhanced vitality. In contrast, urban fringe areas exhibit lower vitality metrics despite higher environmental indicators such as the Green View Index, a pattern attributed to sparse infrastructure. This spatial stratification empirically confirms the close relationship between functional business agglomeration and vitality intensity, as commercial clusters consistently align with human activity hotspots that correspond topographically to high-density zones in thermal imagery.
4.3. Results of the Spatiotemporal Coupling Model
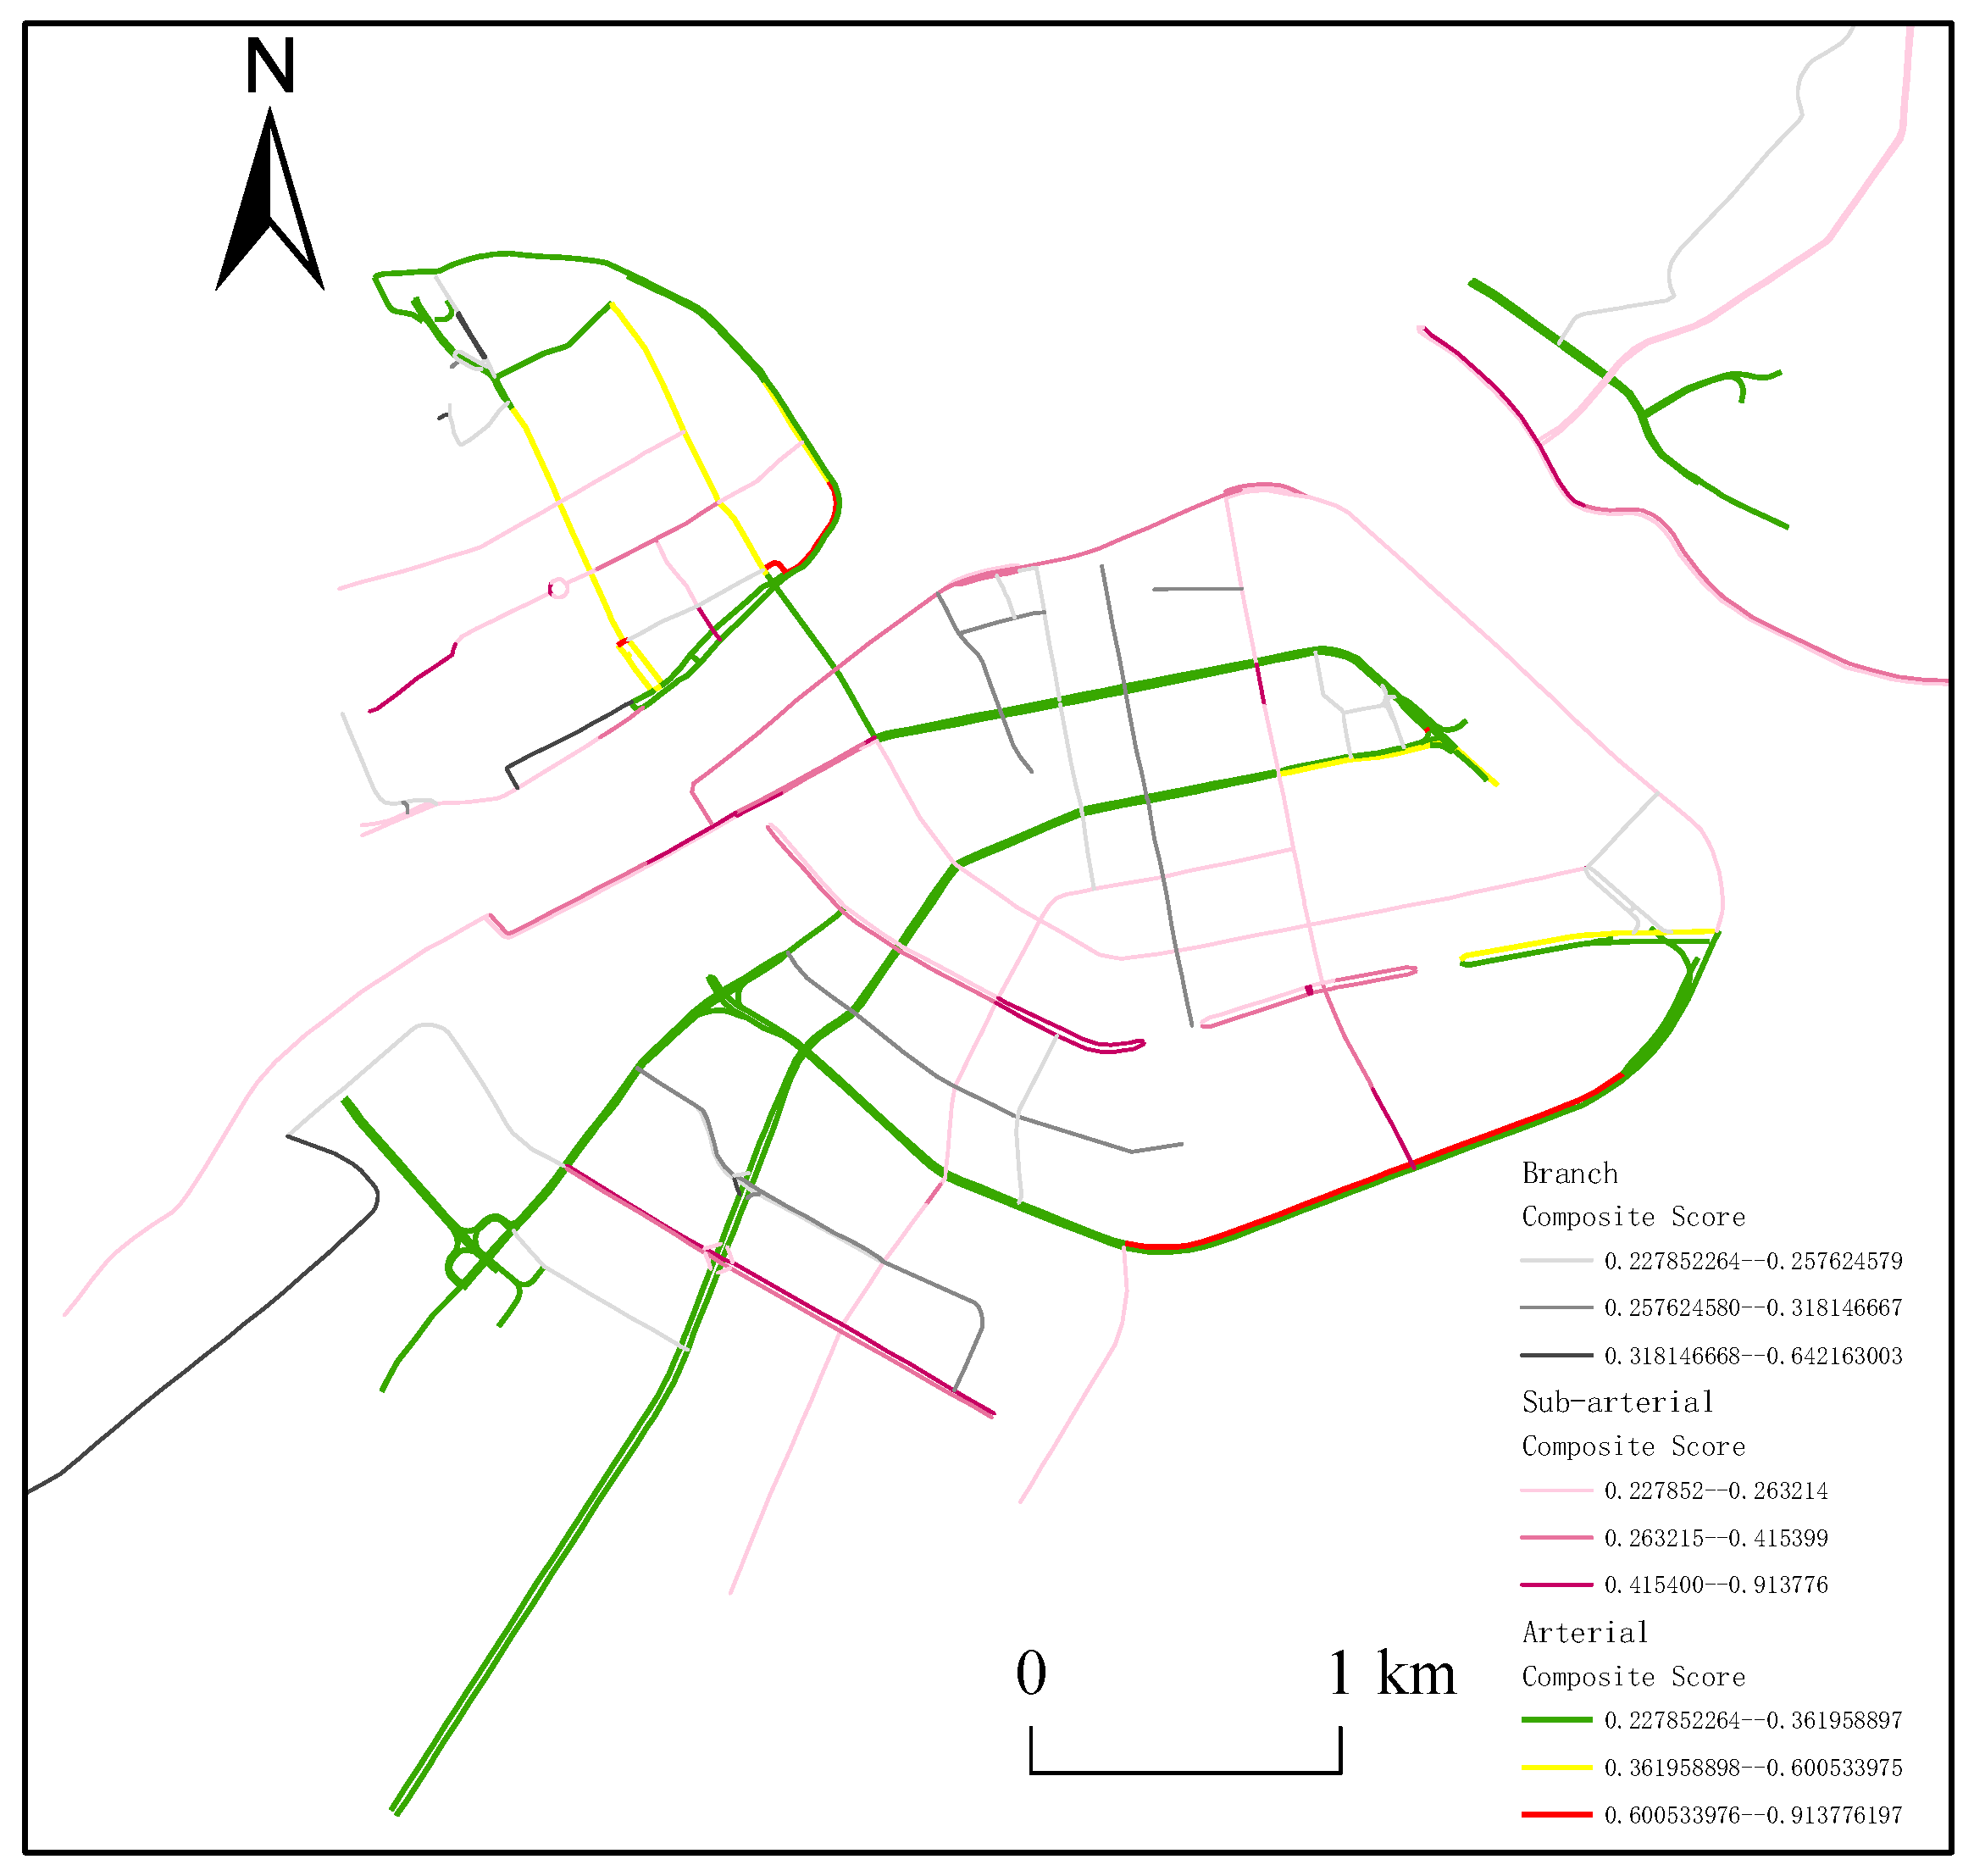
Derived from principal component analysis [36], the composite vitality scores for each street integrate both extrinsic manifestations and intrinsic components of urban vitality. These scores display clear spatial autocorrelation, as shown in Figure 11. High-scoring clusters are mainly located along arterial roads in Xuzhou District and within historic blocks of Cuiping District, reflecting strong commercial activity, improved environmental comfort, and diverse functions. In contrast, streets with lower scores are largely found in emerging and industrial areas, exhibiting a spatiotemporal mismatch where high POI density coincides with low vitality—likely due to traffic congestion or inadequate green infrastructure.
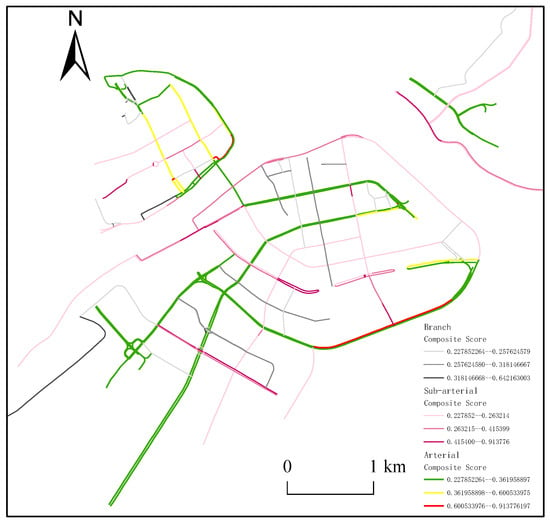
Figure 11.
Street comprehensive score.
This contrast empirically confirms a nonlinear spatiotemporal coupling relationship between built environment features and vitality dynamics. Spatial correlation analysis further verifies a strong association between commercial POI kernel density and heatmap distribution patterns. Importantly, pedestrian network optimization is key to enhancing permeability in low-vitality areas, while high-coupling zones demonstrate effective synergy between spatial carriers and vitality mechanisms. Overall, street vitality stems from the synergy of functional mix, traffic efficiency, and environmental quality, providing an empirical basis for evidence-based urban renewal strategies through score-based spatial stratification.
5. Conclusions
This study developed an improved YOLOv11 model integrated into a multi-source data fusion framework to comprehensively evaluate street vitality by analyzing pedestrian detection results and multi-source geographic data. Empirical research conducted in Yibin City demonstrates that the framework exhibits strong generalizability and scalability, allowing it to adapt to urban environments of varying scales and forms. Its core advantages lie in its modular model architecture and open, compatible data framework. The improved YOLOv11 model innovatively incorporates three key modules: a dual-backbone network, SPDConv, and DySample. The parameters and structure of these modules can be flexibly adjusted according to the typical characteristics of different cities. This modular design not only enhances model performance but also enables dynamic application potential.
This study employed precision, recall, and mAP@50 as core evaluation metrics. The enhanced YOLOv11 architecture achieved significant performance improvements, reaching 90.4% precision, 67.3% recall, and 77.2% mAP@50. Compared to the study by Li et al. [26], which used an improved YOLOv5 model to achieve approximately 74% mAP@50 on similar street view datasets, our model demonstrated superior performance, particularly in handling complex urban scenes and occlusions. In contrast to studies relying on single sensors or fixed-parameter models [19,22], our approach significantly improves the handling of occlusion issues in high-density urban environments through multi-source data fusion and an adjustable architecture.
By integrating edge computing and cloud computing technologies, this study enables dynamic monitoring of street vitality at the district level, providing technical support for adaptive urban management. In terms of computational feasibility, the system’s main resource demand occurs during the GPU-dependent model training phase. In deployment, an edge-cloud architecture processes compute-intensive tasks locally on municipal cameras, transmitting only metadata to the cloud to minimize bandwidth requirements. Although initial investment in edge devices is required, the modular design and open data framework ensure scalable long-term operation, making district-level vitality monitoring practical without persistent reliance on high-performance computing infrastructure.
Based on high-precision detection results, this study analyzed the spatial distribution patterns of street vitality in the central urban area of Yibin City. The analysis revealed that the core commercial corridor in Cuiping District exhibits high-density POI clustering and a concentrated bus stop distribution, which strongly correlates with high vitality intensity. This finding aligns with studies by Xia et al. [31] and Jiang et al. [34] in multiple large Chinese cities, confirming that the accessibility of commercial facilities and the functional mix are key drivers of street vitality. Furthermore, this study uncovered a critical phenomenon in Yibin, a medium-sized city: urban fringe areas exhibit low street vitality despite having high environmental quality indicators (e.g., Green View Index). This “spatial mismatch” suggests that merely improving environmental quality without the necessary infrastructure support (e.g., commercial services and public transportation) is insufficient to stimulate vitality. This contrasts with the “green space premium” effect often observed in megacities, highlighting the uniqueness of vitality drivers in small and medium-sized cities.
The data sources used in this study—such as OSM road networks, heatmaps, POIs, and street view images—are widely accessible across the country, and the standardized data processing workflow ensures the reproducibility of the method in other cities. The framework demonstrates broad applicability: it can identify vitality “dead zones” in high-density megacities to inform urban renewal; balance conservation and development in historic cities; dynamically evaluate planning outcomes in emerging development zones; and guide the layout of recreational spaces in small and medium-sized livable cities.
This study has several limitations. First, the current data collection period (48 h) lacks sufficient temporal duration to adequately capture periodic fluctuations in street vitality. Second, the model’s adaptability under extreme weather conditions requires further validation. Additionally, potential delays in POI data updates may impact the timeliness of assessments. These limitations indicate important directions for future research, including extending the monitoring timeframe, optimizing model adaptability, and establishing dynamic data update mechanisms.
In summary, the complete methodological system established in this study provides a replicable technical tool for scientifically understanding street vitality and precisely optimizing spatial quality. It offers continuous data support and a decision-making basis for urban planning and construction across different cities, contributing significantly to the advancement of people-oriented urban development. In the future, this technical framework is expected to play an increasingly important role in smart city construction and refined urban governance.
Author Contributions
Conceptualization, C.H., W.L. and Y.Z.; methodology, W.L.; software, W.L.; validation, W.L.; formal analysis, C.H. and Y.Z.; investigation, W.L.; resources, W.L. and C.H.; data curation, W.L.; writing—original draft preparation, W.L.; writing—review and editing, C.H. and Y.Z.; visualization, W.L.; supervision, C.H.; project administration, C.H. and Y.Z.; funding acquisition, C.H. All authors have read and agreed to the published version of the manuscript.
Funding
This research was supported by the National Natural Science Foundation of China (Grant No. 42471437), the Sichuan Provincial Research Base of Intelligent Tourism (Sichuan University of Science and Engineering) (Grant No. ZHZJ24-02), and the Graduate Innovation Fund of Sichuan University of Science and Engineering (Grant No. Y2024126).
Institutional Review Board Statement
Not applicable.
Informed Consent Statement
Not applicable.
Data Availability Statement
The datasets can be provided by the corresponding author upon reasonable request.
Acknowledgments
The authors would like to express their heartfelt gratitude to those people who have helped with this manuscript and to the reviewers for their comments on the manuscript.
Conflicts of Interest
The authors declare no conflicts of interest.
References
- Ji, D.; Tian, J.; Zhang, J.; Zeng, J.; Namaiti, A. Identification and Spatiotemporal Evolution Analysis of the Urban–Rural Fringe in Polycentric Cities Based on K-Means Clustering and Multi-Source Data: A Case Study of Chengdu City. Land 2024, 13, 1727. [Google Scholar] [CrossRef]
- Xia, C.; Zhang, A.; Yeh, A.G. The varying relationships between multidimensional urban form and urban vitality in Chinese megacities: Insights from a comparative analysis. Ann. Am. Assoc. Geogr. 2022, 112, 141–166. [Google Scholar] [CrossRef]
- Chen, H.; Ge, J.; He, W. Quantifying Urban Vitality in Guangzhou Through Multi-Source Data: A Comprehensive Analysis of Land Use Change, Streetscape Elements, POI Distribution, and Smartphone-GPS Data. Land 2025, 14, 1309. [Google Scholar] [CrossRef]
- Choi, M.J.; Kim, Y.-j. Planning paradigm shift in the era of transition from urban development to management: The case of Korea. In Urban Planning Education: Beginnings, Global Movement and Future Prospects; Springer: Berlin/Heidelberg, Germany, 2017; pp. 161–174. [Google Scholar]
- Zhan, D.; Kwan, M.P.; Zhang, W.; Fan, J.; Yu, J.; Dang, Y. Assessment and determinants of satisfaction with urban livability in China. Cities 2018, 79, 92–101. [Google Scholar] [CrossRef]
- Wei, H.; Li, L.; Nian, M. China’s urbanization strategy and policy during the 14th five-year plan period. Chin. J. Urban Environ. Stud. 2021, 9, 2150002. [Google Scholar] [CrossRef]
- Li, P.; Xu, Y.; Liu, Z.; Jiang, H.; Liu, A. Evaluation and Optimization of Urban Street Spatial Quality Based on Street View Images and Machine Learning: A Case Study of the Jinan Old City. Buildings 2025, 15, 1408. [Google Scholar] [CrossRef]
- Zarin, S.Z.; Niroomand, M.; Heidari, A.A. Physical and social aspects of vitality case study: Traditional street and modern street in Tehran. Procedia-Soc. Behav. Sci. 2015, 170, 659–668. [Google Scholar] [CrossRef]
- Kang, N.; Liu, C. Towards landscape visual quality evaluation: Methodologies, technologies, and recommendations. Ecol. Indic. 2022, 142, 109174. [Google Scholar] [CrossRef]
- Milias, V.; Sharifi Noorian, S.; Bozzon, A.; Psyllidis, A. Is it safe to be attractive? Disentangling the influence of streetscape features on the perceived safety and attractiveness of city streets. AGILE GIScience Ser. 2023, 4, 8. [Google Scholar] [CrossRef]
- Chen, X.; Zhang, L.; Zhao, Z.; Zhang, F.; Liu, S.; Long, Y. Characterizing and Measuring the Environmental Amenities of Urban Recreation Leisure Regions Based on Image and Text Fusion Perception: A Case Study of Nanjing, China. Land 2023, 12, 1998. [Google Scholar] [CrossRef]
- Liang, H.; Zhang, J.; Li, Y.; Zhu, Z.; Wang, B. Automatic estimation for visual quality changes of street space via street-view images and multimodal large language models. IEEE Access 2023, 12, 87713–87727. [Google Scholar] [CrossRef]
- Jin, A.; Ge, Y.; Zhang, S. Spatial characteristics of multidimensional urban vitality and its impact mechanisms by the built environment. Land 2024, 13, 991. [Google Scholar] [CrossRef]
- Li, X.; Kozlowski, M.; Salih, S.A.; Ismail, S.B. Evaluating the vitality of urban public spaces: Perspectives on crowd activity and built environment. Archnet-IJAR Int. J. Archit. Res. 2024, 19, 562–583. [Google Scholar] [CrossRef]
- Liu, W.; Yang, Z.; Gui, C.; Li, G.; Xu, H. Investigating the Nonlinear Relationship Between the Built Environment and Urban Vitality Based on Multi-Source Data and Interpretable Machine Learning. Buildings 2025, 15, 1414. [Google Scholar] [CrossRef]
- Xie, Y.; Zhang, J.; Li, Y.; Zhu, Z.; Deng, J.; Li, Z. Integrating multi-source urban data with interpretable machine learning for uncovering the multidimensional drivers of urban vitality. Land 2024, 13, 2028. [Google Scholar] [CrossRef]
- Ma, Z. Deep exploration of street view features for identifying urban vitality: A case study of Qingdao city. Int. J. Appl. Earth Obs. Geoinf. 2023, 123, 103476. [Google Scholar] [CrossRef]
- Guo, X.; Chen, H.; Yang, X. An evaluation of street dynamic vitality and its influential factors based on multi-source big data. ISPRS Int. J. Geo-Inf. 2021, 10, 143. [Google Scholar] [CrossRef]
- Liu, S.; Zhang, L.; Long, Y.; Long, Y.; Xu, M. A new urban vitality analysis and evaluation framework based on human activity modeling using multi-source big data. ISPRS Int. J. Geo-Inf. 2020, 9, 617. [Google Scholar] [CrossRef]
- Li, Q.; Cui, C.; Liu, F.; Wu, Q.; Run, Y.; Han, Z. Multidimensional urban vitality on streets: Spatial patterns and influence factor identification using multisource urban data. ISPRS Int. J. Geo-Inf. 2021, 11, 2. [Google Scholar] [CrossRef]
- Nikpour, A.; Yarahmadi, M. Recognizing the components of street vitality as promoting the quality of social life in small urban spaces Case study: Chamran Street, Shiraz. Sustain. City 2020, 3, 41–54. [Google Scholar]
- Wu, W.; Niu, X. Influence of built environment on urban vitality: Case study of Shanghai using mobile phone location data. J. Urban Plan. Dev. 2019, 145, 04019007. [Google Scholar] [CrossRef]
- Wu, W.; Niu, X.; Li, M. Influence of built environment on street vitality: A case study of West Nanjing Road in Shanghai based on mobile location data. Sustainability 2021, 13, 1840. [Google Scholar] [CrossRef]
- Wangbao, L. Spatial impact of the built environment on street vitality: A case study of the Tianhe District, Guangzhou. Front. Environ. Sci. 2022, 10, 966562. [Google Scholar] [CrossRef]
- Yu, B.; Sun, J.; Wang, Z.; Jin, S. Influencing factors of street vitality in historic districts based on multisource data: Evidence from China. ISPRS Int. J. Geo-Inf. 2024, 13, 277. [Google Scholar] [CrossRef]
- Li, Y.; Yabuki, N.; Fukuda, T. Exploring the association between street built environment and street vitality using deep learning methods. Sustain. Cities Soc. 2022, 79, 103656. [Google Scholar] [CrossRef]
- Chen, L.; Jiang, X.; Tan, L.; Chen, C.; Yang, S.; You, W. Analysis of Spatial Vitality Characteristics and Influencing Factors of Old Neighborhoods: A Case Study of Ya’an Xicheng Neighborhood. Buildings 2024, 14, 3348. [Google Scholar] [CrossRef]
- He, L.-h.; Zhou, Y.-z.; Liu, L.; Cao, W.; Ma, J.-h. Research on object detection and recognition in remote sensing images based on YOLOv11. Sci. Rep. 2025, 15, 14032. [Google Scholar] [CrossRef] [PubMed]
- Yang, Z.; Wu, Q.; Zhang, F.; Zhang, X.; Chen, X.; Gao, Y. A new semantic segmentation method for remote sensing images integrating coordinate attention and SPD-Conv. Symmetry 2023, 15, 1037. [Google Scholar] [CrossRef]
- Xi, Y.; Qu, D.; Du, L. DDM-YOLOv8s for Small Object Detection in Remote Sensing Images. In Proceedings of the 2024 7th International Conference on Machine Learning and Natural Language Processing (MLNLP), Chengdu, China, 18–20 October 2024; IEEE: New York, NY, USA, 2024; pp. 1–7. [Google Scholar]
- Xia, C.; Yeh, A.G.O.; Zhang, A. Analyzing spatial relationships between urban land use intensity and urban vitality at street block level: A case study of five Chinese megacities. Landsc. Urban Plan. 2020, 193, 103669. [Google Scholar] [CrossRef]
- Hua, C.; Lv, W. Optimizing Semantic Segmentation of Street Views with SP-UNet for Comprehensive Street Quality Evaluation. Sustainability 2025, 17, 1209. [Google Scholar] [CrossRef]
- Li, Z.; Zhao, G. Revealing the spatio-temporal heterogeneity of the association between the built environment and urban vitality in Shenzhen. ISPRS Int. J. Geo-Inf. 2023, 12, 433. [Google Scholar] [CrossRef]
- Jiang, Y.; Han, Y.; Liu, M.; Ye, Y. Street vitality and built environment features: A data-informed approach from fourteen Chinese cities. Sustain. Cities Soc. 2022, 79, 103724. [Google Scholar] [CrossRef]
- Zhang, R.; Lu, Y.; Song, Z. YOLO sparse training and model pruning for street view house numbers recognition. Proc. J. Phys. Conf. Ser. 2023, 2646, 012025. [Google Scholar] [CrossRef]
- Tan, Y.; Song, J.; Bai, Y. Exploring the relationship between built environment and multidimensional street market vitality: Insights from urban villages in Shenzhen using multi-source data. PLoS ONE 2025, 20, e0332905. [Google Scholar] [CrossRef] [PubMed]
Disclaimer/Publisher’s Note: The statements, opinions and data contained in all publications are solely those of the individual author(s) and contributor(s) and not of MDPI and/or the editor(s). MDPI and/or the editor(s) disclaim responsibility for any injury to people or property resulting from any ideas, methods, instructions or products referred to in the content. |
© 2025 by the authors. Licensee MDPI, Basel, Switzerland. This article is an open access article distributed under the terms and conditions of the Creative Commons Attribution (CC BY) license (https://creativecommons.org/licenses/by/4.0/).

