Article

Research on the Sustainable Indicator System for Multi-Coal Seam Mining: A Case Study of the Buertai Coal Mine in China

1
Key Laboratory of In-Situ Property Improving Mining of Ministry of Education, Taiyuan University of Technology, Taiyuan 030024, China
2
College of Mining Engineering, Taiyuan University of Technology, Taiyuan 030024, China
*
Author to whom correspondence should be addressed.
Sustainability 2025, 17(21), 9512; https://doi.org/10.3390/su17219512 (registering DOI)
Submission received: 10 September 2025 / Revised: 20 October 2025 / Accepted: 22 October 2025 / Published: 25 October 2025

Abstract

The extraction of multiple coal seams not only increases the risk of water inrush disasters in mines but also exacerbates the long-term depletion of groundwater, posing challenges for sustainable resource management in ecologically sensitive areas. This study utilizes the plastic damage–permeability coupling model in Abaqus CAE to analyze the impact of coal seam thickness and pillar layout on the evolution of the plastic zone and groundwater loss in the Shen Dong mining area, specifically at the Buertai coal mine. The results indicate that coal seam thickness is a strong driving factor for aquifer depletion: the water inflow under a 10 m thick coal seam is 1.56 times that under a 4 m thick coal seam. In contrast, the optimized staggered pillar layout alters stress distribution and reduces the water inflow under deeper coal seams by approximately 38%, demonstrating excellent water-saving potential. To translate these findings into a sustainability framework, this study proposes three new indicators: the Groundwater Loss Index (GLI) to quantify depletion intensity, the Aquifer Protection Efficiency (APE) to assess protection benefits, and the Sustainability Trade-off Index (STI) to balance coal recovery, safety, and groundwater protection. These metrics establish a dual-objective optimization approach that ensures safe mining and the sustainability of the aquifer. This study provides practical benchmarks for environmental impact assessment and aligns with the global sustainable development agenda, particularly the United Nations Sustainable Development Goals concerning clean water (SDG 6), responsible consumption (SDG 12), and terrestrial ecosystems (SDG 15). By incorporating groundwater protection into the design of the Buertai coal mine, this study advances the transition of multi-seam mining at Buertai from disaster prevention to sustainability orientation.

1. Introduction

As the cornerstone of the global energy system, the stable supply of coal is crucial for economic and social development, yet the environmental costs associated with its extraction, particularly the disruption to water resources, are increasingly raising concerns [1,2]. China’s main coal production regions are located in the central and western provinces (Shanxi, Shaanxi, Inner Mongolia, Ningxia, and Xinjiang), holding over 80% of the national coal reserves and contributing more than 70% of the coal output. However, these areas only account for 6.7% of the country’s total water resources and 0.3% of the global total [3,4,5,6]. Due to the shallow burial of coal seams, large thickness of coal seams, and thin overlying bedrock in the central and western regions, coal mining under these complex geological conditions can easily lead to significant environmental problems, posing a severe challenge to the ecological sustainability of the mining areas [7,8,9]. Especially in the case of multi-coal seam mining, the roof rock layers are subjected to repeated disturbances, significantly intensifying the movement and deformation of the overburden [10,11], which in turn forms a vertically extending water-conducting fracture zone, with a height and range far exceeding that of single seam mining. Once this fissure network is connected with the overlying aquifer, it will create a major pathway for underground water loss.
Research in different countries has explored the environmental and hydrological effects caused by multi-seam coal mining. South African scholars have pointed out that groundwater discharge due to mining can severely disrupt the balance of regional aquifers [12]; hydrogeological management must be integrated with engineering optimization to achieve sustainable mining [13,14,15]. This issue is particularly prominent in arid and semiarid mining areas where water resources are already scarce [16,17,18]. The continuous drainage of underground aquifers and the sharp drop in water levels can not only trigger geological disasters such as sudden inrushes in mines but also pose a serious threat to production safety [19]. More importantly, it will disrupt the balance of the region, threatening the stability of ecosystems that rely on groundwater [20]. Vegetation degradation, land desertification, and the sustainable use of regional water resources are all directly threatened by this. Therefore, how to maximize the reduction and effectively protect the valuable groundwater resources in mining areas while ensuring national energy security and promoting local economic development has become a core issue that green mine construction must address.
Existing research has achieved significant results in predicting the height of water-conducting fissure zones and in controlling water inrush. Scholars believe that coal seam thickness and the position of key strata are the dominant factors controlling the development of water-conducting fissure zones. The predictive model has been validated through theoretical derivations and methods such as on-site monitoring of borehole water levels, drilling fluid leakage, and borehole television imaging [21,22,23]. Furthermore, numerical simulations and physical experiments provide support for revealing the quantitative relationship between the height of the overburden damage zone and the thickness of the coal seam. By adopting methods such as three-dimensional numerical simulation and water injection leakage experiments, scholars have obtained the dynamic laws of fracture zone development and revealed the critical controlling role of coal seam thickness on damage height [24,25]. At the same time, emerging monitoring technologies have also expanded the research methods. For example, distributed fiber optic sensing technology can monitor the strain of the optical fiber cable in real time during the advancement of the working face. This monitoring data reveals the deformation and fracture characteristics of the rock strata under mining-induced stress, allowing for the determination of the development height of water-conducting fractures [26,27,28,29]. Under complex geological conditions, researchers have also employed a method combining discrete element numerical simulation with field measurement data, discovering that the spatial envelope of fracture zones under weakly cemented cover rock presents a triangular characteristic, and confirmed that when the weakly cemented cover is thick, it can significantly constrain the height and shape of the water-conducting fracture zone. Based on this, a prediction model for the height of the water-conducting fracture zone has been established [30,31].
In addition, there has been a substantial amount of research on numerical modeling and conceptual models of the mining process and mine water inrush. Early analytical models mainly analyzed stress redistribution and overlying rock movement under simplified boundary conditions [32,33,34,35,36]; research has further used the discrete element method and the CFD-DEM coupling method to accurately predict groundwater inflow and rock mass failure in recent years [37,38,39]. To characterize the progressive deterioration and anisotropic behavior of rock masses under high stress and pore pressure conditions, scholars have introduced nonlinear constitutive models, such as elasto-plastic damage models [40,41,42]. These advances have significantly enhanced the understanding of the mechanisms of fracture initiation, propagation, and water-conducting channel formation in deep mining. In addition, engineering prevention and control measures for mine water inrush disasters have been continuously developing, including grouting reinforcement, pre-drainage of water-bearing layers, and the arrangement of water-retaining coal pillars [43,44,45].
In terms of risk assessment, researchers have established an evaluation index system based on microseismic energy, the degree of residual coal pillar damage, and the height of fracture development, and verified the accuracy and applicability of the risk assessment methods [46]. Scholars have also analyzed the laws and mechanisms of multilayer mining in closed mines. When the spacing between multiple coal seams is large, the secondary deformation pattern appears in a ‘W’ shape, and the deformation can be divided into five stages: subsidence, uplift, secondary subsidence, secondary uplift, and relative stability [47]. In addition, the researchers established an evaluation index system for the damage of aquifers in mining geology using remote sensing monitoring technology, and developed a risk assessment model for aquifer damage [48]. From the perspectives of water resources, safety, and socio-economic efficiency, various sustainability assessment systems have been developed to evaluate mining activities [49,50,51]. The above achievements have played an important role in ensuring the safe production of mines. However, there are significant deficiencies in the current research: first, the focus is generally on disaster prevention and safety assurance, while the attention to groundwater resource protection and ecological sustainability is relatively weak; second, existing research mostly focuses on local mechanical or seepage responses, lacking a comprehensive evaluation framework capable of systematically revealing the coupling mechanisms among ‘coal seam thickness—coal pillar arrangement—groundwater evolution’. This tendency of prioritizing safety over protection has, to some extent, constrained the deeper transformation of green mining construction from concept to practice.
To address the research gap mentioned above, this paper uses the Buertai coal mine as a typical project background and creatively builds a plastic damage–permeability coupling numerical model that reflects the interaction between rock mass damage and fluid movement. This model is capable of demonstrating the gradual damage, plastic deformation, and fracture evolution of the overburden during the multi-coal seam mining process, while dynamically simulating the changes in its permeability. Based on this, this article systematically analyzes the mechanisms by which the thickness of coal seam extraction and the spatial position of coal pillars affect the development height of water-conducting fracture zones and the volume of water influx. Furthermore, this paper transcends the traditional safety evaluation framework, establishing a comprehensive evaluation index system for groundwater sustainability. This system specifically includes the Groundwater Loss Index (GLI), the Aquifer Protection Efficiency (APE), and the Sustainability Trade-off Index (STI). Finally, this paper establishes a “dual-objective optimization framework” aimed at collaboratively optimizing economic and environmental benefits, dedicated to minimizing the damage to groundwater resources while ensuring the recovery rate of coal resources. Although the model was validated using the Buertai coal mine in China as an example, its conceptual framework is highly scalable and can be applied to the sustainability assessment of different types of mines, such as coal mines, non-ferrous metal mines, and aggregate resource extraction. This generalizability makes the proposed indicator system an important reference for promoting the global sustainable mining agenda and aligning it with regional policies. This study aims to provide a new design approach and decision-making basis that combines theoretical depth with practical value for the water resource conservation-oriented green mining model in arid and semiarid mining areas.

2. Methodology

2.1. Project Overview

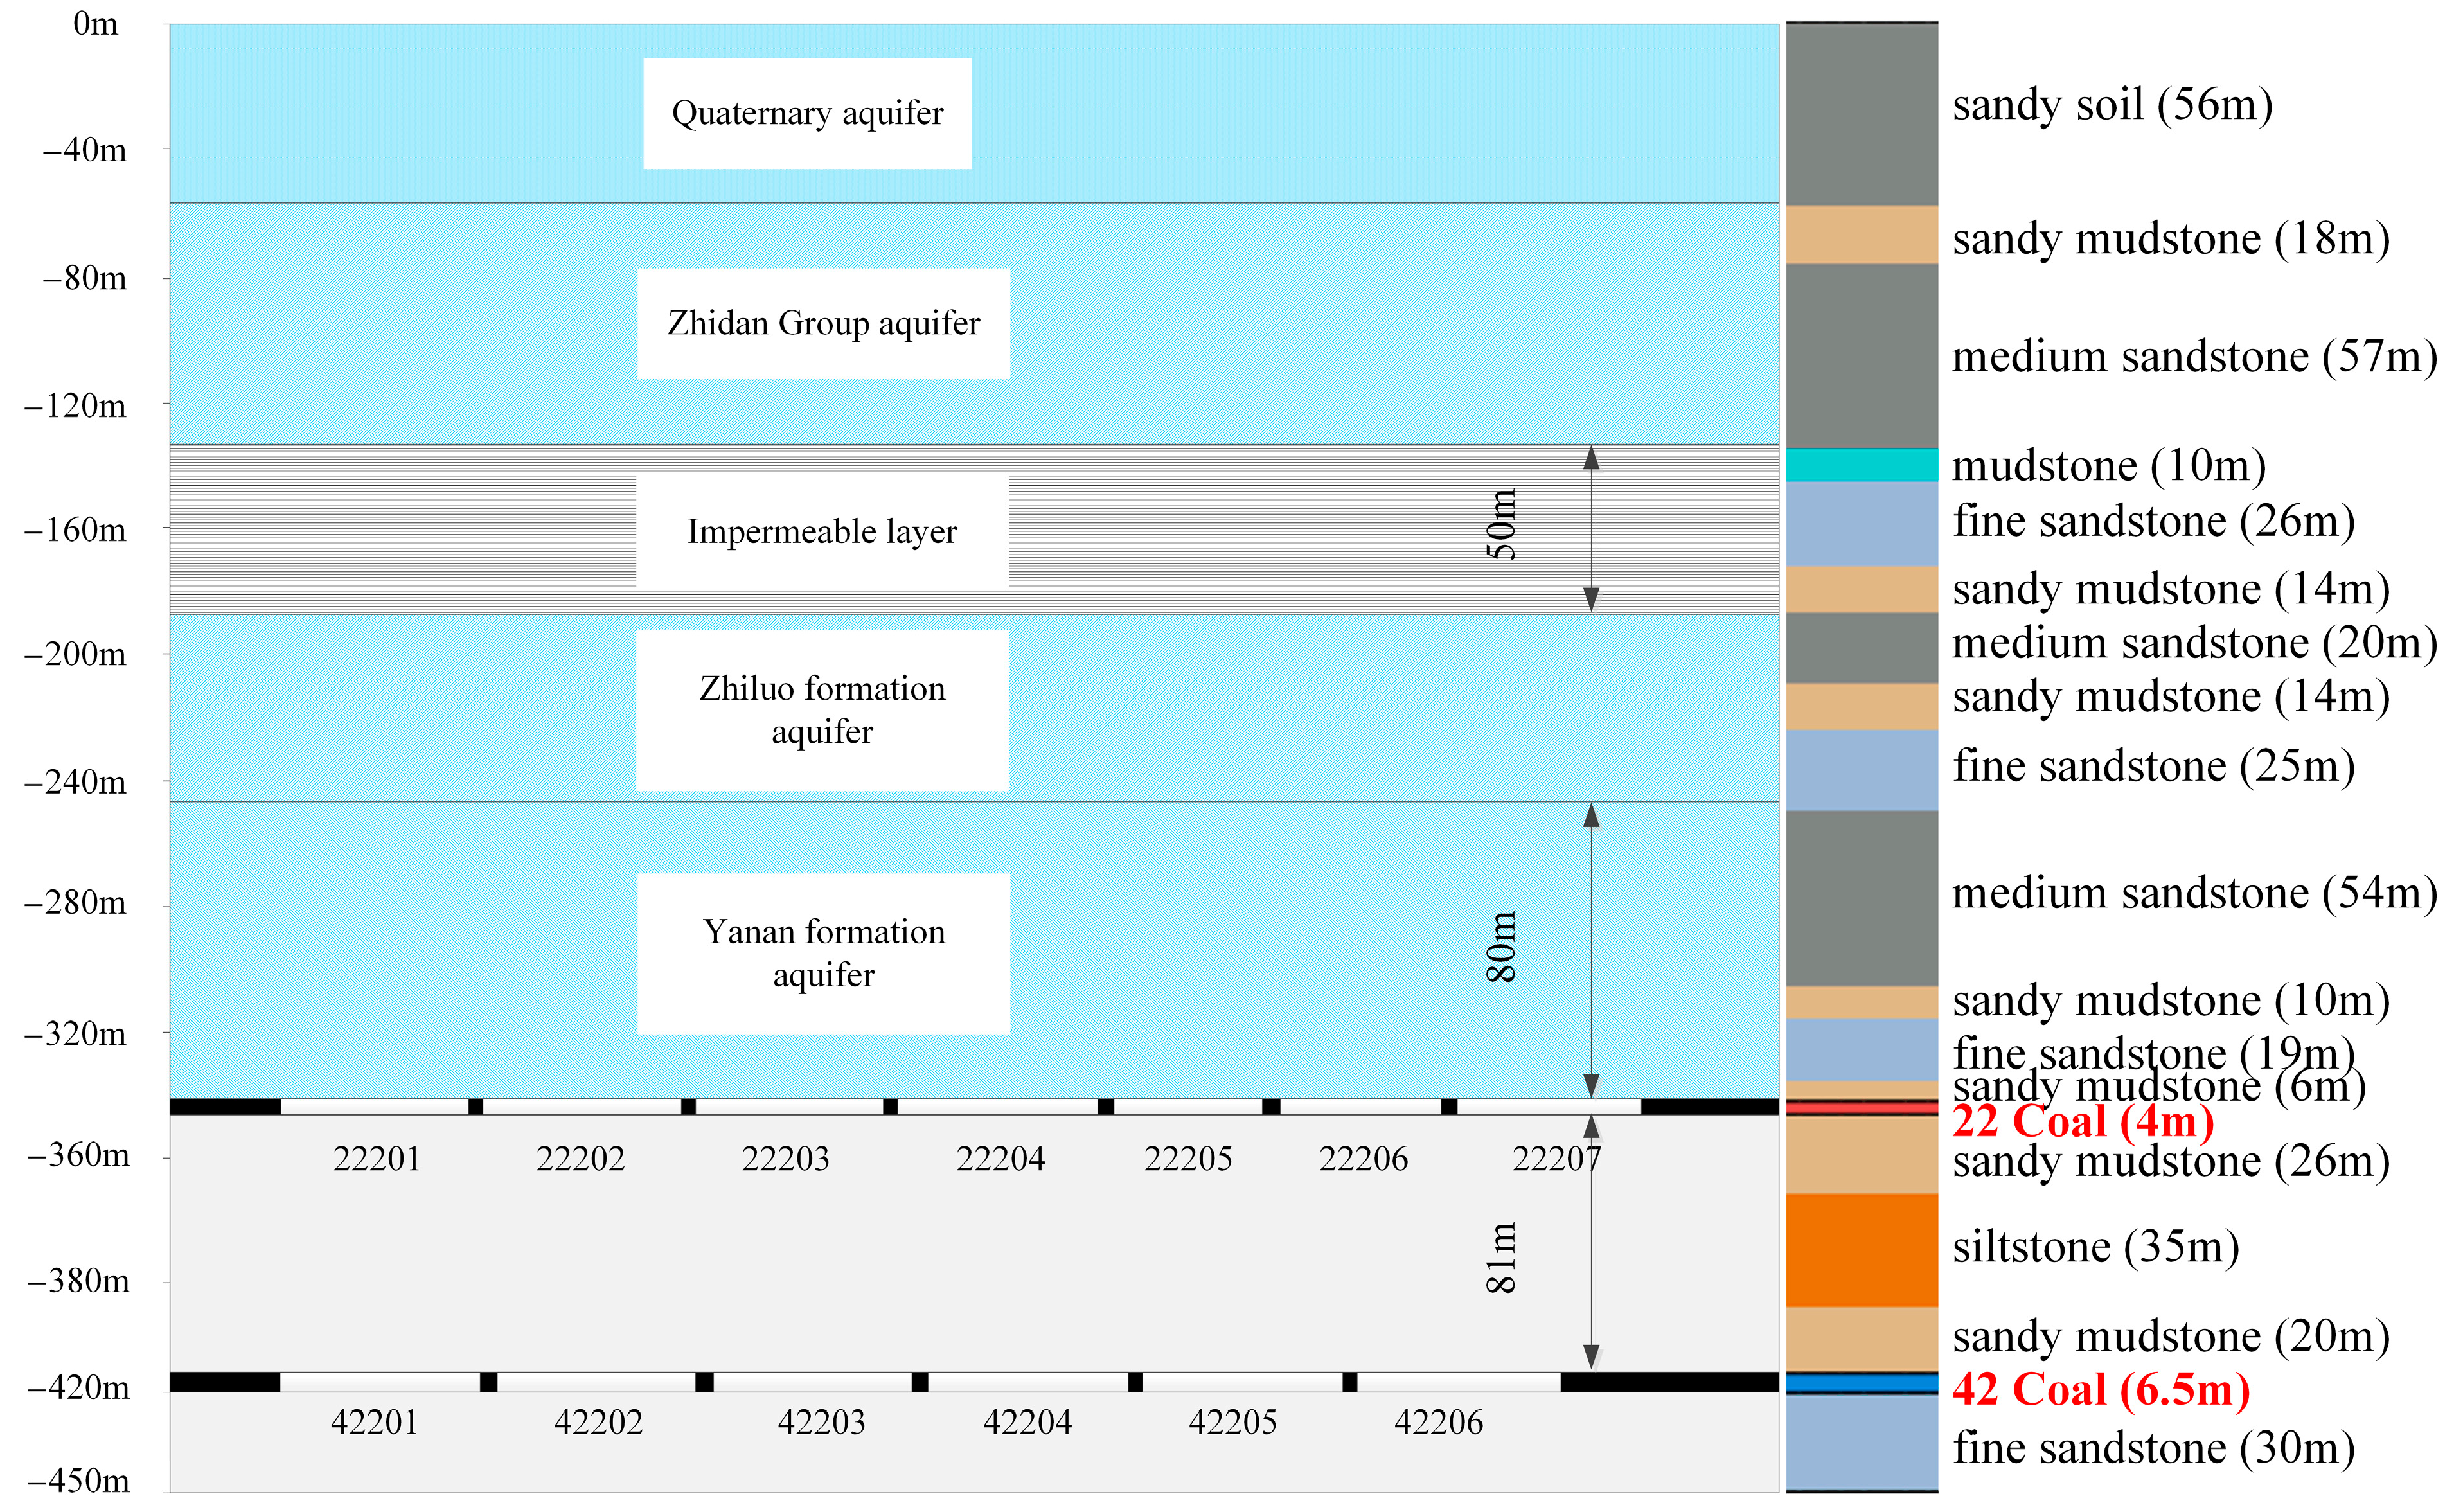
The Buertai Coal Mine is located in Ordos City, Inner Mongolia, at the boundary of the Loess Plateau and the ecologically fragile transitional zone of the Mu Us Desert (Figure 1). The mine is currently primarily extracting coal from the 2–2 and 4–2 layers, with average mining thicknesses of 4 m and 6.5 m, respectively, and burial depths of approximately 280 m and 350 m. The working faces mainly use overlapping and staggered coal pillar arrangement methods. The distribution of the overlying rock layers and key aquifers in the mining area is shown in Figure 2. The main aquifers, from top to bottom, include the Quaternary system, the Cretaceous Zhidan Formation, the Jurassic Zhilu Formation, and the Yan’an sandstone aquifer. The mudstone layer underlying the Zhidan Formation is the key impermeable layer that separates the upper unconfined water from the lower confined water.
In this geological context, the repeated mining of the dual coal seams easily induces the complex expansion of water-conducting fissures in the overlying rock mass. Once these fissures connect different aquifers, they will significantly increase the influx of water into the mined areas, creating a groundwater ‘funnel’. The more severe risk lies in the possibility that when the aquifer fissure zone develops upward and breaches key aquitards, it may connect the near-surface Quaternary and Cretaceous aquifers, potentially resulting in the leakage of surface water systems and the loss of valuable groundwater resources, causing irreversible damage to the surface ecosystem. Therefore, the core objective of this numerical simulation is to systematically reveal the key factors that affect the development height of the water-conducting fracture zone and the amount of inflow, providing a theoretical basis for the formulation of scientifically based mining plans that take into account both the prevention of water hazards and the protection of the ecological environment.

2.2. Plastic Damage–Seepage Coupling Model

A reasonable theoretical model serves as the foundation for the accurate implementation of subsequent numerical simulations. Rock materials exhibit significantly different mechanical responses under varying stress conditions. When the rock is in the elastic stage, the stress and strain are approximately linearly related, and the permeability changes little; however, when the stress exceeds the peak value, the rock enters the plastic deformation stage, accompanied by the formation and propagation of fractures, causing a sharp deterioration of its mechanical properties and a significant increase in permeability.
In order to reflect the deformation and failure characteristics of rock materials under the combined effects of stress and water pressure, a plastic damage constitutive model has been established. This model introduces the principle of effective stress within the framework of elastoplastic damage mechanics, thereby accurately reflecting the stress–strain relationship and permeability evolution under the aforementioned conditions. Its governing equations are as follows:
τ   =   φ p I + τ e
I is the identity matrix. φ is the effective stress coefficient, and its expression is
φ = 1 K db K s ,   if   d ( + )   =   0 1 ,   if   d ( + ) > 0  
where K db is the drained bulk modulus of the porous medium, K s is the effective bulk modulus of the solid. And τ e is the effective stress, its expression is
τ e = ( δ δ p ) E I d
where E is elastic stiffness matrix. δ p is plastic strain vector. d , a damage variable, is a fourth-order tensor:
d = d ( + ) N ( + ) + d ( ) ( I N ( + ) )
where N ( + ) = i = 1 3 h ea ( τ i ) n i   n i   n i   n i , n i is the direction vector, and the Heaviside function can be expressed as
h ea ( τ ) = 1 ,   τ > 0 ( tension ) 0 ,   τ 0 ( compression )
It should be emphasized that d ( + ) and d ( ) represent the tensile and compressive damage variables, respectively. The reason why the damage variables are so distinguished is because of two reasons: (1) Tension and compression constitute the fundamental modes of rock failure, each governed by distinct mechanical mechanisms and energy dissipation patterns; (2) Tension-mode fractures play a dominant role in controlling the abrupt changes in rock permeability. The formation and propagation of tensile cracks markedly enhance the connectivity of the fluid flow network.
Based on Equation (5), the total stress can be decomposed into tensile stress τ e ( + ) and compressive stress τ e ( ) [52]. Furthermore, in the effective stress space, Equation (3) can be simplified to:
τ e ( + ) = ( 1 d ( + ) ) E 0 δ t
where E 0 is the elastic modulus. δ t and τ e ( + ) can be obtained from the Brazilian split experiment.
δ c p = δ c in d ( ) τ e ( ) ( 1 d ( ) ) E 0
where δ c i n = δ c - τ e ( ) E 0 . δ c in , δ c p , and d ( ) are the inelastic strain, plastic strain, and damage variables caused by compressive stress.
The plastic strain δ c p in Equation (7) is obtained through the plastic mechanics theory [52].
As discussed above, tensile damage exerts a significant influence on the permeability evolution of rock. In the undamaged state, the permeability coefficient k is primarily governed by the porosity and elastic volume strain δ ve . Once the rock enters the plastic damage stage, fluid mainly migrates through open cracks (i.e., d ( + ) ) and is also affected by the plastic volume strain δ vp . The expression is
k = k nd   ( 1 + δ ve ) 3 φ p 1 φ p φ p ( 1 + δ ve ) 1 3 ,   d ( + ) = 0 d ( + ) k d 1 + d ( + ) δ vp 3 + 1 d ( + ) k nd ,   d ( + ) > 0
where k nd and k d are the permeability coefficient of the undamaged and damaged part of the rock. φ p is porosity.
The mass conservation equation of the pore fluid is as follows:
( φ p ρ w ) t + ( ρ w ν ) = q
where ρ w is fluid density, and q denotes source or sink terms. The fluid velocity ν follows Darcy’s law:
ν = k μ p
where μ is the dynamic viscosity, and p is the pore pressure.
Through the above Equations (1)–(10), a coupled plastic damage–seepage theoretical model for the mined rock is established. This model lays the theoretical foundation for the subsequent numerical simulation of the height of the water-conducting fracture zone and the seepage behavior of the overlying rock.

2.3. Numerical Model

This study uses Abaqus CAE 2022 software to establish a two-dimensional plane model to simulate the coupled effect of plastic damage and seepage during the mining of multiple coal seams. The distribution of rock layers and the physical and mechanical parameters in the model are set according to Figure 2 and Table 1, with the rock mass yield criterion using the Mohr–Coulomb model. The boundary conditions are set as full constraint at the bottom, horizontal constraint at the sides, and free boundary at the top. Gravity load is applied to the entire model, and the initial pore water pressures in the model are 0.3 MPa (Zhidan group), 0.5 MPa (Zhiluo group), and 0.9 MPa (Yan’an group), respectively.
The mining process is carried out by the gradual deactivation of coal seam units to simulate the advancement of the working face; in each mining step, the evolution of the stress field and the seepage field is calculated, and the plastic deformation and damage state of the rock are reflected through residual stress. The water flow migration is solved using a fully coupled approach, with permeability updated in real-time according to the damage variables. Assign the aforementioned plastic damage–seepage coupling properties to the CPE4P pore fluid–stress element, using implicit integration and the Newton–Raphson iterative algorithm to ensure nonlinear convergence. The interlayer interface is connected through common nodes, and the interlayer permeability coefficient is determined by Equation (8) to ensure flow continuity. The optimal cell size of 4 m was determined through mesh sensitivity analysis, which verified the impact of this grid on the solution and ensured the convergence of the numerical solution [53,54]. The accuracy of the model is ensured according to the above conditions [55].
To systematically reveal the impact of key mining parameters on overburden fracturing and groundwater migration patterns, this study designed the following two independent simulation schemes:
Plan One: Analysis of the Impact of Coal Seam Thickness. To explore the influence of the thickness of the underlying coal seam during extraction, a geometric model measuring 700 m × 450 m is established. Using the method of controlled variables, the extraction thickness of the upper 2–2 coal seam is fixed at 4 m, while the extraction thickness of the lower 4–2 coal seam is treated as the only variable, set at four conditions of 4 m, 6 m, 8 m, and 10 m (Figure 3), in order to analyze its control effect on the height of the water-conducting fracture zone and the migration and infiltration of groundwater.
Plan Two: Analysis of the Impact of Coal Pillar Interference Distances. Given the characteristics of the staggered layout in the work face of the Buertai coal mine, a geometric model measuring 420 m × 450 m was created to explore the effects of the relative positions of coal pillars. The horizontal stagger distance of coal pillars between the upper and lower coal seams (Ls1) was set as the only variable, with six different conditions—0 m (aligned), 20 m, 60 m, 100 m, 138 m, and 160 m (as shown in Figure 4)—while keeping the other parameters consistent with Plan One.
All working conditions adopt a top-down mining sequence, excavating in incremental steps of 20 m, and follow the principle of “extract four, fill two” (i.e., for every 40 m advanced, 20 m are backfilled) to simulate a partial backfilling process. Throughout the simulation, the dynamic evolution of the stress field, displacement field, and seepage field was systematically monitored. By quantitatively analyzing the development pattern of the plastic zone and the water inflow of the goaf, this study aims to evaluate the main controlling effects of two key factors—coal seam thickness and the spatial position of the coal pillar—on mining stability.

2.4. Sustainability Indicator Framework

In order to convert the simulation output into a practical decision-making framework, we have developed three new indicators.
(1)
Groundwater Loss Index (GLI)
G L I quantifies the intensity of groundwater depletion in a given extraction scenario relative to baseline conditions. It is a dimensionless ratio defined as:
G L I = Q s c e n a r i o Q b a s e l i n e
Among them, Q s c e n a r i o is the total steady-state groundwater inflow rate of the assessed scenario (m3/h), whereas Q b a s e l i n e represents the inflow rate of the most conservative baseline scenario (with a CST of 4 m in this study, utilizing the optimal staggered coal pillar arrangement). A higher GLI indicates a greater impact on groundwater resources, which may be more unsustainable.
(2)
Aquifer Protection Efficiency (APE)
APE measures the effectiveness of specific mining design choices (such as pillar layout) in reducing groundwater loss compared to the worst-case scenario. It is represented as a percentage:
A P E = ( Q w o r s t Q o p t i m i z e d Q w o r s t ) × 100 %
Among them, the inflow under the worst design in Q w o r s t (such as a CST of 10 m with aligned coal pillars) is compared with the inflow under the improved design in Q o p t i m i z e d (such as staggered coal pillar arrangement). APE directly measures the protective benefits achieved.
(3)
Sustainability Trade-off Index (STI)
The S T I is a composite index designed to balance the typically conflicting objectives of production, safety, and environmental protection. It is formulated as a weighted sum of normalized scores for each dimension:
S T I = w c S c o a l + w s S s a f e t y + w e S e n v
Among them, S c o a l , S s a f e t y , and S e n v are the normalized scores (ranging from 0 to 1) for coal recovery, rock mechanics safety (such as the reciprocal of the plastic zone height, hereinafter referred to as PZH), and environmental performance (such as the reciprocal of the G L I ), respectively.
w c , w s , and w e are the weight factors for each dimension, and w = 1 . These weights can be adjusted by stakeholders (such as mining companies, regulatory agencies) to reflect different priorities. A higher S T I value represents a more balanced and sustainable mining plan.

3. Results

3.1. The Impact of Coal Seam Thickness

Under the condition of a mining thickness of 4 m in the 4–2 coal seam, the water inflow to the working faces of coal seams 2–2 and 4–2 can be obtained by calculating the seepage velocity of each unit on the top boundary of the goaf, then multiplying by the unit area (4 m × 4 m), and finally summing the results, which are 113 m3/h and 48 m3/h, respectively. This result is mainly due to the impact of multiple mining filling activities on the overlying rock layers, with the maximum height of the plastic zone reaching 155 m. As shown in Figure 5a,b, the plastic zone is approximately symmetrically distributed along the center of the working face and reaches its maximum point near the coal pillar. At the same time, influenced by the rupture of the plastic zone rock layers, the seepage path of groundwater has also formed a symmetrical ‘funnel’ shape. The seepage velocity is fastest on both sides of the Zhiluo Formation and the Yan’an Formation above the 2–2 coal seam, reaching a peak of 1.3 × 10⁻⁸ m/s; while in the center of the ‘funnel’ area, the velocity is slightly slower at 1.1 × 10⁻⁸ m/s. Deeper above the 4–2 coal seam, the average flow velocity in the sandstone aquifer is 8.7 × 10⁻⁹ m/s.
When the mining thickness of the 4–2 coal seam increases to 6 m, the impact of mining on the overlying rock layers becomes more evident. The plastic zone expands upward and first invades the aquifer of the Zhiluo Formation, with its maximum height increasing to 160 m (Figure 5c). The larger fracturing range directly leads to aggravated groundwater seepage. In the ‘funnel-shaped’ seepage field above the 2–2 coal seam, the maximum flow rate in the center area has reached 1.3 × 10⁻⁸ m/s. Deeper in the overlying sandstone of the 4–2 coal seam, due to the more severe fracturing of the plastic zone, the average seepage velocity has reached 1.1 × 10⁻⁸ m/s (Figure 5d). Ultimately, the calculated inflow rates for the goaf of the 2–2 and 4–2 coal seams have risen to 117 m3/h and 53 m3/h, respectively.
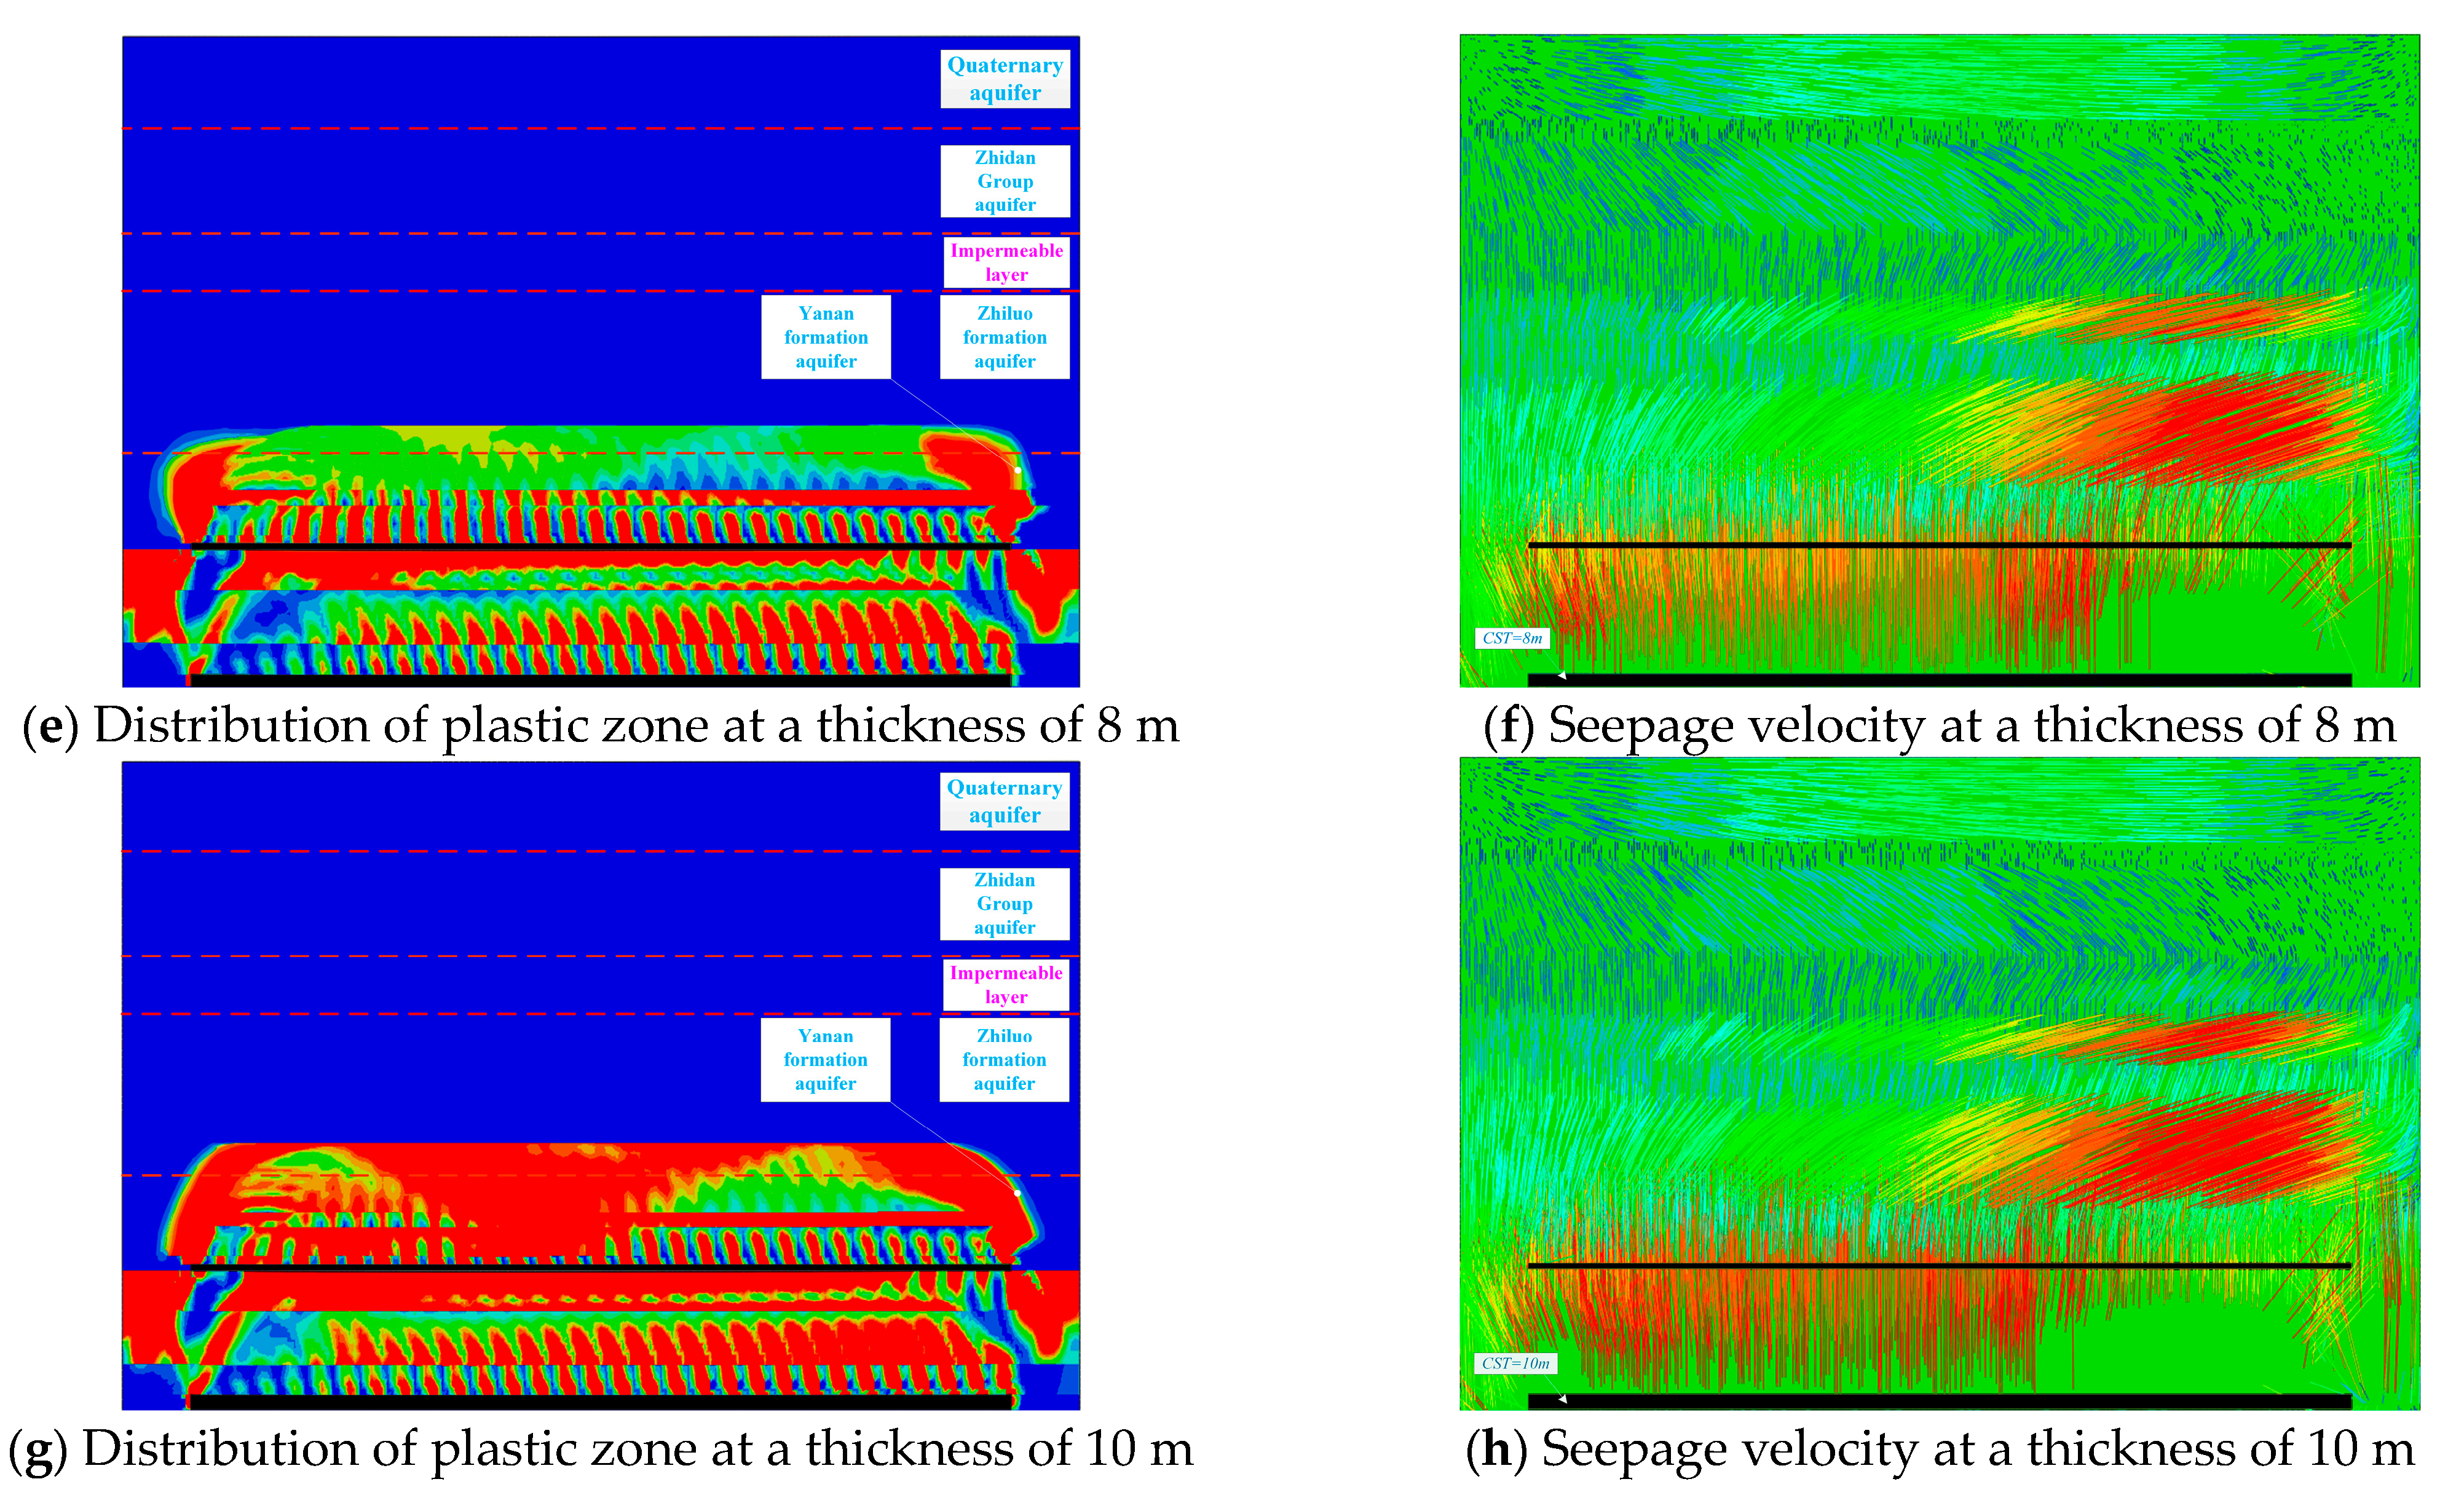
After increasing the mining thickness of the 4–2 coal seam to 8 m, the inflow rates of the 2–2 and 4–2 coal seams have correspondingly increased to 126 m3/h and 64 m3/h, respectively. Due to the continued expansion of the plastic zone, its maximum height has reached 164 m (Figure 5e). A notable phenomenon in the seepage field at this time is that the average flow velocity of the sandstone overlying the 4–2 coal seam has reached 1.5 × 10⁻⁸ m/s, surpassing the maximum flow velocity of 1.3 × 10⁻⁸ m/s at the center of the funnel above the 2–2 coal seam, indicating that the impact of mining activities on the deep aquifer has become more intense (Figure 5f).
When the extraction thickness reaches the maximum of 10 m, the plastic zone also expands accordingly to its maximum extent, reaching a height of 168 m (Figure 5g). Above the 2–2 coal seam, the water flow is concentrated on both wings of a ‘funnel’ shape, moving at speeds up to 1.8 × 10⁻⁸ m/s, with a significant increase in flow velocity in the central area to 1.6 × 10⁻⁸ m/s. This is due to the deepening of the rupture in the central area of the plastic zone above the 2–2 coal seam. Meanwhile, the average seepage velocity of the overlying sandstone of the deep 4–2 coal seam increases to 1.7 × 10⁻⁸ m/s (Figure 5h). The water inflow in the upper 2–2 coal seam increases to 149 m3/h, while the inflow in the lower 4–2 coal seam increases to 75 m3/h.
As the thickness of the 4–2 coal seam increases from 4 m to 10 m, the height of the plastic zone of the overburden only increases by about 8%, while the water inflow significantly rises: the increases for the 2–2 and 4–2 coal seams are approximately 32% and 56%, respectively (Figure 6). Among them, the lower coal seam is more sensitive to changes in thickness, with its increase in water inflow being 1.8 times that of the upper coal seam. At the same time, the seepage velocity in the deep aquifer gradually exceeds that in the upper funnel area, indicating that the expansion of thickness has a more pronounced amplifying effect on the risk of water disasters in the deep layers. Therefore, reasonable control of thickness is an important guarantee for achieving safe mining of multiple coal seams and mitigating the development of water-conducting channels.

3.2. The Impact of Coal Pillar Position

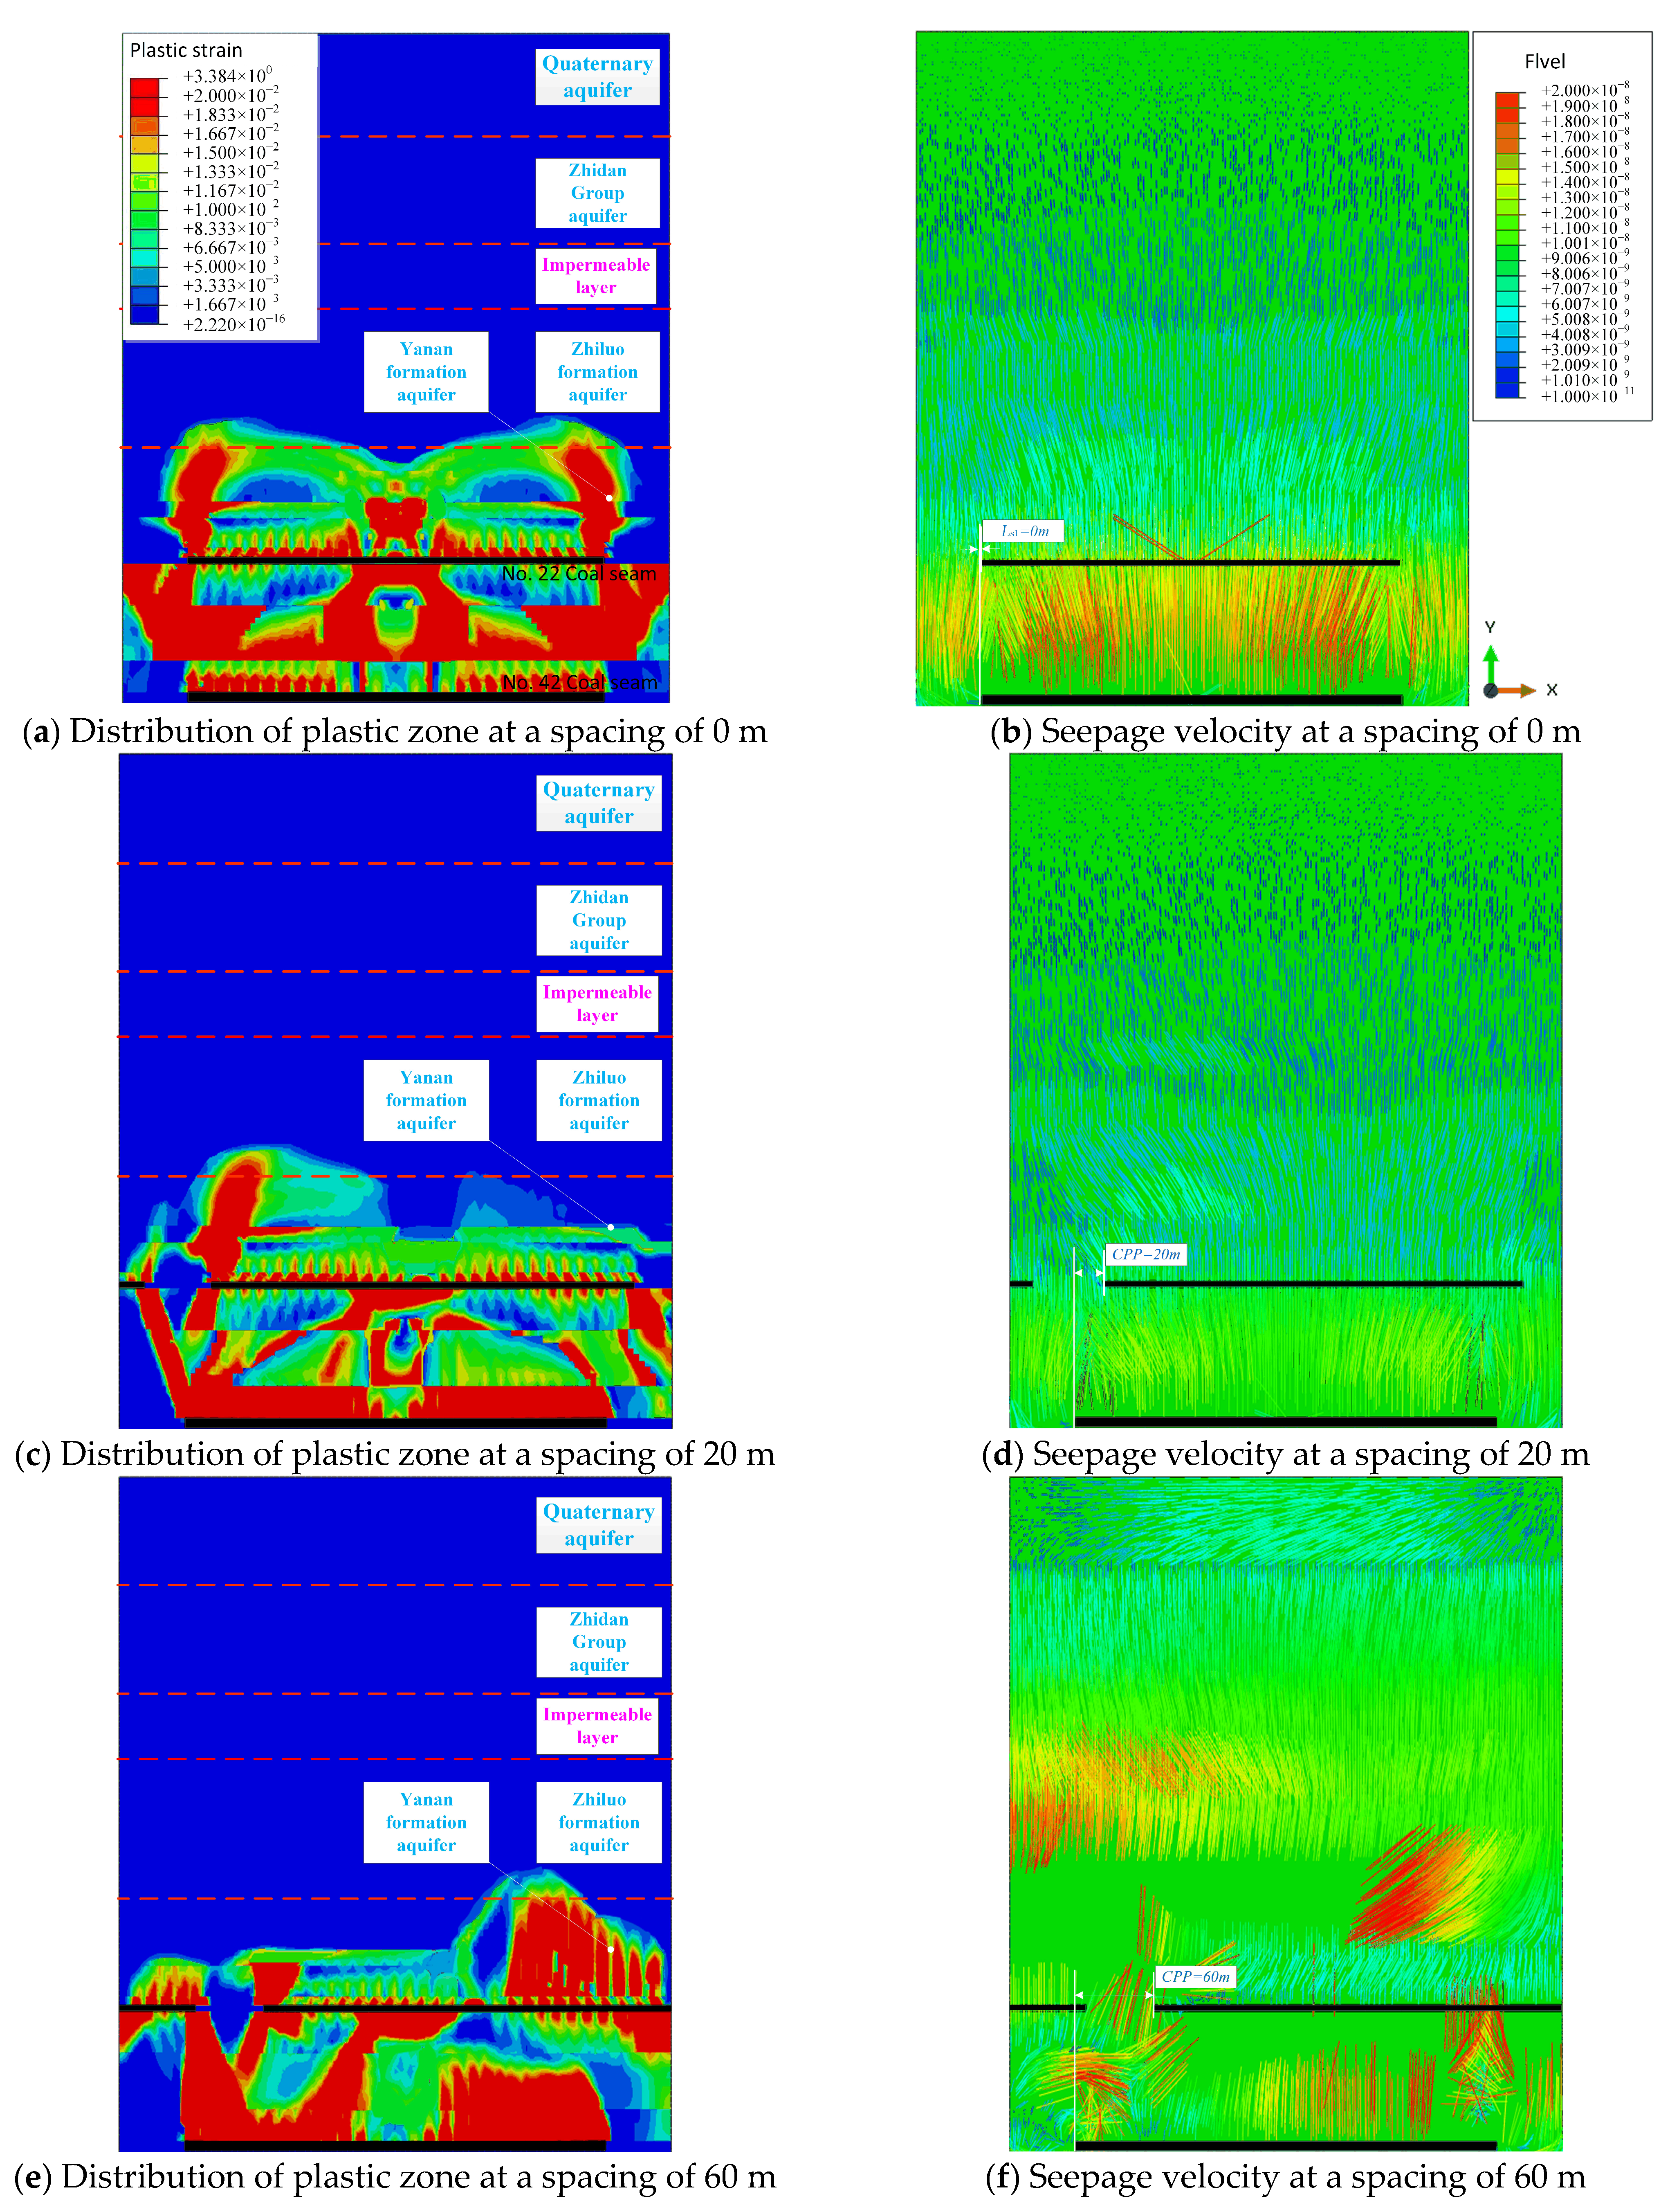
When the coal pillars of the upper and lower coal seams are perfectly aligned (i.e., the staggered distance Ls1 = 0 m), stress is highly concentrated in the vertical direction, leading to the formation of a typical saddle-shaped symmetrical plastic zone in the overlying rock mass (Figure 7a). The development characteristics of this fracture zone show that it is low in the middle and high at both ends, with the maximum height reaching 158 m near the coal pillars. This well-connected fracture structure creates preferential pathways for groundwater flow, consequently forming a symmetrical ‘funnel-shaped’ seepage field. Above the 2–2 coal seam, water mainly infiltrates rapidly along the two wings of the ‘funnel’ (with a maximum speed of 1.4 × 10⁻⁸ m/s), while the flow rate in the central region is relatively slow (approximately 8.6 × 10⁻⁹ m/s). The average seepage velocity of the overlying sandstone in the deeper 4–2 coal seam is 6.4 × 10⁻⁹ m/s (Figure 7b). Ultimately, the inflow rates in the mined-out areas of the 2–2 and 4–2 seams reach 128 m3/h and 63 m3/h, respectively.
After slightly increasing the staggered distance of the coal pillars to 20 m, the original symmetrical stress distribution was disrupted, resulting in the formation of an asymmetric plastic zone within the rock mass. The maximum height of this plastic zone increased to 164 m, with its highest point located near the coal pillars of the 2–2 coal seam (Figure 7c). This asymmetric rupture pattern reshaped the seepage paths of groundwater, causing them to no longer exhibit a symmetrical funnel shape, but instead reaching a maximum seepage velocity of 1.7 × 10⁻⁸ m/s near the coal pillars on both sides of the 4–2 coal seam. In contrast, the seepage velocity in other areas generally remained at 8.2 × 10⁻⁹ m/s, while the average flow velocity of the overlying sandstone of the 4–2 coal seam was also at a low level of 5.2 × 10⁻⁹ m/s (Figure 7d). Despite the occurrence of localized higher rupture heights and flow rates, the overall water conduction effect was weakened, resulting in the final influx of water in the goaf areas of the 2–2 and 4–2 coal seams decreasing to 121 m3/h and 59 m3/h, respectively.
After further increasing the staggered distance of the coal pillars to 60 m, the pattern of rock fracture changed significantly. The maximum height of the plastic zone increased to 168 m, and its highest point shifted from near the upper left coal pillar to above the lower right 4–2 coal seam pillar (Figure 7e). This concentrated fracturing of the deep rock mass formed a high-speed seepage ‘dominant channel’ that directly connects to the Zhiluo formation, with a local peak velocity reaching as high as 1.8 × 10⁻⁸ m/s. However, apart from this localized high-speed area, seepage activity in most regions was effectively suppressed, with a common flow rate dropping to 7.1 × 10⁻⁹ m/s, while the average flow rate in the sandstone above the 4–2 coal seam increased to 5.8 × 10⁻⁹ m/s (Figure 7f). This ‘localization’ effect of the seepage ultimately led to a re-distribution of the inflow: the inflow in the mining area of the lower 4–2 coal seam decreased further to 54 m3/h, while the inflow in the upper 2–2 coal seam dropped to 118 m3/h.
When Ls1 = 100 m, the mechanical stability of the rock mass has significantly improved. The maximum height of the plastic zone decreased from 168 m in the previous working condition to 162 m, and its highest point has returned to near the coal pillar of the upper 2–2 coal seam (Figure 7g). This alignment allows the position of the highspeed seepage zone and the rupture peak to correspond once again, with a peak velocity of 1.8 × 10⁻⁸ m/s. Despite this localized highspeed area, seepage in other regions remains at a lower level (approximately 6.3 × 10⁻⁹ m/s) (Figure 7h). The average flow rate of the sandstone above the lower 4–2 coal seam increased to 6.3 × 10⁻⁹ m/s. This series of changes ultimately manifests as further optimization and redistribution of water inflow: the water inflow from the lower 4–2 coal seam is more effectively controlled, reduced to 48 m3/h, while the water inflow from the upper 2–2 coal seam decreased to 112 m3/h.
As shown in Figure 7i, when Ls1 = 138 m, under the influence of mining in the 2–2 and 4–2 coal seams, an asymmetric distribution of the plastic zone is formed. The highest point of the plastic zone is located near the 4–2 coal pillar, with a height of 170 m (Figure 7i). At this time, the maximum seepage velocity occurs near the highest point of the plastic zone of the Zhi Luo formation, measured at 2.1 × 10⁻⁸ m/s. The seepage velocity in other parts of the Zhiluo formation and the Yan’an formation is generally 5.8 × 10⁻⁹ m/s. The average seepage velocity in the sandstone layers above the 4–2 coal seam is relatively low, at 6.8 × 10⁻⁹ m/s (Figure 7j). The inflow rates for the 2–2 and 4–2 mining faces are 108 m3/h and 45 m3/h, respectively.
When the staggered distance continues to increase to 160 m, the layout achieves the best stability in terms of rock mechanics: the maximum height of the plastic zone significantly decreases to 156 m, which is the lowest value among all staggered conditions, and its highest point also remains stably near the coal pillar of the 2–2 coal seam (Figure 7k). In terms of controlling the inflow, the water inflow in the goaf of the 2–2 and 4–2 coal seams is 101 m3/h and 39 m3/h, respectively. At this time, the maximum seepage velocity occurs near the coal pillar of the 2–2 coal seam in the Zhiluo formation, reaching 1.9 × 10⁻⁸ m/s. The seepage velocity in other parts of the Zhiluo and Yan’an formations is generally 4.6 × 10⁻⁹ m/s. The average seepage velocity of sandstone above the 4–2 coal seam is measured at 6.4 × 10⁻⁹ m/s (Figure 7l).
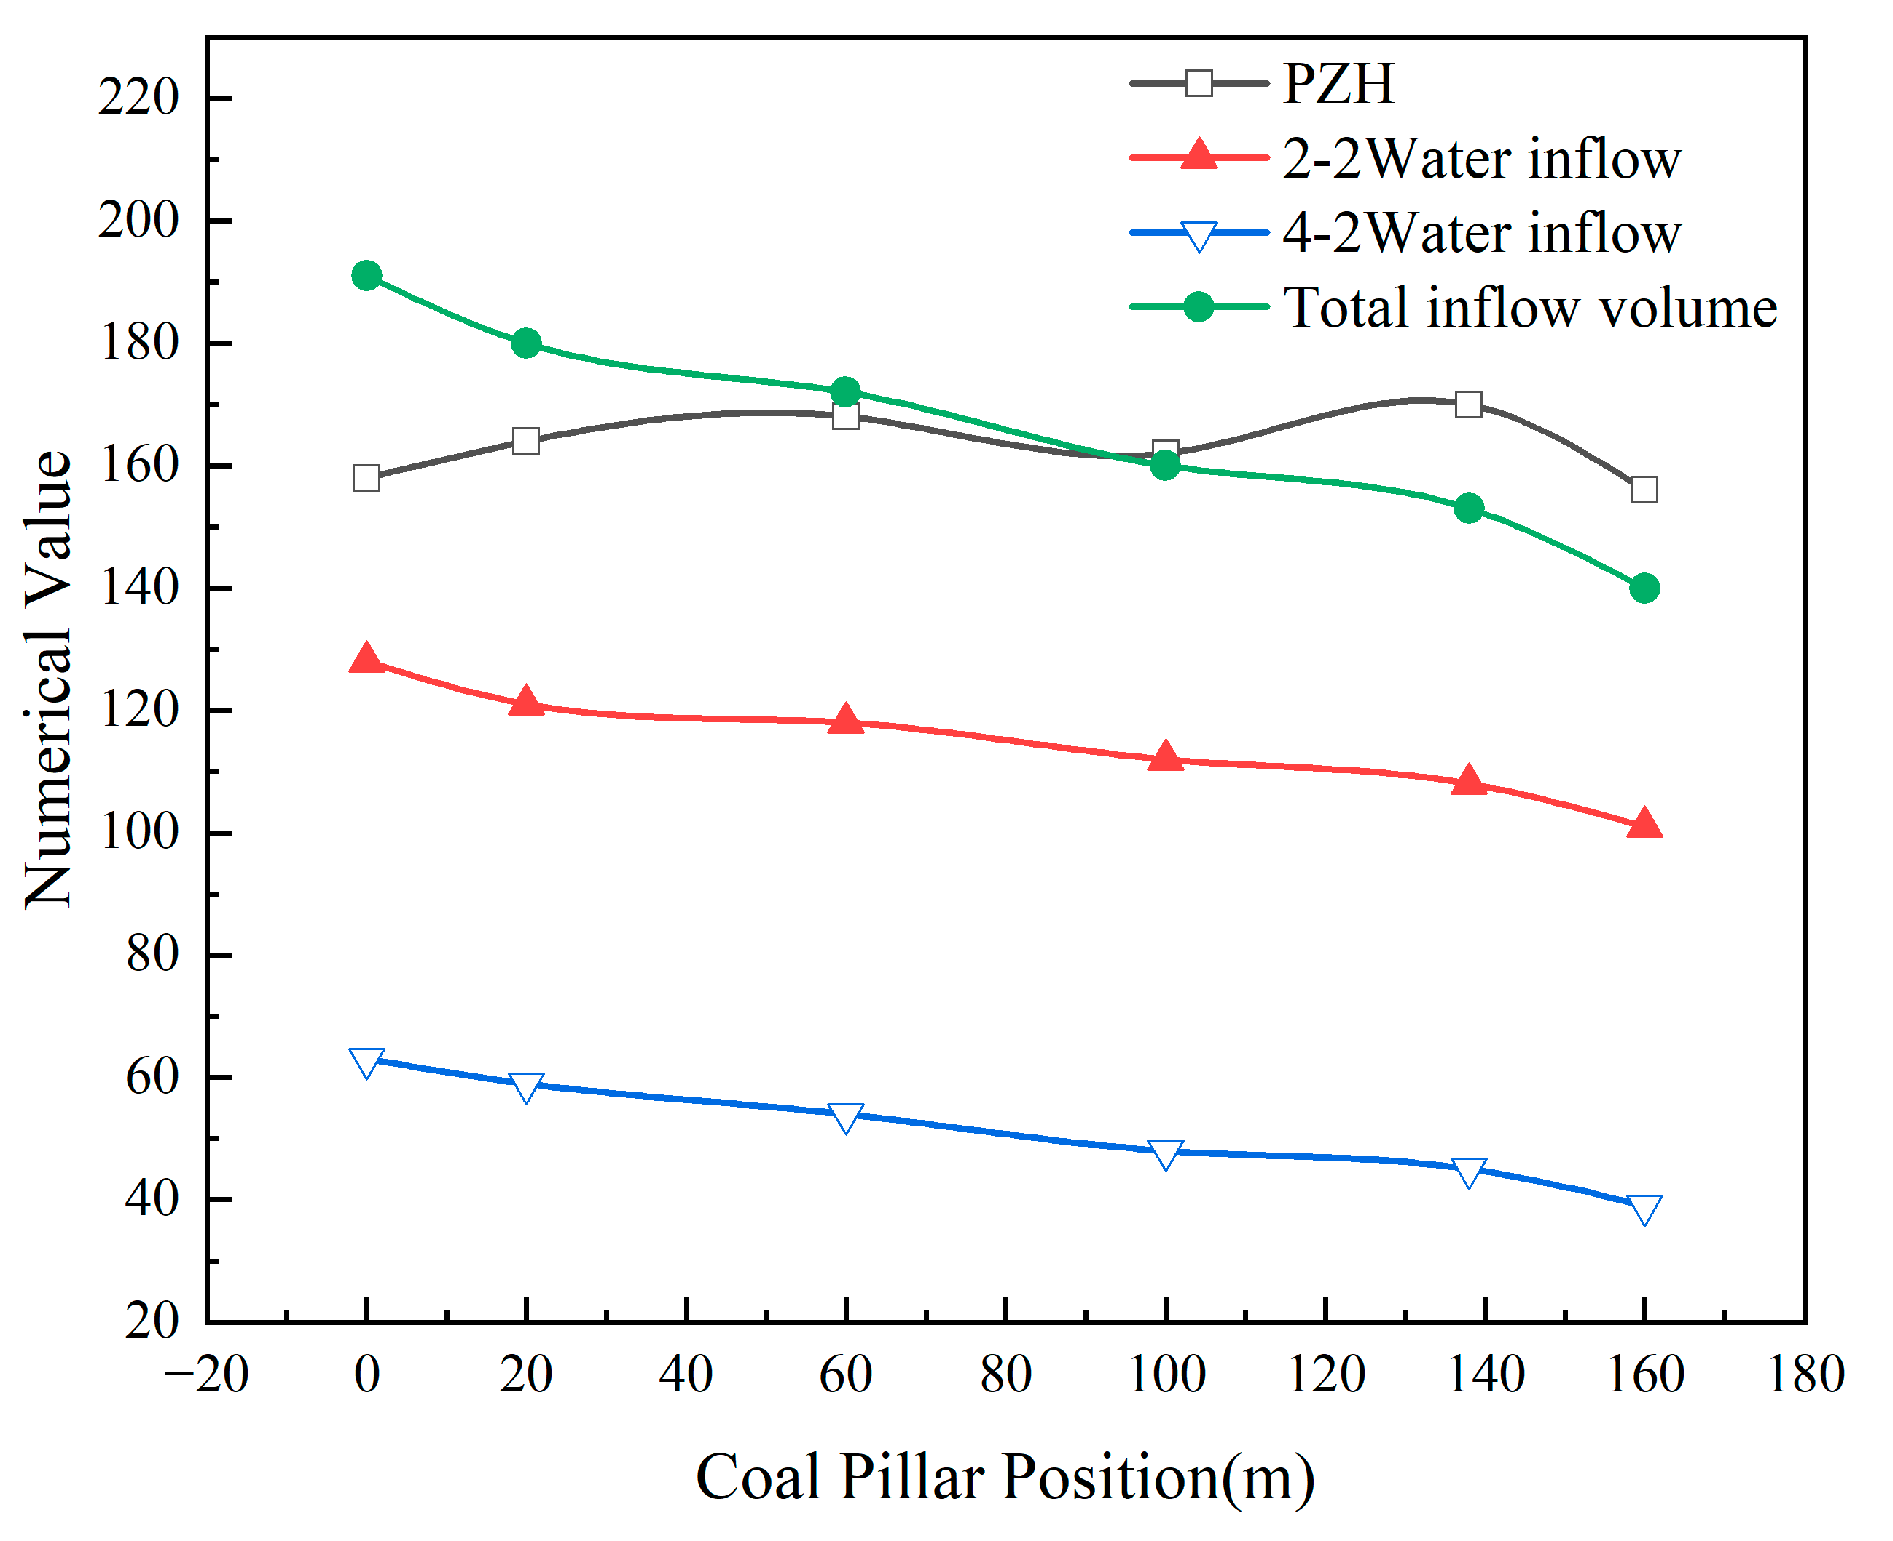
As shown in Figure 8, increasing the inter-column distance (Ls1) has strikingly different effects on the height of the plastic zone and the flow rate. The height of the plastic zone shows slight variation (156–170 m, ≈±7%), with no proportional reduction, reflecting that the local stress redistribution is not influenced solely by the geometric spacing. The flow rate, however, demonstrates a nearly monotonous decrease: the No. 2–2 coal seam reduced by ≈21% (128→101 m3/h), while the No. 4–2 coal seam decreased by ≈38% (63→39 m3/h). The reduction in the lower layer is even greater (about 1.8 times that of the upper layer), indicating that increasing the inter-column distance can effectively suppress the influx of groundwater, reduce the occurrence of water hazards, and thereby enhance overall mining safety.
The model results have been compared with the field measurements of the Buertai 2–2 coal seam, where the observed height of the plastic zone is about 160 m and the water inflow ≈24 m3/h. Under the same conditions, the simulated height of the plastic zone and water inflow are 155 m and 22 m3/h, respectively, with deviations of less than 10%. The results are also consistent with previous studies, confirming that the scaling ratio of crack development is similar [37,56].

3.3. Experimental Verification

Laboratory tests are an important means to verify the effectiveness of the newly developed plastic damage–seepage model. Taking sandstone as an example, the verification process of the plastic damage–seepage model is explained. In numerical simulation, a finite element calculation model is established using Abaqus CAE software, and the parameters of rock specimens are obtained through cyclic loading-unloading tests and permeability tests (see Table 1). The numerical simulation results were compared with the experimental test results (see Figure 9). The two agree well, indicating that the plastic damage–seepage model has high accuracy and reasonable reliability in characterizing the coupled behavior of rock deformation and fluid flow.

3.4. Sustainability Indicator Analysis

The thickness of the coal seam determines the intensity of groundwater loss, while the arrangement of coal pillars affects protective efficiency. Through the coupling evaluation of G L I , A P E , and S T I , it is possible to identify the optimized range that both ensures coal recovery efficiency and reduces groundwater loss.
The sustainability indicators proposed for each scenario were calculated using the simulation results, summarized in Table 2 and Table 3.
From Table 2, it can be seen that as the thickness of the coal seam increases, the GLI value rises from 1.00 to 1.39, while the APE value decreases from 28.1% to 0. This clearly indicates that increasing the extraction thickness will continue to weaken the protection of the aquifer. From the perspective of overall sustainability (STI), the STI value for the (4 m, 0 m) scenario is the highest (0.67), as it performs best in both safety and environmental dimensions; as the thickness increases, the overall STI value continues to decline, indicating a deterioration in sustainability.
The results in Table 3 clearly demonstrate the significant effect of optimizing the arrangement of coal pillars on groundwater protection. When the coal pillars are adjusted from complete alignment (0 m) to a staggered distance of 160 m, the APE value increases from 0% to 26.7%, indicating a significant water-saving effect. The STI value peaks at 0.67 at the 160 m spacing, as this scenario simultaneously achieves the lowest PZH (safest) and the lowest GLI (most environmentally friendly), making it the optimal choice in this plan.

4. Discussion

4.1. Meaning of Sustainability

This study redefines the traditionally perceived issue of mine water inflow, which is considered an engineering disaster, as a critical sustainability challenge. The results quantitatively demonstrate that mining design choices, particularly coal seam thickness, have a disproportionate impact on groundwater resources. The water inflow from mining a 10 m thick coal seam is 1.39 times that of mining a 4 m thick coal seam, indicating that the extraction of thick coal seams could lead to unsustainable rates of aquifer depletion. In water-scarce regions like Inner Mongolia, such loss would exacerbate desertification, reduce agricultural productivity, and hinder long-term ecological restoration efforts, directly conflicting with SDG 6 and SDG 15. Conversely, our findings suggest that strategic mine planning, such as implementing staggered pillar layouts, can serve as a powerful conservation tool. A reduction of approximately 27% in water inflow (with an optimal case APE ≈ 37.5%) represents a low-cost, engineering-based solution to mitigate environmental impacts and support the concept of green mining, thereby promoting regional water security.

4.2. Comparison with Previous Studies

Our findings regarding the expansion of the plastic zone are consistent with previous rock mechanics studies that identified coal seam thickness and pillar stability as critical control factors in roof failure [58,59,60,61]. However, this research advances the field by explicitly linking these mechanical processes to quantifiable groundwater loss outcomes and embedding the analysis within a sustainability framework. While other studies have focused on predicting water inflow [62,63,64], they rarely assess these rates against sustainability benchmarks or translate them into decision-support indices such as GLI and APE. In particular, the STI offers a novel approach that moves beyond single-objective (safety) optimization towards a multi-objective, stakeholder-inclusive model, a direction that has long been advocated in the sustainable resource management literature.

4.3. Support for Policies and Management

  • GLI Threshold: When GLI ≥ 1.5, it may indicate that groundwater extraction is at an unsustainable risk level. This threshold can serve as an early warning reference for implementing measures such as recharge, supplementation, or controlled drainage to maintain aquifer stability.
  • APE Standard: The misalignment arrangement can achieve APE ≈ 27%. Based on this, it is recommended that APE ≥ 20% be used as a preliminary evaluation benchmark for green and efficient mines, providing policymakers with a quantitative standard to promote environmentally friendly mining.
  • STI Optimization: Through STI, the optimal balance point for coal recovery and water resource protection can be identified, providing a scientific basis for mine planning.
  • Global coherence: The indicator system proposed in this article is highly aligned with the United Nations Sustainable Development Goals (SDGs), particularly SDG 6, 12, and 13. Although its applicability in different mining areas still needs further verification, this framework provides an innovative reference for incorporating sustainability indicators into environmental impact assessments and mining approval processes.
These indicators help translate complex simulation results into a common language that can be understood by different stakeholders, promoting a more transparent and sustainable decision-making process that aligns with national environmental policies and the global sustainable development agenda.

4.4. Limitations and Prospects

This study used a two-dimensional model that effectively captures the basic mechanisms within the cross-section. However, it is necessary to acknowledge the limitations of this work. Numerical simulations have high requirements for parameters, and the accuracy of the parameters can affect the results of the simulations. It should be noted that in practical engineering applications, the mechanical parameters used in the simulations should be obtained as accurately as possible. At the same time, the crack networks and fluid flow in the real world are three-dimensional. Future research should adopt three-dimensional simulations to validate and refine these findings. Additionally, long-term field monitoring of groundwater levels and water quality in the Buertai coal mine is crucial for calibrating the model and verifying the actual effectiveness of the proposed protective measures. Finally, future iterations of STI could expand to include socioeconomic factors, such as the impact on local community water supply and the economic costs of water treatment, to provide a more comprehensive sustainability assessment.

5. Conclusions

This study is set against the background of the Buertai coal mine in the Shendong mining area. Based on complex coal seam geological conditions and the extraction of multiple coal seams, the impact of coal seam thickness and coal pillar arrangement on the height of water-conducting fracture zones and water inflow was analyzed using Abaqus CAE numerical simulation software. Three new indicators are proposed—GLI, APE, and STI—in order to optimize mine design to enhance sustainability.
  • Impact of coal seam thickness: The thickness of the coal seam is a major driver of groundwater depletion. While increasing coal seam thickness is economically attractive, it could lead to a significant rise in groundwater loss at the Buertai coal mine, especially with a notable increase in water inflow from deeper coal seams, reaching up to 1.8 times. The proposed Groundwater Loss Index (GLI) successfully quantifies this risk, providing a scientific measurement for identifying mining plans with high environmental impact.
  • Optimizing coal pillar layout: Optimizing the arrangement of coal pillars, especially using staggered layouts, can effectively reduce the roof cracking in the Buertai coal mine and significantly lower the underground water inflow in the Buertai coal mine, with a maximum reduction of 26.7%. The aquifer protection efficiency (APE) provides a practical benchmark for green mining design, and optimizing coal pillar layout helps to enhance groundwater protection and reduce the risk of water disasters.
  • Sustainability Trade-offs: The Sustainability Trade-off Index (STI) provides a framework for balancing production, safety, and environmental protection in the design of the Buertai coal mine. The STI helps identify operational windows for achieving synergistic optimization among these goals, going beyond traditional single-objective planning and promoting the development of the Buertai coal mine towards a more sustainable direction.
  • Policy Relevance: The proposed GLI, APE, and STI indicators show potential for application in environmental impact assessments, mining approval processes, and sustainability certification systems. These quantitative indicators may provide a useful scientific basis for aligning mining practices with national green development goals and international sustainability frameworks (such as the SDGs). However, their applicability under different geological and mining conditions still needs to be further verified through field investigations and long-term monitoring.
  • Sustainable Mining Recommendations: To reduce environmental impact and improve management efficiency, it is recommended to: first, optimize coal pillar design based on APE thresholds, balancing recovery rates with aquifer protection; then, incorporate GLI and STI early warning systems into mine planning and safety monitoring platforms to achieve real-time risk control; and finally, establish an interdisciplinary monitoring network that integrates hydrogeology, rock mechanics, and ecological data to enable full-process sustainable assessment.
In summary, this study shifts the focus from pure disaster prevention to a comprehensive, sustainability-oriented design framework for the Buertai coal mine, ensuring the protection of groundwater resources, the enhancement of ecological resilience, and the responsible extraction of energy resources. The findings of this research provide innovative sustainability decision-making tools for the planning of the Buertai coal mine and offer a new approach for green mining in other coal mines, contributing to the construction and development of green coal mines.

Author Contributions

Software, T.Q. and H.L.; Data research, T.Q. and H.L.; Validation, H.L.; Writing—original draft, T.Q.; Writing—review and editing, H.L. and Z.Z.; Supervision, Z.K. and D.Y. All authors have read and agreed to the published version of the manuscript.

Funding

This research was financially supported by The National Natural Science Foundation of China (No. 42102310), and Fundamental Research Program of Shanxi Province (No. 20210302123106).

Institutional Review Board Statement

Not applicable.

Informed Consent Statement

Not applicable.

Data Availability Statement

The original data presented in this study are included in the article. Further inquiries can be directed to the corresponding author(s).

Conflicts of Interest

On behalf of all authors, the corresponding author states that there are no conflicts of interest.

References

  1. Hamilton, C.; Song, J.; Cui, R.; Olson, C.; Cui, D. Evaluating provincial-level employment challenge during the coal transition in China. Adv. Clim. Change Res. 2022, 13, 729–737. [Google Scholar] [CrossRef]
  2. Wang, Y.; Liu, F.; Kou, M.; Li, M. A Review of Stability of Dam Structures in Coal Mine Underground Reservoirs. Water 2024, 16, 1856. [Google Scholar] [CrossRef]
  3. Audin, J. The coal transition in Datong: An ethnographic perspective. Made China J. 2020, 5, 34–43. [Google Scholar] [CrossRef]
  4. Yuan, Z.; Yan, D.; Yang, Z.; Yin, J.; Yuan, Y. Research on temporal and spatial change of 400 mm and 800 mm rainfall contours of China in 1961–2000. Adv. Water Sci. 2014, 25, 494–502. [Google Scholar]
  5. Liu, Y.; Tang, X.; Sun, Z.; Zhang, J.; Wang, G.; Jin, J.; Wang, G. Spatiotemporal precipitation variability and potential drivers during 1961–2015 over the Yellow River Basin, China. Weather 2019, 74, S32–S39. [Google Scholar] [CrossRef]
  6. Shen, Y.; Hong, Z.; Pan, Y.; Yu, J.; Maguire, L. China’s 1 km merged gauge, radar and satellite experimental precipitation dataset. Remote Sens. 2018, 10, 264. [Google Scholar] [CrossRef]
  7. Meng, Z.; Shi, X.; Li, G. Deformation, failure and permeability of coal-bearing strata during longwall mining. Eng. Geol. 2016, 208, 69–80. [Google Scholar] [CrossRef]
  8. Palchik, V. Formation of fractured zones in overburden due to longwall mining. Environ. Geol. 2003, 44, 28–38. [Google Scholar] [CrossRef]
  9. Bu, W.K.; Mao, X. Research on effect of fault dip on fault activation and water inrush of coal floor. Chin. J. Rock Mech. Eng. 2009, 28, 386–394. [Google Scholar]
  10. Sui, W.; Liu, J.; Gao, B.; Liang, Y. A review on disaster mechanism of quicksand with a high potential energy due to mining and its prevention and control. China Coal Soc. 2019, 44, 2419–2426. [Google Scholar]
  11. Xie, H. Research review of the state key research development program of China: Deep rock mechanics and mining theory. J. China Coal Soc. 2019, 44, 1283–1305. [Google Scholar]
  12. Tati, B.B. Multi-seam coal mining. J. S. Afr. Inst. Min. Metall. 2011, 111, 231–242. [Google Scholar]
  13. Kunz, N.C. Towards a broadened view of water security in mining regions. Water Secur. 2020, 11, 100079. [Google Scholar] [CrossRef]
  14. Mahato, M.K.; Singh, P.K.; Singh, A.K.; Tiwari, A.K. Assessment of Hydrogeochemical Processes and Mine Water Suitability for Domestic, Irrigation, and Industrial Purposes in East Bokaro Coalfield, India. Mine Water Environ. 2018, 37, 493–504. [Google Scholar] [CrossRef]
  15. Gandhe, A.; Venkateswarlu, V.; Gupta, R.N. Extraction of Coal Under a Surface Water Body—A Strata Control Investigation. Rock Mech. Rock Eng. 2005, 38, 399–410. [Google Scholar] [CrossRef]
  16. Booth, C.J.; Spande, E.D.; Pattee, C.T.; Miller, J.D.; Bertsch, L.P. Positive and negative impacts of longwall mine subsidence on a sandstone aquifer. Environ. Geol. 1998, 34, 223–233. [Google Scholar] [CrossRef]
  17. Bruns, D.A. Macroinvertebrate response to land cover, habitat, and water chemistry in a mining-impacted river ecosystem: A GIS watershed analysis. Aquat. Sci. 2005, 67, 403–423. [Google Scholar] [CrossRef]
  18. Candeias, C.; Ávila, P.F.; Ferreira da Silva, E.; Teixeira, J.P. Integrated approach to assess the environmental impact of mining activities: Estimation of the spatial distribution of soil contamination (Panasqueira mining area, Central Portugal). Environ. Monit. Assess. 2015, 187, 135. [Google Scholar] [CrossRef]
  19. Cooper, D.J.; Sanderson, J.S.; Stannard, D.I.; Groeneveld, D.P. Effects of long-term water table drawdown on evapotranspiration and vegetation in an arid region phreatophyte community. J. Hydrol. 2006, 325, 21–34. [Google Scholar] [CrossRef]
  20. Newman, C.; Agioutantis, Z.; Leon, G.B.J. Assessment of potential impacts to surface and subsurface water bodies due to longwall mining. Int. J. Min. Sci. Technol. 2017, 27, 57–64. [Google Scholar] [CrossRef]
  21. He, J.; Li, W.; Fan, K.; Qiao, W.; Wang, Q.; Li, L. A method for predicting the water-flowing fractured zone height based on an improved key stratum theory. Int. J. Min. Sci. Technol. 2023, 33, 61–71. [Google Scholar] [CrossRef]
  22. Jiang, D.; Tang, Y.; Huang, W.; Hou, K.; Luo, Y.; Liu, J. Research on the height of the water-conducting fracture zone in fully mechanized top coal caving face under combined-strata structure. Sustainability 2022, 14, 13781. [Google Scholar] [CrossRef]
  23. Wang, W.; Li, Z.; Du, F.; Li, G. Study on fracture characteristics of high key stratum and development law of water and gas transport channels in Datong mining area. Energy Sci. Eng. 2023, 11, 48–61. [Google Scholar] [CrossRef]
  24. Li, A.; Ding, X.; Yu, Z.; Wang, M.; Mu, Q.; Dai, Z.; Li, H.; Zhang, B.; Han, T. Prediction model of fracture depth and water inrush risk zoning in deep mining coal seam floor. Environ. Earth Sci. 2022, 81, 315. [Google Scholar] [CrossRef]
  25. Chen, L.; Ou, Q.; Peng, Z.; Wang, Y.; Chen, Y.; Tian, Y. Numerical simulation of abnormal roof water-inrush mechanism in mining under unconsolidated aquifer based on overburden dynamic damage. Eng. Fail. Anal. 2022, 133, 106005. [Google Scholar] [CrossRef]
  26. Han, Y.; Wang, Q.; Li, W.; Yang, Z.; Gu, T.; Wang, Z. Predicting the height of the water-conducting fractured zone in fully mechanized top coal caving longwall mining of very thick jurassic coal seams in western China based on the NNBR model. Mine Water Environ. 2023, 42, 121–133. [Google Scholar] [CrossRef]
  27. Li, J.; He, Z.; Piao, C.; Chi, W.; Lu, Y. Research on Subsidence Prediction Method of Water-Conducting Fracture Zone of Overlying Strata in Coal Mine Based on Grey Theory Model. Water 2023, 15, 4177. [Google Scholar] [CrossRef]
  28. Lei, W.; Chai, J.; Zhang, Y.; Ding, G.; Yao, R.; Chen, Y.; Wang, Z.; Ma, C. Study on pressure relief effect of upper protective coal seam mining based on distributed optical fiber sensing monitoring. Opt. Fiber Technol. 2022, 68, 102830. [Google Scholar] [CrossRef]
  29. Guarneri, M.; Ceccarelli, S.; Francucci, M.; de Collibus, M.F.; Ciaffi, M.; Gusella, V.; Liberotti, R.; La Torre, M. Multi-sensor analysis for experimental diagnostic and monitoring techniques at san bevignate templar church in perugia. Int. Arch. Photogramm. Remote Sens. Spat. Inf. Sci. 2023, 48, 693–700. [Google Scholar] [CrossRef]
  30. Lu, C.; Xu, J.; Li, Q.; Zhao, H.; He, Y. Research on the Development Law of Water-Conducting Fracture Zone in the Combined Mining of Jurassic and Carboniferous Coal Seams. Appl. Sci. 2022, 12, 11178. [Google Scholar] [CrossRef]
  31. Wang, X.; Li, H. Failure height and fracture evolution pattern of overburden rock in fully mechanized cave mining. Arab. J. Geosci. 2022, 15, 443. [Google Scholar] [CrossRef]
  32. Panza, E.; Berto, C.; Luzi, E.; Agosta, F.; Zambrano, M.; Tondi, E.; Prosser, G.; Giorgioni, M.; Janiseck, J.M. Structural architecture and Discrete Fracture Network modelling of layered fractured carbonates (Altamura Fm., Italy). Ital. J. Geosci. 2015, 134, 409–422. [Google Scholar] [CrossRef]
  33. Vyazmensky, A.; Stead, D.; Elmo, D.; Moss, A. Numerical analysis of block caving-induced instability in large open pit slopes: A finite element/discrete element approach. Rock Mech. Rock Eng. 2010, 43, 21–39. [Google Scholar] [CrossRef]
  34. Fan, H.; Luo, F.; Gao, S.; Li, M.; Lv, Z.; Sun, G. Evolution law of mining-induced overburden stratum stress and fracture fields in inclined coal seam. World J. Eng. 2024, 21, 475–486. [Google Scholar] [CrossRef]
  35. Munjiza, A.; Owen, D.; Bicanic, N. A combined finite-discrete element method in transient dynamics of fracturing solids. Eng. Comput. 1995, 12, 145–174. [Google Scholar] [CrossRef]
  36. Munjiza, A.; Andrews, K.R.F.; White, J.K. Combined single and smeared crack model in combined finite-discrete element analysis. Int. J. Numer. Methods Eng. 1999, 44, 41–57. [Google Scholar] [CrossRef]
  37. Mai, L.; Li, H. Finite–Discrete Element Method Simulation Study on Development of Water-Conducting Fractures in Fault-Bearing Roof under Repeated Mining of Extra-Thick Coal Seams. Sustainability 2024, 16, 5177. [Google Scholar] [CrossRef]
  38. Liu, J.; Zhao, Y.; Tan, T.; Zhang, L.; Zhu, S.; Xu, F. Evolution and modeling of mine water inflow and hazard characteristics in southern coalfields of China: A case of Meitanba mine. Int. J. Min. Sci. Technol. 2022, 32, 513–524. [Google Scholar] [CrossRef]
  39. Li, H.; Tang, S.; Ma, L.; Bai, H.; Kang, Z.; Wu, P.; Miao, X. Continuous-discrete coupling simulation of progressive failure of mining overburden rock. Chin. J. Rock Mech. Eng. 2022, 41, 2299–2310. [Google Scholar]
  40. Zhang, Y.; Yang, L. A novel dynamic predictive method of water inrush from coal floor based on gated recurrent unit model. Nat. Hazards 2021, 105, 2027–2043. [Google Scholar] [CrossRef]
  41. Cao, J.; Dou, L.; Konietzky, H.; Zhou, K.; Zhang, M. Failure mechanism and control of the coal bursts triggered by mining-induced seismicity: A case study. Environ. Earth Sci. 2023, 82, 168. [Google Scholar] [CrossRef]
  42. Zhang, L.; Yan, X.; Yang, X.; Tian, Z.; Yang, H. An elastoplastic model of collapse pressure for deep coal seam drilling based on Hoek–Brown criterion related to drilling fluid loss to reservoir. J. Pet. Sci. Eng. 2015, 134, 205–213. [Google Scholar] [CrossRef]
  43. Zhang, W.; Li, S.; Wei, J.; Zhang, Q.; Liu, R.; Zhang, X.; Yin, H. Grouting rock fractures with cement and sodium silicate grout. Carbonates Evaporites 2018, 33, 211–222. [Google Scholar] [CrossRef]
  44. Li, L.; Xie, D.; Wei, J.; Yin, H.; Li, G.; Man, X.; Zhang, W. Analysis and control of water inrush under high-pressure and complex karstic water-filling conditions. Environ. Earth Sci. 2020, 79, 493. [Google Scholar] [CrossRef]
  45. Zhou, X.; Ouyang, Z.; Zhou, R.; Ji, Z.; Yi, H.; Tang, Z.; Chang, B.; Yang, C.; Sun, B. An Approach to Dynamic Disaster Prevention in Strong Rock Burst Coal Seam under Multi-Aquifers: A Case Study of Tingnan Coal Mine. Energies 2021, 14, 7287. [Google Scholar] [CrossRef]
  46. Ma, Q.; Liu, X.; Tan, Y.; Wang, Y.; Wang, R.; Wang, E.; Liu, X.; Zhao, Z.; Ren, D.; Xie, W.; et al. Monitoring and evaluation of disaster risk caused by linkage failure and instability of residual coal pillar and rock strata in multi-coal seam mining. Geohazard Mech. 2023, 1, 297–307. [Google Scholar] [CrossRef]
  47. Liu, X.; Wang, J.; Du, S.; Deng, K.; Chen, G.; Qin, X. Monitoring and Law Analysis of Secondary Deformation on the Surface of Multi-Coal Seam Mining in Closed Mines. Remote Sens. 2024, 16, 3223. [Google Scholar] [CrossRef]
  48. Wang, X.; Tan, C.; Wang, X. Study on the damage risk assessment of mining geological aquifer based on remote sensing monitoring method. Fresenius Environ. Bull. 2022, 31, 10513–10522. [Google Scholar]
  49. Deveci, M.; Varouchakis, E.A.; Brito-Parada, P.R.; Mishra, A.R.; Rani, P.; Bolgkoranou, M.; Galetakis, M. Evaluation of risks impeding sustainable mining using Fermatean fuzzy score function based SWARA method. Appl. Soft Comput. 2023, 139, 110220. [Google Scholar] [CrossRef]
  50. Mirzehi, M.; Afrapoli, A.M. A novel framework for integrating environmental costs and carbon pricing in open-pit mine plans: Towards sustainable and green mining. J. Clean. Prod. 2024, 468, 143059. [Google Scholar] [CrossRef]
  51. Al Heib, M.M.; Franck, C.; Djizanne, H.; Degas, M. Post-Mining Multi-Hazard Assessment for Sustainable Development. Sustainability 2023, 15, 8139. [Google Scholar] [CrossRef]
  52. Li, H.; Liang, W.; Li, G.; Bai, J.; Wang, J.; Wu, P. Ductile failure-seepage coupling constitutive equations of broken soft coal and its verification in indirect fracturing engineering. J. China Coal Soc. 2021, 46, 924–936. [Google Scholar]
  53. Ghavidel, A.; Mousavi, S.R.; Rashki, M. The Effect of FEM Mesh Density on the Failure Probability Analysis of Structures. KSCE J. Civ. Eng. 2018, 22, 2371–2383. [Google Scholar] [CrossRef]
  54. Zabolotnii, E.; Morgenstern, N.R.; Ward Wilson, G. Mesh sensitivity in numerical models of strain-weakening systems. Comput. Geotech. 2021, 136, 104253. [Google Scholar] [CrossRef]
  55. Liu, H.; Tang, C.; Rui, Y. Numerical simulation of strata failure process with multi-coal strata mined. Chin. J. Rock Mech. Eng. 2001, 20, 190–196. [Google Scholar]
  56. Ning, W.J.; Tao, L.W.; Cheng, S.W. Numerical Simulation and Test Analysis of Development Height of Fractured Zone in Overlying Strata. Coal Technol. 2017, 36, 149–151. [Google Scholar]
  57. Li, H.; Bai, H.; Wu, J.; Ma, Z.; Ma, K.; Wu, G.; Du, Y.; He, S. A Cascade Disaster Caused by Geological and Coupled Hydro-Mechanical Factors—Water Inrush Mechanism from Karst Collapse Column under Confining Pressure. Energies 2017, 10, 1938. [Google Scholar] [CrossRef]
  58. Hajiabdolmajid, V.; Kaiser, P. Brittleness of rock and stability assessment in hard rock tunneling. Tunn. Undergr. Space Technol. 2003, 18, 35–48. [Google Scholar] [CrossRef]
  59. Ma, Q.; Liu, X.; Qian, R.; Tan, Y.; Li, B.Q.; Liu, X. Progressive failure processes and mechanisms of disasters caused by interrelated failure of residual coal pillars and rock strata. Sci. Total Environ. 2024, 954, 176181. [Google Scholar] [CrossRef] [PubMed]
  60. Shabanimashcool, M.; Li, C.C. Numerical modelling of longwall mining and stability analysis of the gates in a coal mine. Int. J. Rock Mech. Min. Sci. 2012, 51, 24–34. [Google Scholar] [CrossRef]
  61. Suchowerska, A.; Merifield, R.S.; Carter, J.P. Vertical stress changes in multi-seam mining under supercritical longwall panels. Int. J. Rock Mech. Min. Sci. 2013, 61, 306–320. [Google Scholar] [CrossRef]
  62. Wu, C.; Wu, X.; Zhu, G.; Qian, C. Predicting mine water inflow and groundwater levels for coal mining operations in the Pangpangta coalfield, China. Environ. Earth Sci. 2019, 78, 130. [Google Scholar] [CrossRef]
  63. Li, X.; Du, S.; Hu, S.; Dong, D.; Jiang, D.; Cao, C.; Lin, G.; Fu, J. Simulation of surface water–groundwater interaction in coal mining subsidence areas: A case study of the Kuye River Basin in China. J. Hydrol. 2025, 659, 133243. [Google Scholar] [CrossRef]
  64. Heidar, M.R.; Ardejani, F.D.; Taherdangkoo, R.; Shokri, B.J.; Butscher, C. A Novel Empirical-Analytical Model for Predicting Groundwater Inflow into an Open Pit Partially Penetrating an Unconfined Aquifer. Mine Water Environ. 2025, 44, 631–640. [Google Scholar] [CrossRef]
Figure 1. Position of Buertai coal mine.
Sustainability 17 09512 g001
Figure 2. Profile of 22 coal and 42 coal working faces in Buertai Coal Mine.
Sustainability 17 09512 g002
Figure 3. Model 1 stratum layout diagram.
Sustainability 17 09512 g003
Figure 4. Model 2 stratum layout diagram.
Sustainability 17 09512 g004
Figure 5. Fluid–solid coupling mechanical response of overlying strata after No. 42 coal mining (changes in coal seam thickness).
Sustainability 17 09512 g005aSustainability 17 09512 g005b
Figure 6. Changes in numerical values caused by variations in coal seam thickness.
Sustainability 17 09512 g006
Figure 7. Fluid–solid coupling mechanical response of overlying strata after No. 42 coal mining (changes in coal pillar spacing).
Sustainability 17 09512 g007aSustainability 17 09512 g007b
Figure 8. Changes in numerical values caused by variations in the spacing of coal pillars.
Sustainability 17 09512 g008
Figure 9. Comparison of experimental and calculated results under different confining pressures [57].
Sustainability 17 09512 g009
Table 1. Material parameters.
E0/GPac/MPaφknd/(m/s)kd/(m/s)np/%
Coal1.632.7271.3 × 10−115.6 × 10−93.1
Mudstone3.584.3321.1 × 10−113.2 × 10−92.6
Sandy mudstone7.226.5384.2 × 10−102.9 × 10−74.6
Medium sandstone14.3510.3427.6 × 10−91.2 × 10−612.7
Fine sandstone12.3311.1402.8 × 10−93.3 × 10−610.3
Siltstone17.548.4378.1 × 10−101.1 × 10−68.3
Table 2. Simulation results and sustainability indicators under different coal seam thicknesses.
Scenario (CST, CPP)PZH/mTIV (m3/h)GLIAPE/%STI (w = 1/3)
4 m, 0 m1551611.0028.10.67
6 m, 0 m1601701.0624.10.60
8 m, 0 m1641901.1815.20.50
10 m, 0 m1682241.390.00.33
Note: CST is the abbreviation for coal seam thickness; CPP is the abbreviation for the position of the coal pillar; PZH is the abbreviation for the height of the plastic zone; TIV is the abbreviation for total inflow volume. The GLI benchmark is scenario (4 m, 0 m); the worst case for APE is (10 m, 0 m). CST data uses aligned coal pillars; CPP data assumes it is conducted under a coal seam thickness of 4 m.
Table 3. Simulation results under different coal pillar arrangements and sustainability indicators.
Scenario (CST, CPP)PZH/mTIV (m3/h)GLIAPE/%STI (w = 1/3)
4 m, 0 m1581911.360.00.29
4 m, 20 m1641801.295.80.22
4 m, 60 m1681721.239.90.17
4 m, 100 m1621601.1416.20.39
4 m, 138 m1701531.0919.90.25
4 m, 160 m1561401.0026.70.67
Note: CST is the abbreviation for coal seam thickness; CPP is the abbreviation for the position of the coal pillar; PZH is the abbreviation for the height of the plastic zone; TIV is the abbreviation for total inflow volume. The GLI benchmark is scenario (4 m, 160 m); the worst case for APE is (4 m, 0 m). CST data uses aligned coal pillars; CPP data assumes it is conducted under a coal seam thickness of 4 m.
Disclaimer/Publisher’s Note: The statements, opinions and data contained in all publications are solely those of the individual author(s) and contributor(s) and not of MDPI and/or the editor(s). MDPI and/or the editor(s) disclaim responsibility for any injury to people or property resulting from any ideas, methods, instructions or products referred to in the content.