Article

Spatiotemporal Evolution and Driving Factors of the Cooling Capacity of Urban Green Spaces in Beijing over the Past Four Decades

1
School of Civil Engineering and Geomatics, Shandong University of Technology, Zibo 255000, China
2
State Key Laboratory of Regional and Urban Ecology, Research Center for Eco-Environmental Sciences, Chinese Academy of Sciences, Beijing 100085, China
*
Author to whom correspondence should be addressed.
Sustainability 2025, 17(21), 9500; https://doi.org/10.3390/su17219500 (registering DOI)
Submission received: 26 September 2025 / Revised: 17 October 2025 / Accepted: 23 October 2025 / Published: 25 October 2025

Abstract

Urban green spaces (UGS) are crucial for mitigating rising urban land surface temperatures (LST). Rapid urbanization presents unresolved questions regarding (a) seasonal variations in the spatial co-distribution of UGS and LST, (b) the temporal and spatial changes in UGS cooling, and (c) the dominant factors driving cooling effects during different periods. This study focuses on Beijing’s Fifth Ring Road area, utilizing nearly 40 years of Landsat remote sensing imagery and land cover data. We propose a novel nine-square grid spatial analysis approach that integrates LST retrieval, profile line analysis, and the XGBoost algorithm to investigate the long-term spatiotemporal evolution of UGS cooling capacity and its driving mechanisms. The results demonstrate three key findings: (1) Strong seasonal divergence in UGS-LST correlation: A significant negative correlation dominates during summer months (June–August), whereas winter (December–February) exhibits marked weakening of this relationship, with localized positive correlations indicating thermal inversion effects. (2) Dynamic evolution of cooling capacity under urbanization: Urban expansion has reconfigured UGS spatial patterns, with a cooling capacity of UGS showing an “enhancement–decline–enhancement” trend over time. Analysis through machine learning on the significance of landscape metrics revealed that scale-related metrics play a dominant role in the early stage of urbanization, while the focus shifts to quality-related metrics in the later phase. (3) Optimal cooling efficiency threshold: Maximum per-unit-area cooling intensity occurs at 10–20% UGS coverage, yielding an average LST reduction of approximately 1 °C relative to non-vegetated surfaces. This study elucidates the spatiotemporal evolution of UGS cooling effects during urbanization, establishing a robust scientific foundation for optimizing green space configuration and enhancing urban climate resilience.

1. Introduction

With rapid socio-economic advancement, urbanization is progressing at an unprecedented pace. This process has triggered a sharp increase in urban populations [1,2], the continuous expansion of impervious surfaces (e.g., buildings and roads), and the gradual replacement of traditional low-rise buildings with mid-to-high-rise structures [3,4,5]. These impervious surfaces absorb and retain substantial heat, significantly elevating urban temperatures above those in surrounding rural areas—a phenomenon known as the urban heat island (UHI) effect [6,7,8]. In China, major cities including Beijing, Shanghai, and Nanjing exhibit pronounced UHI intensity, a critical environmental challenge in contemporary urban development [9,10,11,12].
Sustainable urban development has become a globally recognized objective, with particular urgency for rapidly urbanizing nations such as China. Mitigating urbanization’s adverse impacts and enhancing rural-urban environmental linkages now constitute critical research priorities. Consequently, diverse mitigation strategies have been adopted—including improved energy efficiency, greenhouse gas reduction, and green infrastructure development—to foster climate-resilient urbanization [13,14,15,16]. Among these strategies, UGS plays a critical role [17,18,19]. Through transpirative cooling and shading effects, UGS significantly reduces local LST [20,21,22]. Compared to alternative UHI mitigation measures, UGS provides more practical and scalable solutions for enhancing urban thermal comfort [23,24,25]. Consequently, UGS expansion and protection are globally endorsed as effective UHI countermeasures [26,27]. These green spaces—varying in size and distribution—generate localized cooling not only within their boundaries but also across adjacent areas, establishing “cooling islands” in urban landscapes [28,29,30,31,32,33].
A comprehensive understanding of UGS cooling effects critically informs UHI mitigation, microclimate improvement, and thermal comfort enhancement. Such studies provide scientific foundations for climate adaptation strategies, advancing green city development and facilitating synergistic optimization of ecological-human habitat systems [34,35,36]. In recent years, research on the cooling effects of UGS has advanced significantly in data acquisition, methodological innovation, and result interpretation. Studies have progressed from early field measurements to extensively utilizing remote sensing imagery—such as MODIS, Landsat, and Sentinel-2—for extracting LST and vegetation indices [37,38,39,40]. Methodologically, the integration of statistical analysis, spatial modeling, machine learning, and computational fluid dynamics (CFD) simulations has significantly advanced our understanding of UGS cooling mechanisms. A growing body of evidence confirms that UGS exert substantial cooling effects, with intensity modulated by factors such as green space area, shape, vegetation type, and surrounding environment [41,42,43,44]. Composite green spaces—such as forest-water complexes—demonstrate enhanced cooling efficiency. Typically, the cooling effect extends up to 500 m from green space boundaries, though significant spatial heterogeneity occurs across climatic regions [28,42,45].
Despite considerable progress, current research remains limited. Temporally, studies are often restricted to short time frames and suffer from a scarcity of long-term time series data, impeding comprehensive analyses of UGS cooling effect dynamics [46,47,48]. Conventional studies have predominantly focused on individual parks or specific urban blocks, thus failing to capture a holistic perspective of the thermal landscape across broader urban areas. Furthermore, their methodological approaches remain relatively conventional and have not adequately integrated cutting-edge technologies such as machine learning [49].
To address these gaps, this study focuses on the area within Beijing’s Fifth Ring Road, employing granular spatial indicators and advanced methodologies—including machine learning modeling. Specifically, it aims to (1) investigate the spatiotemporal evolution of UGS–LST relationships; (2) analyze the cooling capacity dynamics of UGS across space and time; and (3) identify key drivers of UGS cooling effects. These findings will complement the research gap on the relationship between green space configuration and thermal regulation over multiple decades at the urban scale, a field that has not been adequately explored in previous studies, whether in Beijing or other metropolitan areas. It is anticipated that these findings will provide empirical evidence for optimizing UGS design and support urban planning strategies aimed at maximizing the potential for UHI.

2. Materials and Methods

2.1. Materials

2.1.1. Study Area

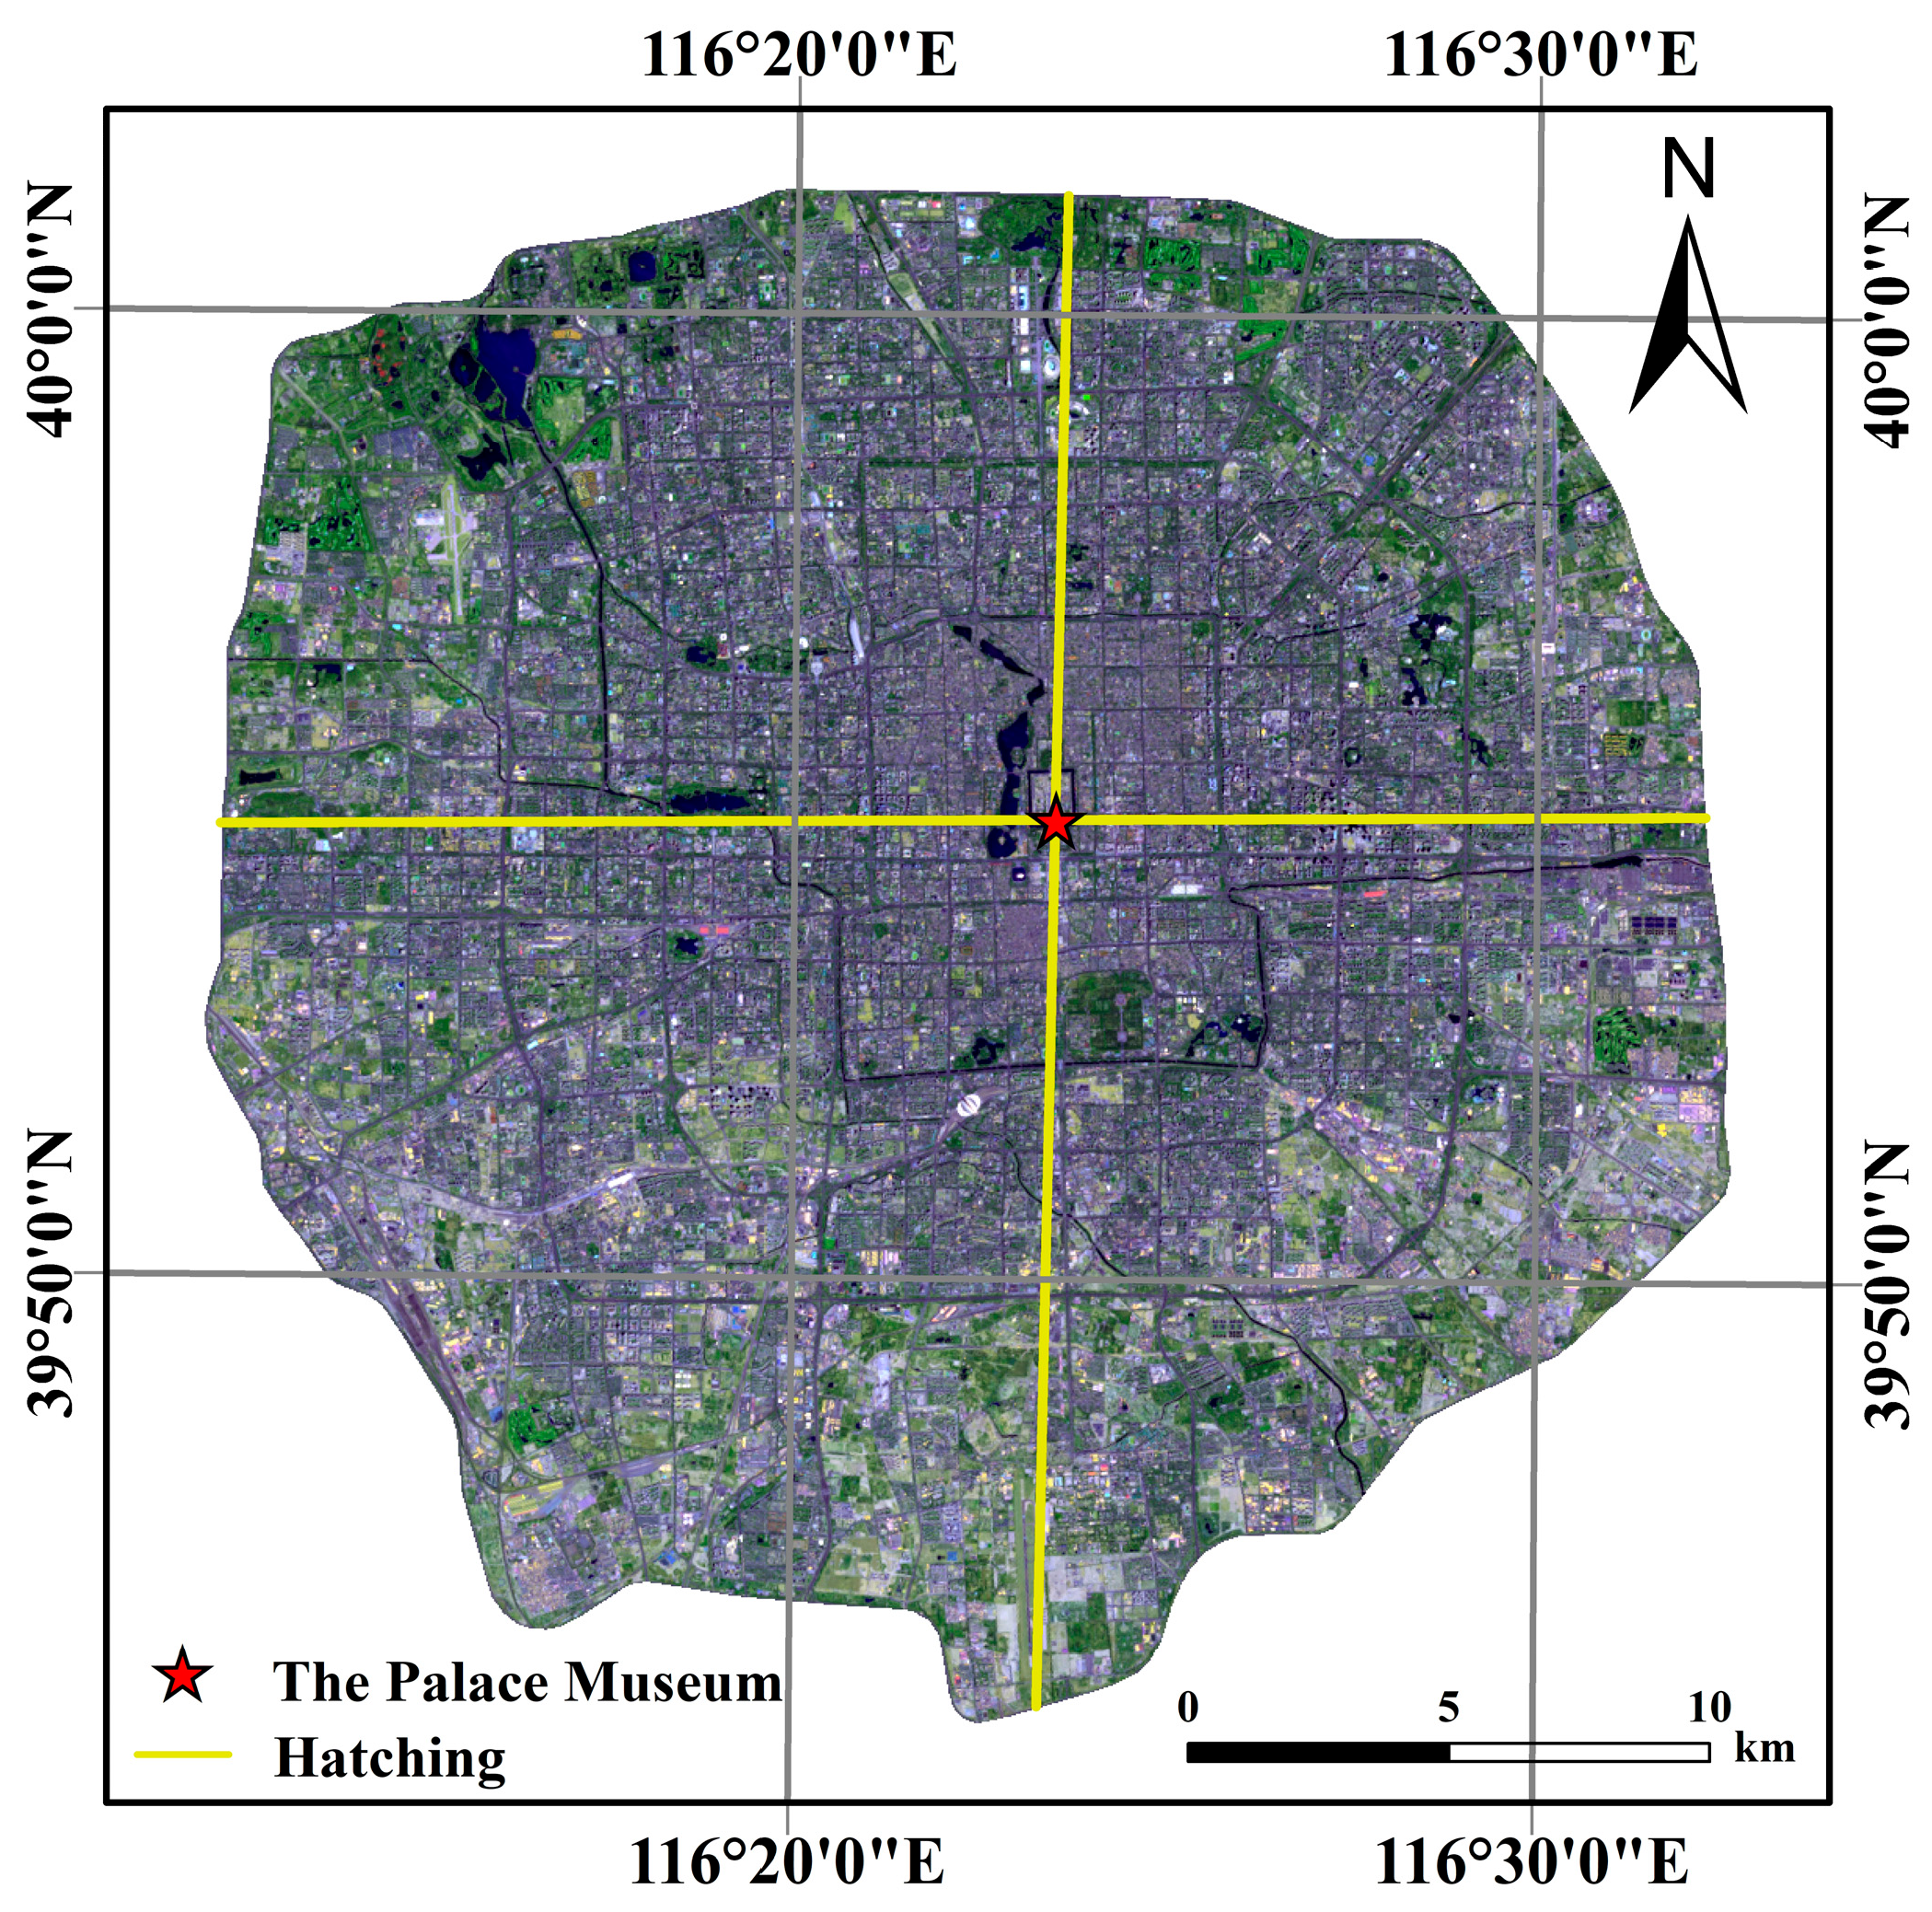
Beijing (39°56′ N, 116°20′ E) is situated in northern China along the northern margin of the North China Plain, bordering Tianjin Municipality to the east and surrounded by Hebei Province elsewhere [50]. As one of China’s most urbanized cities, Beijing exhibits distinct topography and a temperate-monsoon climate. The terrain descends from the northwestern highlands to the southeastern lowlands, with mountains encircling the western, northern, and northeastern sectors. The southeastern slopes transition into a broad alluvial plain extending toward the Bohai Sea. Climatically, summers are hot-humid and winters cold-dry, with abbreviated spring and autumn seasons. Rapid urbanization has intensified summer high-temperature events and amplified the UHI effect, positioning Beijing as an exemplary study area for evaluating UGS cooling efficacy. This research concentrates on the zone between the Inner City and Fifth Ring Road—encompassing Beijing’s primary transportation hub and core development corridor. This densely populated region plays a pivotal role in the city’s spatial-functional structure (study area location shown in Figure 1.

2.1.2. Data Sources

This study utilized Landsat TM-5 and Landsat 8 OLI/TIRS imagery (30 m spatial resolution), acquired from the China Geospatial Data Cloud (http://www.gscloud.cn). To capture long-term trends, summer (June–August) and winter (December–February) scenes were selected at decadal intervals from 1984 to 2021, ensuring representation of key variables under contrasting climatic conditions. For enhanced temporal reliability, seasonal composites were generated from the mean of three high-quality, cloud-free images. Where intra-seasonal data gaps existed, imagery from adjacent years within the same season was substituted to maintain temporal continuity in UGS cooling analysis. Land cover data (CLCD; 30 m resolution) were sourced from Zenodo (https://zenodo.org/records/8176941, Accessed on 9 December 2024). Auxiliary datasets included meteorological station records, Beijing administrative boundaries, a digital elevation model (DEM), and Google Earth high-resolution imagery. Detailed image metadata is provided in Table 1.

2.2. Methods

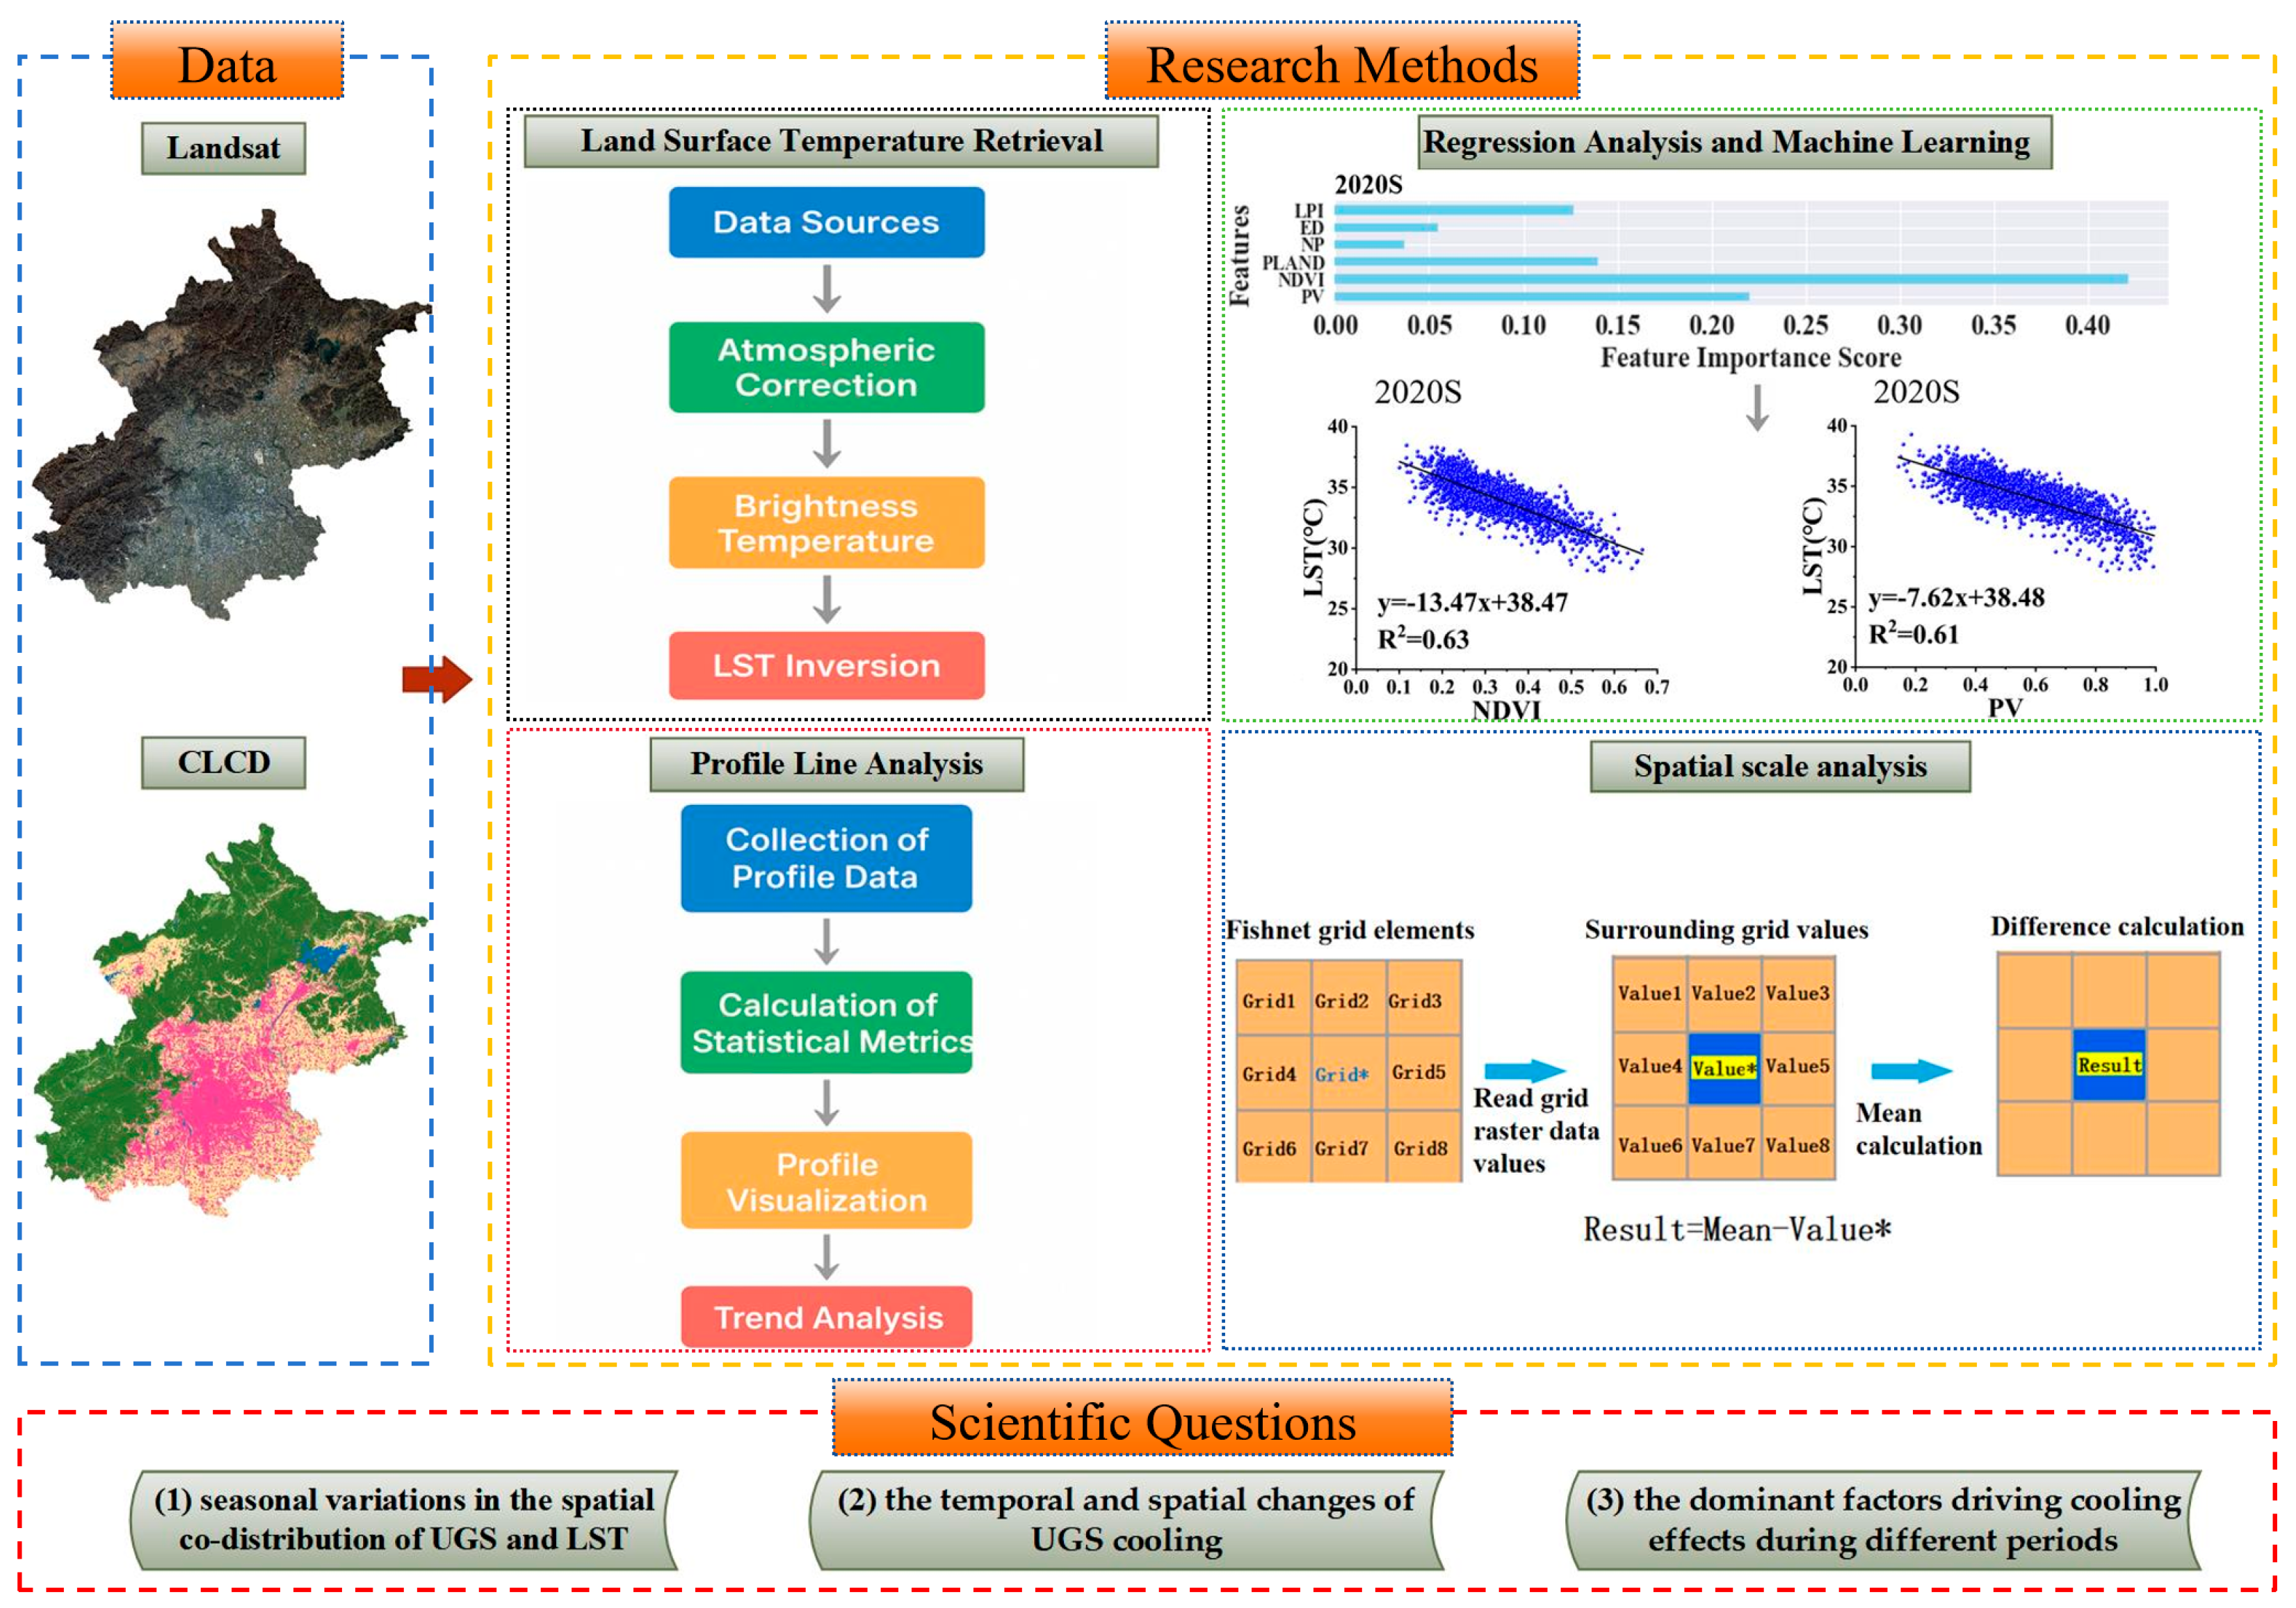
The technical workflow of this study is illustrated in Figure 2. Landsat-derived LST, Normalized Difference Vegetation Index (NDVI), and Percentage of Vegetation (PV) were integrated with CLCD land cover data. Regression analysis, machine learning, profile-based assessment, and multi-scale spatial analysis were employed to examine: (1) UGS spatial pattern evolution, (2) LST heterogeneity, and (3) spatiotemporal dynamics and drivers of UGS cooling effects.

2.2.1. LST Retrieval

To ensure accurate LST retrieval, this study employed the atmospheric correction method [51]. Brightness temperature—the radiatively derived temperature recorded by satellite sensors—was corrected to retrieve LST. The relationship between brightness temperature and LST is expressed as follows:
L λ = B λ T s u r f ε λ B λ T a t m 1 ε λ
In this context, L λ represents the brightness temperature (K) obtained from remote sensing imagery; B λ T s u r f denotes the blackbody radiance of the land surface (W/m2·sr·μm), which is directly associated with LST( T s u r f ); ε λ is the land surface emissivity, typically determined by surface material characteristics; and T a t m indicates the atmospheric temperature (K).

2.2.2. Profile Line Analysis

Profile-line analysis—a key spatial technique in urban thermal environment studies—elucidates temperature gradients across land cover transitions [52,53]. This method quantifies thermal variations from urban cores to peripheries or between green spaces and built-up areas. Reflecting Beijing’s axial-radial spatial structure, north–south and east–west transects were established centered on the Forbidden City. As Figure 3 illustrates, the east–west transect spans the Fifth Ring Road’s western to eastern extents, while the north–south transect connects its northern and southern boundaries.

2.2.3. Spatial Scale Analysis

Spatial scale selection critically influences the evaluation of UGS cooling effects and the interpretation. Local-scale analyses reveal direct temperature reduction mechanisms, while macro-scale analyses illuminate integrated UGS roles in UHI mitigation. Therefore, multi-scale integrated analyses are essential to comprehensively assess UGS cooling potential [54].
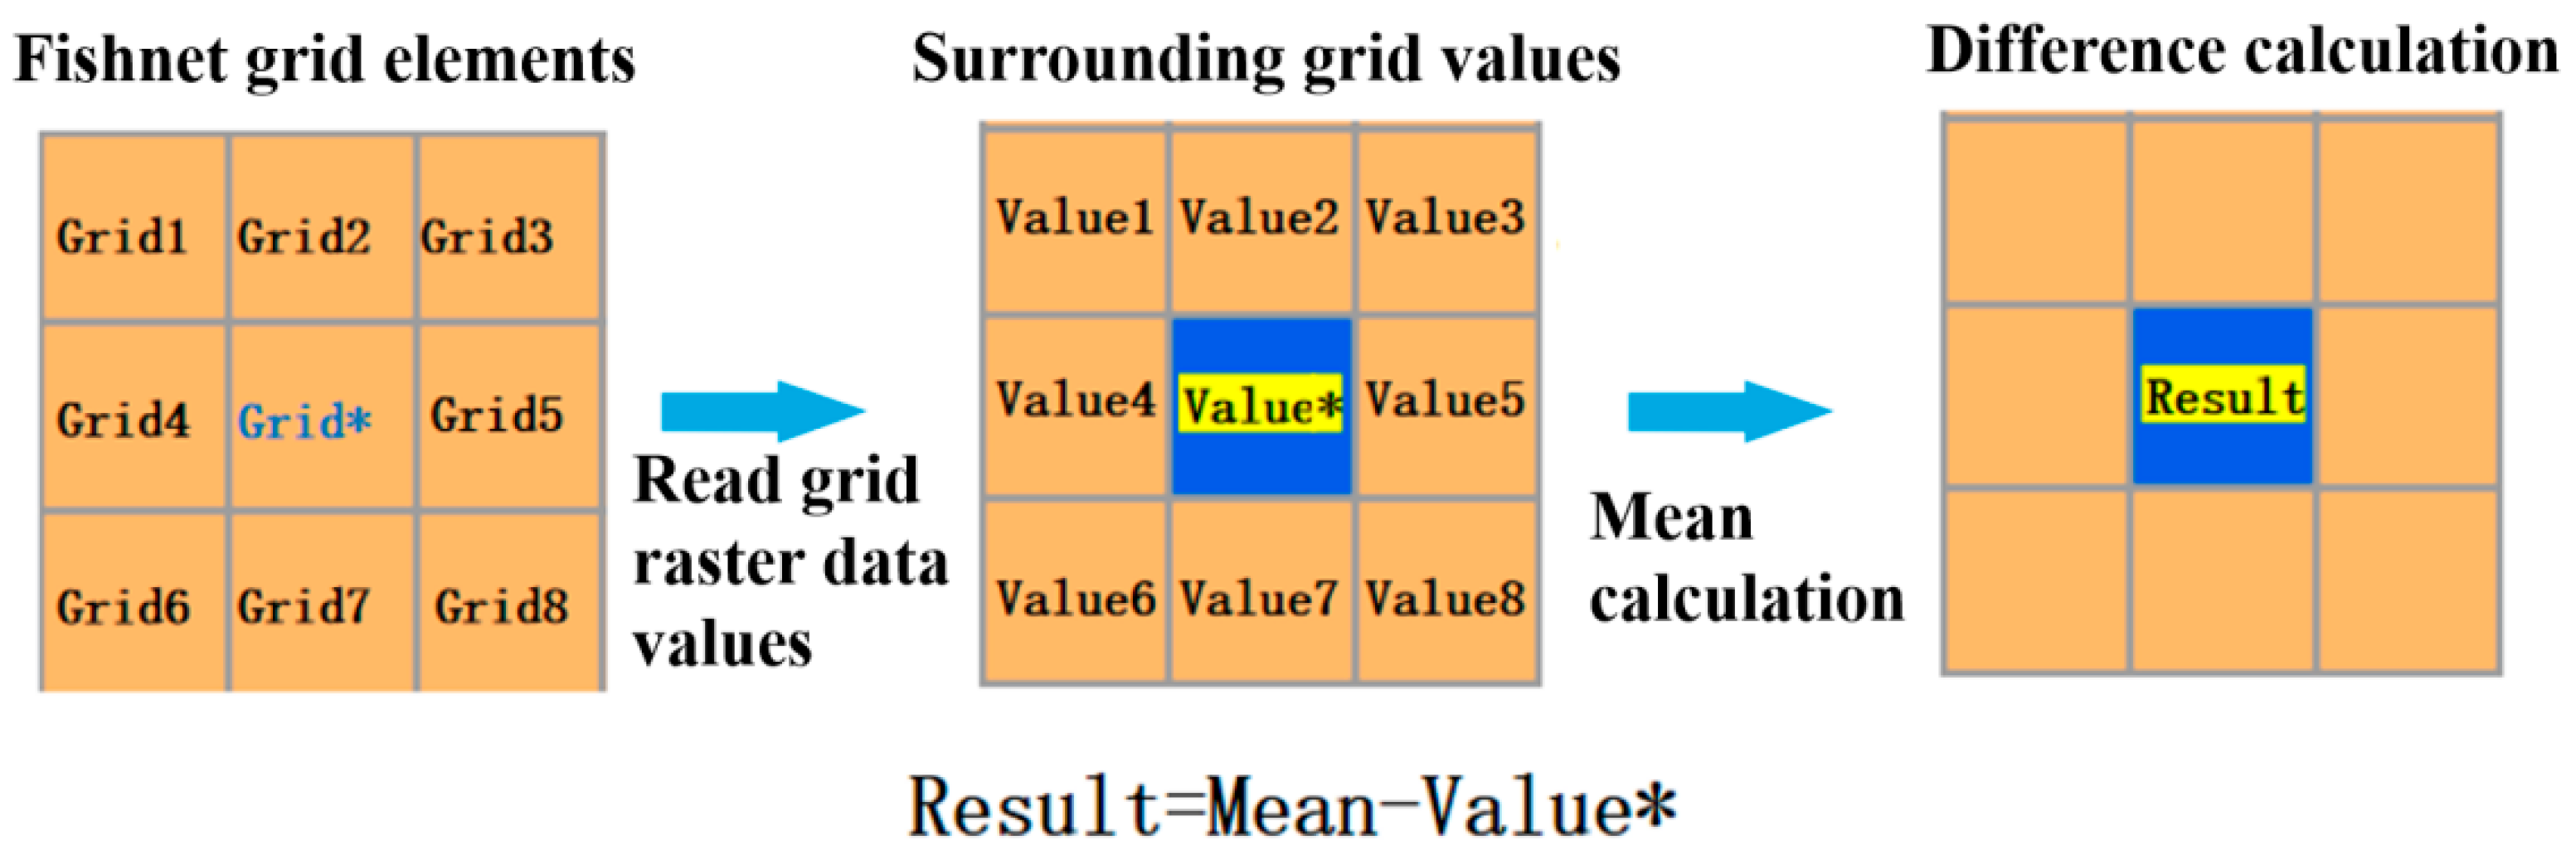
To rigorously characterize the spatial distribution of UGS cooling effects, this study implemented high-resolution spatial analysis. The study area was partitioned into 1 km × 1 km grid units, with thermal adjacency effects quantified for each cell relative to neighboring grids (Figure 4). Grid cells were statistically clustered based on cooling capacity. Comparative temporal analysis then assessed cooling intensity variations, while inter-period grid-level differences systematically revealed interannual evolution of UGS cooling effects.

2.2.4. Machine Learning and Regression Analysis

Machine learning has advanced the study of UGS cooling effects in recent years. Integrating machine learning with landscape pattern analysis helps determine critical landscape determinants of cooling efficacy. This study computed class-level landscape metrics using Fragstats 4.2, selecting four representative indices for analysis (Table 2): Percentage of Landscape (PLAND), number of patches (NP), largest patch index (LPI), and edge density (ED). Then, use the XGBoost model to evaluate the relative importance of six indicators, including NDVI and PV. The dataset was divided into a training set (70%), a test set (20%), and a validation set (10%) for model tuning and accuracy assessment. The model was trained and optimized using the training and validation sets, and its predictive performance was evaluated on the test set using the coefficient of determination (R2) and root mean square error (RMSE). The XGBoost model demonstrated satisfactory accuracy across different decades (1980s–2020s).
This study established a regression model to quantify relationships between LST and predictors, evaluating UGS cooling effects [55]. LST served as the dependent variable, with PV, NDVI, and green space area as independent variables. Linear regression analyzed temporal variations in LST-predictor correlations.

3. Results

3.1. Spatial and Temporal Pattern Evolution of UGS

3.1.1. Temporal and Spatial Changes in UGS

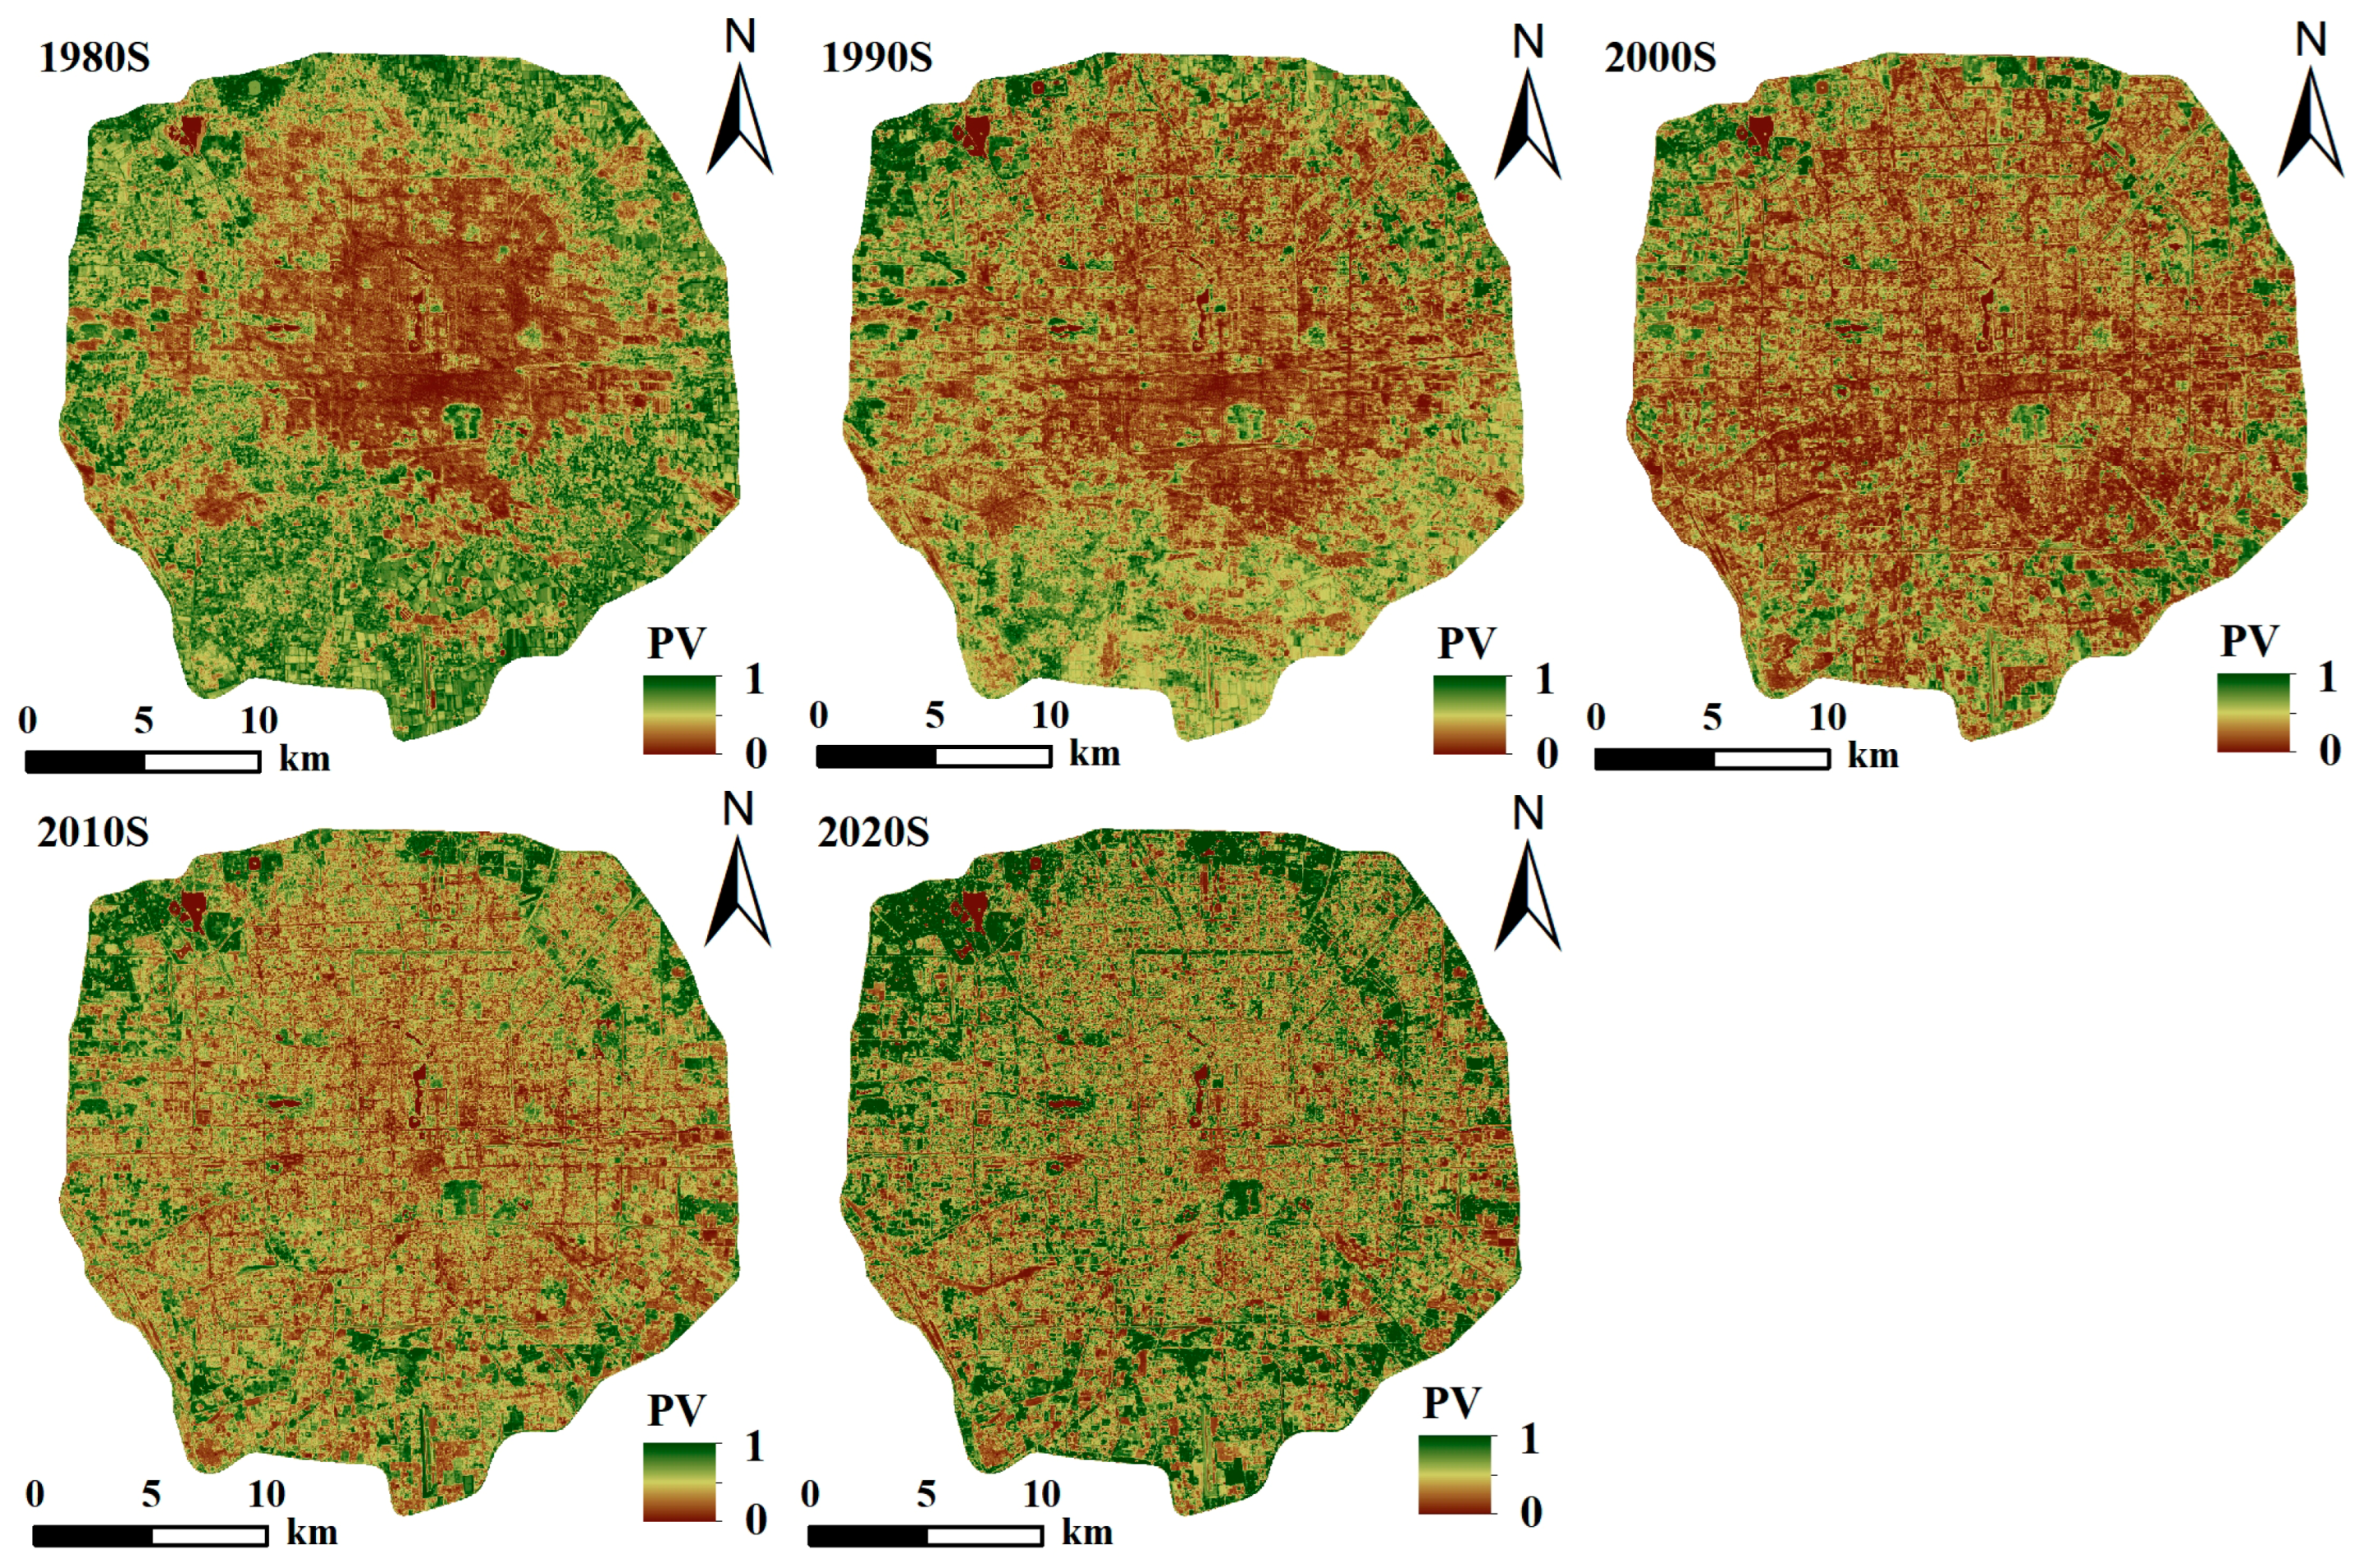
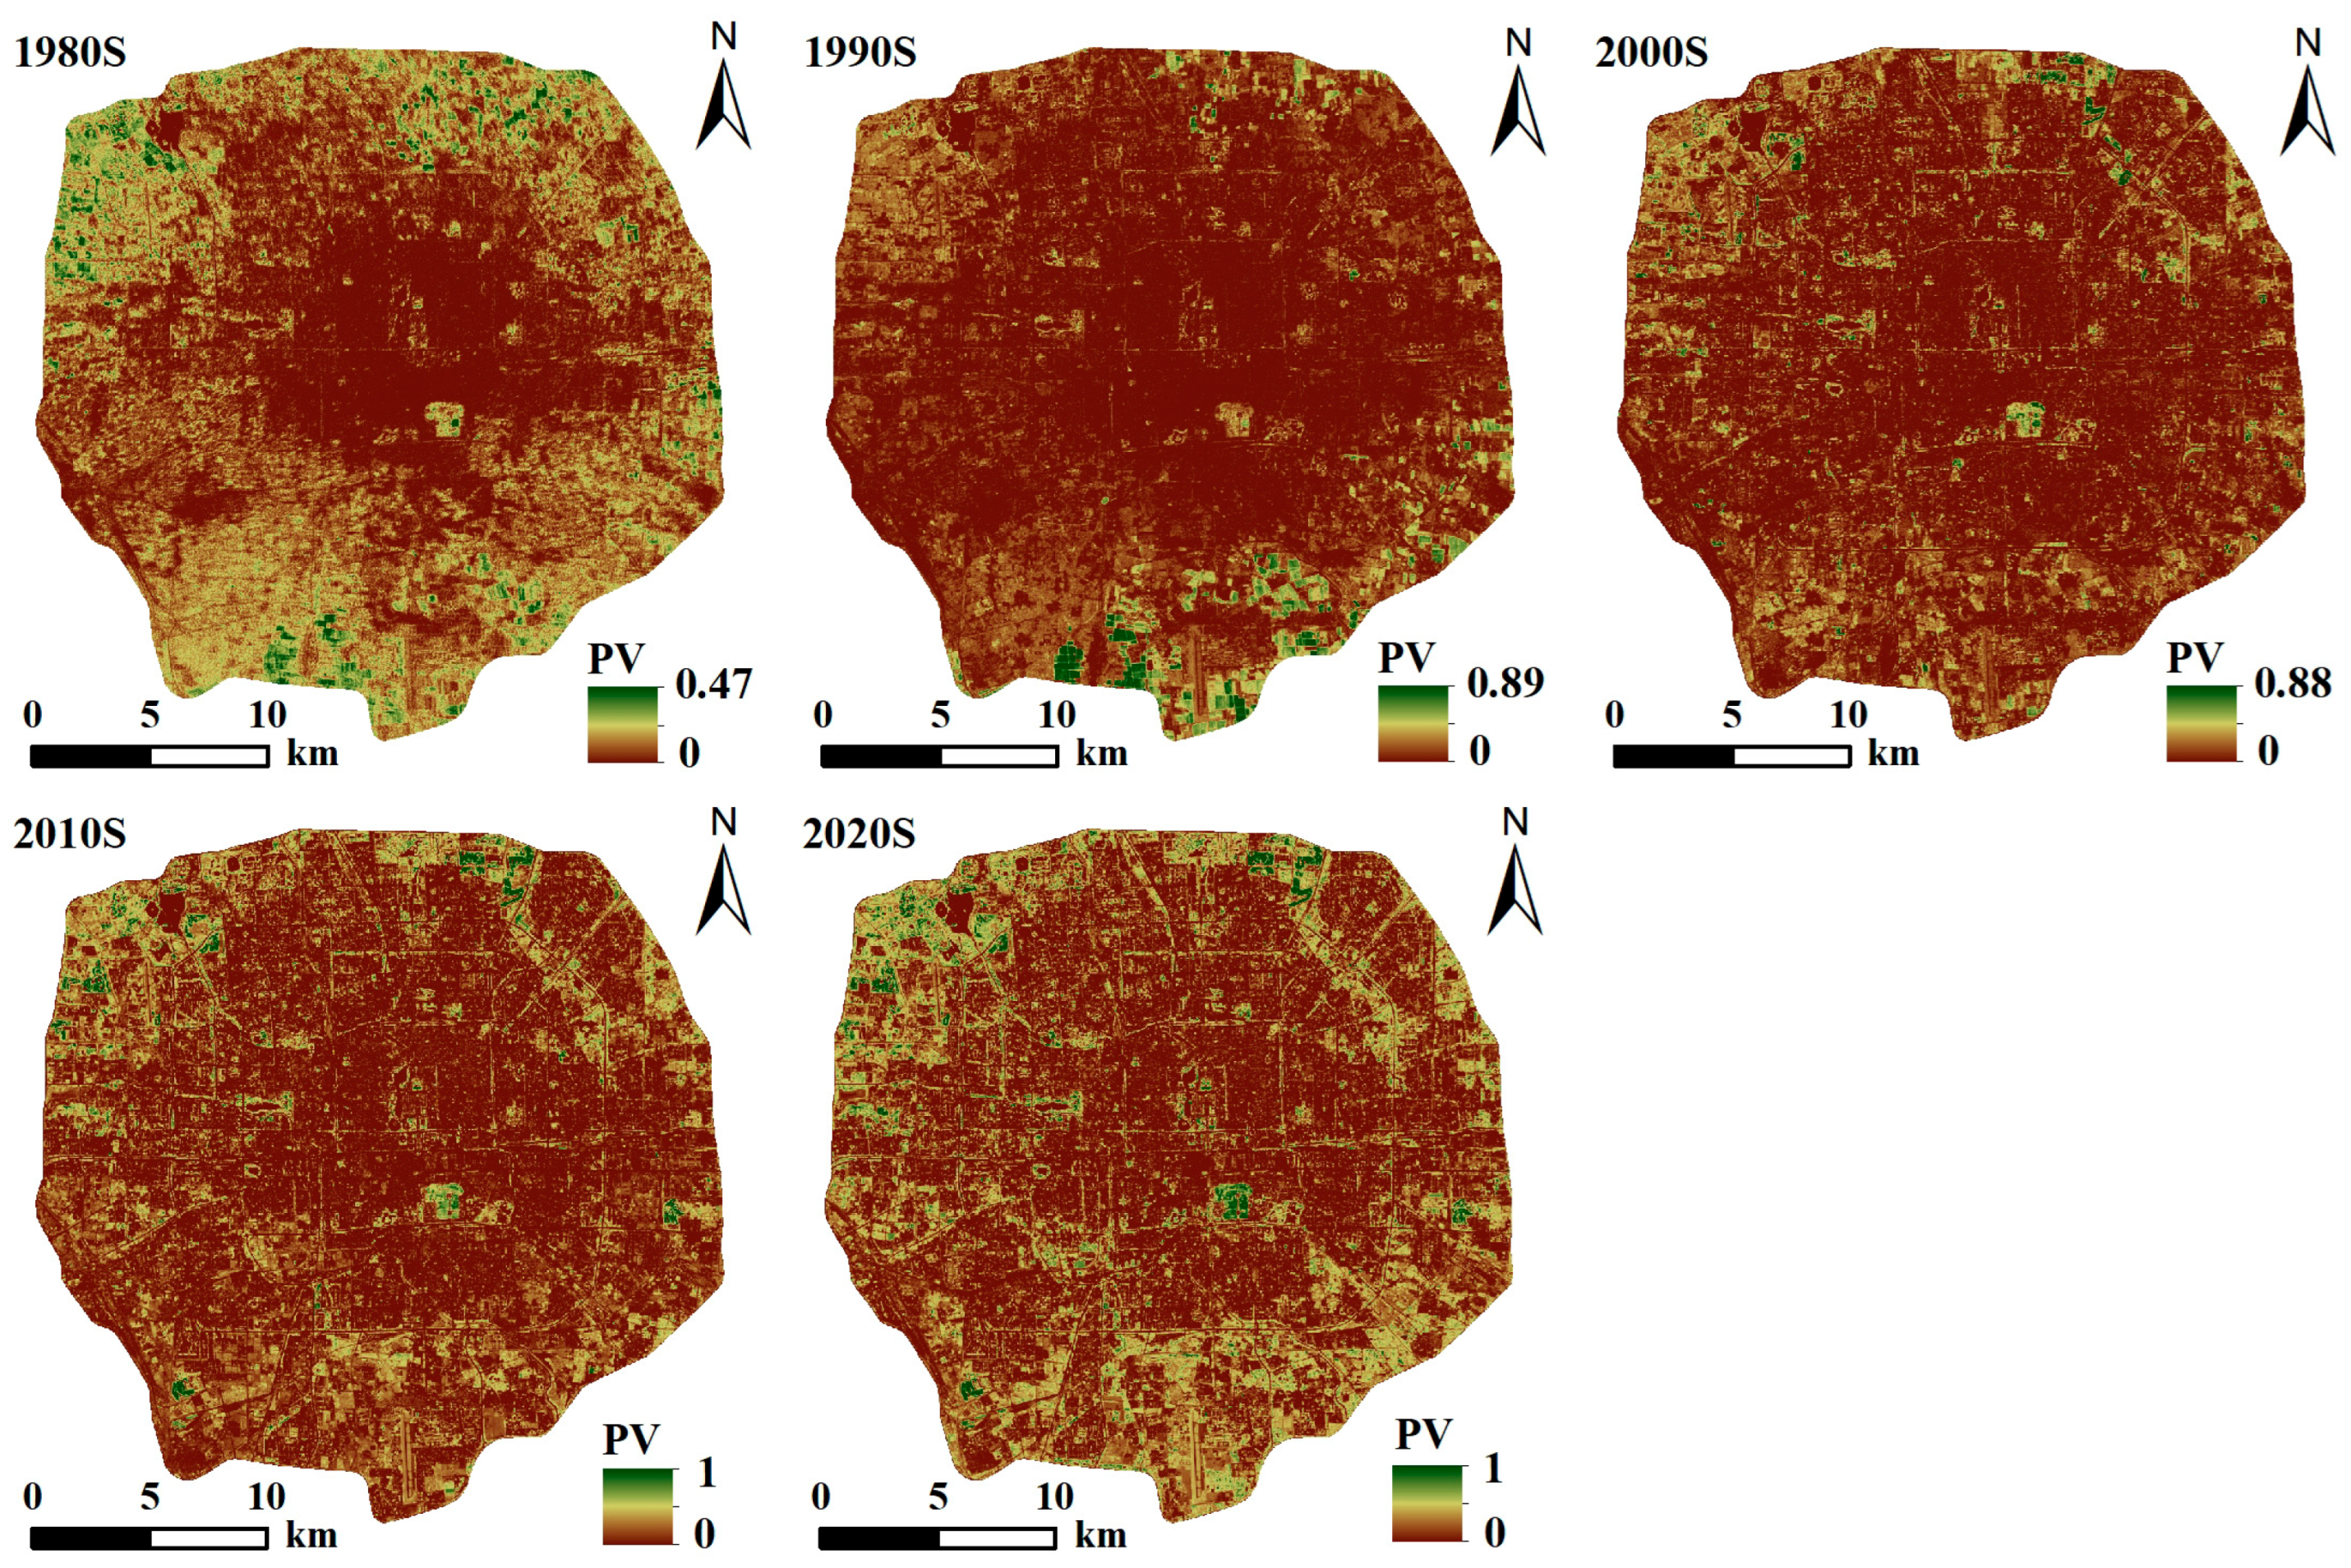
This study examines the evolution of UGS distribution in Beijing from the 1980s to the 2020s using summer and winter PV data. Figure 5 shows limited UGS coverage in the city center during the 1980s, mainly in major parks such as Tiantan [Temple of Heaven] and Ditan [Temple of Earth], while high vegetation indices were mainly along the Fourth–Fifth Ring Road interzone. In the 1990s and 2000s, central UGS coverage increased modestly but decreased significantly between the Fourth and Fifth Ring Roads. Since the 2010s, UGS distribution has become more decentralized, with a notable recovery in the Fourth–Fifth Ring Road corridor. Overall, UGS within Beijing’s Fifth Ring Road experienced two main phases: (1) a decline from the 1980s to the 2000s driven by rapid urbanization replacing UGS with impervious surfaces; and (2) a recovery from the 2010s to the 2020s linked to urban stabilization, functional improvements, and better public infrastructure. This resurgence is especially strong in Chaoyang, Haidian, and Dongcheng districts—key areas for modern service industries. The pre-Olympic greening initiatives in 2008 further significantly expanded urban green coverage.
Figure 6 shows lower winter vegetation indices compared to summer values, due to the dominance of deciduous vegetation in northern temperate climates. However, the addition of evergreen species and improved UGS management has greatly increased winter vegetation indices in historical and cultural parks, showing better urban ecological sustainability.

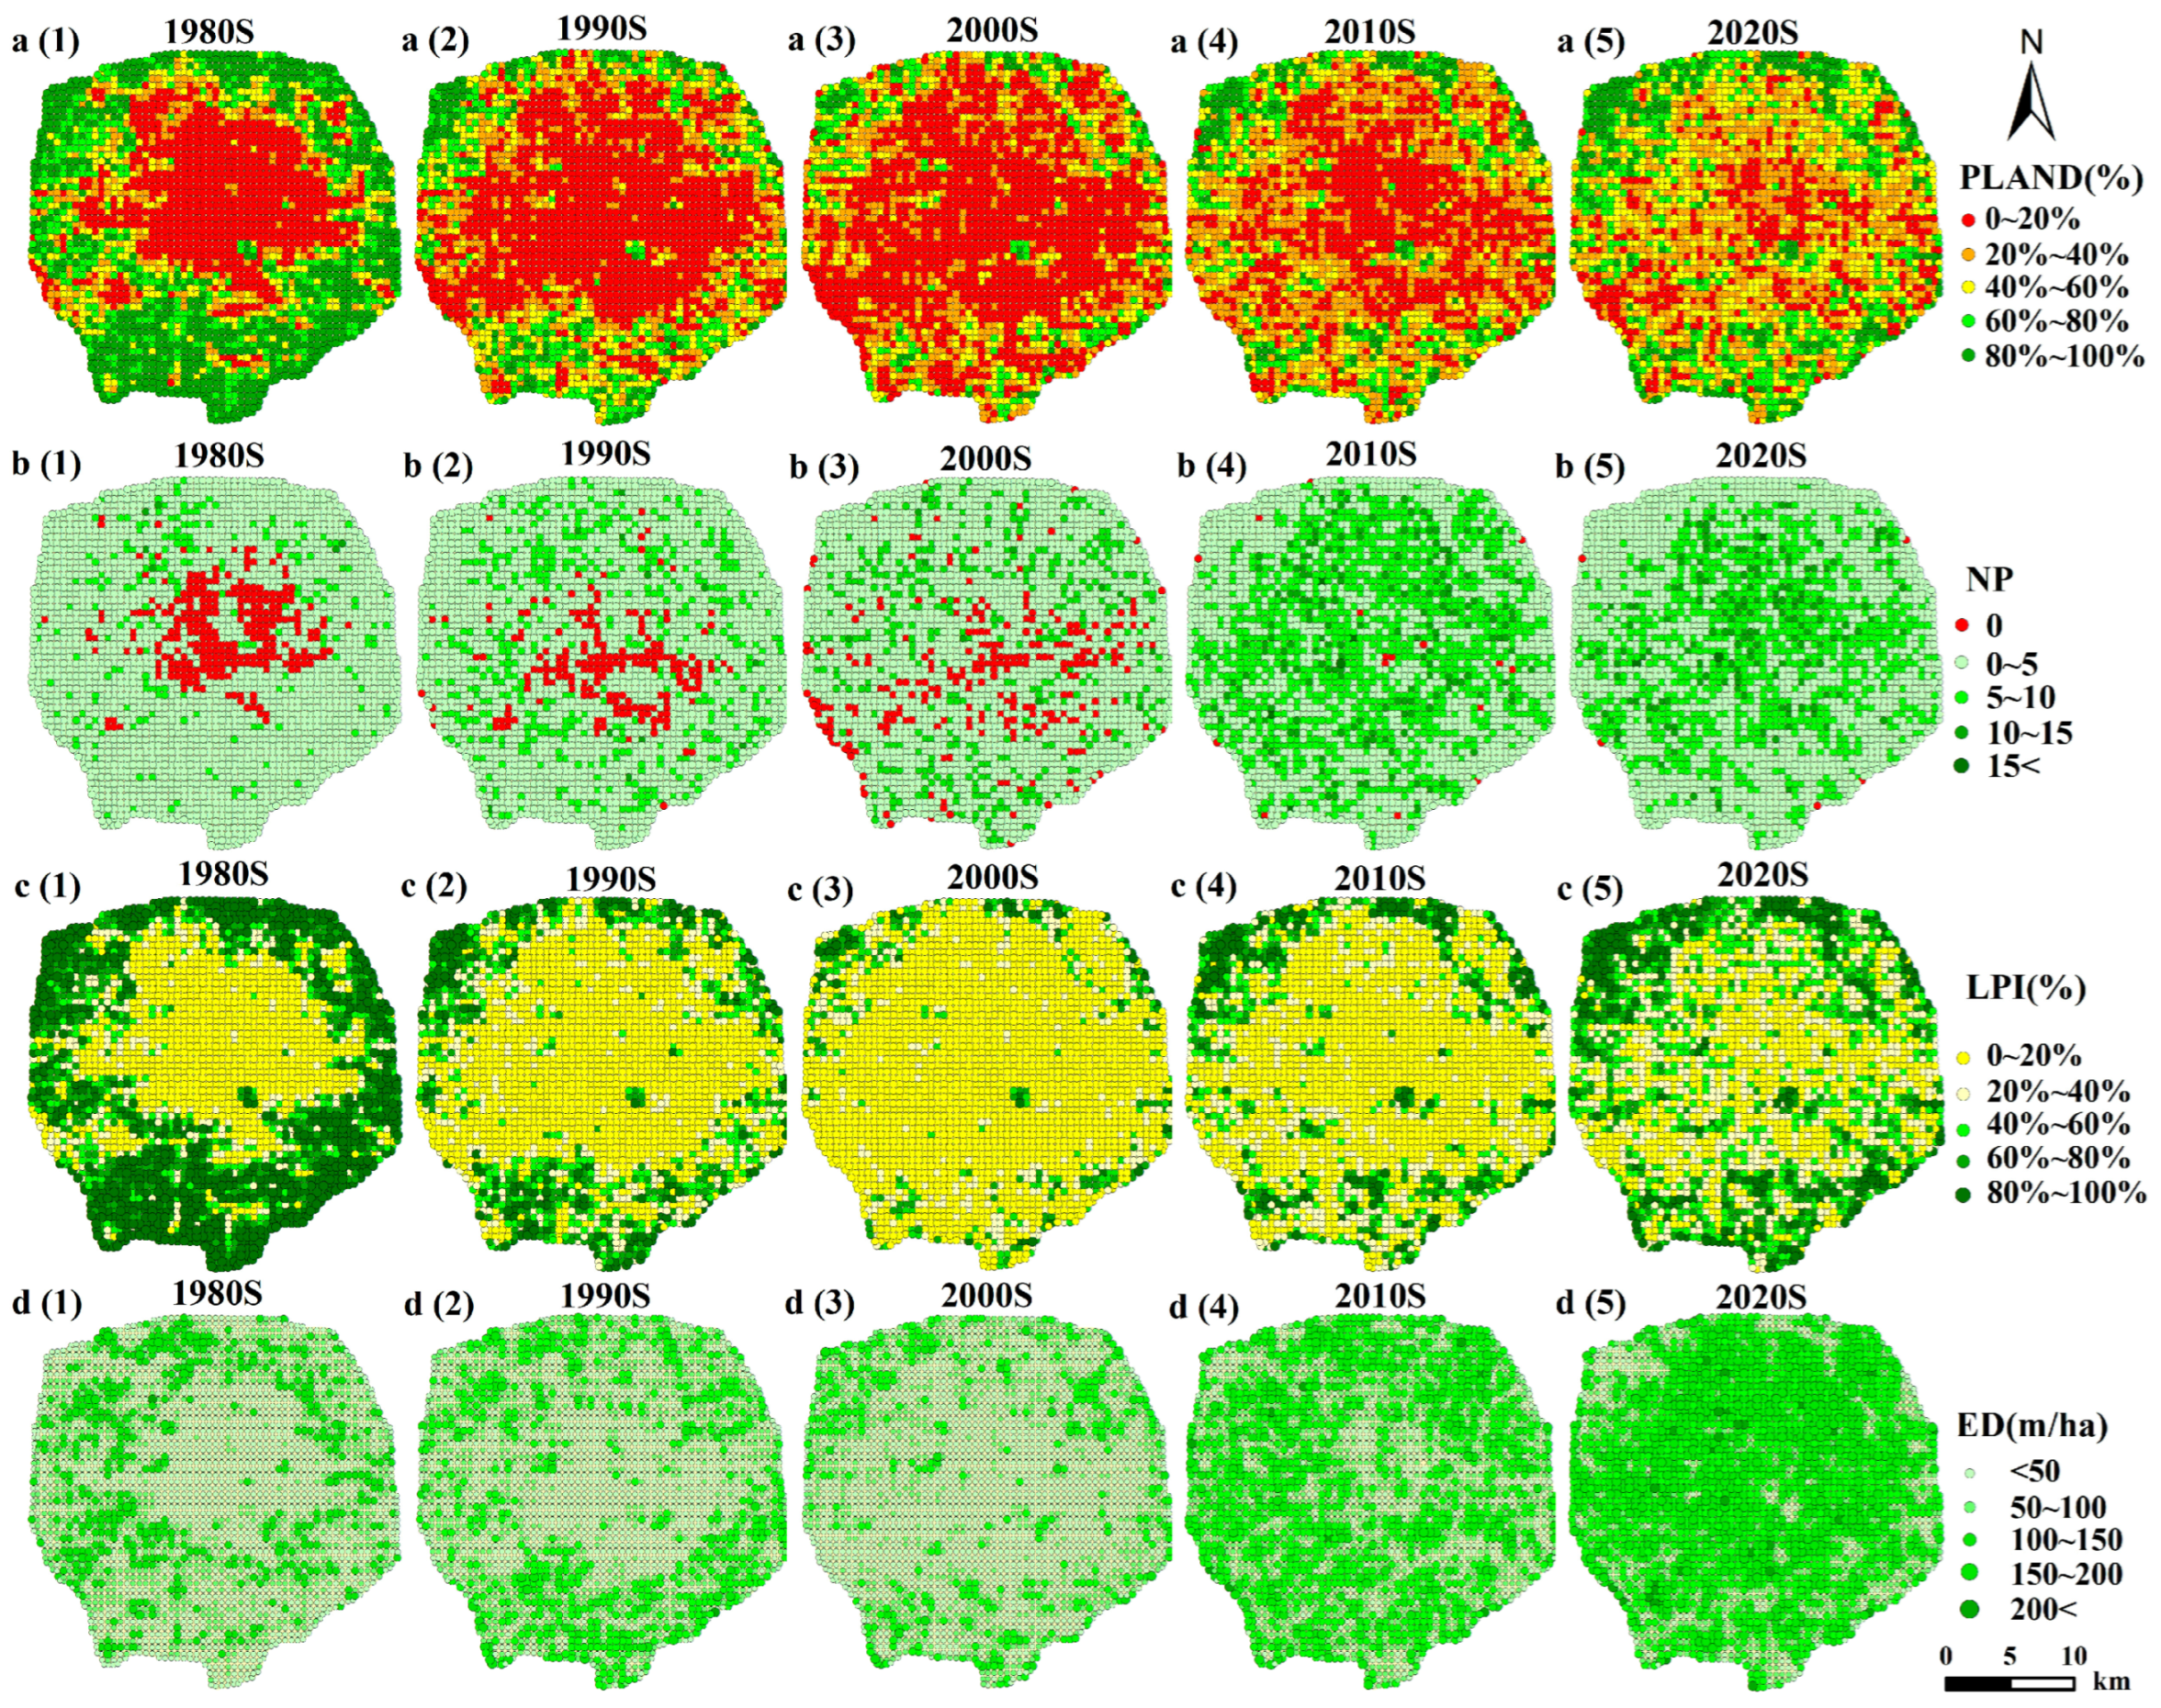
3.1.2. Evolution of UGS Landscape Patterns

Analysis of green space landscape metrics at a 500 m spatial scale (Figure 7) reveals distinct spatiotemporal variations in four key indices, signifying dynamic pattern changes during rapid urbanization. The green landscape followed an “initial fragmentation → gradual restoration” trajectory. From the 1980s to 2000s, urban core PLAND declined continuously while NP increased sharply, indicating intensified fragmentation. Concurrently, decreasing LPI and fluctuating ED (initial increase followed by a decrease) signified greater patch segmentation and structural complexity. Since the 2010s, PLAND recovery with concurrent NP, ED, and LPI increases reflects landscape expansion, reconnection, and integration. Green infrastructure development during this period enhanced ecological spatial structure, improving connectivity and stability.
A detailed stage-wise analysis indicates that during the 1980s, UGS were extensively distributed and spatially concentrated, exhibiting high ecological integrity. Beginning in the 1990s, the UGS area declined markedly, fragmentation intensified, and dominant patches diminished. By the 2000s, the landscape exhibited peak fragmentation and dispersion, with dominant patches disappearing and ecosystem vulnerability escalating sharply. Although the UGS area partially recovered in the 2010s, fragmentation persisted, evidenced by heightened ED. In the 2020s, green space continued to expand, yet patch aggregation and boundary complexity had not reached optimal levels, and spatial integrity still requires enhancement. In summary, the UGS system is transitioning from a development-led model toward ecological restoration prioritization, though spatial optimization remains ongoing.

3.2. Spatiotemporal Evolution of LST

3.2.1. Accuracy Validation of LST

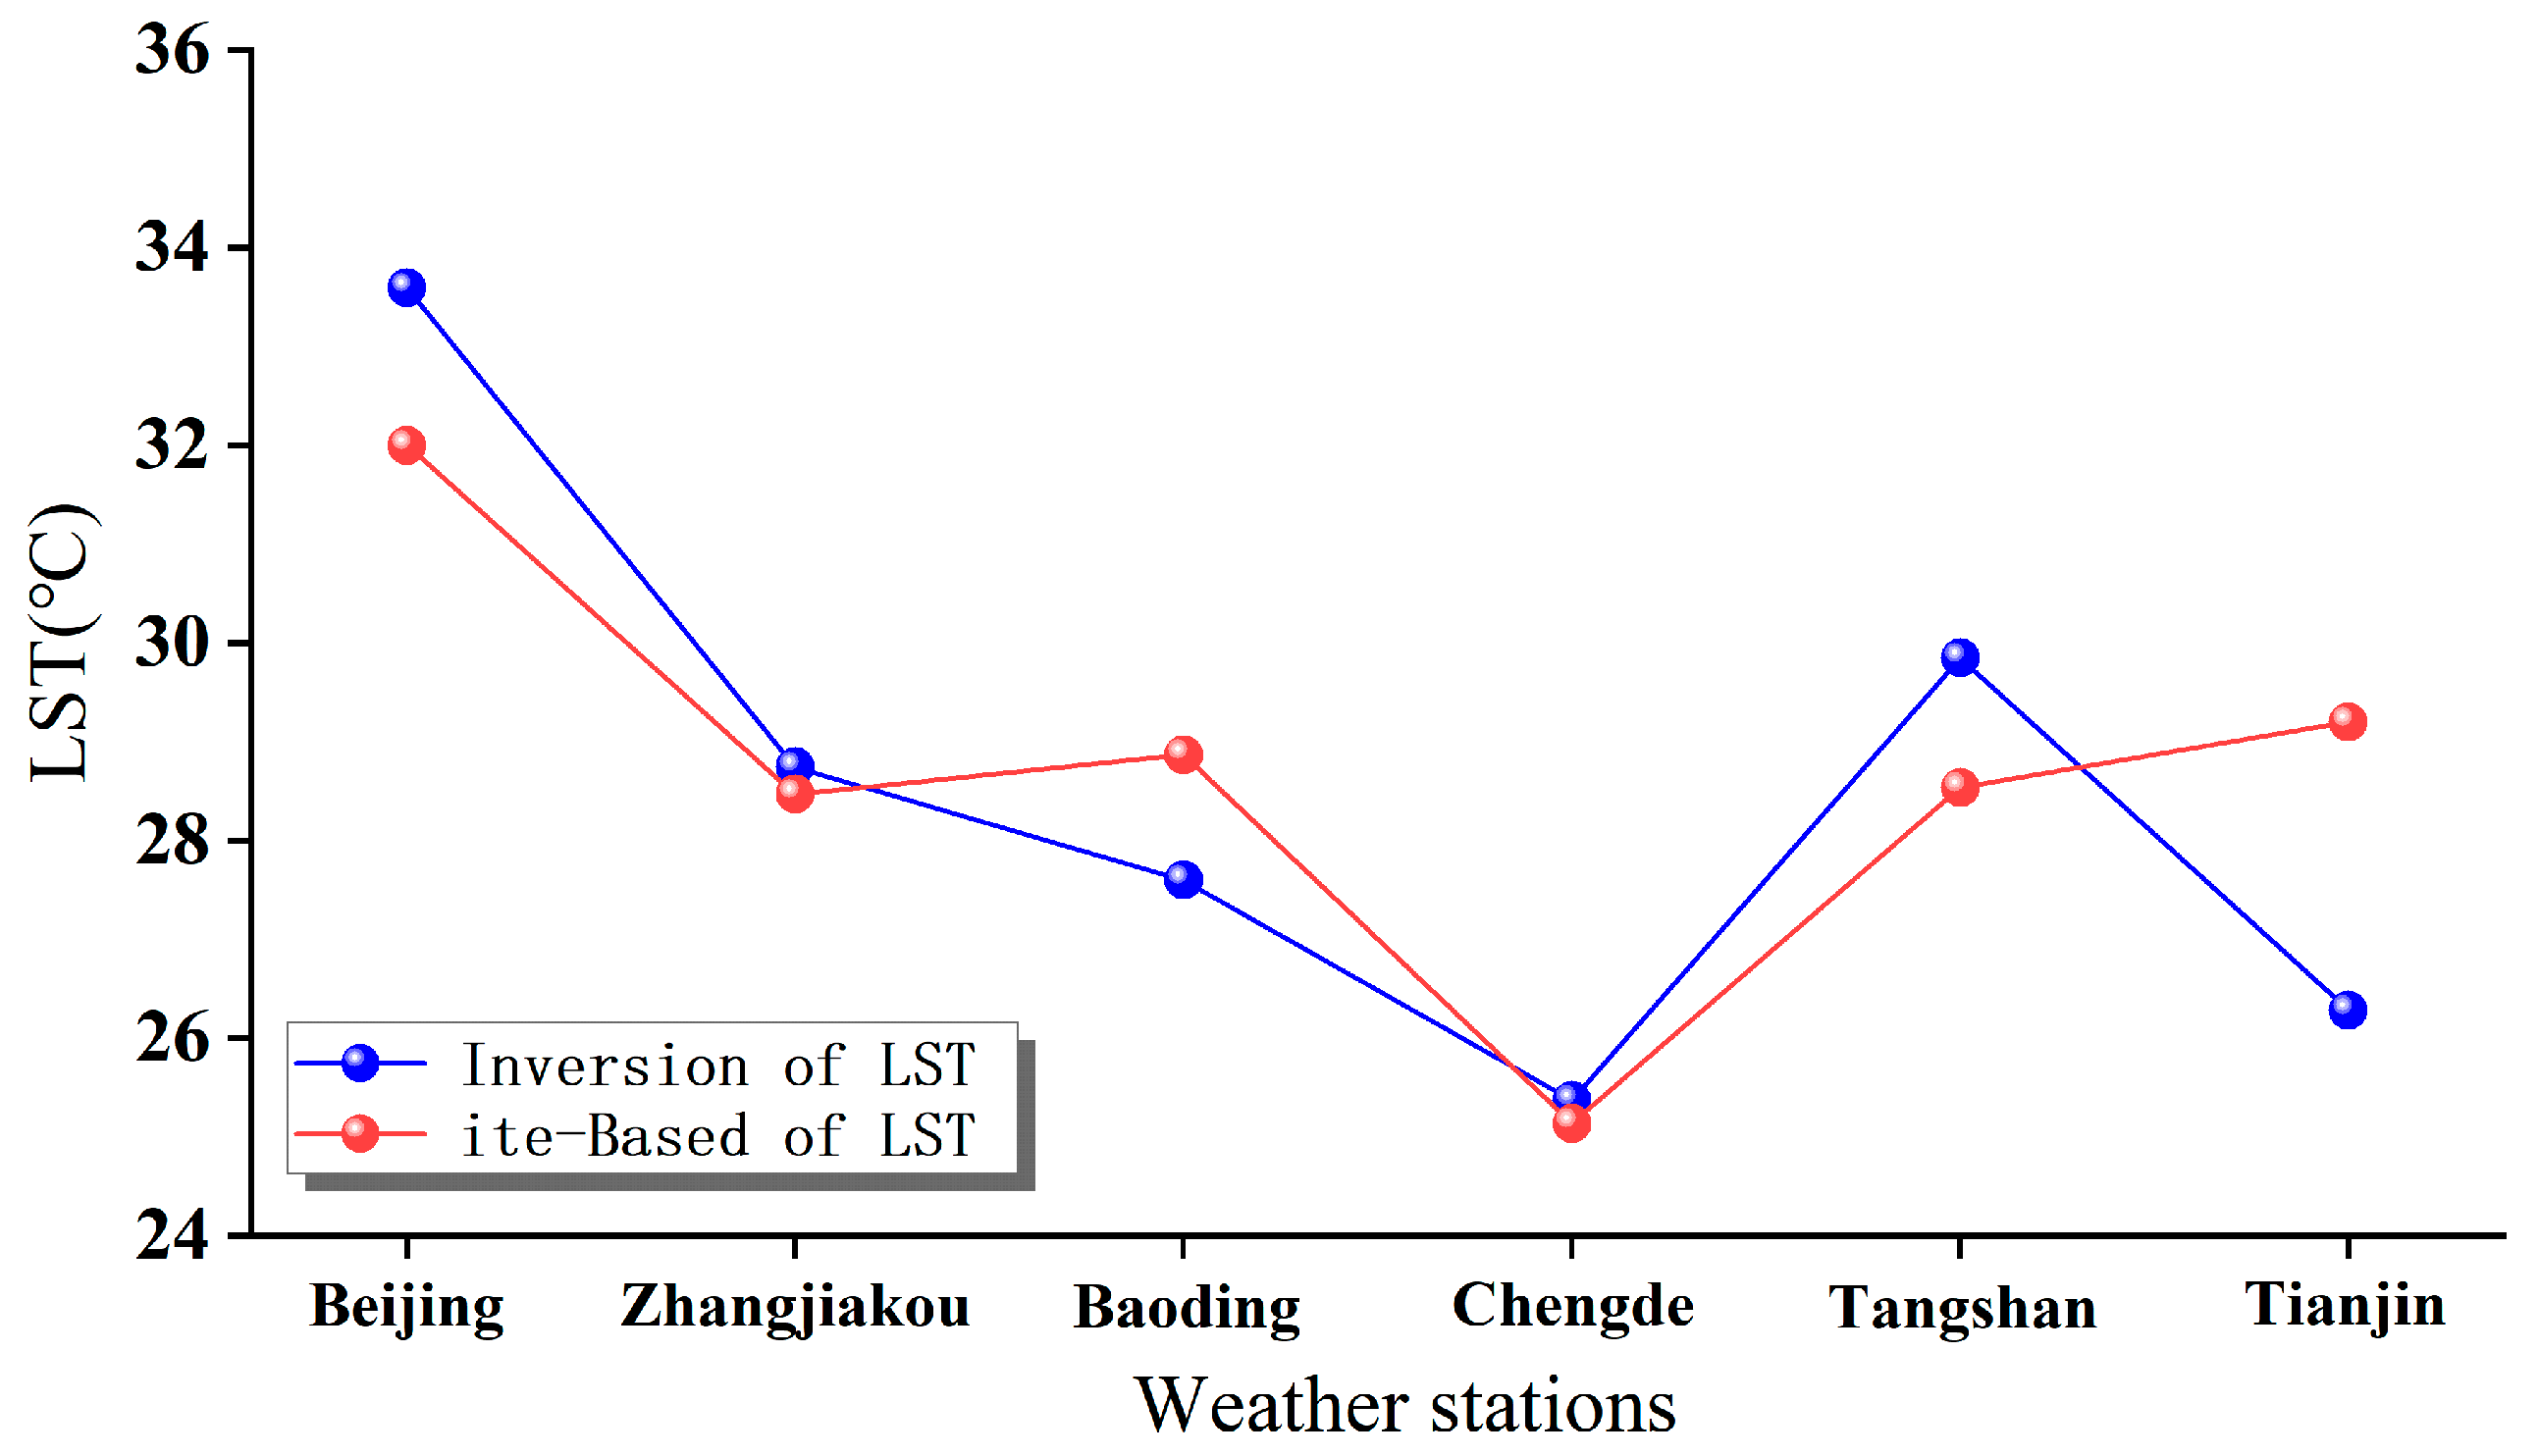
To improve data accuracy and enhance the scientific rigor of subsequent analyses, the retrieved LST data were validated against ground-based observations. Meteorological data were obtained from six national standard meteorological stations within North China, including sites in Beijing, Tangshan, Baoding, Chengde, and surrounding regions. As part of China’s national meteorological observation network, these baseline stations feature long-term monitoring records and stable operational protocols, ensuring high data accuracy. Consequently, their observations serve as reliable references for evaluating the accuracy of LST retrievals.
Figure 8 compares retrieved LST values with station-based air temperature observations. The results indicate limited deviations between retrieved and observed values, with consistent temporal trends. The error remains within acceptable thresholds, confirming that the adopted LST retrieval method is robust and regionally appropriate. This approach accurately reflects land surface thermal characteristics and thus provides a reliable data source for subsequent research.

3.2.2. Temporal Trends of LST Across Beijing’s Ring Roads

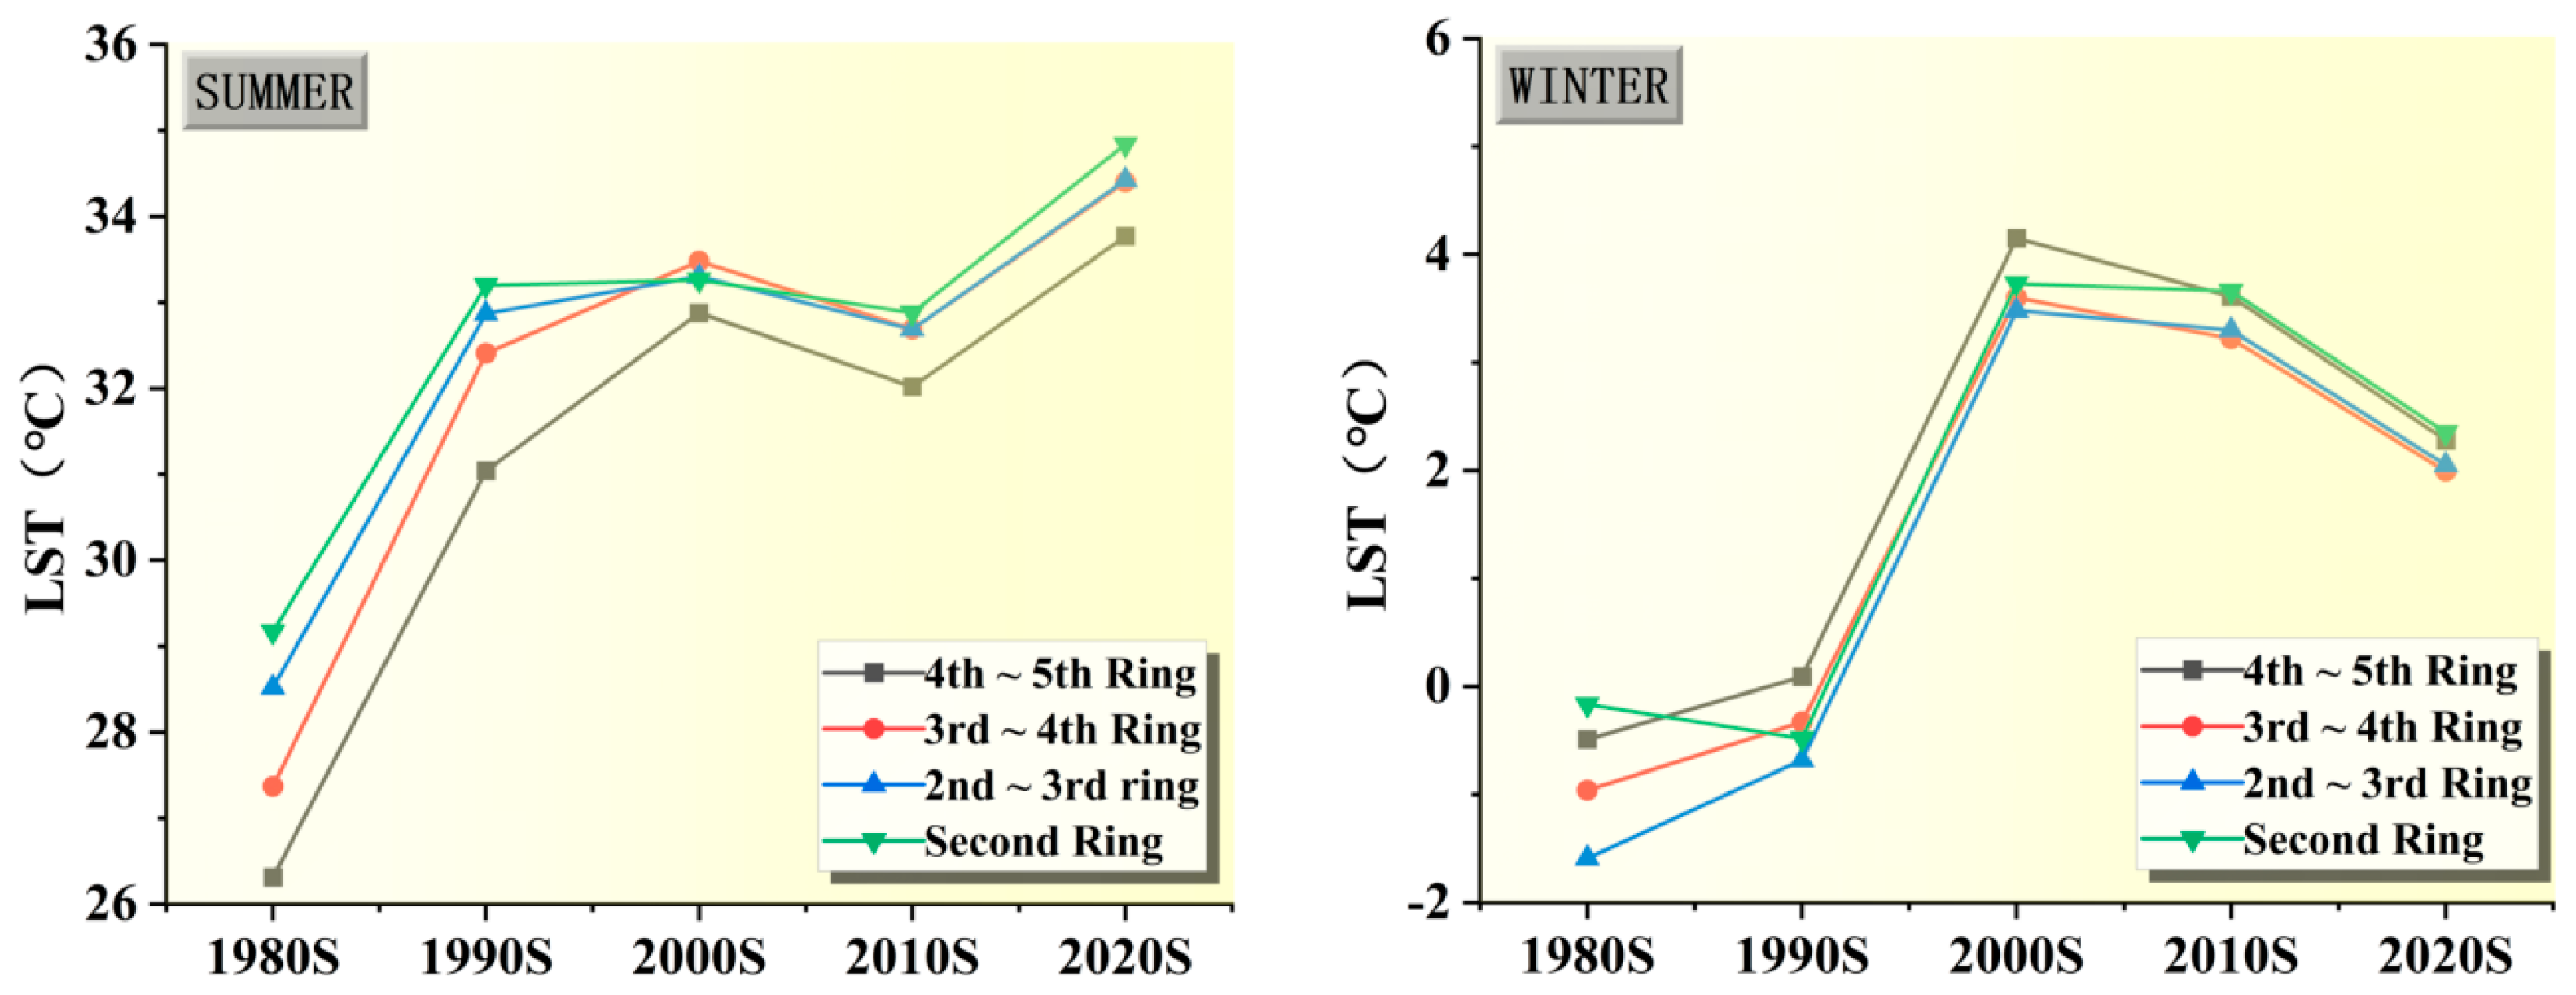
Figure 9 presents the temporal trends of mean LST during summer and winter across distinct ring road zones in Beijing (specifically, the Fifth, Fourth, Third, and Second Ring Roads). Over the past four decades, summer LST in all zones exhibited a generally increasing trend with fluctuations, rising overall by approximately 6–8 °C. The most rapid increase occurred from the 1980s to the 2000s, followed by a reduced rate of warming between the 2000s and 2010s. Conversely, winter LST displayed a more complex pattern, characterized by a three-phase trend: initial increase, subsequent stabilization, and eventual slight decline. Notably, temperature differences among zones during winter were smaller than those observed in summer.
This seasonal disparity in LST trends may partially reflect changes in urban architectural morphology. Since the 2000s, the proliferation of high-rise buildings has increased shadow coverage, reducing ground-level direct solar radiation. This effect likely explains the suppressed winter LST observed in urban areas.
Spatially, the temperature gradient among ring road zones has undergone significant temporal changes. During the 1980s, marked LST differences existed across zones. By the 2020s, however, these differences had substantially decreased. This thermal homogenization likely results from accelerated urbanization, climate change, improved urban greening, and heating system evolution—collectively reducing LST variability across the urban landscape.

3.2.3. Spatiotemporal Heterogeneity of LST

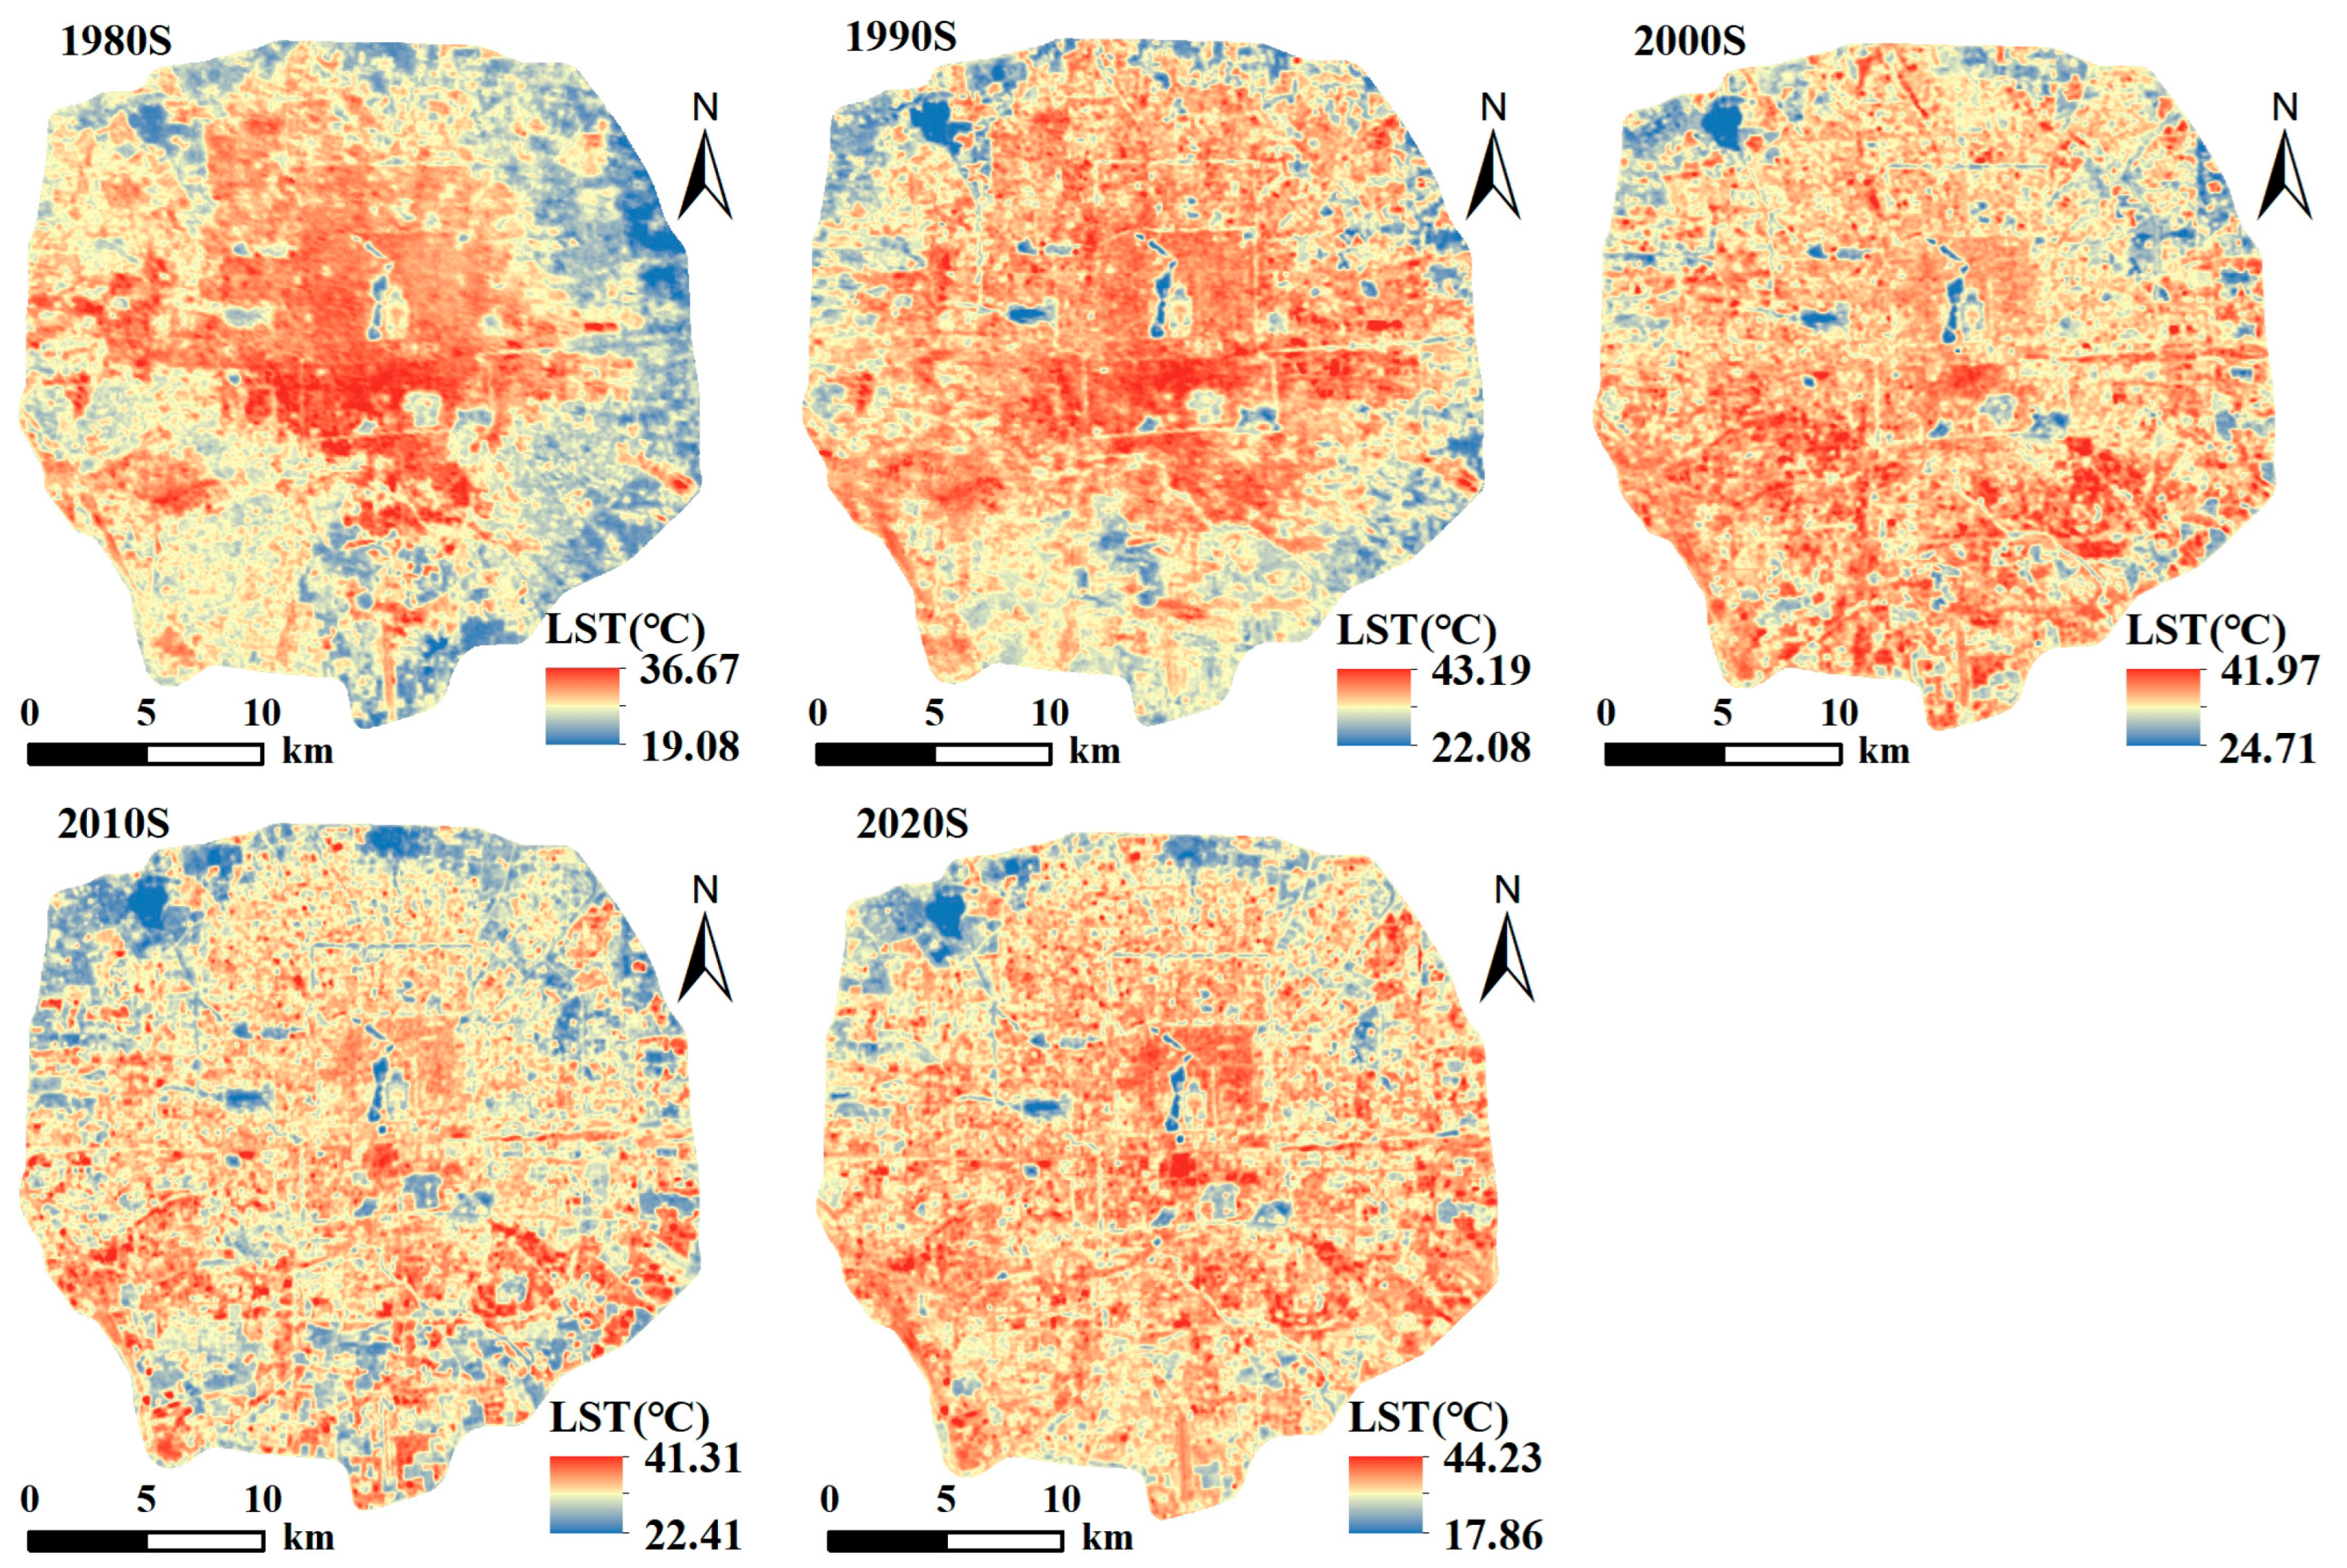
Figure 10 illustrates the marked spatiotemporal heterogeneity and dynamic evolution of Beijing’s thermal environment over the past four decades. Temporally, LST exhibited continuous warming from the 1980s to the 2020s. Temperature peaks in high-temperature zones consistently exceeded 40 °C since the 1990s, reaching a maximum value of 44.23 °C in the 2020s. The warming rate varied interdecadally: rapid growth during the 1980s–1990s coincided with substantial expansion of high-temperature areas; moderated growth in the 2000s; a slight decline in the 2010s; and a resurgence in the 2020s. Spatially, the 1980s featured concentrated, contiguous high-temperature zones primarily within the Third Ring Road, forming a single thermal core. These zones subsequently expanded outward with decreasing spatial concentration. By the 2020s, high-temperature areas exhibited a polycentric, dispersed pattern featuring independent thermal patches in both central urban areas and suburban development zones. This transition from centralized to dispersed UHI patterns reflects urban expansion and polycentric land-use development.
To evaluate the winter temperature regulation capacity of UGS within Beijing’s Fifth Ring Road, LST was analyzed for winter months (December–February). Figure 11 presents winter LST temporal variations. Analysis reveals a spatial distribution pattern similar to summer, but with generally higher temperatures at the study area’s periphery than in the central region. This “Inverse Urban Heat Island” (IUHI) phenomenon primarily results from: (1) industrial zone concentration between the Fourth and Fifth Ring Roads, and (2) frequent temperature inversion events characteristic of northern winter climates. Notably, large UGS containing evergreen vegetation (e.g., Tiantan Park) maintain significant cooling effects during winter.

3.3. Spatiotemporal Evolution of UGS Cooling Capacity

3.3.1. Spatiotemporal Variation in LST and UGS Along Profile Lines in Urban Areas

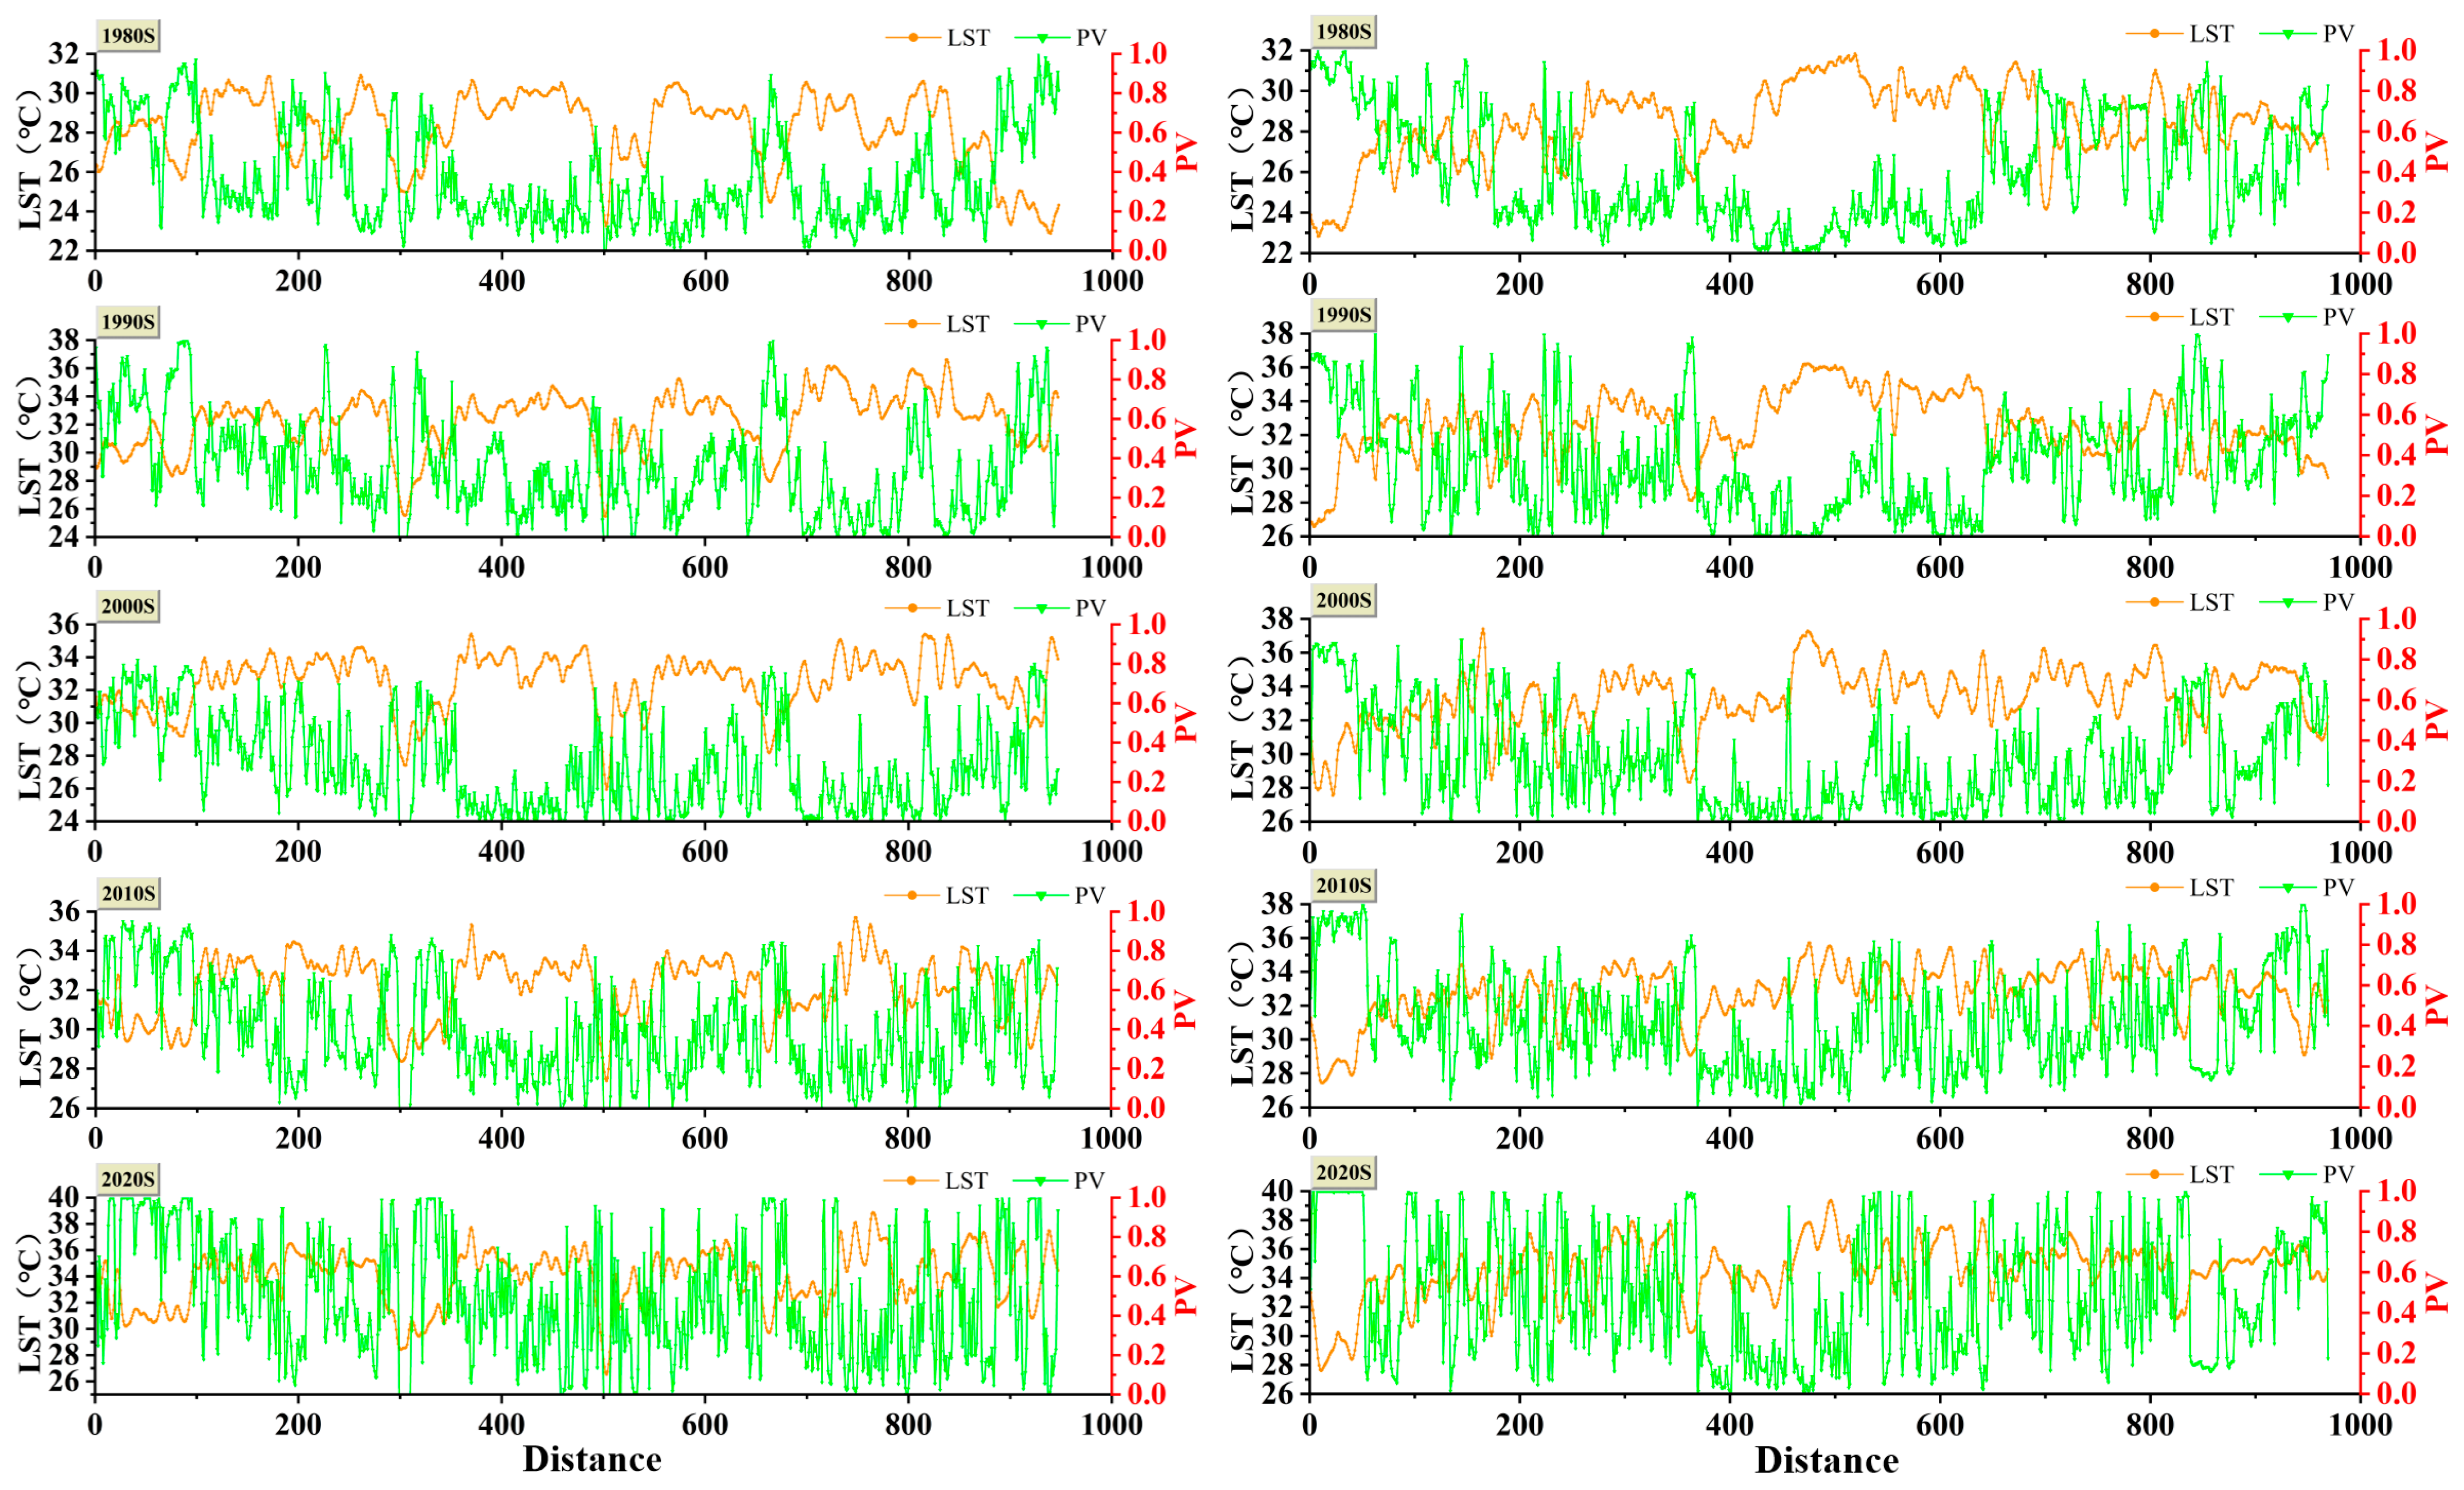
Figure 12 displays the spatiotemporal variations in LST and PV. A distinct inverse relationship exists between LST and PV: areas with high PV values (dense vegetation) exhibit lower surface temperatures, while areas with low PV (built-up/bare surfaces) display significantly elevated temperatures, demonstrating UGS cooling capacity. Temporally, LST shows a general increasing trend with growing thermal fluctuations over decades. PV values underwent more pronounced changes, reaching near-maximum values (PV ≈ 1) in numerous areas during the 2020s. This indicates that despite increased fragmentation of green spaces, enhanced vegetation vigor within individual patches demonstrates effective urban greening implementation with robust thermal regulation capabilities. This study confirms a robust inverse correlation between UGS and LST during summer, demonstrating substantial spatiotemporal UGS evolution impacts on urban thermal environments.

3.3.2. Spatial Pattern Changes in UGS Cooling Capacity

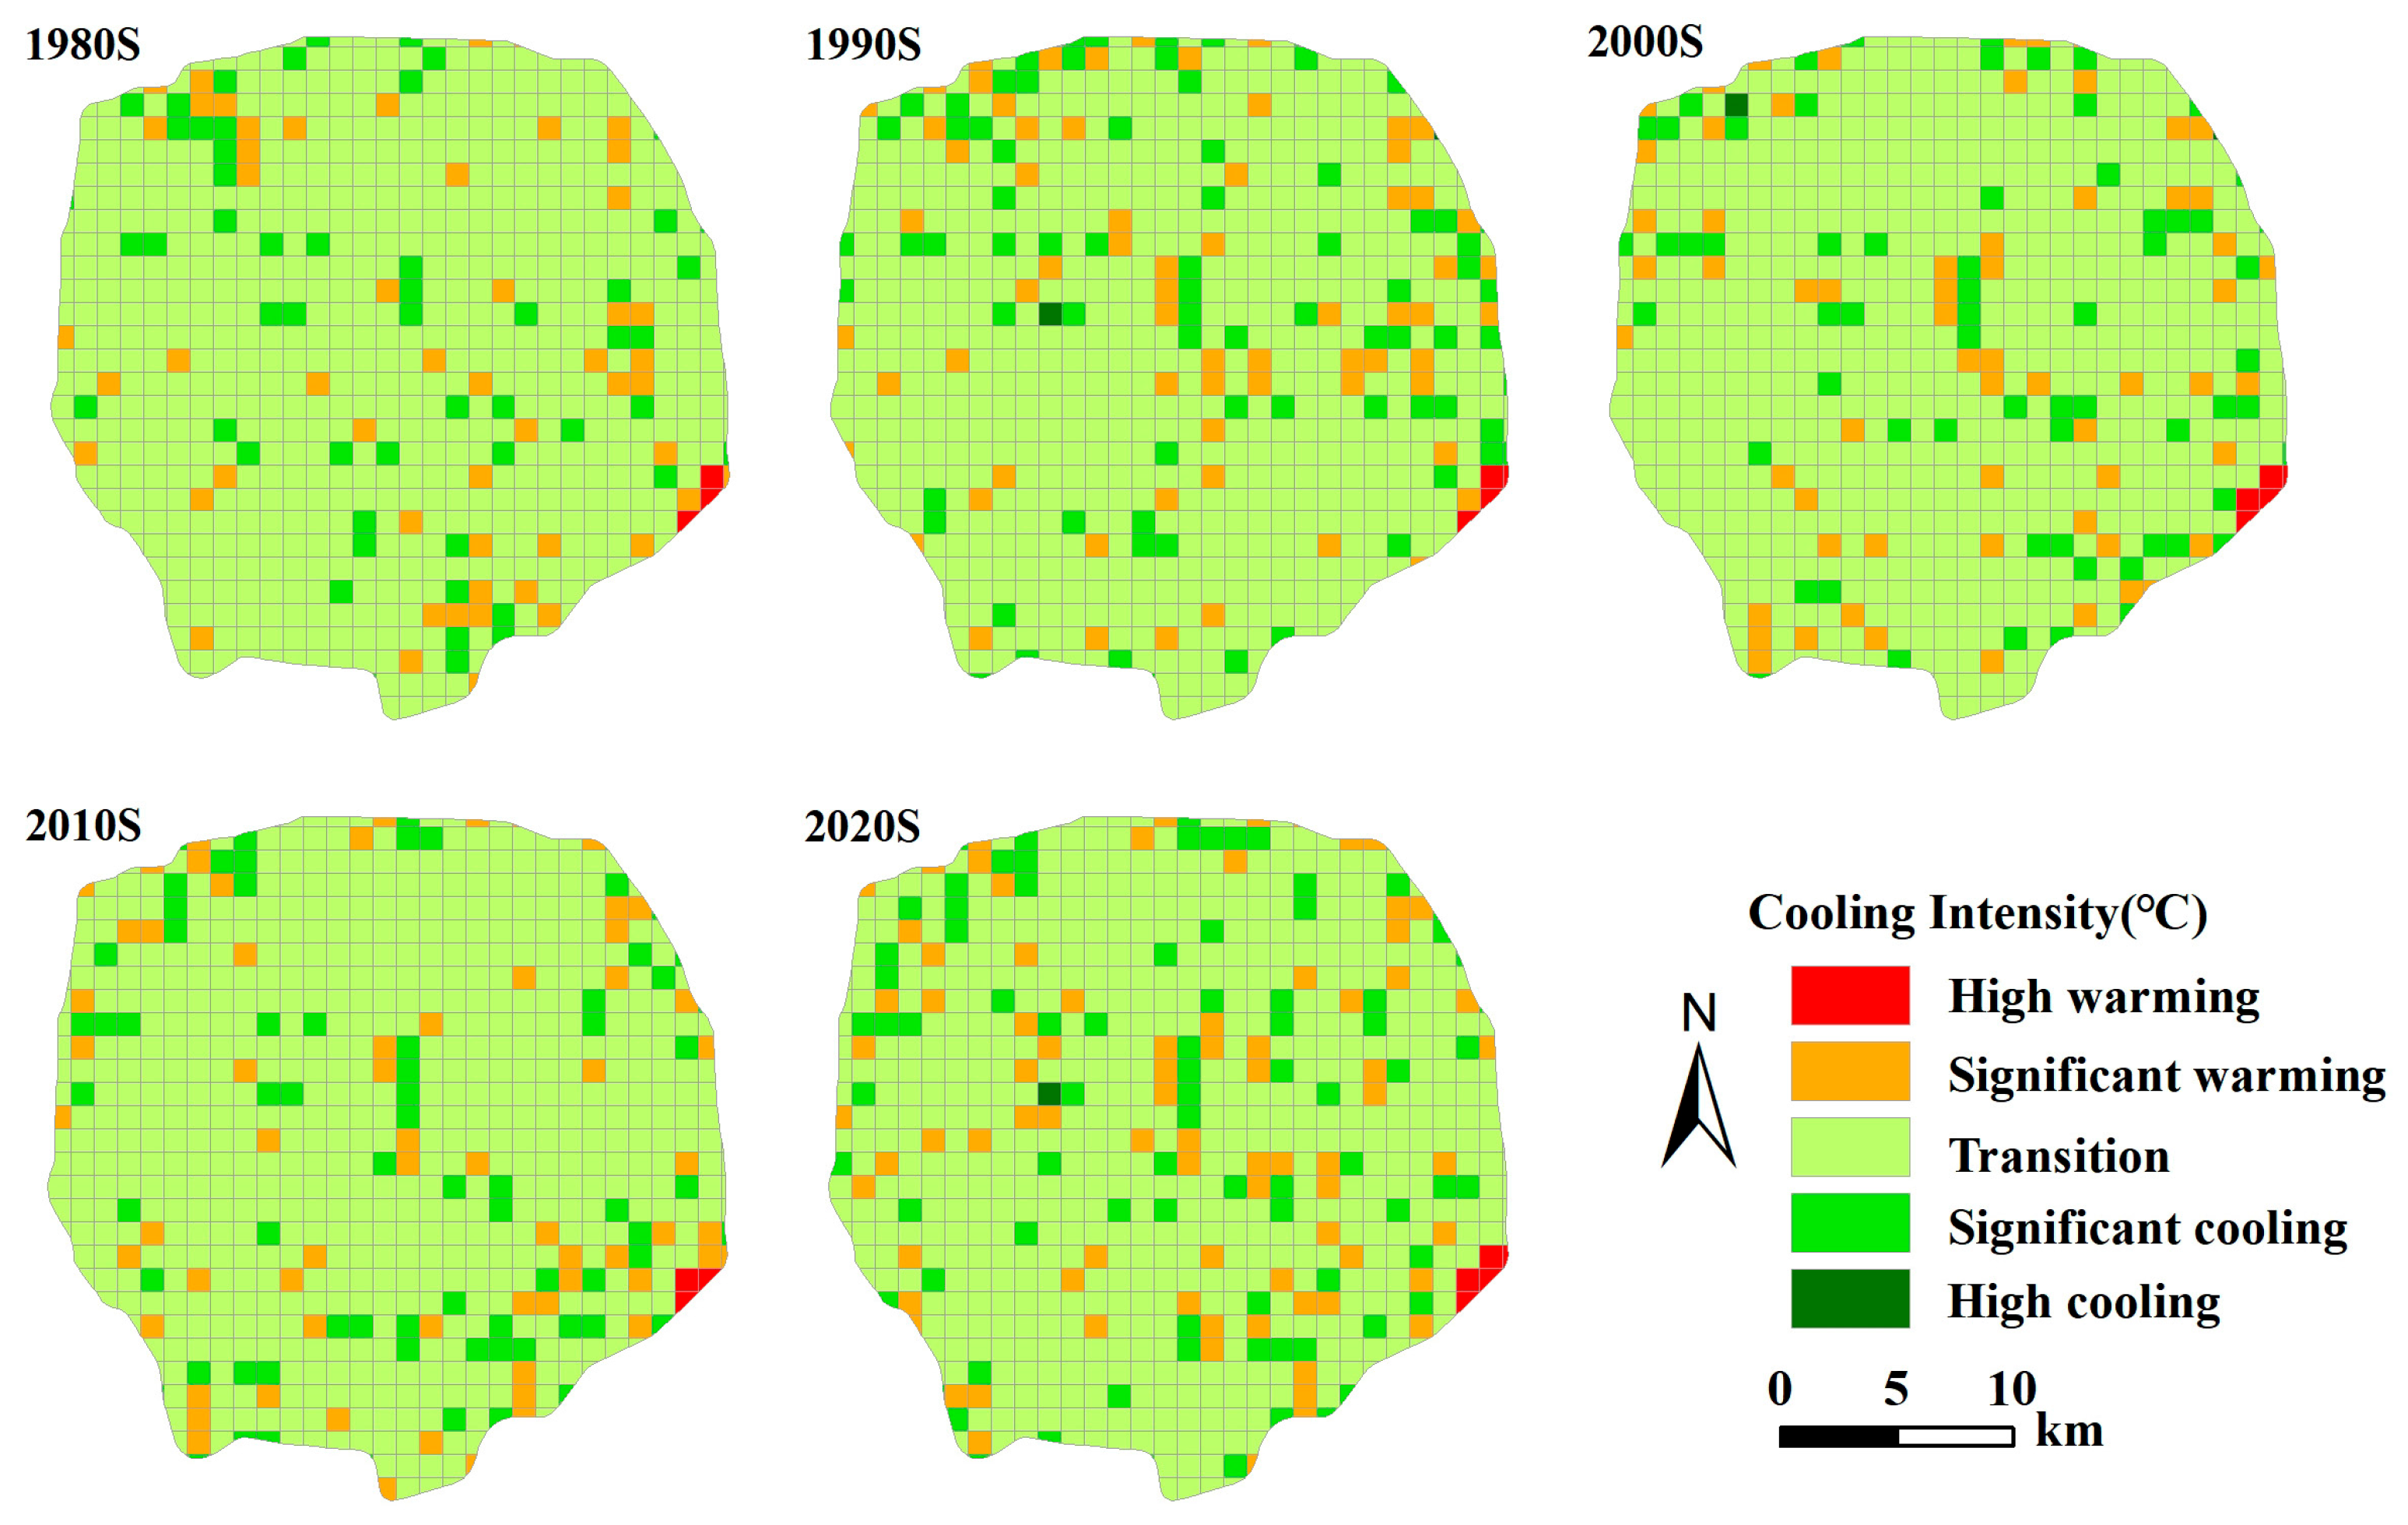
To quantify spatiotemporal variations in UGS cooling effects, this study analyzed the influence of individual 1 km × 1 km grid cells on LST in their eight adjacent neighbors. As Figure 13 demonstrates, grid-level cooling effects exhibited significant spatiotemporal heterogeneity. Across study periods, grid cells with pronounced warming effects clustered predominantly in the study area’s southeastern sector. ArcGIS 10.7 Online comparison with reference basemaps revealed this region’s characteristics: relatively low UGS coverage, extensive impervious surfaces, and dense industrial facilities—collectively elevating summer LST above surrounding areas.
Compared to the 1980s, more grid cells exhibited pronounced cooling capacity in the 2020s, with increased spatial homogeneity in their distribution. Analysis of summer vegetation coverage (Figure 5) reveals declining and increasingly fragmented green spaces at urban fringes over four decades, yet overall distribution has trended toward greater uniformity. This implies that large UGS patches alone are insufficient for optimal cooling. An integrated approach considering spatial configuration, adjacent land-use, and anthropogenic activities is essential. As shown in Figure 14, among the 100 randomly sampled points, most grid cells maintain a stable cooling intensity throughout all periods, within a range of ±1 °C, with only a few exceptions showing significant warming. Crucially, cooling peaks consistently outnumbered warming peaks, confirming UGS predominantly cooled local environments rather than contributing to warming. This provides robust evidence of UGS’s sustained role in mitigating summer UHI effects.
In summary, urban planning and ecological development strategies must recognize that solely augmenting green space area is insufficient to fully realize UGS cooling potential. Maximizing thermal regulation performance requires integrated consideration of UGS spatial distribution, structural composition, and local environmental contexts.

3.3.3. Interannual Variation Patterns of UGS Cooling Capacity

To assess interannual variation in UGS cooling effects, this study performed a cross-decadal comparative analysis of thermal regulation performance within fixed 1 km × 1 km grid cells (Table 3). Findings indicate short-term changes were predominantly ‘transition’ type (>50% per interval), peaking at 76.9% during 2010s–2020s. This demonstrates moderate inter-period stability in cooling capacity for most grids. ‘Enhancement’ grids remained limited in short-term intervals (typically 17–21%), contrasting with the 1980s–2020s long-term proportion of 25.4%. This suggests minimal short-term improvements but moderate long-term enhancement. ‘Weakening’ grids maintained a low proportion (minimum of 10.7% during 2010s–2020s), suggesting either a relatively stable UGS structure throughout this phase or a limited impact of urban expansion on the cooling capacity of UGS.
Overall, the period 2010s–2020s exhibited the highest thermal stability in the urban environment and was the only decade where “Enhanced” grids outnumbered “Weakened” grids. This can be attributed to the near-completion of urbanization within Beijing’s Fifth Ring Road, during which the development model shifted from extensive expansion to intensive renewal. From a long-term perspective (1980s–2020s), the proportion of “Enhanced” grids was significantly higher than that of “Weakened” grids, indicating sustained improvement in the cooling capacity of UGS across specific areas.

3.4. Analysis of the Driving Factors of UGS Cooling Effects

3.4.1. Analysis of Feature Importance for Driving Factors

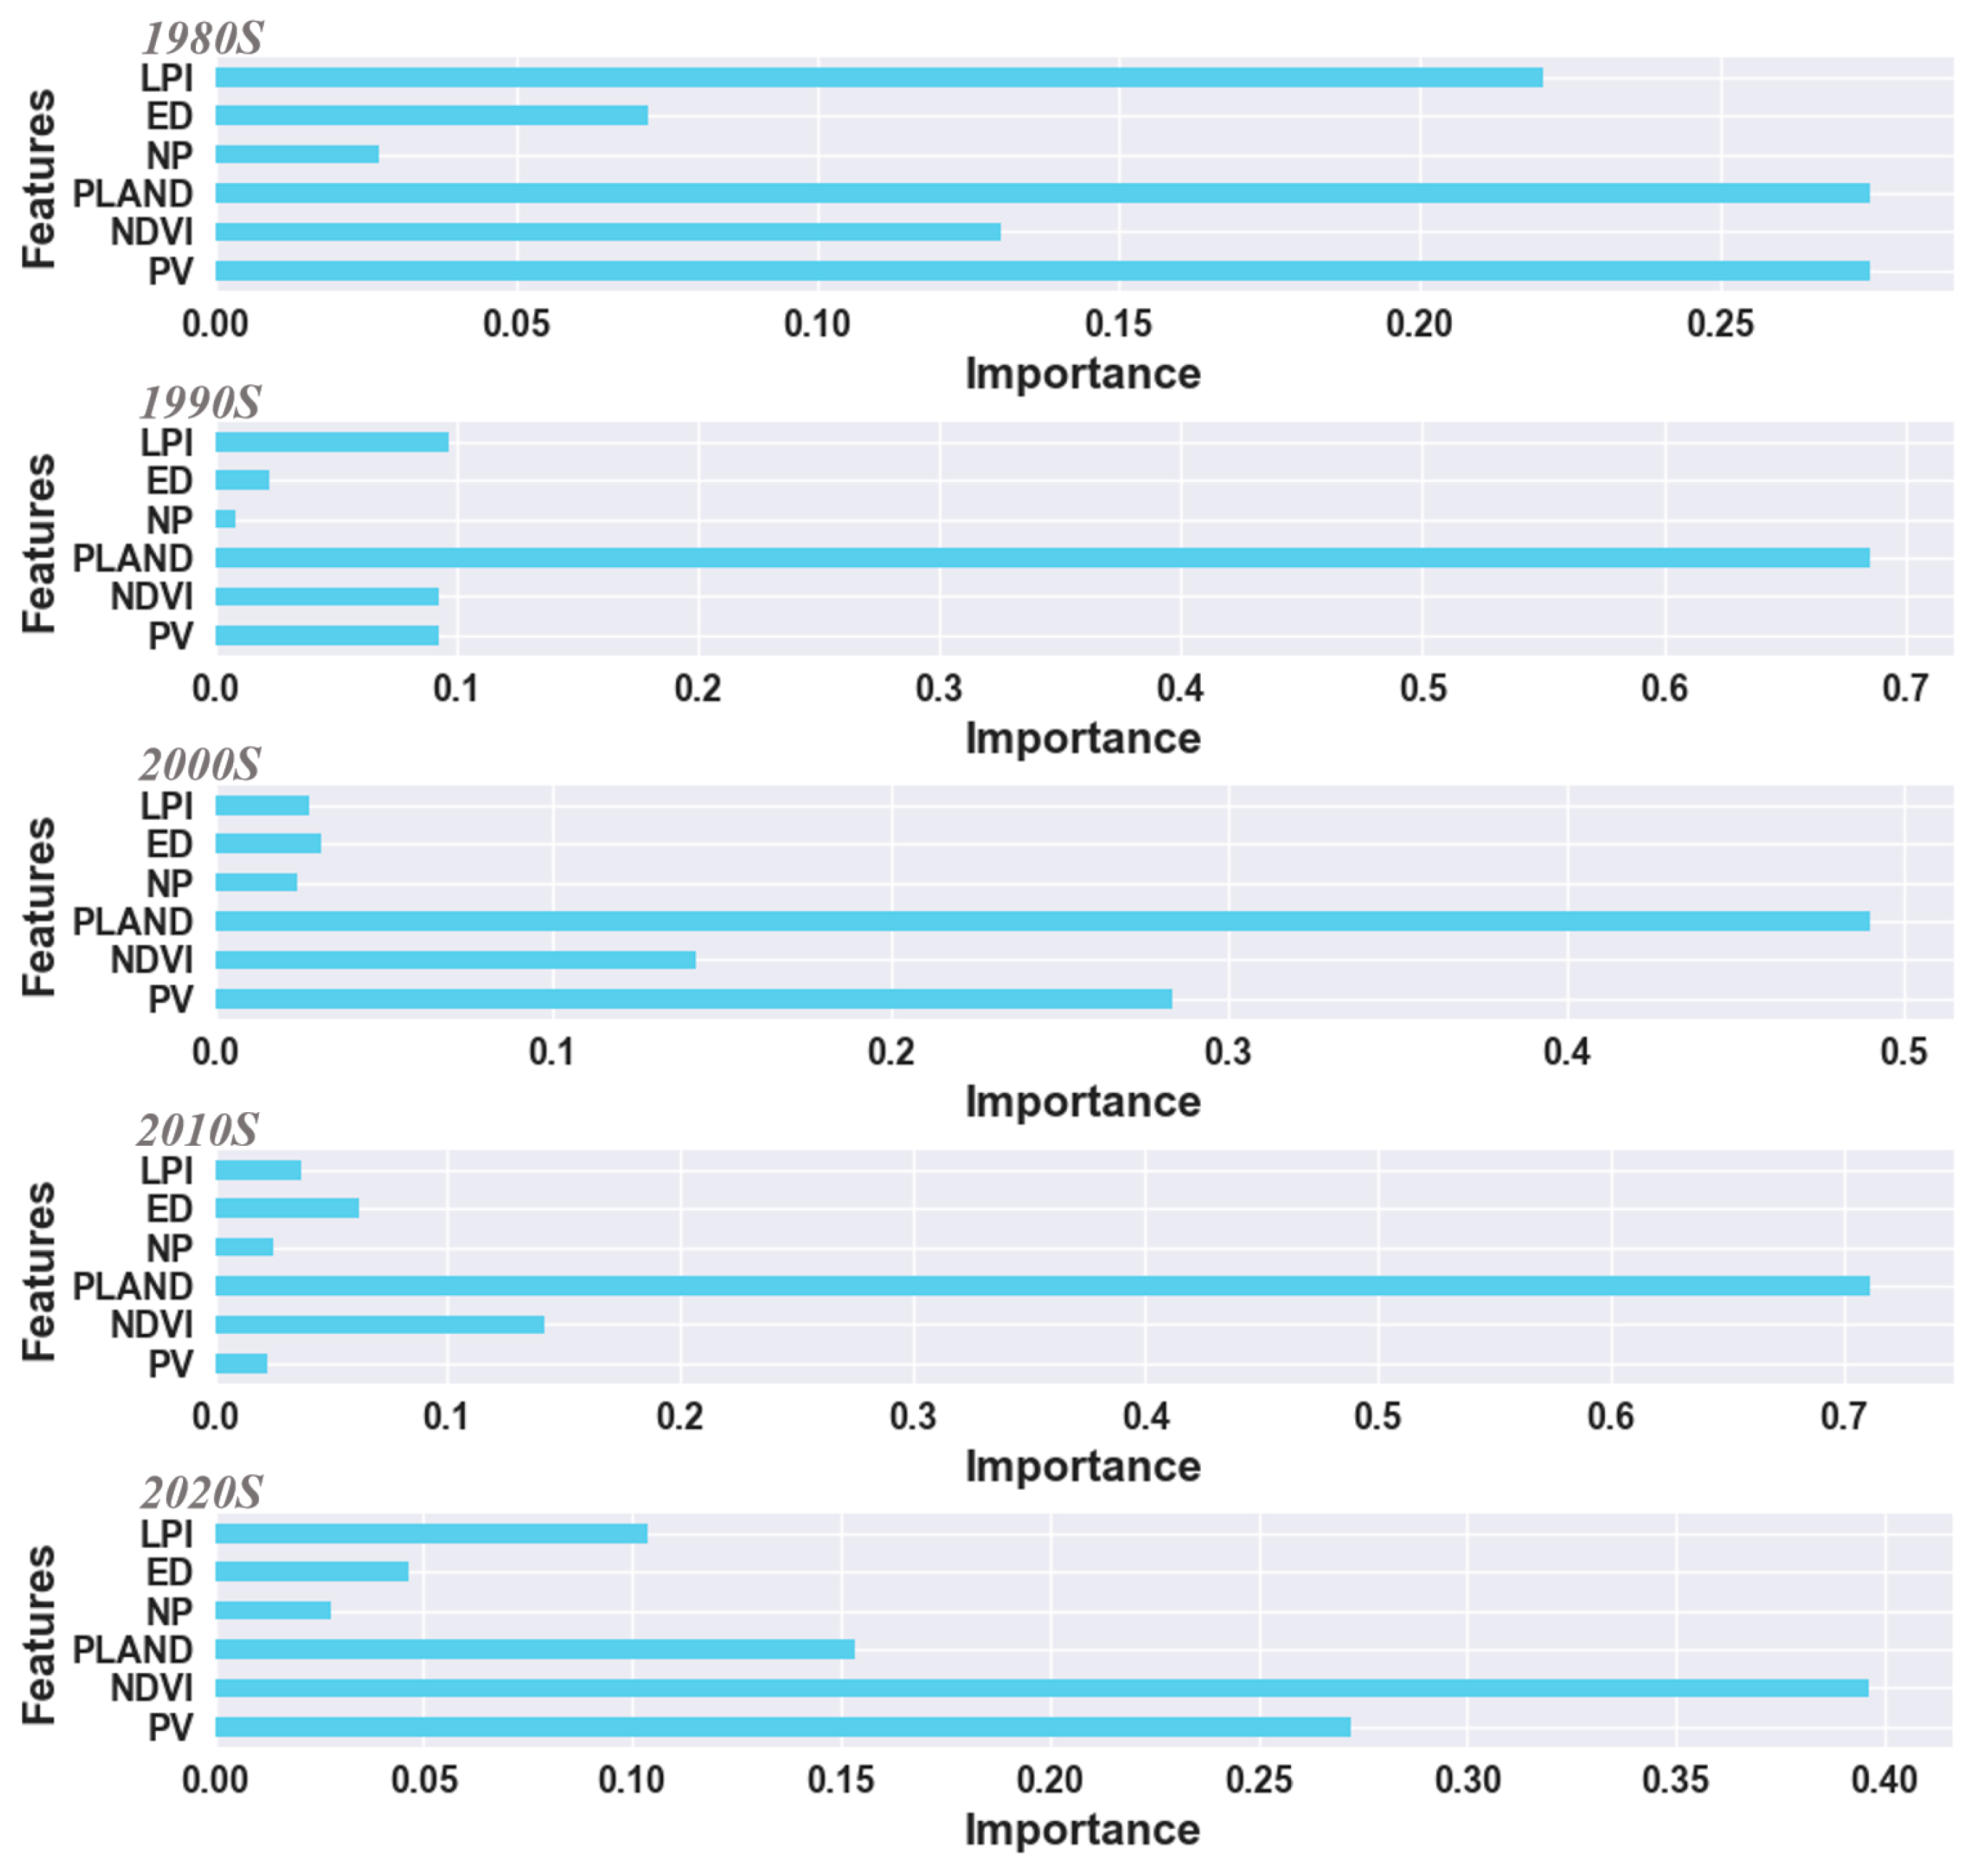
To systematically elucidate the relationship between LST variation and landscape patterns, feature importance analysis was conducted using XGBoost models across distinct temporal periods. As illustrated in Figure 15, the PLAND consistently demonstrated the highest feature importance from the 1990s to the 2010s, indicating that UGS proportion was the decisive predictor of LST variations during these decades. LPI was also relatively prominent only in the 1980s, highlighting the dominant role of large green patches in the early urban landscape configuration. By the 2020s, the importance of the NDVI and PV substantially increased, reflecting the growing influence of vegetation quality on environmental regulation. This shift signifies decreasing reliance on single-metric area indicators and a transition toward integrated consideration of vegetation condition and spatial configuration. Such evolution likely corresponds with advances in refined UGS management and ecological restoration technologies. Collectively, these findings reveal a clear transition in urban ecosystems: from a primary focus on UGS quantity toward an emphasis on UGS quality.

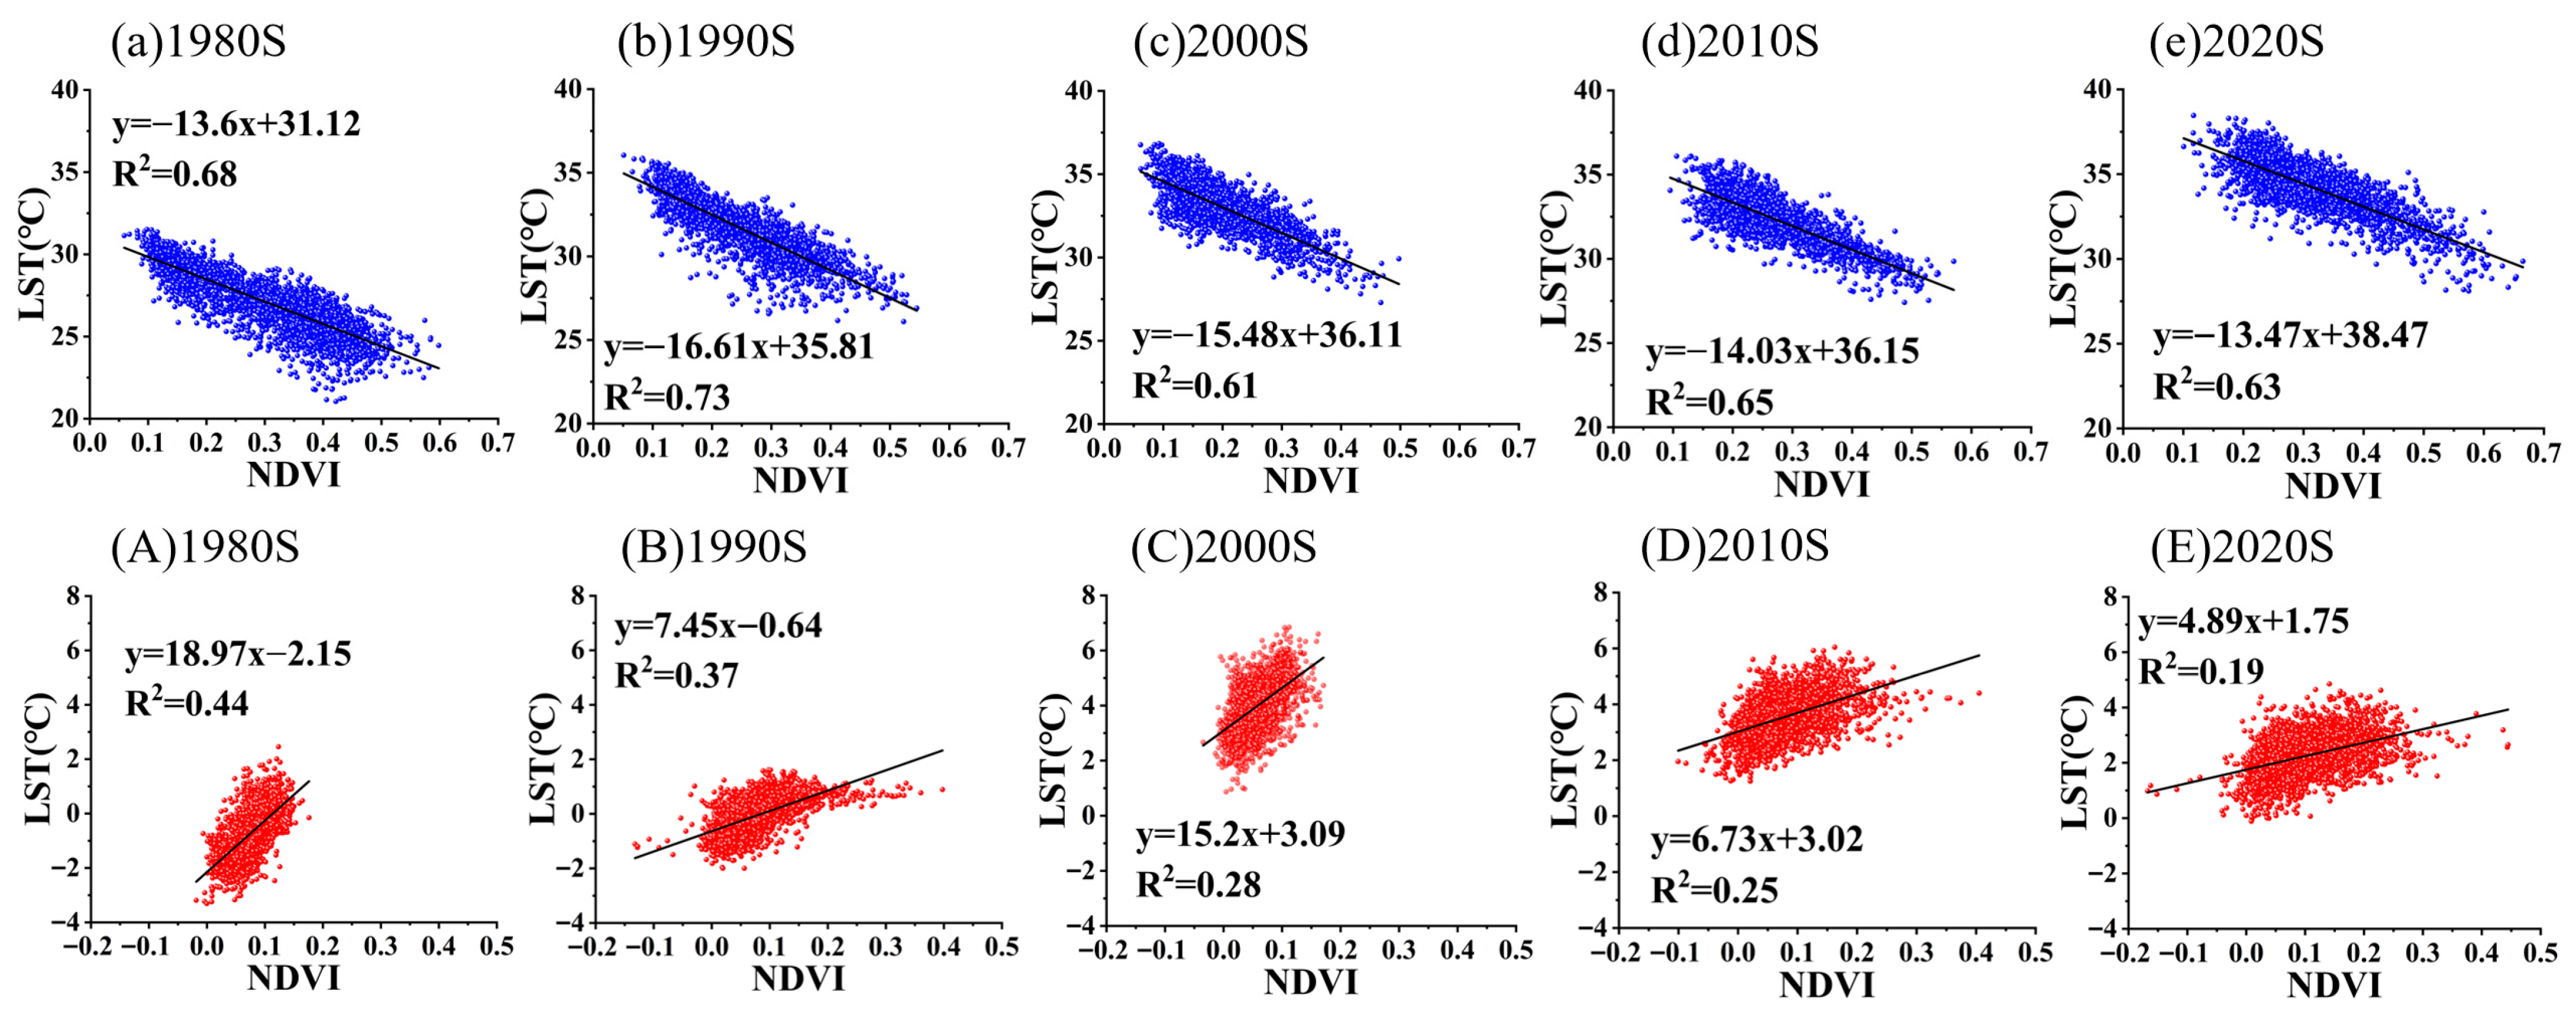
3.4.2. Correlation Between NDVI and LST

NDVI is a key metric for characterizing vegetation coverage on the land surface. Higher NDVI values correspond to denser vegetation, enhancing evapotranspiration (including evaporation and transpiration) and consequently reducing LST. Conversely, lower NDVI values indicate sparse vegetation and reduced evapotranspiration, typically leading to elevated LST. This study quantified the linear relationship between NDVI and LST across four decades (1980s–2020s), as presented in Figure 16.
During summer, NDVI and LST exhibited a significant negative correlation (correlation coefficients > 0.6), indicating strong coupling. The steepest linear regression slope occurred in the 1990s, reflecting the highest cooling efficiency per unit vegetation increase during that decade. Comparison of 1980s and 2020s summer data reveals that although localized LST increases occurred due to rapid urbanization within Beijing’s Fifth Ring Road, NDVI values concurrently increased in certain areas. This demonstrates that UGS has effectively moderated the urban thermal environment over the past four decades. Conversely, winter exhibited a positive NDVI-LST correlation with a weaker linear fit (R2), and both correlation strength and regression slopes diminished progressively over the study period. Winter NDVI values were significantly lower than summer values, consistent with limited evergreen vegetation coverage and reduced physiological activity characteristic of temperate cities during cold seasons. These findings indicate that vegetation’s influence on LST within the Fifth Ring Road is substantially diminished in winter.

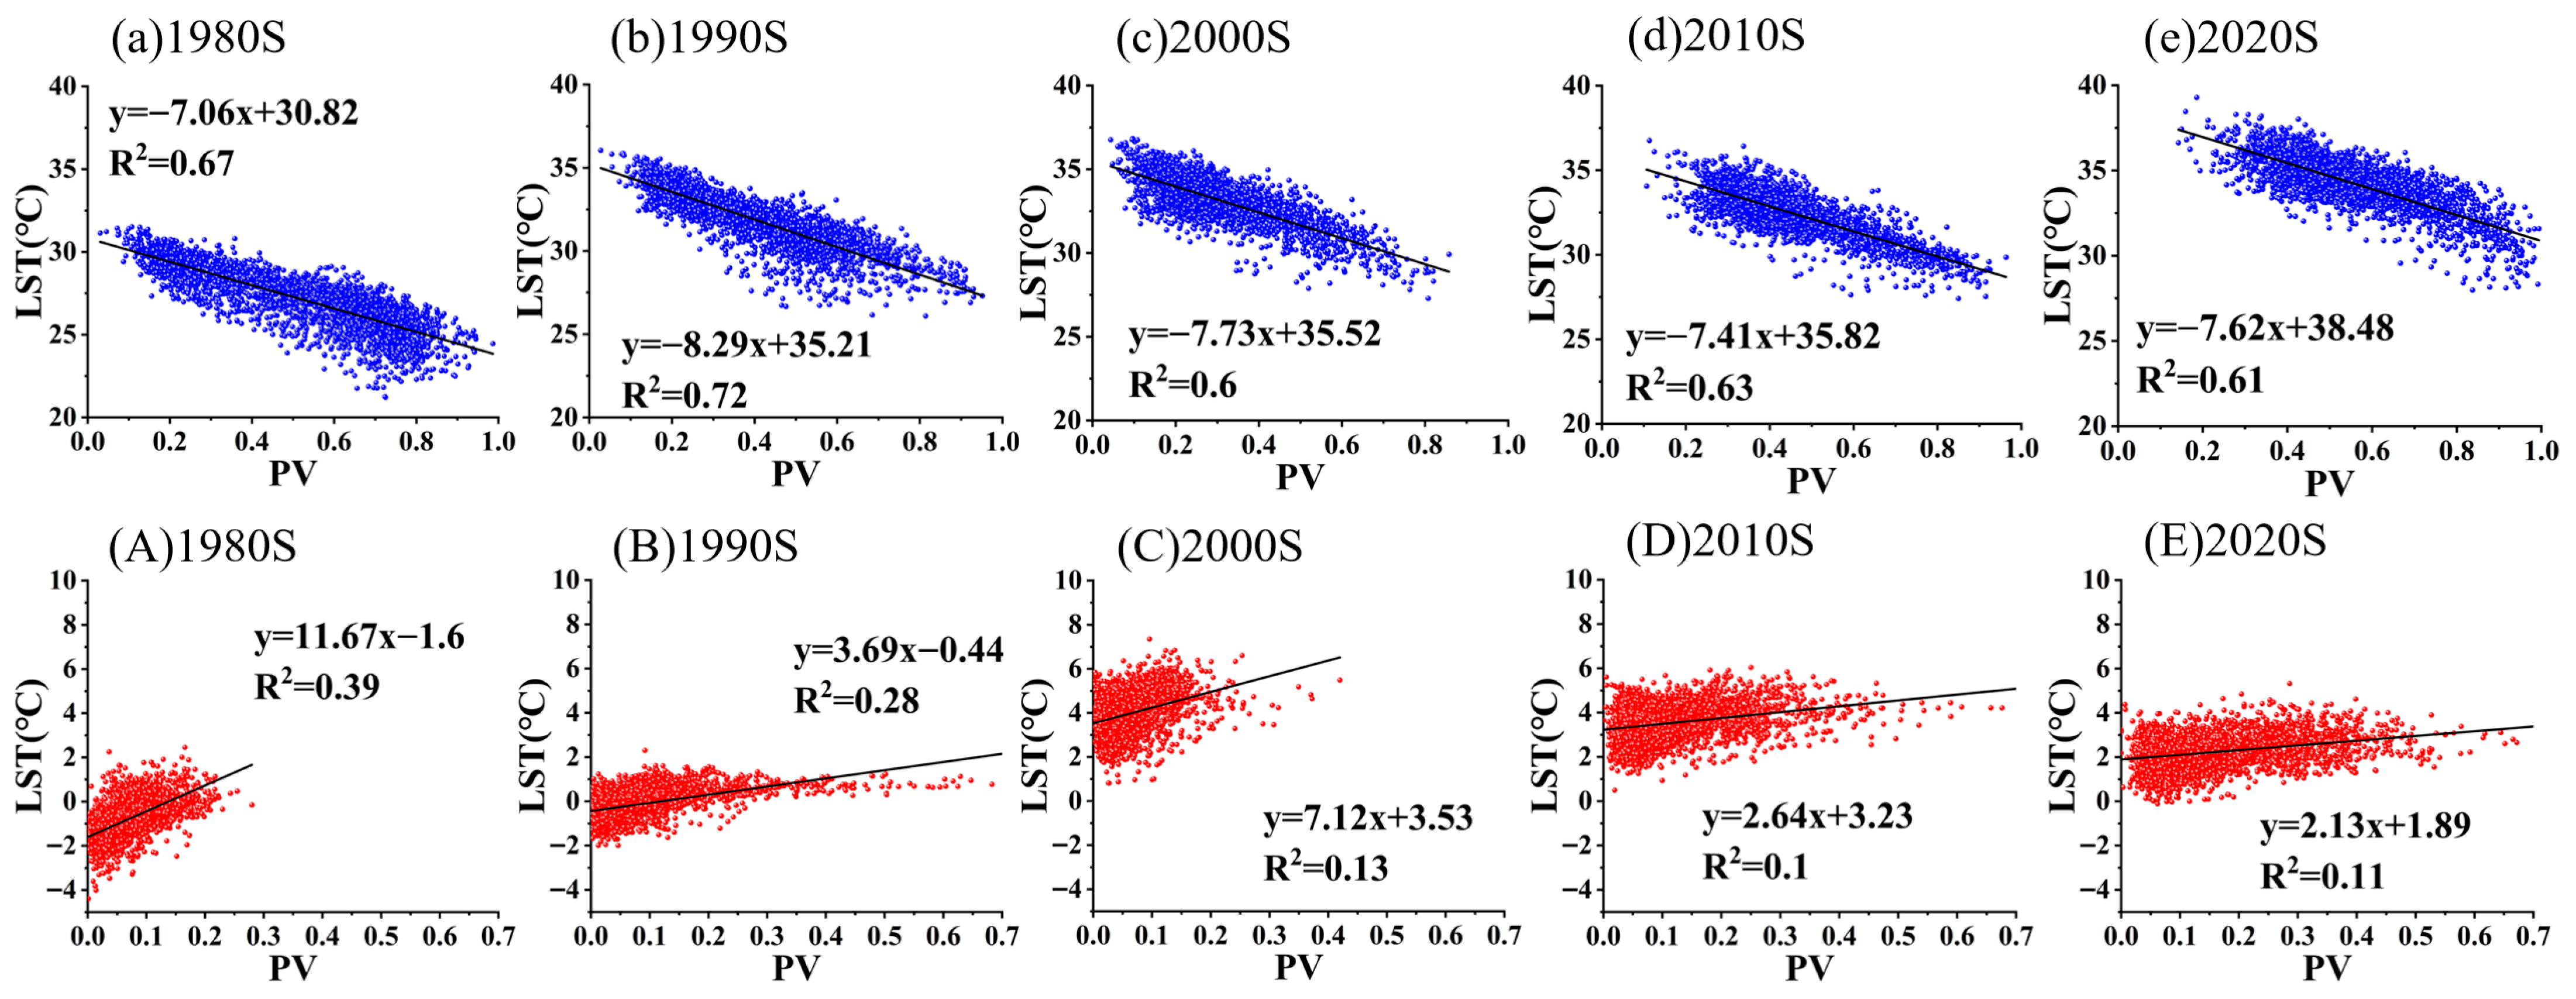
3.4.3. Correlation Between PV and LST

As presented in Figure 17, linear relationships between PV and LST were analyzed from the 1980s to the 2020s. Results demonstrate a consistently significant negative PV-LST correlation during summer across all periods (R2 > 0.6), confirming vegetation coverage’s critical role in regulating urban thermal environments. The strongest association occurred in the 1990s (R2 = 0.72, steepest slope), indicating peak cooling efficiency per unit vegetation increase. These findings underscore the essential function of summer heat mitigation. Conversely, winter exhibited positive PV-LST correlations with progressively diminishing explanatory power (all R2 < 0.4). By the 2000s–2020s, R2 declined to approximately 0.1, demonstrating vegetation’s negligible role in winter LST regulation within Beijing’s Fifth Ring Road. Given that vegetation cooling primarily depends on evapotranspiration and shading processes substantially inhibited during winter in temperate cities, these results align with expected seasonal limitations in ecological service functions.

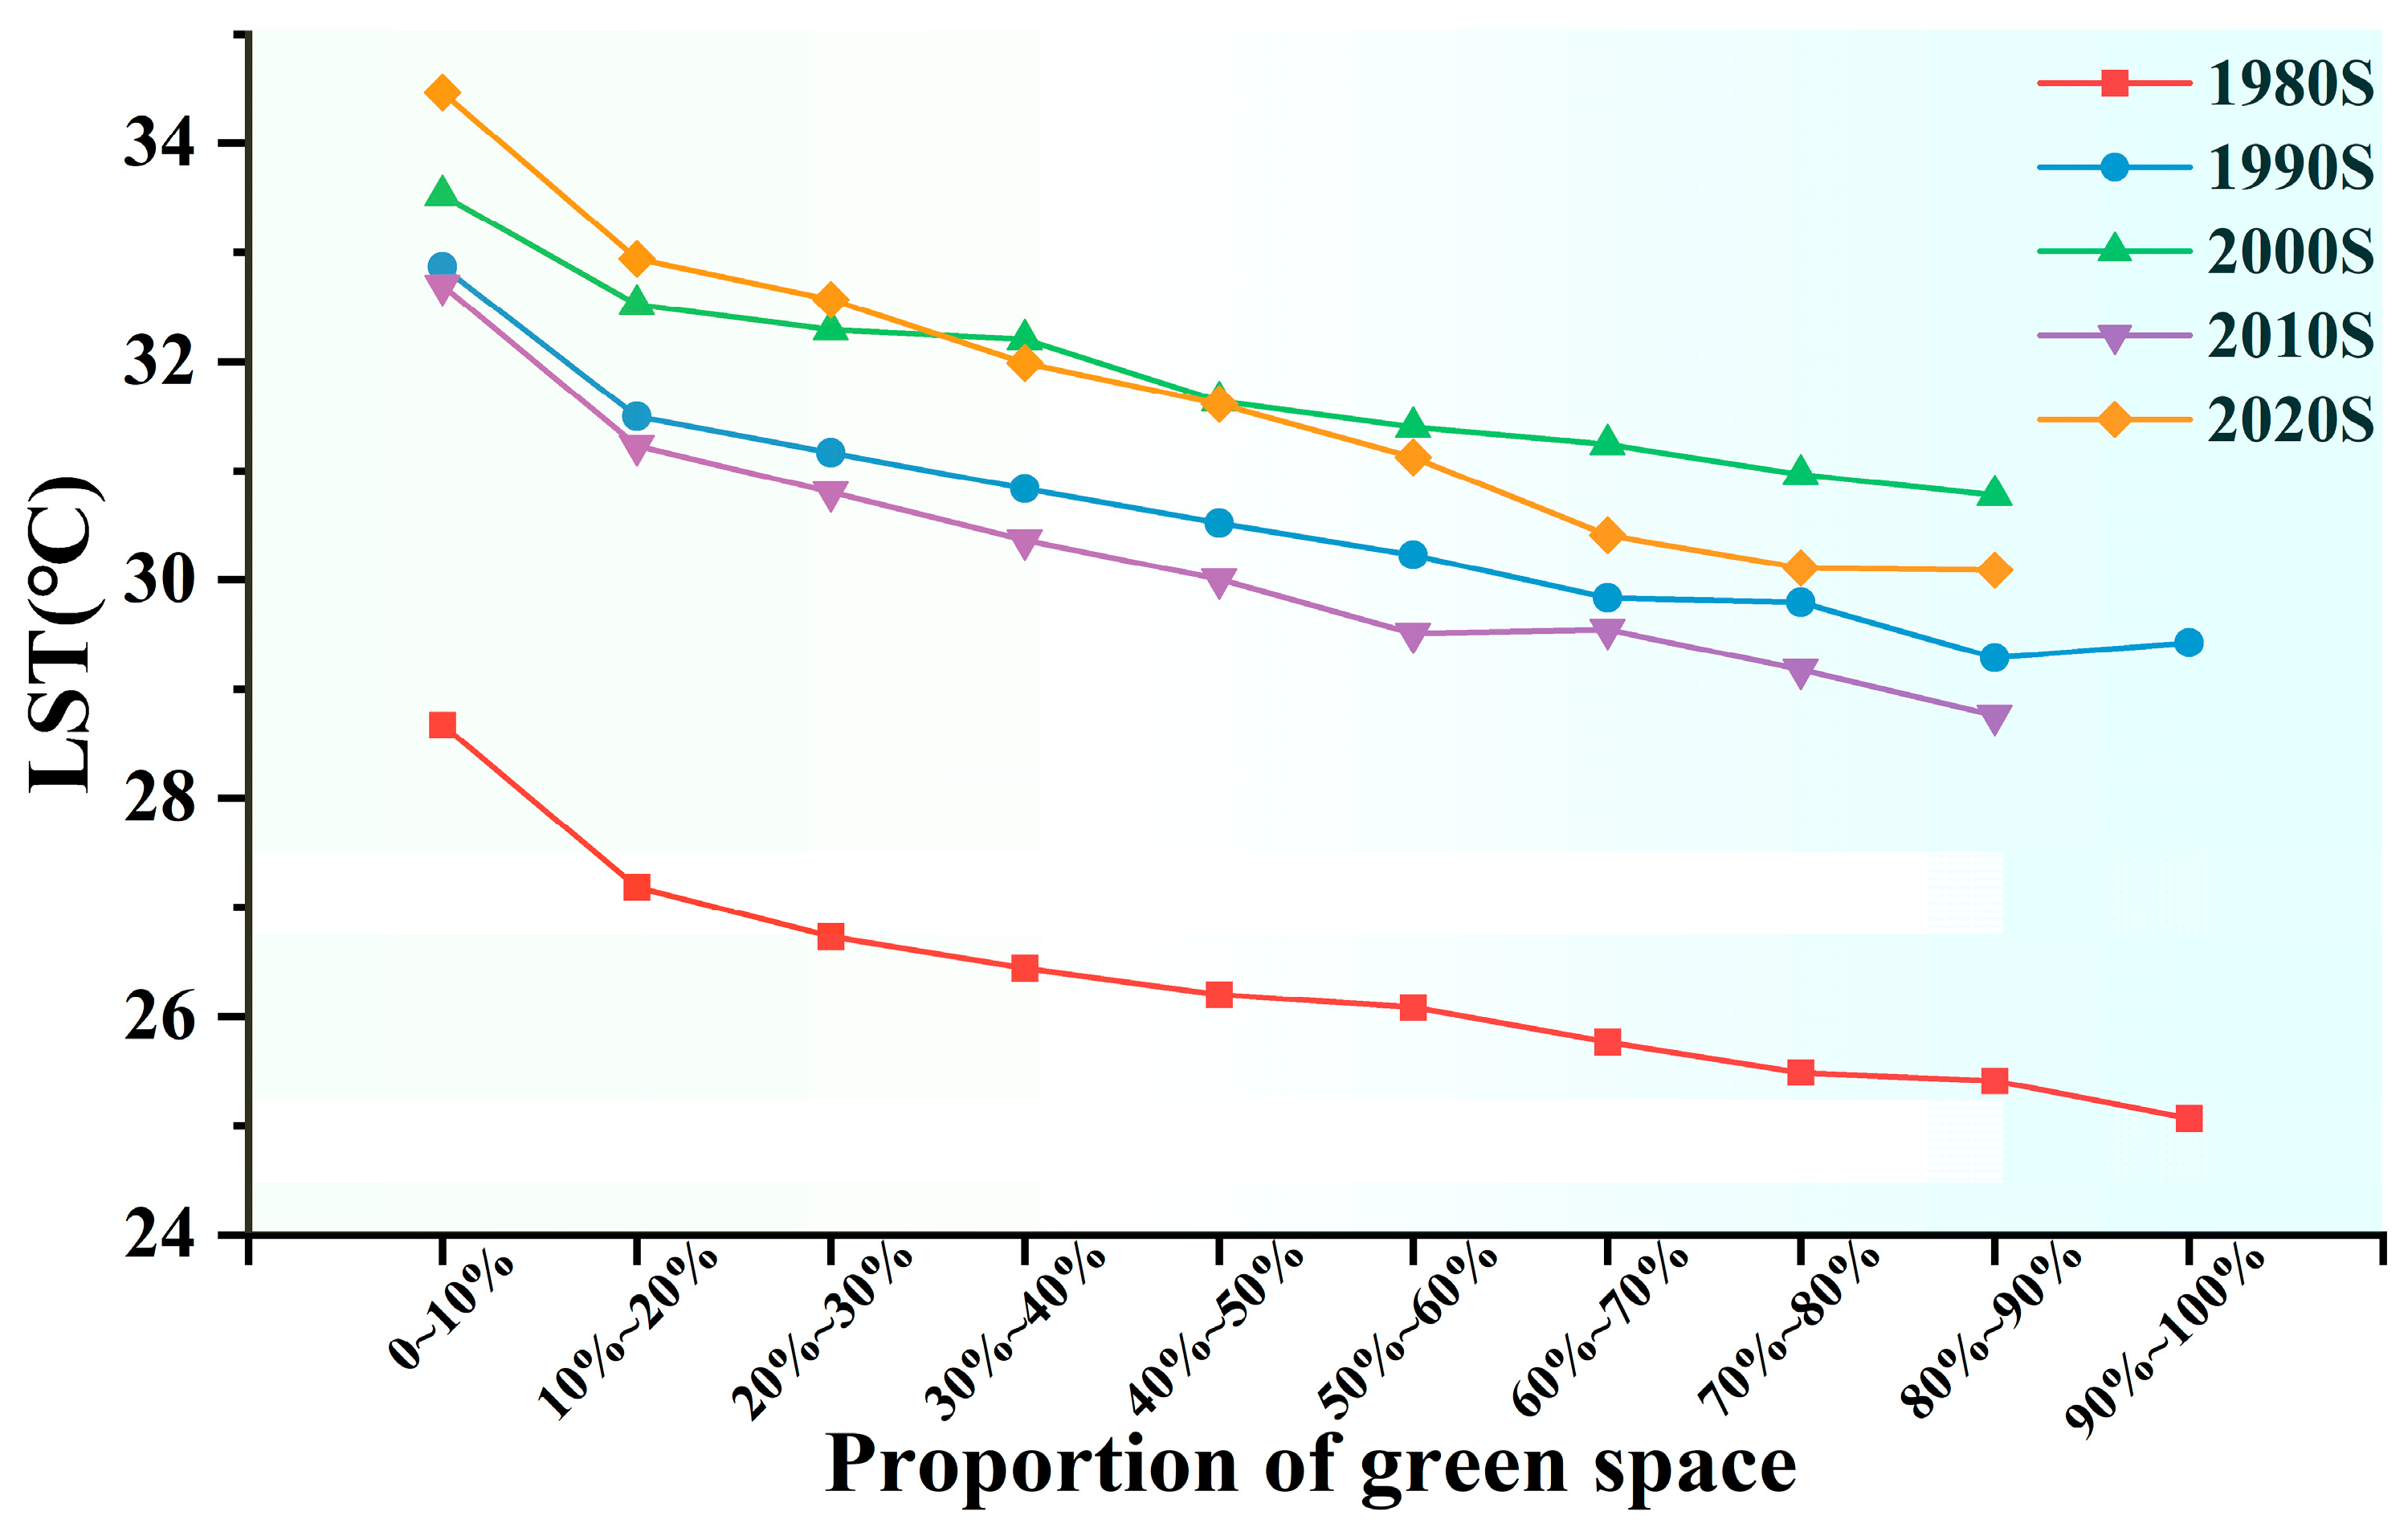
3.4.4. Effect of UGS Area on LST

To identify optimal UHI mitigation strategies through UGS, this study analyzed UGS-LST relationships at a 500 × 500 m grid unit scale (Figure 18). Grid classification based on UGS proportion revealed decade-specific thermal regulation patterns: Maximum cooling efficiency occurred at 10–20% UGS coverage throughout 1980–2020, achieving approximately 1 °C reduction with favorable ecological efficiency. Notably, during the 1990s, LST decreased monotonically with increasing UGS, peaking at 80–90% coverage. In contrast, the 2010s exhibited an inflection point at 50–60% coverage while maintaining cooling benefits beyond this threshold. Throughout the 1980s, 2000s, and 2020s, LST declined with UGS increase but demonstrated marginal thermal reductions beyond 80% coverage. These findings indicate that while UGS expansion effectively mitigates urban heat, diminishing returns occur beyond coverage thresholds. Consequently, optimizing thermal regulation requires holistic strategies integrating socioeconomic constraints with ecological objectives.
Since the 2000s, grid cells exceeding 90% UGS coverage have largely disappeared within Beijing’s Fifth Ring Road—a consequence of rapid urbanization converting green areas into built-up land. This transformation, driven by growing demands for transportation, residential, commercial, and public infrastructure, is particularly pronounced in the Central Business District (CBD) and Financial Street, where intensive land development pressures have precipitated significant UGS decline.

4. Discussion

4.1. Temporal Changes in Dominant Factors Influencing Cooling Effects of UGS

Multi-temporal XGBoost-based feature importance analysis reveals significant temporal shifts in primary drivers of UGS cooling capacity [56,57]. During the 1980s, higher LPI and PLAND values reflected that large continuous green spaces in the early UGS configuration played a dominant role in urban thermal regulation. From the 1990s to the 2010s, the PLAND consistently demonstrated the highest influence, confirming the total green coverage’s decisive role in urban heat mitigation. By the 2020s, vegetation quality indicators—particularly the NDVI and PV—exhibited substantially increased importance. This progression reflects a strategic transition from UGS quantity toward quality optimization [58,59,60], highlighting advancements in precision greening and ecological restoration technologies. Methodologically, temporal replication of XGBoost modeling effectively disentangles diverse drivers’ influence mechanisms on urban thermal environments [61]. Furthermore, spatially constraining the study area within Beijing’s Fifth Ring Road ensures representative specificity, enhancing the findings’ robustness and contextual relevance.

4.2. Evolution of Cooling Mechanisms and Optimal UGS Configuration

The overall findings of this study align closely with previous research, such as Hamada (2010) [62], which identified a significant negative correlation between vegetation cover and LST [63,64]. Specifically, the regulatory function of vegetation in reducing surface temperature—primarily mediated through transpiration and shading mechanisms—was robustly validated during summer. However, unlike earlier studies that predominantly employed static, single-time-point analyses, this research utilized multi-year, multi-temporal remote sensing data to systematically reveal the dynamic evolution of the UGS cooling effect across both temporal and seasonal dimensions in Beijing. This underscores a pivotal shift in urban thermal environment management: from prioritizing UGS quantity to emphasizing vegetation quality. Consequently, our work expands traditional frameworks in temporal scale and regulatory mechanisms. Significant seasonal and temporal variations in UGS cooling efficacy were observed. Cooling effects were most pronounced in summer, whereas the vegetation–LST correlation weakened considerably in winter. This finding corroborates Zhao (2021) [48], though our study extends spatial coverage to the entire area within Beijing’s Fifth Ring Road, yielding broader and more representative spatial insights [62,65,66,67]. Furthermore, an optimal UGS proportion threshold was identified: maximum cooling benefits occurred when vegetated areas comprised approximately 20% of the surrounding environment. This result closely aligns with the optimal configuration range proposed by Zeng (2025) [68]. Such evidence provides an operational, quantitative foundation for UGS planning and thermal environment optimization, offering substantive policy relevance and practical application value.

4.3. Optimization Strategies for UGS Cooling

Amid intensifying global climate warming, the UHI effect has become increasingly pronounced, posing significant challenges to urban ecological systems and public health. Studies demonstrate that merely expanding the UGS area is insufficient for UHI mitigation, as cooling benefits exhibit diminishing marginal returns [69]. Consequently, enhancing vegetation quality and vitality has emerged as essential for alleviating urban thermal stress and strengthening ecological resilience [58,69]. Urban planning must therefore transition from a quantitative to a qualitative paradigm, emphasizing diverse species composition, optimized ecosystem structures, and science-based ecological restoration techniques. Such approaches can elevate the holistic ecological service functions and microclimate regulation capacity of UGS. Focusing on Beijing, this study employs multi-source remote sensing data integrated with a nine-square grid spatial analysis framework to systematically investigate spatiotemporal dynamics of UGS patterns across regions and temporal scales. A notable example of policy-driven UGS change occurred during the Beijing Olympics, when a significant increase in green space resulted from targeted interventions and urban planning measures. These actions altered the urban landscape and, in turn, influenced the distribution of UGS and their associated cooling effects. Results reveal significant regional disparities in UGS distribution, driven by urban expansion, land-use transitions, and policy interventions. These findings establish a scientific foundation for optimized resource allocation and zonal management of green infrastructure, enabling spatially tailored governance strategies. This approach facilitates more efficient regulation of the urban thermal environment while advancing urban resilience and socio-ecological livability.

4.4. Limitations and Future Perspectives

This study had some limitations. First, although machine learning methods can effectively identify potential key predictors, they primarily reveal statistical associations rather than causal relationships. Therefore, to enhance the scientific rigor and interpretability of future research, it is essential to integrate causal inference models and spatial statistical approaches and to explore the multi-scale dynamics of underground space cooling effects. Second, although this study reveals long-term evolution patterns of UGS cooling effects within Beijing’s Fifth Ring Road, the scope remains confined to the urban core. This exclusion of rapidly expanding suburban areas due to urban sprawl fails to comprehensively characterize urbanization impacts on metropolitan-scale cooling effects. Additionally, the decadal temporal resolution may obscure short-term variation patterns. Third, vegetation-type differentiation in cooling efficacy was not addressed. Future work should incorporate species composition and canopy structure parameters for granular analysis [70]. Furthermore, multidimensional influences of urban morphology, socio-cultural dynamics, and socioeconomic factors require more systematic consideration. Subsequent research should integrate diverse data sources to enable comprehensive multifactorial analysis.

5. Conclusions

This study systematically analyzes the spatiotemporal evolution of the cooling capacity of UGS within the Beijing Fifth Ring Road area over the past four decades and its key driving factors. The main findings are as follows:
(1)
Pronounced seasonal differences: A significant negative correlation was observed between UGS and LST in summer (mean R2 > 0.64), strongly confirming the critical role of vegetation in regulating the urban thermal environment and mitigating the heat island effect. In contrast, the correlation weakened considerably in winter (mean R2 < 0.31), indicating a notable decline in the cooling capacity of vegetation during the cold season.
(2)
Phased fluctuations in cooling effectiveness: Accelerated urbanization has intensified the fragmentation of UGS inside the Fifth Ring Road, with a clear shift in spatial configuration from continuous patches to fragmented and isolated units. Concurrently, the cooling capacity exhibited distinct phased fluctuations, characterized by an “enhancement–decline–re-enhancement” trajectory. In the temporal comparison, the proportion of grids with an enhanced cooling effect consistently remained over 10% higher than in the preceding period. This trend was notably pronounced during the 1990s–2000s, with the proportion reaching 20.5%.
(3)
Spatiotemporal dynamics of landscape pattern: Urbanization has not only altered the spatial distribution of UGS but also reshaped its landscape pattern characteristics. Importance analysis based on the XGBoost model revealed significant temporal heterogeneity in the key indicators governing the cooling effect of UGS: in the 1980s, landscape-scale metrics (e.g., PLAND, LPI) were dominant, whereas by the 2020s, quality-based metrics (e.g., NDVI) became more influential. This shift indicates that the underlying influencing mechanism has transitioned from “scale-dominated” to “quality-dominated.” Therefore, future urban greening strategies should shift from merely pursuing green space expansion to optimizing spatial configuration and enhancing the ecological quality of vegetation.
(4)
Existence of an optimal cooling efficiency threshold: Investigation into the relationship between UGS area and LST over the past 40 years revealed that when the UGS coverage ratio increased from 0–10% to 10–20%, the cooling efficiency reached its maximum, achieving a temperature reduction of approximately 1 °C.

Author Contributions

Conceptualization, C.Y. and C.W.; methodology, C.W. and H.W.; software, L.Y.; validation, C.W. and H.W.; formal analysis, L.Y.; investigation, C.W.; resources, C.Y.; data curation, C.W. and L.Y.; writing—original draft preparation, C.W.; writing—review and editing, C.Y.; visualization, C.W.; project administration, C.Y.; funding acquisition, C.Y. All authors have read and agreed to the published version of the manuscript.

Funding

This study was funded by the National Natural Science Foundation of China (grant number 32471645, 42201123) and the Shandong Provincial Natural Science Foundation, China (grant number ZR2024MD024). This study was also supported by Shandong Provincial College and University Youth Innovation Technology Program (2024KJG015).

Institutional Review Board Statement

Not applicable.

Informed Consent Statement

Not applicable.

Data Availability Statement

The data presented in this study are available on request from the corresponding author. The data are not publicly available due to privacy.

Acknowledgments

The authors sincerely thank all contributors to this work. Special appreciation goes to C.Y. for her insightful guidance and project supervision.

Conflicts of Interest

The authors declare no conflicts of interest.

References

  1. Hamstead, Z.A.; Kremer, P.; Larondelle, N.; McPhearson, T.; Haase, D. Classification of the heterogeneous structure of urban landscapes (STURLA) as an indicator of landscape function applied to surface temperature in New York City. Ecol. Indic. 2016, 70, 574–585. [Google Scholar] [CrossRef]
  2. Bai, Y.; Jia, R.X. Elite Recruitment and Political Stability: The Impact of the Abolition of China’s Civil Service Exam. Econometrica 2016, 84, 677–733. [Google Scholar] [CrossRef]
  3. Rajagopal, P.; Priya, R.S.; Senthil, R. A review of recent developments in the impact of environmental measures on urban heat island. Sustain. Cities Soc. 2023, 88, 104279. [Google Scholar] [CrossRef]
  4. Zhang, W.; Li, W.; Zhang, C.; Hanink, D.M.; Liu, Y.; Zhai, R. Analyzing horizontal and vertical urban expansions in three East Asian megacities with the SS-coMCRF model. Landsc. Urban Plan. 2018, 177, 114–127. [Google Scholar] [CrossRef]
  5. Yu, B.; Liu, H.; Wu, J.; Hu, Y.; Zhang, L. Automated derivation of urban building density information using airborne LiDAR data and object-based method. Landsc. Urban Plan. 2010, 98, 210–219. [Google Scholar] [CrossRef]
  6. Stumpe, B.; Bechtel, B.; Heil, J.; Jörges, C.; Jostmeier, A.; Kalks, F.; Schwarz, K.; Marschner, B. Soil texture mediates the surface cooling effect of urban and peri-urban green spaces during a drought period in the city area of Hamburg (Germany). Sci. Total Environ. 2023, 897, 165228. [Google Scholar] [CrossRef] [PubMed]
  7. Yin, H.; Zhao, X. Urban heat island analysis based on high resolution measurement data: A case study in Beijing. Sustain. Cities Soc. 2024, 106, 105389. [Google Scholar] [CrossRef]
  8. Yuan, F.; Bauer, M.E. Comparison of impervious surface area and normalized difference vegetation index as indicators of surface urban heat island effects in Landsat imagery. Remote Sens. Environ. 2007, 106, 375–386. [Google Scholar] [CrossRef]
  9. Leal, W.; Wolf, F.; Castro-Díaz, R.; Li, C.L.; Ojeh, V.N.; Gutiérrez, N.; Nagy, G.J.; Savic, S.; Natenzon, C.E.; Al-Amin, A.Q.; et al. Addressing the Urban Heat Islands Effect: A Cross-Country Assessment of the Role of Green Infrastructure. Sustainability 2021, 13, 753. [Google Scholar] [CrossRef]
  10. Gago, E.J.; Roldan, J.; Pacheco-Torres, R.; Ordóñez, J. The city and urban heat islands: A review of strategies to mitigate adverse effects. Renew. Sustain. Energy Rev. 2013, 25, 749–758. [Google Scholar] [CrossRef]
  11. Leal Filho, W.; Echevarria Icaza, L.; Neht, A.; Klavins, M.; Morgan, E.A. Coping with the impacts of urban heat islands. A literature based study on understanding urban heat vulnerability and the need for resilience in cities in a global climate change context. J. Clean. Prod. 2018, 171, 1140–1149. [Google Scholar] [CrossRef]
  12. Santamouris, M. Recent progress on urban overheating and heat island research. Integrated assessment of the energy, environmental, vulnerability and health impact. Synergies with the global climate change. Energy Build. 2020, 207, 109482. [Google Scholar] [CrossRef]
  13. Liu, R.; Dong, X.; Wang, X.; Zhang, P.; Liu, M.; Zhang, Y. Relationship and driving factors between urbanization and natural ecosystem health in China. Ecol. Indic. 2023, 147, 109972. [Google Scholar] [CrossRef]
  14. Akdag, S.; Yıldırım, H. Toward a sustainable mitigation approach of energy efficiency to greenhouse gas emissions in the European countries. Heliyon 2020, 6, e03396. [Google Scholar] [CrossRef] [PubMed]
  15. Skillington, K.; Crawford, R.H.; Warren-Myers, G.; Davidson, K. A review of existing policy for reducing embodied energy and greenhouse gas emissions of buildings. Energy Policy 2022, 168, 112920. [Google Scholar] [CrossRef]
  16. Lin, T.-Y.; Chiu, Y.-h.; Chen, C.-H.; Ji, L. Renewable energy consumption efficiency, greenhouse gas emission efficiency, and climate change in Europe. Geoenergy Sci. Eng. 2025, 247, 213665. [Google Scholar] [CrossRef]
  17. Wu, Z.; Zhou, Y.; Ren, Y. Green space-building integration for Urban Heat Island mitigation: Insights from Beijing’s fifth ring road district. Sustain. Cities Soc. 2024, 116, 105917. [Google Scholar] [CrossRef]
  18. Wu, C.; Li, J.; Wang, C.; Song, C.; Chen, Y.; Finka, M.; La Rosa, D. Understanding the relationship between urban blue infrastructure and land surface temperature. Sci. Total Environ. 2019, 694, 133742. [Google Scholar] [CrossRef]
  19. Furlan, R.; Sinclair, B.R. Planning for a neighborhood and city-scale green network system in Qatar: The case of MIA Park. Environ. Dev. Sustain. 2021, 23, 14933–14957. [Google Scholar] [CrossRef]
  20. Huang, J.; Kong, F.; Yin, H.; Middel, A.; Liu, H.; Zheng, X.; Wen, Z.; Wang, D. Transpirational cooling and physiological responses of trees to heat. Agric. For. Meteorol. 2022, 320, 108940. [Google Scholar] [CrossRef]
  21. Su, Y.; Wu, J.; Zhang, C.; Wu, X.; Li, Q.; Liu, L.; Bi, C.; Zhang, H.; Lafortezza, R.; Chen, X. Estimating the cooling effect magnitude of urban vegetation in different climate zones using multi-source remote sensing. Urban Clim. 2022, 43, 101155. [Google Scholar] [CrossRef]
  22. Armson, D.; Stringer, P.; Ennos, A.R. The effect of tree shade and grass on surface and globe temperatures in an urban area. Urban For. Urban Green. 2012, 11, 245–255. [Google Scholar] [CrossRef]
  23. Li, P.; Wu, W.; Yin, Y. Enhanced accessibility to park cooling services in developed areas: Experimental insights on the walkability in large urban agglomerations. Build. Environ. 2025, 272, 112665. [Google Scholar] [CrossRef]
  24. Gao, Z.; Zaitchik, B.F.; Hou, Y.; Chen, W. Toward park design optimization to mitigate the urban heat Island: Assessment of the cooling effect in five U.S. cities. Sustain. Cities Soc. 2022, 81, 103870. [Google Scholar] [CrossRef]
  25. Yang, F.; Yousefpour, R.; Zhang, Y.; Wang, H. The assessment of cooling capacity of blue-green spaces in rapidly developing cities: A case study of Tianjin’s central urban area. Sustain. Cities Soc. 2023, 99, 104918. [Google Scholar] [CrossRef]
  26. Zhou, W.; Yu, W.; Zhang, Z.; Cao, W.; Wu, T. How can urban green spaces be planned to mitigate urban heat island effect under different climatic backgrounds? A threshold-based perspective. Sci. Total Environ. 2023, 890, 164422. [Google Scholar] [CrossRef]
  27. Das, M.; Das, A.; Momin, S. Quantifying the cooling effect of urban green space: A case from urban parks in a tropical mega metropolitan area (India). Sustain. Cities Soc. 2022, 87, 104062. [Google Scholar] [CrossRef]
  28. Liu, Q.; Dong, Q.; Zhang, L.; Sun, C. Summer cooling island effects of blue-green spaces in severe cold regions: A case study of harbin, China. Build. Environ. 2024, 257, 111539. [Google Scholar] [CrossRef]
  29. Zhang, M.; Huang, L.; Jiang, W.; Fan, M.; Dai, W.; Han, W.; Xu, Q.; Dong, Y. Urban core greening and industrial decentralization lead to contrasting trends in surface urban heat islands in a metropolitan area in China. J. Environ. Manag. 2025, 374, 124045. [Google Scholar] [CrossRef] [PubMed]
  30. Peng, J.; Dan, Y.; Yu, X.; Xu, D.; Yang, Z.; Wang, Q. Response of urban green space cooling effect to urbanization in the Three Ring Road area of Changsha City. Sustain. Cities Soc. 2024, 109, 105534. [Google Scholar] [CrossRef]
  31. Wang, Y.; Meng, D.; Zhu, Y.; Zhang, F. Impacts of regional urbanization development on plant diversity within boundary of built-up areas of different settlement categories in Jinzhong Basin, China. Landsc. Urban Plan. 2009, 91, 212–218. [Google Scholar] [CrossRef]
  32. Xiao, X.D.; Dong, L.; Yan, H.; Yang, N.; Xiong, Y. The influence of the spatial characteristics of urban green space on the urban heat island effect in Suzhou Industrial Park. Sustain. Cities Soc. 2018, 40, 428–439. [Google Scholar] [CrossRef]
  33. Shah, A.; Garg, A.; Mishra, V. Quantifying the local cooling effects of urban green spaces: Evidence from Bengaluru, India. Landsc. Urban Plan. 2021, 209, 104043. [Google Scholar] [CrossRef]
  34. Kabisch, N.; Frantzeskaki, N.; Pauleit, S.; Naumann, S.; Davis, M.; Artmann, M.; Haase, D.; Knapp, S.; Korn, H.; Stadler, J.; et al. Nature-based solutions to climate change mitigation and adaptation in urban areas: Perspectives on indicators, knowledge gaps, barriers, and opportunities for action. Ecol. Soc. 2016, 21, 39. [Google Scholar] [CrossRef]
  35. Fedele, G.; Donatti, C.I.; Harvey, C.A.; Hannah, L.; Hole, D.G. Transformative adaptation to climate change for sustainable social-ecological systems. Environ. Sci. Policy 2019, 101, 116–125. [Google Scholar] [CrossRef]
  36. Wolch, J.R.; Byrne, J.; Newell, J.P. Urban green space, public health, and environmental justice: The challenge of making cities ‘just green enough’. Landsc. Urban Plan. 2014, 125, 234–244. [Google Scholar] [CrossRef]
  37. Rasul, A.; Balzter, H.; Smith, C.; Remedios, J.; Adamu, B.; Sobrino, J.A.; Srivanit, M.; Weng, Q.; Millington, A.; Nagendra, H.; et al. A Review on Remote Sensing of Urban Heat and Cool Islands. Land 2017, 6, 38. [Google Scholar] [CrossRef]
  38. Pritipadmaja; Garg, R.D.; Sharma, A.K. Assessing the Cooling Effect of Blue-Green Spaces: Implications for Urban Heat Island Mitigation. Water 2023, 15, 2983. [Google Scholar] [CrossRef]
  39. Budzik, G.; Sylla, M.; Kowalczyk, T. Understanding Urban Cooling of Blue-Green Infrastructure: A Review of Spatial Data and Sustainable Planning Optimization Methods for Mitigating Urban Heat Islands. Sustainability 2025, 17, 142. [Google Scholar] [CrossRef]
  40. Zhao, Z.; Zhang, G.; Chen, Q.; Cai, D.; Meng, F.; Long, X.; Zhang, T.; Wang, Y.; Xu, T.; Yang, H.; et al. Gold exploration using multi-source remote sensing data in the northern part of the Wa State, Myanmar. Ore Geol. Rev. 2025, 183, 106703. [Google Scholar] [CrossRef]
  41. Bowler, D.E.; Buyung-Ali, L.; Knight, T.M.; Pullin, A.S. Urban greening to cool towns and cities: A systematic review of the empirical evidence. Landsc. Urban Plan. 2010, 97, 147–155. [Google Scholar] [CrossRef]
  42. Zhou, W.; Cao, W.; Wu, T.; Zhang, T. The win-win interaction between integrated blue and green space on urban cooling. Sci. Total Environ. 2023, 863, 160712. [Google Scholar] [CrossRef]
  43. Wang, M.; Song, H.Y.; Zhu, W.; Wang, Y.C. The Cooling Effects of Landscape Configurations of Green-Blue Spaces in Urban Waterfront Community. Atmosphere 2023, 14, 833. [Google Scholar] [CrossRef]
  44. Lin, B.-S.; Tsai, Y.-H.; Chang, H.-C.; Yu, C.-C.; Hsieh, C.-I. Building with nature: Morphological spatial pattern of green infrastructure in urban heat mitigation. Build. Environ. 2025, 279, 113087. [Google Scholar] [CrossRef]
  45. Pan, Z.W.; Xie, Z.Y.; Wu, L.Y.; Pan, Y.; Ding, N.; Liang, Q.S.; Qin, F. Simulation of Cooling Island Effect in Blue-Green Space Based on Multi-Scale Coupling Model. Remote Sens. 2023, 15, 2093. [Google Scholar] [CrossRef]
  46. Yu, Z.; Yang, G.; Zuo, S.; Jørgensen, G.; Koga, M.; Vejre, H. Critical review on the cooling effect of urban blue-green space: A threshold-size perspective. Urban For. Urban Green. 2020, 49, 126630. [Google Scholar] [CrossRef]
  47. Gómez-Baggethun, E.; Barton, D.N. Classifying and valuing ecosystem services for urban planning. Ecol. Econ. 2013, 86, 235–245. [Google Scholar] [CrossRef]
  48. Zhao, J.C.; Zhao, X.; Liang, S.L.; Wang, H.Y.; Liu, N.J.; Liu, P.; Wu, D.H. Dynamic Cooling Effects of Permanent Urban Green Spaces in Beijing, China. Remote Sens. 2021, 13, 3282. [Google Scholar] [CrossRef]
  49. Yan, D.Y.; Xu, L.; Wang, Q.F.; Feng, J.; Wu, X.X. Quantifying Landscape Effects on Urban Park Thermal Environments Using ENVI-Met and 3D Grid Profile Analysis. Forests 2025, 16, 1085. [Google Scholar] [CrossRef]
  50. Pan, T.; Kuang, W.H.; Pan, R.Y.; Niu, Z.G.; Dou, Y.Y. Hierarchical Urban Land Mappings and Their Distribution with Physical Medium Environments Using Time Series of Land Resource Images in Beijing, China (1981–2021). Remote Sens. 2022, 14, 580. [Google Scholar] [CrossRef]
  51. Kirner, D.; Láska, K.; Stachoň, Z. Assessment and validation of Land Surface Temperature retrieval algorithms using Landsat 8 TIRS data in Antarctic ice-free areas. Polar Sci. 2024, 42, 101127. [Google Scholar] [CrossRef]
  52. Alavipanah, S.; Haase, D.; Makki, M.; Nizamani, M.M.; Qureshi, S. On the Spatial Patterns of Urban Thermal Conditions Using Indoor and Outdoor Temperatures. Remote Sens. 2021, 13, 640. [Google Scholar] [CrossRef]
  53. Rodríguez, L.R.; Ramos, J.S.; de la Flor, F.J.S.; Domínguez, S.A. Analyzing the urban heat Island: Comprehensive methodology for data gathering and optimal design of mobile transects. Sustain. Cities Soc. 2020, 55. [Google Scholar] [CrossRef]
  54. Jeon, G.; Park, Y.; Guldmann, J.M. Impacts of Urban Morphology on Seasonal Land Surface Temperatures: Comparing Grid- and Block-Based Approaches. Isprs Int. J. Geo-Inf. 2023, 12, 482. [Google Scholar] [CrossRef]
  55. Yang, C.; Kui, T.; Zhou, W.; Fan, J.; Pan, L.; Wu, W.; Liu, M. Impact of refined 2D/3D urban morphology on hourly air temperature across different spatial scales in a snow climate city. Urban Clim. 2023, 47, 101404. [Google Scholar] [CrossRef]
  56. Huang, J.D.; Lu, X.H.; Wang, Y.C. Spatio-Temporal Changes and Key Driving Factors of Urban Green Space Configuration on Land Surface Temperature. Forests 2024, 15, 812. [Google Scholar] [CrossRef]
  57. Bhattarai, S.; Banjara, P.; Pandey, V.P.; Aryal, A.; Pradhan, P.; Al-Douri, F.; Pradhan, N.R.; Talchabhadel, R. Quantifying the cooling effects of blue-green spaces across urban landscapes: A case study of Kathmandu Valley, Nepal. Urban Clim. 2025, 61, 102493. [Google Scholar] [CrossRef]
  58. Knobel, P.; Dadvand, P.; Alonso, L.; Costa, L.; Español, M.; Maneja, R. Development of the urban green space quality assessment tool (RECITAL). Urban For. Urban Green. 2021, 57, 126895. [Google Scholar] [CrossRef]
  59. Gundersen, V.; Frivold, L.H.; Löfström, I.; Jørgensen, B.B.; Falck, J.; Øyen, B.-H. Urban woodland management—The case of 13 major Nordic cities. Urban For. Urban Green. 2005, 3, 189–202. [Google Scholar] [CrossRef]
  60. Addas, A. Influence of Urban Green Spaces on Quality of Life and Health with Smart City Design. Land 2023, 12, 960. [Google Scholar] [CrossRef]
  61. Wei, J.Q.; Li, Y.H.; Jia, L.Q.; Liu, B.T.; Jiang, Y.H. The Impact of Spatiotemporal Effect and Relevant Factors on the Urban Thermal Environment Through the XGBoost-SHAP Model. Land 2025, 14, 394. [Google Scholar] [CrossRef]
  62. Hamada, S.; Ohta, T. Seasonal variations in the cooling effect of urban green areas on surrounding urban areas. Urban For. Urban Green. 2010, 9, 15–24. [Google Scholar] [CrossRef]
  63. Zhong, Y.; Li, S.; Liang, X.; Guan, Q. Causal inference of urban heat island effect and its spatial heterogeneity: A case study of Wuhan, China. Sustain. Cities Soc. 2024, 115, 105850. [Google Scholar] [CrossRef]
  64. Imhoff, M.L.; Zhang, P.; Wolfe, R.E.; Bounoua, L. Remote sensing of the urban heat island effect across biomes in the continental USA. Remote Sens. Environ. 2010, 114, 504–513. [Google Scholar] [CrossRef]
  65. Yang, C.B.; He, X.Y.; Wang, R.H.; Yan, F.Q.; Yu, L.X.; Bu, K.; Yang, J.C.; Chang, L.P.; Zhang, S.W. The Effect of Urban Green Spaces on the Urban Thermal Environment and Its Seasonal Variations. Forests 2017, 8, 153. [Google Scholar] [CrossRef]
  66. Liu, W.; Zhao, H.Y.; Sun, S.B.; Xu, X.Y.; Huang, T.T.; Zhu, J.N. Green Space Cooling Effect and Contribution to Mitigate Heat Island Effect of Surrounding Communities in Beijing Metropolitan Area. Front. Public Health 2022, 10, 870403. [Google Scholar] [CrossRef]
  67. Aram, F.; Higueras García, E.; Solgi, E.; Mansournia, S. Urban green space cooling effect in cities. Heliyon 2019, 5, e01339. [Google Scholar] [CrossRef]
  68. Zeng, W.X.; Yang, K.; Zhang, S.H.; Bi, C.Y.; Liu, J.; Yang, X.F.; Rao, Y.; Ma, Y. Configuration of Green-Blue-Grey Spaces for Efficient Cooling of Urban Physical and Perceptual Thermal Environments. Land 2025, 14, 645. [Google Scholar] [CrossRef]
  69. Xu, Z.; Zhao, S. Scale dependence of urban green space cooling efficiency: A case study in Beijing metropolitan area. Sci. Total Environ. 2023, 898, 165563. [Google Scholar] [CrossRef]
  70. Wang, X.; Dallimer, M.; Scott, C.E.; Shi, W.; Gao, J. Tree species richness and diversity predicts the magnitude of urban heat island mitigation effects of greenspaces. Sci. Total Environ. 2021, 770, 145211. [Google Scholar] [CrossRef]
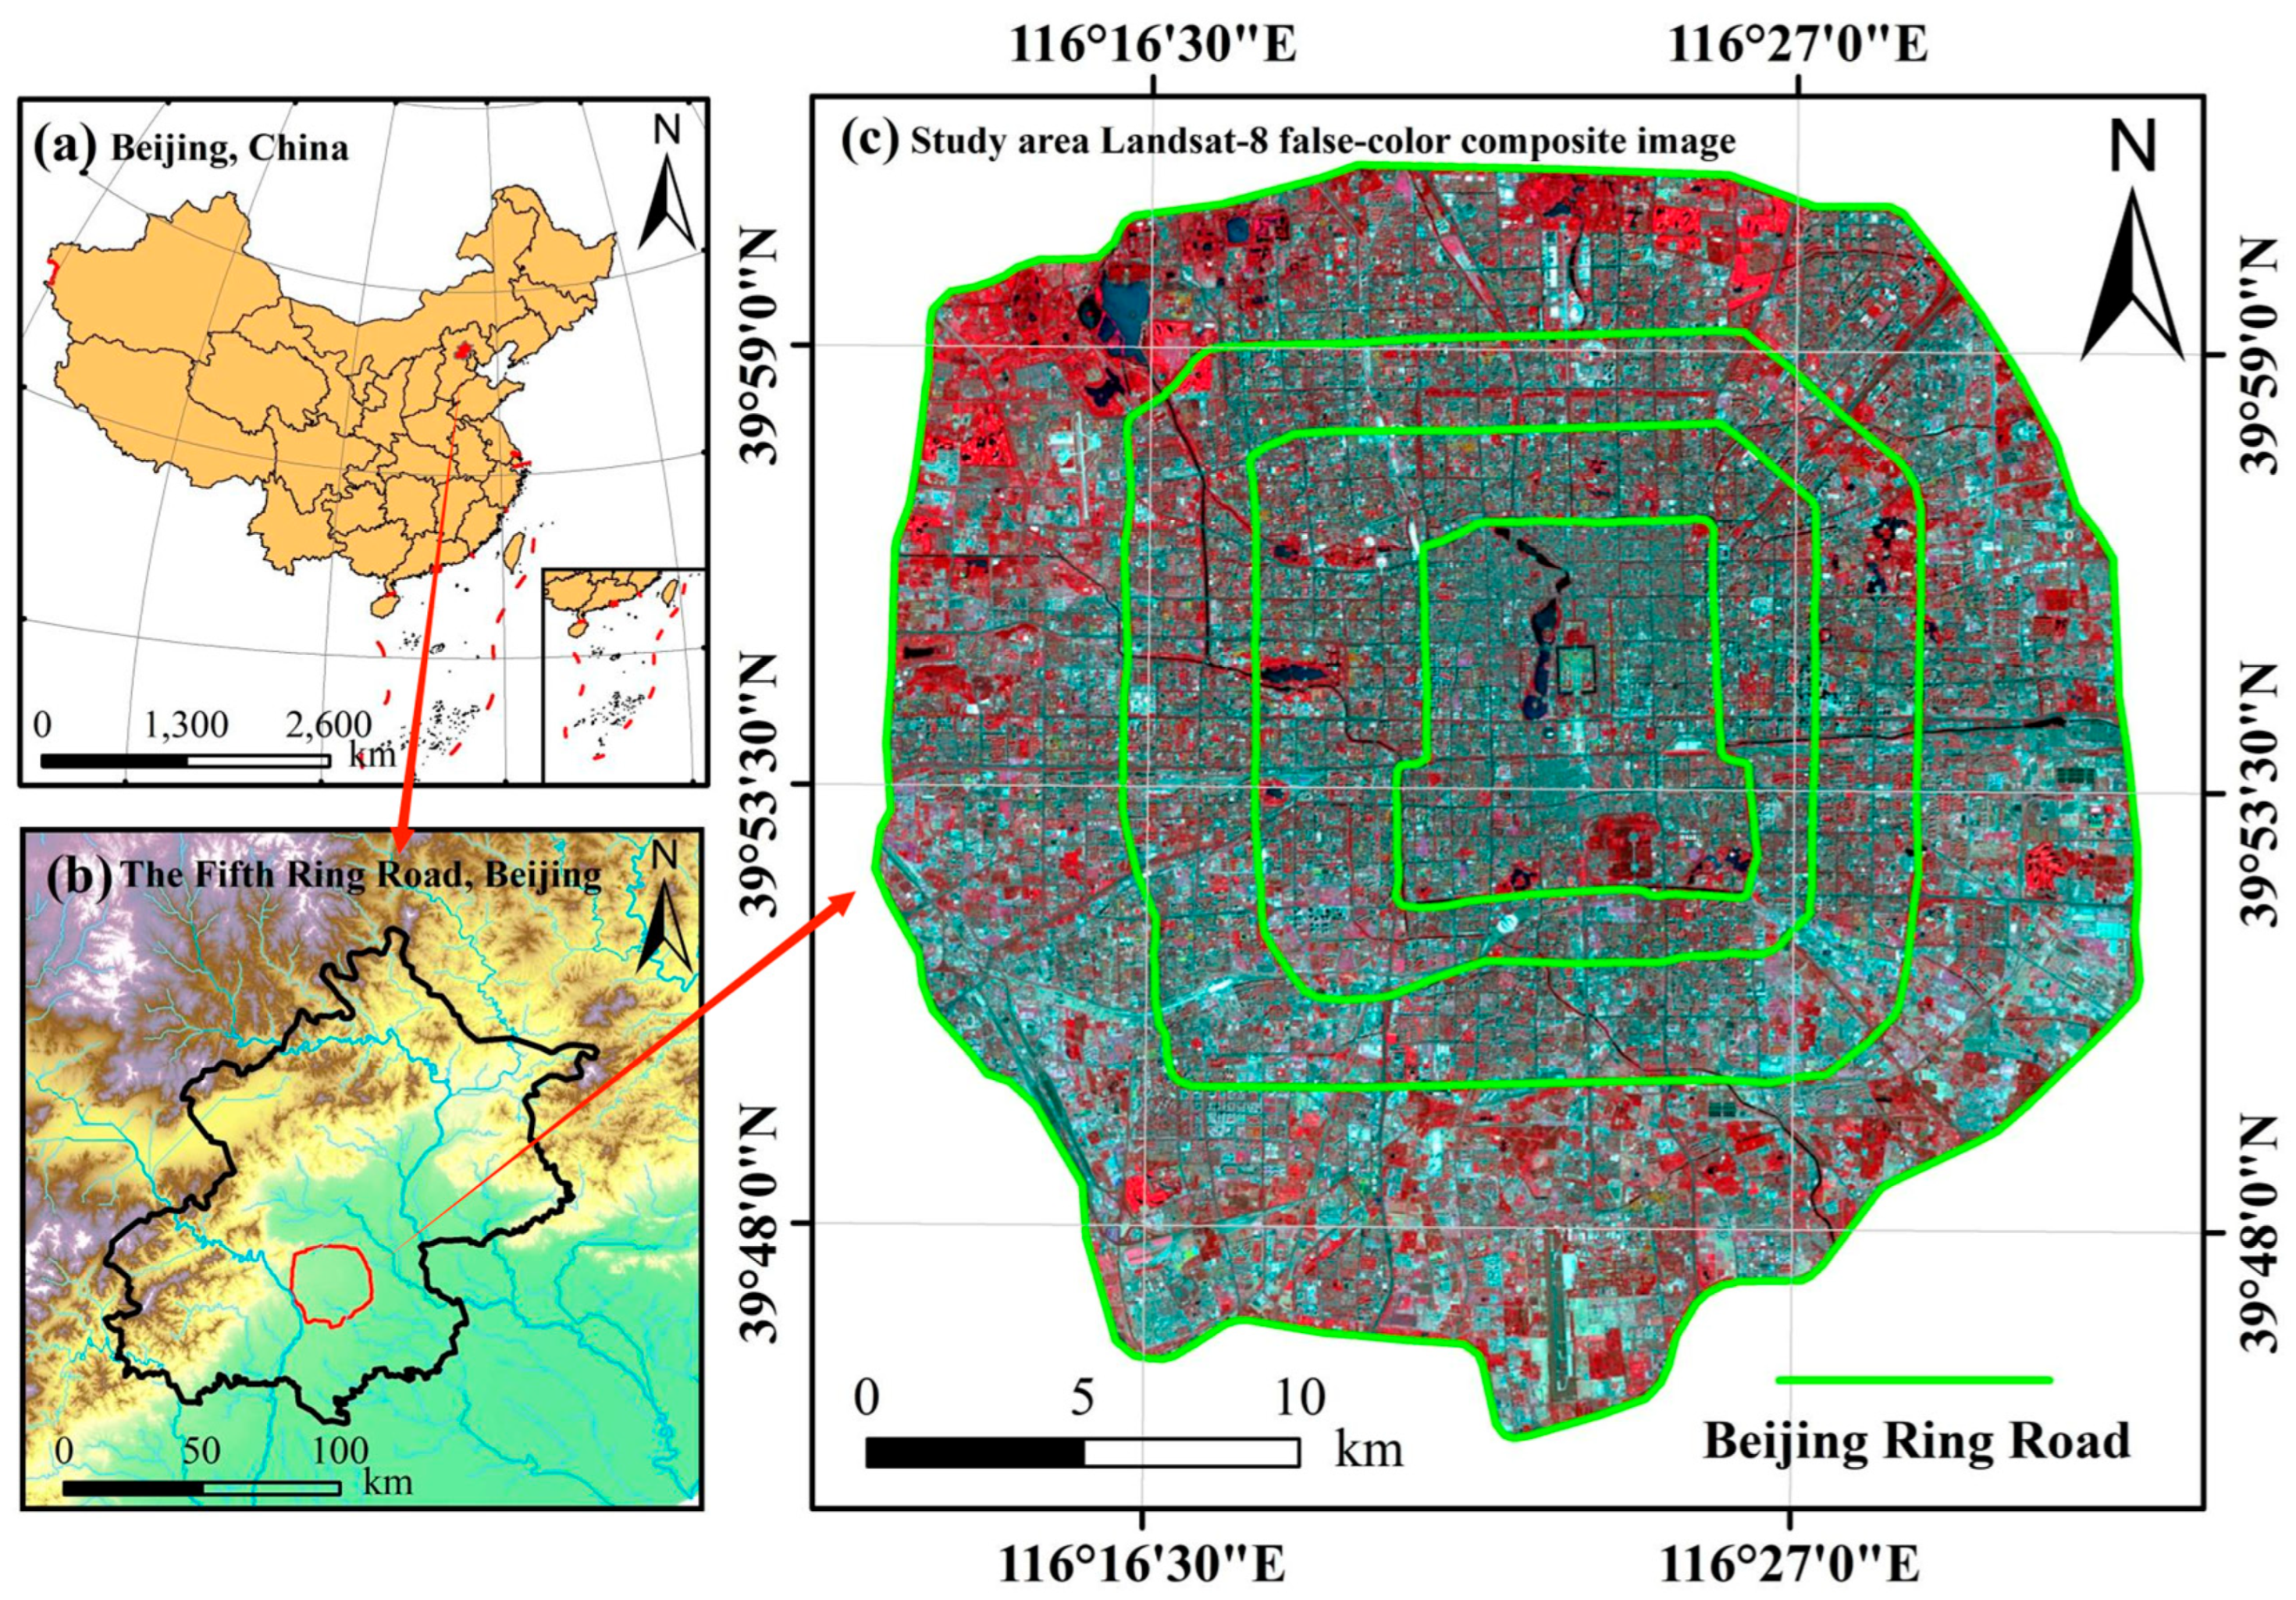
Figure 1. Location of the study area (Landsat-8 false-color composite image).
Sustainability 17 09500 g001
Figure 2. Technical workflow of the study. Different colors represent different types of land. “*” It is only used to mark the computational grid, with no other special purpose.
Sustainability 17 09500 g002
Figure 3. Schematic diagram of transect lines in the study area.
Sustainability 17 09500 g003
Figure 4. Schematic diagram illustrating the calculation method of green space cooling intensity between adjacent grid cells. “*” It is only used to mark the computational grid, with no other special purpose.
Sustainability 17 09500 g004
Figure 5. Spatial distribution of summer PV in the study area.
Sustainability 17 09500 g005
Figure 6. Spatial distribution of winter PV in the study area.
Sustainability 17 09500 g006
Figure 7. Schematic diagram of the distribution of landscape pattern in a unit area.
Sustainability 17 09500 g007
Figure 8. Temporal Trends of LST across Beijing’s Ring Roads.
Sustainability 17 09500 g008
Figure 9. Temporal trends of LST across different ring roads in Beijing.
Sustainability 17 09500 g009
Figure 10. Spatial distribution characteristics of summer LST within the study area.
Sustainability 17 09500 g010
Figure 11. Spatial distribution of winter LST within the study area.
Sustainability 17 09500 g011
Figure 12. Left: Horizontal (east–west) profiles of summer LST and UGS in the study area; Right: Vertical (north–south) profiles of summer LST and UGS in the study area; The distance between two points on the X-axis is 30 m.
Sustainability 17 09500 g012
Figure 13. Spatial distribution patterns of UGS cooling capacity across different periods.
Sustainability 17 09500 g013
Figure 14. Line chart of crid-based cooling intensity (“+” for Cooling, “−” for Warming).
Sustainability 17 09500 g014
Figure 15. Feature importance of UGS cooling drivers across decades.
Sustainability 17 09500 g015
Figure 16. Linear relationships between NDVI and LST in different periods. (ae) represent the summer NDVI–LST linear relationships for each period; (AE) represent the winter NDVI–LST linear relationships for each period.
Sustainability 17 09500 g016
Figure 17. Linear relationships between PV and LST during different periods. Panels (ae) show the summer correlations for each respective period, while panels (AE) display the corresponding winter correlations.
Sustainability 17 09500 g017
Figure 18. Temporal variation in the relationship between UGS area and LST over the past 40 years.
Sustainability 17 09500 g018
Table 1. Acquisition dates of Landsat imagery used in this study.
Season1980s1990s2000s2010s2020s
Summer1984-06-291993-06-222004-07-062013-07-312021-06-03
1984-08-161993-08-252005-06-232014-08-192021-06-19
1985-07-181996-06-302005-07-092017-07-102021-08-06
Winter1984-12-061994-12-022003-12-112014-12-252020-12-25
1985-01-071995-12-052003-12-272015-01-102021-12-12
1986-02-271996-02-072006-02-182016-12-142021-12-28
Table 2. Green space landscape pattern index.
Metric NameCalculation FormulaMeaning
Percent of Landscape
(PLAND)
P L A N D = j = 1 n a i j A × 100 a i j  : The area of the j-th patch belonging to the i-th class (e.g., green space), measured in square meters or number of pixels.  n  : The total number of plaques in that category.  A :   The   total   area   of   the   entire   landscape . j = 1 n a i j : The total area of all patches in that category (e.g., green space).
Number of Patches
(NP)
N P = n n : Refers to the total number of patches in a given landscape type (e.g., green space, forest land, construction land, etc.).
Largest Patch Index
(LPI)
L P I = m a x a i j A × 100 max a i j :   The   largest   patch   in   category   i    (e.g., green space).  A : The total area of the entire landscape.
Edge Density
(ED)
E D = e i k A × 10,000 e i k :   The   total   length   ( in   meters )   of   all   patch   boundaries   in   category   i   (e.g., green space).
A : The total area of the entire landscape.
Table 3. The temporal distribution of cooling capacity intensity across grid cells.
Cooling Ability1990s–1980s2000s–1990s2010s–2000s2020s–2010s2020s–1980s
Weakened18.4%21.0%18.4%10.7%15.1%
Transition63.6%58.50%64.2%76.9%59.5%
Enhanced18.0%20.50%17.4%12.4%25.4%
Note: Weakened: T ≤ −0.5. Transition: −0.5 °C < T < 0.5 °C. Enhanced: 0.5 ≤ T.
Disclaimer/Publisher’s Note: The statements, opinions and data contained in all publications are solely those of the individual author(s) and contributor(s) and not of MDPI and/or the editor(s). MDPI and/or the editor(s) disclaim responsibility for any injury to people or property resulting from any ideas, methods, instructions or products referred to in the content.