Article

Carbon-Aware Dispatch of Industrial Park Energy Systems with Demand Response and Ladder-Type Carbon Trading

1
Marketing Service Center of State Grid Hebei Electric Power Co., Ltd., Shijiazhuang 051000, China
2
College of Electrical Engineering, Henan University of Technology, Zhengzhou 450001, China
*
Author to whom correspondence should be addressed.
Sustainability 2025, 17(21), 9472; https://doi.org/10.3390/su17219472
Submission received: 8 May 2025 / Revised: 2 August 2025 / Accepted: 5 August 2025 / Published: 24 October 2025

Abstract

The transition to sustainable energy systems is essential for attaining global carbon neutrality targets. Demand-side flexibility for carbon mitigation is investigated, and a low-carbon operational strategy tailored for industrial park energy systems is proposed. Demand response (DR) is classified into price-based and alternative categories, with respective models developed utilizing a price elasticity matrix and accounting for electricity-to-heat conversion. Integrated energy system (IES) involvement in the carbon trading market is incorporated through a stepped carbon pricing mechanism to regulate emissions. A mixed-integer linear programming model is constructed to characterize IES operations under ladder-type carbon pricing and DR frameworks. The model is resolved via the off-the-shelf commercial solver, facilitating effective optimization of dispatch over multiple time intervals and complex market interactions. Case study findings indicate that implementing stepped carbon pricing alongside DR strategies yields a 44.45% reduction in carbon emission costs, a 9.85% decrease in actual carbon emissions, and a 10.62% reduction in total system costs. These results offer a viable approach toward sustainable development of IES, achieving coordinated improvements in economic efficiency and low-carbon performance.

1. Introduction

Continuous socio-economic development has imposed a heavy burden on the environment, which is mainly reflected in the massive emission of greenhouse gases, which in turn has triggered the serious challenge of global warming [1,2]. In the face of the global environmental crisis, China is committed to reaching its peak carbon emissions by 2030 and attaining carbon neutrality by 2060 [3], contributing Chinese power to global climate governance. Among the key areas of carbon emission reduction, the electric power industry, as the core of energy consumption, occupies a pivotal position in the total carbon emissions. Therefore, promoting the development of low-carbon power has become the key to accelerating the carbon emission reduction process of the whole society [4]. The integrated energy system (IES), with its advantages of synergistic coupling of different energy sources, can optimize energy allocation and improve energy utilization efficiency, and has attracted much attention in the field of integrated energy low-carbon development [5]. In this context, an in-depth exploration of the carbon trading mechanism within the IES is pivotal for achieving the goal of low-carbon development of the IES.
The carbon trading mechanism, as a market instrument, can optimize systematic resource allocation and motivate each subject to save energy and reduce emissions [6,7,8]. Reference [9] introduced the stepped carbon trading mechanism, which guides the IES to control carbon emissions through an optimization model while considering the refined utilization of hydrogen to achieve the low-carbon goal. Reference [10] investigated cooperative energy trading based on asymmetric Nash bargaining for a multi-park IES to optimize carbon emissions and energy costs under a carbon trading mechanism. Reference [11] investigated a carbon credit trading mechanism based on a coupled carbon and electricity market modeling approach to optimize carbon emissions and electricity trading. Reference [12] investigates the low-carbon dispatch of IES under a stepped carbon trading mechanism, which takes into account the coordinated optimization of source and load-side resources to reduce carbon emission costs. The above studies provide a theoretical basis and application support for the carbon trading mechanism to reduce carbon emissions. Nevertheless, the carbon reduction capabilities of demand-side resources within IES remain underexplored.
Demand response (DR) facilitates bidirectional communication and coordination between the generation and consumption sides [13]. Reference [14] investigated the optimization of cooperative operation of multiple energy stations in an integrated district energy system, considering joint DR to improve system flexibility and energy efficiency. Reference [15] investigated the optimal operation of an IES that combines DR with energy trading to improve system flexibility and reduce operating costs by integrating DR. Reference [16] analyzed the optimal management of an IES, incorporating the synergistic effect of electric-thermal DR and utilizing the adjustability of heat loads to achieve the balance of electric-thermal supply and demand and to improve the system operation efficiency and economy. Reference [17] investigated the flexible power supply of DR and combined it with the diversified utilization of hydrogen to realize the low-carbon dispatch of the IES. However, the above literature either only analyzes the carbon trading mechanism or only considers DR, which is not conducive to coordinating the low-carbon nature and economy of the system.
Consequently, implementing a carbon trading mechanism transforms emission allowances into economically valuable, dispatchable assets, while DR enables unlocking the potential of energy consumers, facilitating the system’s low-carbon and cost-effective operation [18]. Reference [19] investigated the optimal scheduling of integrated agricultural energy systems, taking into account stepped carbon trading mechanisms and DR strategies for low-carbon economic operations. Reference [20] combines CCPP-P2G on the source side and price-based DR on the load side, taking into account dynamic carbon trading prices, to reduce carbon emissions and increase wind energy utilization. Reference [21] proposed an integrated energy DR model considering source-load synergy and a stepped carbon trading mechanism to optimize energy system dispatch, but did not construct a load-side refinement model.
Summarizing the current situation and problems, this paper proposes a comprehensive energy system optimization operation model considering stepped carbon price and DR. Firstly, the DR is divided into price type and alternative type. Secondly, a stepped carbon trading mechanism is constructed. Finally, simulation results confirm that incorporating DR within the carbon trading framework enables effective peak load reduction and promotes the IES’s economic and low-carbon synergy, offering valuable insights for its sustainable operation.

2. System Modeling

2.1. The IES Model

An IES framework including DR is developed in this study, illustrated in Figure 1. Electricity and gas are sourced from the upstream grid and gas network, with wind turbines (WT) and photovoltaic (PV) generation supplementing electric load requirements. Gas procured from the upstream network fuels the combined heat and power (CHP) unit and gas boiler (GB) to meet heat load demands. Excess electricity generated by the CHP can be marketed to the upstream grid. The energy coupling equipment includes CHP, heat pump (HP), and GB, which can realize the two-way flow of electric and thermal energy; CHP consists of a gas turbine (GT) and a waste heat boiler (WHB), which functions by decoupling thermal and electrical processes to accommodate varying system operating conditions. The CHP operates with thermoelectric decoupling to accommodate varying system conditions. The HP utilizes electric power and partially assumes heat load responsibilities. Electric storage (ES) and heat storage (HS) serve as energy storage units to enhance system stability. DR integration helps mitigate load curve fluctuations, enables interactive electricity–heat coupling, optimizes peak load adjustment, and reduces operational costs.

2.2. IES Equipment Model

(1)
PV and WT
Supply-side clean energy is mainly considered for WT and PV, and the system is often unable to consume all of the energy due to factors such as uncertainty in wind and solar output and grid transmission capacity.
0 P P V , t P P V max
0 P W T , t P W T max
where P P V , t , P W T , t are the output power of the PV and WT at time t . P P V max , P W T max are the upper limits of the PV and WT output.
(2)
GT model
The CHP system is constituted through the synchronized operation of the GT and WHB [22].
P G T , t = η G T e Q C H P , t Γ g
H G T , t = η G T h Q C H P , t Γ g
where P G T , t is the electrical power output from the GT at time t . H G T , t is the thermal power output of GT at time t . η G T e is the gas-to-electricity efficiency of GT. η G T h is the gas-to-thermal efficiency of GT. Q C H P , t is the CHP gas consumption at time t . Γ g is the calorific value of natural gas.
(3)
WHB model
WHB recovers the thermal energy produced by GT in the power generation process, improving the operational efficiency and economy of the system.
P W H B , t = η W H B H G T , t
where P W H B , t is the heat power recovered by the WHB at time t . η W H B is the heat recovery efficiency of the WHB.
(4)
HP model
The HP transfers low-grade heat from the environment to a higher temperature level, improving energy efficiency and reducing system operating costs.
H H P , t = η H P P H P , t
where H H P t is the thermal power output from the HP at time t . η H P is the electrical transfer efficiency of the HP. P H P , t is the electrical power input to the HP at time t .
(5)
GB model
The GB converts natural gas into thermal energy, ensuring a stable heat supply and enhancing the reliability of the system.
H G B , t = η G B Q G B , t
Q G B min Q G B , t Q G B max
Δ Q G B min Q G B , t + 1 Q G B , t Δ Q G B max
where H G B , t is the power input to GB at time t. η G B represents the energy conversion rate of GB. Q G B , t is the GB gas consumption at time t . Q G B max and Q G B min refer to the maximum and minimum gas consumption boundaries of GB, respectively. Δ Q G B max , Δ Q G B min denote the maximum and minimum ramp rates of the GB, respectively [22].
(6)
ES model
This study employs electric storage batteries as the energy storage solution, valued for their superior energy density, prolonged cycle lifespan, and reliable safety features [23]. Its application in mitigating the fluctuation of renewable energy output is promising, and its mathematical model can be used to charge the state [24]. The ES formulation is expressed as follows:
S E S , t = S E S , t 1 + η E S c h P E S , t c h S E S , max Δ t 1 η E S d i s P E S , t d i s S E S , max Δ t
0 μ E S , t c h + μ E S , t d i s 1
μ E S , t c h P E S min P E S , t c h μ E S , t c h P E S max
μ E S , t d i s P E S min P E S , t d i s μ t d i s P E S max
S E S min S E S , t S E S max
S E S , 1 = S E S , T
where S E S , t is the ES charge state at time t. η E S c h , η E S d i s are the charging and discharging efficiency of the ES. μ E S , t c h , μ E S , t d i s are the charging and discharging states of the ES at time t . P E S , t c h , P E S , t d i s are the charging and discharging power of the ES at time t . P E S min , P max E S are the minimum and maximum values of ES charging and discharging power. S E S min , S E S max are the minimum and maximum charge states of the ES. S E S , 1 , S E S , T are the initial and final charge states of the ES during the charging and discharging cycle.
(7)
HS model
Thermal energy storage captures and retains excess heat for later use, enhancing system flexibility, efficiency, and overall energy economy [25].
S H S , t = S H S , t 1 + η H S c h P H S , t c h S H S , max Δ t 1 η H S d i s P H S , t d i s S H S , max Δ t
0 μ H S , t c h + μ H S , t d i s 1
μ H S , t c h P H S min P H S , t c h μ H S , t c h P H S max
μ H S , t d i s P H S min P H S , t d i s μ H S , t d i s P H S max
S H S min S H S , t S H S max
S H S , 1 = S H S , T
where S H S , t is the HS charge state at time t. η H S c h , η H S d i s are the charging and discharging efficiency of the HS. μ H S , t c h , μ H S , t d i s are the storage and release states of the HS at time t . P H S , t c h , P H S , t d i s are the storage and release power of HS at time t . P H S min , P H S max are the minimum and maximum values of HS charging and discharging power. S H S min , S H S max are the minimum and maximum charge states of the HS. S H S , 1 , S H S , T are the initial and final charge states of the HS during the charging and discharging cycle.

2.3. DR Modeling

DR is a strategic energy management mechanism where consumers adjust electricity usage in response to grid signals, such as price fluctuations or reliability events. It enhances system flexibility, reduces peak demand, integrates renewables, and promotes cost efficiency while supporting sustainable, low-carbon power system operation [26].
(1)
Price-oriented DR program
End-use loads respond differently to identical tariff signals, depending on their intrinsic characteristics. Within a price-responsive framework, loads are generally divided into two classes: curtailable loads (CL), which can be reduced or switched off when prices rise, and shiftable loads (SL), which can be rescheduled to alternative time periods. The operational behavior of CL is driven by a comparison of electricity prices across successive intervals, enabling consumers to determine whether curtailment is advantageous. To mathematically characterize this responsiveness, a price-demand elasticity matrix is introduced. In this matrix, the entry ω t captures the electrical load elasticity coefficient at time t .
ω t = P D , t P D , t i n i / P D , t i n i ξ t ξ t i n i / ξ t i n i
Let P D , t denotes the practical load demand at time t after the implementation of DR. The baseline load before response at the same moment is represented by P D , t i n i . The term ξ t characterizes the practical electricity price observed at time t , while ξ t i n i stands for the original price level at that instant. Based on these definitions, the adjusted curtailment amount Δ P t C L and shifted amount Δ P t S L in load can be mathematically expressed as follows:
Δ P t C L = P t C L , i n i t = 1 24 Ω C L ξ t ξ t i n i ξ t i n i
Δ P t S L = P t S L , i n i t = 1 24 Ω S L ξ t ξ t i n i ξ t i n i
where P t C L , i n i is the initial amount of load that can be curtailed at time t . P t S L , i n i is the initial amount of load that can be shifted at time t . The elasticity matrix Ω C L , Ω S L systematically quantifies the dynamic relationship between price signals and load adjustments.
(2)
Replaceable DR
In the case of thermal loads that can flexibly utilize either electricity or direct heat supply, the scheduling principle is adapted to prevailing price conditions. When electricity tariffs are low, the system favors electrical consumption, whereas at high tariff levels, heat is consumed directly to satisfy thermal demand. This mechanism ensures the flexible substitution between electricity and heat, thereby improving cost efficiency and energy flexibility. The mathematical formulation describing the behavior of such replaceable loads (RL) is developed as follows:
Δ P t R L , e = Γ e κ e Γ h κ h Δ P t R L , h
Δ P min R L , e / h Δ P t R L , e / h Δ P max R L , e / h
where Δ P t R L , e , Δ P t R L , h represent the portions of electrical demand that can be substituted and the corresponding thermal demand that compensates for it,, respectively. Γ e , Γ h quantify the calorific values per unit of electrical and thermal energy. κ e , κ h specify the respective effective utilization rates. Δ P min R L , e / h , Δ P max R L , e / h are the minimum and maximum substitutions for the replaceable electrical and heat loads.

2.4. Laddered Carbon Trading Mechanism

A laddered carbon trading mechanism establishes legally binding emission rights and permits their exchange to regulate total emissions. Regulators assign initial quotas to emission sources, and firms adjust operations accordingly. Surpluses can be sold, while deficits require additional purchases [27].
(1)
Carbon emission allowance model
Carbon emissions in IES mainly stem from grid-purchased electricity, GB, and CHP units. The carbon emissions are expressed as:
E I E S = β e t = 1 T P B u y , t + β g t = 1 T P C H P , t + H C H P , t + β g t = 1 T H G B , t
where β e , β g denote the emission intensities assigned to unit electricity from coal plants and unit gas consumption of gas-fired units, respectively. P B u y , t , P C H P , t indicate the purchased electricity and CHP generation at time t . H G B , t represents the thermal output of GB at time t . T denotes the scheduling horizon.
(2)
Actual carbon emission modeling
E I E S , a = t = 1 T a 1 + b 1 P B u y , t + c 1 P B u y , t 2 + t = 1 T a 2 + b 2 P T o t a l , t + c 2 P T o t a l , t 2
P T o t a l , t = P C H P , t + H C H P , t + P G B , t
where E I E S , a represents the verified carbon discharge of the IES. P T o t a l , t corresponds to the effective output of CHP and GB at time t . a 1 , b 1 , c 1 and a 2 , b 2 , c 2 serve as calibration factors for estimating emissions from coal-fired generation and gas-fueled equipment.
(3)
Stepped carbon trading framework
The difference between allocated quotas and verified emissions determines the tradable volume of carbon permits for the integrated energy system, expressed as:
E I E S , e x = E I E S , a E I E S
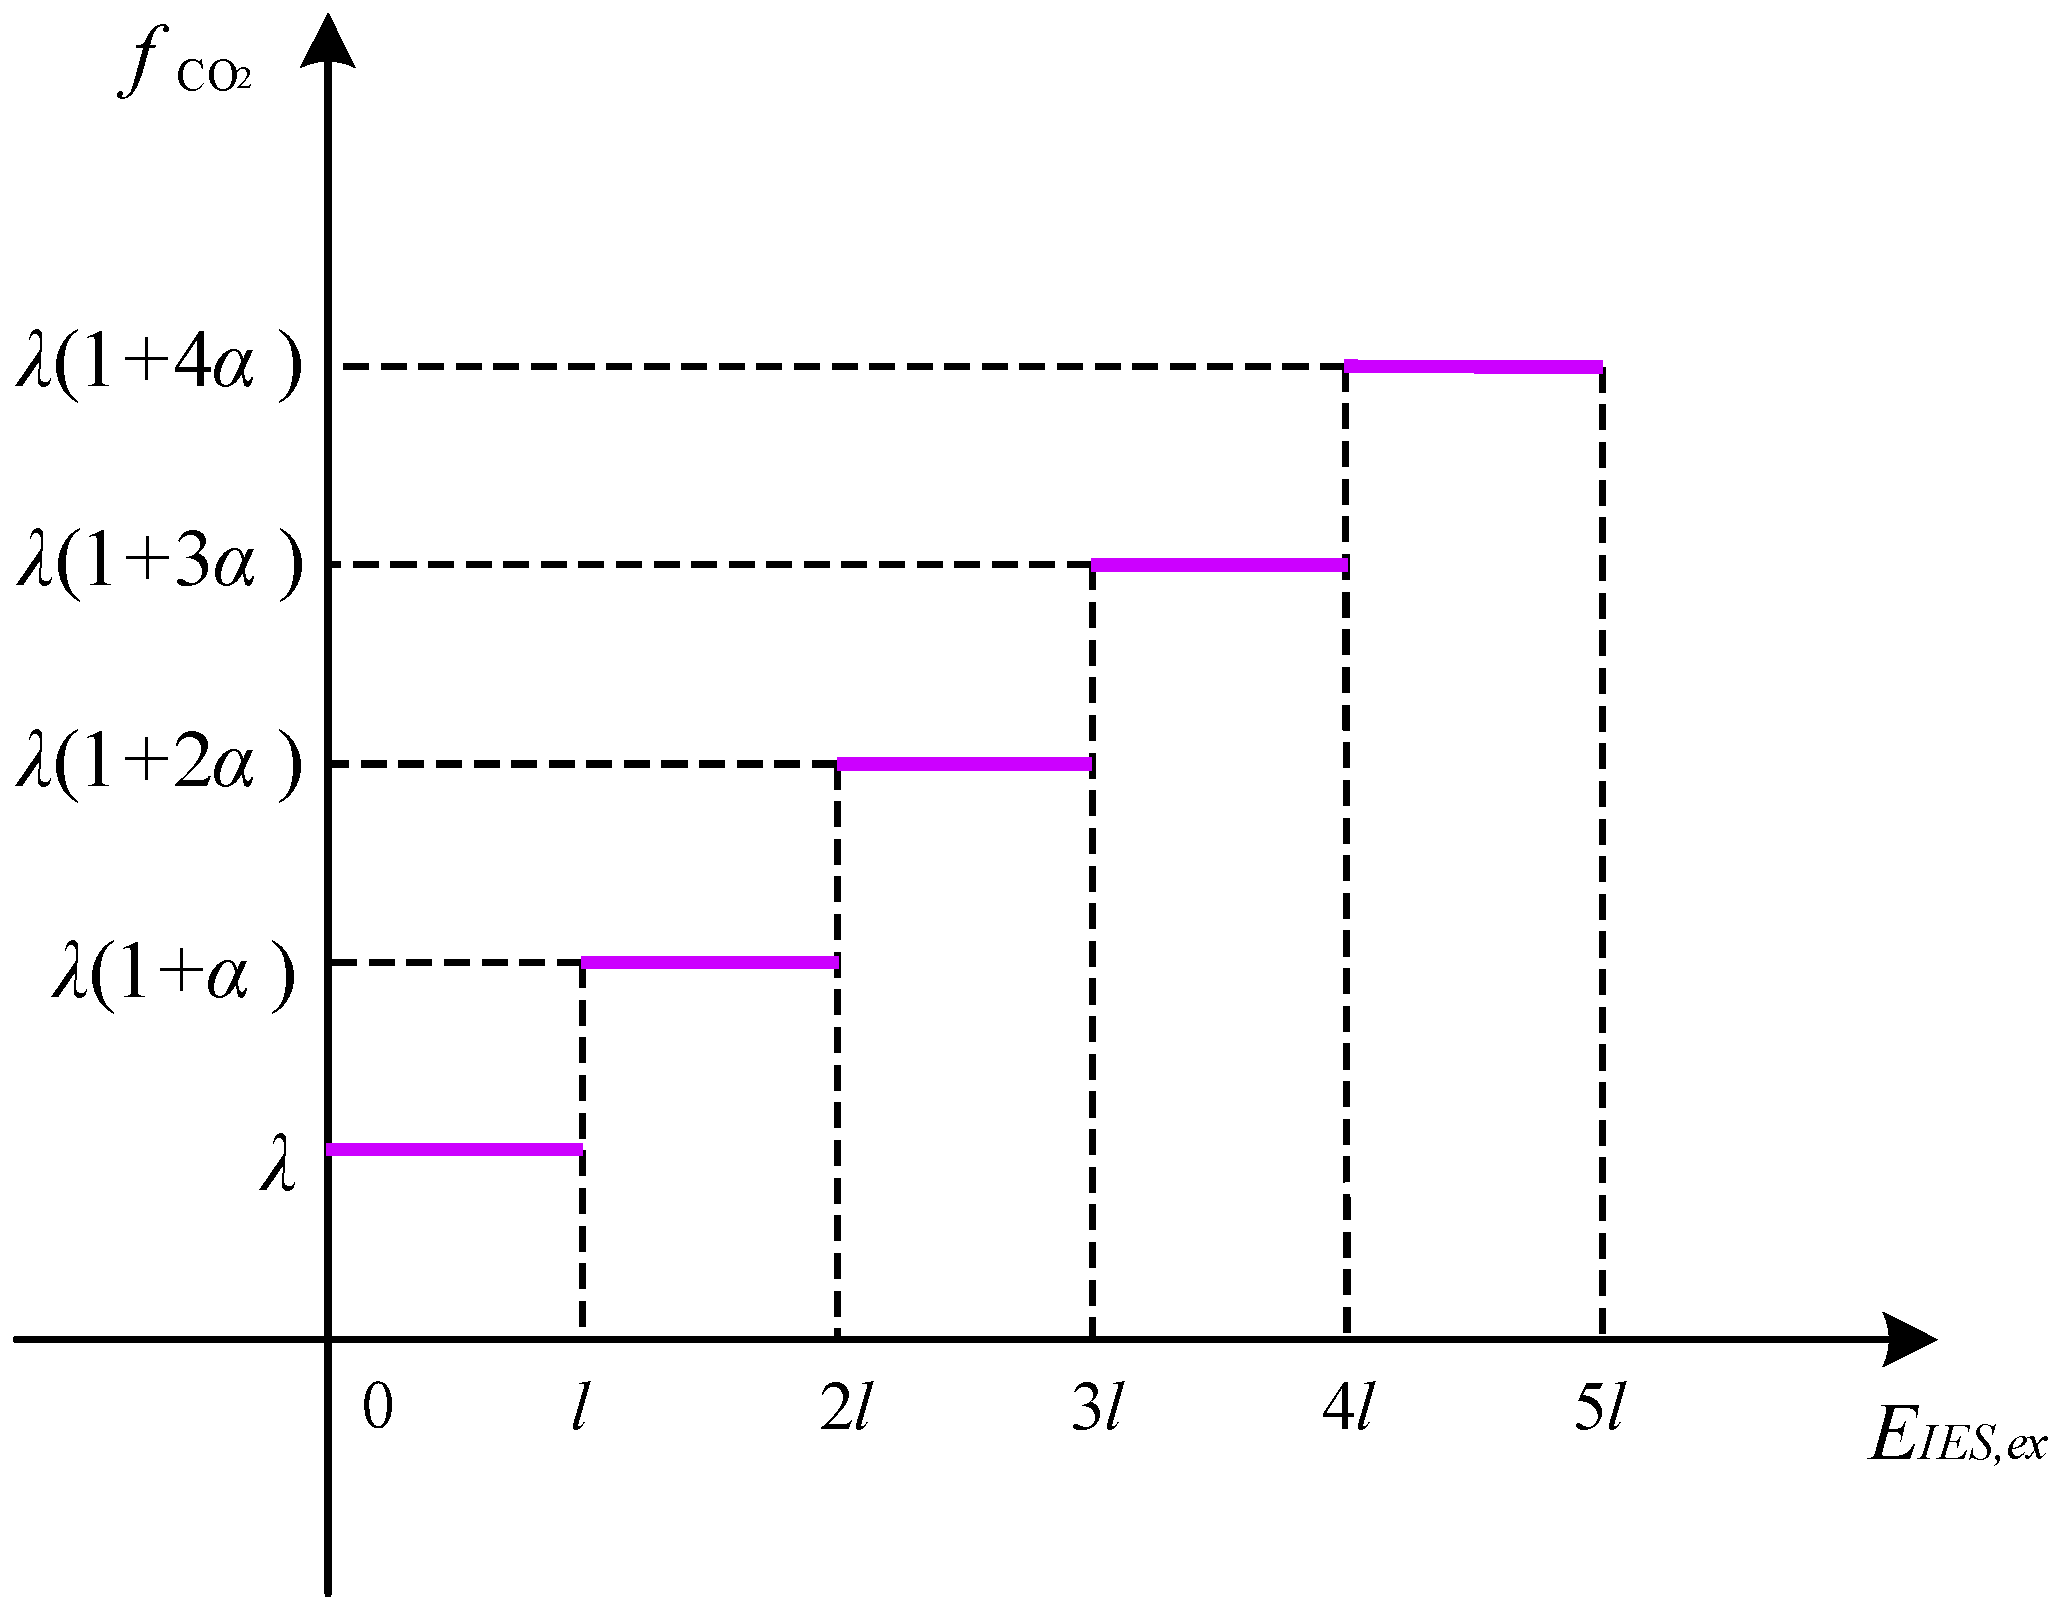
f C O 2 = λ E I E S , e x E I E S , e x l λ 1 + α E I E S , e x l + λ l l E I E S , e x 2 l λ 1 + 2 α E I E S , e x 2 l + λ 2 + α l 2 l E I E S , e x 3 l λ 1 + 3 α E I E S , e x 3 l + λ 3 + 3 α l 3 l E I E S , e x 4 l λ 1 + 4 α E I E S , e x 4 l + λ 4 + 6 α l E I E S , e x 4 l
where E I E S , e x quantifies the credits exchanged in the market. f C O 2 represents the cost incurred from tiered carbon trading. λ denotes the initial carbon price. l corresponds to the width of the emission allowance interval. α indicates the rate at which the price increases. The schematic diagram of ladder-type carbon trading is shown in Figure 2.

3. Optimization of the Operating Model

3.1. Objective Function

The model for optimal dispatch of the IES, factoring in demand-side management under a carbon market scheme, is formulated to optimize the overall network’s economic efficiency within system operation limits. The goal is to minimize the aggregate expenditures, including costs for energy acquisition f B u y , operational and maintenance costs f O p e , and carbon allowance transactions.
min F = f B u y   +   f O p e   +   f C O 2
(1)
Energy purchase cost f B u y . The system can trade power with the higher-level grid, purchasing power from the higher-level grid when generation cannot meet its own demand and, accordingly, selling excess power to the higher-level grid when there is a surplus of generation. Moreover, natural gas procurement is required to support the operation of the CHP and GB.
f B u y = t = 1 T P B u y , t φ B u y , t P S e l l , t φ S e l l , t + Q B u y , t φ g , t
where P B u y , t , P S e l l , t are the purchased and sold electricity from the power grid at time t , respectively. φ B u y , t , φ S e l l , t , φ g , t are the prices of electricity purchased, electricity sold, and gas purchased at time t , respectively. Q B u y , t is the amount of natural gas purchased at time t . κ g is the price of natural gas per unit.
(2)
Operation and maintenance costs f o p e
f O p e = t = 1 T ω P V P P V , t + ω W T P W T , t + ω G T P G T , t + ω W H B P W H B , t + ω H P H H P , t + ω G B H G B , t + ω E S P E S , t c h + P E S , t d i s + ω H S P H S , t c h + P H S , t d i s
where ω P V , ω W T , ω G T , ω W H B , ω H P , ω G B are the unit operation and maintenance cost factors. ω E S , ω H S are the unit operation and maintenance cost factors of ES and HS.
(3)
Carbon transaction cost. The carbon transaction cost of an operational cycle is the sum of all momentary costs, Equation (17).

3.2. Constraints

(1)
Electric power balance
This study establishes an IES comprising flows of electricity, heat, and gas, all of which must comply with their respective equilibrium. Equations (23)–(25) are the total energy balance constraints of the system.
P B u y , t + P P V , t + P W T , t + P C H P , t + P E S , t d i s = P S e l l , t + P H P , t + P E S , t c h + P D , t i n i + Δ P t C L + Δ P t S L + Δ P t R L , e
(2)
Thermal power balance
Thermal power balance ensures that heat supply matches demand within the system, maintaining stable operation and efficient energy utilization.
H G B , t + H H P , t + H C H P , t + H H S , t d i s = H H S , t c h + H D , t i n i + Δ P t R L , h
where H D , t i n i is the initial thermal power demand at time t.
(3)
Gas power balance
Q B u y , t = Q C H P , t + Q G B , t
where Q C H P , t is the gas power consumed by GT at time t .
(4)
Customer satisfaction constraints on electricity usage
The customer satisfaction index is defined as the proportion of time intervals during which the adjusted load remains within an acceptable deviation range relative to the baseline load. It is expressed as:
ψ = 1 T t = 1 T 1 δ P D , t P D , t i n i δ + , ψ ψ min
where ψ is the satisfaction index. ψ min is the minimum satisfaction threshold. P D , t is the actual electricity load after DR at time t . δ + , δ are the upper and lower bounds of the acceptable deviation range for the load ratio.

4. Case Study

4.1. Parameter Setting

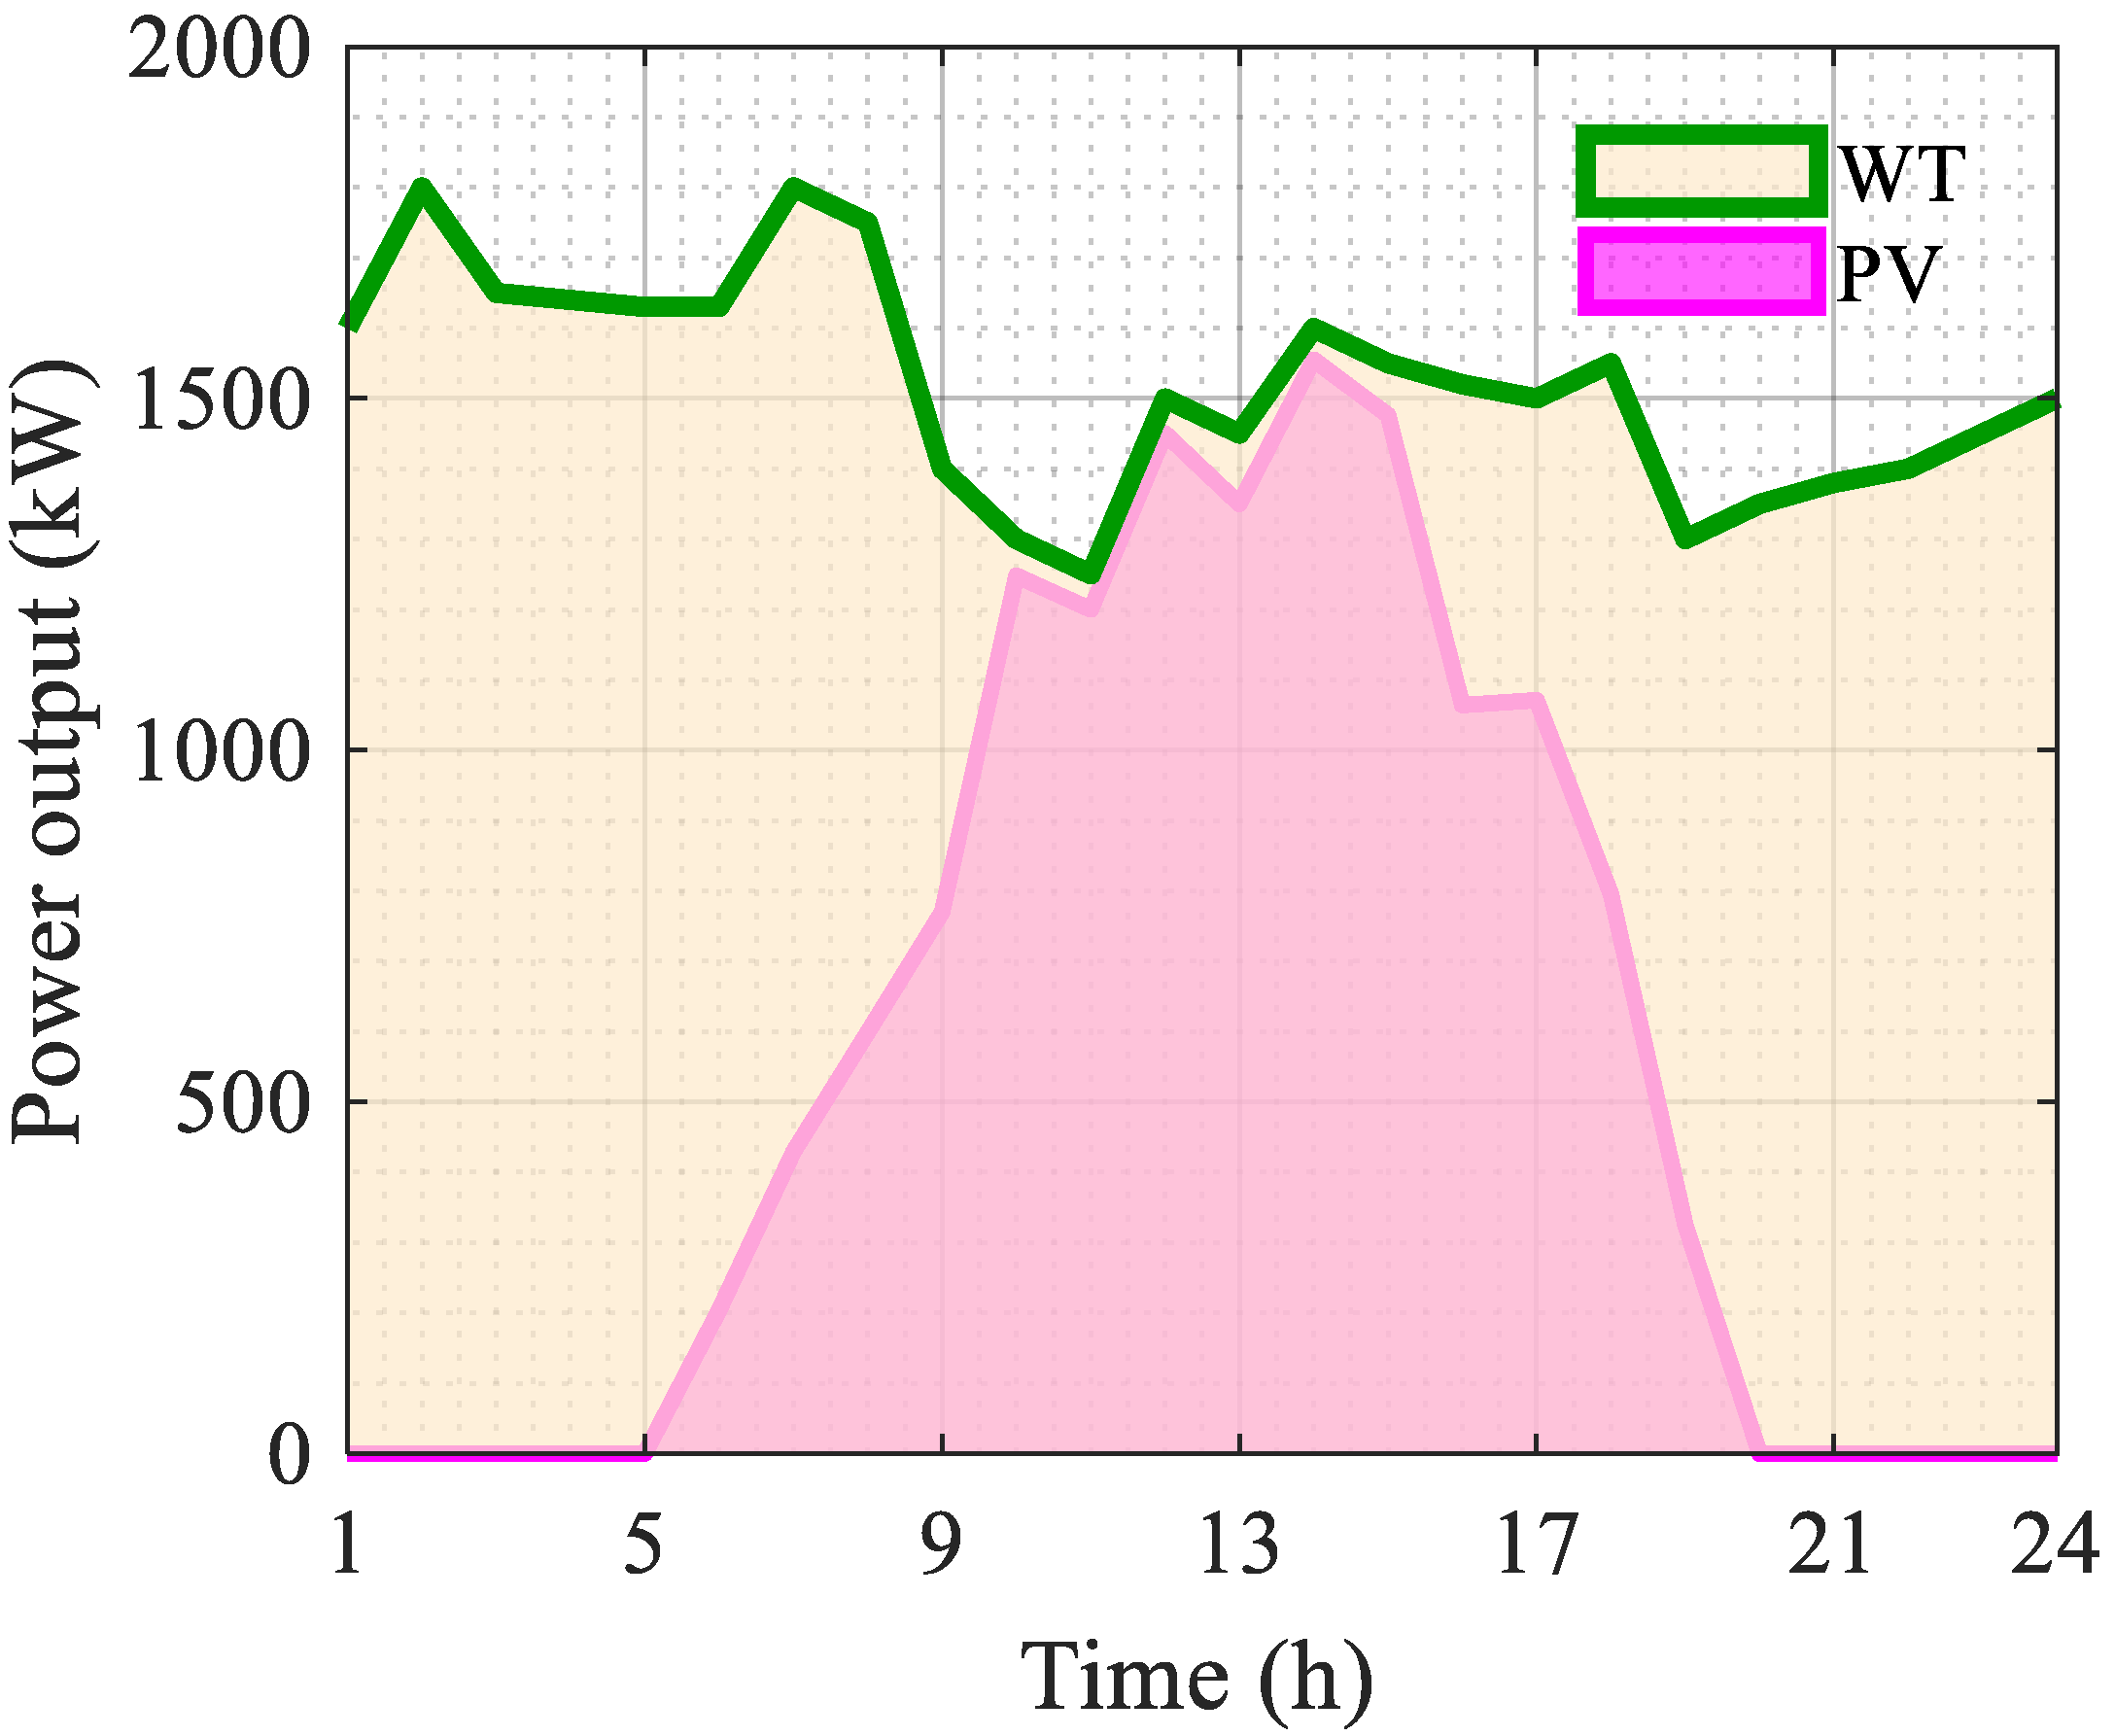
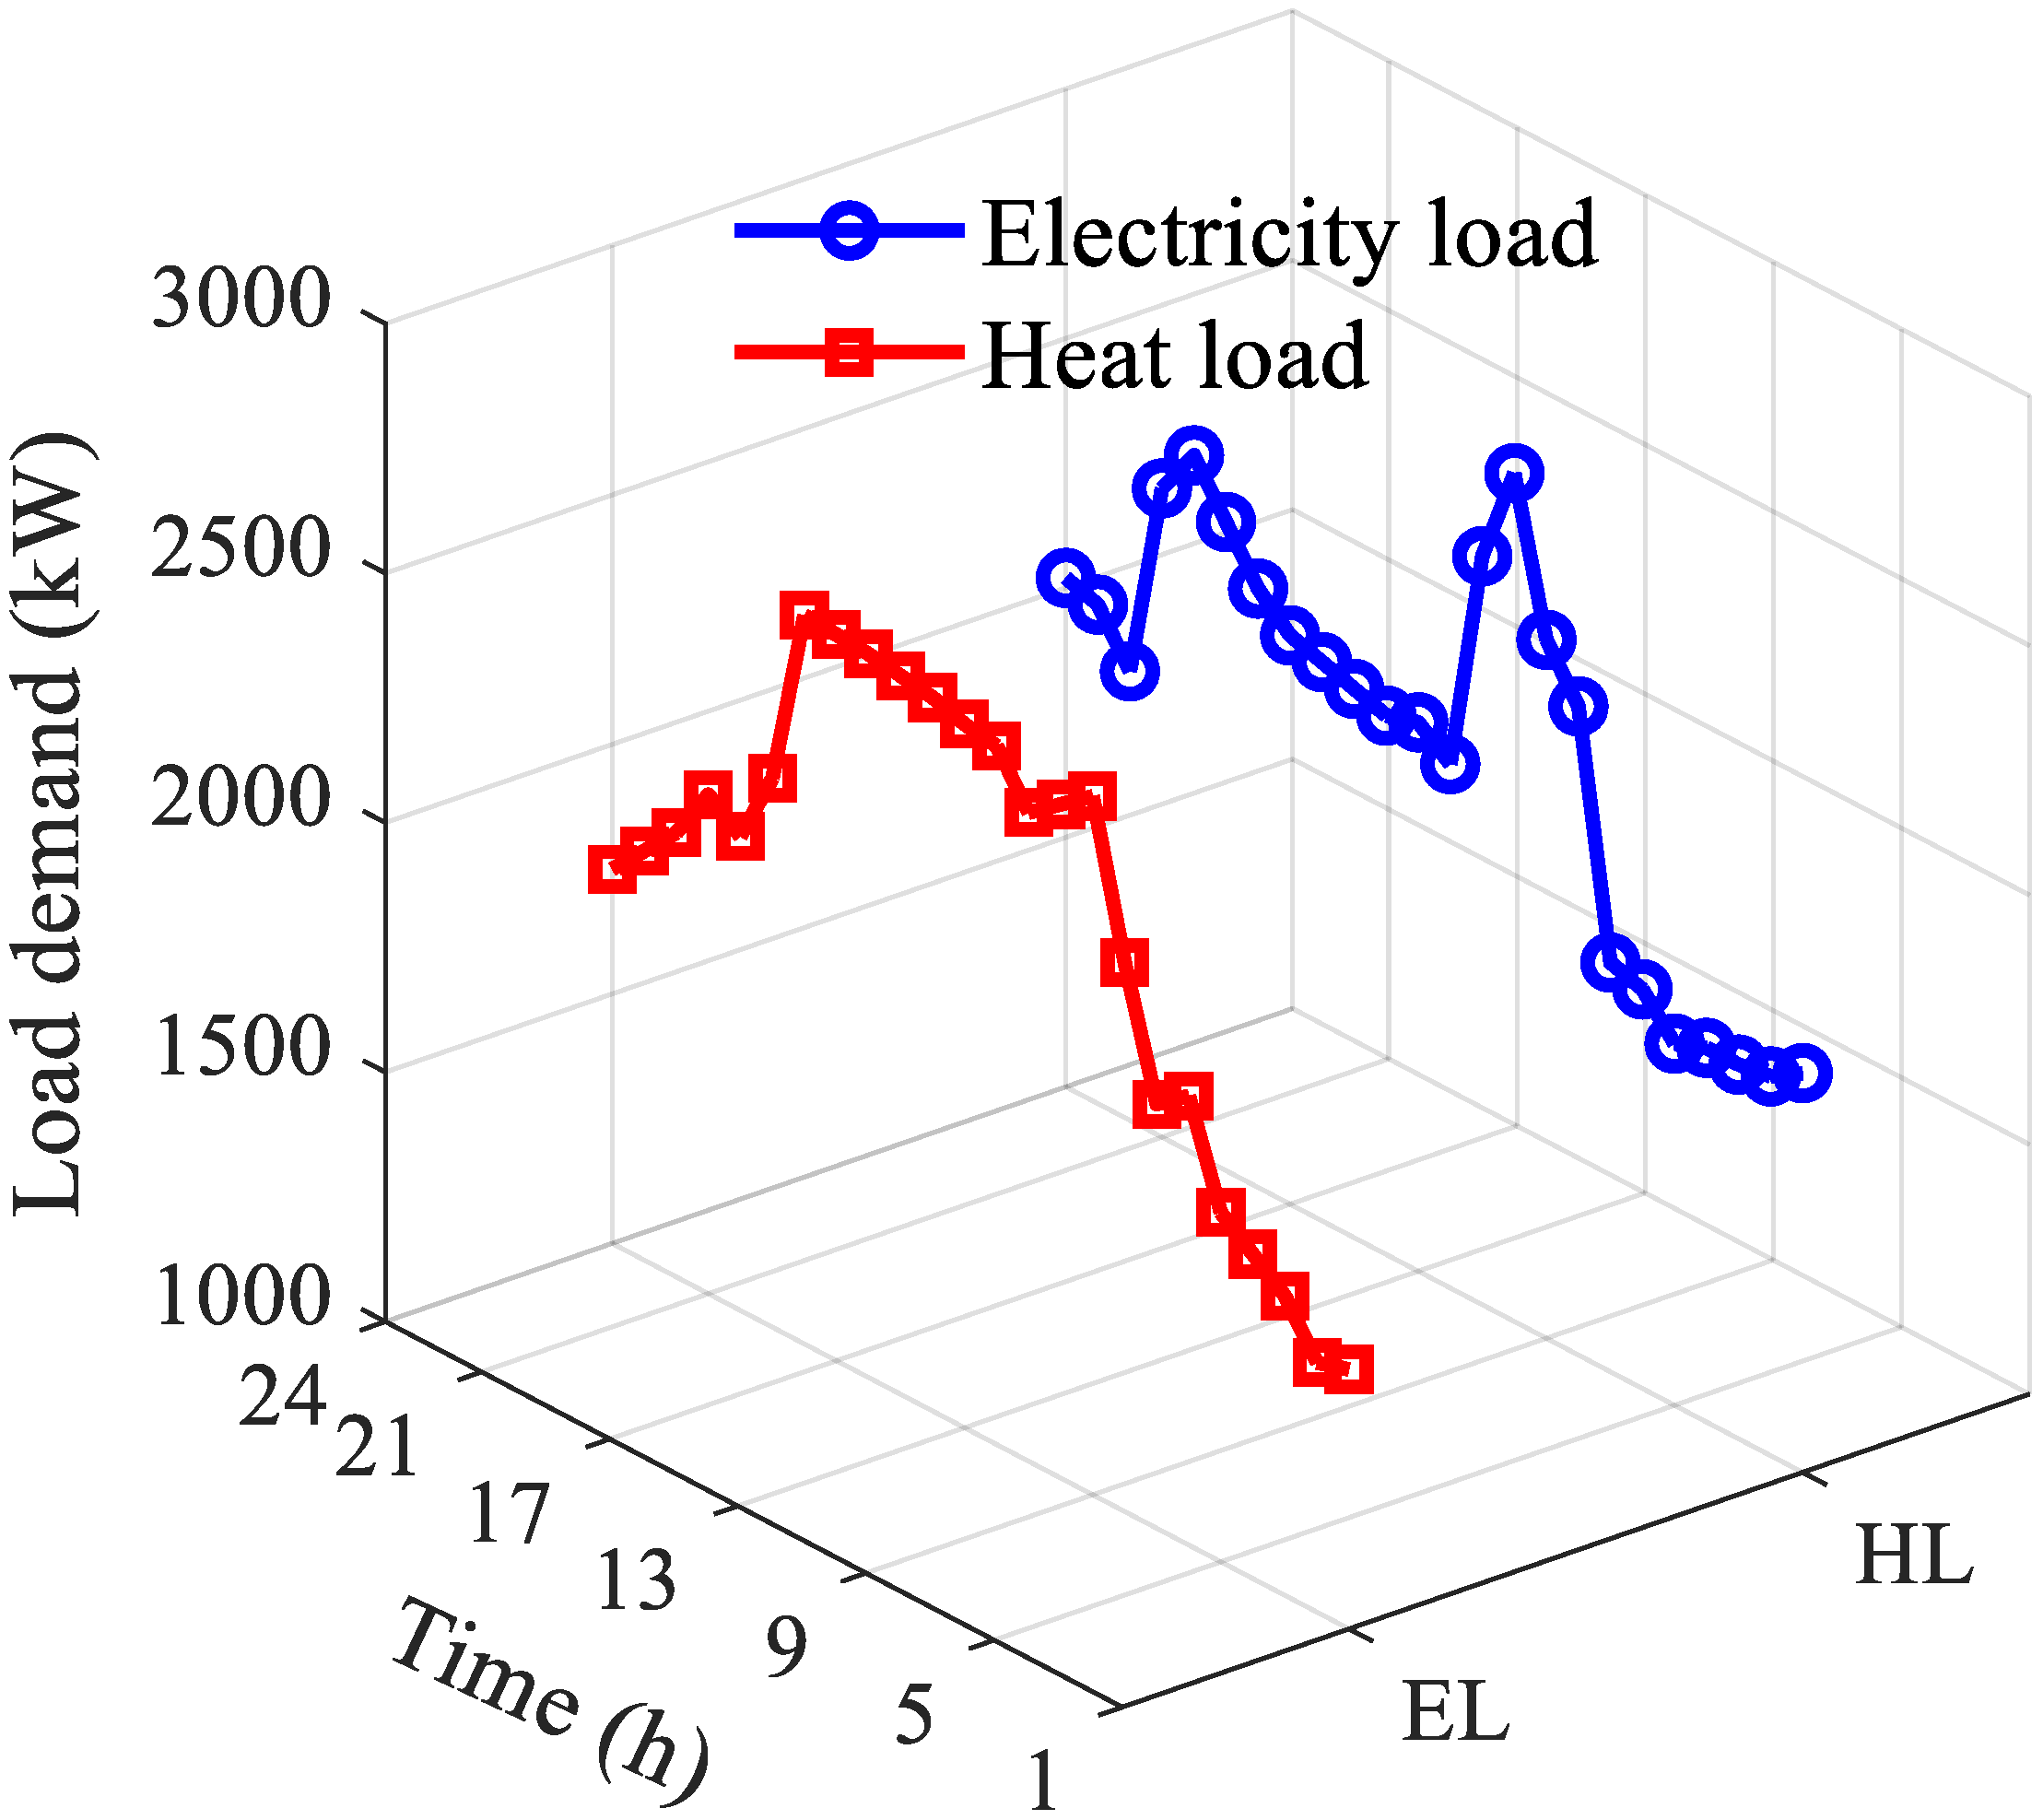
An industrial park in the north is taken as the research object, with 24 h as an operation cycle, and the unit operation time is 1 h. The installed equipment in the system is CHP, HP, GB, HS, and ES, which are composed of GT and WHB, and the parameters are shown in Table 1. The time-sharing tariff is shown in Table 2. The natural gas price is CNY 2.55/m3. According to the natural conditions of the park, combined with the unit output model, the PV and WT outputs are obtained as shown in Figure 3. The electrical and heat load configurations are shown in Figure 4 [28].
The optimization model was implemented in Matlab 2024a and solved using the Gurobi 10.01 solver on a workstation equipped with an Intel Core i9 processor (3.7 GHz) and 32 GB RAM, running Windows 10. The optimality gap tolerance is 0.01%. The solution process exhibited stable convergence across all comparative scenarios, and no numerical issues or infeasibility warnings were encountered.

4.2. Different Scenarios Comparison

To validate the effectiveness of the proposed model, the following four distinct scenarios are evaluated and compared:
Case 1 involves solely the implementation of a tiered carbon trading mechanism.
Case 2 incorporates DR within the stepped carbon trading framework.
Case 3 considers DR exclusively.
Case 4 excludes both the stepped carbon pricing and DR.
Table 3 summarizes the expenses and real carbon emissions associated with each scenario.
As shown in Table 3, Case 1 achieves a 42.00% reduction in carbon emission costs and a 2890.4 kg reduction, that is a 6.79% decrease in actual carbon emissions compared to Case 4. This is attributed to the incorporation of the carbon emission mechanism, which provides the system with an initial carbon emission allowance, partially offsetting carbon emission costs and achieving dual optimization of economic and environmental benefits. In contrast, Case 4, lacking this mechanism, bears full costs for actual carbon emissions, resulting in higher carbon emission expenditures. Case 3 reduces energy purchasing costs by 10.44% relative to Case 4 through the implementation of DR strategies. By reducing peak-hour electrical loads and increasing off-peak loads, the system optimizes energy procurement, selecting more cost-effective options based on time-varying energy prices and availability, thereby lowering energy purchasing costs. However, while Case 3 has lower energy purchasing costs than Cases 1 and 2, its carbon trading costs and actual carbon emissions remain higher, highlighting the significant role of carbon trading mechanisms in promoting energy conservation and emission reduction. Notably, Case 2 demonstrates the lowest total operating costs, energy purchasing costs, carbon trading costs, and actual carbon emissions among all cases. It achieves 44.45% reduction in carbon emission costs, 9.85% decrease in actual carbon emissions, and a 10.62% reduction in total system costs. This is because the combination of DR and the carbon trading mechanism not only shifts loads from high-tariff to low-tariff periods but also enables mutual substitution of electricity and heat energy, smoothing the load curve. Consequently, the system can precisely compare the costs of electricity and gas procurement across different time periods and the outputs of gas turbines and gas boilers, selecting an economic and low-carbon operation mode that effectively balances economic and low-carbon performance.
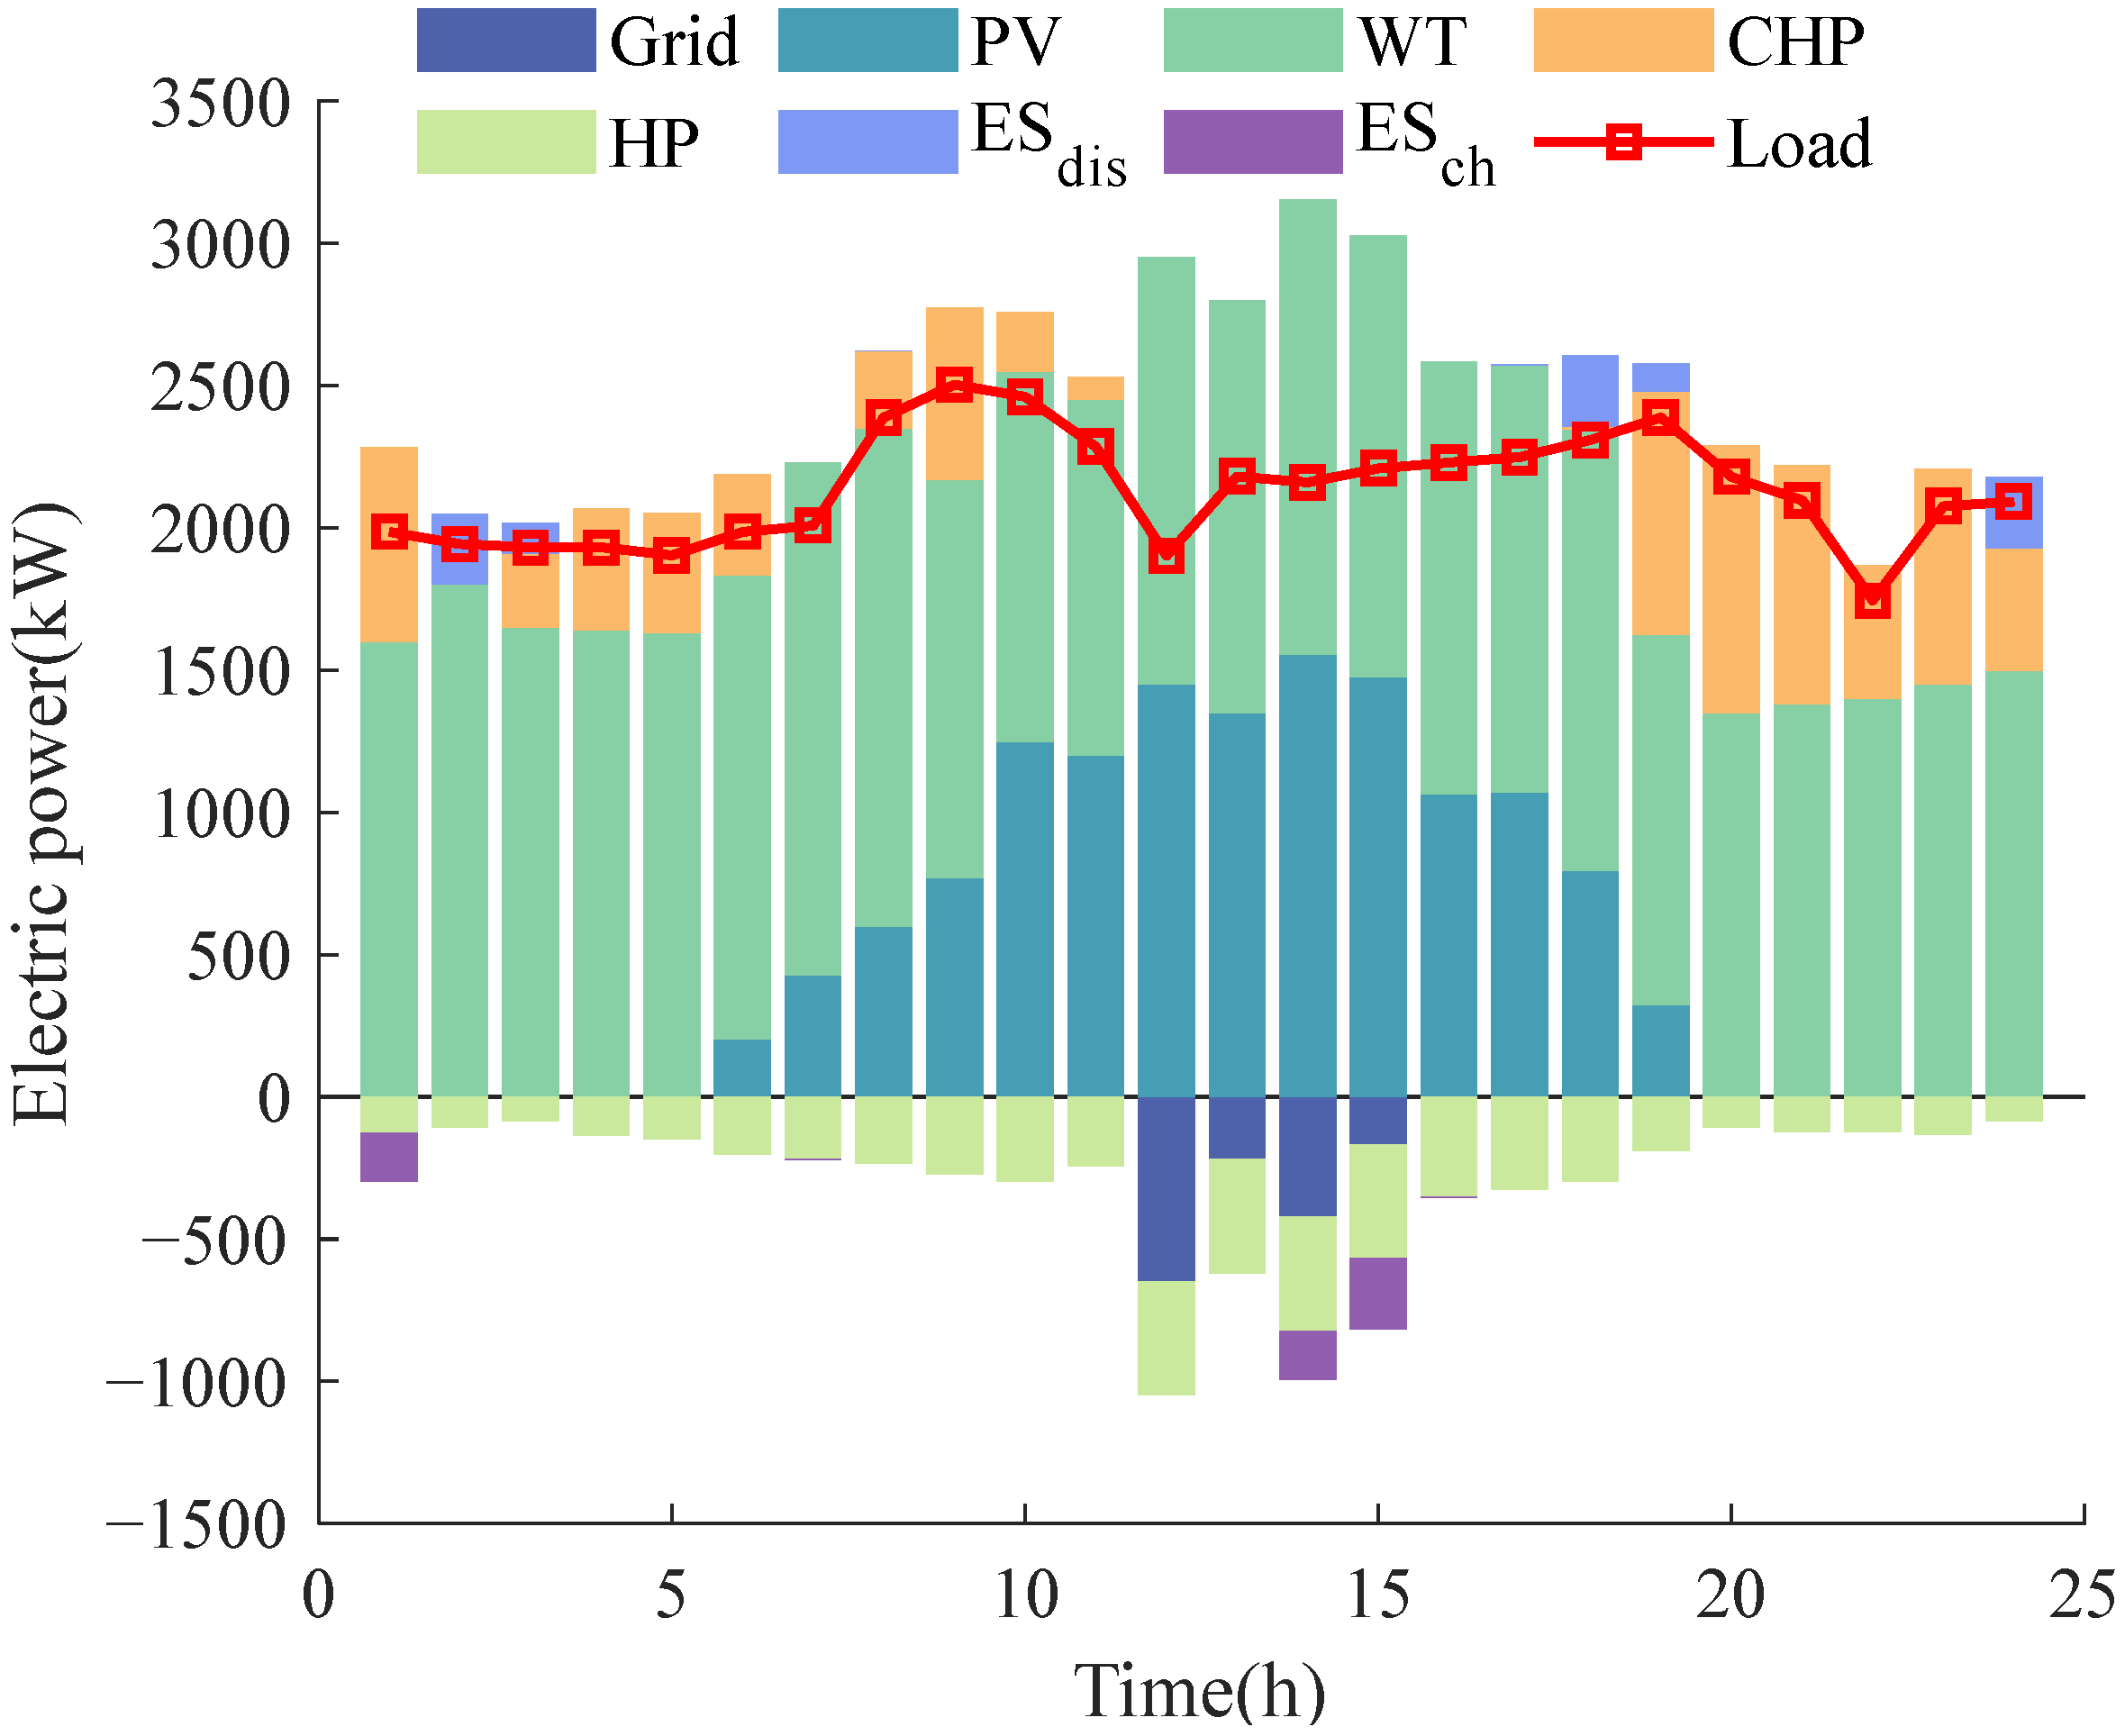
Figure 5 illustrates the electrical output of each device in Case 2. From 1:00 to 7:00, the system primarily depends on WT and CHP units to meet the demand of HP and electrical loads, maintaining electrical balance. Should output fall short, the ES system activates promptly to bridge the power gap, ensuring stable operations. From 8:00 to 19:00, PV panels gradually come online, working with WT and CHP to satisfy HP and electrical load demands, achieving dynamic electrical equilibrium. Between 12:00 and 15:00, when PV and WT output peaks, the system meets its power needs, stores excess power in the ES, and sells part of the surplus to the grid, optimizing power allocation and maximizing economic benefits while preserving electrical balance. From 18:00 to 19:00, as light fades, PV and WT output decline. The ES releases stored power to fill the gap, ensuring stability during peak demand hours. From 19:00 to 24:00, PV output ceases, and the system relies mainly on CHP and WT to meet HP and electrical load demands, maintaining nighttime electrical balance. This multi-equipment cooperative operation highlights the system’s flexibility in deploying resources. It can adjust operations efficiently, stably, and economically across different periods, adapting to each device’s characteristics and power demand changes.
Figure 6 presents the heat output of each piece of equipment in Case 2. The thermal load is predominantly supplied by the GB and HP, which together ensure thermal power balance. The system prioritizes the HP for heat supply to minimize energy loss and enhance efficiency. When the HP’s heating capacity is insufficient to meet demand independently and the CHP does not supply heat during specific periods, the GB is activated to fill the heat load gap, ensuring a stable heat supply. From 1:00 to 6:00, due to heat load fluctuations or other factors, the CHP participates in heat supply, with its generated heat effectively addressing the load gap and ensuring thermal balance. From 14:00 to 16:00, excess heat is stored in the HS unit, improving system energy efficiency and providing a reserve for subsequent peak load hours. From 19:00 to 24:00, the CHP and HS jointly supply heat, leveraging the CHP’s stable output and the HS’s stored energy to meet nighttime trough hour demands, reducing equipment startups/shutdowns and boosting overall efficiency and economy. Additionally, the ES charges during low-tariff hours and discharges during high-tariff hours, with the HS operating oppositely, enhancing system flexibility.

4.3. Different DR Strategy Analysis

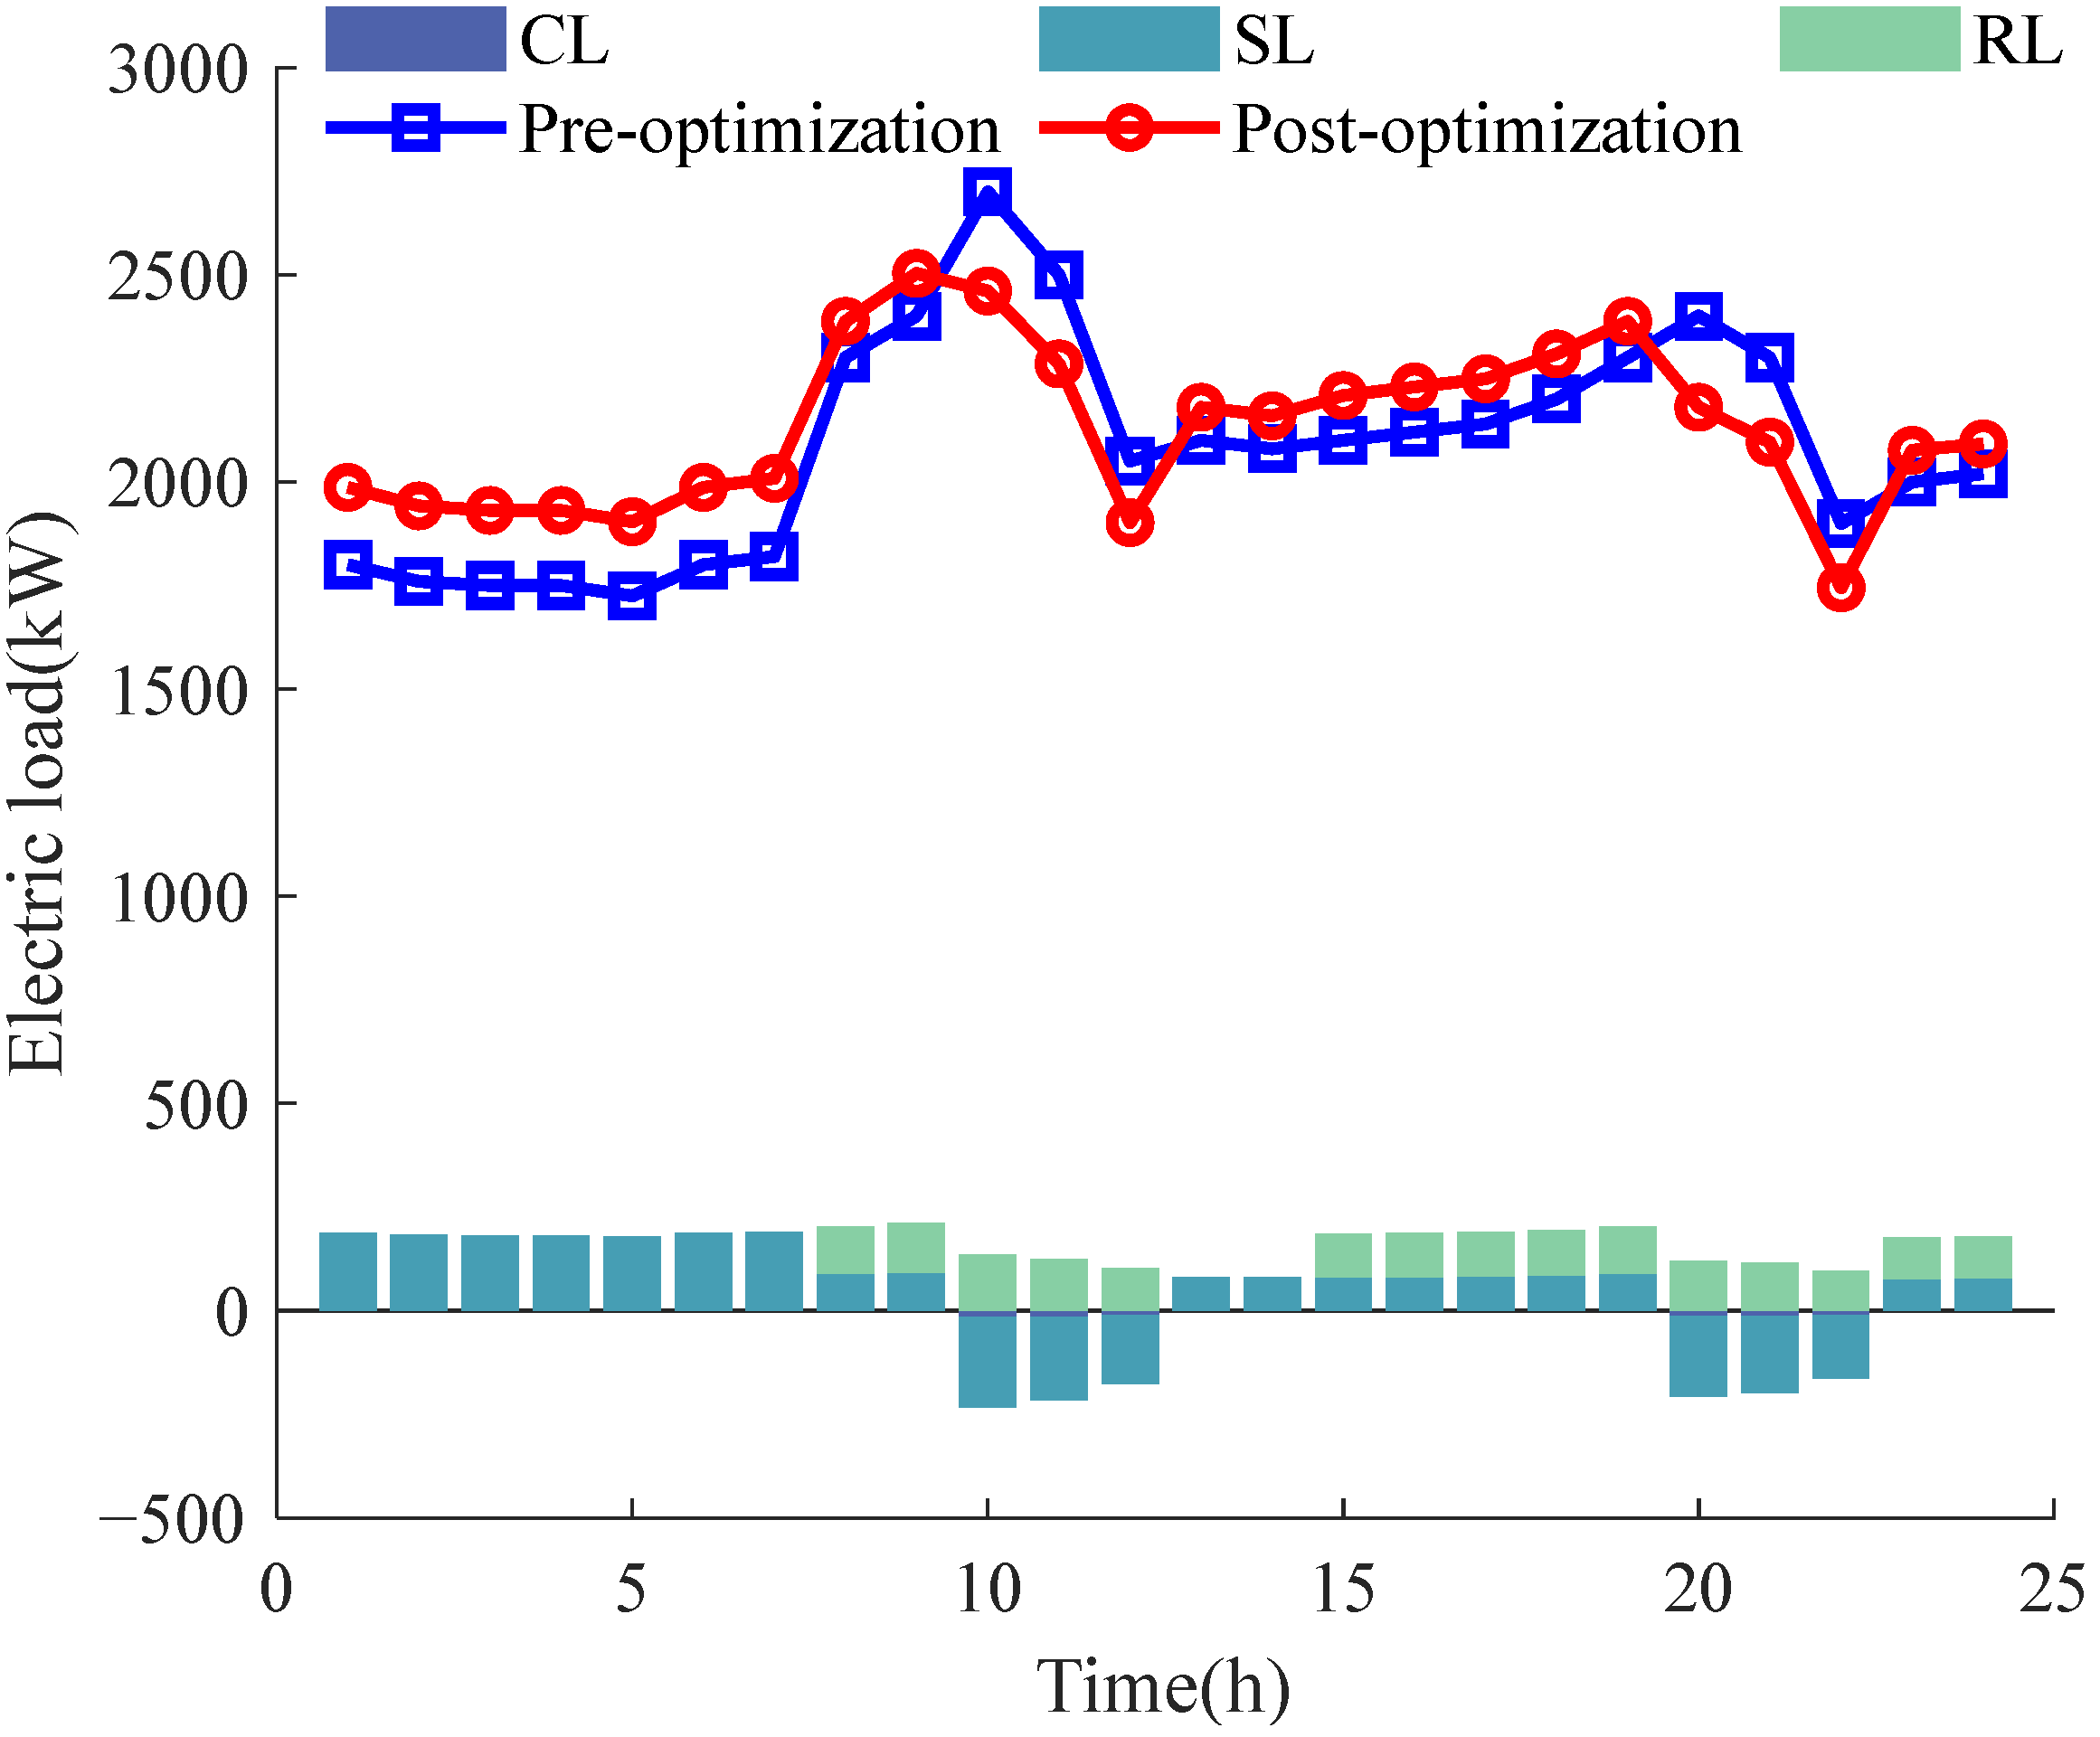
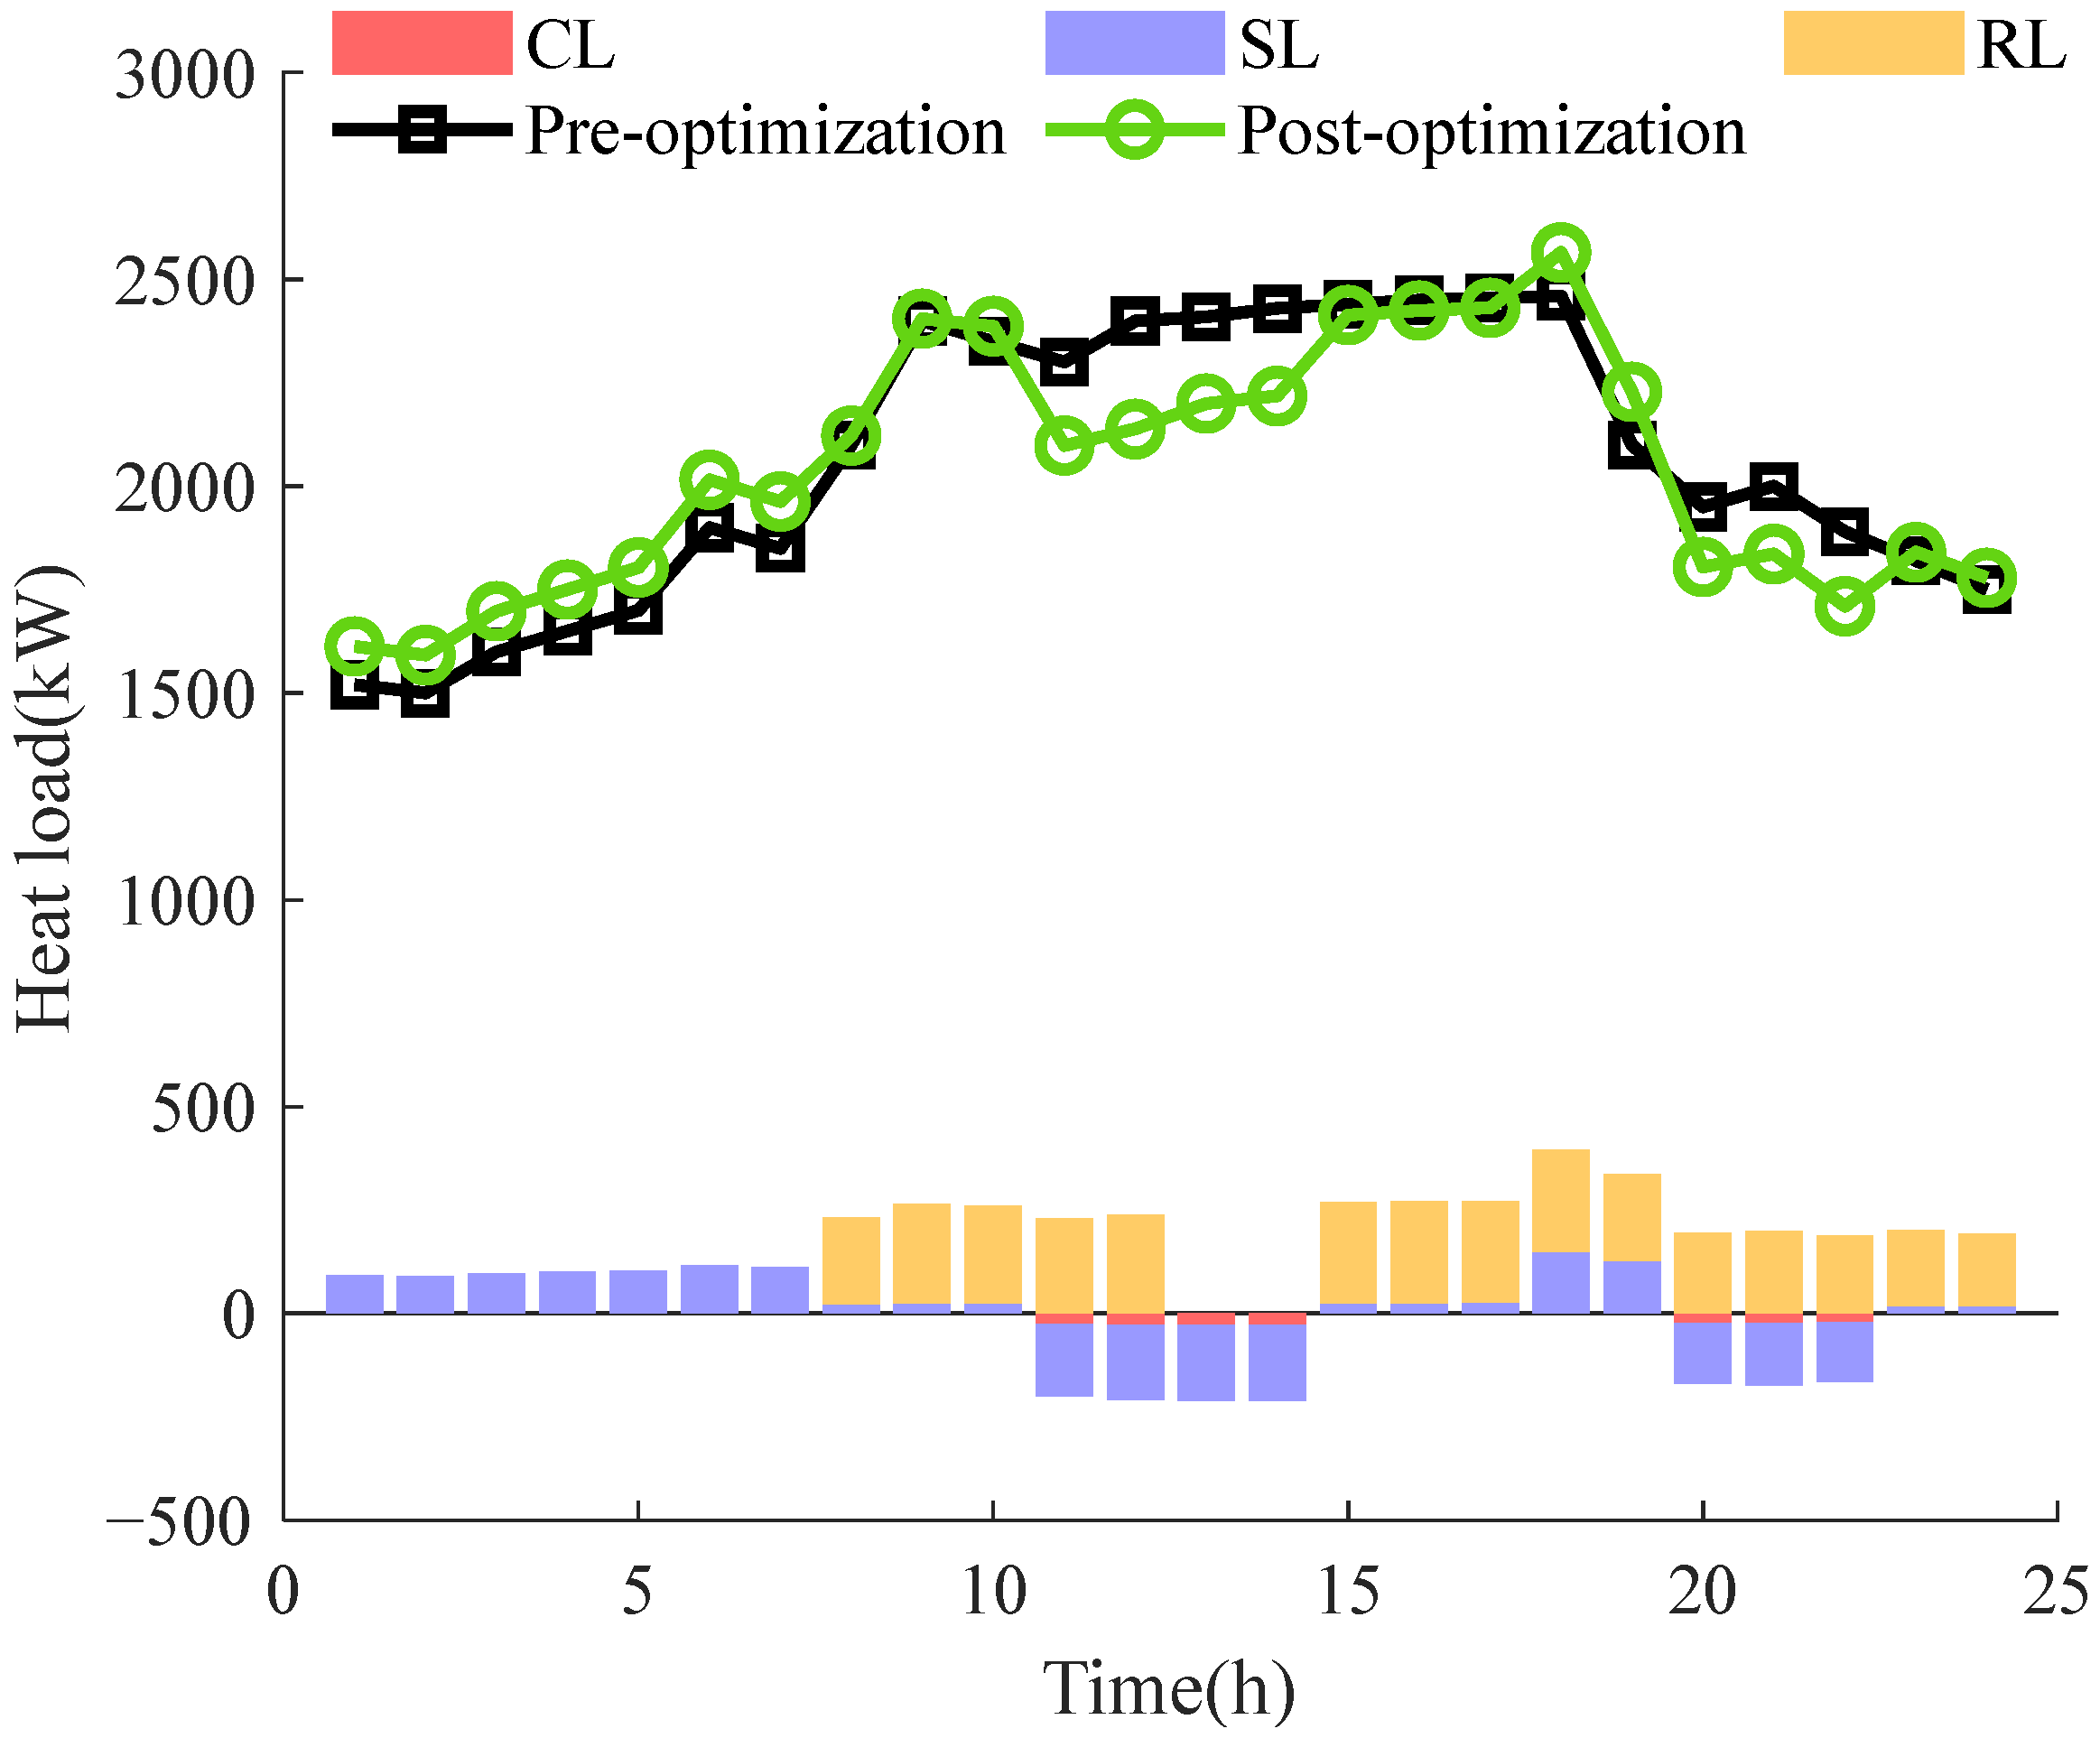
As depicted in Figure 7 and Figure 8, the electric and thermal load composition in Case 2 reveals a more balanced load curve compared to the original load’s pronounced peak–valley distribution. CL responds to time-varying tariffs by reducing consumption during high-tariff periods (09:00–12:00, 20:00–21:00). SL shifts part of its demand from high-tariff hours (10:00–12:00, 20:00–22:00) to low-tariff periods (00:00–09:00), lowering peak-period loads and raising off-peak loads for a smoother curve. RL transfers electrical loads from high-tariff periods (08:00–12:00, 19:00–24:00) to heat loads, and vice versa during low-tariff hours (15:00–19:00). The combined effect of price-based and alternative DR strategies effectively flattens the load curve, achieving peak shaving and valley filling.

4.4. Limitations and Future Research

This paper presents a low-carbon operational strategy for IESs, yet several areas still require further exploration. The study focuses mainly on electricity, heat, and gas energy, with limited exploration of other energy types. Future research will expand the scope to include hydrogen and cooling energy, enhancing strategy comprehensiveness. A simplified carbon trading model was designed in this paper, but this limitation may restrict its real-world applicability. Future research will center on dynamic quota allocation and heterogeneous regional policies within an electricity-carbon coupled market framework, thereby offering robust support for practical carbon trading applications. In terms of DR, only price-based and alternative DRs are considered, while incentive-based DR is ignored. Future work will incorporate diverse DR types into the model to enrich DR strategy options. The proposed model fails to account for renewable energy output and load demand uncertainties. Future research will employ stochastic planning or robust optimization to address these uncertainties, improving the model’s real-world applicability and offering reliable guidance for IES low-carbon operation.

5. Conclusions

A low-emission operational approach for the IES is developed in this study, integrating a tiered carbon market framework alongside a DR model. Through the comparison and analysis of four scenarios, the model’s validity is verified, and the following conclusions are drawn, along with an outlook on theoretical contributions and future research directions.
(1)
The introduction of the stepped carbon trading mechanism alongside DR strategies significantly reduces carbon emission costs by 44.45%, actual carbon emissions by 9.85%, and total system costs by 10.62% compared to scenarios without this mechanism. This demonstrates the mechanism’s effectiveness in providing an initial carbon emission allowance, achieving a dual optimization of economic and environmental benefits. This finding contributes to the existing literature by offering a novel perspective on how carbon trading mechanisms can be practically applied in IES to balance economic efficiency and environmental goals.
(2)
The implementation of DR strategies leads to a 10.44% reduction in energy purchase costs. By reducing peak loads and increasing valley loads, the system can optimize energy procurement based on time-varying energy prices and availability. This approach decreases expenses while simultaneously improving the system’s versatility and resilience. The study extends prior research by examining the specific impacts of different DR types on IES operations, providing deeper insights into demand-side management.
(3)
When both the stepped carbon trading mechanism and DR are considered, the total operating costs, energy purchase costs, carbon trading costs, and actual carbon emissions are all lower than in scenarios considering only carbon trading. DR not only shifts and cuts loads but also enables the mutual substitution of electricity and heat energy, smoothing the load curve. The system can accurately compare the costs of electricity and gas procurement and the outputs of gas turbines and gas boilers across different periods. This facilitates choosing an operational strategy that is both cost-efficient and environmentally friendly, achieving an effective balance between economic benefits and carbon reduction. This research advances the field by developing a comprehensive model that integrates carbon trading and DR, offering a more holistic approach to IES operation.

Author Contributions

Conceptualization, C.Y.; data curation, Q.H.; formal analysis, J.X. and H.L.; investigation, J.X.; methodology, H.L.; resources, J.X.; software, Q.H.; validation, C.Y., C.L., and J.W.; writing—original draft, C.Y.; supervision, J.W. All authors have read and agreed to the published version of the manuscript.

Funding

This work was supported by the Science and Technology Tackling Project of Henan Province (Grant No. 252102240105) and Fund of the Institute of Complexity Science, Henan University of Technology (Grant No. CSKFJJ-2025-27).

Institutional Review Board Statement

Not applicable.

Informed Consent Statement

Not applicable.

Data Availability Statement

The original study’s contributions are included in the article and any further inquiries can be directed to the corresponding authors.

Conflicts of Interest

Authors Chao Yan, Jianyun Xu, Chunrui Li, Qilin Han, Hongwei Li were employed by the State Grid Hebei Electric Power Co., Ltd. The remaining author declares that the research was conducted in the absence of any commercial or financial relationships that could be construed as a potential conflict of interest.

Nomenclature

Abbreviation
  CHPCombined heat and power
  CLCurtailable load
  DRDemand response
  ESElectric storage
  GBGas boiler
  GTGas turbine
  HPHeat pump
  HSHeat storage
  IESIntegrated energy system
  MILPMixed-integer linear programming
  PVPhotovoltaic
  RLReplaceable load
  SLShiftable load
  WTWind turbines
  WHBWaste heat boiler
Sets and indices
   T Scheduling cycle
   t Index of time
Parameters and constants
   E I E S Carbon emission right allowances for IES
   E I E S , a Actual carbon emissions from IES
   E I E S , e x Carbon credits exchanged in the market
   P E S min Minimum value of ES charging and discharging power
   P E S max Maximum value of ES charging and discharging power
   P H S min Minimum value of thermal energy storage and heat release power
   P H S max Maximum value of thermal energy storage and heat release power
   P P V max Maximum value of PV output
   P W T max Maximum value of WT output
   Q G B m a x Upper input power limits of GB
   Q G B m i n Lower input power limits of GB
   S E S , 1 Initial charge state of the ES during the charging and discharging cycle
   S E S , T Final charge state of the ES during the charging and discharging cycle
   S E S min Minimum state-of-charge of the ES
   S E S max Maximum state-of-charge of the ES
   S H S , 1 Initial charge state of the HS during the charging and discharging cycle
   S H S , T Final charge state of the HS during the charging and discharging cycle
   S H S min Minimum state-of-charge of the HS
   S H S max Maximum state-of-charge of the HS
   Δ P min R L , e / h Minimum substitutions for the replaceable electrical/heat loads
   Δ P max R L , e / h Maximum substitutions for the replaceable electrical/heat loads
   Δ Q G B max Upper limits of the GB’s climb
   Δ Q G B min Lower limits of the GB’s climb
   a 1 , b 1 , c 1 Emission factors of coal-fired generation
   a 2 , b 2 , c 2 Emission factors of gas-fueled equipment
   β e Emission intensities of unit electricity from coal plants
   β g Emission intensities of unit gas consumption of gas-fired units
   η G T e Gas-to-electricity efficiency of GT
   η G T h Gas-to-thermal efficiency of GT
   η W H B Heat recovery efficiency of the WHB
   η H P Electrical transfer efficiency of the HP
   η G B Energy conversion efficiency of GB
   η E S c h Charging efficiency of the ES
   η E S d i s Discharging efficiency of the ES
   η H S c h Charging efficiency of the HS
   η H S d i s Discharging efficiency of the HS
   κ e Energy utilization rates of electric energy
   κ h Energy utilization rates of thermal energy
   Γ e Unit calorific value of electric energy
   Γ g Unit calorific value of natural gas
   Γ h Unit calorific value of thermal energy
   λ Initial carbon price
   l Width of the emission allowance interval
   α Carbon price increase rate
   f B u y Energy purchase cost
   f O p e Operation and maintenance cost
   f C O 2 Carbon trading cost
   F System total cost
   ω P V PV unit operation cost
   ω W T WT unit operation cost
   ω G T GT unit operation cost
   ω W H B WHB unit operation cost
   ω H P HP unit operation cost
   ω G B GB unit operation cost
   ω E S ES unit operation cost
   ω H S HS unit operation cost
   ψ Customer satisfaction index
   ψ min Minimum satisfaction threshold
   δ + , δ Upper and lower bounds of load deviation range ratio
Variables
   H C H P , t Thermal power generated by GT at time t
   H G B , t Power input to GB at time t
   H G T , t Thermal power output of GT at time t
   H H P , t Thermal power output from the HP at time t
   H W H B , t Thermal power input to the WHB at time t
   P B u y , t Power purchased from the grid at time t
   P C H P , t Electric power generated by GT at time t
   P D , t Practical load demand at time t
   P D , t i n i Baseline load at time t
   P E S , t c h Charging power of the ES at time t
   P E S , t d i s Discharging power of the ES at time t
   P G T , t Electrical power output from the GT at time t
   P H P , t Electrical power input to the HP at time t
   P H S , t c h Storage power of thermal energy storage at time t
   P H S , t d i s Release power of thermal energy storage at time t
   P P V , t PV power output at time t
   P S e l l , t Power sold to the grid at time t
   P T o t a l , t Combined output power of CHP and GB at time t
   P W H B , t Heat power recovered by the WHB at time t
   P W T , t WT power output at time t
   P t C L , i n i Initial amount of load that can be curtailed at time t
   P t T L , i n i Initial transferable load quantity at time t
   Q B u y , t Purchased gas consumption at time t
   Q C H P , t CHP gas consumption at time t
   Q G B , t GB gas consumption at time t
   S E S , t Charge state of ES at time t
   S H S , t Charge state of HS at time t
   Δ P t C L Amount of curtailable load at time t
   Δ P t R L , e Amount of replaceable electrical load at time t
   Δ P t R L , h Amount of replaceable heat loads at time t
   Δ P t S L Amount of shiftable load at time t
   ω t The electrical load elasticity coefficient at time t
   ξ t Practical electricity price at time t
   ξ t i n i Baseline electricity price at time t
   φ B u y , t Electricity purchased price at time t
   φ S e l l , t Electricity sold price at time t
   φ g , t Gas purchased price at time t
   μ E S , t c h Charging state of the ES at time t
   μ E S , t d i s Discharging state of the ES at time t
   μ H S , t c h Storage state of the thermal energy storage at time t
   μ H S , t d i s Release state of the thermal energy storage at time t

References

  1. Wang, P.; Li, H.; Wang, L.; Huang, Z. The impact of teleconnections of built-up land on regional carbon burden under the shared socio-economic pathways. Sci. Total Environ. 2024, 906, 167589. [Google Scholar] [CrossRef]
  2. Zhang, Z.; Qian, Z.; Chen, M.; Zhu, R.; Zhang, F.; Zhong, T.; Lin, J.; Ning, L.; Xie, W.; Creutzig, F. Worldwide rooftop photovoltaic electricity generation may mitigate global warming. Nat. Clim. Change 2025, 15, 393–402. [Google Scholar] [CrossRef]
  3. Zhang, S.; Chen, W.; Zhang, Q.; Krey, V.; Byers, E.; Rafaj, P.; Nguyen, B.; Awais, M.; Riahi, K. Targeting net-zero emissions while advancing other sustainable development goals in China. Nat. Sustain. 2024, 7, 1107–1119. [Google Scholar] [CrossRef]
  4. Zhou, W.; Chi, Y.; Tang, S.; Hu, Y.; Wang, Z.; Zhang, X. The evolution analysis of low-carbon power transition strategies and carbon emission decoupling based on carbon neutrality target. Energy 2024, 311, 133298. [Google Scholar] [CrossRef]
  5. Zhang, J.; Ding, S.; Lu, Z.; Kong, X.; Guo, X.; Zhang, J. Towards net-zero: Coupling carbon mineralization with seasonal energy storage in integrated energy systems planning. Appl. Energy 2025, 393, 126065. [Google Scholar] [CrossRef]
  6. Morris, J.; Gurgel, A.; Mignone, B.K.; Kheshgi, H.; Paltsev, S. Mutual reinforcement of land-based carbon dioxide removal and international emissions trading in deep decarbonization scenarios. Nat. Commun. 2024, 15, 7160. [Google Scholar] [CrossRef]
  7. Wang, Y.; Liu, J.; Zhao, Z.; Ren, J.; Chen, X. Research on carbon emission reduction effect of China’s regional digital trade under the “double carbon” target--combination of the regulatory role of industrial agglomeration and carbon emissions trading mechanism. J. Clean. Prod. 2023, 405, 137049. [Google Scholar] [CrossRef]
  8. Han, Y.; Tan, S.; Zhu, C.; Liu, Y. Research on the emission reduction effects of carbon trading mechanism on power industry: Plant-level evidence from China. Int. J. Clim. Change Strateg. Manag. 2022, 15, 212–231. [Google Scholar] [CrossRef]
  9. Li, F.; Wang, D.; Guo, H.; Zhang, J. Distributionally Robust Optimization for integrated energy system accounting for refinement utilization of hydrogen and ladder-type carbon trading mechanism. Appl. Energy 2024, 367, 123391. [Google Scholar] [CrossRef]
  10. Chen, J.; Tang, Z.; Huang, Y.; Qiao, A.; Liu, J. Asymmetric Nash bargaining-based cooperative energy trading of multi-park integrated energy system under carbon trading mechanism. Electr. Power Syst. Res. 2024, 228, 110033. [Google Scholar] [CrossRef]
  11. Wang, L.; Yang, C.; Xu, Z.; Yuan, G.; Tang, L.; Bai, Y.; Wang, X. Analysis of carbon electricity coupled market modeling method based on carbon credit trading mechanism. Int. J. Electr. Power Energy Syst. 2024, 156, 109707. [Google Scholar] [CrossRef]
  12. Wang, L.; Ren, X.; Ma, Y.; Liu, Z.; Dong, W.; Ni, L. Optimal low-carbon scheduling of integrated energy systems considering stepped carbon trading and source-load side resources. Energy Rep. 2024, 12, 3145–3154. [Google Scholar] [CrossRef]
  13. Zhou, W.; Lai, J.; Li, X.; Zeng, Z. Dynamic Vertical Peer-to-Peer Carbon Right Sharing Management for Microgrid Clusters with Multiple Structural Demand Response. IEEE Trans. Ind. Inform. 2025, 21, 6038–6048. [Google Scholar] [CrossRef]
  14. Wang, Y.; Dong, P.; Xu, M.; Li, Y.; Zhou, D.; Liu, X. Research on collaborative operation optimization of multi-energy stations in regional integrated energy system considering joint demand response. Int. J. Electr. Power Energy Syst. 2024, 155, 109507. [Google Scholar] [CrossRef]
  15. Xiong, Z.; Zhang, D.; Wang, Y. Optimal operation of integrated energy systems considering energy trading and integrated demand response. Energy Rep. 2024, 11, 3307–3316. [Google Scholar] [CrossRef]
  16. Wang, Y.; Li, Y.; Zhang, Y.; Xu, M.; Li, D. Optimized operation of integrated energy systems accounting for synergistic electricity and heat demand response under heat load flexibility. Appl. Therm. Eng. 2024, 243, 122640. [Google Scholar] [CrossRef]
  17. Ma, C.; Hu, Z. Low-Carbon Economic Scheduling of Integrated Energy System Considering Flexible Supply–Demand Response and Diversified Utilization of Hydrogen. Sustainability 2025, 17, 1749. [Google Scholar] [CrossRef]
  18. Yang, M.; Liu, Y. Research on multi-energy collaborative operation optimization of integrated energy system considering carbon trading and demand response. Energy 2023, 283, 129117. [Google Scholar] [CrossRef]
  19. Gao, L.; Fei, F.; Jia, Y.; Wen, P.; Zhao, X.; Shao, H.; Feng, T.; Huo, L. Optimal dispatching of integrated agricultural energy system considering ladder-type carbon trading mechanism and demand response. Int. J. Electr. Power Energy Syst. 2024, 156, 109693. [Google Scholar] [CrossRef]
  20. Cui, Y.; Xu, Y.; Huang, T.; Wang, Y.; Cheng, D.; Zhao, Y. Low-carbon economic dispatch of integrated energy systems that incorporate CCPP-P2G and PDR considering dynamic carbon trading price. J. Clean. Prod. 2023, 423, 138812. [Google Scholar] [CrossRef]
  21. Zhang, Y.; Li, L.; Hu, W. An Integrated Energy Demand Response Model Considering Source-Load Synergy and Stepped Carbon Trading Mechanism. Eng. Lett. 2024, 32, 614. [Google Scholar]
  22. Fan, W.; Ju, L.; Tan, Z.; Li, X.; Zhang, A.; Li, X.; Wang, Y. Two-stage distributionally robust optimization model of integrated energy system group considering energy sharing and carbon transfer. Appl. Energy 2023, 331, 120426. [Google Scholar] [CrossRef]
  23. Wang, J.; Zhao, Y.; Li, H.; Xu, X. Enhanced photovoltaic-powered distribution network resilience aided by electric vehicle emergency response with willingness and reward. Appl. Energy 2025, 389, 125619. [Google Scholar] [CrossRef]
  24. Hu, J.; Wang, Y.; Dong, L. Low carbon-oriented planning of shared energy storage station for multiple integrated energy systems considering energy-carbon flow and carbon emission reduction. Energy 2024, 290, 130139. [Google Scholar] [CrossRef]
  25. Sadeq, A.M. Energy Storage Systems: A Comprehensive Guide. 2023. Available online: https://www.researchgate.net/publication/374133294_Energy_Storage_Systems_A_Comprehensive_Guide (accessed on 1 July 2025).
  26. Maghami, M.R.; Pasupuleti, J.; Ekanayake, J. Energy storage and demand response as hybrid mitigation technique for photovoltaic grid connection: Challenges and future trends. J. Energy Storage 2024, 88, 111680. [Google Scholar] [CrossRef]
  27. Wang, J.; Meng, J.; Li, H.; Xu, X. Analysis of regional electric vehicle aggregation response behavior in the coupling electricity and carbon markets. Energy 2025, 326, 135914. [Google Scholar] [CrossRef]
  28. Wei, Z.; Ma, X.; Guo, Y.; Wei, P.; Lu, B.; Zhang, H. Optimized operation of integrated energy system considering demand response under carbon trading mechanism. Electr. Power Constr. 2022, 43, 1–9. [Google Scholar]
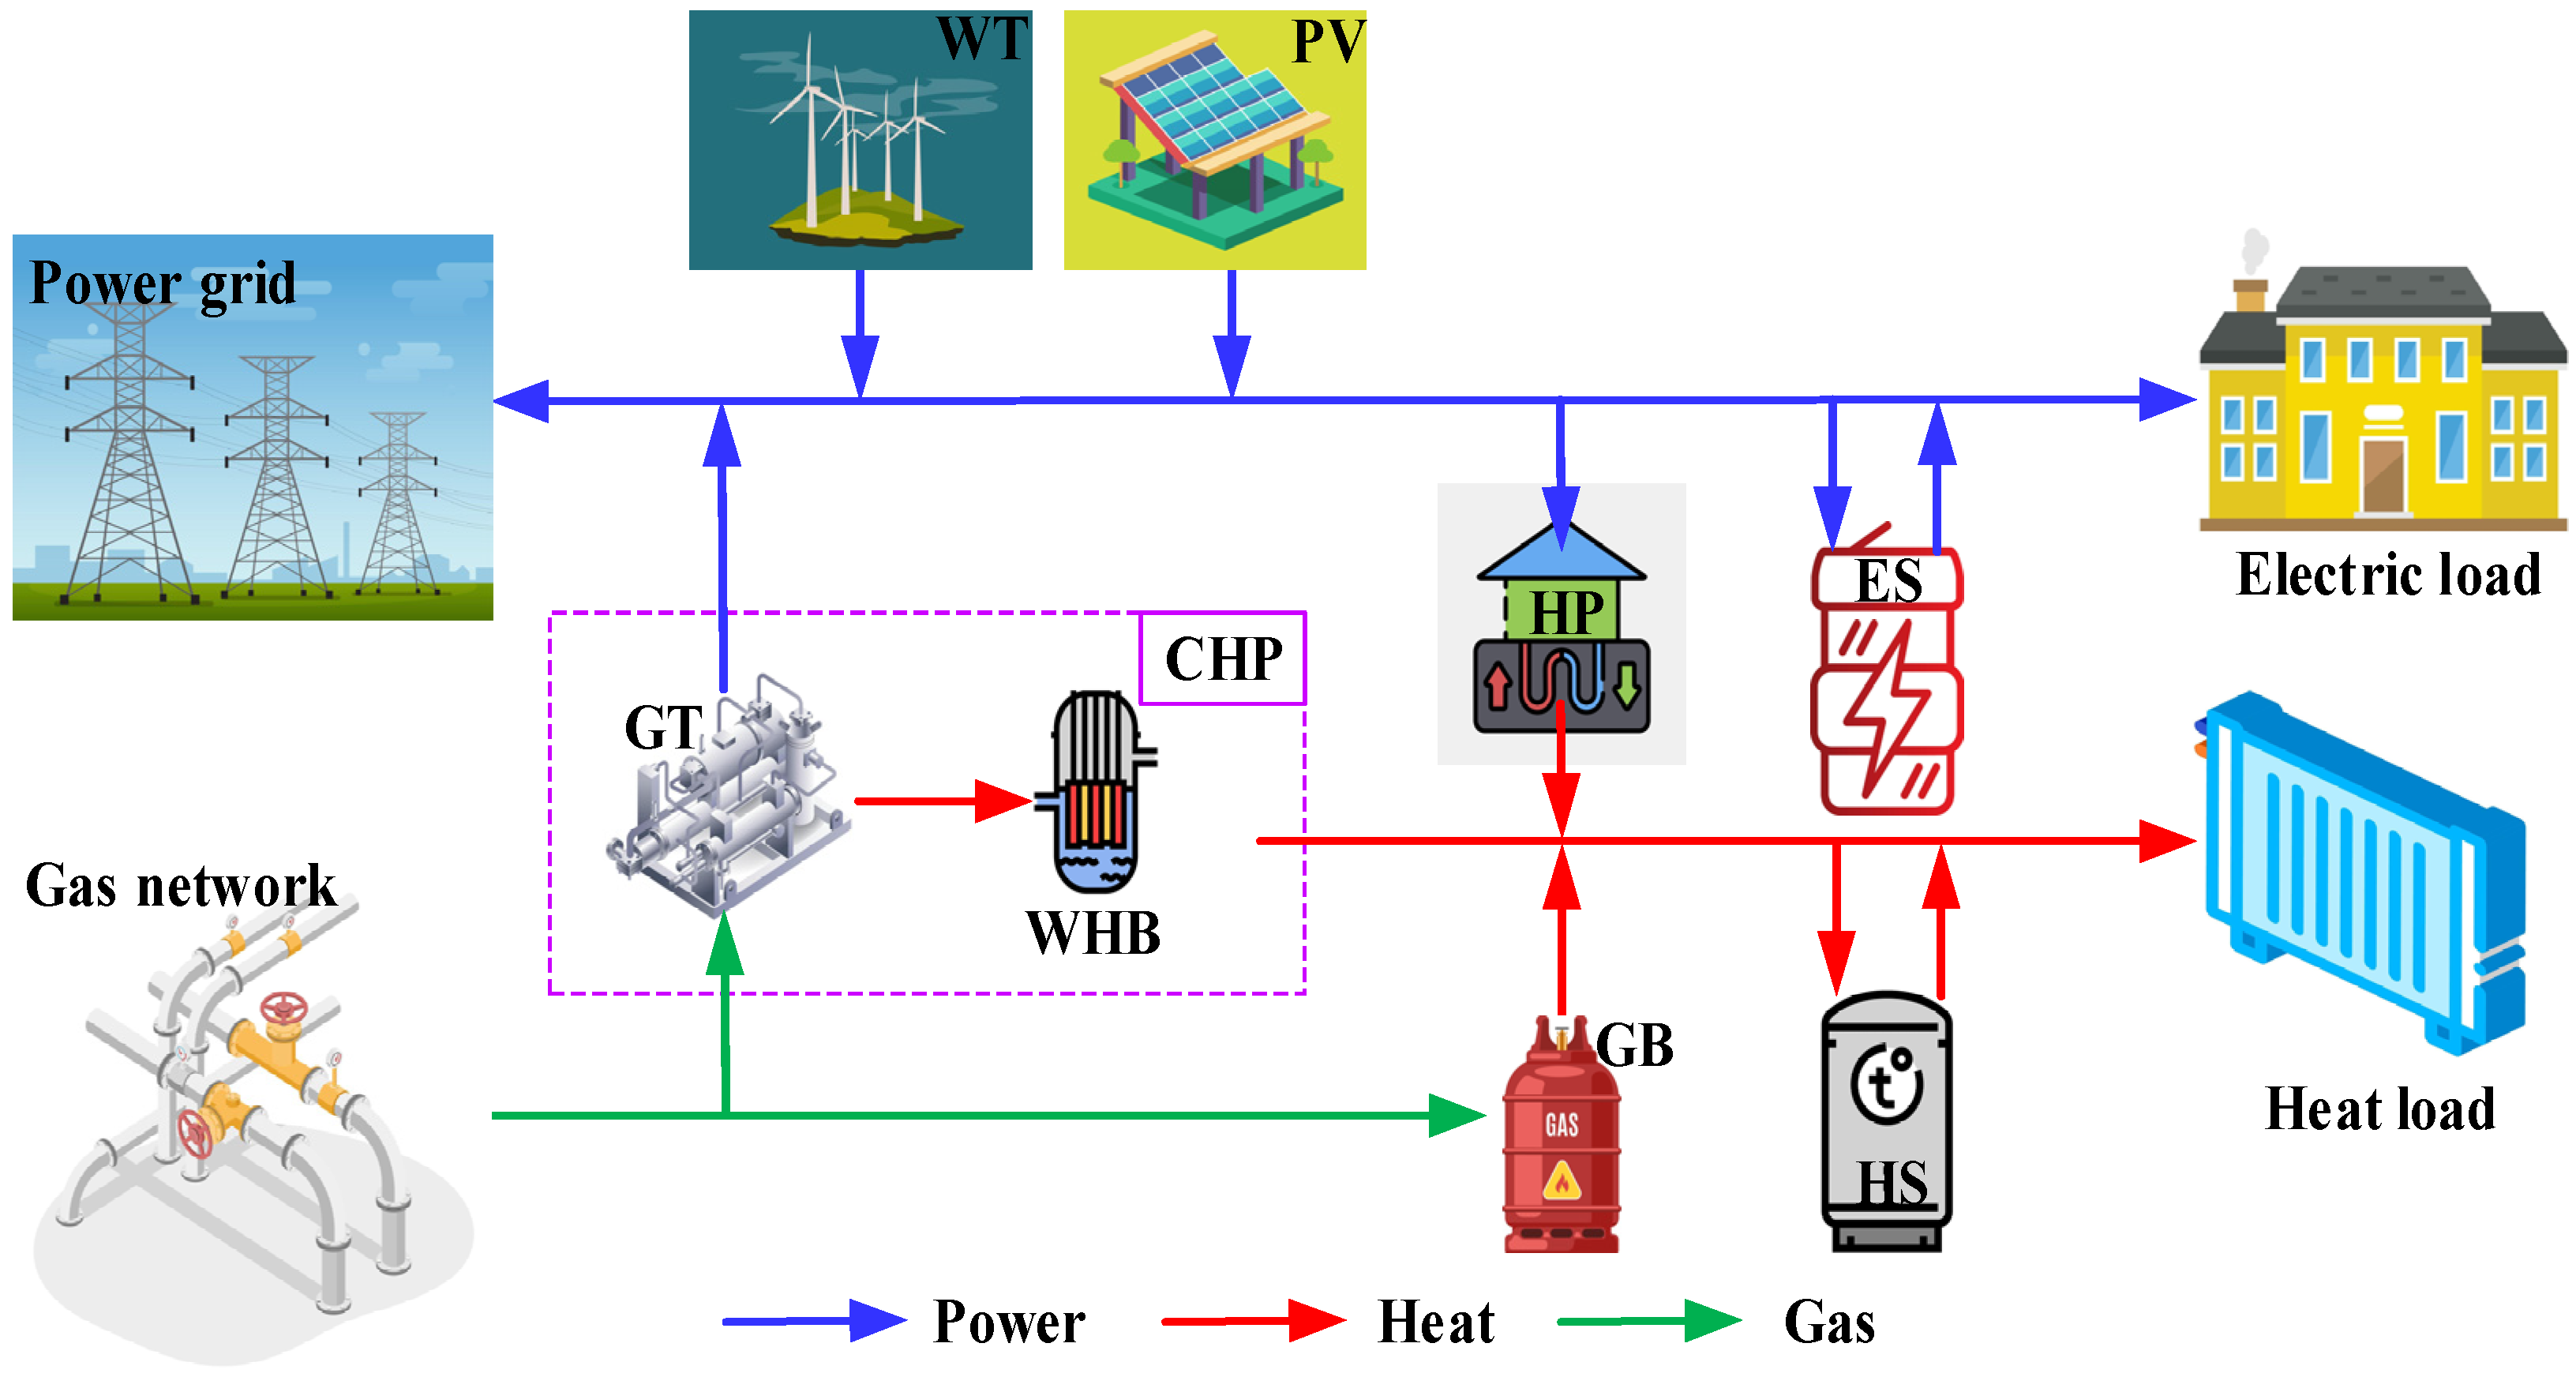
Figure 1. The diagram of the industrial IES.
Sustainability 17 09472 g001
Figure 2. Schematic diagram of ladder-type carbon trading.
Sustainability 17 09472 g002
Figure 3. Power output of PV and WT.
Sustainability 17 09472 g003
Figure 4. Electricity and heat load configuration.
Sustainability 17 09472 g004
Figure 5. Power output in Case 2.
Sustainability 17 09472 g005
Figure 6. Heat output in Case 2.
Sustainability 17 09472 g006
Figure 7. Composition of electric load in Case 2.
Sustainability 17 09472 g007
Figure 8. Composition of heat load in Case 2.
Sustainability 17 09472 g008
Table 1. Parameters of devices.
Equipment TypeParametersValue
GTInstalled capacity/kW4000
Electrical efficiencies0.3
Thermal efficiency0.4
GBInstalled capacity/kW1000
Efficiency0.9
WHBEfficiency0.8
HPInstalled capacity/kW400
Efficiency4.4
HSMaximum capacity/kWh400
Initial heat storage/kWh50
Charge/discharge thermal efficiency0.95/0.9
Maximum charging and discharging power/kW250
ESMaximum capacity/kWh400
Initial power/kWh70
Charge/discharge efficiency0.95/0.9
Maximum charge/discharge power/kW250
Table 2. Time-of-use electricity prices.
TimePrice (CNY/kWh)TimePrice (CNY/kWh)
01:00–07:000.3815:00–18:000.68
08:00–11:000.6819:00–22:001.2
12:00–14:001.223:00–24:000.38
Table 3. Daily operation cost in four different cases.
Case F /CNY f B u y /CNY f O p e /CNY f C O 2 /CNY E I E S , e x /kg
122,438.119,886.61721.1830.439,664.3
221,169.518,584.21790.1795.238,364.2
321,723.518,383.81803.91535.841,418.3
423,684.520,527.81725.21431.542,554.7
Disclaimer/Publisher’s Note: The statements, opinions and data contained in all publications are solely those of the individual author(s) and contributor(s) and not of MDPI and/or the editor(s). MDPI and/or the editor(s) disclaim responsibility for any injury to people or property resulting from any ideas, methods, instructions or products referred to in the content.