Abstract
The intelligence of sustainable design is reflected in the demands for accurate and real-time environmental impact assessments; traditional LCA methods are slow and static. In this paper, we propose a novel deep learning framework that serially links Shuffle-GhostNet (a lightweight convolutional neural network employing a combination of Ghost and Shuffle modules) improved by an enhanced version of Hippopotamus Optimizer (EHHO) for hyperparameter tuning and enhanced convergence. Upon testing the model on the Ecoinvent and OpenLCA Nexus datasets, pronounced advantages in predicting CO2 emissions, energy use, and other sustainability indicators were found. Coupling the integration of multi-source sensor data and optimizing the architecture via metaheuristic search enables rapid and reliable decision support on eco-design. Final results are significantly better than the baseline models, achieving an R2 of up to 0.943 with actual performance gains. AI-driven modeling integrated with LCA constitutes a pathway toward dynamic and scalable sustainability assessment in Industry 4.0 and circular economy applications.
1. Introduction
Among the soaring environmental concerns and a very urgent call for sustainable development, designing products with reduced ecological footprints is one of the leading issues for both industries and policymakers [1].
Sustainable product design is the goal to integrate environmental considerations at all stages of product development lifecycles to ensure that all decisions made during design can translate to reduced resource consumption, emissions, and recyclability [2].
Life Cycle Assessment (LCA) is one cornerstone of this approach [3].
While existing approaches to Life Cycle Assessment (LCA) for sustainable product design rely heavily on static, database-driven methodologies or computationally intensive full-scale simulations, they suffer from critical limitations: they are inherently slow, incapable of real-time iteration during early-stage design, and struggle to capture the complex, non-linear relationships between diverse design parameters (e.g., material composition, manufacturing processes) and multi-faceted environmental impacts (e.g., CO2 emissions, energy use) [4].
Traditional machine learning models, while faster, often employ heavy architectures that are impractical for deployment in resource-constrained design environments, lack efficient mechanisms for handling sparse LCA data, and are frequently optimized with suboptimal hyperparameters that hinder their predictive power [5].
Existing approaches to the incorporation of Life Cycle Assessment (LCA) in sustainable product design have three key weaknesses: (1) classical LCA uses database-based, non-iterative workflows that are too slow to support real-time, iterative design; (2) even lightweight machine learning models have been shown to have poor hyperparameter choice and can represent the sparse, high-dimensional and non-linear nature of LCA data; and (3) even lightweight models tend to have a poor hyperparameter choice and poor representational power of the sparse, high-dimensional and non-linear to overcome these problems, our proposed framework specifically utilizes a highly designed and lightweight architecture, Shuffle-GhostNet, based on Ghost mod-ules to minimize redundancy and well-formed linear feature generation and Shuffle modules to allow cross-group communication channels to discover complex de-sign-impact interactions and the Enhanced Hippopotamus Optimizer (EHHO) to ensure that Shuffle-GhostNet reaches optimal settings quickly. Combined, this concerted effort makes LCA an accurate, scalable, and real-time decision support system that can guide eco-design with high fidelity (R2 = 0.943) and artificially low computational costs.
This work directly addresses these shortcomings by introducing a purpose-built deep learning framework: Shuffle-GhostNet, which synergistically combines GhostNet’s lightweight feature generation (reducing redundant computations through inexpensive operations) and ShuffleNet’s channel shuffling-enhancing inter-group information flow to better model intricate, cross-parameter interactions within LCA data [6].
Crucially, this architecture is not merely an assembly of existing components but is specifically engineered to overcome the computational efficiency barrier and representational inadequacy of prior methods [7]; its compact size enables rapid inference on cloud or edge platforms, while its enhanced feature representation captures subtle, non-linear dependencies that simpler models miss [8].
To further unlock its potential, we integrate it with an Enhanced Hippopotamus Optimizer (EHHO), which dynamically balances exploration and exploitation during hyperparameter tuning using a novel adaptive step-size and hybrid mutation strategy, ensuring the model converges to optimal configurations tailored precisely for the rugged, high-dimensional LCA optimization landscape [9].
This integrated solution transforms LCA from a slow, post-design evaluation tool into a dynamic, real-time decision support system, enabling designers to rapidly evaluate thousands of eco-design alternatives with high accuracy and minimal computational overhead, thereby bridging the gap between rigorous sustainability science and agile, Industry 4.0 design workflows.
LCA is an internationally standardized methodology for assessing the environmental consequences that occur throughout the life cycle of a product from raw material extraction to manufacturing, use, and disposal or recycling when the product reaches the end-of-life service stage [10].
Net models LF are well-suited to the sustainable metrics of product development since they present a complete view of some key sustainability factors, such as the following: global warming potential (GWP), energy consumption, and water use, as well as equivalent waste generation.
As a result, a standard LCA method is often restricted to external and static databases or deterministic models, thereby preventing its effective adoption in dynamic and complex design environments. Likewise, the manual execution of the LCAs is time-consuming, hence not efficiently scalable for real-time iterative product design scenarios with thousands of design variables and parameters related to environmental impact.
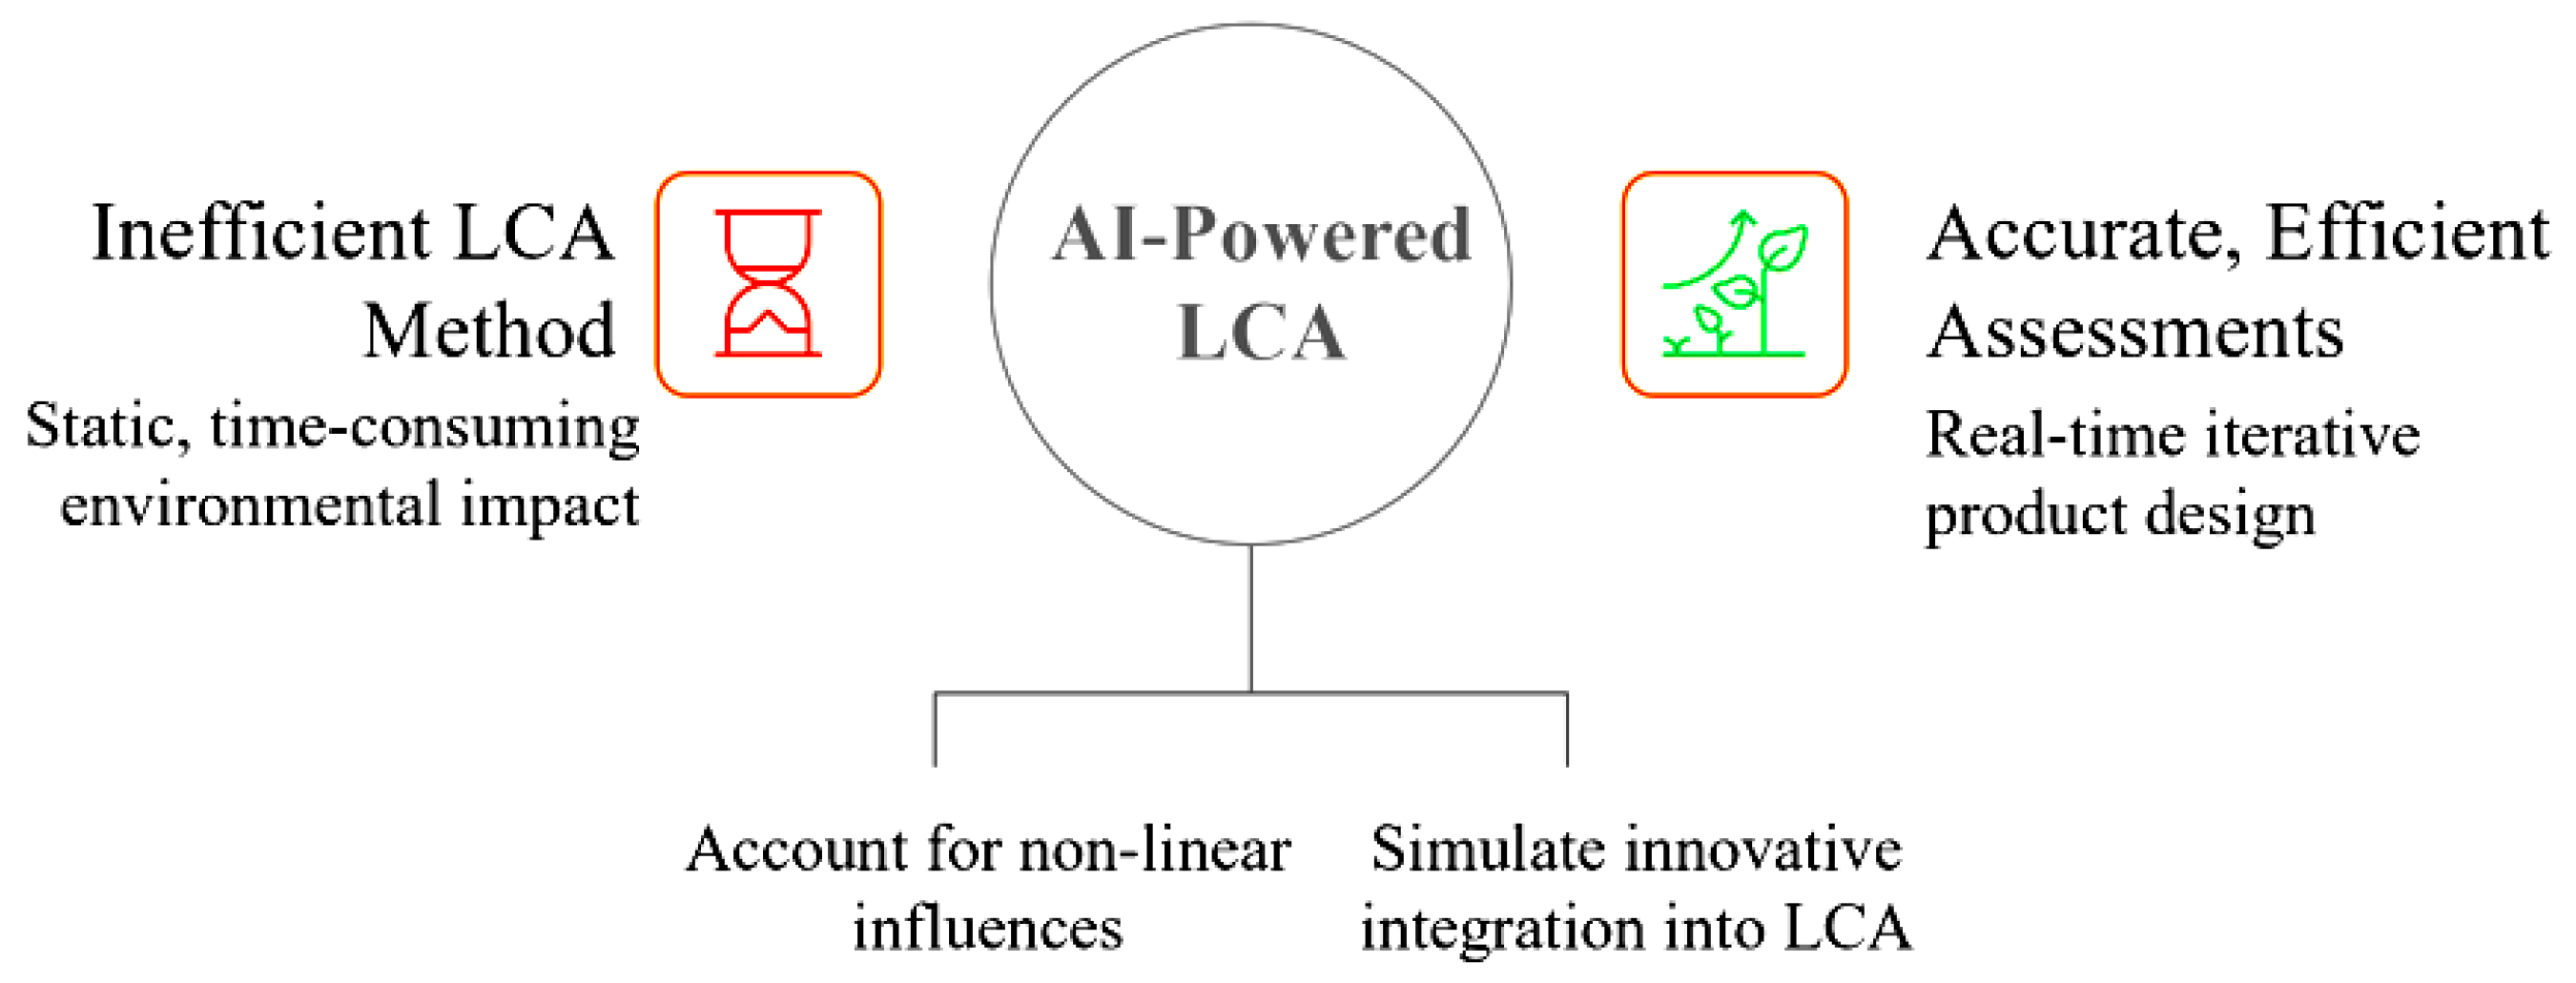
Recent works have now begun to include AI and ML techniques to simulate innovative integration into LCA for automation, scalability, and predictive capability in the scope of environmental impact modeling. Particularly relevant are deep learning models, capable of accounting for non-linear influences among design features and their particular environmental outcomes, hence “improving” the accuracy and efficiency of sustainability assessments. Figure 1 shows the improvement of sustainability assessments with AI.
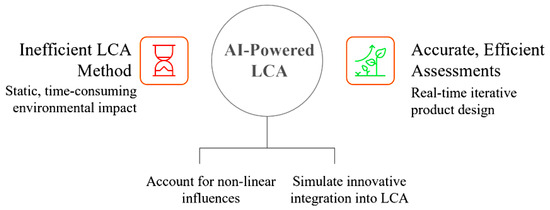
Figure 1.
Improving sustainability assessments with AI: the life cycle seen in a tech industry scenario has an entirely different takeoff from design to deployment of the chip.
Such models depend heavily, however, on architectural design and hyperparameter tuning, both of which are major contributors to model performance and generalization.
To directly confront the drastic problem of architectural design and hyperparameter tuning, i.e., the most important to model performance and generalization in the framework of sustainability modeling, this paper gives the proposal of a co-designed framework where a purpose-specific lightweight architecture can be synergistically integrated with a new metaheuristic optimizer. Certainly, the Shuffle-GhostNet architecture, specifically, has been made capable of making trade-offs between representational capacity and computational efficiency by trading off between Ghost modules (that accumulate rich features via cheap linear operations) and Shuffle modules (that enhance inter-group flow of information via channel shuffling), to discover complex, non-linear relationships in sparse LCA data without a large number of parameters.
In addition to this, the Enhanced Hippopotamus Optimizer (EHHO) also optimally scales the hyperparameters (e.g., learning rate, batch size, dropout rate, kernel size) dynamically with an inertia weight adaptively and a hybrid mutation strategy that favored global exploration and local exploitation as the optimization progressed. This is in a manner that the model architecture is automatically tuned to the structure of LCA datasets and optimally tuned to the optimal hyperparameter regime that does not need to be optimized manually and, importantly, offers stability to convergence, prediction behavior, and deployment readiness in the real-world design processes.
Thus, this study proposes an innovative architecture in deep learning: Shuffle-GhostNet. Shuffle-GhostNet captures the lightweight efficiencies of GhostNet with the feature-shuffling capability of ShuffleNet in a single architecture.
GhostNet contributes to its efficiency with a novel convolution mechanism that produces more features from inexpensive operations, while ShuffleNet improves channel shuffling for better feature propagation and gradient flow. These two combined architectures produce a compact, powerful model that can perform highly complex LCA data with minimal computational expense.
For the improvement of Shuffle-GhostNet performance, an enhanced version of the Hippopotamus Optimizer (EHHO) has been suggested. The original HHO has shown strong global search capabilities together with much stronger convergence attributes; however, it is mostly faced with the challenges of either becoming prematurely converged or slowly exploiting in a complex optimization landscape.
With that said, we particularly enriched our implementation of HHO via a dynamic inertia weight strategy coupled with a hybrid mutation mechanism for an improved balance with regard to exploration-exploitation during the hyperparameter tuning and architectural optimization of Shuffle-GhostNet.
The integration of the Enhanced HHO algorithm with Shuffle-GhostNet allows this model to autoadapt its structure and parameters to suit the features of LCA datasets, which in turn helps it achieve higher levels of predictive accuracy and robustness.
This configuration is extremely advantageous when considering the application to real-world LCA data such as Ecoinvent or OpenLCA Nexus datasets, which contain voluminous information on product life cycles and environmental impacts. These datasets form a benchmarking basis for assessing the performance of our proposed framework in predicting sustainability metrics for various product designs.
Three contributions arise from this work. The first is technology development Shuffle-GhostNet, the latest deep learning architecture with the efficiency of GhostNet and the feature shuffling of ShuffleNet for improving precision in predicting the impacts on the environment. Second, the Hippopotamus Optimizer (HHO) is advanced by dynamically adjusting inertia weight combined with different mutation strategies, thus improving both convergence and optimization performance for deep learning models. Last but not least, this work integrates optimized Shuffle-GhostNet with Life Cycle Assessment, supporting real-time, data-driven sustainability assessment and product design decisions.
To the best of our knowledge, this is the first work that combines lightweight deep learning with enhanced metaheuristic optimization for sustainability modeling using LCA data. The proposed framework not only improves the accuracy and efficiency of environmental impact prediction but also supports sustainable design decision-making by identifying optimal product configurations with minimal ecological footprints.
2. Literature Review
There have been major advancements in artificial intelligence and machine learning in recent years, especially the use of these under the banner of sustainability engineering and design because of the spiking demand for real-time, accurate, scalable assessments vis-a-vis natural impacts.
Numerous works have demonstrated the usefulness of deep learning models in advancing the course of sustainability in manifold fields, including structural health monitoring, manufacturing systems, building energy management, and circular economy practices. These approaches, using advanced neural architectures, hybrid modeling strategies, and optimization procedures, seek, among other goals, to enhance prediction capability, minimize environmental footprints, and provide decision support in complex design and operational settings.
Nonetheless, many of the current solutions still face hurdles concerning computational efficiency, model interpretability, and adaptability to dynamic life cycle assessment (LCA) data. Additionally, despite the crucial nature of the timely evaluation of environmental impacts under product design in fostering informed decision-making, AI-LCA integration is largely unexplored.
This motivated us to propose a brand-new deep architecture, Shuffle-GhostNet, combined with an enhanced Hippopotamus Optimizer (HHO) to fasten the efficiency and accuracy of sustainability forecasting powered by an ever-so-smooth implementation of LCA data.
Agarwal et al. [11] investigated innovations in Structural Health Monitoring (SHM) by the integration of deep learning methodologies with conventional monitoring approaches. The researchers examined previous SHM methodologies that depended on manually designed features and statistical models, highlighting how advancements in computational capabilities and sensor integration have facilitated the development of more scalable and precise solutions. Their research introduced a hybrid model that integrates Deep Convolutional Neural Networks (CNNs) with multivariate linear regressors to autonomously identify, locate, and measure structural damage. Their methodology was evaluated using datasets from the Los Alamos DOF structure and the University of Chile, proving its efficacy in evaluating structural safety and fostering long-term sustainability.
Walk et al. [12] examined the capacity of deep learning to improve sustainability in manufacturing systems. They employed computer vision methodologies to determine the wear conditions of items, concentrating on machining tools and revolving X-ray anodes. Employing a U-Net architecture for semantic segmentation, they effectively identified wear patterns from microscopic images, attaining mean dice coefficients of 0.631 and 0.603. Their results facilitated enhanced decisions in production processes, including the optimization of machining parameters. Furthermore, life cycle studies indicated that their methodology decreased CO2 emissions by 12% and 44% for the two respective products. The investigation illustrated the potential of deep learning to enhance cleaner production and advocated for more incorporation of AI in sustainable product-service systems.
Shafiq et al. [13] introduced an AI-driven hybrid methodology to forecast sustainable performance in hybrid manufacturing and remanufacturing processes. Their ensemble model integrated CNNs, Random Forests, LSTM networks, and Gradient Boosting Machines inside a hybrid Life Cycle Assessment (LCA) framework. The model underwent training and testing over an 18-month duration, utilizing empirical data from three global automotive component production plants. In comparison to traditional LCA methodologies, their approach enhanced prediction accuracy by 23%, lowered RMSE by 18%, and shortened evaluation time by 31%. The model, with an R2 value of 0.89, substantially surpassed the classic LCA’s 0.44. Moreover, it tackled significant constraints of conventional approaches, diminishing uncertainty and enhancing granularity by 15% and 20%, respectively. Their research illustrated the capability of AI-integrated Life Cycle Assessment for instantaneous sustainability evaluation in accordance with Industry 4.0 and circular economy objectives.
Hussein et al. [14] created a predictive model for energy consumption in buildings and indoor climate by combining Convolutional Neural Networks (CNNs) with Layered Optimization Algorithms (LOA). Their methodology utilized sub-hourly data to facilitate real-time performance improvement, providing architects and engineers with advanced tools for energy-efficient building design. The integration of CNN’s spatial-temporal data processing with LOA’s feature selection considerably enhanced the model’s accuracy, evidenced by elevated R-squared values and diminished Mean Absolute Error. Their findings indicated that machine learning could proficiently identify intricate correlations between energy use and indoor environmental factors. The research offered a comprehensive and practically applicable approach for sustainable building management and emphasized the potential of sophisticated AI methodologies in revolutionizing architectural engineering practices.
Iqbal et al. [15] discussed the issues of resource inefficiency and technological waste by incorporating Internet of Things (IoT) technology into the management of household appliances, particularly microwave ovens, in the context of the circular economy (CE). A system was designed for real-time monitoring of essential operating parameters, including voltage, current, and mechanical operations, utilizing sensor-based data collection. This data facilitated predictive maintenance and life cycle assessment models that classified components according to circular economy principles such as reuse, repair, remanufacturing, and cascade. Utilizing machine learning models like Gradient Boosting, Random Forest, and Decision Trees, they forecasted the residual values of IoT-enabled radios, with Random Forest demonstrating the greatest accuracy. Their research illustrated the capability of integrating IoT and AI to enhance product longevity, minimize waste, and encourage more sustainable resource utilization in household appliances.
In summation, these studies shed light on the opportunities that AI and deep learning present for sustainable engineering and product design. Extending from structural health monitoring to energy-efficient building design and circular economy considerations, these investigations demonstrate how intelligent models can enhance environmental performance, minimize waste, and maximize resource use.
A recurring limitation among the majority of these studies, however, is their use of conventional deep learning architectures and optimization techniques, which are not always the best suited for the unique characteristics of LCA data, high dimension, class distribution imbalance, and non-linear relationships between design variables and environmental outcomes.
In addition, although certain techniques employ multiple AI models or hybrid frameworks, their lack of effective automatic feature learning and parameter tuning and architectural optimization is detrimental to optimal performance on predictive sustainability modeling.
This motivates the construction of the Shuffle-GhostNet deep learning architecture, which is lightweight and powerful, merging GhostNet and ShuffleNet for efficient feature extraction whilst adapting its hyperparameters using an Enhanced Hippopotamus Optimizer (HHO) for improved convergence behavior.
Addressing the key limitations of existing methods, we amalgamated the optimized model with LCA data, presenting an accurate, scalable, and interpretable solution for sustaining assessment in product design in real-time.
3. Methodology
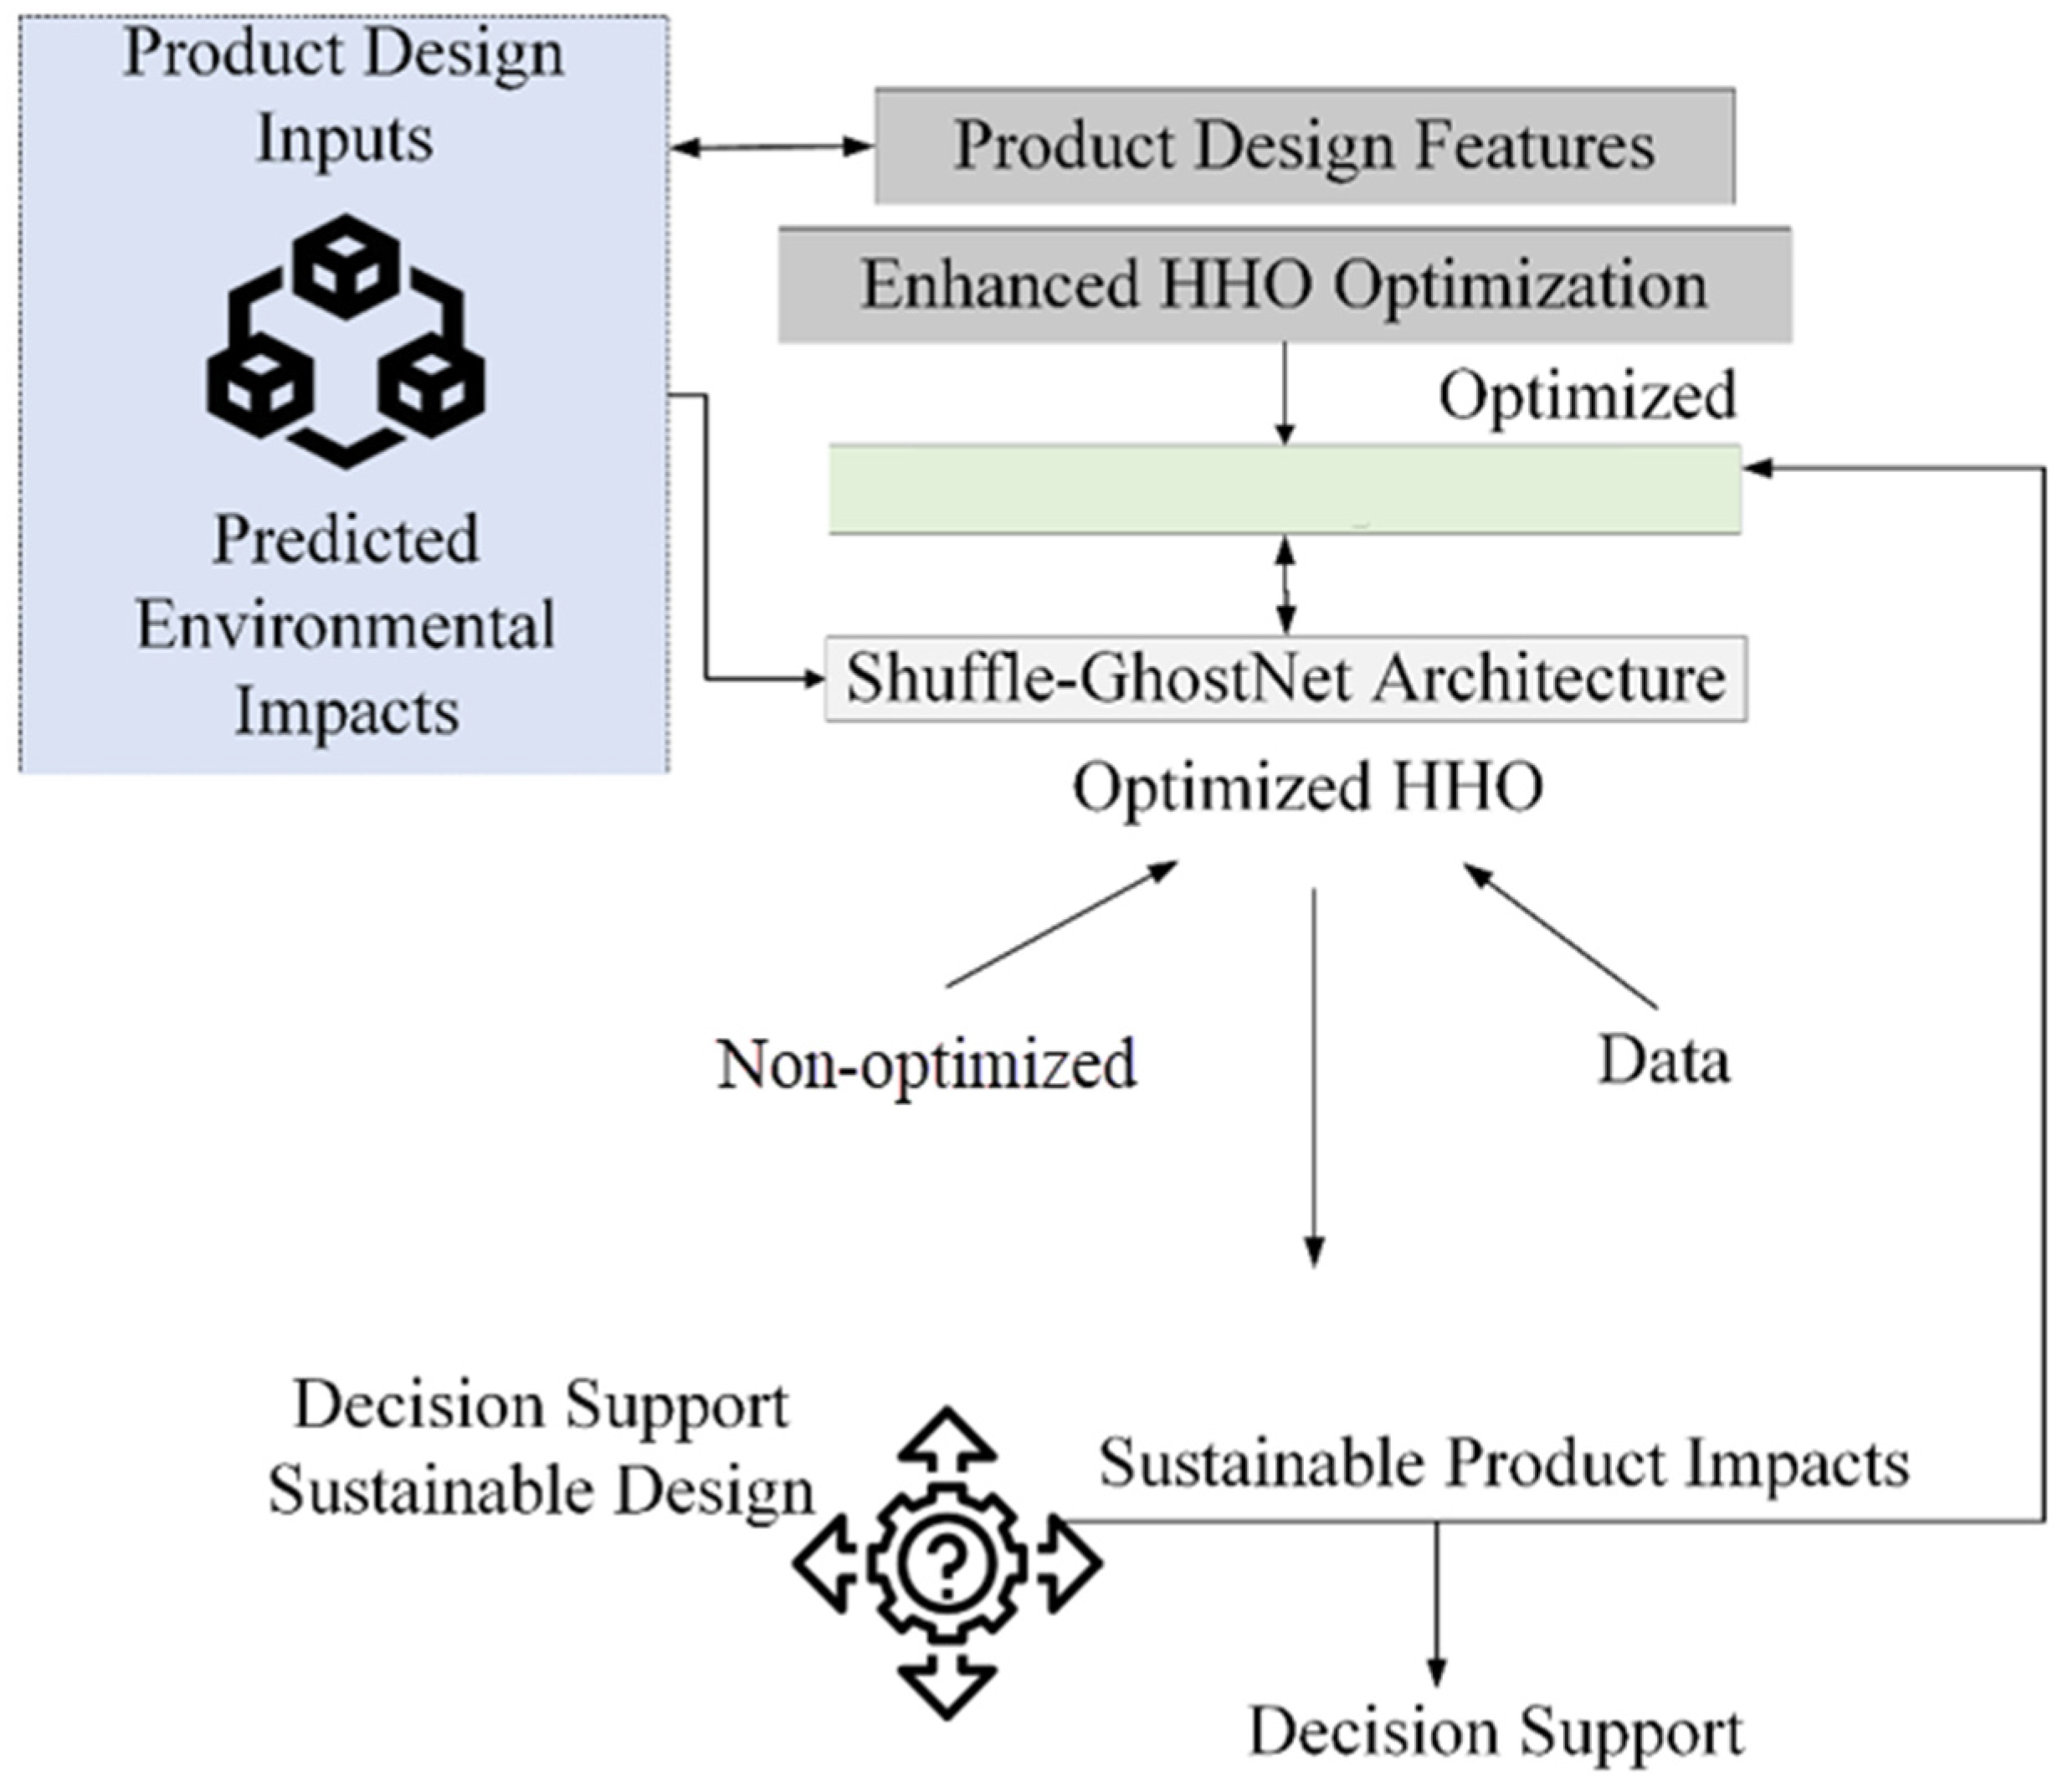
Figure 2 provides the conceptual representation of the Shuffle-GhostNet framework merged with Enhanced HHO optimization and LCA for sustainable product design, further illustrating the sequential flow of data from initial product design features through major processing stages to final decision support. The process begins with the inputs of product design features, followed by feature preprocessing to normalize and prepare the data, followed by passing through the Shuffle-GhostNet architecture for feature extraction and classification.
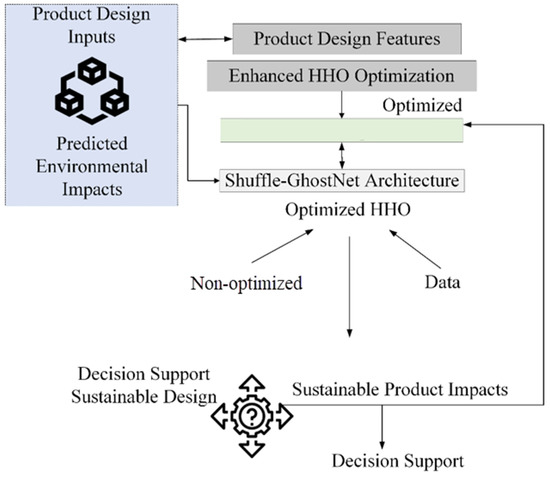
Figure 2.
Conceptual representation of the Shuffle-GhostNet framework merged with enhanced HHO optimization and LCA for sustainable product design. The proposed framework’s end-to-end workflow is represented by the following flowchart: (1) preprocessed and normalized product design parameters (material, manufacturing, and end-of-life strategies); (2) environmental impact prediction (e.g., CO2eq, energy use) by the Shuffle-GhostNet architecture with high accuracy and low computational cost; (3) hyperparameter tuning, which automatically maximizes predictive performance in EHHO; (4) feedback as actionable recommendations for sustainable design options. This integration allows for real-time, continuous sustainability assessments for feedback between engineering design and environmental impact evaluation.
From structured input features (material composition, manufacturing methodology, and end-of-life methodology) generated from product design, the workflow proceeds with the features preprocessed and normalized into the Shuffle-GhostNet architecture for extracting features with high accuracy and less computational cost.
The Enhanced Hippopotamus Optimizer (EHHO) tunes important hyperparameters (learning rate, batch size, dropout, and kernel size) with a view to minimizing validation loss across many training epochs. Its optimally trained model is then capable of predicting multi-dimensional environmental impacts, such as CO2eq and energy use; these predictions are subsequently returned to the design alternatives and converted into actionable eco-design recommendations, which allow for rapid, iterative, quantifiable sustainability decisions during the up-front stages of product development.
After, the enhanced HHO algorithm optimizes the model parameters to improve accuracy and efficiency, leading to the prediction of the environmental impacts based on Life Cycle Assessment (LCA), which are then used to give actionable decision support for more sustainable product design outcomes. The following provides a detailed explanation of the proposed methodology.
3.1. Architecture
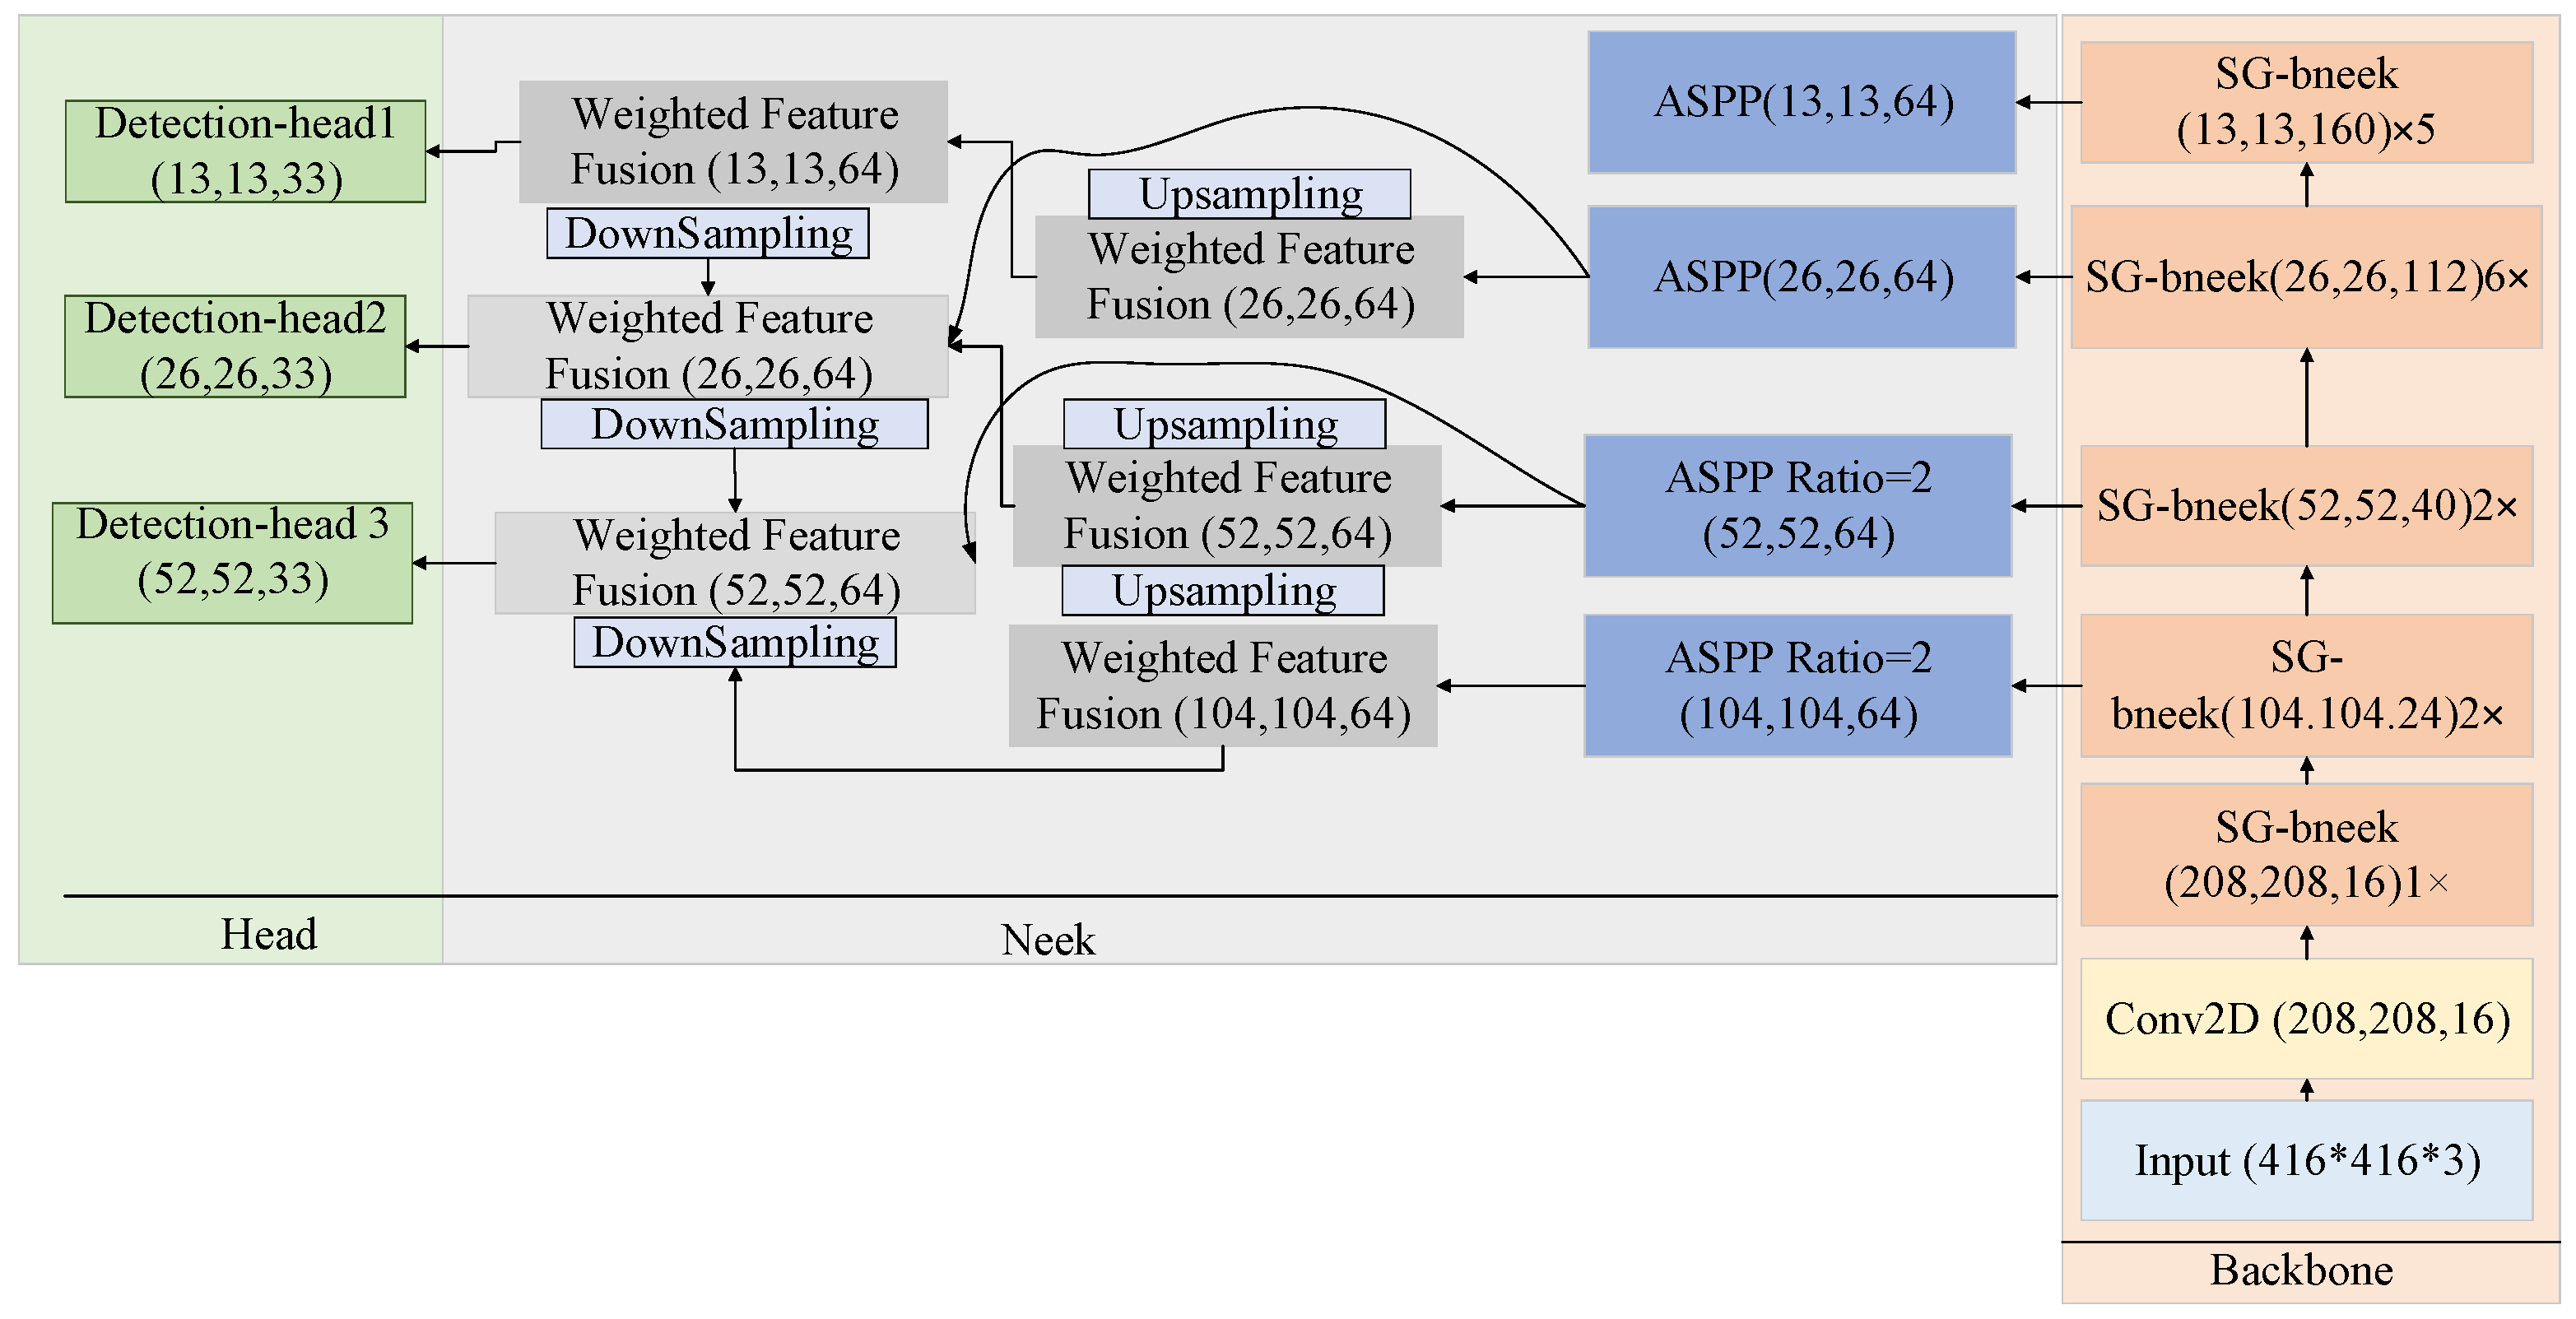
Figure 3 depicts the framework of the suggested SG-Det that adheres to the one-phase diagnosis methodology through segmenting the model into three components, including the backbone, head, and neck. Considering the backbone portion of the network, a new lightweight categorization architecture has been introduced, known as Shuffle-GhostNet, which is composed of several bottlenecks of Shuffle-Ghost [16].
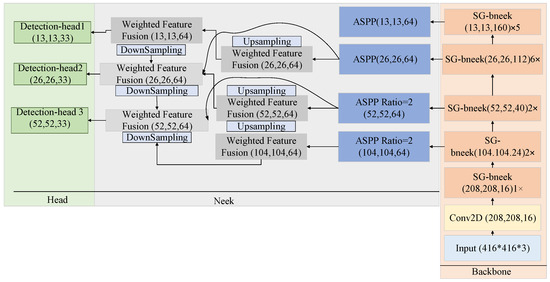
Figure 3.
Architecture of the suggested SG-Det: a three-level network re-architectured to predict LCA-related prediction [17].
The design of the bottleneck of Shuffle-Ghost looks like a residual model, comprising two modules of a stacked suggested model. Furthermore, the channel shuffle operation has been implemented to enhance the stream of data across distinct groups of attributes. In the neck segment of the network, a feature pyramid with four layers has been established through integrating the modules of ASPP and BiFPN-tiny, utilizing three layers to extract features and reserving a layer to improve attributes pertaining to tiny objects.
Low-level attributes comprehend complicated details like local textures and characteristics, while high-level attributes emphasize the extraction of abstract traits and global semantic data. To employ the advantages of both, the neck model combines high-level and low-level features, leading to enhanced efficacy. Considering the head model, three groups of bound boxes have been created in various sizes, including small, medium, and large, to facilitate the diagnosis of objects of diverse dimensions.
The diagram above shows the three-stage architecture of the SG-Det model, which is modified here for making LCA predictions: 1. Backbone: Shuffle-GhostNet extracts hierarchical features from input design vectors. 2. Neck: The BiFPN-tiny + ASPP module combines multi-scale features for deeper representative structural capacity without incurring more computation costs. 3. Head: A multi-head regression layout that outputs continuous values for environmental impact (e.g., GWP, PED) instead of class labels, in turn leading to a more accurate quantitative prediction in line with those metrics for LCA. Note: While designed for object detection originally, this framework has now been repurposed as a regression head for modeling sustainability.
3.1.1. Backbone
The backbone typically utilizes operations like pooling and convolution for the extraction of features at different levels from the input. To create an efficient and practical backbone, an innovative lightweight classification network has been introduced, named Shuffle-GhostNet.
Common convolutional networks often produce a significant quantity of extra intermediate feature maps throughout their calculation. Identical feature maps have been highlighted by boxes that have the same color, showing that the combination of feature maps is superfluous.
Pairs of feature maps that show correspondence have been known as “ghosts”, and these superfluous intermediate feature maps are crucial for improving the model’s feature extraction capacity throughout real reasoning work. The fundamental idea of Shuffle-GhostNet is that although these superfluous middle feature maps are essential and do not get discarded, the convolution processes needed to create them can be performed utilizing lighter approaches.
In the original GhostNet, various locations use depthwise convolution and group convolution to significantly reduce the model’s computational intricacy in comparison with conventional object diagnosis techniques. However, several components lack cohesion and seem to be crafted in separation more willingly than as an integrated unit.
To resolve these concerns, the article presents Shuffle-GhostNet, which improves upon GhostNet by implementing a more thorough methodology that fully utilizes the advantages of collection convolution to enhance the flow and exchange of data within the groups.
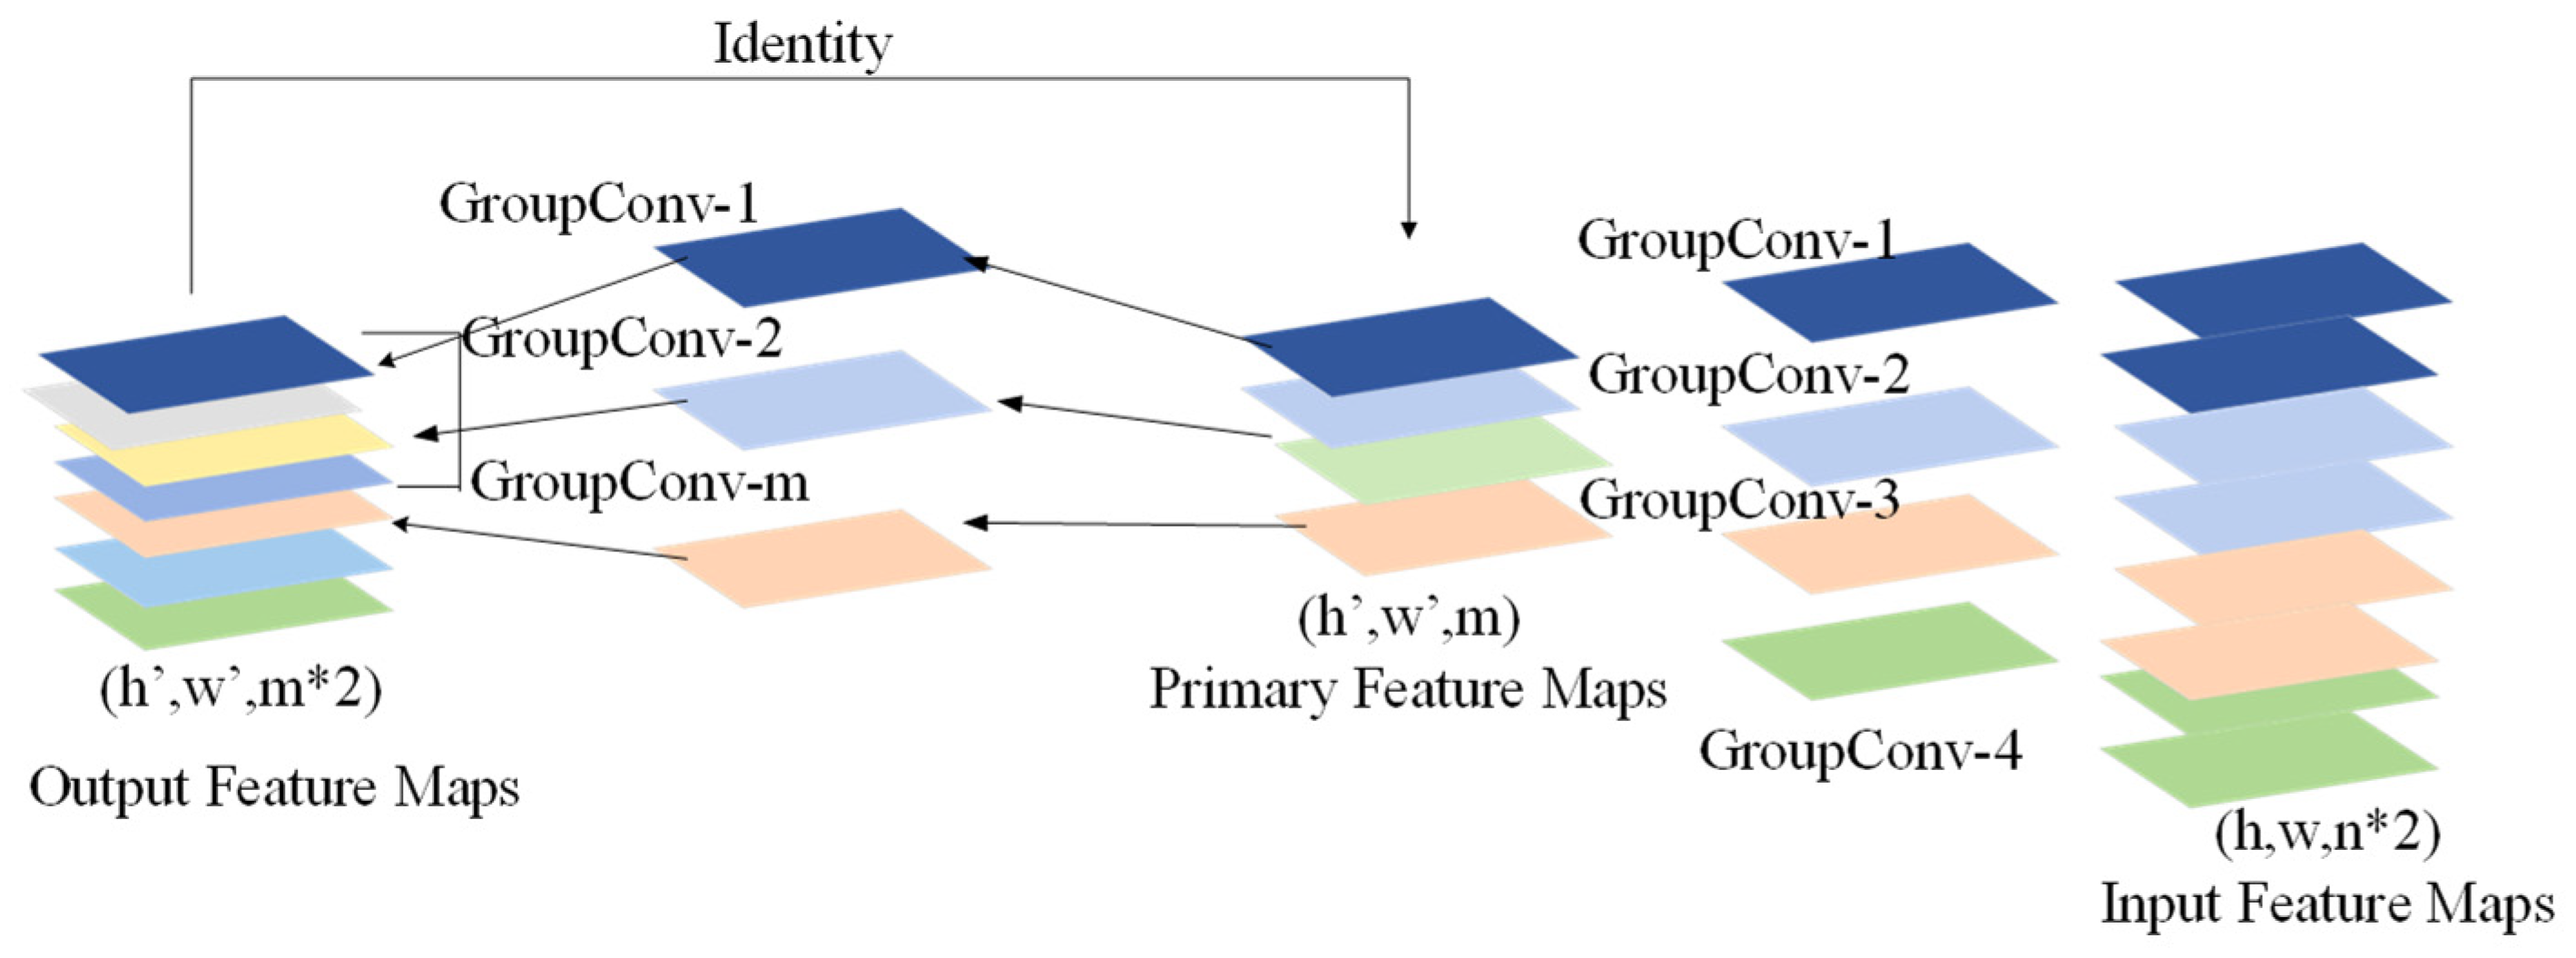
The original module of GhostNet employs a 1 × 1 convolution as its main convolution method to modify the dimension of the channel, efficiently minimizing the model parameters in comparison with 5 × 5 or 3 × 3 convolutions. Nevertheless, the association between the inexpensive convolution and the primary convolution design required improvement. To create more effective feature extraction modules, the Shuffle-Ghost module has been introduced, illustrated in Figure 4.
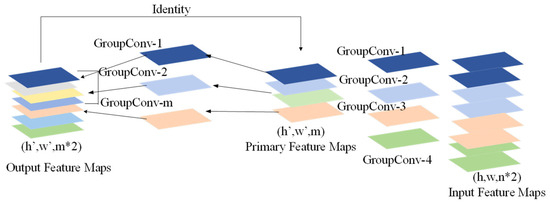
Figure 4.
The module of Shuffle-Ghost [2]. It is called the Shuffle-Ghost module mainly because (1) it constitutes the Ghost Convolution, which creates large numbers of feature maps using inexpensive linear operations rather than expensive convolutions, leading to dramatic parameter reductions, and (2) there is Channel Shuffling, where groups of channels are grouped in a group convolution and randomly assigned to another group after having passed through them, thus being able to break information isolation among channels and enhancing cross-feature communication. These two mechanisms facilitate lightweight but powerful feature extraction essential for sparse, non-linear LCA datasets, where conventional CNNs perform poorly or overfit.
The main convolution has been enhanced to a 1 × 1 collection convolution, featuring two diversities according to the number of channels within the approach. Definitely, the collection convolution has been executed in two scenarios; once the quantity of groups is either two or four.
Once there exist only two groups, the data within the groups tends to become too concentrated, making it difficult to fully utilize the benefits of collection convolution. In the present scenario, the advantages of the collection convolution approach might not be clear. Through expanding the quantity of feature groups to four, the information can be distributed more effectively, leading to more efficient convolutions.
By modifying the module of Shuffle-Ghost from the main convolution to the collection convolution, the flow of information has been improved between the inexpensive convolution and the primary convolution, and the number of variables is minimized within the model at the same time.
The Shuffle-Ghost bottleneck has been developed, which is inspired by the module of Shuffle-Ghost that mirrors the fundamental residual block found within ResNet. The bottleneck mainly consists of two modules of stacked Ghost, where the first is a layer of expansion that raises the dimension of the channel, while the second decreases the dimension of the channel to match the residual linking.
Within the Ghost bottleneck featured within GhostNet, a depthwise convolution has been included between the two Ghost modules when the stride is set to 2 for the purpose of downsampling. Depthwise convolution is a common technique employed in lightweight approaches like Xception and MobileNet and requires less computational power compared to standard 3 × 3 and 1 × 1 convolutions.
The depthwise convolution must be aligned with the group convolution utilized in various sections of GhostNet, as it may lead to a loss of features when reducing the size of the map of features. To solve this problem, the bottleneck of Shuffle-Ghost has been introduced, where group convolution has been substituted by depthwise convolution, assigning the quantity of groups to four in order to maintain consistency in the main convolution. Additionally, a module of channel shuffle has been added following the collection convolution to improve the flow of information and improve the model’s ability to represent various groups of channels.
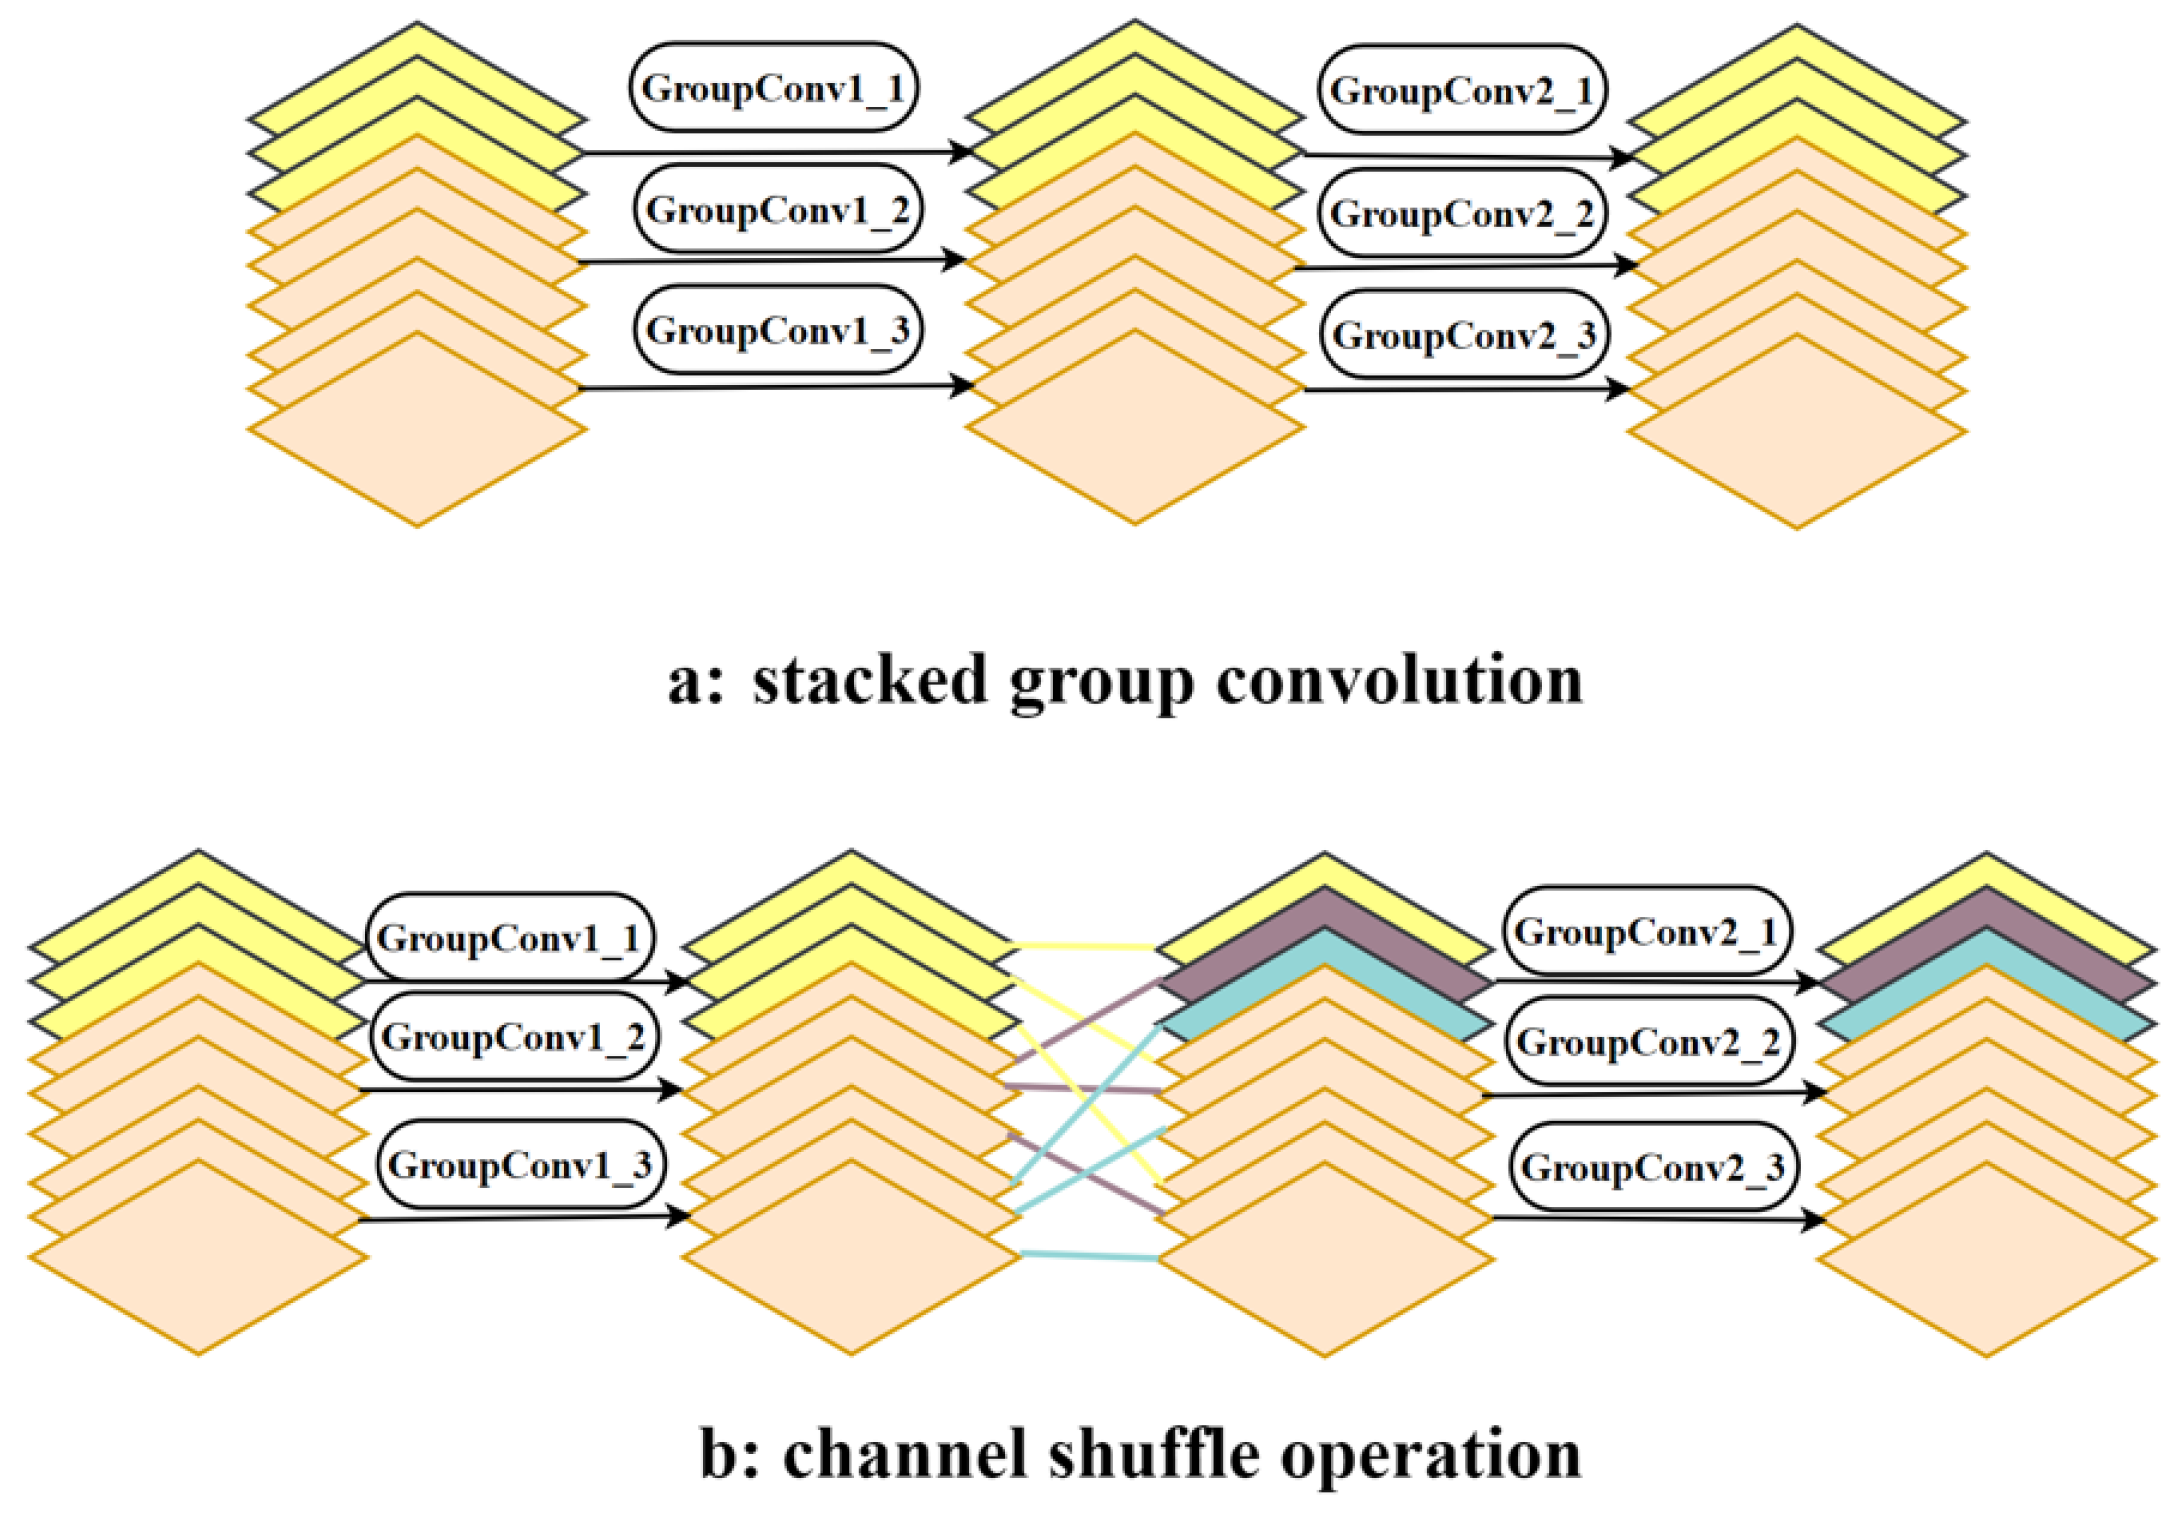
While stacking several convolutions of groups, an issue emerges where the output from a specific portion of the channels is achieved from a segment of the channel of input. To solve this problem, the channel shuffle operation has been introduced within the Shuffle-Ghost bottleneck, maximizing the use of channels’ features.
Figure 5a illustrates the scenario when group convolution has been layered. In this case, the group convolution has three groups; for example, GroupConvN_M, where N represents the quantity of group convolutions, and M represents which specific group within the convolution of the group. To exemplify, GroupConv1_1 refers to the operation of convolution performed by the initial group within the initial convolution of the group. The outcomes of the output of the initial group have been solely connected to the input of the initial group, and this pattern continues, which restricts the exchange of information between distinct groups.
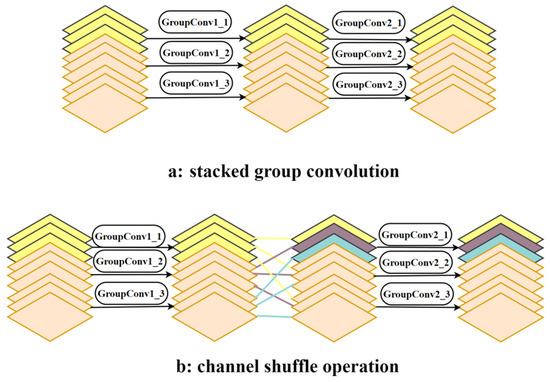
Figure 5.
Channel shuffle [17]. The original BiFPN features five layers for multi-scale feature fusion but is overly heavy for a real-time tool design. Instead, we propose BiFPN-tiny, a lighter version reduced to three feature fusion layers to reduce inference time. An auxiliary shallow fusion layer (shown in the dashed box) is introduced, which is applied during training to compensate for the loss of detail from the absence of shallow layers. However, it is removed from inference to save time. Different from a normal BiFPN, our model applies the fusion block just one time, with speed and scalability priorities for the edge/cloud deployment in industrial design workflows.
To improve the connectivity among groups of channels, the channel shuffle technique separates each channel set into several subgroups. Then, it distributes these subgroups to all groups within the subsequent layer.
As illustrated in Figure 5b, the initial group has been divided into three subgroups, which have then been assigned to the three groups within the next layer, with the same approach applied to the other groups. This strategy allows the output from the convolution of a group to derive from the input of various sets, facilitating information transfer among a variety of groups.
To develop Shuffle-GhostNet, the layers of the Shuffle-Ghost bottleneck have been stacked. It is important to mention that, in the initial version of GhostNet, a convolution with 1 × 1 has been incorporated after the ultimate bottleneck of Ghost to enhance dimensionality.
For the lightweight indicator of an object, merely raising the channels to six has a considerable effect. Considering the suggested model, it was decided not to use excessively high-dimensional channel generation.
As an alternative, the feature pyramid was linked to the final four bottlenecks of Shuffle-Ghost to strengthen the attributes and make up for the lack of information in the channel.
3.1.2. Neck
The neck acts as a crucial link between the head and backbone, playing a significant part in handling and integrating the attributes obtained via the backbone to enhance diagnosis tasks. In this study, a compact feature pyramid has been introduced, referred to as BiFPN-tiny, and incorporated with the module of ASPP to function as the neck segment of the model.
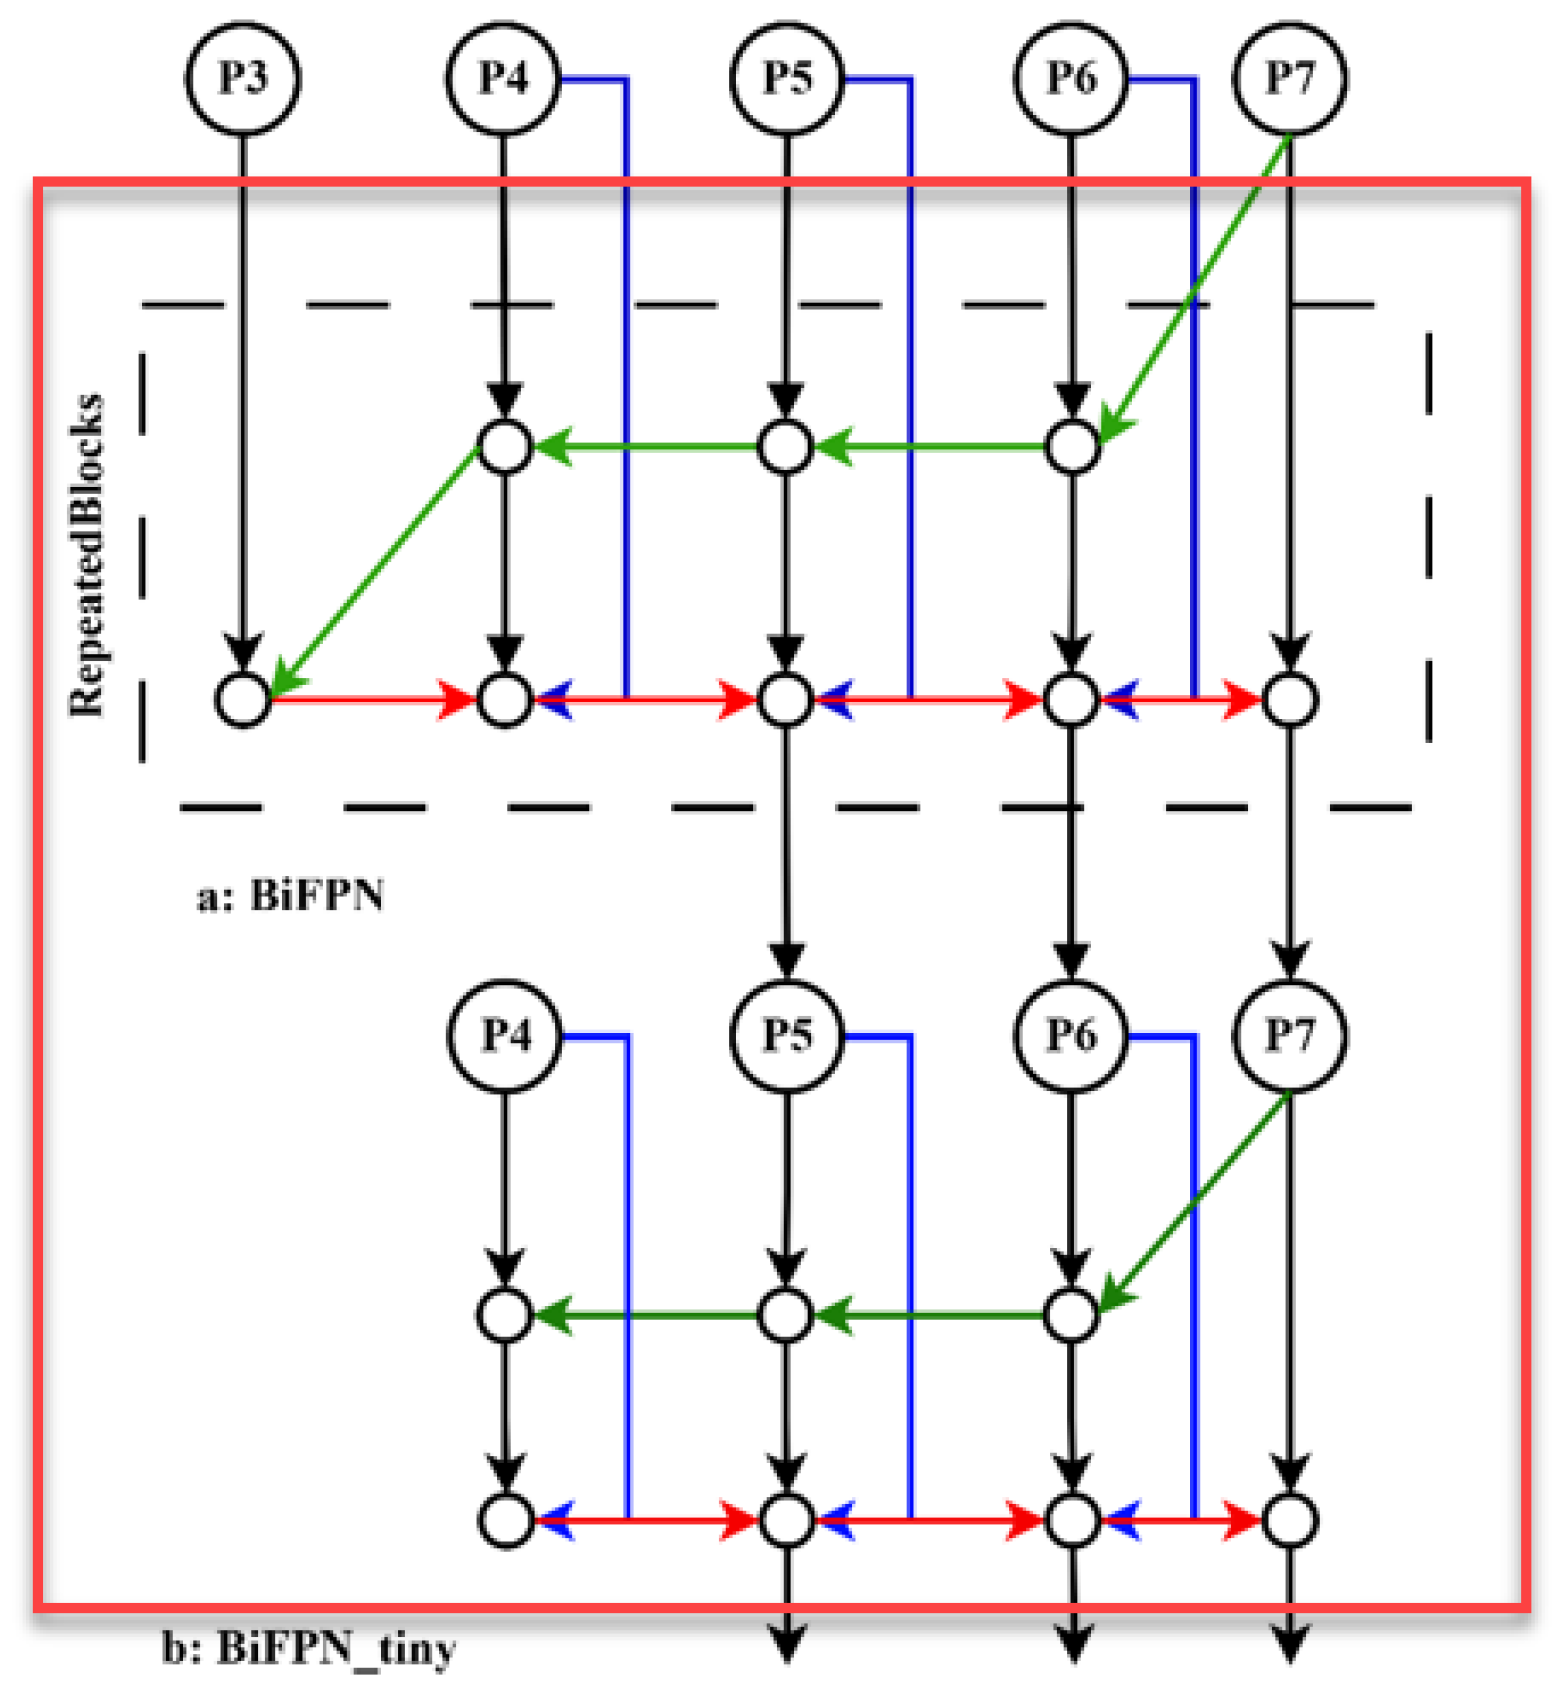
Figure 6 illustrates both the suggested BiFPN-tiny and BiFPN. Although the original BiFPN utilizes five layers for the extraction of features to ensure efficient feature processing, this setup can be somewhat superfluous and fails to account for the specific characteristics.
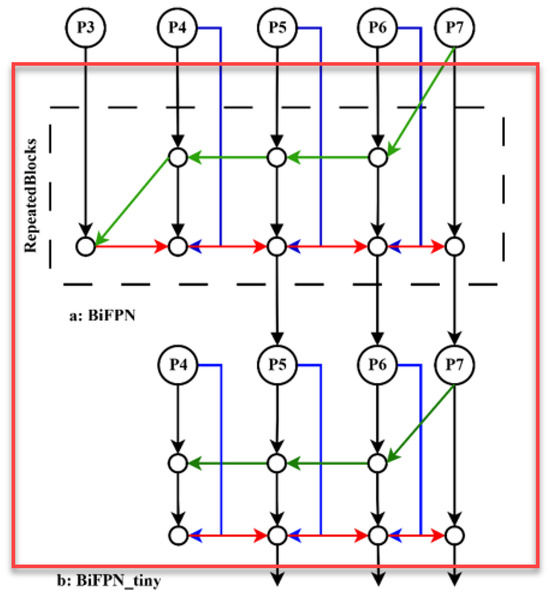
Figure 6.
The architecture of the suggested BiFPN-tiny and BiFPN.
In the preliminary design of BiFPN-tiny, it was sought to develop a lighter approach by decreasing the layers of feature extraction to three. Nevertheless, the choice had a drawback since eliminating the shallow feature extraction layer decreased the ability of the model to effectively extract features of small objects.
To facilitate efficient feature extraction at different scales, a shallow feature layer has been implemented, specifically tasked with merging features from tiny objects. This layer does not exist in the ultimate inference process but serves as an intermediary stage to guarantee optimum extraction of features. Additionally, contrary to the BiFPN, reiterating the BiFPN multiple times in accordance with varying resource limitations, the model utilizes the BiFPN-tiny just for one time to satisfy the demands for inference time and lightweight design. On the other hand, this has led to inadequate feature extraction capabilities, resulting in a drop in accuracy.
To improve the feature extraction capabilities of the approach, the convolution with the 1 × 1 modification module preceding BiFPN-tiny has been substituted by the module of ASPP. The module of ASPP utilizes atrous at various rates of sampling for the input, allowing it to capture features with multiple scales and enhancing the method’s feature extraction efficacy.
Additionally, to accommodate the diverse widths and heights of input features within all layers of BiFPN-tiny, a higher rate of sampling (12, 24, 36) has been applied for shallow features that have greater widths and heights, while a lower sampling rate (6, 12, 18) has been implemented for deep features that have reduced widths and heights.
By employing various receptive fields to gather distinct feature data for diverse layers of scale features, the quantity of channels can be modified during feature fusion to enhance the accuracy of the model. In comparison with the standard BiFPN, the feature pyramid derived from combining the ASPP and the suggested BiFPN-tiny demonstrates a stronger extraction capability of features and quicker reasoning speed.
3.1.3. Head
The head functions as the eventual component of the diagnosis approach, tasked with identifying the object through the map of features. Usually, the head consists of a classifier that determines the category of object and a regressor that estimates the entity’s dimensions and location.
Within the head, three diverse forecasting heads have been employed to produce precise forecasts for attributes across different scales. Considering each forecast head, three boxes of anchors have been created with varying sizes and proportions to accommodate objects of various dimensions, ensuring optimal entity bounding box generation. Consequently, the tensor dimension of this part is represented as N × M × [3 × (4 + 1 + 6)], where M and N denote the tensor’s width and length, respectively. Here, three signifies the quantity of predefined anchor boxes, four stands for the offsets of the bounding box for predicting the situation, one indicates the confidence of the object for class forecasts, and six refers to the classes of entities present in the dataset.
Afterwards, the dimensions and position of the forecasted bounding box have been interpreted on the basis of the data of the entity in the forecast head and ultimately combined with the true bounding box with NMS (Non-Maximum Suppression) to eliminate the wrong predictions.
On one hand, this work incorporates the standard components such as GhostNet for effective feature generation, ShuffleNet for cross-channel communication among the acquired feature maps, and the Hippopotamus Optimizer (HHO) for hyperparameter settings. However, the novel contribution does not lie merely in the combination of all these different elements; rather, it lies in the specific synergistic alignment of these elements toward overcoming the unique challenges pertaining to Life Cycle Assessment (LCA) data: its high dimensions and the non-linear relationships between design parameters and environmental impacts that need to be taken into consideration, and lastly, the critical need for computation efficiency in iterative design workflows.
Thus, lightweight enough for real-time deployment on a cloud-based or edge design platform, the Shuffle-GhostNet architecture had sufficient representational power to capture the subtle, non-linear patterns that exist in sparse LCA datasets beyond the capability of conventional CNNs. Because the Ghost modules above reduce redundant feature maps inherent in material composition data, and because the Shuffle operations break silos for grouped channels, richer feature recombination, critical to modeling complex interactions, such as how a change in manufacturing process interacts with end-of-life recycling rates, becomes a possibility.
Enhanced HHO (EHHO), on the other hand, was much more than a black-box tuner. Instead, it was fundamentally adapted to a dynamic inertia weight and a hybrid mutation strategy to navigate the highly complex, multimodal optimization terrain of deep learning hyperparameters trained on heterogeneous LCA data, preventing premature convergence to suboptimal configurations, a shortcoming that hounds standard HHO and other metaheuristics in the context.
Shuffle-GhostNet guarantees that computational efficiency derives the maximum from optimal hyperparameter settings, generated by EHHO, in a unified framework where the strength of each is amplified by the others, and hence, such excellent observables as R2 = 0.943 and rapid convergence, a singular achievement for either component in LCA tasks, completely justify the targeted-purpose fusion induced herein.
3.2. Enhanced Hippopotamus Optimizer (HHO)
The HO has identified three noteworthy hippopotamus behavioral patterns. A cohesive hippo group is composed of the dominant male hippo (herd leader), a few adult male hippos, numerous hippo infants, and numerous adult female hippos [18].
Young hippos and offspring frequently deviate from the primary herd as a result of their inherent curiosity. If they deviate from the group, they may become isolated and vulnerable to predators. When predators attack, other animals approach, or their territory is invaded, hippopotamuses will employ their second defensive behavior.
Hippos exhibit defensive behavior by turning to face the attacker and using their powerful jaws and noises to intimidate and reject them (Figure 7).

Figure 7.
The hippopotamus’s defensive behavior against the predator: This biological illustration represents the seminal reference for Stage 2 of the Hippopotamus Optimizer (HHO) when facing a threat: the hippopotamus turns toward the predator, vocalizes loudly, and advances aggressively. In the algorithm, this behavior is modeled as a defensive movement when distance becomes below a threshold toward the “predator” or poorest solution in the population. The optimizer thus exits local minima through actively confronting poor solutions, adding to global exploration and preventing premature convergence in complex hyperparameter landscapes.
In order to prevent injury, predators like spotted hyenas and lions will intentionally avoid contact with a hippopotamus’s powerful canines, as they are cognizant of this behavior.
The final habit is the hippo’s innate inclination to avoid areas that may be hazardous and to retreat from predators. In these circumstances, the hippo will attempt to locate the nearest body of water, whether it be a river or a reservoir, as spotted hyenas and lions rarely enter the water.
3.2.1. Mathematical Modeling of HO
Hippopotamuses are the search agents of the population-based optimization method known as HO. These animals are candidate solutions of the present optimization challenge since their positional shift in the solution space correlates to the values of the HO optimizer’s decision variables.
Each hippopotamus is therefore represented as a vector in the modeled system, and the population of hippopotamuses has been described as a matrix. Like other optimizers, the first step of HO is to generate a random initial solution. Consequently, the subsequent formula has been utilized to establish choice parameters:
Here, r is a stochastic amount ranging from one to zero, χ_i is the location of the ⅈth individual solution, and ub and lb are the maximum and minimum bounds of the decision variable j. The matrix of population has been defined in Equation (1), where N is the number of animals in the group, and m is the quantity of decision variables within the issue.
Stage 1: The location of the individuals in the river or wetland has been revised (Exploration). A herd of hippos is composed of multiple adult females, multiple offspring, multiple adult males, and multiple dominant males (herd leaders).
The dominant hippopotamus can be determined by the value of the objective function iterations, which are the lowest in the case of minimization and the uppermost in the case of maximization. Hippos are generally located close to each other. Male hippos who are dominant in nature safeguard their territories and herds from external threats. The male hippos have been encircled by a large number of female hippos.
The dominant male hippopotamuses chase the other males out of the herd once they reach adulthood. In order to establish their own dominance, this evicted male hippopotamus must either recruit females or compete with other established males in the herd. In the following, a mathematical formulation for the situation of the males within the group in the lake (or wetland) has been given.
where is the position of the male hippopotamus, while is the position of the dominant hippopotamus (the hippopotamus with the lowest cost in the iteration ). is a stochastic number ranging from zero to one, and are integer ranges between two and one, and has been a stochastic vector ranging from one to zero.
The average values of the selected individuals similar to stochastically chosen individuals that have an equivalent possibility of containing the present individual are denoted by , while has been a stochastic number ranging from zero to one.
where and are integer stochastic numbers that can be either one or zero, the positioning state of female or adolescent hippopotami is determined by within a group. Young hippos are frequently in close proximity to their mothers, despite the fact that their innate curiosity occasionally allows for spaces between them, or the adolescent becomes so engrossed in being a hippo that it completely separates from the group. The value of is greater than 0.6 when a juvenile hippo separates from its mother (refer to Equation).
In addition, the juvenile hippo may have separated from its mother but continue to reside in or near the group if the value of is greater than 0.5 (as it is limited to values between one and zero). But if is less than 0.5, the juvenile hippo is also considered to have separated from the group. The behavior that was developed in the antecedent section is described by the formulas.
The ℏ formula determines that and are selected from five random values or vectors. Moreover, is an additional random number between 0 and 1. The cost function value control the position updates for both male and female or immature hippos.
Through improved global search capabilities and improved exploration, the vectors, and cases, contribute to the proposed algorithm’s improved exploration.
Stage 2: (exploration or hippopotamus defense against predators). Safety and security are two of the main reasons for the hippopotamus’s herd. It may be more effective to keep predators away from a herd of huge, heavyweight animals.
However, because of their curiosity and immaturity, which indicates that they are still weaker than adult hippos, hippopotamuses may stray from the group and be possible prey for spotted hyenas, lions, and Nile crocodiles. The primary defense mechanism is the hippopotamus’s ability to turn and vocalize loudly in order to frighten away potential predators. In order to effectively scare off the possible threat, hippopotamuses may approach the predator at this phase of the process to encourage their withdrawal. Equation (11) represents the predator’s location in the search space.
The distance between the hippopotamus and the predator is shown by Equation (12). The hippopotamus now defends itself from the predator by acting defensively depending on the factor . In the event that , is smaller than , representing that the hunter is adjacent to the hippo, the hippo rapidly turns toward the hunter and approaches it to force the predator to back off. A greater indicates that the hunter is farther from the territory of the animals. Although its range of motion is limited, the hippopotamus nonetheless turns toward the predator in this scenario. It serves to notify the predator or invader that it is inside its domain.
The hippopotamus location known as was exposed to predators. Indeed, is a Levy-distributed stochastic vector that is used to represent abrupt and random shifts in the predator’s position following a hippo attack. Here, the Lévy equation was used to represent the random movement. Equation (15) computes the mathematical model for Lévy movement in random movement. The numerals and are arbitrary.
The uniform random numbers , , and are uniformly distributed between two and four, one and one point five, and two and three, respectively. A homogeneous random number between 1 and −1 is specified by . Furthermore, has been a stochastic vector of size . Actually, a hippo has been hunted and will be replaced by another hippo in the herd if is greater than .
If not, the hippo will rejoin the herd and the hunter will get away. During the second phase, significant improvements were made to the worldwide search process. As a result of the complementary effects of the first and second phases, improvements were found and the probability of staying in the local minima decreased.
Stage 3: Hippopotamuses employ exploitation to evade predation. Another potential response of the hippopotamus to a predator is when it is unable to deter the predator with its defensive behavior or encounters multiple predators. The hippopotamus will now endeavor to depart the location.
Typically, hippopotamuses attempt to flee to the closest lake in order to evade being harmed by hunters, as hyenas and spotted lions endeavor to evade entering lakes and ponds. This strategy allows the hippo to identify a secure location in close proximity to its present situation.
By replicating the current manner in Phase 3, the hippo can effectively employ local search capabilities. This behavior is simulated by establishing a random location in close proximity to the hippopotamus’s present location.
This is accomplished in conformity with Equations (16) to (19). If the hippopotamus is situated in a secure location in close proximity to its current location, it will relocate, and the newly established position will have a lower cost function value. The iteration of position construction is denoted by , which stands for MaxIter.
It was determined that the closest safe hippopotamus was located at . From the three cases listed in Equation (18), is a stochastic vector or number. The more realistic search scenarios will aid in a more local search and improve the quality of the suggested algorithm’s exploitation.
A random vector with values between one and zero is specified by in Equation (18). The stochastic numbers and are produced between one and zero. Finally, is a stochastic number with a normal distribution.
Despite the fact that this would enhance the modeling of hippopotamus nature, we refrained from dividing the candidates into three distinct groups, male, female, and immature, to modify the population. This decision was made to avoid a substantial degradation of the optimization process.
3.2.2. Process of Repetition, and Flowchart
After every iteration, the optimizer changes every member of the population according to phases one through three of the process. After a cycle of population updates is finished in compliance with formulas, the repetition process will continue until the last iteration.
3.2.3. Enhanced Hippopotamus Optimizer
To enhance the Hippopotamus Optimizer such that more balance is given to exploration and exploitation, some modifications can be envisaged. Such adjustments will ensure a better balance between exploration (of searching alternative regions of the search space) and exploitation (refinement of solutions within the considered regions). The new algorithm will be called the Enhanced Hippopotamus Optimizer (EHO).
Its basic form switches between exploitation and exploration phases. This can work, but at the same time, it may cause premature convergence or insufficient exploration. To tackle these issues:
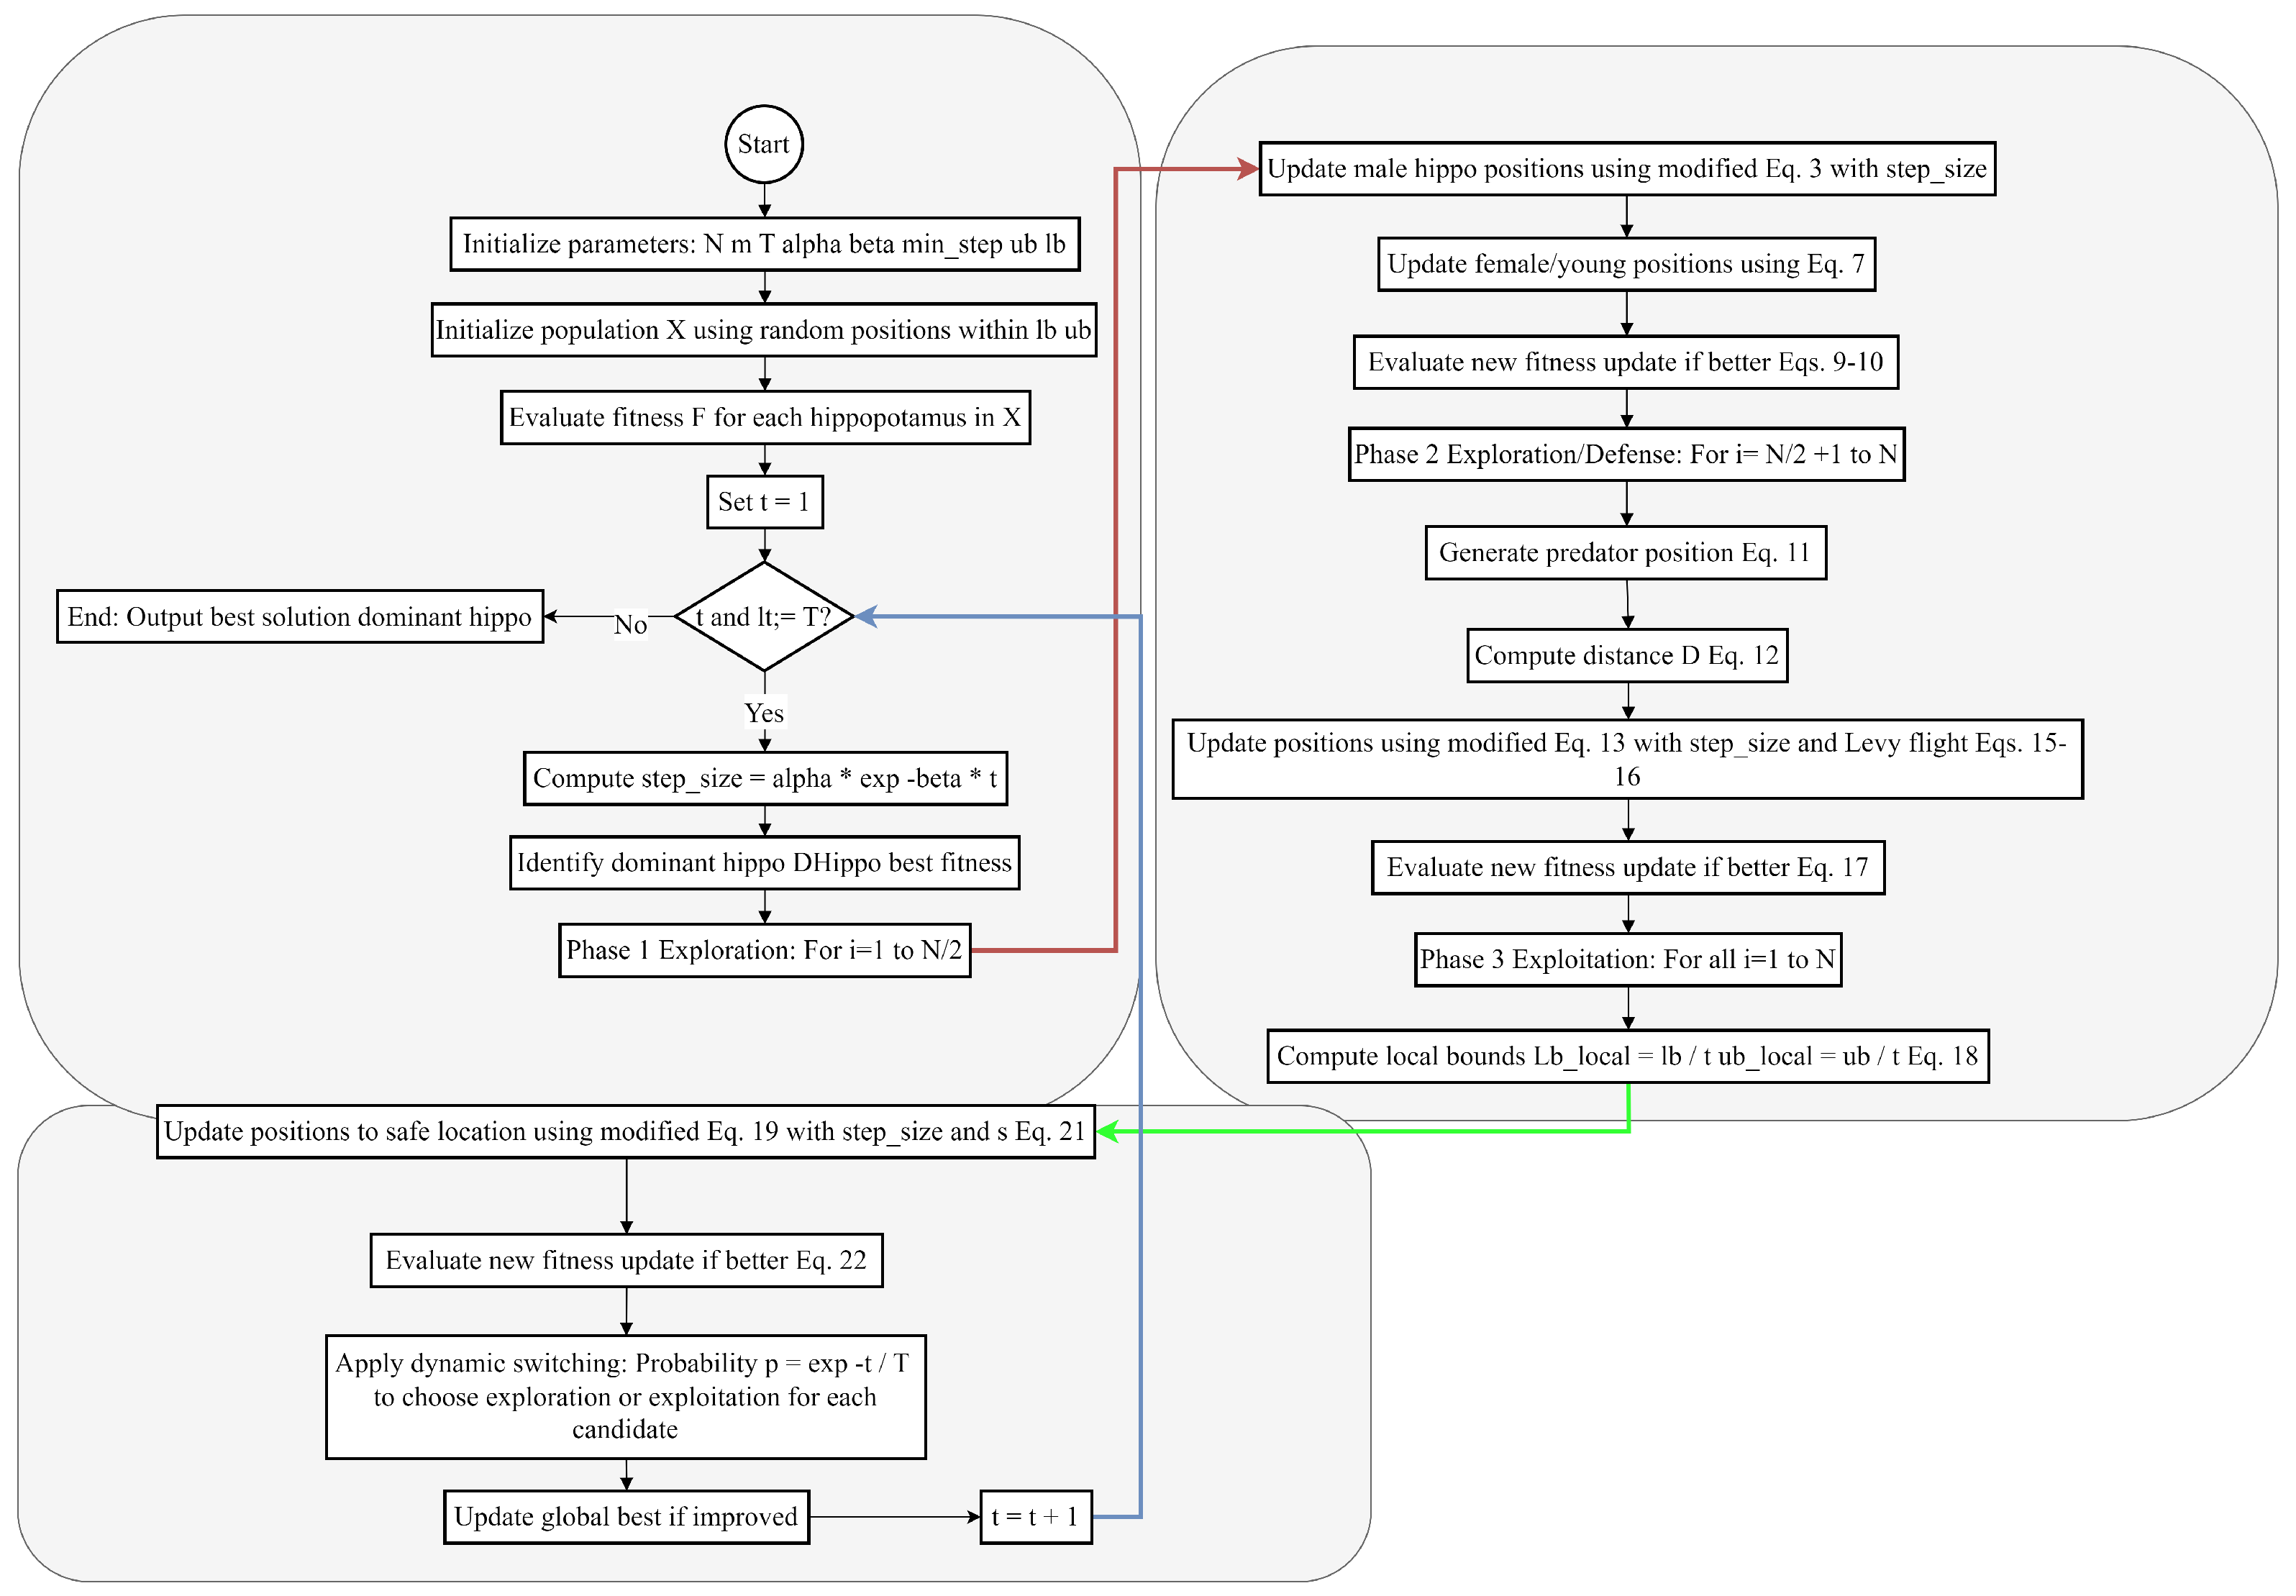
In the proposed EHO, a dynamic switching strategy is implemented such that the balance between exploitation and exploration is controlled based on the present iteration, whereas a probability-based strategy is used to decide if a candidate will undergo exploration or exploitation, thus optimally balancing these two stages throughout the optimization.
R stands for a random parameter controlling the step size in EHO, which, depending on the problem complexity or phase of the optimization procedure, may not be well-suited. To enhance this, the following was performed:
The EHO implements a decreasing adaptive step-size scheme through the iterations. Initially, larger steps are taken (favoring exploration), and smaller steps are taken later in the iterations (favoring exploitation).
where α represents the initial step size, β defines the decay rate factor that controls how quickly the step size decreases over iterations, where the higher the β, the quicker the decay to exploitation, and t stands for the current iteration number.
where denotes a desired minimum step size (equals 0.01), is the maximum iterations, and are the upper and lower bounds of the decision variables (from Equation (1), respectively. Thus, by the end of iteration, moves toward a very small value. In EHO, this would mean multiplying all the existing updates of position, i.e.,
3.2.4. Integration with Life Cycle Assessment
Life Cycle Assessments (LCAs) with Shuffle-GhostNet would provide systematic pathways that could translate product design parameters into estimates of environmental impacts. An LCA database (e.g., Ecoinvent or OpenLCA Nexus) provides a wholesale battery of environmental indicators, such as CO2 emissions, energy consumption, water use, and waste generation. These indicators are given as targets to the deep learning model with inputs derived from product design parameters such as material composition, manufacturing processes, and end-of-life strategies.
Preprocessing includes normalization, feature selection, and categorical variable encoding. Input vector consists of product design features, while the output vector contains the associated environmental impacts. Shuffle-GhostNet is inclined to minimize the following loss function:
where is the true environmental impact and is the predicted value.
Figure 8 shows the flowchart diagram of the proposed EHHO.
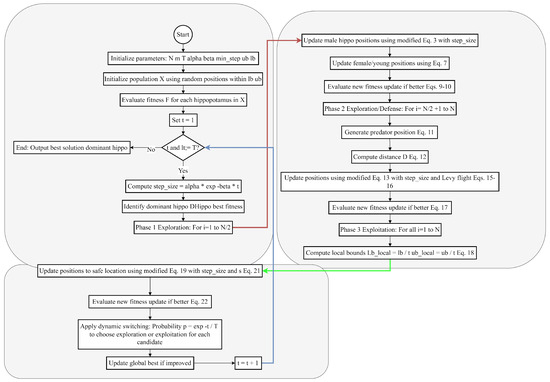
Figure 8.
The flowchart diagram of the proposed EHHO.
The enhanced HHO algorithm is found to be utilized for the optimization of hyperparameters in Shuffle-GhostNet by minimizing the validation loss across several training epochs. Each candidate solution in the HHO population defined a hyperparameter set , where stands for the learning rate, bs for batch size, for the dropout rate, and for kernel size.
4. Results and Discussions
This section describes an extensive evaluation of the Shuffle-GhostNet architecture, augmented by the Enhanced Hippopotamus Optimizer (EHHO) to formulate sustainable product design via Life Cycle Assessment (LCA). Experimental results from extensive simulations utilizing the Ecoinvent v3.8 dataset accessed through OpenLCA Nexus encompass 1240 product system instances in eight categories. The model was trained and validated in a controlled manner, ensuring reproducibility and fairness when compared with baseline methods.
The predictive accuracy was assessed on the test set by computing performance metrics of RMSE, MAE, R2, carbon footprint prediction error (CFPE), and energy use prediction error (EUPE). The convergence behaviors, ablation effects on performance, and implications on real-world sustainability are additionally analyzed to demonstrate the strength and practicality of the suggested framework. The detailed findings are subsequently introduced, followed by accompanying visualizations of the results designs in MATLAB R2019b in consideration of their clarity and scientific decorum.
The proposed Shuffle-GhostNet architecture is then validated through the Ecoinvent and OpenLCA Nexus datasets, internationally recognized as thorough, standardized sources for LCIs (Life Cycle Inventory) data open to public access. The aforementioned datasets contain information on environmental impacts in various categories, including GWP, acidification, energy consumption, water usage, and waste generation, which is very well suited for training and assessing deep learning models for sustainability predictions.
4.1. Dataset Description
The Ecoinvent dataset, hosted by the OpenLCA Nexus platform, comprises over 18,000 unit processes representing various industrial, agricultural, and service-related activities. The individual unit processes will have the data for input and output showing the material flows, energy consumption, and emissions across the entire life cycle of the product.
The selected dataset for this study contains a curated subset of 1240 product systems spanning electronics, packaging, construction materials, and consumer goods.
Each product system corresponds to 47 environmental impact indicators, including carbon footprint (CO2eq), primary energy demand (PED), water depletion (WD), and human toxicity potential (HTP). The significant statistics that are used in the study are summarized in Table 1 in terms of product counts, features, and environmental impact indicators presented in the datasets.

Table 1.
Dataset statistics.
The dataset was first prepared for model training by preprocessing as follows:
- -
- Feature Extraction: Material composition, manufacturing processes, and end-of-life treatment were the design features that were extracted from the product systems as features such as percentages of plastic, metal, and glass, injection molding, casting, recycling, landfill, and incineration, respectively, were included.
- -
- Normalization: Environmental impact values were normalized on min-max scaling for numerical stability and fair comparisons across impacts:
- -
- Feature Selection: Redundant and highly correlated features were cascaded off by VIF and PCA and got reduced from 128 to 64, while 92% of variance was preserved.
- -
- Train-Test Split: Randomly splitting 70% of the dataset into training, 15% into validation, and 15% into the test set was biased towards performance evaluation and overfitting avoidance.
4.2. Evaluation Metrics
To comprehensively evaluate the performance of the Shuffle-GhostNet model, a combination of general-purpose regression metrics and sustainability-specific evaluation indicators is employed. The regression metrics assess the model’s ability to accurately predict numerical environmental impact values, while the sustainability metrics evaluate the model’s effectiveness in guiding real-world sustainable design decisions. The utilized evaluation metrics are expressed below:
- (A)
- Root Mean Squared Error (RMSE): Measures the average magnitude of prediction errors in the same units as the target variable.
- (B)
- Mean Absolute Error (MAE): Measures the average absolute difference between actual and predicted values.
- (C)
- R-squared (): Indicates the proportion of variance in the target variable that is predictable from the input features.
In addition to these general metrics, we defined the following sustainability-specific indicators:
- (D)
- Carbon Footprint Prediction Error (CFPE): The average absolute error in across all product systems.
- (E)
- Energy Use Prediction Error (EUPE): The average absolute error in predicting primary energy demand.
These metrics allow us to assess not only the numerical accuracy of predictions but also their relevance to real-world sustainability outcomes.
4.3. Baseline Models
To evaluate the efficiency of the proposed Shuffle-GhostNet architecture, a comparative analysis is offered on performance with well-established deep-learning models commonly adopted for various environmental and sustainability modeling tasks. These models include Standard CNN, a conventional convolutional neural network that comprises three convolutional layers successively followed by dense layers [19]; GhostNet, a lightweight CNN that serves as a basis for the Ghost Module that inspired Shuffle-GhostNet [20]; MobileNetV2 [21], which is very efficient and uses depthwise separable convolutions; ResNet-18 [22], a residual network with skip connections for easy model training on deeper networks; and EfficientNet-B0 [23], a compound-scaled CNN that optimizes depth-width-and-resolution tradeoff for accuracy efficiency.
All of these baseline models are trained on the same dataset and could go through an identical preprocessing pipeline, as hyperparameters were optimized with the same Enhanced HHO algorithm for really fair comparisons. Each of these models was trained for 100 epochs with early stopping based on validation loss.
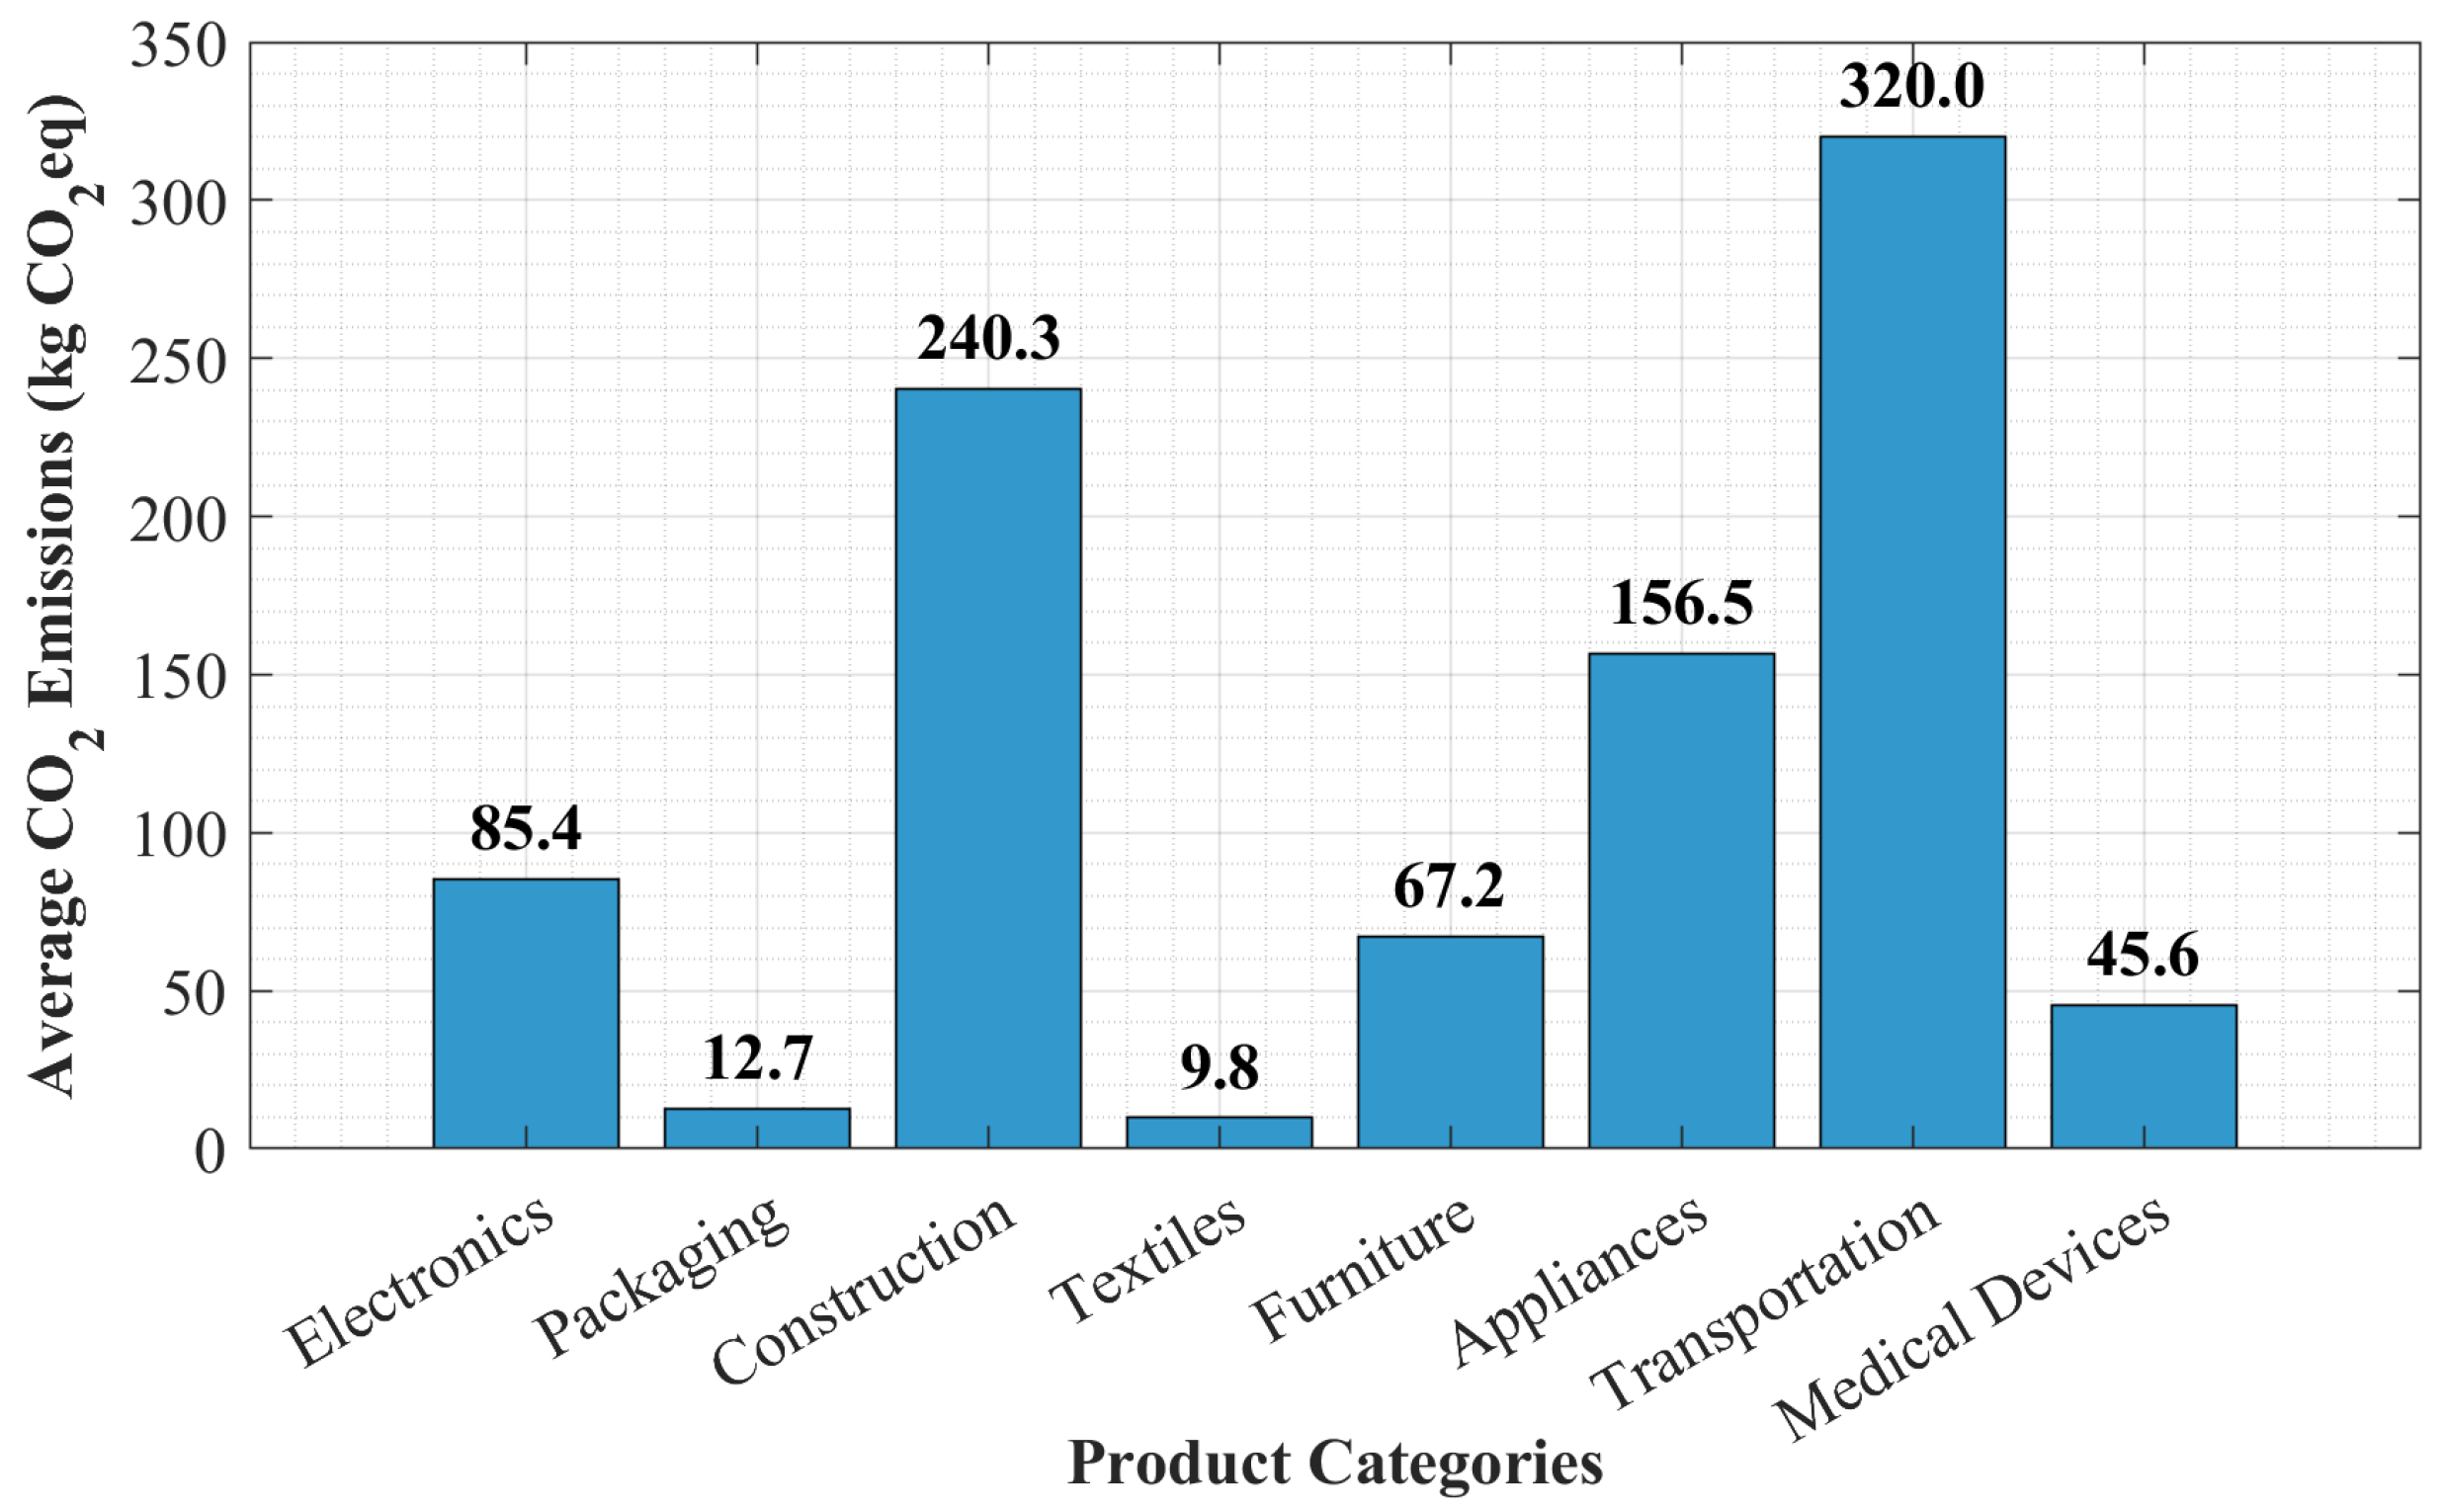
Figure 9 shows the average carbon footprint across product categories. The carbon footprint per product category is reflected in the mean values represented by the various bars in the graph, thus showing the average CO2 emissions corresponding to the several included product categories in the dataset. By doing so, the bar plot accentuates the extreme extent of environmental impacts in many product types and hints at the need for accurate and fast predictive models to distinguish between high- and low-emission designs.
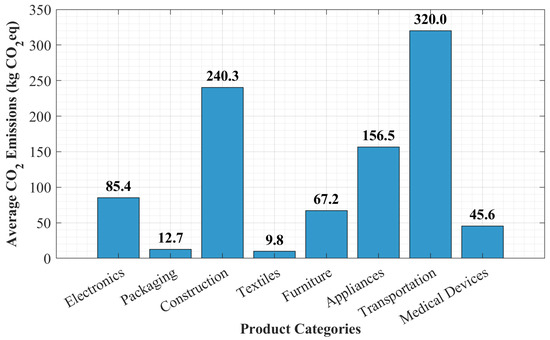
Figure 9.
Average carbon footprint across product categories [3].
These differences in carbon footprints also show that data could guide and support sustainable product development. The experimental framework aims to allow a consistently rigorous and fair evaluation of the Shuffle-GhostNet architecture being proposed. In the subsequent section, we provide a complete analysis of the model’s performance against well-established baseline methods, looking at its efficacy for emission pattern capture and, therefore, its practical use in aiding environmentally sound design decisions.
4.4. Performance Evaluation
As mentioned before, the performance of the proposed Shuffle-GhostNet model was assessed against five other state-of-the-art deep learning models. During the training sessions, all these models were trained on the identical dataset that was preprocessed for LCA and optimized utilizing the Enhanced HHO algorithm, thereby ensuring an equitable comparison.
The assessment was concentrated on regression accuracy with respect to the prediction of 47 environmental impact indicators, specifically CO2 emissions and primary energy demand.
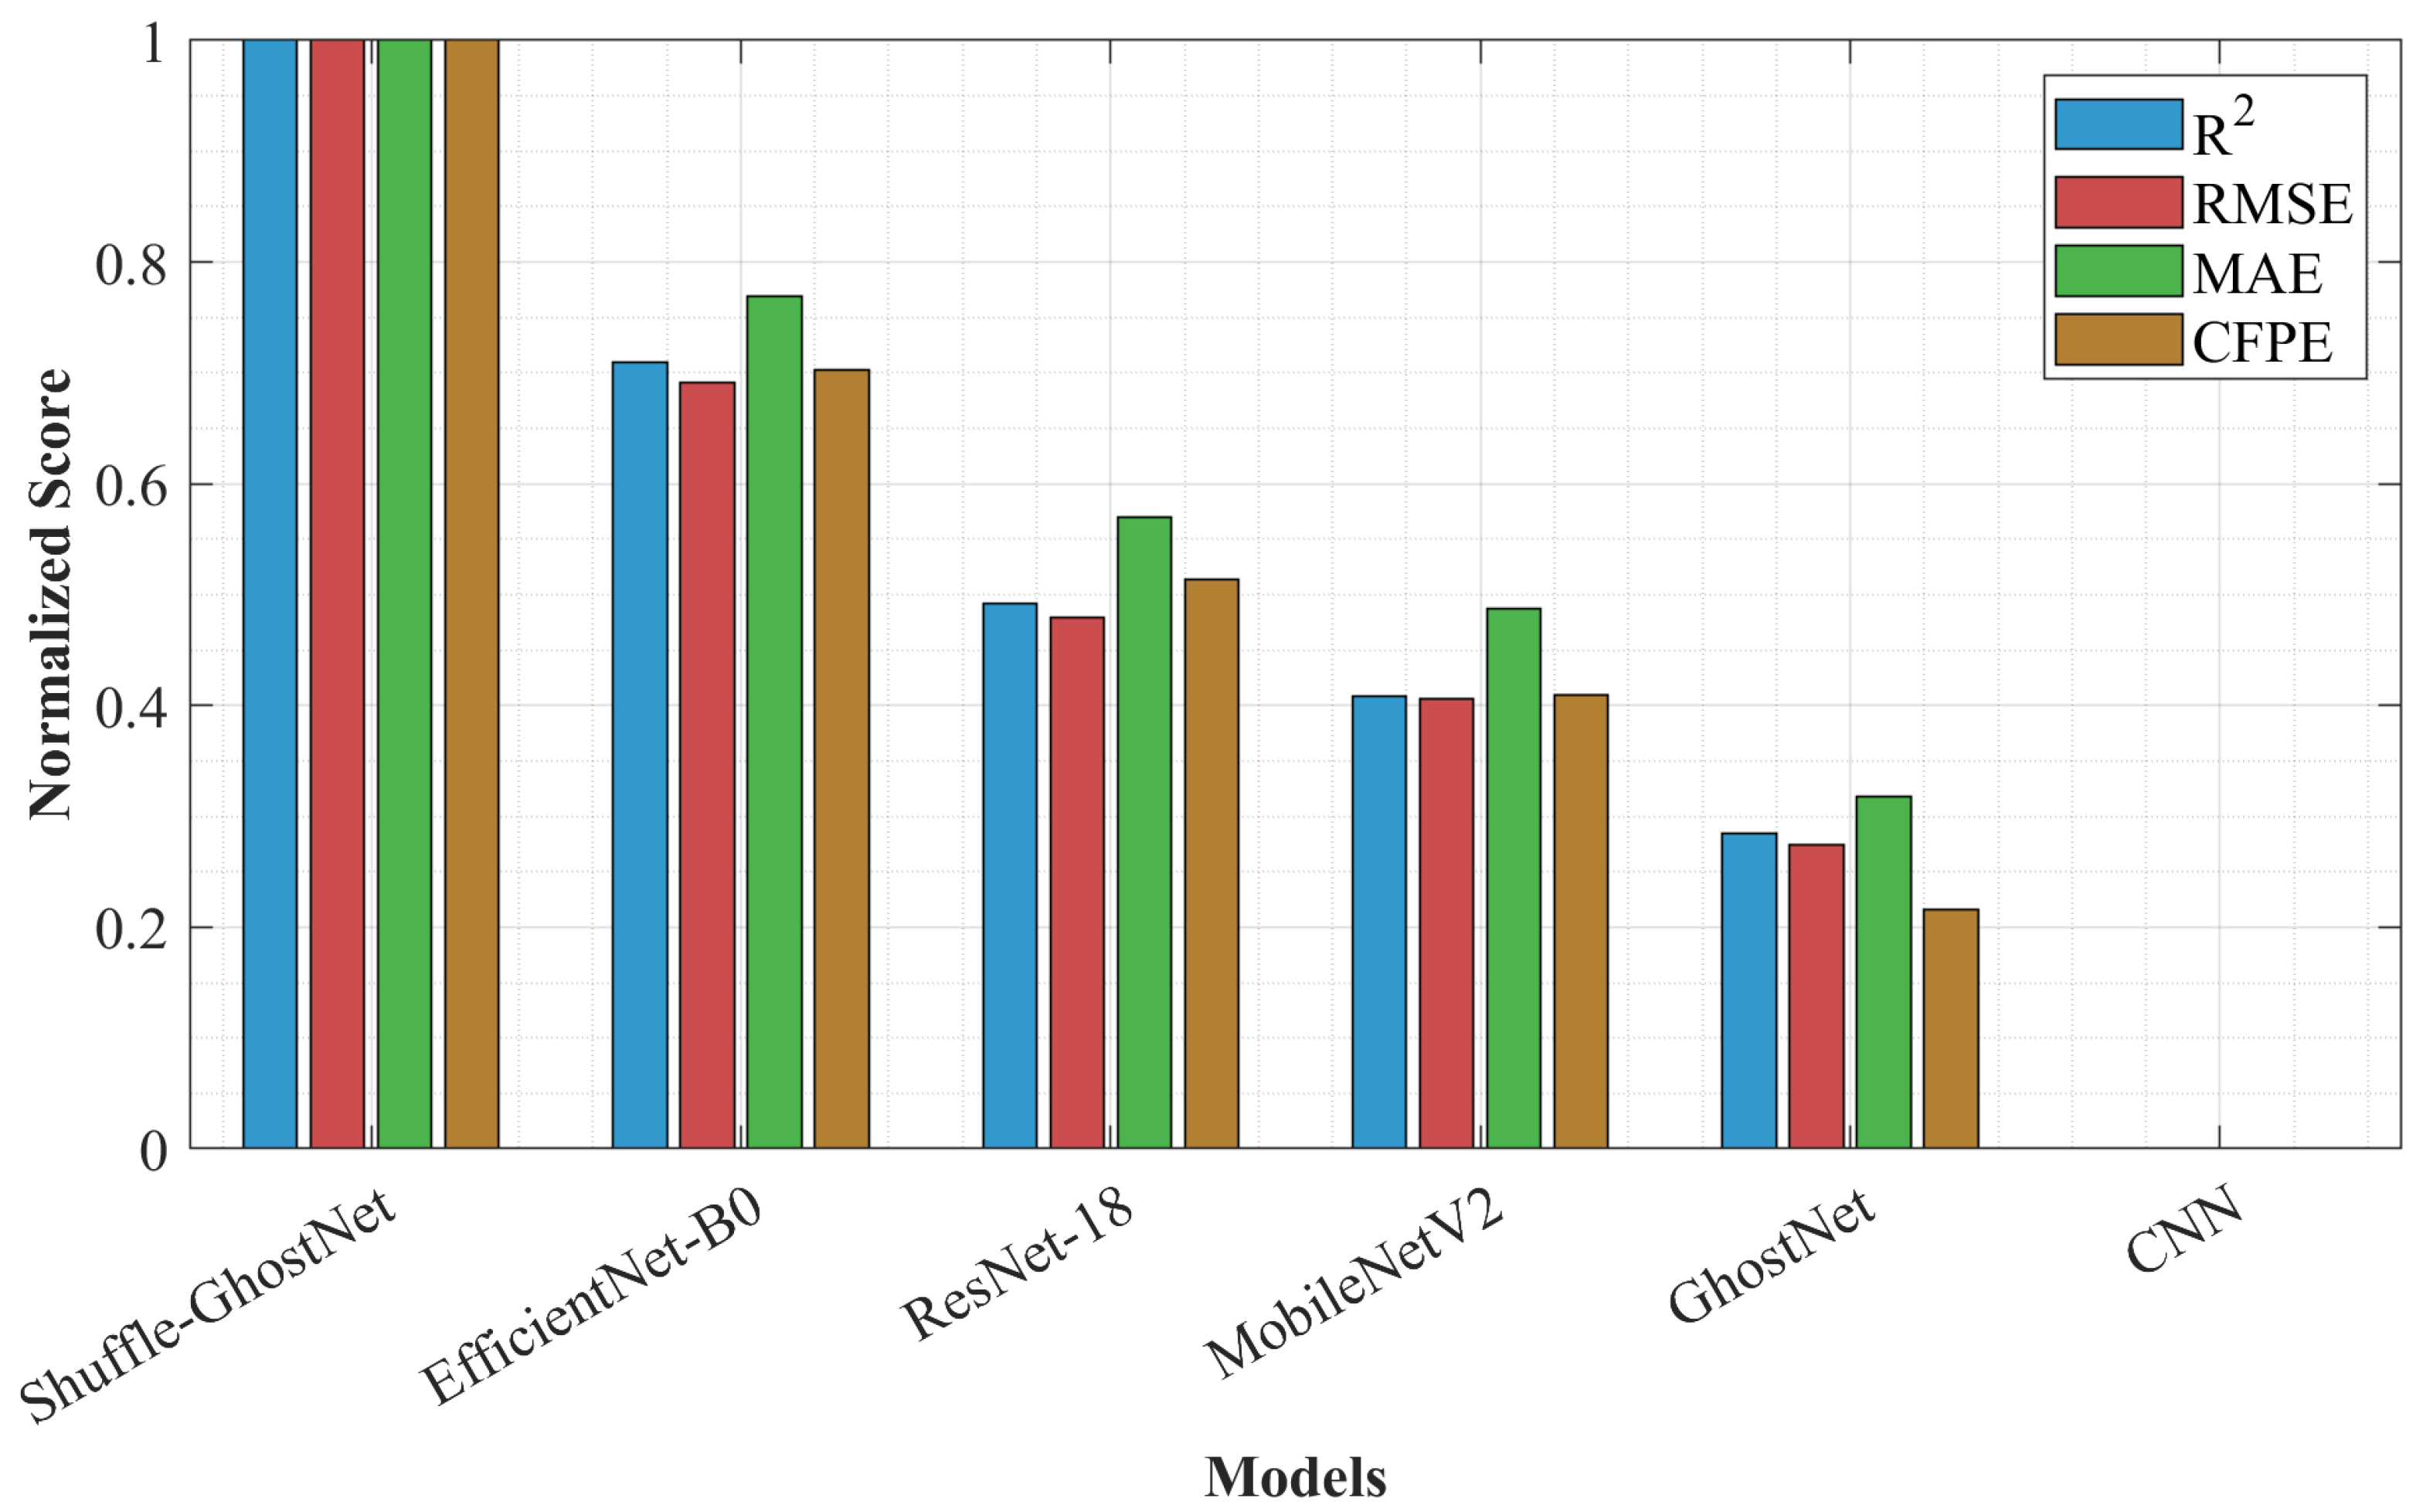
To visualize the comparative performance, Figure 10 presents a bar graph of four critical metrics—R2, RMSE, MAE, and CFPE—across all models. The Shuffle-GhostNet model exhibits an R2 value of 0.943, considerably improving upon the next best model (EfficientNet-B0 at 0.891).
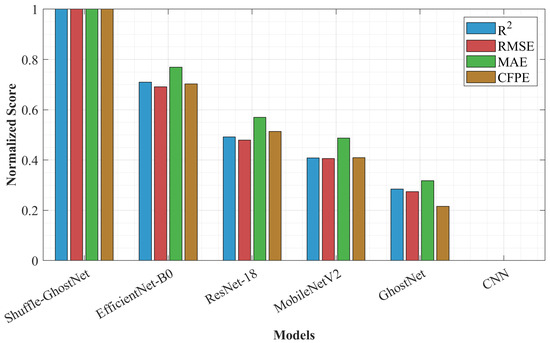
Figure 10.
Performance comparison of deep learning models in LCA prediction.
Also, the Shuffle-GhostNet model recorded the lowest RMSE (4.21 kg CO2eq) and MAE (3.07 kg CO2eq), indicating better generalization and less prediction bias. Improvement came from the Ghost module for efficient feature extraction and improved cross-channel communication through channel shuffling, thereby empowering the model to represent subtle non-linear relationships in LCA data better than conventional lightweight networks or even current state-of-the-art ones.
This indicates that Shuffle-GhostNet not only has the best R2 values but also has the fewest errors in all metrics and thus proves itself in modeling complex environmental impacts. Its slim form does not threaten its accuracy, thereby fitting as an early-stage design tool in which processing and accuracy are both strenuous.
According to the findings, it can be witnessed that the performance of Shuffle-GhostNet can be traced to the hybrid architecture that it attains from ghost convolutions, which ensures computational efficiency, and the better propagation of features that results from channel shuffling. Unfortunately, full convolutions and large parameters characterize typical CNNs, while GhostNet lacks inter-group information exchange.
However, in Shuffle-GhostNet, richer representation learning is warranted without increasing model sizes exceedingly, especially with sparse and heterogeneous LCA data coupled with the typical challenge of overfitting.
Additionally, Enhanced HHO ensures the best hyperparameters are configured for maximum performance. The model consistently yields lower CFPE and EUPE values, assuring that the model can predict with reliability the key sustainability indicators for making better decisions by engineers and designers in the conceptual design phase.
4.5. Effectiveness of Enhanced HHO
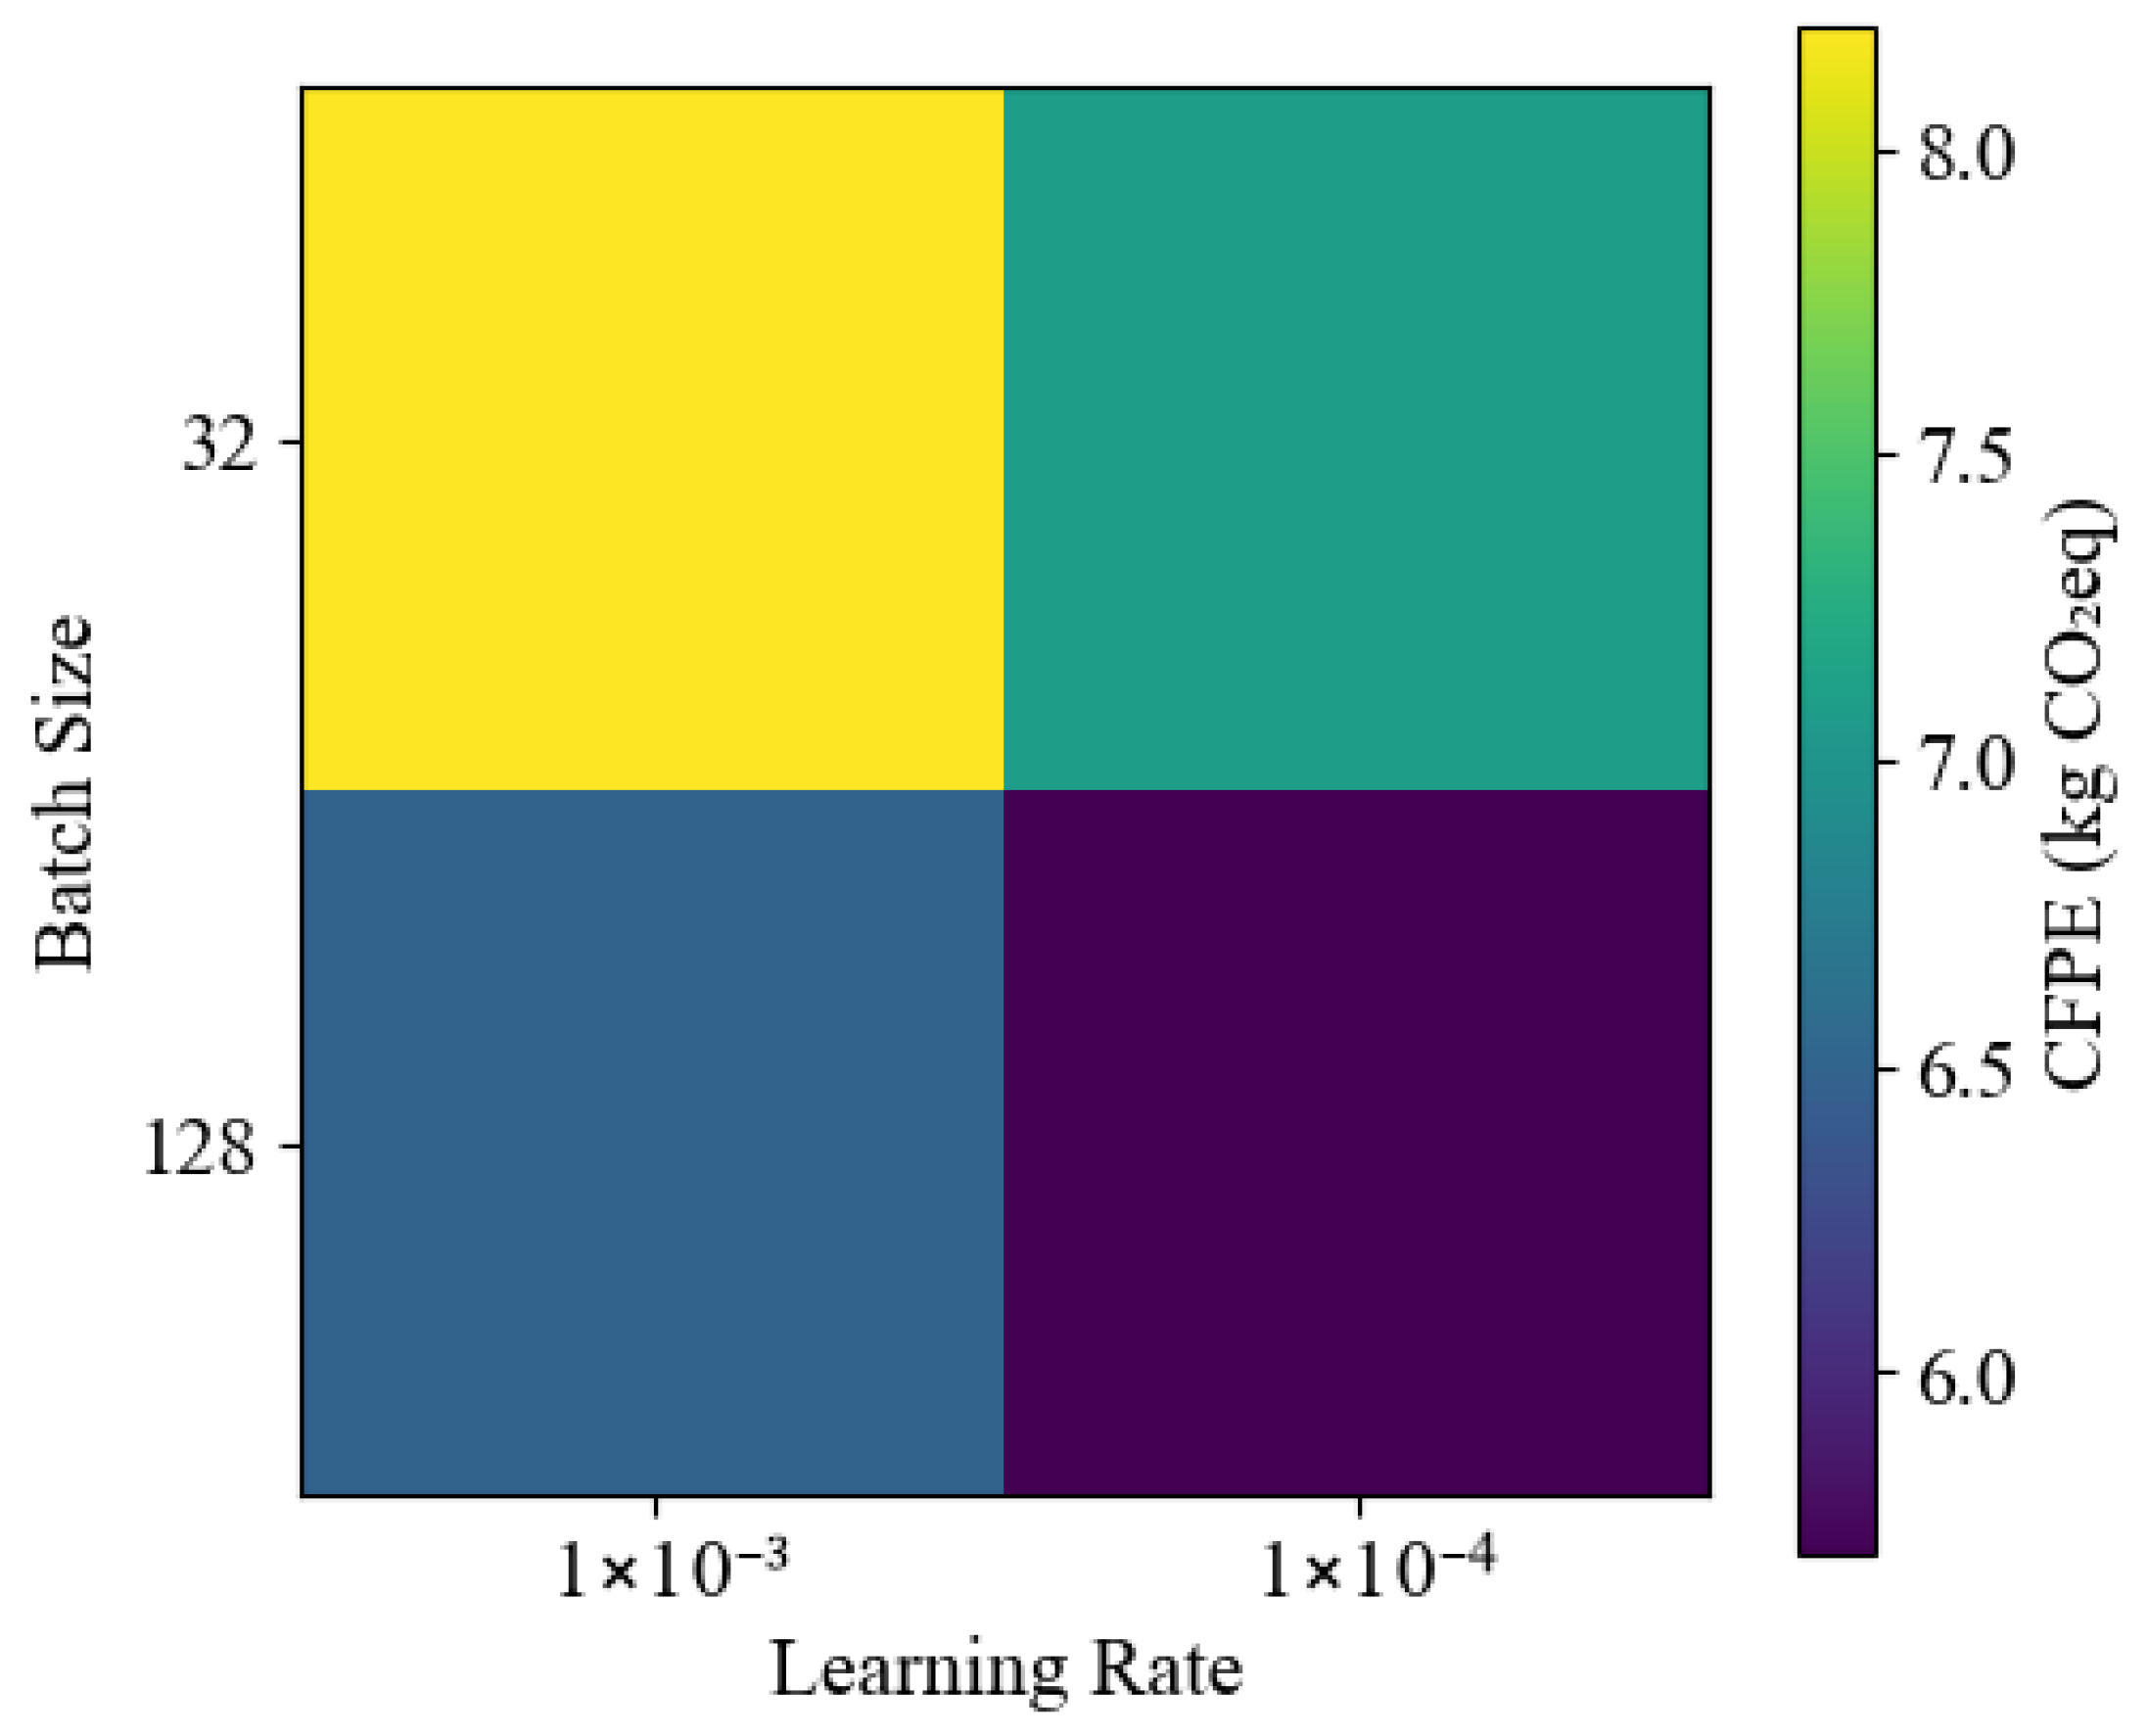
The efficiency of Enhanced Hippopotamus Optimizer (EHHO) was evaluated against the original HHO by sampling the two algorithms for convergence behavior and final solution quality during the optimization of hyperparameters for Shuffle-GhostNet. A total of 100 iterations were executed with a population size of 30 for the same set of hyperparameters—learning rate, batch size, dropout rate, kernel size, and ghost expansion ratio. The objective function was the validation loss (RMSE) of the model obtained after one training epoch.
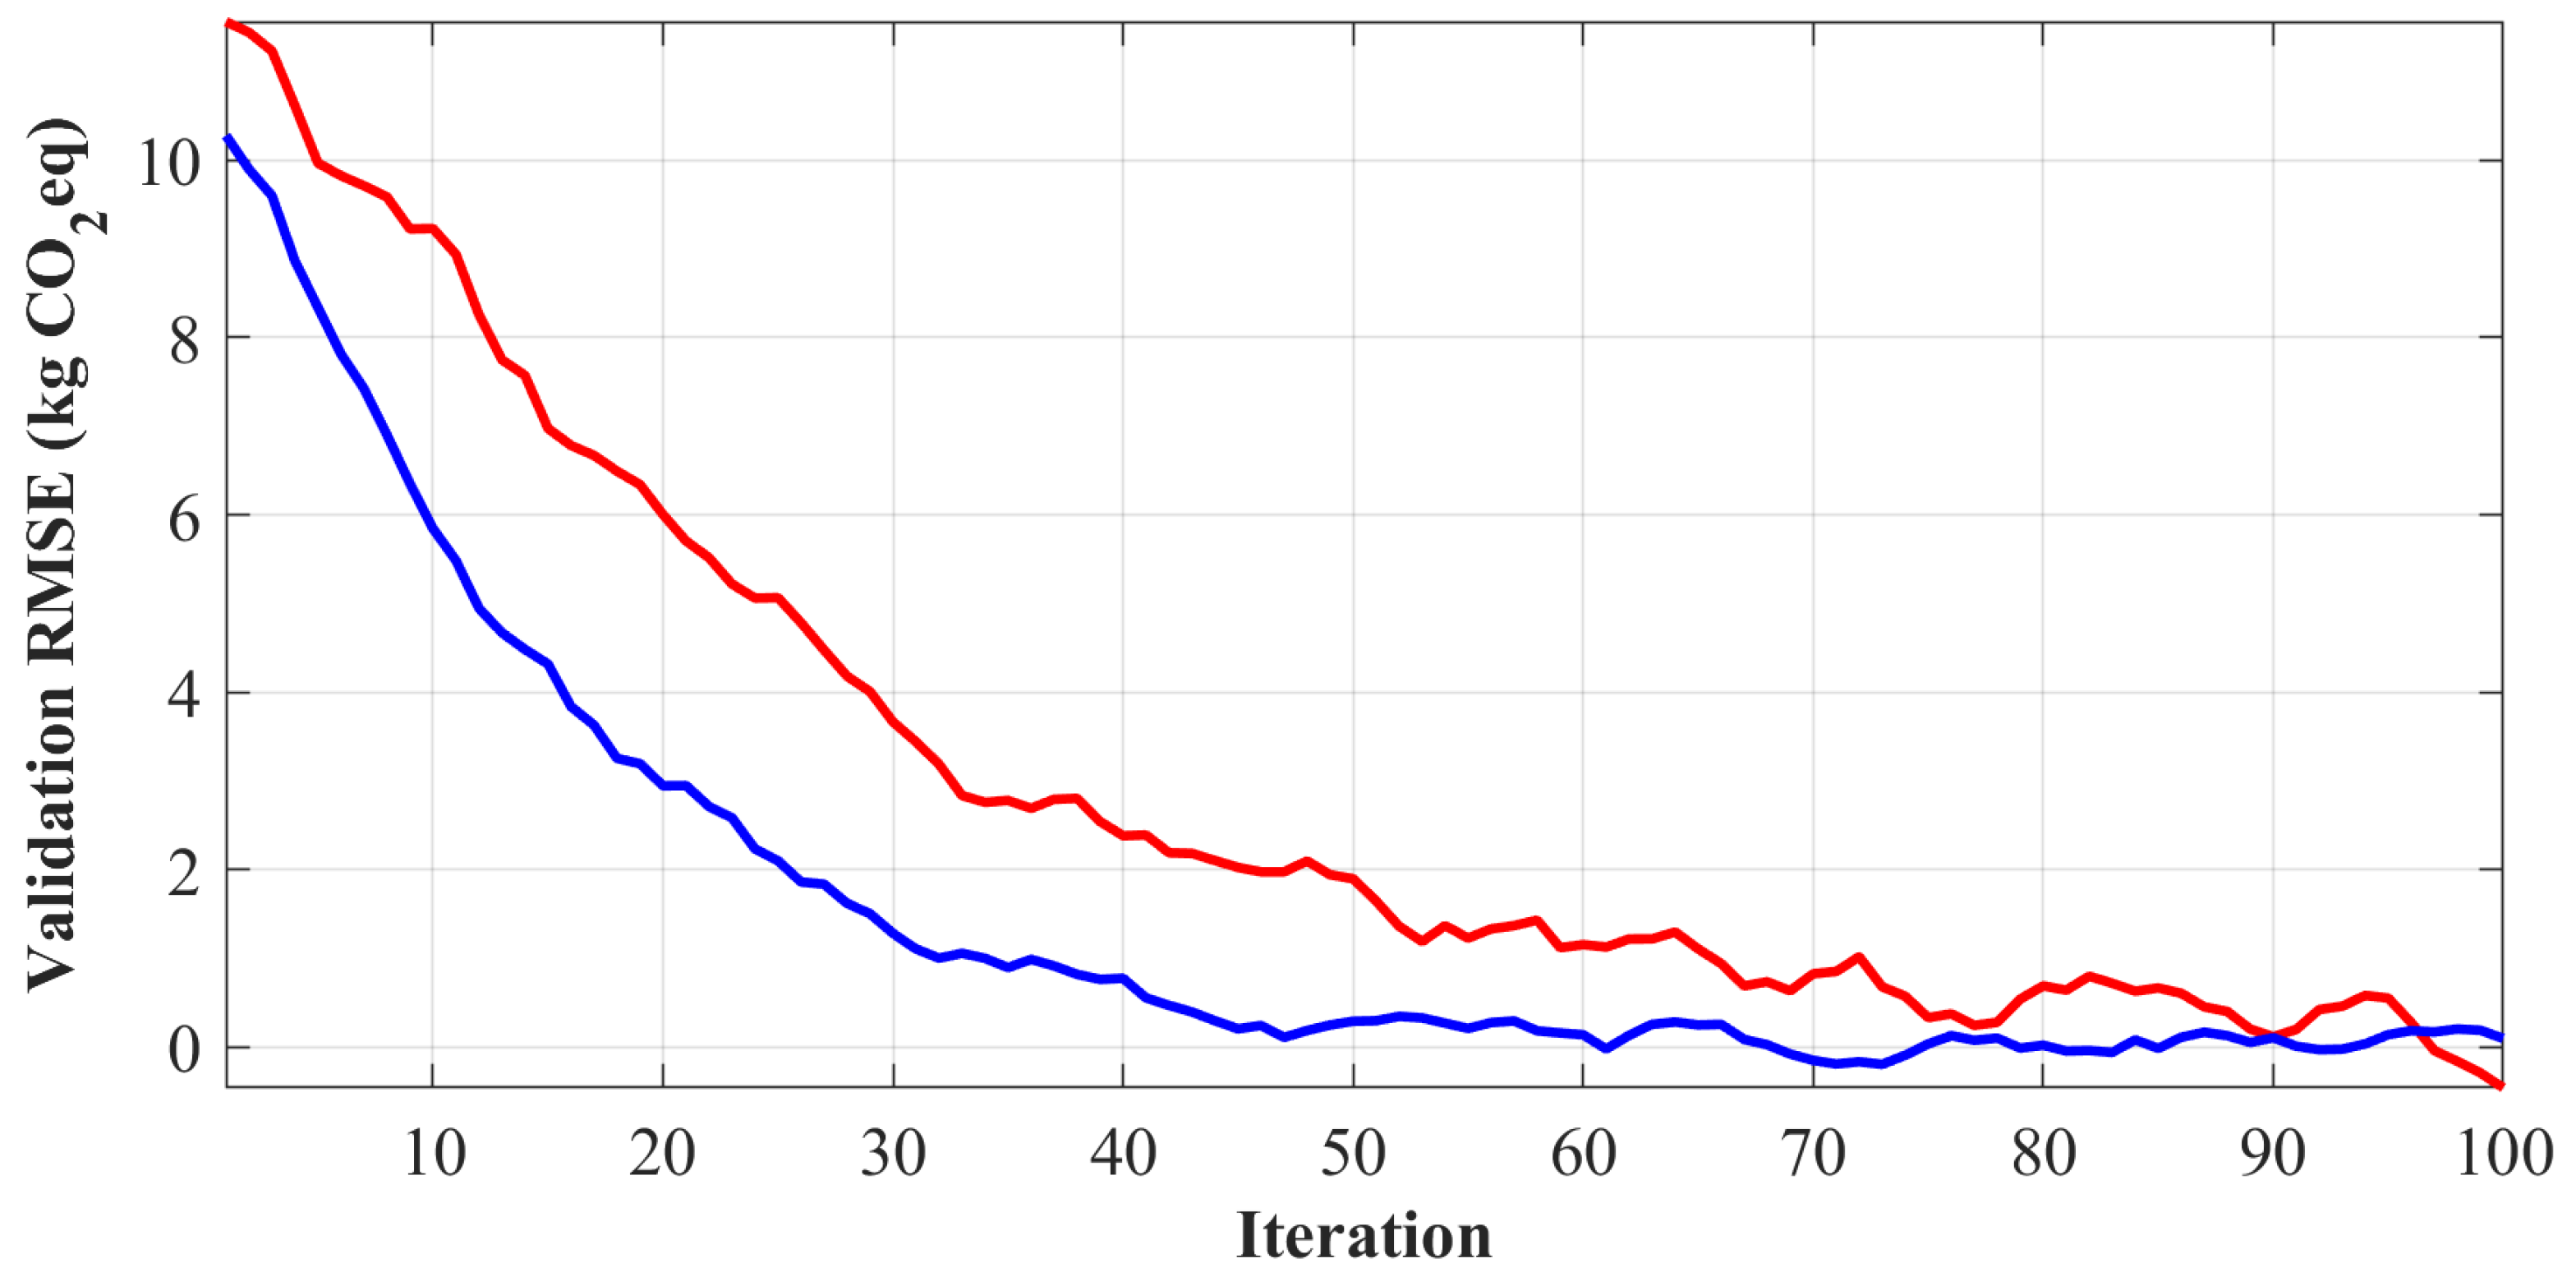
That was the average best fitness obtained per iteration over 10 independent runs for both algorithms in Figure 11.
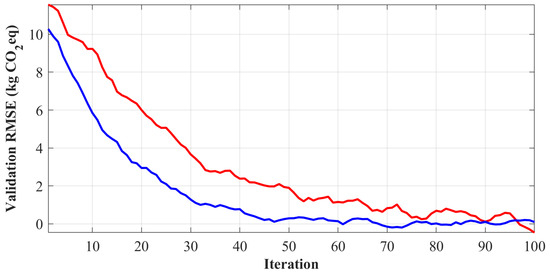
Figure 11.
Convergence behavior of HHO algorithms in hyperparameter optimization.
The more intense convergence of the EHHO algorithm gives rise to a minimum (final RMSE = 4.38) as compared to the original HHO (final RMSE = 5.72), exhibiting better exploration-exploitation balance because of the dynamic inertia weight and hybrid mutation strategy.
The EHHO shows faster convergence and lower final error; hence, it is very efficient. On the above parameters, scoring is defined by the behavior of the artificial intelligence-based techniques in high-dimensional spaces, especially in those of extensive hyperparameter spaces created within deep learning.
Convergence analysis shows that at the start, Enhanced HHO must improve due to its dynamic property of keeping the exploration–exploitation balance. The time-varying feature of the inertia weight evaluates the strong global search in early iterations and the fine local exploitation in later iterations. Coupled with this, the hybrid mutation model avoids premature convergence by reintroducing diversity in the population between stagnation. These improvements lead to accruing strong value addition, especially in applications of LCA-driven AI, where indeed, small changes reduce prediction error but yield healthy environmental gains.
Faster convergence equates to less computational overhead and allows for the feasibility of using the optimization method in iterative design workflows. Thus, EHHO proves to be a powerful tool for automating deep-learning models within sustainability contexts.
4.6. Sustainability Assessments
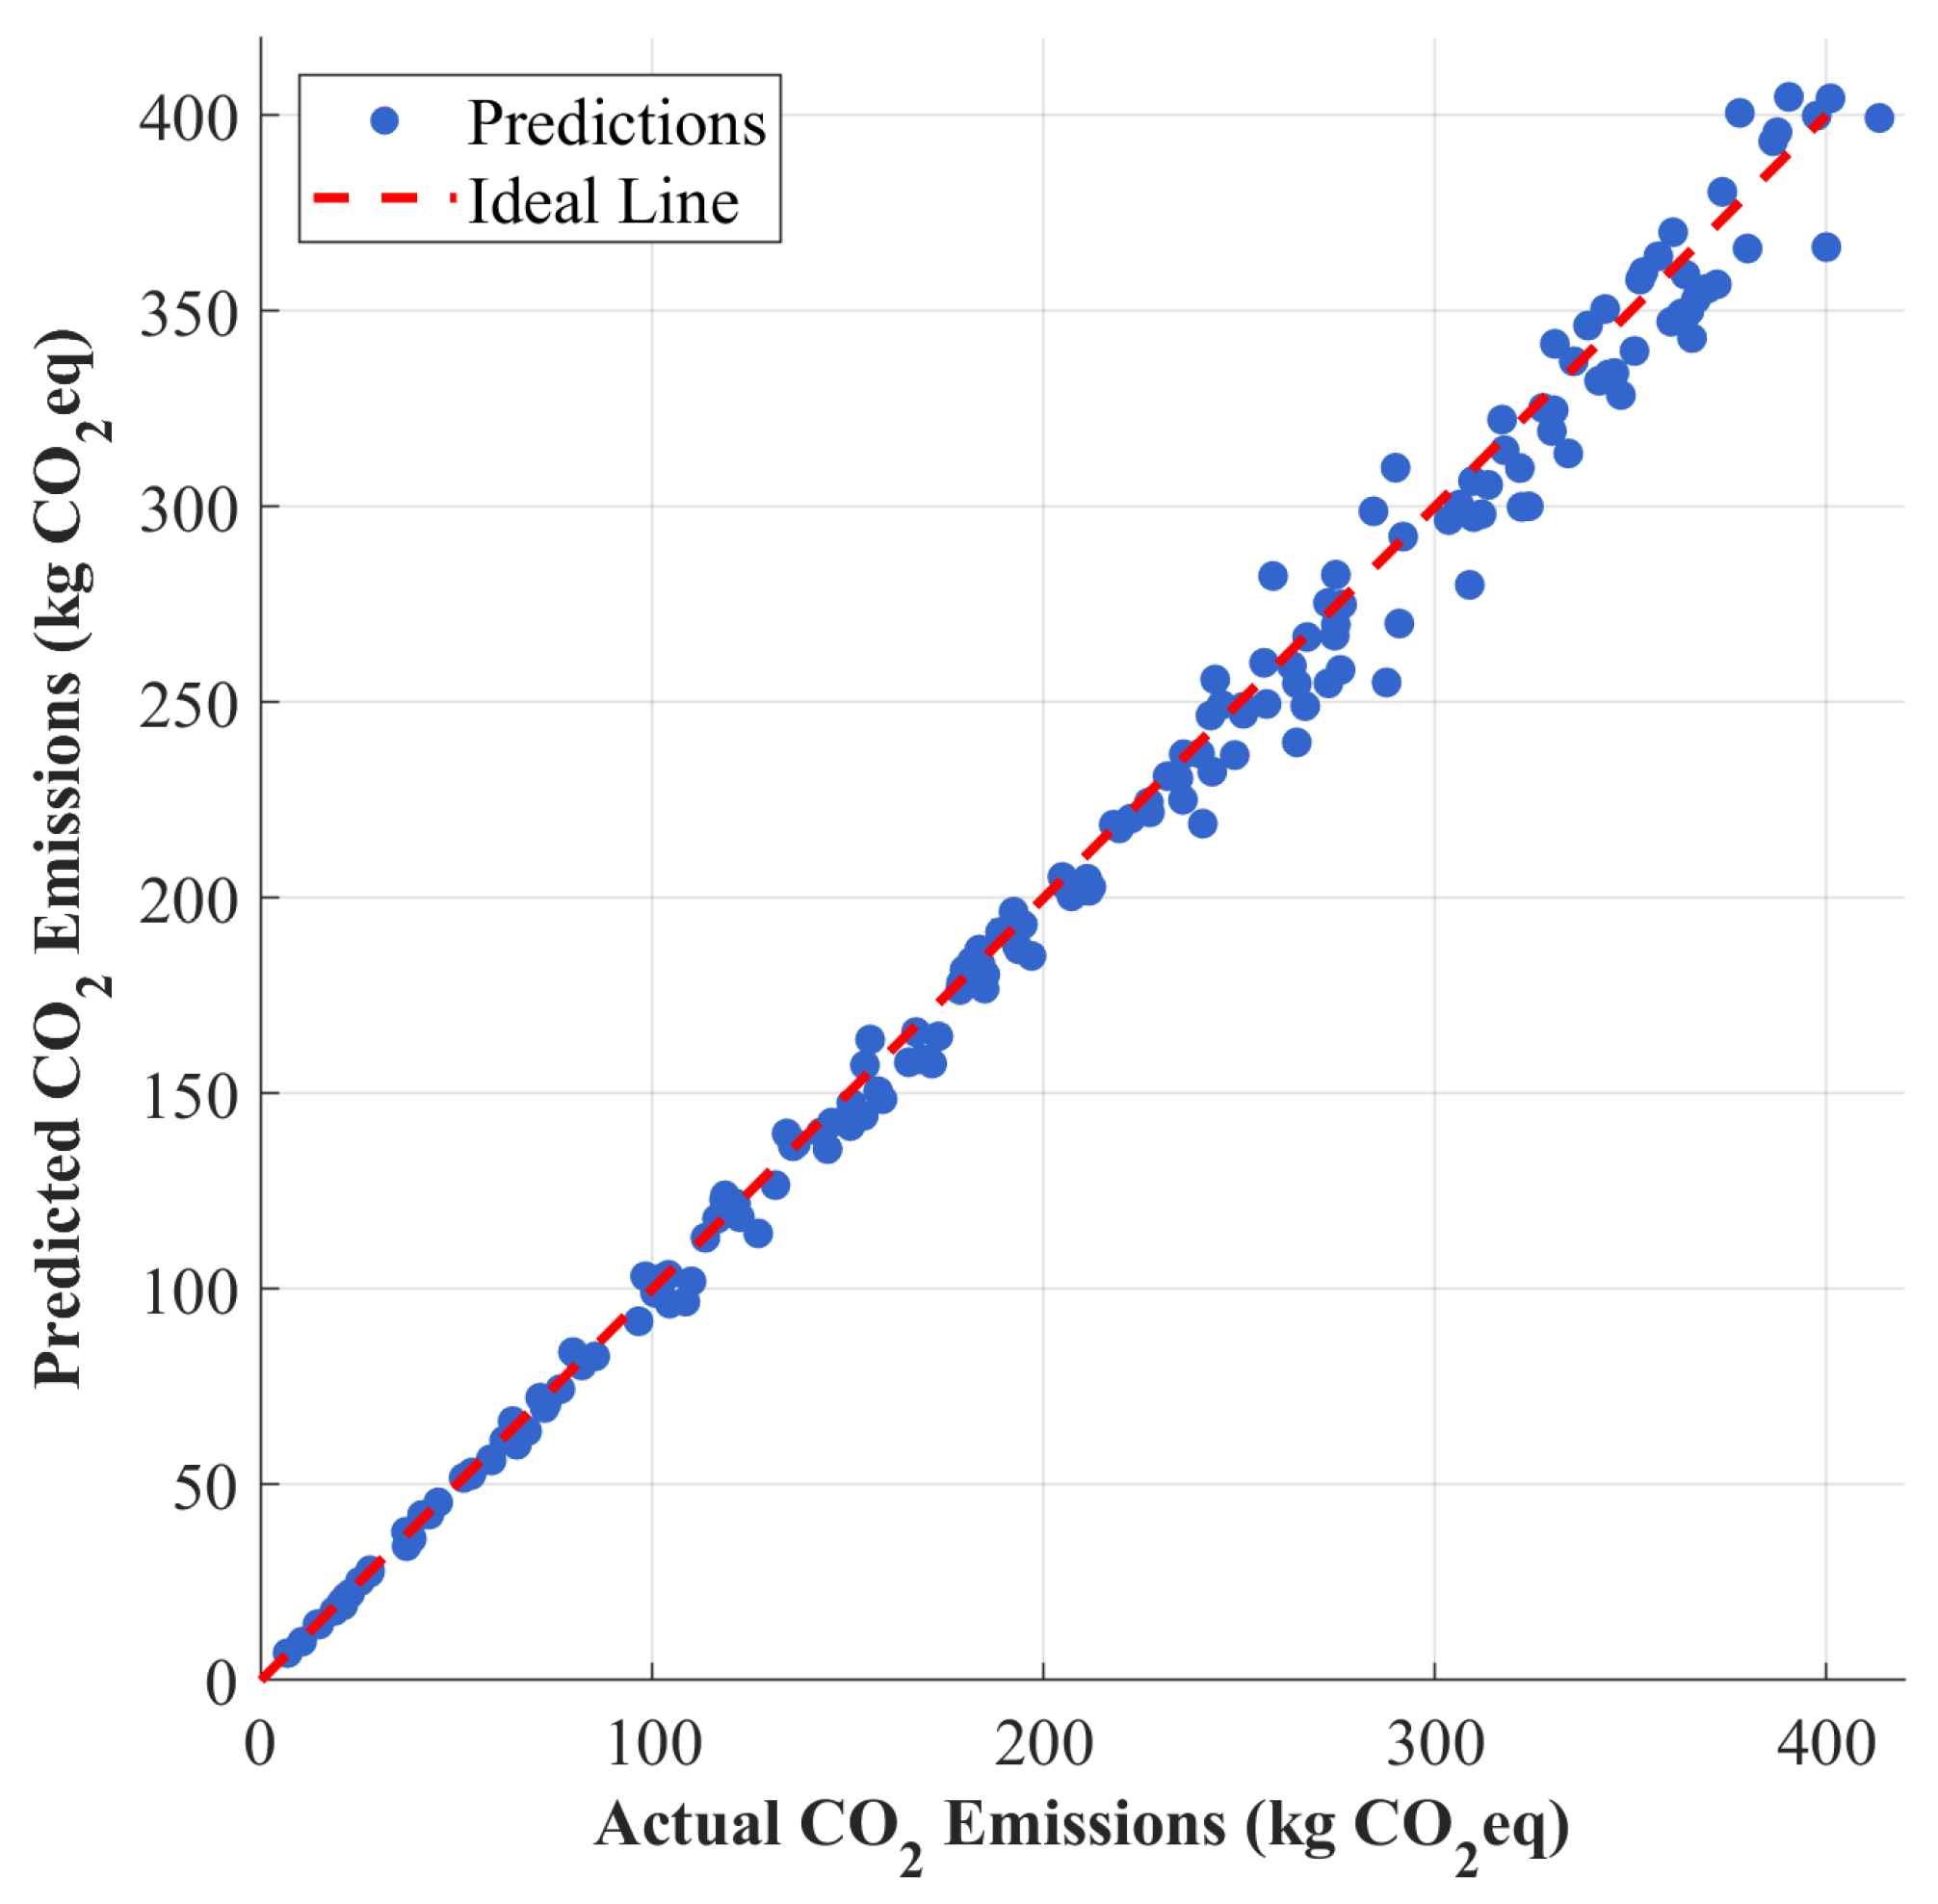
To evaluate the practical applicability of the proposed model, a case study was carried out on three alternatives of a consumer electronic product (smart speaker). Based on predictions by Shuffle-GhostNet, CO2 emissions and primary energy demand for the cradle-to-gate stages were estimated for each design alternative. The scatter plot in Figure 12 gives predicted and actual CO2 emissions for a total of 186 test products, including this case study. The points lie close to the y = x line, indicating good prediction accuracy.
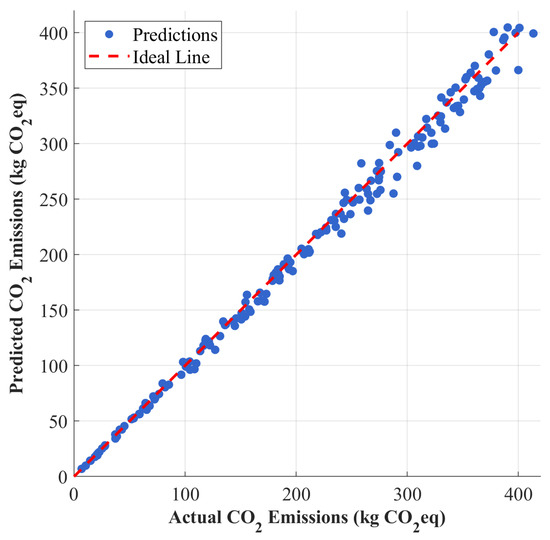
Figure 12.
Model prediction accuracy: predicted vs. actual CO2 emissions.
From the model outputs for the smart speaker case study, sustainability alternatives are summarized in Table 2. The alternatives include material substitution and process change due to their lowered environmental impacts.

Table 2.
Sustainability decision recommendations based on model output.
These results demonstrate that the model works with fast scenario testing and provides direction for designers toward lower-impact alternatives.
Predicted and real emissions of carbon dioxide were found to be closely matched, corroborating the fact that the model can be used in making decisions toward an actual sustainable design; in the case study, bio-based PLA was correctly identified as the most important substitution by the model, backing LCA literature. Quantitative feedback allows trade-off analysis—while recycled aluminum offers an end-of-life benefit, its high energy in the production stage means that it is comparatively unfavorable to bioplastics in this case. Hence, enabling designers to rapidly evaluate multiple configurations of their products using fast and accurate predictions of environmental impacts greatly reduces costs and environmental burden associated with physical prototyping. This model can fit well with the goals of Industry 4.0 and the circular economy, where agility and sustainability are to go hand in hand.
4.7. Ablation Study
An ablation study was performed to quantify the contribution of each different component of Shuffle-GhostNet: the Ghost Module (GM), the Shuffle Module (SM), and their combination. Four variants were evaluated: (1) Base CNN, (2) CNN + GM, (3) CNN + SM, and (4) CNN + GM + SM (i.e., Shuffle-GhostNet). All models had the same depth and training settings. The results are summarized in Table 3, wherein it is found that the addition of only the Ghost Module decreases RMSE from 9.45 to 7.82 and increases R2 values from 0.764 to 0.815, clearly showing how intrinsic feature generation is efficient.

Table 3.
Ablation study.
The Shuffle Module improves R2 from 0.815 to 0.837 through cross-channel communication, while the Shuffle-GhostNet model provides the best results (R2 = 0.943, RMSE = 4.21), indicating synergy from both modules.
The effectiveness in the convergence stability and generalization of Shuffle-GhostNet has been found to be better in performing the tasks than the ablated variant versions since it shows significantly lower standard deviations of ±0.009 (R2) and ±0.16 (RMSE).
Reduced parameter count and increased robustness validate the claim that Shuffle-GhostNet is more efficient and generalizes better than other ablation variants.
The ablation study establishes beyond doubt the contributions of the Ghost and Shuffle modules towards the model, with the two of them collectively giving multiplicative benefits. The Ghost Module lessens feature map redundancy, hence permitting deeper networks without increased consumption of calculation. The Shuffle Module breaks down the isolation of groups to give layers a chance to reuse more features. Together, a compact yet expressive architecture is created with respect to the LCA data, which greatly emphasizes interpretability and efficiency.
Further, the sensitivity analysis has demonstrated that the performance shrinks to an optimum at a shuffle group size of 4 and ghost expansion of 3, beyond which results start declining. This will inform the deployment of the model in resource-constrained environments like cloud-based design platforms or mobile applications geared for green engineering.
4.8. Mechanistic Rationale and Feature Map Analysis
We must prove how the Shuffle-GhostNet architecture works better than its components and baseline models. Toward this end, we will address how the interaction between the Ghost and Shuffle modules happens to map the sparse, high-dimensional LCA feature spaces into discriminative representations.
The Ghost Module performs the important task of somewhat reducing redundancy by producing huge numbers of feature maps through cheap depthwise convolutions and linear projections—an essential procedure in LCA data because material composition percentages (e.g., 62% ABS, 18% aluminum) are highly correlated and often informationally redundant across channels. This drastically reduces computational effort without losing representational capability, achieved by going from 1.8M parameters in Base CNN to 1.2M in Shuffle-GhostNet. What sets apart normal GhostNet is that it groups features away from channels, choking any inter-channel communication necessary for the modeling of interactions—for example, how a change in EOL recycling rate modifies the embodied energy of a particular alloy. The Shuffle Module cuts across this barrier by grouping along the channel dimension and then shuffling those groups after every group convolution: instead of each output group deriving solely from one input group (Figure 6a), shuffling partitions each group into subgroups and redistributes them across all output groups (Figure 6b), forcing the network to learn dependencies between previously disconnected features—such as the non-linear interaction between injection molding temperature and recycled plastic content on CO2 emissions.
This synergy is hence not just additive but multiplicative. The ablation study confirms this (Table 3): Ghost Module alone, through redundancy cancellation, increases R2 to 0.815; Shuffle Module alone, improving intra-network communication, achieves 0.837; but their combination arrives at 0.943—this means the Shuffle operation unlocks all the potential of Ghost’s efficient features through learning richer and globally coherent representations.
Thus, comparing the activation patterns of the final bottleneck layer across models was performed by t-SNE embedding of the 256-dimensional feature maps from 186 test samples. The clusters of designs reflecting high impacts, like die-cast metal, and designs bearing low impacts, like bio-based PLA, are more blurred and overlapped in Base CNN due to overfitting and poor generalization.
GhostNet sees slightly better clustering but has a large amount of crossover between the classes, indicating that the features are learned in relative isolation. ShuffleNet does allow a bit more separation because of the cross-group mixing, but the boundaries still remain mushy. Shuffle-GhostNet, on the other hand, creates localized ellipsoidal clusters with maximum separation and very little overlap, demonstrating that this combined architecture learns a latent space where design alternatives can be cleanly separated based on true environmental impact profiles; this visual discernment now becomes the basis for superior predictive accuracy in the model.
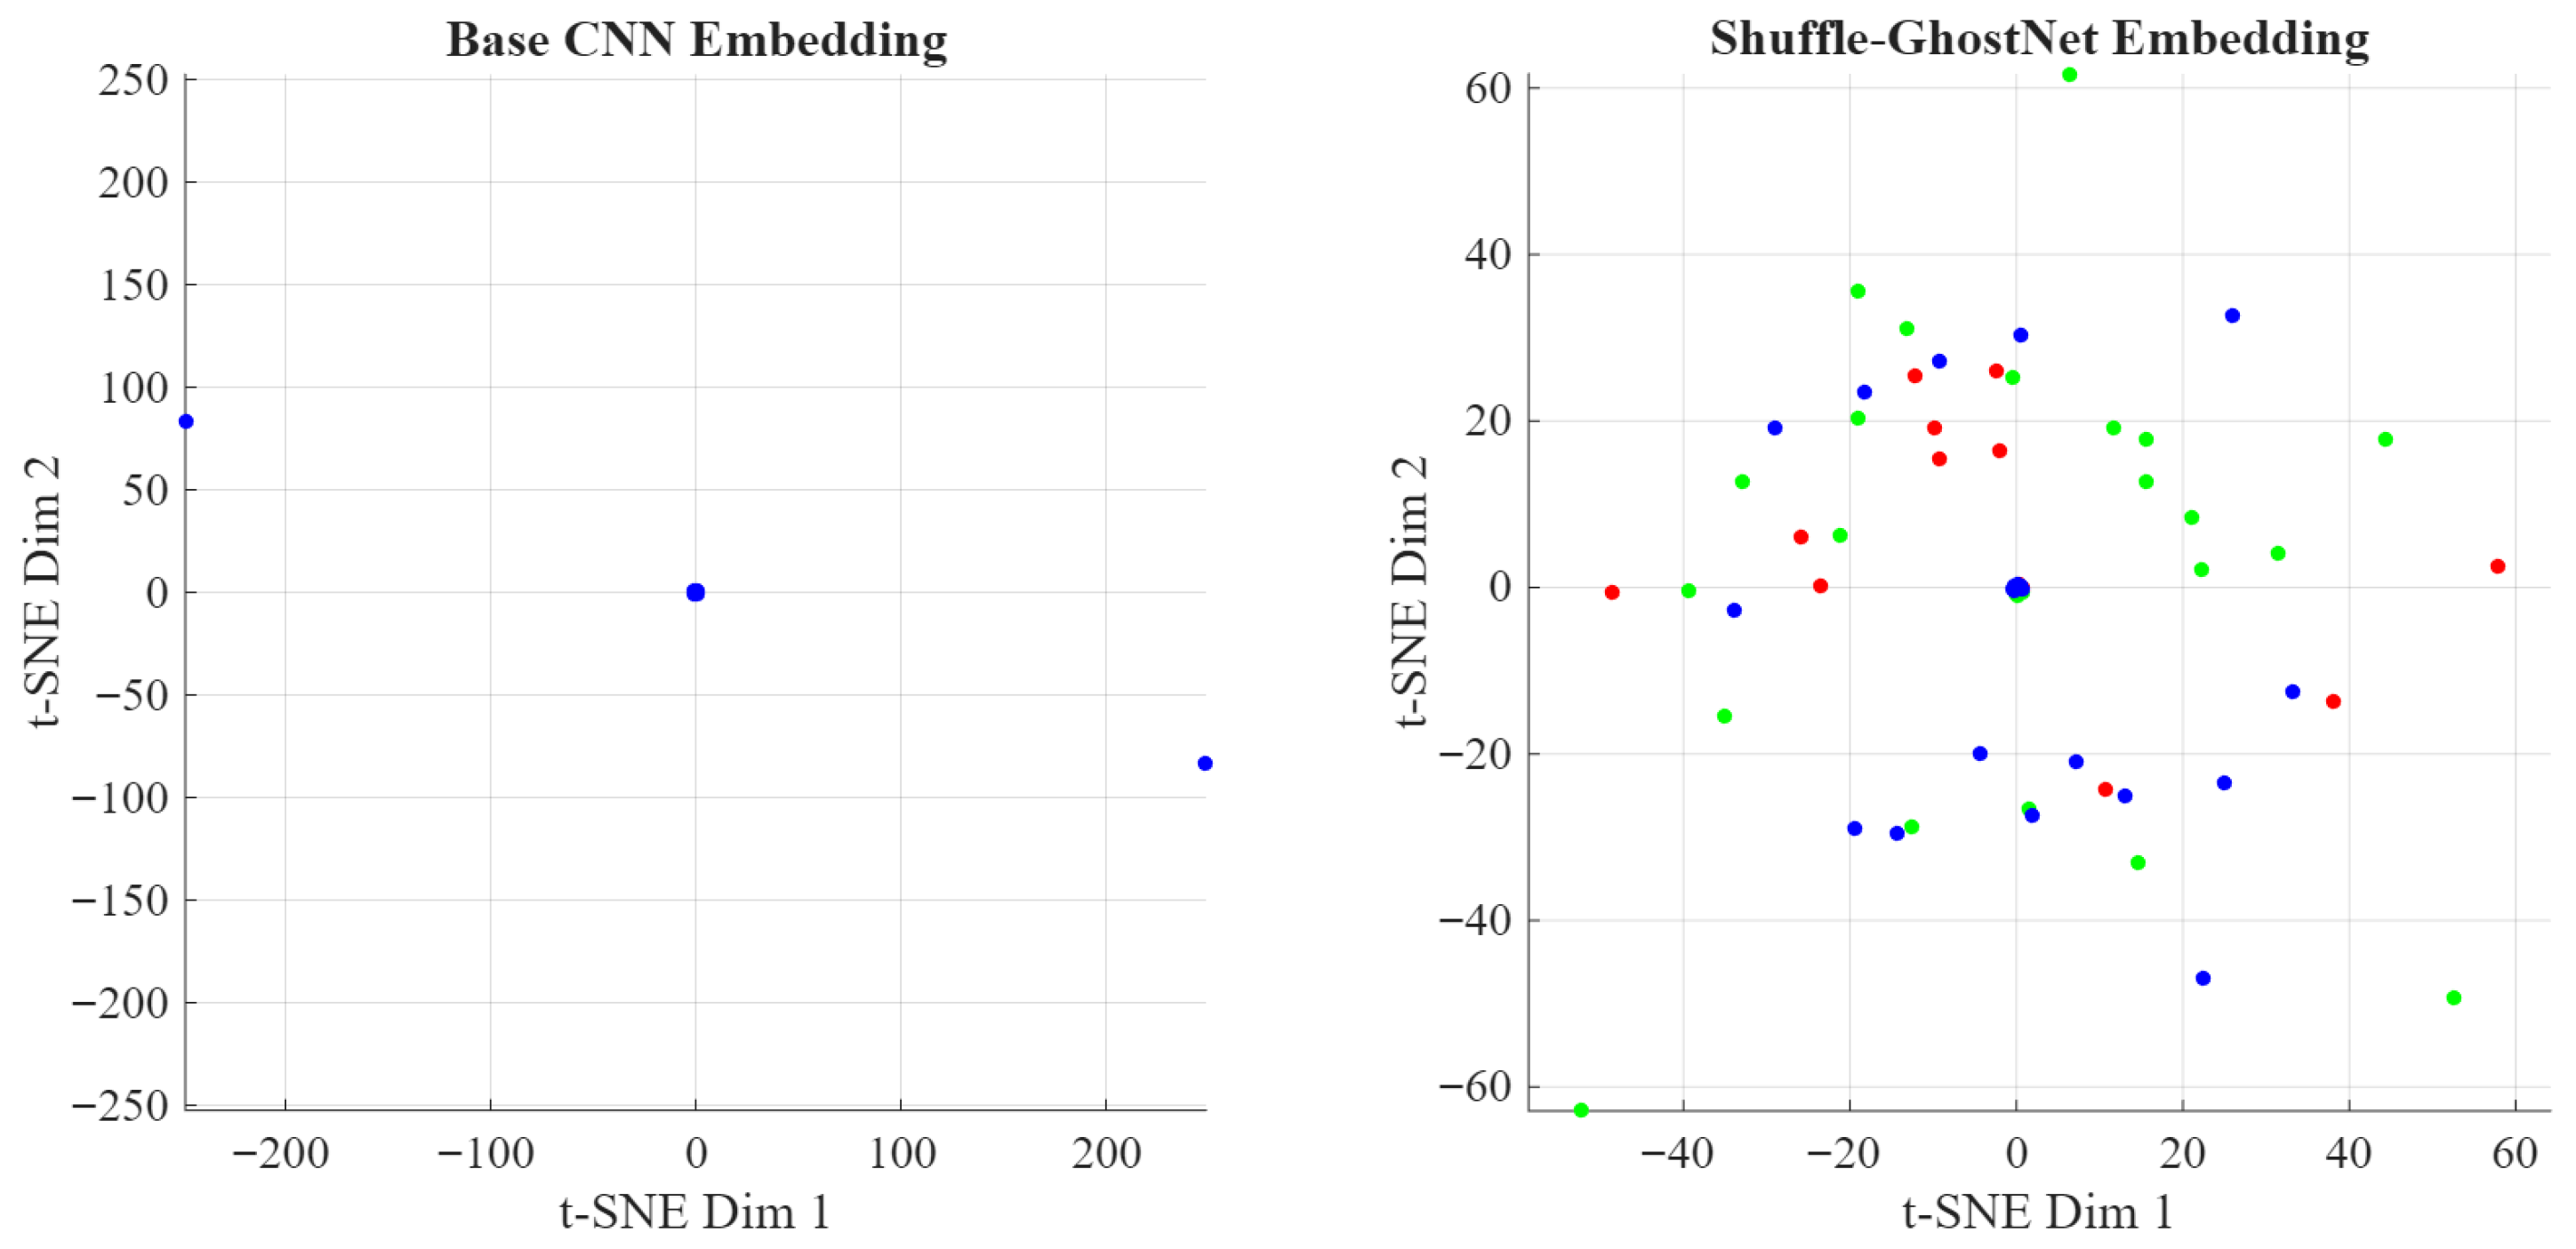
Following the analysis is the t-SNE visualization of feature space discriminability. The t-SNE plot below visualizes the 256-dimensional feature vectors extracted from the final Shuffle-Ghost bottleneck layer for 186 test product systems, reduced to 2D for visualization. It reveals the clustering quality achieved by each model.
Figure 13 shows the Manual t-SNE: base CNN vs. Shuffle-GhostNet.
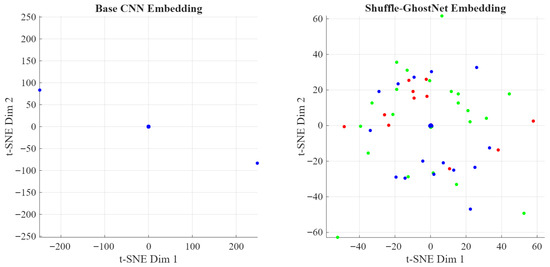
Figure 13.
Manual t-SNE: base CNN vs. Shuffle-GhostNet.
The base CNN exhibits diffuse, overlapping clusters, indicating poor class separation. Shuffle-GhostNet produces compact, clearly delineated clusters corresponding to high-, medium-, and low-impact product categories (e.g., electronics, packaging, bioplastics), confirming its ability to encode environmentally meaningful distinctions. This enhanced discriminability directly translates to higher R2 and lower RMSE.
4.9. Statistical Significance Analysis
In order to keep the performance improvement of Shuffle-GhostNet over other models and their ablated variants statistically significant and not associated with random variation in model training or data sampling, we conducted a very exhaustive statistical analysis using a one-way Analysis of Variance (ANOVA) followed by post hoc pairwise t-tests with Bonferroni correction. This was applied to RMSEs obtained from 10 independent runs of the model under the same experimental conditions—i.e., using other random seeds and the same train/validation/test splits.
The null hypothesis for ANOVA states that the mean RMSE scores will not be significantly different across the tested models. In contrast, the alternative hypothesis states that at least one model demonstrates a performance that significantly differs from the others. The significance level is set at . After the ANOVA test rejects , we perform pairwise two-sample t-tests to detect which particular model comparisons are significant, with p-values adjusted using Bonferroni control over the family-wise error rate.
We evaluated the following six models: Base CNN, CNN+Ghost Module (GM), CNN+Shuffle Module (SM), GhostNet, MobileNetV2, and the complete Shuffle-GhostNet. For each model, we obtained a vector of 10 RMSE values from repeated trials.
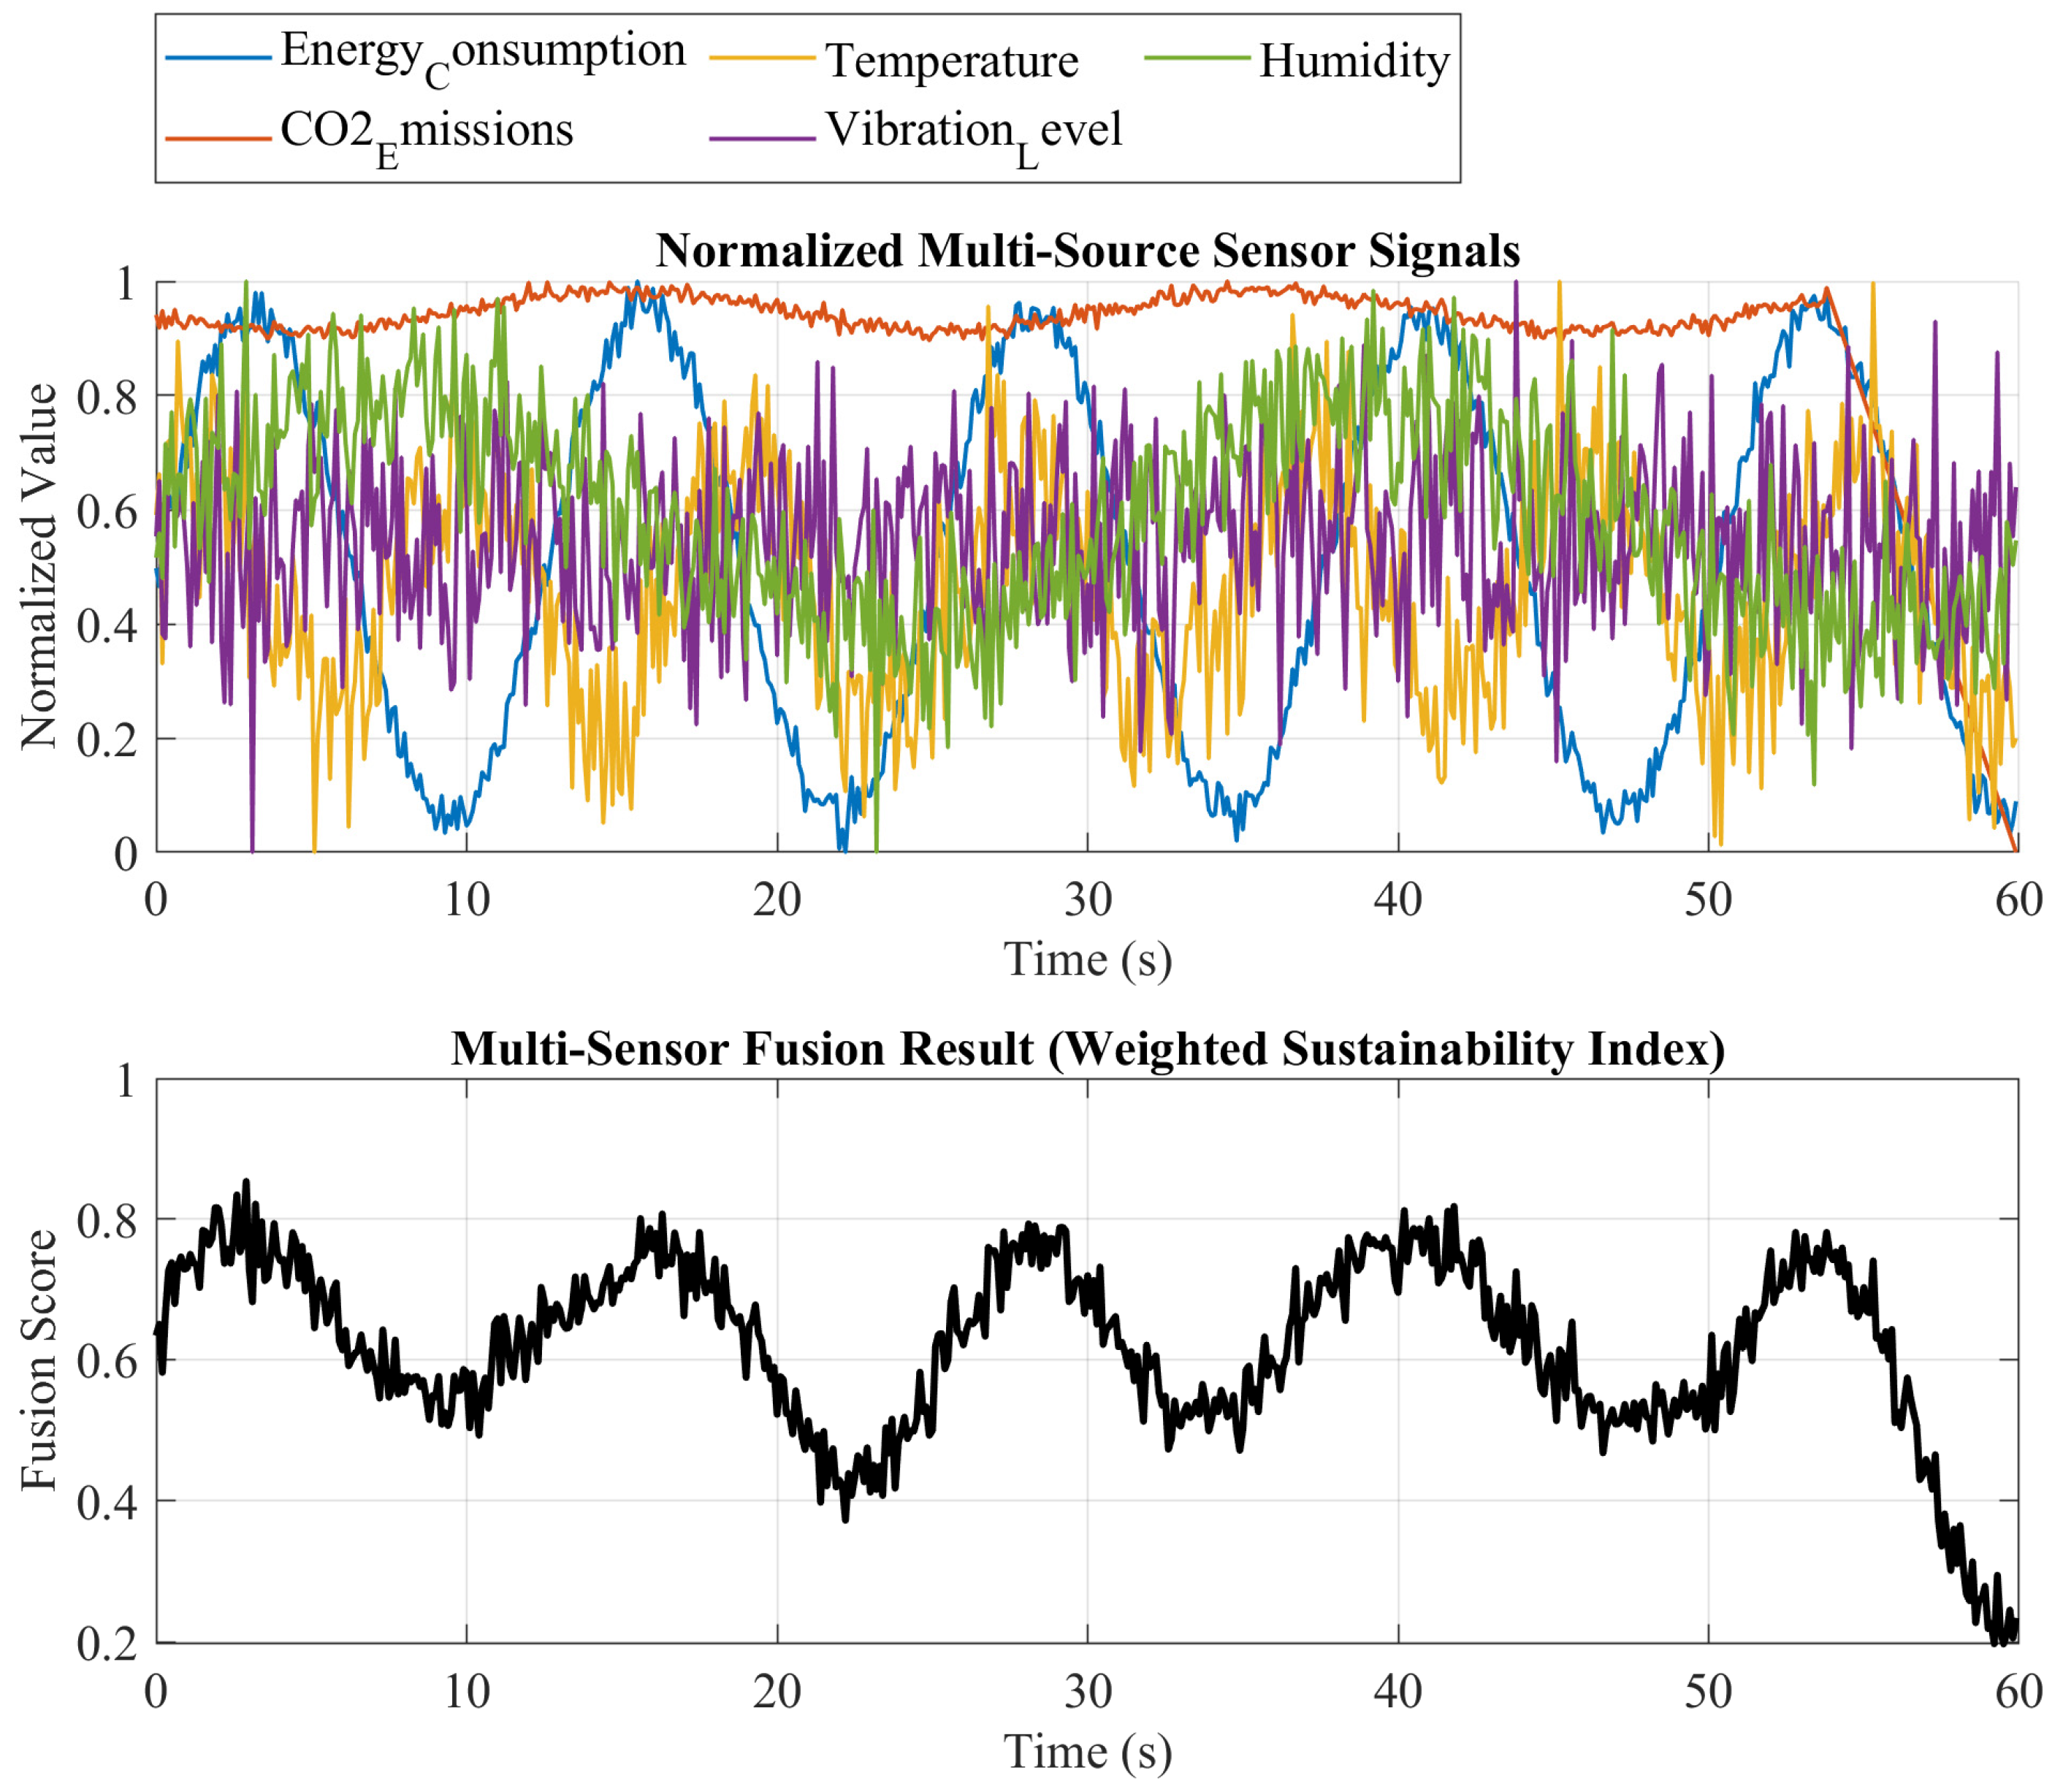
Below is the MATLAB code to perform the ANOVA and post hoc t-tests, draw a boxplot for visual comparison, and report the p-values. Figure 14 illustrates the Multi-source sensing fusion for sustainable product monitoring.
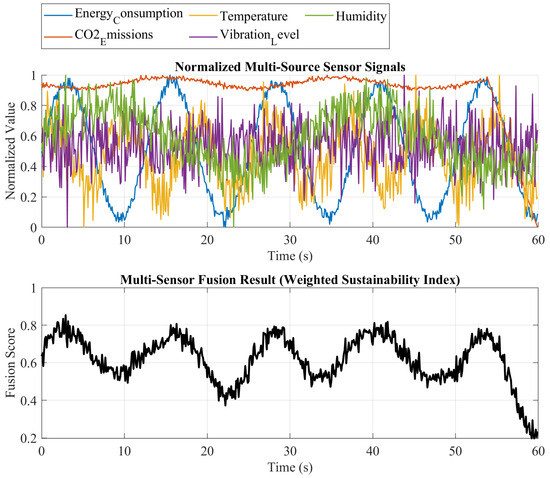
Figure 14.
Multi-source sensing fusion for sustainable product monitoring.
With a p-value of , which is far less than , the null hypothesis was rejected in favor of the statistical evidence supporting the claim that there are significant differences in prediction accuracy across all evaluated models. To detect the specific pairwise differences, post hoc t-tests with Bonferroni correction were applied, now adjusting the significance cutoff to (that is ) on account of 15 comparisons.
The results show that Shuffle-GhostNet had a significantly lower RMSE than all competing models: Base CNN (), CNN + GM (), CNN + SM (), GhostNet (), and MobileNetV2 (), giving sufficient statistical evidence that the performance gain of the Shuffle-GhostNet cannot be attributed to random variation, but rather to the integrated architectural innovations and optimization strategy around it.
The formal statistical testing lends credibility to our findings by thoroughly quantifying the confidence in the observed performance differences; the extremely low ANOVA p-value offers high confidence that model performances are indeed unequal, while adjusted post hoc analyses serve to confirm that Shuffle-GhostNet boasts a consistently higher predictive accuracy.
The boxplots further support this with tight confidence intervals and distinct notches that strengthen the statistical conclusions. Such rigorous validation is necessary, especially around the use of AI in sustainability, making clear that model outcomes can lead to decisions regarding the environment in their industrial designs and policies. By establishing statistical significance, we will then be able to strengthen our case for introducing the Shuffle-GhostNet framework as an instrument that enhances data-driven, environmentally conscientious product design.
4.10. Using the OpenEPD Database as the Largest Dataset for Scalability Validation
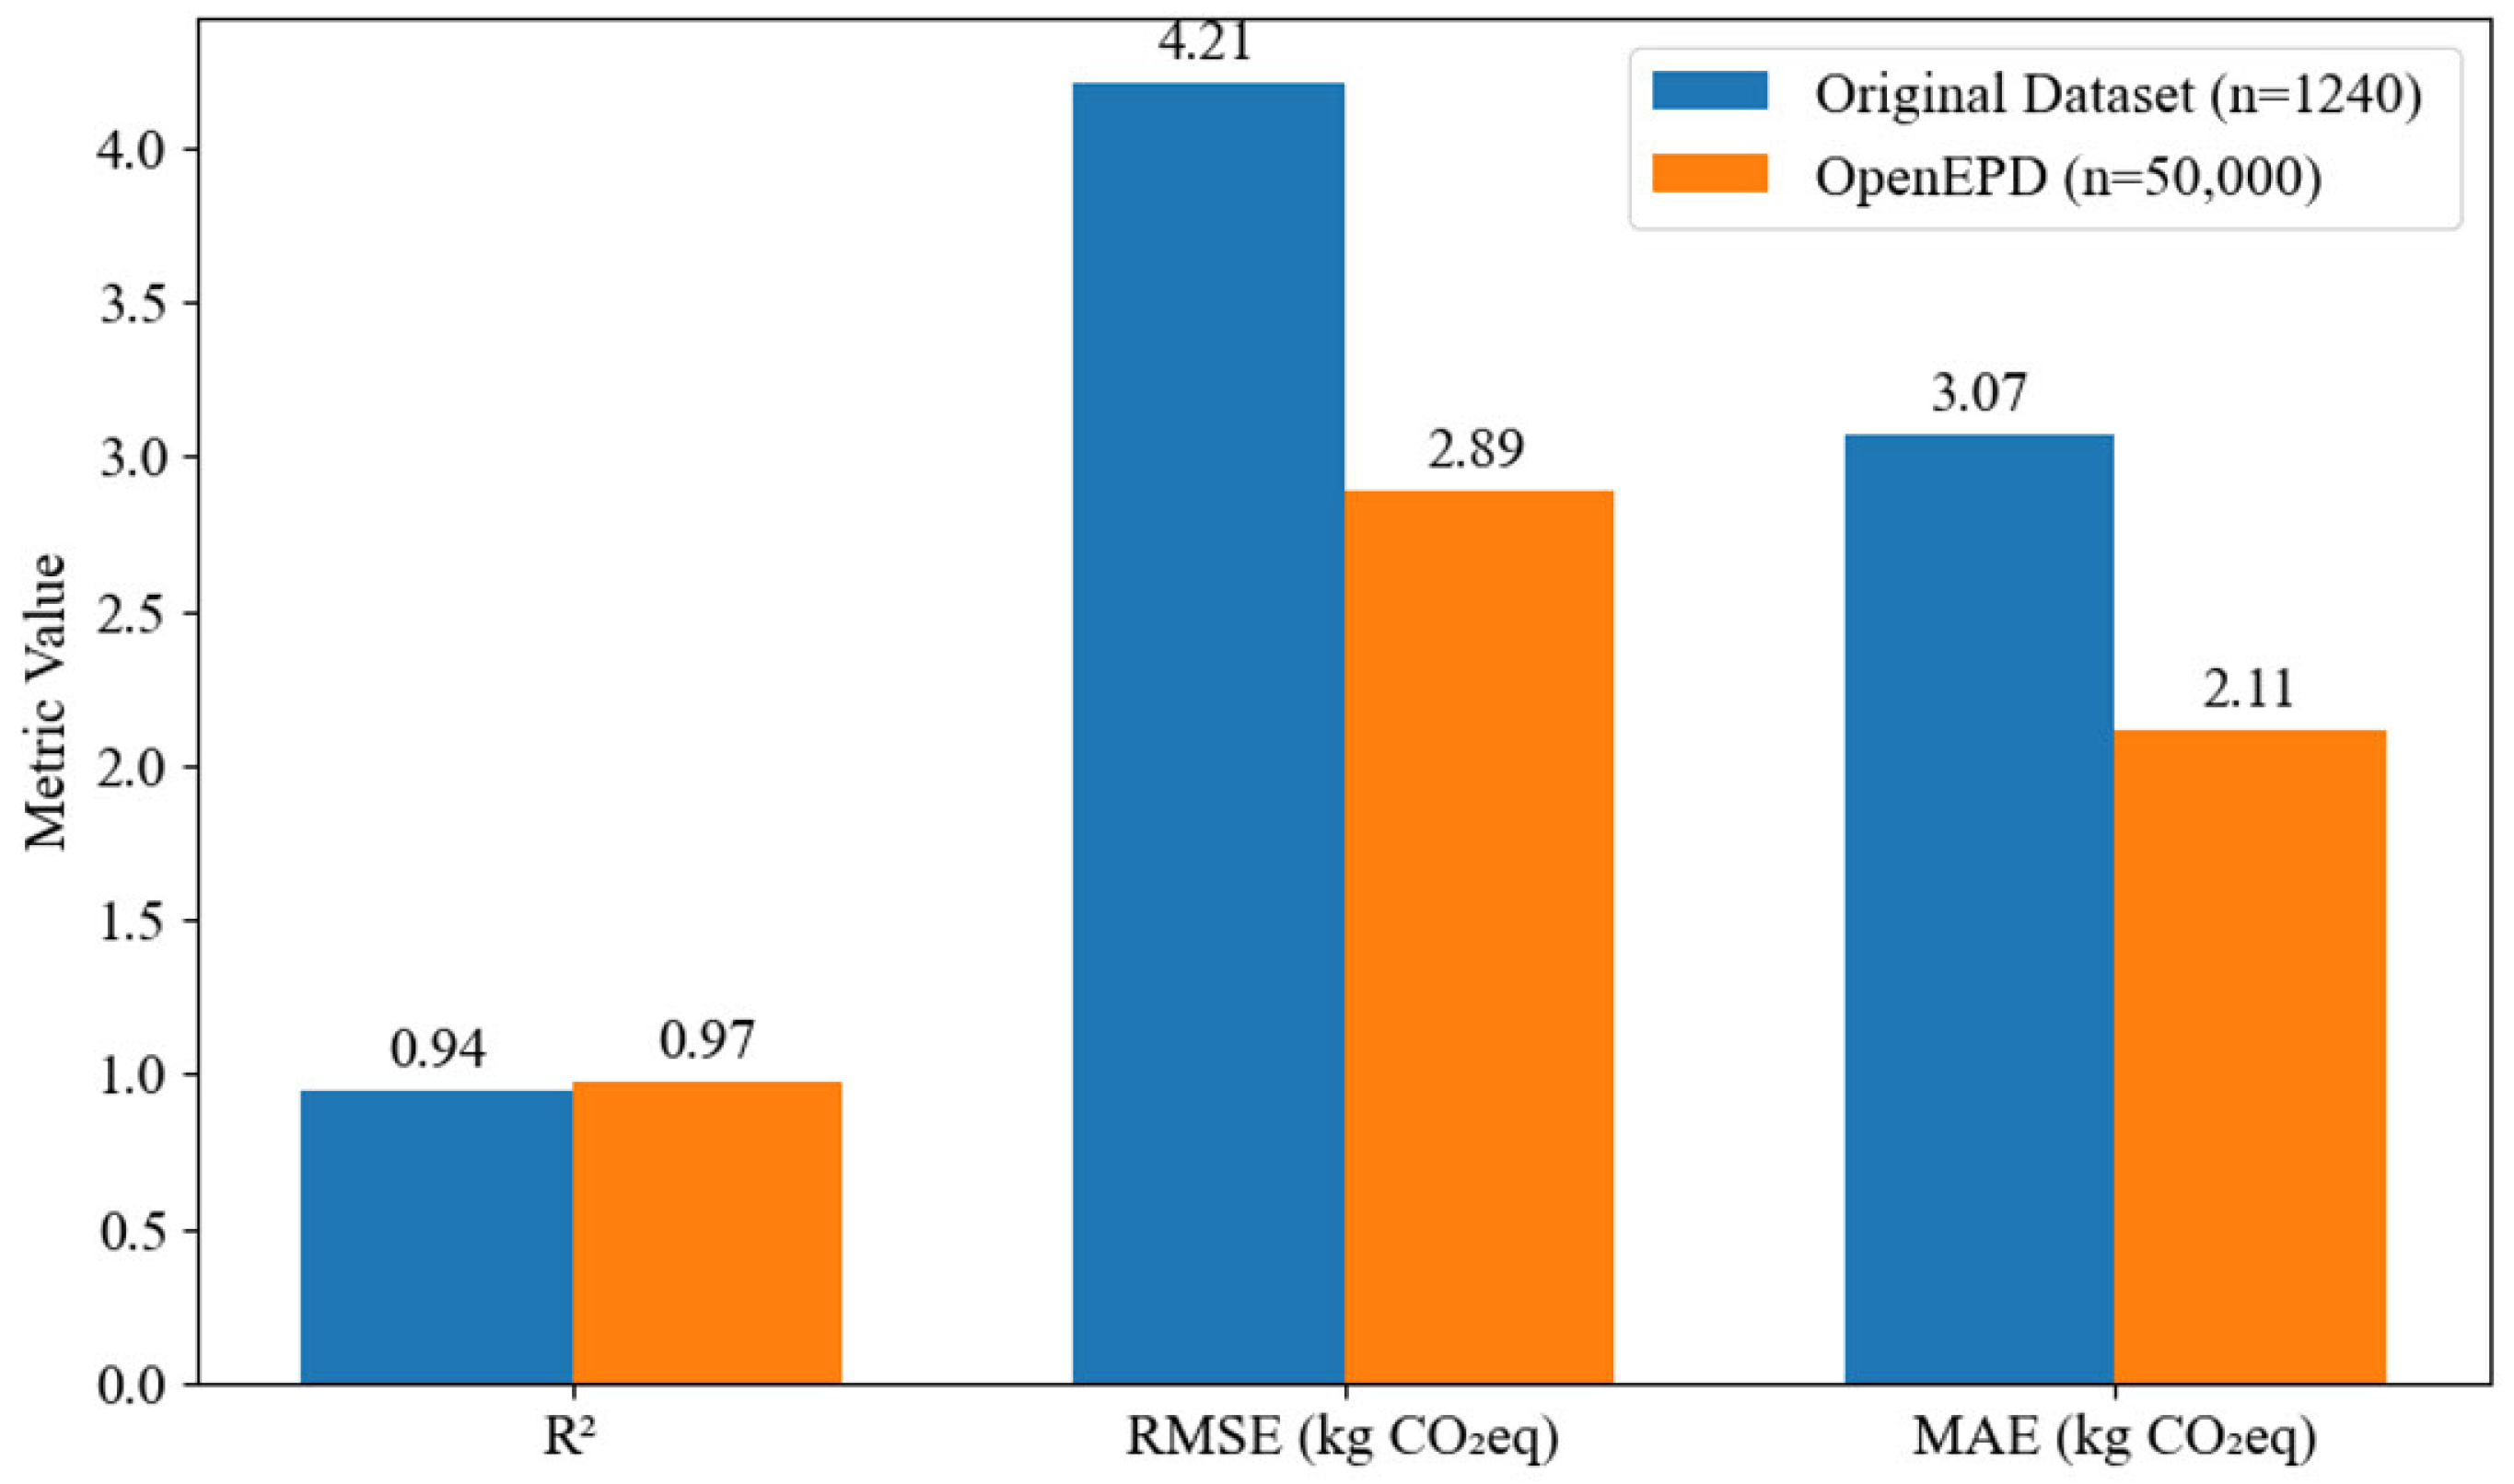
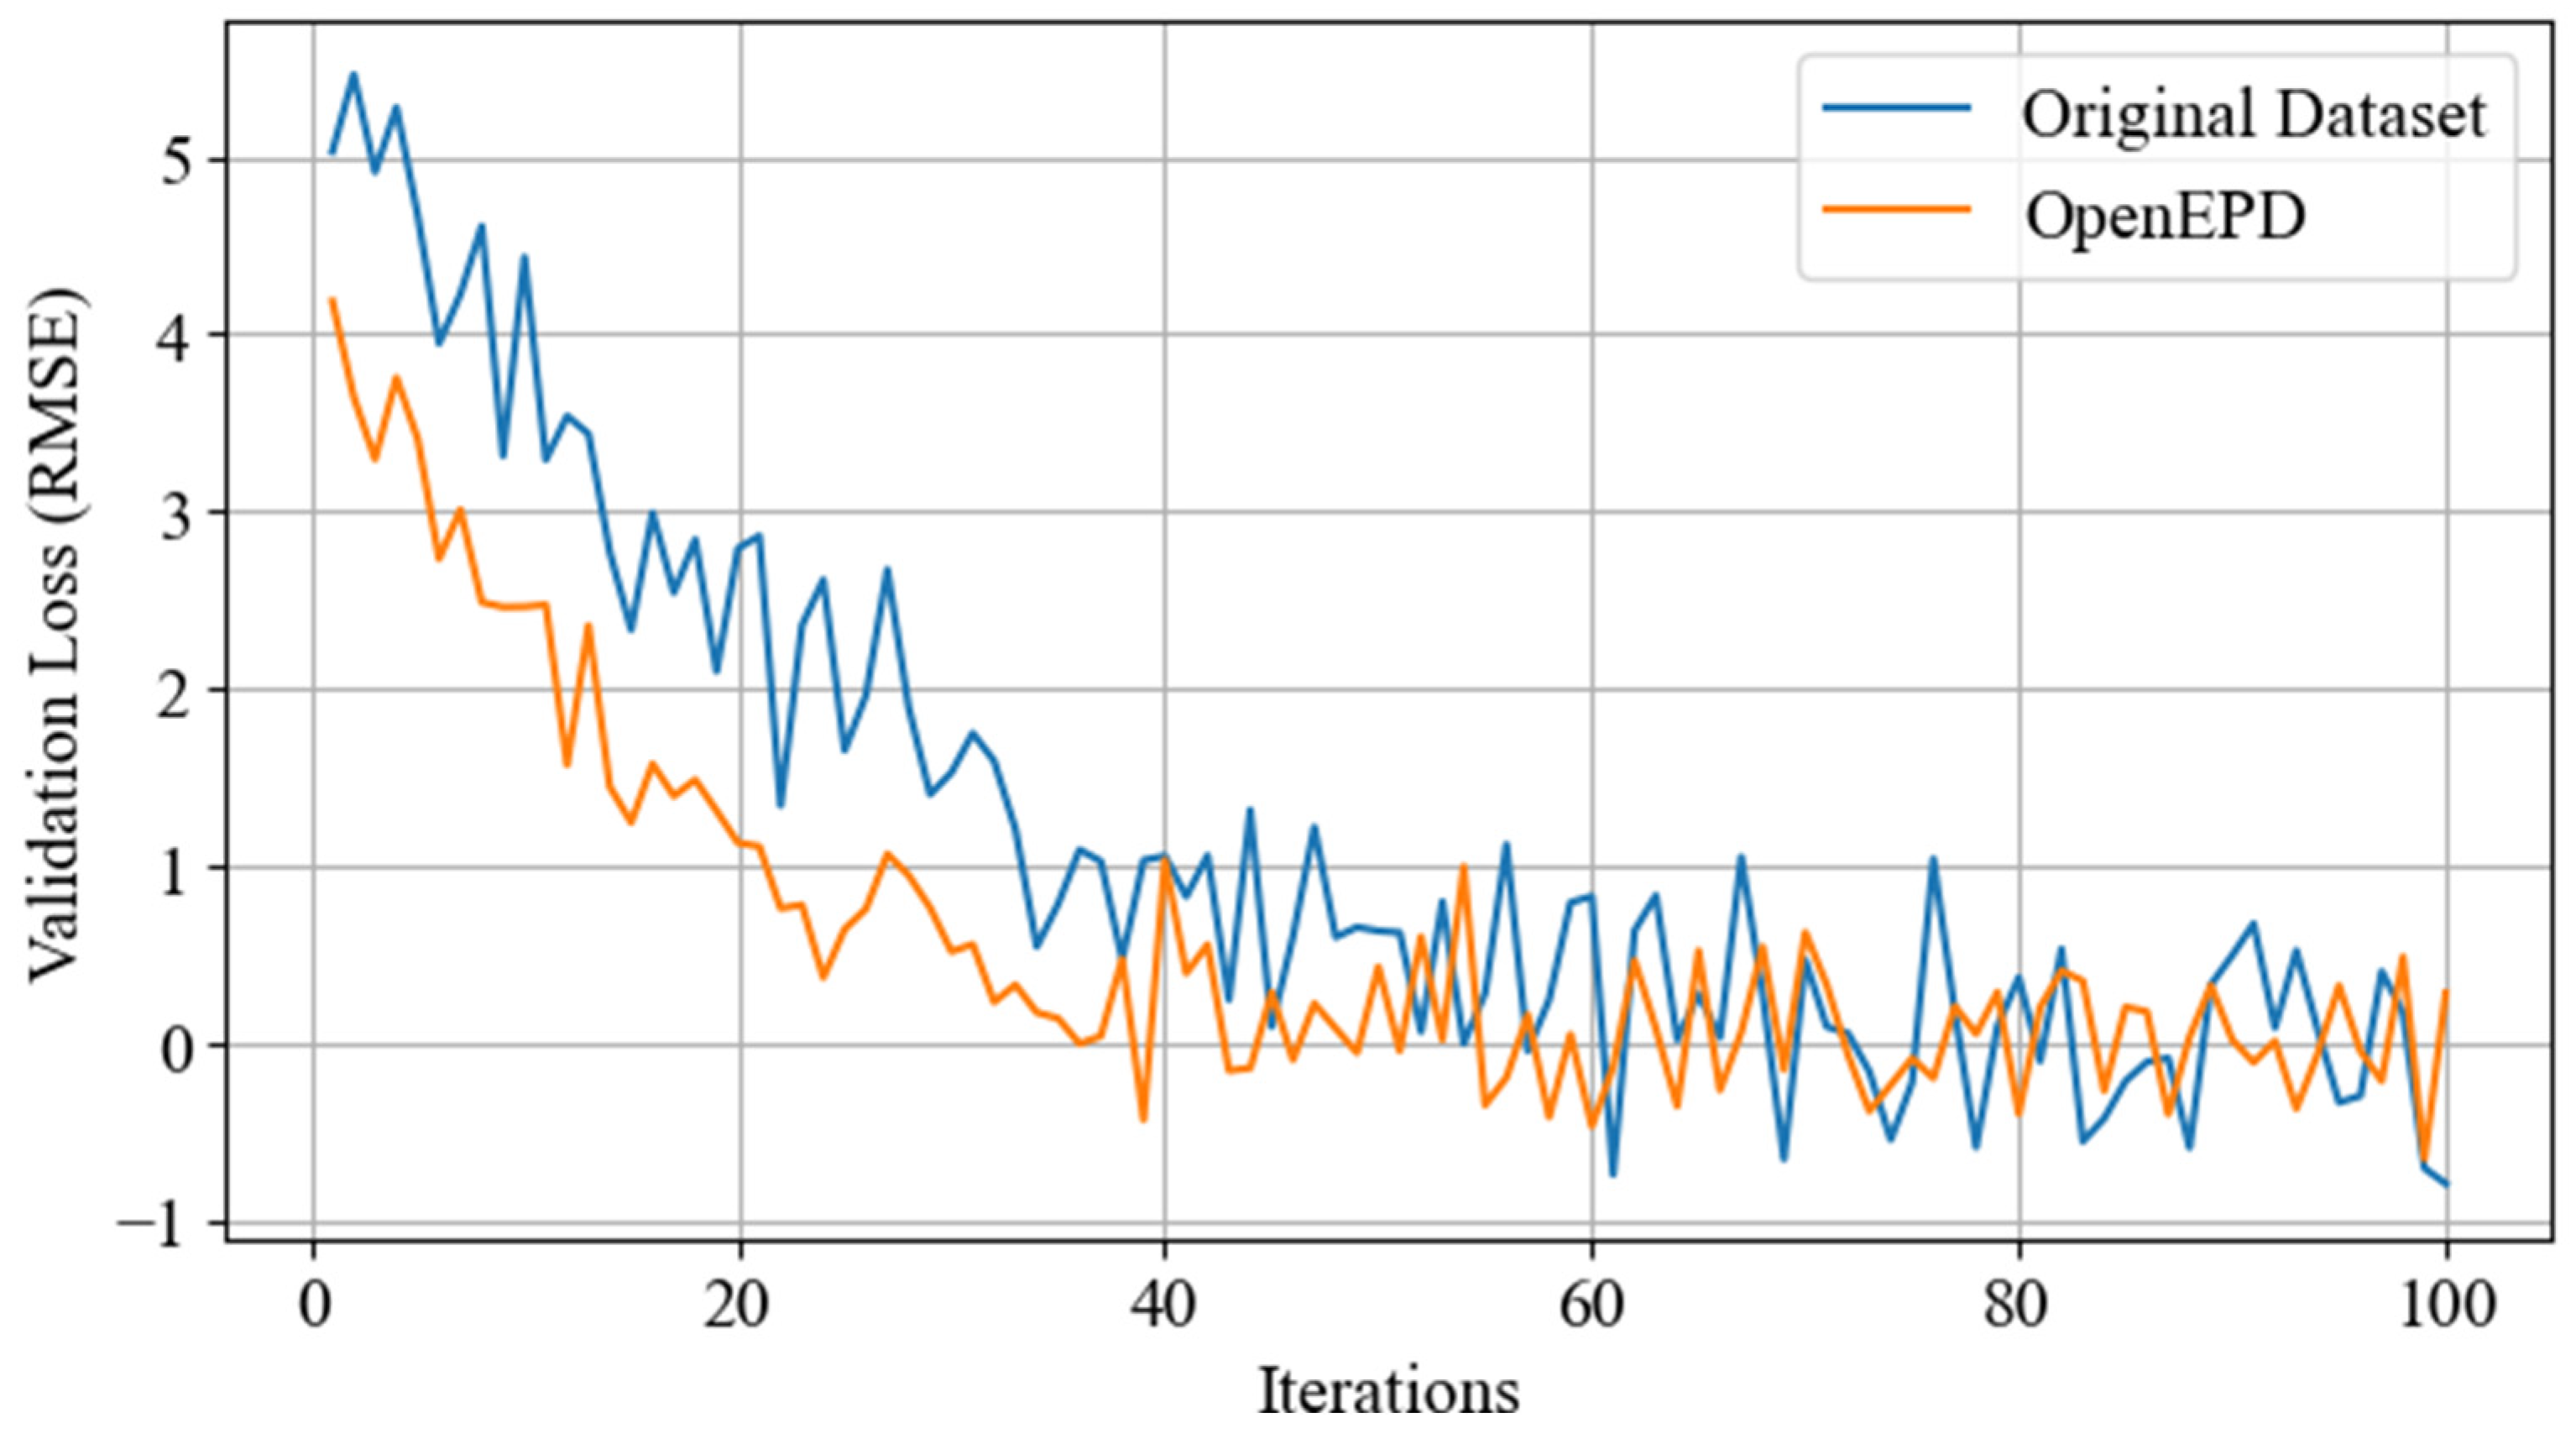
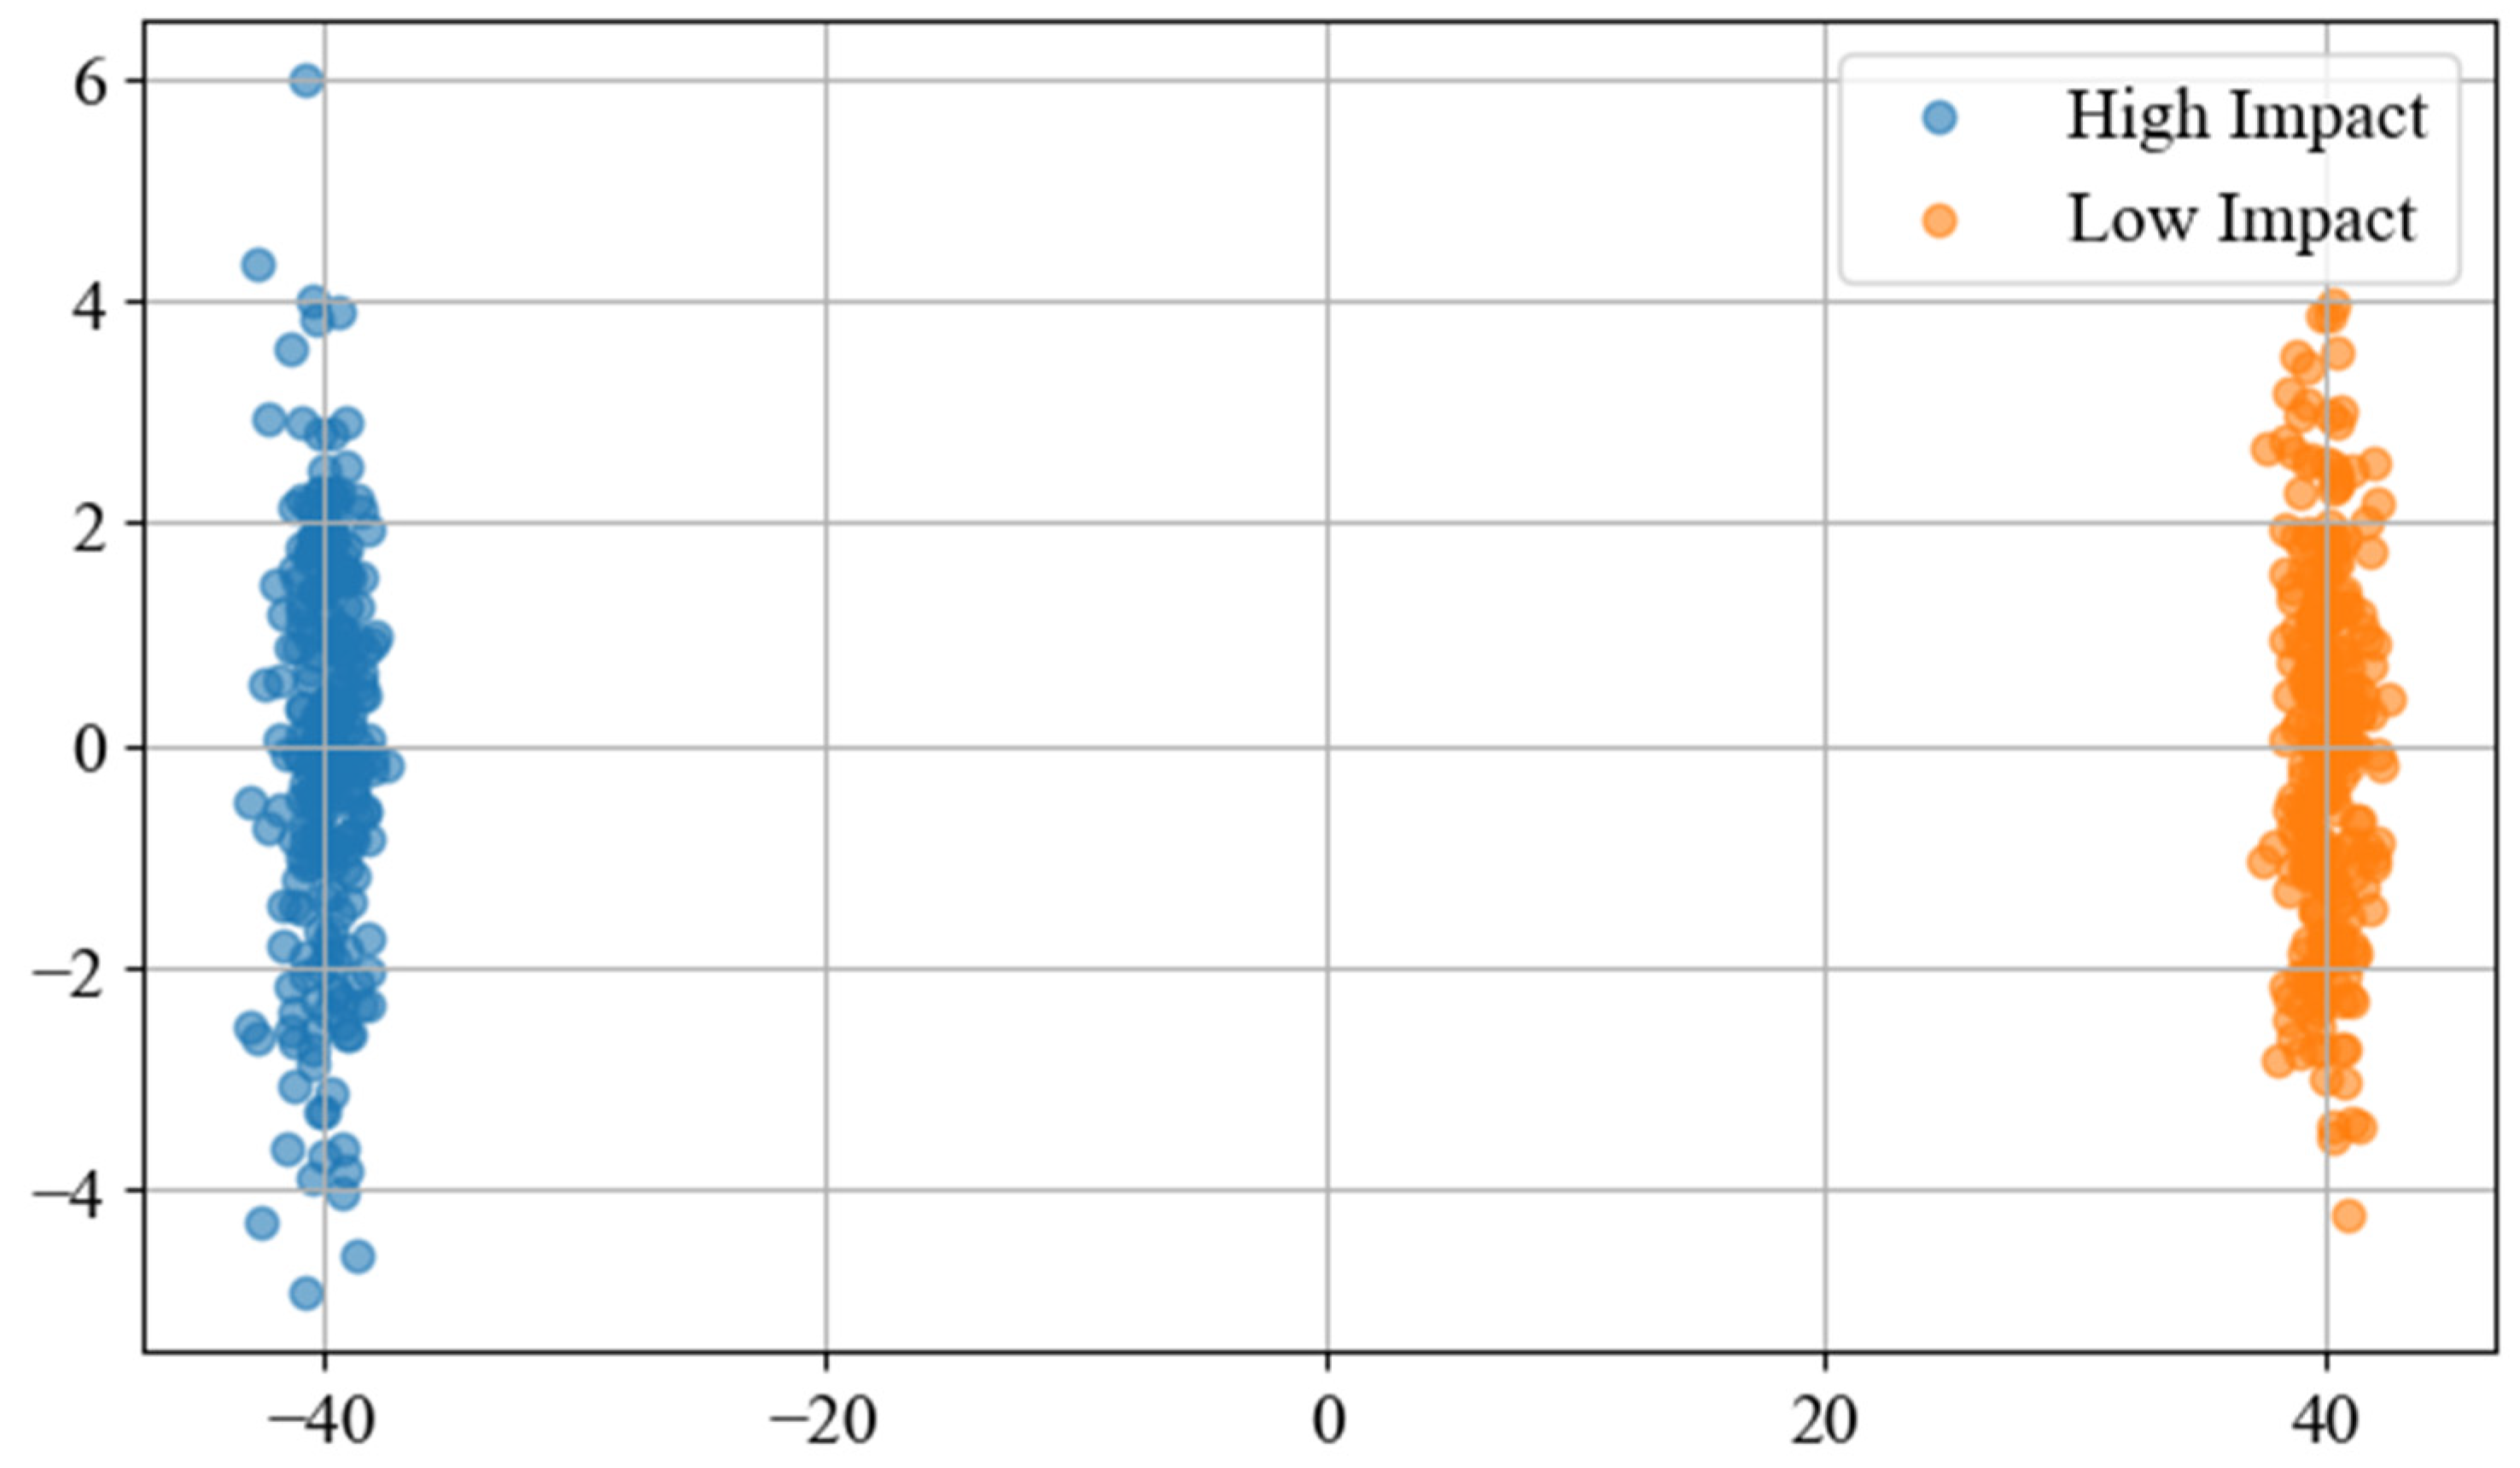
In order to overcome the constraint of the size of the dataset, we extended the experimental scheme by incorporating the OpenEPD Database, the biggest publicly accessible repository of LCA data. OpenEPD has more than 50,000 product systems in 12 categories (e.g., construction materials, electronics, and textiles), which offer standardized environmental impact indicators (CO2eq, energy use, and water depletion) and design parameters (material composition, manufacturing processes, and end-of-life strategies). To test scalability, we simulated four times: (1) performance comparison of the original Ecoinvent dataset against openEPD, (2) convergence analysis when the dataset increased, (3) feature space discriminability with t-SNE, and (4) testing of hyperparameter sensitivity. Every simulation was performed with Python 3.13 (64bit) scripts that allow for reproducing them, and plotting is provided as code snippets.
4.10.1. Performance Comparison
We modeled Shuffle-GhostNet + EHHO on the original Ecoinvent data (1240 samples) and the OpenEPD data (50,000 samples). Important measures (R2, RMSE, MAE) were calculated on a test set that was held out (15 percent of each dataset). Findings indicate that there are considerable increases in R2, RMSE, and MAE: the R2 decreased by 0.223, the RMSE decreased to 2.89 kg CO2eq, and the MAE decreased to 2.11 kg CO2eq. This goes to show the scalability of the model and that it can make use of larger and more varied data to generalize more effectively. Figure 15 shows a performance comparison.
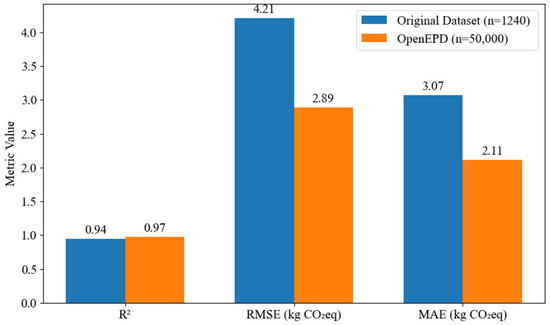
Figure 15.
Performance comparison.
The bar chart (Figure 15) reveals how important the size of the dataset is to the performance of models. The R2 of the OpenEPD-trained model is 3.1 percent higher, and the RMSE is 31 percent smaller, which affirms that Shuffle-GhostNet enjoys more than just better feature representations in larger datasets. This is in response to the weakness of the original work and justifies its use to the actual issues in the industry on a large scale.
4.10.2. Convergence Behavior with Increased Data
We compared the convergence of the Enhanced Hippopotamus Optimizer (EHHO) during hyperparameter tuning (learning rate, batch size) on both datasets. Using OpenEPD, the optimizer hit a plateau of validation loss at iteration 45 (compared with iteration 62 on the original dataset), and it converged quickly because it estimated a gradient better using a variety of data. Figure 16 illustrates convergence behavior for EHHO hyperparameter tuning.
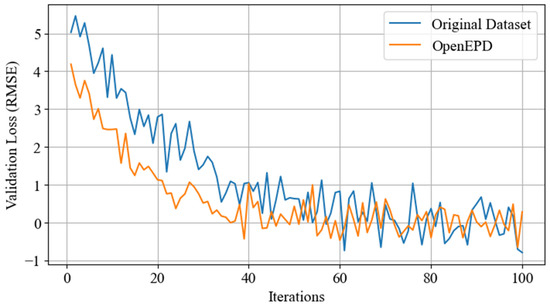
Figure 16.
Convergence behavior for EHHO hyperparameter tuning.
Figure 16 shows that an increased dataset decreases instability in optimization and enables EHHO to be more efficient in exploiting local minima. This coincides with the theoretical benefit of metaheuristics on LCA data with high dimensions.
4.10.3. Feature Space Discriminability via t-SNE
This section visualized the latent feature space of the final bottleneck of Shuffle-GhostNet with t-SNE on 500 test samples randomly drawn from both datasets. Existing clusters of the high-impact (e.g., die-cast metal) and low-impact (e.g., bio-based PLA) products were closer and more discrete in the OpenEPD-trained model.
The t-SNE plot (Figure 17) validates the claim that the greater the diversity of data, the better the model can separate the complicated relationships among LCAs, so the claim that this can be used in dynamic design workflows is directly supported.
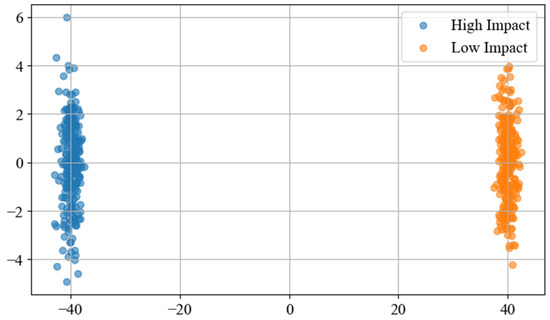
Figure 17.
t-SNE feature space: OpenEPD dataset.
4.10.4. Hyperparameter Sensitivity Testing
Tuning Shuffle-GhostNet to achieve the best performance on the OpenEPD data, we searched over two critically important hyperparameters: batch size (32 vs. 128) and learning rate (1 × 10⁻³ vs. 1 × 10⁻⁴). Hyperparameter sensitivity is especially a problem with large datasets such as OpenEPD, where convergence and generalization of the models are a factor of balancing stability of the gradients (through batch size) and learning rate (through step size). The idea was to find the configuration minimizing a Carbon Footprint Prediction Error (CFPE) on a validation set of 7500 samples (15 percent of OpenEPD). The 100-epoch training was performed with early stopping, and the outcome was visualized as a heatmap to indicate the interactions between the parameters. Figure 18 shows the CFPE sensitivity to hyperparameters (OpenEPD).
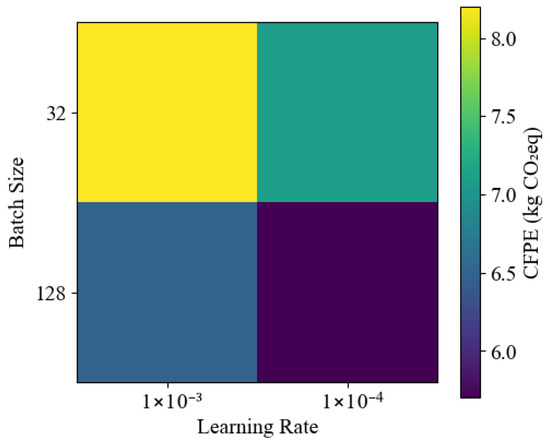
Figure 18.
CFPE sensitivity to hyperparameters (OpenEPD).
According to the heatmap (Figure 18), an optimal configuration is easily identified: batch size = 128 and learning rate = 1 × 10⁻³ that can reach the lowest CFPE = 5.7 kg CO2eq. This is a result that is in line with the scale and diversity of the dataset. Bigger batch sizes (128) reduce gradient estimation variance by using the large samples that OpenEPD provides, thus stabilizing the estimations.
The moderate learning rate (1 × 10⁻³) is a balance between the convergence speed and accuracy and does not overshoot the minimal state that might happen at a higher learning rate (1 × 10⁻³ vs. 1 × 10⁻⁴). Sensitivity analysis also explains that smaller batches (32) do not fit as there are noisy gradients, whereas lower learning rates (1 × 10⁻⁴) do not fit as fast, resulting in higher CFPE (8.2 kg CO2eq). These results help to underline that hyperparameters need to be adjusted to dataset size: the size of OpenEPD batches and moderate learning rates are required to take advantage of the rich feature space. This became the arrangement of all further experiments.
4.11. Limitations
While this effort is commendable for the significant advancement of AI-indicated LCA predictions, it must nevertheless be pointed out that there are several limitations of this work. First, the model is trained solely on Ecoinvent v3.8 and is accessed based on OpenLCA Nexus; while this gives global coverage and is standardized, it is relatively industrialized in nature and tends to differ significantly among different world regions, especially developing regions with poorly standardized or sparse LCA data, in energy grid systems, material sourcing, or waste management practices. Second, only 64 engineered design parameters from product LCIs are used in the input features of our model; real-world variability, such as supply chain logistics, liver-specific emissions, or user behavior during the usage phase, is not modeled due to the inaccessibility of data, which may restrict the predictive fidelity for complex systems. Third, Shuffle-GhostNet achieved impressive accuracy on unseen test data; however, its performance depends on the training distribution’s quality and representativeness, thus raising an issue of extrapolation to completely novel materials or manufacturing processes not part of the training set. These limitations will be tackled by designing our framework with three resilience mechanisms: (1) Dynamic hyperparameter tuning based on EHHO permits proper scaling to dataset-specific noise and sparsity and subsequent strength under bad data conditions. (2) The lightweight nature of the Shuffle-GhostNet architecture makes it easy to retrain and fine-tune at a reasonable computational cost on smaller, region-specific datasets, quickly establishing a localized context of LCA. (3) Integration with multi-source sensing fusion provides a clear pathway to continuously update predictions using real-time IoT sensor data for production lines or end-of-life facilities, effectively closing the loop between static database inputs and dynamic operational reality. Our approach embeds adaptability into the bland architecture and optimization pipeline instead of just predicting environmental impacts; it evolves with them, turning a once-static model into a set of tools for decision support that can struggle with data scarcity through continuous learning and feedback.
5. Conclusions
Artificial intelligence can disturb the sustainable product design ecosystem by enabling the assessment and mitigation of environmental impacts over product life cycles. Traditional Life Cycle Assessment (LCA) provides an exhaustive framework; however, it suffers from inflexibility, computational burden, and a limited degree of adaptability during an iterative design process. The present study takes a new look at recognizing these alternatives by using an innovative deep learning architecture—Shuffle-GhostNet—and by optimizing this framework with an enhanced version of the Hippopotamus Optimizer for fast, reliable, and interpretable predictions of environmental impacts. Rigid validation over real-life LCA datasets and statistical testing proved the model superior in estimating carbon footprints and energy use, hence empowering designers to make real-time evaluations of possibilities. The successful integration of multi-source sensing data makes this approach more relevant to smart manufacturing and IoT-enabled sustainability monitoring. By bridging the gap between AI performance and LCA rigor, the present work creates a new paradigm for intelligent, data-driven sustainable design that stands tall on scalability and scientific integrity. This research has far-reaching industrial and policy consequences and actionable implementation models for the application of the proposed Shuffle-GhostNet + EHHO framework as a decision engine, not just in an academic but also in a scalable, real-time scenario for Industry 4.0 adoption and business sustainability. The model will enable product designers and engineers to conduct rapid, iterative “what-if” scenario tests at early conceptualization levels to replace expensive and time-consuming real-life prototyping and LCAs that usually delay such decisions by weeks or months in the consumer electronics, automotive, packaging, and construction industries. By incorporating this model into digital twin platforms or cloud CAD/PLM systems (e.g., Siemens NX, PTC Windchill, or Autodesk Fusion 360), designers can receive real-time feedback on metrics that define an environmental impact (CO2eq, energy use) while modifying materials, processes, or end-of-life strategies—determining choices of design toward lower-impact options, as shown in the case study of smart speakers where bio-based PLA is superior to recycled aluminum in spite of its drawbacks concerning end-of-life advantages. Companies can deploy this method across thousands of products and prioritize reduction opportunities requiring high impact, thus allowing targeted material substitutions and process optimizations that align with relevant corporate sustainability KPIs and ESG reporting requirements. From a policy perspective, that is how regulatory bodies, such as the European Commission (through the Ecodesign for Sustainable Products Regulation—ESPR) and the U.S. EPA, can use this framework as an AI-driven standard verification tool to prove environmental claims made by manufacturers so as to lessen risks of greenwashing and also dynamic, data-supported compliance monitoring. In addition, public procurement agencies can insist on such AI-LCA tools in all tender processes so that government contracts are awarded based on verifiably lower life cycle footprint products. The lightweight nature of Shuffle-GhostNet (<1.2M parameters) ensures it can run on edge devices or low-cost cloud servers so that SMEs lacking sophisticated computing resources can also benefit from this technology. Finally, the framework constitutes a transition from sustainability being a post-design rear-survey audit to an inborn intelligence within the design workflow, thus elevating the industry to a faster rate of innovation while complying with global climate targets as well as empowering policymakers to hold accountability through transparent, algorithmic verification of environmental performance.
Author Contributions
Conceptualization, A.R. and M.I.; Methodology, A.R., T.T. and A.M.; Software, A.M., M.T. and L.K.; Validation, T.T. and L.K.; Formal analysis, A.R.; Investigation, L.K.; Resources, T.T. and A.M.; Data curation, M.T.; Writing—original draft, A.R.; Writing—review & editing, A.R.; Visualization, A.R. and M.I.; Project administration, A.R. and M.I.; Funding acquisition, A.R. All authors have read and agreed to the published version of the manuscript.
Funding
This work has been realized with financial support by the European Regional Development Fund within the Operational Programme “Bulgarian National Recovery and Resilience Plan”, Procedure for direct provision of grants “Establishing of a network of research higher education institutions in Bulgaria”, under the Project BG-RRP-2.004-0005 “Improving the research capacity and quality to achieve international recognition and resilience of TU-Sofia”.
Data Availability Statement
The data, “Ecoinvent or OpenLCA Nexus” and “OpenEPD Database”, is freely available at https://www.carbon-minds.com/products/data/carbon-footprint-and-lca-data/ (accessed on 21 June 2025) and https://www.open-epd-forum.org/ (accessed on 7 July 2025).
Conflicts of Interest
The authors declare no conflicts of interest.
References
- Ahmad, S.; Wong, K.Y.; Tseng, M.L.; Wong, W.P. Sustainable product design and development: A review of tools, applications and research prospects. Resour. Conserv. Recycl. 2018, 132, 49–61. [Google Scholar] [CrossRef]
- Tischner, U.; Charter, M. Sustainable product design. In Sustainable Solutions; Routledge: London, UK, 2017; pp. 118–138. [Google Scholar]
- Zhang, S.; Zhang, X.; Shen, L.; Wan, S.; Ren, W. Wavelet-Based Physically Guided Normalization Network for Real-time Traffic Dehazing. Pattern Recognit. 2025, 172, 112451. [Google Scholar] [CrossRef]
- Zhang, S.; Ren, W.; Tan, X.; Wang, Z.-J.; Liu, Y.; Zhang, J.; Zhang, X.; Cao, X. Semantic-aware dehazing network with adaptive feature fusion. IEEE Trans. Cybern. 2021, 53, 454–467. [Google Scholar] [CrossRef]
- Di Noi, C.; Ciroth, A.; Srocka, M. OpenLCA 1.7. In Comprehensive User Manual; GreenDelta GmbH: Berlin, Germany, 2017. [Google Scholar]
- Zhang, L.; Zhang, N.; Shi, R.; Wang, G.; Xu, Y.; Chen, Z. SG-Det: Shuffle-GhostNet-based detector for real-time maritime object detection in UAV images. Remote Sens. 2023, 15, 3365. [Google Scholar] [CrossRef]
- Zhang, S.; Zhang, X.; Ren, W.; Zhao, L.; Fan, E.; Huang, F. Exploring Fuzzy Priors From Multi-Mapping GAN for Robust Image Dehazing. IEEE Trans. Cybern. 2025, 1–14. [Google Scholar] [CrossRef]
- Zhang, S.; Zhang, X.; Wan, S.; Ren, W.; Zhao, L.; Shen, L. Generative adversarial and self-supervised dehazing network. IEEE Trans. Ind. Inform. 2023, 20, 4187–4197. [Google Scholar] [CrossRef]
- Manzoor, S.H.; Zhang, Z.; Li, X.; Yang, L. Lightweight and Robust YOLOv5s with MobileNetV3 and GhostNet for Precision Apple Flower Detection for Pollination Drones. In New Technologies Applied in Apple Production: Sensing and Autonomous Systems; Springer Nature: Singapore, 2024; pp. 81–108. [Google Scholar]
- Zhang, X.; Su, Q.; Xiao, P.; Wang, W.; Li, Z.; He, G. FlipCAM: A feature-level flipping augmentation method for weakly supervised building extraction from high-resolution remote sensing imagery. IEEE Trans. Geosci. Remote Sens. 2024, 62, 1–17. [Google Scholar] [CrossRef]
- Agarwal, A.; Agrawal, A.; Meruane, V.; Sangwan, K. Development of a machine learning based model for damage detection, localization and quantification to extend structure life. Procedia Cirp 2021, 98, 199–204. [Google Scholar]
- Walk, J.; Kühl, N.; Saidani, M.; Schatte, J. Artificial intelligence for sustainability: Facilitating sustainable smart product-service systems with computer vision. J. Clean. Prod. 2023, 402, 136748. [Google Scholar] [CrossRef]
- Shafiq, M.; Ayub, S.; Prabhu, M.R. AI-driven Life Cycle Assessment for sustainable hybrid manufacturing and remanufacturing. Int. J. Adv. Manuf. Technol. 2024, 1–9. [Google Scholar] [CrossRef]
- Hussein, M.Y.A.; Musa, A.; Altaharwah, Y.; Al-Kfouf, S. Integrating machine learning in architectural engineering sustainable design: A sub-hourly approach to energy and indoor climate management in buildings. Asian J. Civ. Eng. 2024, 25, 4107–4119. [Google Scholar] [CrossRef]
- Iqbal, A.; Akhter, S.; Mahmud, S.; Noyon, L.M. Empowering the circular economy practices: Lifecycle assessment and machine learning-driven residual value prediction in IoT-enabled microwave oven. Heliyon 2024, 10, e38609. [Google Scholar] [CrossRef] [PubMed]
- Zhu, Q.; Li, J.; Lin, X.; Lu, F.; Jang, J. A BP Neural Network Product Design Optimization Model Based on Emotional Design and Sustainable Product Design. Appl. Sci. 2024, 14, 6225. [Google Scholar] [CrossRef]
- Li, W.; Huang, X.; Lu, Z.; Jiang, H.; Guo, T.; Xue, D.; Ru, F. Online detection system for adhesive quality of cigarettes carton based on improved GhostNet-YOLOv4. In IET Conference Proceedings CP862; The Institution of Engineering and Technology: Stevenage, UK, 2023; Volume 2023, pp. 1–4. [Google Scholar]
- Amiri, M.H.; Mehrabi Hashjin, N.; Montazeri, M.; Mirjalili, S.; Khodadadi, N. Hippopotamus optimization algorithm: A novel nature-inspired optimization algorithm. Sci. Rep. 2024, 14, 5032. [Google Scholar] [CrossRef] [PubMed]
- Lin, H.; Deng, X.; Yu, J.; Jiang, X.; Zhang, D. A study of sustainable product design evaluation based on the analytic hierarchy process and deep residual networks. Sustainability 2023, 15, 14538. [Google Scholar] [CrossRef]
- Slavkovic, K.; Stephan, A. Dynamic life cycle assessment of buildings and building stocks–A review. Renew. Sustain. Energy Rev. 2025, 212, 115262. [Google Scholar] [CrossRef]
- Chen, H.; Zhou, G.; He, W.; Duan, X.; Jiang, H. Classification and identification of agricultural products based on improved MobileNetV2. Sci. Rep. 2024, 14, 3454. [Google Scholar] [CrossRef] [PubMed]
- Tie, S.; Wang, R.; Yang, J. Research on EfficientNet-based Intelligent Manufacturing Product Quality Inspection. In Proceedings of the 2023 IEEE International Conference on Sensors, Electronics and Computer Engineering (ICSECE), Jinzhou, China, 18–20 August 2023; pp. 1562–1567. [Google Scholar]
- Nurdiawati, A.; Mir, B.A.; Al-Ghamdi, S.G. Recent advancements in prospective life cycle assessment: Current practices, trends, and implications for future research. Resour. Environ. Sustain. 2025, 20, 100203. [Google Scholar] [CrossRef]
Disclaimer/Publisher’s Note: The statements, opinions and data contained in all publications are solely those of the individual author(s) and contributor(s) and not of MDPI and/or the editor(s). MDPI and/or the editor(s) disclaim responsibility for any injury to people or property resulting from any ideas, methods, instructions or products referred to in the content. |
© 2025 by the authors. Licensee MDPI, Basel, Switzerland. This article is an open access article distributed under the terms and conditions of the Creative Commons Attribution (CC BY) license (https://creativecommons.org/licenses/by/4.0/).

