Abstract
The exploration of the ecosystem service value of rural tourism destinations and their driving factors is regarded as an important approach for promoting the high-quality development of rural tourism and achieving rural revitalization. At present, both industry and academia lack quantitative analyses and integrated optimization approaches for small-scale landscape elements within the context of rural tourism destinations. An examination of rural ecosystem service values from a small-scale perspective can assist rural areas in precisely enhancing ecological functions, advancing rural landscape construction, and fostering high-quality rural development. Six sample sites within rural tourism areas in the Yangtze River Delta region were selected, and the functional value method, willingness-to-pay method, and binary logistic regression model were comprehensively applied to assess ecosystem service values and their influencing factors. The results indicate that: (1) Significant differences exist in ecosystem service values across small-scale rural landscapes, primarily attributable to variations in cultural service values, which constitute the dominant component of the overall value. (2) Cultural service values are manifested in tourists’ willingness to pay, which is closely associated with the configuration types of rural small-scale landscapes. (3) Tourists’ willingness to pay is primarily influenced by their cognition of cultural services and by psychological perception factors. According to the regression results, perceived importance of cultural service protection, concerns regarding damage, levels of tourist satisfaction, and willingness to revisit exert significant negative effects on willingness to pay. (4) High-demand tourism motives exhibit only a weak correlation with willingness to pay. (5) Low-demand motivations significantly suppress willingness to pay. The conclusions serve as a reference for the quantification of small-scale rural landscape values and the examination of mechanisms underlying their multiple influencing factors, as well as for the optimization of rural landscape planning, design, and sustainable management practices.
1. Introduction
Landscape is a complex system consisting of numerous heterogeneous components that are spatially interrelated and scale-dependent [1], where “small scale” refers to human perception of the surrounding space and the entire environment during various activities. The global ecosystem is currently affected by polycrisis, resulting in heightened vulnerability and the degradation of landscape structures and functions. Environmental, economic, social, and political crises are intertwined across multiple scales, generating complex systemic pressures through causal interdependencies [2]. Research has indicated that these polycrisis constitute not only socio-economic challenges but also impose profound constraints on ecosystem stability and sustainable development. An interdisciplinary and integrated research perspective is therefore required to capture the multidimensionality, the potential cascading effects, and the scale-adaptive characteristics of these crises [3]. At the landscape level, these global systemic dynamics are driving regional ecological changes that undermine landscape sustainability and alter ecosystem service provision. Small-scale landscapes are positioned both as micro-carriers influenced by global pressures and as practical units for targeted interventions. The study of these landscapes facilitates the identification of how crises are triggered and amplified at specific sites, thereby supplying micro-level evidence to inform global strategies. Despite their limited size, small-scale landscapes can have a significant impact on the local ecological environment, such as microclimate regulation [4,5], pollution reduction [6], and habitat beautification [7]. Rural areas are characterized by richer native biodiversity than urban areas [8] and by more prominent natural resource value. Rural landscapes, functioning as composite ecosystems in which human and natural elements coexist, support higher levels of landscape heterogeneity and biodiversity [9]. In highly dispersed and heterogeneous regions, landscape fragmentation and dispersion result in species structures within patches being more dependent on changes in small-scale environments [10], thereby potentially increasing species richness and diversity [11]. Diverse small-scale habitats within rural landscapes are also more likely to interact with surrounding environments [12,13]. In summary, even small patches can contribute substantially to the overall functionality of ecosystems, and the diverse and differentiated characteristics of rural small-scale landscapes underscore the need for more targeted and comprehensive rural landscape management policies [14].
2. Background and Literature Review
2.1. Policy Context
As urbanization progresses, attention within the industry has increasingly been directed toward small-scale landscape renovations, while the global community has extended substantial policy support for related construction initiatives. In developed countries, construction practices have long transitioned from large-scale development to small-scale, phased renovation efforts. For example, the Environmental Stewardship Scheme (ES), launched in the United Kingdom in 2005, introduced multiple measures aimed at improving small-scale rural habitats and conserving landscapes, including leaving stubble, establishing wildflower strips, and expanding grass margins, thereby effectively enhancing rural landscapes and biodiversity [15]. The Nationaal Programma Landelijk Gebied (NPLG), issued by the Netherlands in 2023, explicitly aims to create blue-green corridors in 10% of the country’s rural areas through the construction of small-scale landscape elements (e.g., hedgerows, field margins, ponds, etc.). Since 2016, the Chinese government has formally introduced the concept of “micro-renovation” as part of its urban renewal approach. This has led to a reduction in large-scale demolition and construction in rural areas, with landscape renewal being increasingly focused on small-scale internal areas. The Yangtze River Delta region responded positively by releasing the “Guidelines for the Construction of Harmonious and Beautiful Villages.” Provinces have also introduced relevant policies. As the tourism industry expands and rural landscapes are transformed for tourism purposes, changes in rural land use have resulted in the gradual emergence of ecological and environmental issues, thereby affecting the ecosystem service functions of local areas. With the ongoing advancement of the ecological and environmental damage compensation system, the valuation of rural ecosystem services has become increasingly important, particularly in rural tourism areas, where such evaluations can contribute to balancing ecological protection and tourism development. Valuation of small-scale landscapes in rural tourism areas aligns with current policy requirements and enables precise identification of ecological benefits, thereby promoting the rational utilization and sustainable development of rural ecological resources. Therefore, appropriate quantitative evaluation methods should be employed to investigate the mechanisms of influence and pathways for synergistic development between the construction of small-scale landscapes in rural tourism areas and ecosystem services.
2.2. Research Progress on the Value of Ecosystem Services
Ecosystem services (ES) are the various benefits that ecosystems provide for human well-being and long-term socioeconomic development, including provisioning, regulating, supporting, and cultural services. Ecosystem service value (ESV) is the monetary valuation of ecosystem services. Over the past 30 years, ESV research has received widespread attention in the academic community. Scholars have conducted numerous practical studies at various scales, including global, regional, watershed, and ecosystem-specific scales, as well as for individual service values. The research focus has shifted toward multiple scales and types [16]. In large-scale studies on the value of ecosystem services, research in developed countries has primarily focused on macro-level ecological functions, including land-use change, climate regulation, and biodiversity conservation. The research methods employed often involve a combination of remote sensing monitoring, ecological modeling, and input–output analysis for comprehensive assessment [17]. For example, Costanza et al. proposed a global framework for estimating ecosystem service values, laying the theoretical foundation for ecological value assessment [18]; Bateman et al. employed an integrated approach based on decision support models in the UK National Ecological Assessment project to reveal the impact of different land use types on ESV [19]. As research has advanced, the perspective of some scholars has been extended to encompass smaller-scale landscapes that are more closely associated with daily life. Research at the small-scale level has primarily focused on application sites closely associated with human life, such as vegetable gardens and ornamental gardens. Research methods have predominantly involved a combination of qualitative and quantitative approaches, including questionnaire surveys, participant observation, and situational simulations. For example, Clarke et al. conducted experiments in community gardens in Los Angeles, California, which demonstrated that the ESV and biodiversity of local gardens are driven by a combination of management practices, income, cultural characteristics, and size [20]; Severo et al. conducted a study on homes in the State of Mexico, where gardens were assessed for average annual ESV. The study found that the ecological values of these gardens were primarily aesthetic, ornamental, food provisioning, and medicinal [21].
Large-scale assessments of ecosystem service values in China have primarily been conducted at policy implementation levels, including land ecological functional zones, watershed scales, and ecological protection red line areas, and have frequently employed methods such as remote sensing monitoring, the InVEST model, and the value equivalence factor method [22,23]. For example, a China-specific ecosystem service value equivalence coefficient method, based on national land use data, was proposed by Xie et al. and has since been widely applied across multiple regional scales [24]. However, such studies have predominantly concentrated on macro-level patterns and the spatial distribution of services, which limits their direct applicability to micro-level ecological planning and design. Clarke et al.’s study of home gardens in Beijing demonstrated that socio-economic gradients can result in a shift in ecosystem services from cultural services to provisioning services [25]. Overall, although scholarly attention to ESV has shifted toward more specific and micro-level aspects, it has remained largely confined to in-depth investigations of large-scale or typological issues, and the research perspective continues to lack sufficient comprehensiveness.
In terms of research types, numerous studies have demonstrated that, although rural areas are relatively small in scale, they deliver complex and diverse ecosystem services, which contrast with traditional single-focus studies centered on urban or forest ecosystems. Early research paid limited attention to the multifunctionality of rural ecosystems, concentrating primarily on single services such as agricultural production or forest carbon sequestration [26]. Research on rural ecosystem services in developed countries has significantly expanded in recent years. Power’s study demonstrated the existence of multiple service values in rural ecosystems and highlighted that agricultural management is essential for enhancing value benefits and minimizing adverse impacts [26]; Radford et al. found that the value of rural aesthetics and recreational ecosystem services is higher than that of urban areas [27]. At the landscape level, the concept of “landscape service” was proposed by Termorshuizen et al. to analyze the coupling mechanism between the spatial structure of rural landscapes and service provision [28]. Rolo et al. found a close correlation between rural land cover types and landscape environmental characteristics. Additionally, the cultural service value of agroforestry composite landscapes is significantly higher than that of single landscapes [29]. Since the concept of the Two Mountains Theory (TMT) was introduced, the rural ecological value has attracted significant attention from the academic community. In the past, the economic value of rural natural resources has been relatively undervalued [30]. The focus of current research on ESV in China is shifting from large-scale, single ecosystems to small- and medium-scale composite ecosystems, such as cities and forests [31]. Scholars have increasingly focused on rural areas. For instance, Jiang et al. demonstrated that ESV in township areas is linked to spatial and temporal land use patterns and industrial development. Forested and cultivated lands were found to contribute the most to the ESV [32]; Duan et al. assessed ESV in Nanjing’s rural areas and found that recreational service values were dominant. High-value zones were identified in tourist villages, large reservoirs, and scenic regions [33]. However, most existing studies have been conducted at the county or township level of valuation. Compared with the small-scale research scenarios addressed in this study, research on rural areas at finer spatial resolutions remains significantly underrepresented. Therefore, this study seeks to address the current research gap regarding the limited attention to small-scale rural landscapes and to expand the spatial scope of ecosystem service value assessments.
In summary, macro-scale research typically focuses on broad spatial trends and development patterns across extensive areas [34,35], which limits its applicability to specific practical scenarios, particularly in landscape design and management. By contrast, the small-scale approach is considered more operationally feasible and is capable of revealing the response relationships between specific environmental factors and ecosystem services. The employment of quantitative evaluation methods is regarded as providing stronger scientific support for refined landscape planning [36]. In the context of rapid rural tourism development, the complexity of landscape functions has increased, and their services are no longer confined to traditional agricultural production but have expanded to encompass aesthetic, recreational, and educational functions, thereby necessitating more refined identification and optimized allocation. Current research on rural areas remains deficient in systematic investigations of representative scenarios, such as rural tourism sites, and in quantitative analyses of the optimal configuration of landscape pattern elements [16]. This study seeks to identify key influencing factors through an assessment of the Ecosystem Service Value (ESV) of small-scale landscapes in rural tourism destinations within the Yangtze River Delta region, thereby exploring combination types and strategies for enhancing ESV (Figure 1). Based on the aforementioned theoretical framework and the identified research gaps, the following hypotheses are proposed to examine how small-scale landscape features and visitor perceptions influence the ecosystem service value of rural tourism destinations:
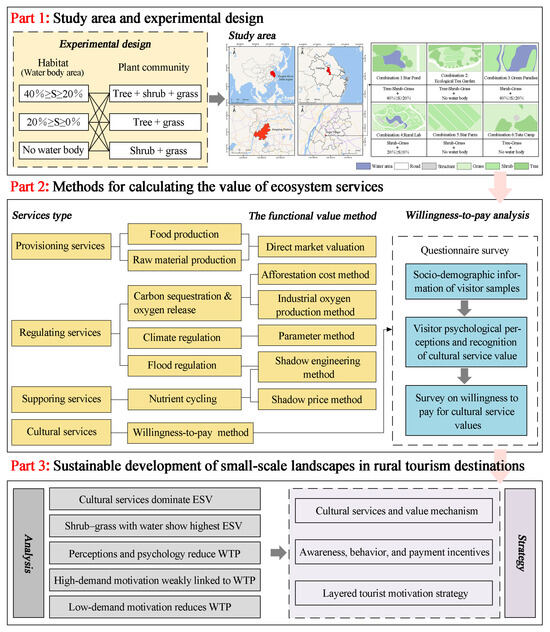
Figure 1.
Schematic diagram of the research process.
Hypothesis 1.
Small-scale landscapes in rural tourism destinations are assumed to provide measurable ecosystem service value, with distinct service types contributing at significantly different levels to overall ESV.
Hypothesis 2.
Landscape composition and structural characteristics are considered to exert a significant influence on ESV. Generally, landscapes that contain water bodies and exhibit complex vegetation structures are more likely to demonstrate higher ecosystem service value than those lacking water bodies or featuring monotonous vegetation.
Hypothesis 3.
Within the rural tourism context, cultural services are understood to exert a greater influence on visitors’ value perceptions and landscape evaluations than other service types. Consequently, they are assumed to constitute a significant proportion of overall ESV in small-scale rural tourism landscapes and to substantially shape value realization.
Hypothesis 4.
Visitors’ personal backgrounds and subjective perceptions (e.g., age, educational attainment, income level, landscape preferences, and satisfaction) are expected to significantly influence their evaluations of small-scale landscape ESV and their supportive behaviors (e.g., willingness to contribute to conservation or participate in related activities).
3. Materials and Methods
3.1. Study Area and Experimental Design
The research site was located in Jiangning District, Nanjing, situated in the eastern portion of the Yangtze River Delta region. Jiangning District lies within the hilly terrain of the lower reaches of the Yangtze River, characterized by a landscape comprising hills, mountains, ridges, and plains. The area serves as a microcosm of the characteristic mountain–water interwoven landscapes of the Yangtze River Delta region. The region possesses a well-developed rural tourism industry and has repeatedly been recognized with the title of National Model Rural Tourism Village. The rural landscape in the Yangtze River Delta region is shaped by the interaction of natural and anthropogenic factors, resulting in a distinctive rural landscape pattern. The dense water network divides the land into plots of varying sizes, causing natural vegetation and agricultural land to appear fragmented and discontinuous. Vegetation patches are scattered across various small microhabitat types, including those around villages, along water edges, and at the edges of hard pavements. These patches intersperse with each other, creating heterogeneous and diverse landscapes. Meanwhile, within the context of regional integration and green development strategies, rural landscape construction in the Yangtze River Delta is more advanced than in other cities. The highly urbanized process has significantly impacted rural habitats [37]. Excessive human development activities have further exacerbated the complexity and fragmentation of the landscape structure in rural areas, resulting in numerous smaller-scale fragmented patches [38,39]. These small-scale landscapes are characterized by diverse habitats, wide distribution, and high redundancy, and they hold significant ecological value. In summary, owing to the representative characteristics of the rural landscape structure in the Yangtze River Delta region, this area can be considered an ideal case for investigating the ecosystem service value of small-scale landscapes. Jiangning District, Nanjing, is regarded as a microcosm of the rural landscape in the Yangtze River Delta region, and the conclusions drawn from this study are of reference value for comparable regions.
“Habitat + plant community” is considered the fundamental unit of natural ecosystems [40]. In small-scale landscapes, microenvironmental factors—such as habitat characteristics, vegetation structure, management intensity, and soil composition—are key determinants of ecosystem richness at a site [10], which, in turn, influences its ecosystem service value. In anthropogenic landscape planning, the selection and optimization of habitats can be incorporated into the site design process, while plant communities can be artificially designed, planted, and maintained. Therefore, the combination of “habitat + plant community” applies to rural ecosystems and has the potential to function as a fundamental unit for rural landscape planning.
The first aspect is the delineation of habitats; contextual complexity must be carefully accounted for during site selection. Field investigations have indicated that the intensity of human intervention is generally consistent within the same village. Accordingly, experimental sites were required to be located within the same natural village and to be separated by no more than 1 km. As a result, factors such as accessibility and crowding can be regarded as largely uniform across the study sites. Within a single site, the dominant influence on various habitat types is typically exerted by only one or two ecological factors [41]. In small-scale landscape study areas, relatively minor variations are observed in controllable ecological factors such as solar radiation, soil, atmospheric conditions, air temperature and humidity, and topography. Consequently, the aquatic environment has been identified as the primary factor influencing habitat type classification. Secondly, in the classification of plant communities, based on existing studies, it has been observed that the plant communities in the Nanjing countryside predominantly exhibit three structural types: single-layer, double-layer, and compound-layer. Among these, the multi-layered “tree + shrub + grass” model is the most commonly used, followed by the two-layer “tree + grass” and “shrub + grass” models [42]. The structural characteristics of the plant communities in the study area are generally consistent with those reported in the referenced study; therefore, the three primary plant community patterns can be delineated.
Based on this, a rural tourism site in Jiangning District is planned to be selected as the experimental site. After integrating the water environment with plant community types, nine plots in the study area will be preselected. The experimental control variables are defined as follows: 1. Plant community structure, selected under the conditions of tree + shrub + grass, shrub + grass, and tree + grass; 2. Water environment, defined by the percentage of the water body area relative to the total site area, where S represents the water body area distributed as 40% ≥ S ≥ 20%, 20% ≥ S ≥ 0%, and the complete absence of water bodies [43,44]. However, only six eligible plots were identified during the field research: Combo 1: Star Pond, Combo 2: Ecological Tea Garden, Combo 3: Green Paradise, Combo 4: Rural Lab, Combo 5: Star Farm, and Combo 6: Tutu Camp, each covering an area of 800 m2 with dimensions of 20 m × 40 m.
In summary, a multi-scale progressive site selection approach was employed to ensure the representativeness of the samples (Figure 2). First, Jiangning District in Nanjing was selected because its composite topography is representative of the typical rural landscapes and habitat heterogeneity of the Yangtze River Delta region; subsequently, six standardized experimental sites were selected based on the “habitat + plant community” framework. The samples adhered to predefined gradient standards, and the site selection was aligned with the landscape fragmentation caused by regional urbanization, thereby ensuring effective representation of typical characteristics. Additionally, the sites belonged to different rural tourism sectors, thereby providing a scalable foundation for research on small-scale landscape ecosystem services in rural areas.
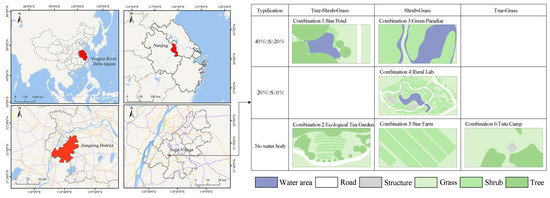
Figure 2.
Schematic diagram of the experimental site (maps credits to ArcGIS 10.8).
3.2. Methods for Calculating the Value of Ecosystem Services
The current methods for calculating ESV are divided into two main categories: the functional value method and the equivalent factor method. The equivalent factor method applies to larger-scale areas, while this study focuses on rural, small-scale landscapes, for which the functional value method is more appropriate. Similarly, due to the specificity of small-scale landscapes, some ecosystem service types (e.g., soil formation, genetic resources, and erosion control and sediment retention) underpin the generation or support of other service types, the magnitude of which is difficult to quantify and is more frequently reflected in the final service. In addition, cultural services are characterized by human ecological traits such as individual migration and the social mobility of participants, necessitating the adoption of a social science research approach. Consequently, the analytical framework differs from that of other ecosystem service types. The benefit transfer method, travel cost method, willingness-to-pay method, and choice experiment method are commonly used by researchers to evaluate cultural services [45]. Given the absence of direct consumption items at the experimental sites, measuring their use value is challenging; therefore, the willingness-to-pay method is considered more suitable. In conclusion, to reduce accounting ambiguity and effectively minimize double-counting, the following calculation methods were ultimately selected based on the actual site conditions. Details are provided in Table 1 below.

Table 1.
Indicators, models, and parameter descriptions for assessing the ecosystem service value of small-scale landscapes in the rural areas of the Yangtze River Delta (the exchange rate at the time of data collection was 1 USD = 7.20 CNY).
3.3. Determination of Parameters for Ecosystem Service Calculation
- Provisioning Services.
For food production, the annual output of plant species with food value at the six sites was determined through field surveys, and the value of food production was calculated by summing the local food market prices. Regarding raw material production, due to the long production cycle of forest trees, the generally non-traded nature of timber, and the absence of timber and economic forests in the study area, trees within the site are excluded from the raw material count. According to the survey, plant species with direct processing value are considered for calculating raw material production value.
- 2.
- Regulating Services.
In the carbon sequestration and oxygen release process, due to the limited number of trees in the small-scale landscape and based on the photosynthesis equation, for every 1 t of dry matter produced by plants, 1.62 t of carbon dioxide is absorbed and 1.2 t of oxygen is released. The average density of dry wood is 0.45 t/m3, and the weight of branches (and roots) is 1/4 of the trunk weight [46]. The site area exceeded 1 acre, and the tree depression was greater than 0.2, meeting the woodland criteria. The net primary productivity of shrubland was taken as 4.01 t·hm−2·a−1 [47]; the average net primary productivity of grassland was taken as 0.8 t·hm−2·a−1 [48]; and the average net primary productivity of tea fields was taken as 9.56 t·hm−2·a−1 [49]. The carbon tax rate is determined using the Swedish carbon tax rate of 150 $/t and is converted into dollars based on the average exchange rate of each year. Thus, PC = 1000 CNY/t. The value of oxygen production is often used to estimate the cost of industrial oxygen production methods. Industrial oxygen production costs 400 CNY/t, i.e., PO = 400 CNY/t.
In climate regulation, the evapotranspiration rate was assumed to be constant because the study sites were close, and the difference was negligible. The average water surface evapotranspiration in Jiangsu Province was 1425 mm, while the evapotranspiration of the natural water body was estimated by multiplying the evaporator-measured evapotranspiration by a reduction factor of 0.8 [50]. The transpiration coefficient of trees ranges from 500 to 1000, with a median value of 750. Similarly, the transpiration coefficient of shrubs varies between 300 and 500, with a median value of 400 [51]. The transpiration coefficient of grassland is assumed to be the minimum value observed for shrubs, which is 300 [52]. The climate regulation value of water vapor transpiration per unit volume is estimated to be $0.02/m3, i.e., Pqh = 0.13 CNY/m3 [53].
The cost of reservoir construction was estimated at 0.92 CNY/m3 for flood regulation and storage services [52,54]. The average annual precipitation was assumed to be 1000 mm, with R= 0.6 [55]. The E-values of subtropical evergreen broadleaf forest, deciduous broadleaf forest, and evergreen-deciduous broadleaf mixed forest were assigned values of 0.36, 0.28, and 0.34, respectively, while that of shrubs was set at 0.14. In the absence of specific studies on the E-value of grass, the value for shrubs was used as a reference [52].
- 3.
- Supporting Services.
Soil data were obtained from the 2nd Soil Census Database in the China Soil Science Database (http://vdb3.soil.csdb.cn), where the average soil depth in Jiangsu Province was reported as 61.00 ± 4.62 cm (mean ± standard deviation) and converted to 0.61 m [56]. Meanwhile, the soil bulk density was assumed to be 1.40 g/cm3 [57]. Nutrient prices refer to the fertilizer market prices. The price of diammonium phosphate fertilizer is 2750 CNY·t−1, which contains 235.0 g·kg−1 of phosphorus and 212.0 g·kg−1 of nitrogen. The price of potassium chloride fertilizer is 2250 CNY·t−1, which contains 523.5 g·kg−1 of potassium [58]. Thus, the price of 1 kg of total nitrogen is 11.32 CNY, the price of 1 kg of available phosphorus is 10.21 CNY, and the price of 1 kg of quick-release potassium is 4.20 CNY [59].
- 4.
- Cultural Services.
The cultural services provided by the ecosystem of Sujia Village, as an emerging rural tourism destination, are primarily reflected in a range of benefits provided to visitors and residents, including recreation and eco-tourism, aesthetic value, and inspiration acquisition. Through interviews with local leaders and field research, the annual visitor flow to the village was estimated to be 500,000 individuals. The Willingness to Pay (WTP) method, also known as the Contingent Valuation Method (CVM), is currently a relatively mature and effective quantitative method for assessing the value of public goods with intangible benefits (such as culture, environment, ecology, etc.) [60], which is the maximum willingness to pay (WTP) for cultural services as determined by a questionnaire survey. This study investigates tourists’ willingness to pay for cultural services, and the amount tourists were willing to pay was quantified as donations for cultural service resource protection fees, with 10 bidding values ranging from 10 to 1000 CNY.
A total of 320 questionnaires were distributed through on-site surveys between 17 August and 17 October 2024, yielding 318 valid responses. The questionnaire survey was administered anonymously. Respondents were first provided with written or verbal instructions regarding the research objectives and the concept of ecosystem cultural service value. They then completed the questionnaire, ensuring accurate comprehension and minimizing information bias. The questionnaire items were primarily derived from existing literature, supplemented with case-specific characteristics, and refined through consultation with three experts in the fields of culture, tourism, and ecology. The survey comprises three main sections:
- Socio-demographic information of visitor samples, encompassing eight items including gender, age, and educational attainment.
- Visitor psychological perceptions and recognition of cultural service value. Visitor psychological perceptions include three items: travel motivation, tourism satisfaction, and willingness to revisit. Recognition of cultural service value comprises two items: the importance of protecting cultural services and the degree of concern regarding ecological and cultural degradation.
- Survey on willingness to pay for cultural service values, comprising three questions: willingness to pay, amount paid, and reasons for refusal to pay.
An analysis of valid questionnaires revealed that the majority of the source market is within Nanjing, accounting for 94% of the total. The majority of tourists are female and belong to the post-80s and post-90s age groups, with more than half having a bachelor’s degree, indicating a relatively high overall literacy level among tourists, with a balanced distribution of tourists across different income levels. As shown in Table 2, the distribution of each statistic in the tourist sample is appropriate, consistent with the actual operations of tourism-based villages, and demonstrates a reasonable level of credibility and representativeness.
Table 2.
Demographic information of the interviewed tourists.
Binomial logistic regression analysis was performed on 318 questionnaires using SPSS 29.0 software. The variables influencing tourists’ willingness to pay for ecosystem cultural services were incorporated into the binary logistic regression model for analysis. The binary logistic regression model is commonly used when the dependent variable is dichotomous (0 or 1), which assumes that the probability of tourists’ willingness to pay is P, and the probability of not paying is 1-P. The logit transformation of P is applied, and the corresponding regression model is:
where α represents a constant term, Xi represents the i-th independent variable (factors affecting tourists’ willingness to pay), βi represents its regression coefficient, and the influencing factors are listed in Table 3.
Table 3.
List of variables influencing tourists’ willingness to pay for the value of cultural services.
4. Results
4.1. Ecosystem Service Value of Rural Small-Scale Landscape
As shown in Table 4, the annual ESVs of the six small-scale landscapes were 6,236,000 CNY, 18,927,000 CNY, 18,716,300 CNY, 42,282,800 CNY, 12,011,400 CNY, and 16,045,600 CNY, respectively, with Combination 4 exhibiting the highest ESVs and Combination 1 the lowest, and the value difference amounting to 3,646,700 CNY, representing a significant disparity. Cultural services represented a larger portion of the ecosystem services’ value, each contributing over 99% to the value of their respective ecosystem services, whereas the remaining three services contributed less than 1% to the value of their respective ecosystem services.
Table 4.
Ecosystem service values of the six sites in the study area (CNY).
Due to the overwhelming dominance of cultural service values within the ecosystem services of the study area, the subsequent analysis is focused on this dimension. It should be noted that this focus results from the significant proportional disparity and its direct link to landscape construction, without disregarding the ecological functions of other service types. The fundamental ecological functions of other services are structurally supported by the “habitat + plant community” criteria employed in the experimental site, and their relatively low economic valuation reflects the limitations of monetary assessment rather than an absence of ecological function.
4.2. Research on Factors Influencing the Value of Cultural Services in Rural Small-Scale Landscapes
4.2.1. Visitors’ Willingness to Pay for Cultural Service Value
The willingness of visitors to pay is closely associated with the landscape portfolio type, and preferences vary significantly across different landscapes. Among the 318 respondents, 158 tourists indicated a willingness to pay for cultural services. The average willingness to pay for Combinations 1 through 6 was 40%, 44%, 50%, 64.62%, 46%, and 48.98%, respectively, corresponding to average payment amounts of 31 CNY, 85.91 CNY, 74.81 CNY, 130.83 CNY, 52.17 CNY, and 65.42 CNY. Both the willingness to pay and the payment amount were significantly higher for Combination 4 than for the other combinations, i.e., landscape types with a ‘shrub + grass’ double-layer plant structure and 0–20% water body coverage. The willingness to pay rate was at least 50% for Combination 3 and Combination 4, both of which feature a ‘shrub + grass’ double-layer plant structure and a water body.
The refusal to pay by visitors was primarily due to the belief that the government should be solely responsible for the protection of cultural services, along with concerns about the standardization of fund usage. The data in Table 5 indicates that, across the six sites, the majority of tourists who were unwilling to pay for the value of cultural services cited concerns such as “fear that the funds would not be effectively utilized” and “protection should be funded by the government” as the primary reasons. Although most of these tourists have benefited from the protection of ecosystem cultural services, due to their long-standing expectation that the government will invest in and provide public goods, such as ecosystem services [61], they typically consider cultural services as public goods and believe that the government should bear sole responsibility for protecting cultural services in rural landscapes, which leads to a sense of mistrust.
Table 5.
Reasons for tourists’ refusal to pay the value of cultural services.
4.2.2. Willingness-to-Pay Correlation Analysis
Tourists’ willingness to pay for small-scale rural landscapes is primarily determined by perceived attributes of cultural services (the importance of conservation of ecological and cultural services and concerns about their potential destruction) and psychological factors (satisfaction and the willingness to revisit), whereas personal social attributes exert less influence. The data in Table 6 indicate that the importance of ecological and cultural service protection in Combination 1 was statistically significant; the two independent variables, ecological and cultural destruction concern, and satisfaction, in Combination 2 were statistically significant; the two independent variables, age 31–45 and willingness to revisit, in Combination 3 were statistically significant; the two independent variables, ecological and cultural service protection importance and satisfaction, in Combination 4 were statistically significant; the independent variable, ecological and cultural destruction concern, in Combination 5 was statistically significant; and the independent variable, willingness to revisit, in Combination 6 was statistically significant. In Combination 4, the independent variables of ecological and cultural services protection importance and satisfaction were found to be statistically significant; in Combination 5, the independent variable of ecological and cultural services destruction worry was found to be statistically significant; in Combination 6, the willingness to revisit was found to be statistically significant. Except for the age group of tourists in Combination 3, no significant differences were found between the individual social attribute factors and willingness to pay for the value of cultural services, which were not statistically significant and therefore less informative.
Table 6.
Parameter estimation results of the binary logistic regression model.
The regression results for the six sites showed that the HL test was significant at the 5% level with Nagelkerke R2 = 0.487 for combination 1, Nagelkerke R2 = 0.490 for combination 2, Nagelkerke R2 = 0.427 for combination 3, Nagelkerke R2 = 0.337 for combination 4, Nagelkerke R2 = 0.355, and Nagelkerke R2 = 0.436 for combination 6, indicating that the equations were fitted with acceptable goodness of fit and the respective variables to explain the dependent variable.
- Characterization Factors of Tourists’ Cultural Service Perceptions.
The perceived importance of cultural service protection in Combination 1 and Combination 4 has a significant negative effect on willingness to pay, indicating that greater emphasis on cultural service protection correlates with a reduced willingness to pay for its value. Similarly, Combination 2 and Combination 5 also exhibit a significant negative effect on concerns about cultural service destruction, indicating that increased concern about cultural service deterioration is associated with a decreased willingness to pay for preservation. The questionnaire results suggest that the preservation of cultural services in small-scale landscapes is perceived by most tourists as crucial for tourism development (Mean = 3.96). At the same time, there are concerns about the potential negative impact of tourism activities on the local cultural ecology (Mean = 2.81). Therefore, in considering the reasons for tourists’ reluctance to pay, it is evident that although they acknowledge the importance of protecting cultural services, they do not regard themselves as accountable. Moreover, concerns about the misuse of funds contribute to their reluctance to contribute financially, particularly due to apprehensions regarding potential harm to cultural resources.
- 2.
- Tourist Psychological Perception Factors.
Satisfaction and willingness to revisit are generally believed to positively influence willingness to pay. Yet, the survey data revealed that visitor satisfaction in Combination 2 and Combination 4 had a significant negative impact on their willingness to pay for cultural services, indicating that greater visitor satisfaction corresponded to lower willingness to pay. The questionnaire results indicated that the monthly income (Mean = 2.74, 2.52) and per capita consumption (Mean = 2.02, 1.98) in Combination 2 and Combination 4 were significantly lower compared to other venues, suggesting that lower income and consumption levels contributed to their reluctance to pay. Tourists’ willingness to revisit Combination 3 and Combination 6 has been found to have a significant negative effect; namely, as tourists’ willingness to revisit increases, their willingness to pay decreases. Through on-site interviews and field investigations, it was identified that catering and camping facilities were present in the vicinity of Combination 3 and Combination 6. The proximity of these consumer facilities was found to encourage repeat visitation, resulting in visitor expenditures being concentrated on tangible recreational products rather than on landscape development. Previous studies have also confirmed the negative impact of willingness to revisit on willingness to pay [62], aligning with the findings of this study. Although satisfaction and willingness to revisit can enhance visitor experiences, they may have a counterproductive effect when actual payment is required. This outcome results from the combined influence of economic constraints and alternative spending options, reflecting a structural disconnect between visitors’ psychological perceptions and their willingness to pay.
4.2.3. Analysis of Tourists’ Tourism Motivation
The motivation for high-demand tourism is weakly correlated with willingness to pay, whereas low-demand motivation significantly inhibits it. This pattern suggests the presence of consumption expectation inertia among tourists regarding basic landscape experiences, along with a low willingness to pay for value-added services. Survey data indicate that tourists’ travel motivations, ranked from highest to lowest, include outdoor recreation and experiencing nature (90.3%), the enjoyment of discovering beauty (51.9%), agritourism educational activities (17.6%), the pursuit of inspiration and creativity (20.8%), the desire for a sense of belonging (11.6%), and the enhancement of interpersonal communication (11%). Correlation analysis of the willingness to pay and tourists’ travel motives indicates that the data in Table 7 demonstrate a significant negative correlation between tourists’ willingness to pay and the motives of seeking inspiration and creativity, engaging in educational activities in agro-tourism, gaining a sense of belonging, and enhancing interpersonal communication in most rural small-scale landscapes, potentially inhibiting their willingness to pay. In contrast, the motives related to outdoor recreation, nature experiences, and the enjoyment of discovering the beauty of the countryside exhibit a weaker influence on tourists’ willingness to pay.
Table 7.
Correlation between willingness to pay and tourists’ motivation to travel.
5. Discussion
The results of this study revealed significant differences in the ecosystem service values of small-scale rural landscapes, with cultural service values playing a dominant role as the primary driver of these differences. This phenomenon indicates that, in small-scale rural landscapes, reliance on and emphasis on non-material experiences far exceed the focus on traditional ecosystem services, rendering cultural services the key dimension influencing overall value assessments. Rural ecosystem services are multifunctional, and macro-scale research often aligns with ecological disciplines such as basic ecology, agriculture, and forestry [63]. However, the results of this study indicate that the values of small-scale rural landscapes are more closely associated with cultural services. These findings are consistent with previous studies that highlight cultural services—particularly recreational and tourism services—as higher-value components of rural landscapes, surpassing provisioning, regulating, and supporting services [33]. From a broader sustainable development perspective, the role of cultural services in promoting human well-being, fostering inclusive public spaces, and safeguarding ecosystems is closely aligned with one core Sustainable Development Goal (SDG) 11 (Sustainable cities and communities) that emphasizes enhancing the livability of human settlements by providing accessible and safe public green spaces, while cultural services act as a crucial bridge for fulfilling aesthetic, recreational, and local identity needs. Therefore, the sustainable planning and management of small-scale landscapes in rural tourism areas should place greater emphasis on developing and protecting cultural services by integrating cultural resources and optimizing their functions, thereby establishing a collaborative framework for their protection and sustainable use.
The data from this study indicate that landscape types featuring a two-layer plant structure of “shrubs + grass” combined with 0–20% water body coverage exhibit higher ecosystem service values. Within a small scale, this landscape type exhibits rich layering and diverse activity spaces, better aligning with visitors’ aesthetic preferences. Diversified planting structures can enhance biodiversity and visitor enjoyment; however, tall trees may obstruct views, and the planting of large trees in rural areas may be constrained by spatial or maintenance limitations. The implementation of high-value landscapes through layered planting of lower vegetation strata is considered a practical approach. In addition, large water bodies within small-scale landscapes may impede visitor activities. The incorporation of small water bodies, such as ponds, wetlands, or streams, into rural landscape projects is more conducive to achieving landscape balance. Existing research has also confirmed that rural landscapes featuring crops, shrubs, and water features are more popular [64], while environments containing small-scale water features are perceived as more relaxing [65]. Therefore, the “shrub + grass” dual-layer plant structure, when combined with 0–20% water body coverage, can achieve mutually beneficial outcomes for aesthetics and ecology, and such advantageous combinations should be prioritized in the design of small-scale landscapes for rural tourism sites. The advantages of this landscape type go beyond aesthetics, highlighting its potential to enhance ecosystem services through natural processes central to Nature-Based Solutions (NbS) as well as the benefits of high biological diversity (SDG 15: Life on land, focusing on protecting, restoring, and promoting the sustainable use of terrestrial ecosystems). Ecological connectivity and habitat diversity for species can be enhanced by introducing elements such as living hedgerows, pocket wetlands, riparian buffers, and ecological corridors into small-scale rural landscapes, combined with a dual-layer vegetation structure of shrubs and grasses adjacent to water bodies covering 0–20% of the area, without disrupting the existing landscape pattern. This approach also strengthens links between regulatory and cultural ecosystem services, while NbS-oriented strategies offer feasible pathways to implement global sustainability goals at the small-scale landscape level.
Willingness to pay was found to be significantly and negatively influenced by tourists’ perceptions of cultural services and psychological factors. In the questionnaire, the payment format was designed as a donation for the protection of cultural service resources. Tourists generally believed that small-scale landscapes require protection; however, they perceived no necessity for individuals to bear the cost of such protection, preferring instead to spend their money on tangible consumer experiences. They also believed that the development of cultural services should be led by local governments, with residents taking the initiative to assume protection responsibilities; moreover, given the high level of tourist literacy and the low incidence of destructive behavior, willingness to pay has consequently decreased. It is necessary to strengthen tourists’ awareness of the importance of personal participation in ecological conservation, while enhancing the perceived connection between payment behavior and conservation outcomes. To bridge the gap between attitudes and behaviors, efforts should focus on strengthening publicity and guidance regarding ecological ethics and responsibility, coupled with establishing transparent and effective fund management and feedback mechanisms, to gradually improve this situation. As rural tourism continues to develop, this issue will become increasingly important for the sustainable development of landscapes. Otherwise, with limited public budgets, local areas may face challenges in maintaining the quality of ecosystem services. This study highlights this challenge; although it was conducted in rural China, similar phenomena may occur in many rural areas worldwide. Enhancing public participation and community co-governance mechanisms is essential for bridging the gap between tourists’ environmental awareness and behavioral action. Establishing transparent connections between visitors’ willingness to pay and specific ecological restoration projects would not only improve funding efficiency and foster nature-based collaborative governance but also advance the SDG of promoting participatory planning and management.
A weak correlation was observed between tourists’ high-demand motivations and their willingness to pay. The primary motivations for travel among tourists were identified as outdoor recreation, natural experiences, and the enjoyment of discovering beauty. This finding reflects an appreciation for the small-scale landscapes of rural areas; however, it has not translated into an actual willingness to pay. This may be explained by the perception of natural landscapes as “public goods” that should not incur additional fees. At the same time, such high-demand motivations reflect public appreciation for the foundational landscapes provided by rural tourism destinations. Personalized natural experiences (e.g., guided nature walks or night tours) could be offered by tourist attractions, with a portion of the fees allocated to natural conservation, thereby potentially increasing tourists’ willingness to pay. Another approach would be to explore directly linking willingness to pay with improvements in landscape experience quality, for instance by specifying that funds will be allocated to visible projects such as vegetation restoration or facility construction, thereby reducing existing cognitive inertia. This mechanism combines ecological experiences with capital reinvestment, consistent with the adaptive management principles of NbS. Visitors and local communities gain cultural and financial benefits while promoting ecological restoration, forming a virtuous cycle. Real-time visitor feedback allows adaptive adjustment of priorities for landscape maintenance and ecological activities. This supports a monitoring system integrating visitor satisfaction, cultural perception indices, and ecological indicators (e.g., patch diversity, semi-natural habitats, and corridor connectivity).
Tourists’ low demand motivation has been found to significantly inhibit their willingness to pay. Such low demand motivation is associated with value-added services, including inspiring creativity, participating in agritourism education activities, fostering a sense of local belonging, and strengthening interpersonal relationships. Research findings indicate that these aspects are not strong motivators for most tourists, possibly because such services are perceived as non-essential or as failing to meet expectations, thereby leading to reluctance to pay. If rural tourism landscapes are able to better cater to these deeper needs, their appeal may be expanded, thereby encouraging these tourist groups to pay. For example, educational value represents a growing niche market in sustainable tourism. Educational services—such as nature observation and agricultural experiences—can be incorporated into the landscape to generate income that supports conservation efforts while meeting the needs of tourists seeking educational experiences. Tourists receiving direct value may be more willing to pay maintenance fees. Similarly, other low-demand motivations can also be enhanced through similar approaches: designing public artworks inspired by nature, constructing dedicated contemplation points, and organizing photography and painting activities, among others. These initiatives can help rural tourism destinations stand out in the highly competitive tourism market, attract a more diverse range of visitors, and thereby enhance development sustainability. In summary, the design of rural small-scale landscapes should explore innovative pathways for value-added services while ensuring basic landscape experiences, thereby enriching the functions of rural landscapes to enhance their appeal and payment conversion rates, and ultimately strengthen their sustainability.
6. Conclusions
6.1. Strengthening the Orientation Toward Cultural Services and Establishing a Sustainable Value Enhancement Mechanism for Rural Landscapes
It has been indicated by research that cultural services occupy a central position within the ecosystem services of small-scale rural landscapes, and that visitors exhibit a marked preference for composite landscape combinations. The values of ecosystem services within small-scale landscapes were established and compared in this study, thereby confirming Hypotheses 1 and 3. These results are consistent with the findings of Severo et al. and Duan et al., which highlight the dominance of cultural and recreational services in family gardens and rural tourism destinations, thereby further corroborating the reliability of small-scale studies regarding the importance of cultural services. This suggests that sustainable planning for rural tourism destinations should move beyond the traditional emphasis on ecosystem functions and be redirected toward landscape design that is centered on the value of cultural services. The optimization of a “shrub + grass” dual-layer plant structure, when combined with small-scale water bodies, not only enhances aesthetic experiences but also facilitates the synergistic optimization of ecological and landscape attributes, thereby providing decision-making criteria that balance functionality and value in rural landscape planning. The synergistic advantage corresponding to Hypothesis 2 was partially confirmed. At the same time, it is hypothesized that an excessively large water body area or an overly complex vegetation structure is unfavorable for increasing ecosystem service value. Frameworks such as Europe’s LQO [66,67] and Germany’s IÖR-Monitor [68] also recommend that landscapes be divided into small-scale units to further quantify the relationship between ecosystem services and the constituent elements and functions within those units, thereby providing precise support for small-scale intervention strategies and aligning with the findings of this study.
6.2. Enhance Public Awareness and Behavioral Change and Improve the Incentive Mechanism for Cultural Service Payments
The willingness of tourists to pay is constrained by cognitive biases and behavioral gaps. Although the value of cultural services is highly recognized by tourists, it is difficult for this recognition to be translated into actual action, providing empirical support for Hypothesis 4. This is primarily because landscape conservation is generally perceived by visitors as a public responsibility, with limited intuitive recognition of the necessity and effectiveness of individual contributions. Amid the global polycrisis, the risks associated with insufficient public participation have been further amplified. Public awareness and behavioral change are essential not only for ensuring financial sustainability but also for directly enhancing the resilience and adaptability of landscapes under complex crisis conditions. In light of this reality, the positive feedback loop between tourists’ sense of behavioral responsibility and the visibility of their payment actions should be strengthened, and a transparent, participatory payment conversion mechanism should be established to enhance public willingness to participate and mitigate the constraints of the “public goods dilemma” on funding sustainability. By integrating institutional design with behavioral guidance, this approach also safeguards the long-term sustainable provision of landscapes under polycrisis conditions.
6.3. Developing a Layered Strategy for Tourist Motivation to Stimulate the Sustainable Competitiveness of Landscapes
Although the high motivation of rural tourism visitors has not directly translated into a willingness to pay, it reflects a substantial recognition of the intrinsic value of small-scale landscapes. Low motivation, however, has been found to significantly inhibit the willingness to pay. Therefore, the enhancement of visitors’ sense of belonging and initiative should be pursued through the improvement of personalized natural experiences and cultural value-added services. In light of the foregoing, subjective perceptions, including perceptions of cultural services, psychological factors, and tourism motivations, were found to be closely associated with willingness to pay, thereby partially confirming Hypothesis 4. The influence of tourists’ personal backgrounds and other socio-economic variables was relatively limited. By integrating differences in visitor motivation, a layered guidance and service strategy can be formulated to achieve differentiated tourism functional positioning, promote landscape diversification, and support sustainable revenue growth. This phenomenon aligns with the Attitude–Behavior Gap (A–B Gap) model in tourism consumer behavior research [69,70], suggesting that the observed disconnect possesses universal explanatory significance. The model has been applied in rural tourism studies conducted in multiple countries, thereby reinforcing the validity and broader applicability of the present study’s conclusions. China’s “micro-renovation” policy adopts design approaches such as integrating local spatial resources, incorporating regional cultural imagery, and enhancing the composite functions of public spaces, thereby strengthening the interactivity, cultural significance, and local identity associated with small-scale landscapes. Additionally, by drawing on international policy experiences such as the Netherlands’ ES and the UK’s NPLG, the exploration of more flexible and adaptive pathways for small-scale landscape construction is advocated in this study. These pathways include the introduction of incentive mechanisms based on ecological performance, landscape guidance systems oriented toward agricultural integration, and mechanisms for multi-stakeholder participation. This aligns with the proposed direction in this study for rural landscape renewal, which seeks to balance localization, collaboration, and ecological values.
6.4. Deepen Design and Practical Application, Clarifying Multi-Stakeholder Implementation Strategies
The research findings provide valuable insights into the sustainable development and landscape planning of rural tourism destinations. The following recommendations are proposed for tourism managers, planners, and operators in the Yangtze River Delta region. Local tourism authorities are encouraged to strengthen the cultural service orientation in tourism operations and maintenance. Considering variations in willingness and motivation to pay, “experience–conservation” activities can be introduced, micro-donation mechanisms established, and visitor engagement enhanced through visual feedback. This approach fosters a virtuous cycle between ecological conservation and tourism consumption. Planners should establish a micro-unit planning system at the village scale, prioritizing the allocation of high-value landscapes as a design focus. These should be applied primarily at entrances, waterfront areas, and key nodes along the main visitor routes. Employing a strategy of ‘prioritising nodes, connecting corridors, and advancing zones sequentially’ will enhance landscape quality and ecological functionality at minimal cost. Operators can use research findings to design seasonal experiences, cultural exhibitions, and interactive activities, turning cultural services into tangible experiences that extend visitor stays and encourage repeat visits. By integrating local materials and spatial features, operators can develop contextualized thematic projects that enhance landscape appeal and cultural identity. By incorporating cultural service strengths, spatial principles, and behavioral patterns into the landscape development process, operators can help establish collaborative mechanisms that promote the sustainable development of small-scale rural landscapes.
Finally, small-scale rural landscapes are taken as the primary research object in this study, with the aim of quantitatively analyzing their ecosystem service values, identifying high-value landscape types and their influencing factors, and providing new perspectives for ecosystem service value research. A basis for rural landscape planning and policy formulation is also provided. Research findings indicate that cultural services are found to occupy a central position within the ecosystem service value of small-scale rural landscapes. Additionally, the ‘shrub + grass’ structure in combination with small water bodies is associated with higher landscape value. Although the scenic experience is acknowledged by visitors, their willingness to pay is influenced by cognitive, perceptual, and motivational factors. To enhance the overall appeal, it is necessary that value-added services be expanded while ensuring that fundamental experiential requirements are met. At the policy level, the orientation toward cultural services should be strengthened, a tiered mechanism for payment incentives and motivational drivers should be established, and international experience should be drawn upon to identify locally appropriate pathways for landscape optimization, thus enhancing the sustainability of rural tourism. However, certain limitations should be acknowledged. Due to site-specific environmental constraints, the sample selection was limited, and the combination types were relatively monotonous, leading to a lack of effective controls in some sites, which may, in turn, affect the generalizability of the conclusions. Concurrently, methodological approaches for measuring willingness to pay are found to exhibit limitations, including questionnaire surveys being susceptible to social desirability bias, while traditional measurement techniques are considered inadequate under conditions of polycrisis. Future research should expand the scope of data collection to establish a more comprehensive control system, conduct related studies across different regions, enhance the applicability of findings to complex rural scenarios, and further explore correlations between various tourism formats. Research methodologies are required to undergo enhanced comparative analysis and refinement of diverse measurement approaches, incorporating multi-stakeholder participation, multi-scale monitoring, and behavioral and scenario-based experiments to strengthen the robustness of conclusions and their applicability to policy.
Author Contributions
Conceptualization, X.J., G.H. and S.L.; methodology, G.H. and S.L.; validation, Y.J., Y.Q. and S.L.; formal analysis, Y.J., Y.Q. and S.L.; investigation, Y.J., Y.Q. and S.L.; data curation, S.L. and Y.Q.; writing—original draft preparation, Y.J., Y.Q. and S.L.; writing—review and editing, G.H.; visualization, Y.Q. and S.L.; supervision, X.J.; project administration, X.J.; funding acquisition, X.J. All authors have read and agreed to the published version of the manuscript.
Funding
This research was funded by the National Social Science Foundation of Art Program (General project: Research on Designing Strategies and Paths to Promote Rural Revitalization in the New Era—22BG110) and National Social Science Foundation of Art Program (General project: Comparative study on agritourism between China and America—2019BH04738).
Institutional Review Board Statement
The study was conducted in accordance with the Declaration of Helsinki, and approved by the College of Art & Design at Nanjing Forestry University Ethic Committee (20240715 and date of approval 15 Juny 2025).
Informed Consent Statement
Informed consent was obtained from all subjects involved in the study.
Data Availability Statement
Data available upon request.
Conflicts of Interest
The authors declare no conflicts of interest.
References
- Hou, W.; Walz, U. Extraction of Small Biotopes and Ecotones from Multi-Temporal RapidEye Data and a High-Resolution Normalized Digital Surface Model. Int. J. Remote Sens. 2014, 35, 7245–7262. [Google Scholar] [CrossRef]
- Lawrence, M.; Homer-Dixon, T.; Janzwood, S.; Rockstöm, J.; Renn, O.; Donges, J.F. Global Polycrisis: The Causal Mechanisms of Crisis Entanglement. Glob. Sustain. 2024, 7, e6. [Google Scholar] [CrossRef]
- Matlovič, R.; Matlovičová, K. Polycrisis in the Anthropocene as a Key Research Agenda for Geography: Ontological Delineation and the Shift to a Postdisciplinary Approach. Folia Geogr. 2024, 66, 5–33. [Google Scholar]
- Honjo, T.; Takakura, T. Simulation of Thermal Effects of Urban Green Areas on Their Surrounding Areas. Energy Build. 1990, 15, 443–446. [Google Scholar] [CrossRef]
- Saito, I.; Ishihara, O.; Katayama, T. Study of the Effect of Green Areas on the Thermal Environment in an Urban Area. Energy Build. 1990, 15, 493–498. [Google Scholar] [CrossRef]
- Manes, F.; Incerti, G.; Salvatori, E.; Vitale, M.; Ricotta, C.; Costanza, R. Urban Ecosystem Services: Tree Diversity and Stability of Tropospheric Ozone Removal. Ecol. Appl. 2012, 22, 349–360. [Google Scholar] [CrossRef]
- Ciftcioglu, G.C.; Ebedi, S.; Abak, K. Evaluation of the Relationship between Ornamental Plants—Based Ecosystem Services and Human Wellbeing: A Case Study from Lefke Region of North Cyprus. Ecol. Indic. 2019, 102, 278–288. [Google Scholar] [CrossRef]
- Walker, J.S.; Grimm, N.B.; Briggs, J.M.; Gries, C.; Dugan, L. Effects of Urbanization on Plant Species Diversity in Central Arizona. Front. Ecol. Environ. 2009, 7, 465–470. [Google Scholar] [CrossRef]
- Chen, S.; Pan, K.; Xu, S.; Zhang, Y. Effects of Rural Landscape Spatial Morphology on Plant Diversity in the Yangtze River Delta Region. Chin. J. Eco-Agric. 2023, 31, 1909–1920. [Google Scholar] [CrossRef]
- Mao, Q.; Ma, K.; Wu, J.; Tang, R.; Zhang, Y.; Luo, S.; Bao, L.; Cai, X. An Overview of Advances in Distributional Pattern of Urban Biodiversity. Acta Ecol. Sin. 2013, 33, 1051–1064. [Google Scholar] [CrossRef]
- Abadie, J.-C.; Machon, N.; Muratet, A.; Porcher, E. Landscape Disturbance Causes Small-Scale Functional Homogenization, but Limited Taxonomic Homogenization, in Plant Communities. J. Ecol. 2011, 99, 1134–1142. [Google Scholar] [CrossRef]
- Aviron, S.; Burel, F.; Baudry, J.; Schermann, N. Carabid Assemblages in Agricultural Landscapes: Impacts of Habitat Features, Landscape Context at Different Spatial Scales and Farming Intensity. Agric. Ecosyst. Environ. 2005, 108, 205–217. [Google Scholar] [CrossRef]
- Happe, A.-K.; Riesch, F.; Rösch, V.; Gallé, R.; Tscharntke, T.; Batáry, P. Small-Scale Agricultural Landscapes and Organic Management Support Wild Bee Communities of Cereal Field Boundaries. Agric. Ecosyst. Environ. 2018, 254, 92–98. [Google Scholar] [CrossRef]
- Xiao, H.; Zhang, Q.; Li, L.; Zheng, B.; Yu, Z. Fine-Scale Rural Landscape Change Analysis. Resour. Sci. 2013, 35, 1685–1692. [Google Scholar]
- Baker, D.J.; Freeman, S.N.; Grice, P.V.; Siriwardena, G.M. Landscape-Scale Responses of Birds to Agri-Environment Management: A Test of the English Environmental Stewardship Scheme. J. Appl. Ecol. 2012, 49, 871–882. [Google Scholar] [CrossRef]
- Wang, Y.; Zhang, Y.; Yang, G.; Cheng, X.; Wang, J.; Xu, B. Knowledge Mapping Analysis of the Study of Rural Landscape Ecosystem Services. Buildings 2022, 12, 1517. [Google Scholar] [CrossRef]
- de Groot, R.S.; Alkemade, R.; Braat, L.; Hein, L.; Willemen, L. Challenges in Integrating the Concept of Ecosystem Services and Values in Landscape Planning, Management and Decision Making. Ecol. Complex. 2010, 7, 260–272. [Google Scholar] [CrossRef]
- Costanza, R.; d’Arge, R.; de Groot, R.; Farber, S.; Grasso, M.; Hannon, B.; Limburg, K.; Naeem, S.; O’Neill, R.V.; Paruelo, J.; et al. The Value of the World’s Ecosystem Services and Natural Capital. Nature 1997, 387, 253–260. [Google Scholar] [CrossRef]
- Bateman, I.J.; Harwood, A.R.; Mace, G.M.; Watson, R.T.; Abson, D.J.; Andrews, B.; Binner, A.; Crowe, A.; Day, B.H.; Dugdale, S.; et al. Bringing Ecosystem Services into Economic Decision-Making: Land Use in the United Kingdom. Science 2013, 341, 45–50. [Google Scholar] [CrossRef] [PubMed]
- Clarke, L.W.; Jenerette, G.D. Biodiversity and Direct Ecosystem Service Regulation in the Community Gardens of Los Angeles, CA. Landsc. Ecol. 2015, 30, 637–653. [Google Scholar] [CrossRef]
- Arcos-Severo, M.; Gutiérrez-Cedillo, J.-G.; Balderas-Plata, M.-Á.; Martínez-García, C.-G. Ecosystem Provision Services Provided by Agroecosystems of Family Gardens in the State of Mexico. Rev. Biol. Trop. 2021, 69, 1069–1078. [Google Scholar] [CrossRef]
- Li, H.; Guan, Q.; Fan, Y.; Guan, C. Ecosystem Service Value Assessment of the Yellow River Delta Based on Satellite Remote Sensing Data. Land 2024, 13, 276. [Google Scholar] [CrossRef]
- Liu, Y.; Wang, Y.; Lin, Y.; Ma, X.; Guo, S.; Ouyang, Q.; Sun, C. Habitat Quality Assessment and Driving Factors Analysis of Guangdong Province, China. Sustainability 2023, 15, 11615. [Google Scholar] [CrossRef]
- Xie, G.; Zhang, C.; Zhen, L.; Zhang, L. Dynamic Changes in the Value of China’s Ecosystem Services. Ecosyst. Serv. 2017, 26, 146–154. [Google Scholar] [CrossRef]
- Clarke, L.W.; Li, L.; Jenerette, G.D.; Yu, Z. Drivers of Plant Biodiversity and Ecosystem Service Production in Home Gardens across the Beijing Municipality of China. Urban Ecosyst. 2014, 17, 741–760. [Google Scholar] [CrossRef]
- Power, A.G. Ecosystem Services and Agriculture: Tradeoffs and Synergies. Philos. Trans. R. Soc. B Biol. Sci. 2010, 365, 2959–2971. [Google Scholar] [CrossRef]
- Radford, K.G.; James, P. Changes in the Value of Ecosystem Services along a Rural–Urban Gradient: A Case Study of Greater Manchester, UK. Landsc. Urban Plan. 2013, 109, 117–127. [Google Scholar] [CrossRef]
- Termorshuizen, J.W.; Opdam, P. Landscape Services as a Bridge between Landscape Ecology and Sustainable Development. Landsc. Ecol. 2009, 24, 1037–1052. [Google Scholar] [CrossRef]
- Rolo, V.; Roces-Diaz, J.V.; Torralba, M.; Kay, S.; Fagerholm, N.; Aviron, S.; Burgess, P.; Crous-Duran, J.; Ferreiro-Dominguez, N.; Graves, A.; et al. Mixtures of Forest and Agroforestry Alleviate Trade-Offs between Ecosystem Services in European Rural Landscapes. Ecosyst. Serv. 2021, 50, 101318. [Google Scholar] [CrossRef]
- Wen, T.; Luo, S.; Dong, X.; Liu, Y. The Innovative Form of Value Realization of Ecological Resources under the Background of Rural Vitalization. China Soft Sci. 2018, 12, 1–7. [Google Scholar]
- Gong, J.; Yan, L.; Xu, C.; Guo, Q. Comparative Analysis of Ecosystem Service Research Hotspots in China and the United States over the Past 30 Years—Based on Bibliometric Studies. Acta Ecol. Sin. 2020, 40, 3537–3547. [Google Scholar] [CrossRef]
- Jiang, W.; Lin, M.; Weng, P.; Wei, D.; Lin, W.; Su, K. Evolution Mechanism of Ecosystem Service Value at the Township-Scale in Anxi County of Fujian Province, China. Chin. J. Appl. Ecol. 2021, 32, 4457–4466. [Google Scholar] [CrossRef]
- Duan, H.; Xu, N. Assessing Social Values for Ecosystem Services in Rural Areas Based on the SolVES Model: A Case Study from Nanjing, China. Forests 2022, 13, 1877. [Google Scholar] [CrossRef]
- Hasan, S.S.; Zhen, L.; Miah, M.G.; Ahamed, T.; Samie, A. Impact of Land Use Change on Ecosystem Services: A Review. Environ. Dev. 2020, 34, 100527. [Google Scholar] [CrossRef]
- Seppelt, R.; Dormann, C.F.; Eppink, F.V.; Lautenbach, S.; Schmidt, S. A Quantitative Review of Ecosystem Service Studies: Approaches, Shortcomings and the Road Ahead. J. Appl. Ecol. 2011, 48, 630–636. [Google Scholar] [CrossRef]
- Hou, W.; Walz, U. Enhanced Analysis of Landscape Structure: Inclusion of Transition Zones and Small-Scale Landscape Elements. Ecol. Indic. 2013, 31, 15–24. [Google Scholar] [CrossRef]
- Xie, C.; Xia, Y.; Yin, C.; Che, S. Rural Vegetation Characteristics and Biodiversity Conservation Strategies in the Yangtze River Delta Urban Agglomeration. Chin. Landsc. Archit. 2021, 37, 31–37. [Google Scholar] [CrossRef]
- Liu, D.; Du, S.; Wang, C. Landscape Pattern Change and Its Response to Ecosystemservices Value in a Rural Tourism Area. Bull. Soil Water Conserv. 2021, 41, 264–275. [Google Scholar] [CrossRef]
- Liu, L.; Yang, L.; Li, Z.P. Landscape Ecological Problems and the Countermeasures in the Process of Rural Urbanization. Ecol. Environ. 2006, 1, 202–206. [Google Scholar] [CrossRef]
- Liu, H.; Xu, B.; Chen, Y. Urban Habitat and Plant Community Design: Research on Habitat-Site Design and Construction in Semi-Arid Areas in Northwest China. Landsc. Archit. 2020, 27, 36–41. [Google Scholar] [CrossRef]
- Liu, H.; Wu, X.; Li, C. An Experimental Research Approach on Habitat-Site Design (Ii): Study on Habitat-Site Types and Zoning in Urban Green Space. Chin. Landsc. Archit. 2017, 33, 46–53. [Google Scholar]
- Zhao, M.; Su, T.; Yang, J.; Li, Y.; Zhang, Q.; Zhang, C.; Ding, Y. Characteristics of Plant Community in Rural Public Space in Nanjing. J. Northwest For. Univ. 2022, 37, 175–182. [Google Scholar] [CrossRef]
- Tang, C.; Lu, J. A Study on Ecological Characteristics of Community of the Migrating Waders in Wetlands Insides Cofferdam near the Pudong National Airport. Chin. J. Zool. 2002, 37, 27–33. [Google Scholar] [CrossRef]
- Yue, F.; Ren, W.; Luo, Z.; Yang, Y.; Wang, T. Analysis of Wader Birds Biodiversity of Spring in Dayi River, Qufu, Shandong Province. Sichuan J. Zool. 2011, 30, 247–250. [Google Scholar] [CrossRef]
- Márquez, L.A.M.; Rezende, E.C.N.; Machado, K.B.; do Nascimento, E.L.M.; Castro, J.D.B.; Nabout, J.C. Trends in Valuation Approaches for Cultural Ecosystem Services: A Systematic Literature Review. Ecosyst. Serv. 2023, 64, 101572. [Google Scholar] [CrossRef]
- Fan, L.; Feng, W. Valuation of Ecosystem Regulation Services in Xiamen Tianzhushan National Forest Park. Manag. Adm. 2019, 9, 149–152. [Google Scholar] [CrossRef]
- Zeng, H.; Liu, Q.; Feng, Z.; Ma, Z.; Hu, L. Estimation Models of Understory Shrub Biomass and Their Applications in Red Soil Hilly Region. Chin. J. Appl. Ecol. 2007, 18, 2185–2190. [Google Scholar]
- Miao, J.; Sun, S.; Wang, Z.; Huang, G. Evaluating the Ecosystem Services of Gaotianyan Nature Reserve in Lianhua County, Jiangxi Province. Acta Ecol. Sin. 2017, 37, 6422–6430. [Google Scholar] [CrossRef][Green Version]
- Li, S. Carbon Balance of Tea Plantation Ecosystem in China. Ph.D. Thesis, Zhejiang University, Hangzhou, China, 2010. [Google Scholar]
- He, D.; Wang, L.; Ni, X.; Jiang, H.; Ding, J. Evaluation of Ecosystem Service of the Coastal Mudflat Wetland in Yancheng, Jiangsu Province. J. Jiangsu For. Sci. Technol. 2016, 43, 29–33. [Google Scholar] [CrossRef]
- Liu, X. Several Issues about Forest Ecology. Chin. J. Agric. Resour. Reg. Plan. 2005, 26, 14–17. [Google Scholar]
- Zhu, S.; Zhang, J.; Hu, H.; Chen, C. Study on the Value-Added Effect of Ecosystem Serive Values in Tourism Development. Resour. Environ. Yangtze Basin 2019, 28, 603–613. [Google Scholar] [CrossRef]
- Kong, D.; Zhang, H. Economic Value of Wetland Ecosystem Services in the Heihe National Nature Reserve of Zhangye. Acta Ecol. Sin. 2015, 35, 972–983. [Google Scholar] [CrossRef][Green Version]
- Lai, M.; Wu, S.; Dai, E.; Yin, Y.; Zhao, D. The Indirect Value of Ecosystem Services in the Three-River Headwaters Region. J. Nat. Resour. 2013, 28, 38–50. [Google Scholar]
- Zhao, T.; Ouyang, Z.; Zheng, H.; Wang, X.; Miao, H. Forest Ecosystem Services and Their Valuation in China. J. Nat. Resour. 2004, 19, 480–491. [Google Scholar]
- Wu, Y.; Dong, W. Climatic Potential Productivity of Vegetation and Its Correlation with Soil Factors in the Middle and Lower Reaches of the Yangtze River. J. Northeast. For. Univ. 2022, 50, 53–58. [Google Scholar] [CrossRef]
- Li, X.; Zhou, H.; Li, C.; He, L.; Liu, X.; Xiao, Z.; Lu, H.; Su, J. Distribution of Soil Physicochemical Properties and Microbial Biomass in Three Green Lands with Different Use Types in the Urban Area. Soils 2021, 53, 874–880. [Google Scholar] [CrossRef]
- Li, H.; He, S.; Min, Q.; Zhu, H.; Wu, L. Evaluation of the Xinghua Duotian Traditional Agrosystem in Jiangsu Province Based on the Evaluation Methods of the Important Agricultural Heritage Systems. Chin. J. Eco-agric. 2020, 28, 1370–1381. [Google Scholar] [CrossRef]
- Su, B.; Liu, M.; Li, Z. Extra Services of Agricultural Heritage Systems Ecosystem Services: A Case Study on Costal Bench Terrace System in Ruian, Zhejing Province. Acta Ecol. Sin. 2023, 43, 1016–1027. [Google Scholar] [CrossRef]
- Shi, L.; Ma, W.; Sun, Y.; Zhu, X.; Yan, Z. Economic Evaluation of Eco-Compensation Based on Tourists’ willingness-to-Pay—A Case Study of Sushansi National Forest Park, Wuhan (China). Resour. Environ. Yangtze Basin 2014, 23, 180–188. [Google Scholar] [CrossRef]
- Hu, H.; Zhang, J.; Liu, Z.; Yu, P.; Chen, M. Tourists’ Willingness to Pay for Tourism Ecological Compensation and the Influencing Factors in National Parks:Take a Case of Huangshan Scenic Area. Resour. Environ. Yangtze Basin 2017, 26, 2012–2022. [Google Scholar] [CrossRef]
- Gu, Y.; Xu, D.; Yu, P.; Yu, F.; Zhang, J. Research on the Willingness of Tourists to Compensate for Cultural Ecology in Traditional Village Tourism Destinations: A Case Study of Luxiang, Yangwan, Mingyuewan and Dongcun in Suzhou. J. Nanjing Norm. Univ. (Nat. Sci. Ed.) 2024, 47, 63–71. [Google Scholar] [CrossRef]
- Ge, B.; Wang, C.; Song, Y. Ecosystem Services Research in Rural Areas: A Systematic Review Based on Bibliometric Analysis. Sustainability 2023, 15, 5082. [Google Scholar] [CrossRef]
- Li, C.; Yuan, Y.; Sun, C.; Sun, M. The Perceived Restorative Quality of Viewing Various Types of Urban and Rural Scenes: Based on Psychological and Physiological Responses. Sustainability 2022, 14, 3799. [Google Scholar] [CrossRef]
- Tang, H.-F.; Lee, A.-Y.; Hung, S.-H. Does Built Environment and Natural Leisure Settings with Bodies of Water Improve Human Psychological and Physiological Health? Landsc. Ecol. Eng. 2024, 20, 547–558. [Google Scholar] [CrossRef]
- Santé, I.; Tubío, J.M.; Miranda, D. Public Participation in Defining Landscape Planning Scenarios and Landscape Quality Objectives (LQO): Landscape Guidelines for Galicia (NW Spain) Case Study. Land Use Policy 2020, 94, 104559. [Google Scholar] [CrossRef]
- Sowińska-Świerkosz, B.N.; Chmielewski, T.J. A New Approach to the Identification of Landscape Quality Objectives (LQOs) as a Set of Indicators. J. Environ. Manag. 2016, 184, 596–608. [Google Scholar] [CrossRef]
- Meinel, G.; Knop, M.; Hecht, R. Aspects of Quality and Availability of Digital Topographic Data in Germany in Particular Consideration of ATKIS(R) Basis-DLM and DTK25(-V). Photogramm. Fernerkund. Geoinf. 2008, 1, 29–40. [Google Scholar]
- Juvan, E.; Dolnicar, S. The Attitude–Behaviour Gap in Sustainable Tourism. Ann. Touris. Res. 2014, 48, 76–95. [Google Scholar] [CrossRef]
- Nieto-García, M.; Acuti, D.; Viglia, G. Consumer Hypocrisy and Researcher Myopia: A Scrutiny of the Intention-Behaviour Gap in Sustainable Tourism. Ann. Touris. Res. 2024, 104, 103678. [Google Scholar] [CrossRef]


Disclaimer/Publisher’s Note: The statements, opinions and data contained in all publications are solely those of the individual author(s) and contributor(s) and not of MDPI and/or the editor(s). MDPI and/or the editor(s) disclaim responsibility for any injury to people or property resulting from any ideas, methods, instructions or products referred to in the content. |
© 2025 by the authors. Licensee MDPI, Basel, Switzerland. This article is an open access article distributed under the terms and conditions of the Creative Commons Attribution (CC BY) license (https://creativecommons.org/licenses/by/4.0/).