Article

Response of Soil Microbial Population and Activity to Sunn Hemp Cover Crop, Combined Nano Zinc and Copper and Nitrogen Fertiliser Application After Canola Cultivation

by
Mahlare Mapula Mokgophi
1,2,*,
Kingsley Kwabena Ayisi
1,2,
Pholosho Mmateko Kgopa
2 and
Mapotso Anna Kena
2
1
Centre for Global Change, University of Limpopo, Private Bag X 1106, Sovenga 0727, South Africa
2
Department of Plant Production, Soil Science and Agricultural Engineering, University of Limpopo, Private Bag X 1106, Sovenga 0727, South Africa
*
Author to whom correspondence should be addressed.
Sustainability 2025, 17(21), 9407; https://doi.org/10.3390/su17219407
Submission received: 29 July 2025 / Revised: 28 August 2025 / Accepted: 28 August 2025 / Published: 23 October 2025

Abstract

Agricultural soil health and quality centre around the ability of the soil to cycle nutrients to growing crops. However, soil biological properties focusing on microorganisms and their contribution to soil health are also important. This study was established at Syferkuil and Ofcolaco to determine the effect of cover crop, combined nano Zn and Cu, and nitrogen fertiliser on soil biological properties. Sunn hemp was planted, slashed, and incorporated into the soil, followed by winter canola in a split split-plot design with sixteen treatments. Key factors analysed after harvest included bacterial and fungal populations, active carbon, microbial activity measured by Fluorescein Diacetate (FDA), organic matter, urease, and pH. Statistical analysis was conducted using JASP 0.19.3. Cover crop, nano Zn and Cu, and nitrogen fertiliser enhanced bacterial populations, active carbon, urease, organic matter, and pH at Syferkuil, most particularly in 2023, while 2024 showed minor improvements. Ofcolaco showed improvements in fungal populations, organic matter and urease in 2023, whereas 2024 exhibited marginal changes. Nitrogen fertilisation increased POxC, ranging from 10% to 22% and urease at 31% to 111% in both locations, although this varied across application rates. Treatment interactions showed improvements in some of the measured parameters but varied across seasons and locations. In conclusion, sunn hemp cover crop, combined nano zinc and copper and nitrogen fertiliser have the potential to enhance soil microbial activity through the application of 60 and 120 kgN ha−1, thus reducing heavy inputs of synthetic fertilisers in canola production.

1. Introduction

In agriculture, soil health refers to the capacity of soil to function within an ecosystem, to sustain plant and animal productivity, as well as maintaining water and air quality [1]. The biological aspect of soil, particularly the role of microorganisms in contributing to soil health, is of equal or greater significance. The evaluation of soil microbial activity includes, but is not limited to, soil organic matter, soil respiration, soil and plant nutrient content, and microbial enzyme assays [2]. Given the extreme changes in climate, modern day agriculture is confronted with the challenges of ensuring global food security through increased crop yields while simultaneously mitigating environmental ramifications arising from the increased competition for land, water, and energy [3]. This hastens the need to evaluate soil health indicators given the vulnerability of ecosystems to environmental changes which may negatively affect nutrient distribution and availability [4]. The evaluation and maintenance of soil health necessitates a holistic assessment of its interdependent chemical, as well as the physical and biological properties contributing directly or indirectly to soil system functionality. However, with the growing human population and demand for food, soil health has become compromised in order to sustain livelihoods. This is seen by the excessive use of chemical fertilisers, especially N, to enhance the soil’s productivity and ultimately the crop yields [5,6]. The farming community often justifies this practice by highlighting the detrimental effects of nutrient deficiency or depletion on the overall soil performance and soil microbial growth [7]. Unfortunately, this kind of management practice negatively impacts soil enzyme and microbial activity [8]. However, Bebber and Richards (2022) [9] stipulated that the use of organic soil amendments showed a superior impact on soil microbial population and diversity enhancement relative to synthetic fertilisers. This could be attributed to the availability of organic substrates under organic amendments which provide energy and carbon to soil microorganisms, thus enhancing their activity and functionality [10].
With a crop such as canola (Brassica napus), which depends heavily on N fertilisation, a limitation of the nutrient can result in severe yield losses. Moreover, synthetic fertilisers such as nitrogen are integral to maintaining global food security, which explains their decadal use across various crop production systems [5,11]. However, the extensive and prolonged use of synthetic fertilisers in agroecosystems has compromised the soil and environment, negatively affecting soil fertility and overall productivity [12]. Land use changes affect soil microbial communities such as bacteria, fungi, and enzyme activity, which serve as indicators of soil ecosystem quality shifts and overall soil health. This is due to their role in diverse soil processes and extreme sensitivity to disturbances, which reflects the soil’s current condition [13].
Soil management practices that can restore and enhance soil microbial activity, abundance, and diversity would be suitable alternatives to mitigate the adverse effects of conventional fertilisers. The use of cover crops such as sunn hemp (Crotalaria juncea) for sustainable agriculture in cropping systems has the potential to improve soil microbial activity, abundance, and diversity relative to conventional fertilisers [14]. Sunn hemp is commonly used in rotations due to its allelopathic effects on weed seed germination and also because it has been found to provide 100–200 kg ha−1 of nitrogen upon residue incorporation, although this differs across locations [15]. Koudahe et al. (2022) [14] further stipulated that cover crops are able to maintain and improve soil fertility and lessen the need for excess chemical fertiliser inputs. These crops can mitigate the effects of climate change on soil fertility through biological N fixation as well as carbon sequestration, thus curbing their losses to the atmosphere [16,17,18,19].
Additionally, numerous research studies have elucidated the benefits of nanofertilisers on crop yields and soil productivity due to their nanoscale [12,20]. Nanoformulations are reported to be 20 to 30% more efficient in enhancing crop growth and yield relative to conventional fertiliser inputs, further reducing the frequency of chemical fertiliser application [21,22]. Elizabath et al. (2019) [23] also reported that agricultural applications supported by nanofertilisers tend to show improved management and conservation of inputs attributed to their greater absorbance and high reactivity. Global adoption of nanofertilisers could be pivotal in achieving sustainable agriculture because of their high bioavailability [24] and slow-release mechanisms, among other characteristics [25].
Current studies on canola production vary, including nitrogen fertiliser management strategies to improve yield, as well as soil, chemical, and biological properties’ responses to crop rotations and residue management [26]. A study by Elsawy et al., (2022) [27] also noted the enhancement of soil biological properties such as catalase and dehydrogenase enzymes and soil microbial biomass carbon through the use of recycled nanomaterials in canola production. This current study is the first to evaluate soil biological properties under canola production using sunn hemp cover crop and combined nano Zn and Cu foliar micronutrients. The study was prompted by the high nitrogen fertilisation during canola production, which is accompanied by the loss of fertiliser to the environment necessitating regular application [28]. This negatively affects the soil ecosystem through nutrient imbalances, resulting in compromised soil microbial activity and diversity, to name a few [29]. However, the use of cover crops, nanofertilisers, and N fertiliser presents favourable residual effects in the soil, potentially contributing to sustainable farming practices. Therefore, assessing the residual effects of the treatments serves as a guide for managing soil amendment inputs such as N fertiliser to avoid unnecessary fertilisation. The study hypothesis posits that the combination of cover crop, nano Zn and Cu, and N fertiliser will not vary in their effects on soil microbial populations and activity. In view of this, the study was established to assess the combined effect of sunn hemp cover crop, nano Zn and Cu, and N fertiliser on soil microbial population and activity as indicators of soil health after canola production.

2. Materials and Methods

2.1. Study Site Description

The study was conducted at two agro-ecologically diverse locations in the Limpopo province of South Africa, namely, the University of Limpopo experimental farm (Syferkuil) and a Cooperative Farmers’ field at Ofcolaco in Capricorn and Mopani Districts, respectively, in the 2022 and 2023 growing seasons (Figure 1). The Syferkuil farm is in the Polokwane Local Municipality at geographical coordinates of 23°51′0″ S, 29°42′0″ E. The Ofcolaco farmers’ field is in the Maruleng Local Municipality, approximately 120 km southeast of Syferkuil at coordinates of 23°56′ S, 31°07′ E. Syferkuil receives an average annual rainfall of 450 mm, while the semi-arid zone of Ofcolaco, located in the Maruleng municipality, receives approximately 700 mm of annual rainfall, predominantly during the summer season. Both areas are dominated by Hutton soil form [30], with Syferkuil topsoil containing 26% clay and Ofcolaco having 32% clay.

2.2. Weather Conditions for the 2023 Growing Season

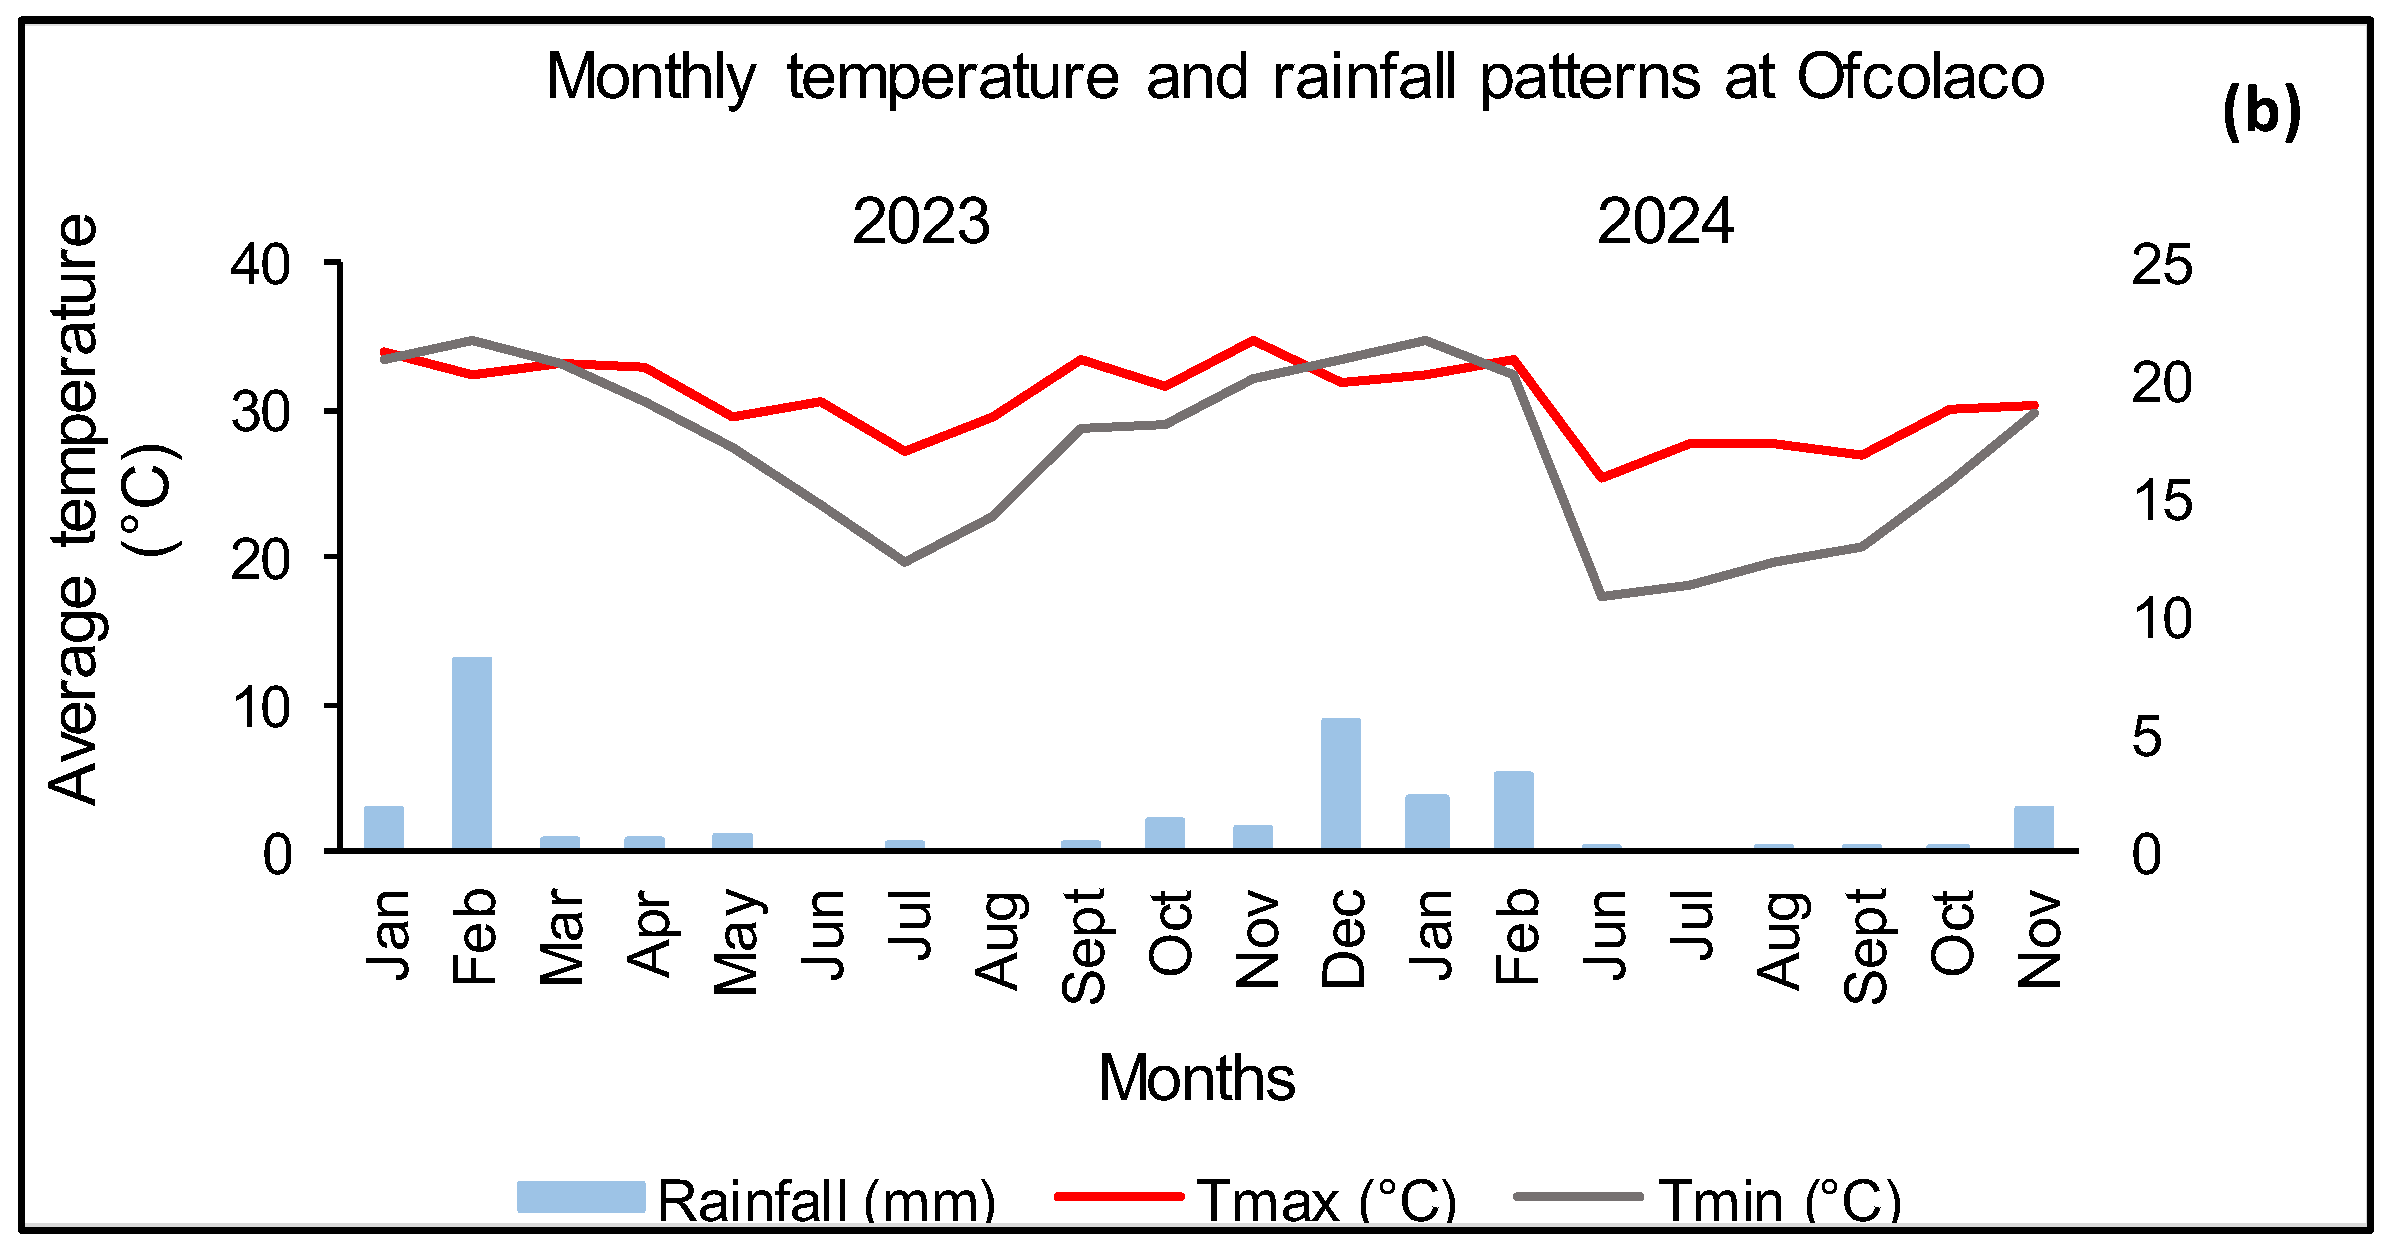
The monthly average maximum temperatures at Syferkuil ranged from 21.28 °C to 29.83 °C in 2023, whereas in 2024, it ranged from 28.93 °C to 30.49 °C. On the other hand, minimum temperatures ranged from 1.85 °C to 16.67 °C in 2023 and 18.18 °C to 18.74 °C in 2024. For the duration of the growing season, the location received 272 mm and 403 mm total rainfall in 2023 and 2024, respectively (Figure 2a). On the other hand, Ofcolaco had monthly average temperatures with a maximum range of 27.23 °C to 34.78 °C and a minimum of 12.22 °C to 21.65 °C. The total seasonal rainfall was 165 mm for the duration of the 2023 season, with the highest rainfall received in February (Figure 2b).

2.3. Experimental Layout and Treatments

Both study sites used similar land preparation and weeding techniques, which were disking and manual weed control. After this, the field was demarcated into equal portions, with one half used for cover cropping, while the other remained fallow for the duration of cover crop growth. Prior to planting canola in winter, sunn hemp was planted on the experimental units assigned to the cover crop in summer (December to February for 2022 and 2023), slashed at the onset of flowering, and left in situ at Syferkuil and Ofcolaco. The covered and non-covered plots were disked and allowed a resting period of 4 weeks before the canola was planted. The canola trial was established in winter (April to September for 2023 and 2024) as a split split-plot design with sixteen treatments, three replications and three blocks.
The main plot treatment was assigned to cover crop (with (C1) and without (C0)), the subplot was combined with nano Zn and Cu micronutrient (with and without), and the sub-subplot was applied N fertiliser rates (0, 60, 120, and 180 kgN ha−1) labelled as N0, N60, N120, and N180 respectively (Figure 3). The combined nano Zn and Cu micronutrient fertiliser is a clear blue solution containing Cupric Nitrate·3H2O (54.8 g L−1), Zinc Nitrate·6H2O (262 g L−1), and Silver Nitrate (1.66 g L−1). The pH of the undiluted solution is <1.5. This was applied as a foliar spray once weekly for 4 weeks after emergence and then biweekly until flowering with a dose of 20 mL/100 L of water using a knapsack with a flat fan nozzle. Canola was planted within experimental units measuring 3 m × 4 m, with 90 cm inter-row spacing and 15 cm intra-row spacing, with a buffering space of 1 m and 1.5 m between plots and replications. Nitrogen fertiliser was applied as Lime ammonium nitrate (LAN) (28% N) at Ofcolaco and Urea (46-0-0) at Syferkuil in split application—half at planting and the other half at flowering.

2.4. Soil Sampling and Analysis

Eight soil samples were collected randomly from each study area at a depth of 0–30 cm and composited into two for pre-plant soil analysis. After the canola trial, 48 soil samples were collected per plot in each location. The soil samples and devoid of any crop residues and stored in a sterile zip-lock plastic bag and refrigerated at 4 °C and later analysed for soil biological properties. For chemical properties, the soil was air-dried and passed through a 2 mm mesh sieve prior to analysis.
Total N was measured using a block digester (SC154 Hot Block Digester, Environmental Express, Charleston, SC, USA) following the Kjeldahl method by Bremner (1996) [32], where 1 g of air-dried soil sample was sieved through a 2 mm mesh into a 100 mL digestion tube. A catalyst mixture of 1–2 g was added, then followed by 3–5 mL of concentrated sulphuric acid (in fume hood), and the contents were swirled until thoroughly mixed. Digestion tubes were placed in the block digester at 390 °C, ensuring not to exceed 410 °C. The mixture was boiled until clear and then removed from the digester to cool. About 20 mL water was added to each tube, and then 20 mL H3BO3 was also added and distilled at 22 °C. A few drops of indicator (0.10 g Bromocresol green and 0.07 g methyl red in 100 mL ethanol (96%)) were added, and the solution was titrated with 0.01 mol L−1 sulphuric acid. The solution was then read on a gallery analyser.
Available phosphorus (P) was extracted using a 1% citric acid extraction method by Blanck (1931) [33]. A soil sample of 5 g was used, where 50 mL of 1% citric acid solution (dissolved 11 g citric acid in distilled water to make 1 L) was added to the sample and placed on a reciprocating shaker for two hours. This mixture was allowed to stand for 20 h and then placed on the shaker for an additional hour and then filtered. After filtering, 1 mL of the filtrate was poured into a 100 mL volumetric flask, and 80 mL of distilled water and 10 mL of mixed reagent (dissolved 1.5 g ascorbic acid in 100 mL stock solution) were added. This solution was allowed to stand for an hour, and then absorbance was read on a UV/VIS spectrophotometer (Thermo Fischer Scientific, Helide Gamma, New York, NY, USA) at a wavelength of 882 or 720 nm.
The extractable cations (K, Ca, and Mg) were measured using 1 M NH4OAc [34], while micronutrients (Cu and Zn) were extracted using 0.25 M ethylene diamine tetra-acetic acid (EDTA) [35]. They were analysed using an ICP–9000 emission spectrometer.
Soil pH was extracted by adding 50 mL deionised water to 10 g soil and stirring the mixture for 10 min and then allowed to stand for 30 min, followed by a 2 min stirring, after which pH in the suspension was measured using a pH meter (HI2002-01 edge, Hanna instruments, Bedfordshire, UK) following the electrode method [36].
Organic carbon (OC) was determined by following the Walkley–Black chromic acid wet oxidation method [37]. A 10 mL K2Cr2O7 solution was added to 1 g of sample, and then 20 mL sulphuric acid was added and allowed to cool for 30 min. After cooling, 150 mL of de-ionised water and 10 mL concentrated orthophosphoric acid were added, and the excess K2Cr2O7 was titrated with iron (II) ammonium sulphate after adding 1 mL of indicator (barium diphenylamine sulphonate). Organic carbon content was then calculated using the following formula:
[ F e N H 4 2 S O 4 2   m o l d m 3 ] = [ 10 c m 3   K 2 C r 2 O 7 × 0.167 × 6 ] [ c m 3   F e N H 4 2 ( S O 4 ) 2 ]
%   O C = [ c m 3   F e N H 4 2   b l a n k c m 3   F e N H 4 2   s a m p l e ] × [ M × 0.3 × f ] g   s a m p l e
where M = concentration of Fe (NH4)2(SO4)2, and f = 1.3
Aggregate stability (MWD) determination was carried out by placing 100 g of dry soil sample on a set of sieves (4, 2, 0.212 and 0.50 mm) stacked in descending order [38]. The stacked sieves containing a soil sample were placed on a sieve shaker for 5 min, allowing the vibrations to separate the aggregates according to different size fractions. Each aggregate size was weighed, excluding those greater than 4 mm, and the mean weight diameter was calculated using the following formula:
M W D =   i = 1 n x i w i
where MWD = mean weight diameter, xi = mean diameter of each fraction size (mm), wi = proportion of total sample weight (g), n = number of size fractions
Total bacterial and fungal counts: A pour plate method was used to enumerate soil bacterial and fungal isolates [39]. One gram of soil was added to a test tube containing 9 mL distilled water and a serial dilution of 105. Nutrient agar and Potato dextrose agar were both prepared in distilled water and autoclaved at 121 °C for 15 min and left to cool. Then, 1 mL from the last dilution was poured into a sterile petri dish followed by molten agar, mixed, and left to solidify before incubating in a growth chamber (Scientific: model 358) at 37 °C and 23 °C for 2 and 7 days, respectively, for bacteria and fungi. Present colonies were examined and counted, and then the coliform units per millilitre (CFU/mL) were transformed into logarithm base 10 (i.e., Log10) units.
C F U = n u m b e r   o f   c o l o n i e s ( m l   p l a t e d × d i l u t i o n   f a c t o r )
Active carbon (POxC) was measured following the method by Weil et al. [40] by weighing 2.5 g of air-dried soil sample into a 50 mL falcon tube in triplicate and then adding 18.0 mL of deionized water, and 2.0 mL of 0.2 M KMnO4 stock solution was added and then placed on a reciprocating shaker for 180 oscillations for 2 min. After this, the samples were inverted to remove soil on the sides of the tube and were allowed to settle for 10 min. Following the completion of the settling time, 0.5 mL of the supernatant was transferred to a separate Falcon tube containing 49.5 mL of deionised water and mixed thoroughly. The active carbon was measured on a spectrophotometer at 550 nm wavelength and calculated using the following formula:
P O x C   m g . k g 1   s o i l = 0.02 m o l L a + b × A b s × 9000   m g C m o l ×   0.02   L   ÷   W t
where 0.02 mol L−1 = initial solution concentration, a = intercept of the standard curve, b = slope of the standard curve, Abs = absorbance of unknown, 9000 = mg of carbon oxidized by 1 mole of MnO4, 0.02 L = volume of stock solution reacted, and Wt = weight of air-dried soil sample in kg.
Total microbial activity in the soil was measured by monitoring the hydrolysis of fluorescein diacetate (FDA), as described by [41]. A 1 g sample was placed into a 150 mL plastic bottle, and 50 mL of THAM buffer (0.1 mol L−1, pH 7.6) was added to each flask with 0.5 mL of 47.6 mmol L−1 FDA. A control sample was included for each sample, in which only acetone was added. After the samples were incubated for three hours at 37 °C, 2 mL of acetone was added to each sample, and the FDA was then added to the controls. Samples were then centrifuged and filtered, and the yellow green colour was measured using a T60 UV-Visible spectrophotometer (PG instruments Limited, Leicestershire, UK) at 490 nm wavelength. The samples were analysed in triplicate, and FDA hydrolytic activity was then expressed as micrograms of fluorescein released per gram of dry weight of soil per hour and calculated as
F D A = ( S C ) D M
where S is the mean concentration of fluorescein in the sample, C is the concentration of fluorescein di-acetate, and DM is the dry mass.
Urease activity determination was conducted through the non-buffered short-term assay by [42]. Soil samples collected from a depth of 0–30 cm were processed using a 2 mm mesh sieve and subsequently stored at 4 °C before analysis. Subsequently, 5 g of soil was placed in a 100 mL Erlenmeyer flask, followed by the addition of 2.5 mL of urea solution. The flasks were closed with a stopper and incubated for 2 h at 37 °C, after which 50 mL KCl solution was added, and the contents were shaken for 30 min. The blanks were done as described above, but with 2.5 mL distilled water, and the 2.5 mL urea solution was added at the end of incubation and immediately before 50 mL KCl addition. The suspension was filtered using Whatman no. 42 filter paper (Whatman, Buckinghamshire, UK) and diluted 10 times with distilled water. Ammonium concentration was determined by pipetting 1 mL of clear filtrate into a 50 mL Erlenmeyer flask and adding 9 mL distilled water, 5 mL Na-salicylate/NaOH solution, and then 2 mL sodium dichloroisocyanurate solution. The solution was allowed to stand for 30 min at room temperature before measuring ammonium content at 690 nm optical density using a T60 ultra-violet (UV) visible spectrophotometer. Urease activity was calculated by determining the amount of ammonium nitrogen given by the equation below:
U r e a s e   a c t i v i t y   μ g   N H 4 - N   g 1 2   h 1 = [ S B ×   V   ×   10 ] 2   ×   d w t
where S is the ammonium-N concentration (µg NH4-N ml−1) in the sample; B is the NH4-N concentration (µg NH4-N ml−1) in the blank; V is the total volume of the extract; 10 is the dilution factor; 2 is the duration of the incubation; dwt is the mass of dry soil.

2.5. Statistical Analysis

Analyses of variance (ANOVA) were conducted to detect the least significant differences and interactions within the treatments for the selected soil biological properties. The Tukey HSD pairwise comparison test was also used to compare treatment means at the probability level p < 0.05. Pearson correlations were carried out to compare treatments and establish the extent of relationships among measured parameters. The normality and homogeneity tests have been conducted using skewness and kurtosis, as well as Levene’s test for equality of variance. All statistical analyses were completed using Jefrey’s Amazing Statistical Program (JASP) version 0.19.3.

3. Results

3.1. Pre-Sown Soil Properties of the Experimental Field

The pre-sown soil test results indicate that Syferkuil had a moderately alkaline pH, while Ofcolaco had slightly alkaline to very slight acidity after sunn hemp. Sufficient to slightly high concentrations of P, K, Mg, Cu, and Zn were observed at both locations as per the critical soil test limits, both before and after sunn hemp incorporation. Based on the critical soil test limits, there was also an observed difference before and after sunn hemp incorporation at Syferkuil, indicating an improvement in Mg, P, Zn, total N, OC, and MWD; in contrast, pH, Ca, K, and Cu declined. Similarly, the Ofcolaco data also revealed improved Zn, total N, OC, and MWD status, while pH, Ca, Mg, K, P, and Cu decreased (Table 1).

3.2. Treatment Effects on Soil Bacterial Populations

3.2.1. Syferkuil

The bacterial populations at Syferkuil were significantly affected by cover crop, combined nano Zn and Cu, and their respective interactions in 2023 (Table 2 and Figure 4a).
In 2024, the bacterial populations were significantly affected by cover crop incorporation, while combined nano Zn and Cu, N fertiliser, and all interactions had no influence (Table 2 and Figure 4b).
In 2023, the findings at Syferkuil indicated a 0.6% increase in bacterial populations under cover crop incorporation compared to its absence. In contrast, combined nano Zn and Cu resulted in a 0.6% decrease in bacterial populations relative to conditions without the nano micronutrients at the same location (Table 2). Nitrogen fertiliser enhanced the bacterial population by 0.9% under 60 kgN ha−1 compared to the average of 120 and 180 kgN ha−1; however, the population was not different from 0 kgN ha−1 (Table 2). A 3% population increase was recorded in the absence of cover crop and combined nano Zn and Cu, which was under 60 kgN ha−1 compared to the average count at application of 120 and 180 kgN ha−1. The application rate of 60 kgN ha−1 did not vary from 0 kgN ha−1 (Figure 4a). Without cover crop, no population difference was observed upon the application of combined nano Zn and Cu, irrespective of N fertiliser (Figure 4a). Incorporating cover crop led to a 2% higher population when N fertiliser was applied at 60 kgN ha−1 than 180 kgN ha−1 without combined nano Zn and Cu, although the former rate did not differ from 0 and 120 kgN ha−1. With cover crop, combined nano Zn and Cu, and N fertiliser, a 2% bacterial population increase was recorded under 0 kgN ha−1 compared to 60 kgN ha−1. Similarities in populations were also observed among the 0, 120, and 180 kgN ha−1 fertiliser rates (Figure 4a).
During the 2024 season, cover crop incorporation resulted in a 12% improvement in populations relative to treatments without it (Table 2).

3.2.2. Ofcolaco

During the 2023 season, bacterial populations were significantly affected by the application of combined nano Zn and Cu, while cover crop and N fertiliser and their respective interactions had no impact at Ofcolaco (Table 3). Combined nano Zn and Cu reduced bacterial populations by 1.7 percentage points compared to plants receiving no micronutrient application (Table 2). No interaction effect was observed on the bacterial population count, but it ranged from 7.79 to 8.29 Log CFU mL−1.
In 2024 bacterial populations were significantly affected by cover crop and N fertiliser but not by combined nano Zn and Cu (Table 3). No interaction effects were observed, with the exception of cover crop × N fertiliser (Figure 5a). Bacterial populations under cover crop were 16% higher than those without cover crop (Table 3). Furthermore, 10% greater populations were found under 120 kgN ha−1 than under 0 kgN ha−1. The aforementioned N fertiliser rates did not differ from 60 and 180 kgN ha−1 (Table 3). Though cover crop and N fertiliser interaction affected bacterial populations, no variation was observed without cover crop, regardless of N fertiliser. However, with cover crop, 20% more populations were found under 120 kgN ha−1 relative to 0 kgN ha−1 (Figure 5a).

3.3. Treatment Effects on Soil Fungal Populations

3.3.1. Syferkuil

At Syferkuil, fungal populations did not vary under cover crop, combined nano Zn and Cu, and N fertiliser in 2023 (Figure 6a). Significant interactions were only observed for combined nano Zn and Cu × N fertiliser (Figure 6b). Therefore, an average 1.6% fungal population increase occurred when combined nano Zn and Cu interacted with N fertiliser at 60 kgN ha−1 compared to 0 and 120 kgN ha−1 (Figure 6b). Application rates of 60 kgN ha−1 and 180 kgN ha−1 showed no variation in fungal populations.
In 2024, the results at Syferkuil revealed significant effects of cover crop on fungal populations, while combined nano Zn and Cu, N fertiliser, and all interactions had no effect (Figure 6a,b). As such, cover crop incorporation increased fungal populations by 11% compared to treatments without it (Figure 6a).

3.3.2. Ofcolaco

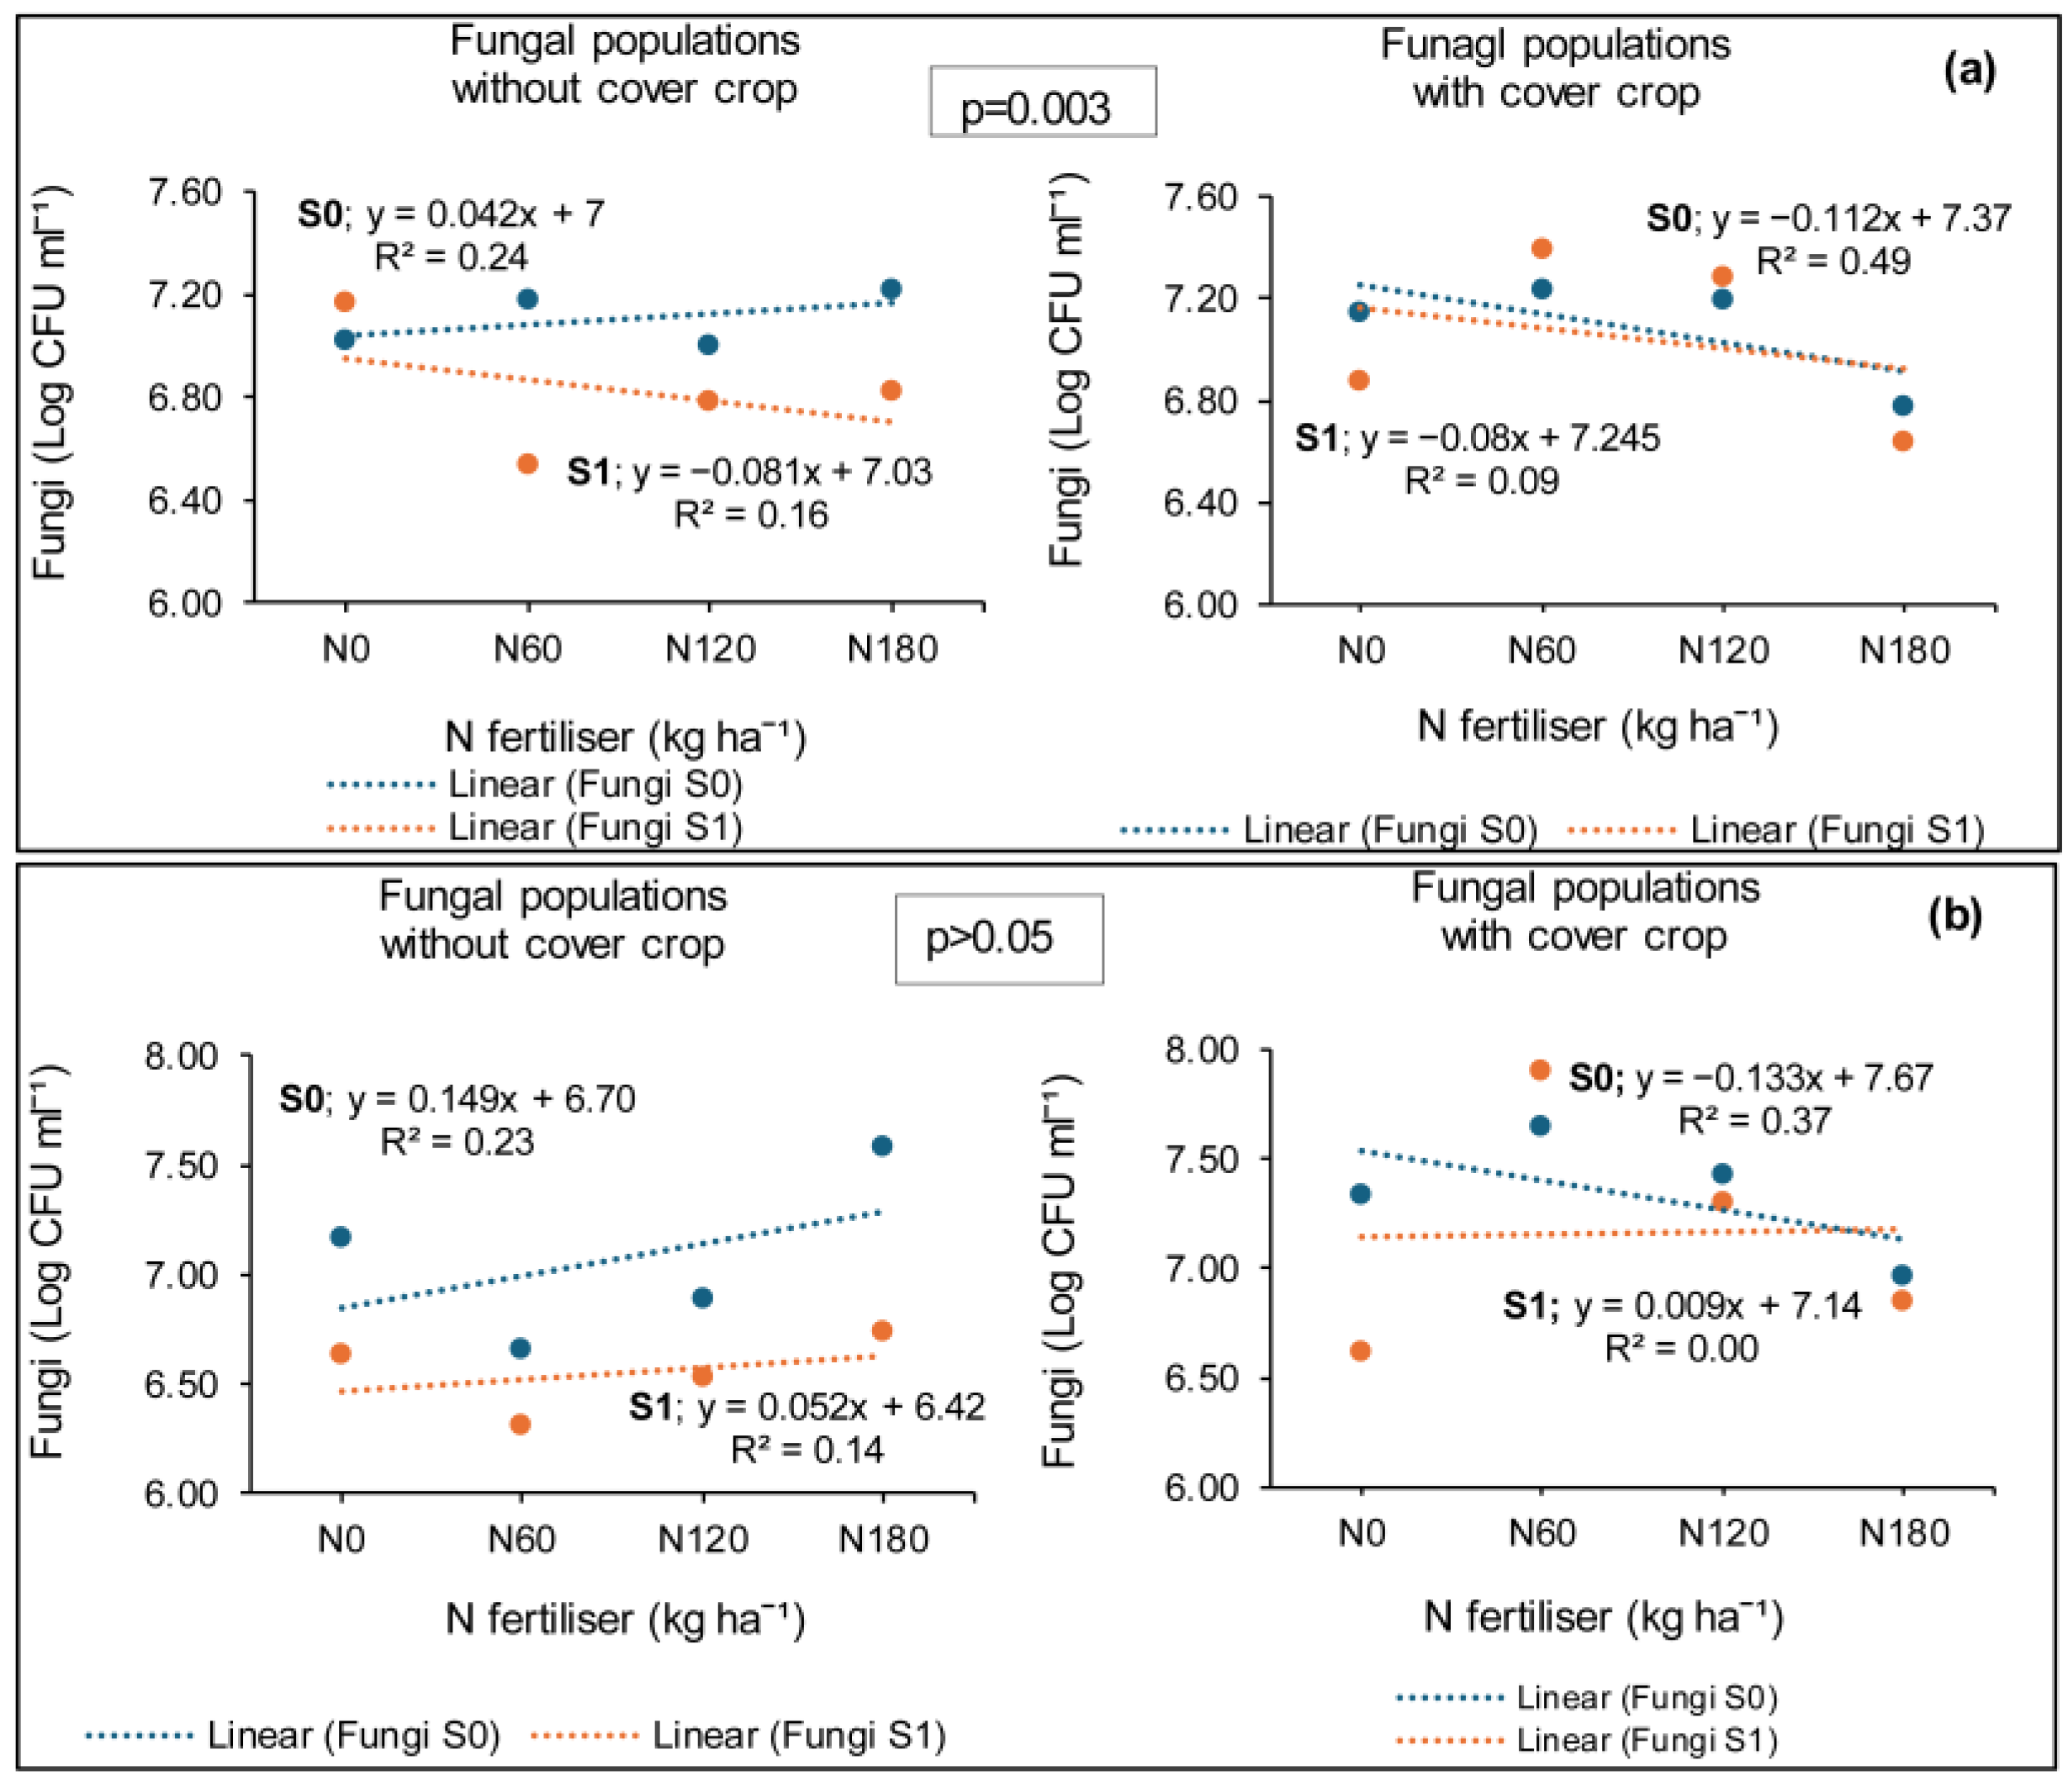
Ofcolaco fungal populations for the 2023 season were significantly affected by combined nano Zn and Cu and N fertiliser application, while cover crop had no impact. Significant interaction effects were also recorded, except for nano Zn and Cu × N fertiliser (Figure 7a). In 2024, fungal populations did not respond to any treatment or their interactions (Figure 7b).
During the 2023 season, the absence of cover crop and combined nano Zn and Cu had no interactive effects on fungal populations, irrespective of N fertiliser application (Figure 7a). However, with combined nano Zn and Cu application, the population count under 0 kgN ha−1 was 10% greater than 60 kgN ha−1 without cover crop incorporation but similar to 120 and 180 kgN ha−1 application rates under the same condition. With cover crop incorporation and no application of combined nano Zn and Cu, fungal populations showed no differences regardless of N fertilisation. Under the three-factor interaction with cover crop and combined nano Zn and Cu, 11% higher fungal populations were recorded at 60 kgN ha−1 relative to 180 kgN ha−1 (Figure 7a). The fertilisation rate of 60 kgN ha−1 was similar to 0 and 120 kgN ha−1.

3.4. Treatment Effects on Soil Active Carbon (POxC)

3.4.1. Syferkuil

Active carbon at Syferkuil was significantly influenced by cover crop, combined nano Zn and Cu, N fertiliser, and their respective interactions in 2023 (Table 4 and Figure 8). In 2024, POxC was significantly affected by cover crop and N fertiliser, while combined nano Zn and Cu and all interactions were not significant (Table 4 and Figure 8b).
Table 4 shows that in 2023, POxC increased by 30% under cover crop relative to treatment without cover and by 14% when nano Zn and Cu was applied compared to the unfertilised treatments. Regarding the impact of N fertiliser application, an application rate of 180 kgN ha−1 reduced POxC by 10% compared to 0 kgN ha−1 (Table 4). Additionally, in the absence of cover crop and combined nano Zn and Cu, the 0 kgN ha−1 fertiliser rate resulted in POxC values that were 85% higher than those observed with 180 kgN ha−1 while being equivalent to the values for 60 and 120 kgN ha−1 (Figure 8a). In contrast, the application of combined nano Zn and Cu alongside N fertiliser at a rate of 180 kgN ha−1 resulted in an average improvement of 97% compared to 0 and 120 kgN ha−1 without cover crop and was comparable to the results observed at 60 kgN ha−1. In the presence of cover crop, the non-fertilised plots resulted in an average increase of 84% in POxC compared to other rates lacking combined nano Zn and Cu. Conversely, POxC exhibited a further increase of 30% when cover crop, combined nano Zn and Cu, and N fertiliser were applied at 180 kgN ha−1 compared to 0 kgN ha−1, although both rates were comparable to those at 60 and 120 kgN ha−1 (Figure 8a). Soil active carbon (POxC) at Syferkuil displayed an increasing trend associated with combined nano Zn and Cu application, especially under cover crop incorporation, while a decline occurred in treatments without combined nano Zn and Cu (Figure 8a).
The 2024 season at Syferkuil had a 13% higher POxC recorded under cover crop than treatments without it, while 120 kgN ha−1 led to 16% greater POxC than 0 kgN ha−1 (Table 4). Both rates were similar to 60 and 180 kgN ha−1.

3.4.2. Ofcolaco

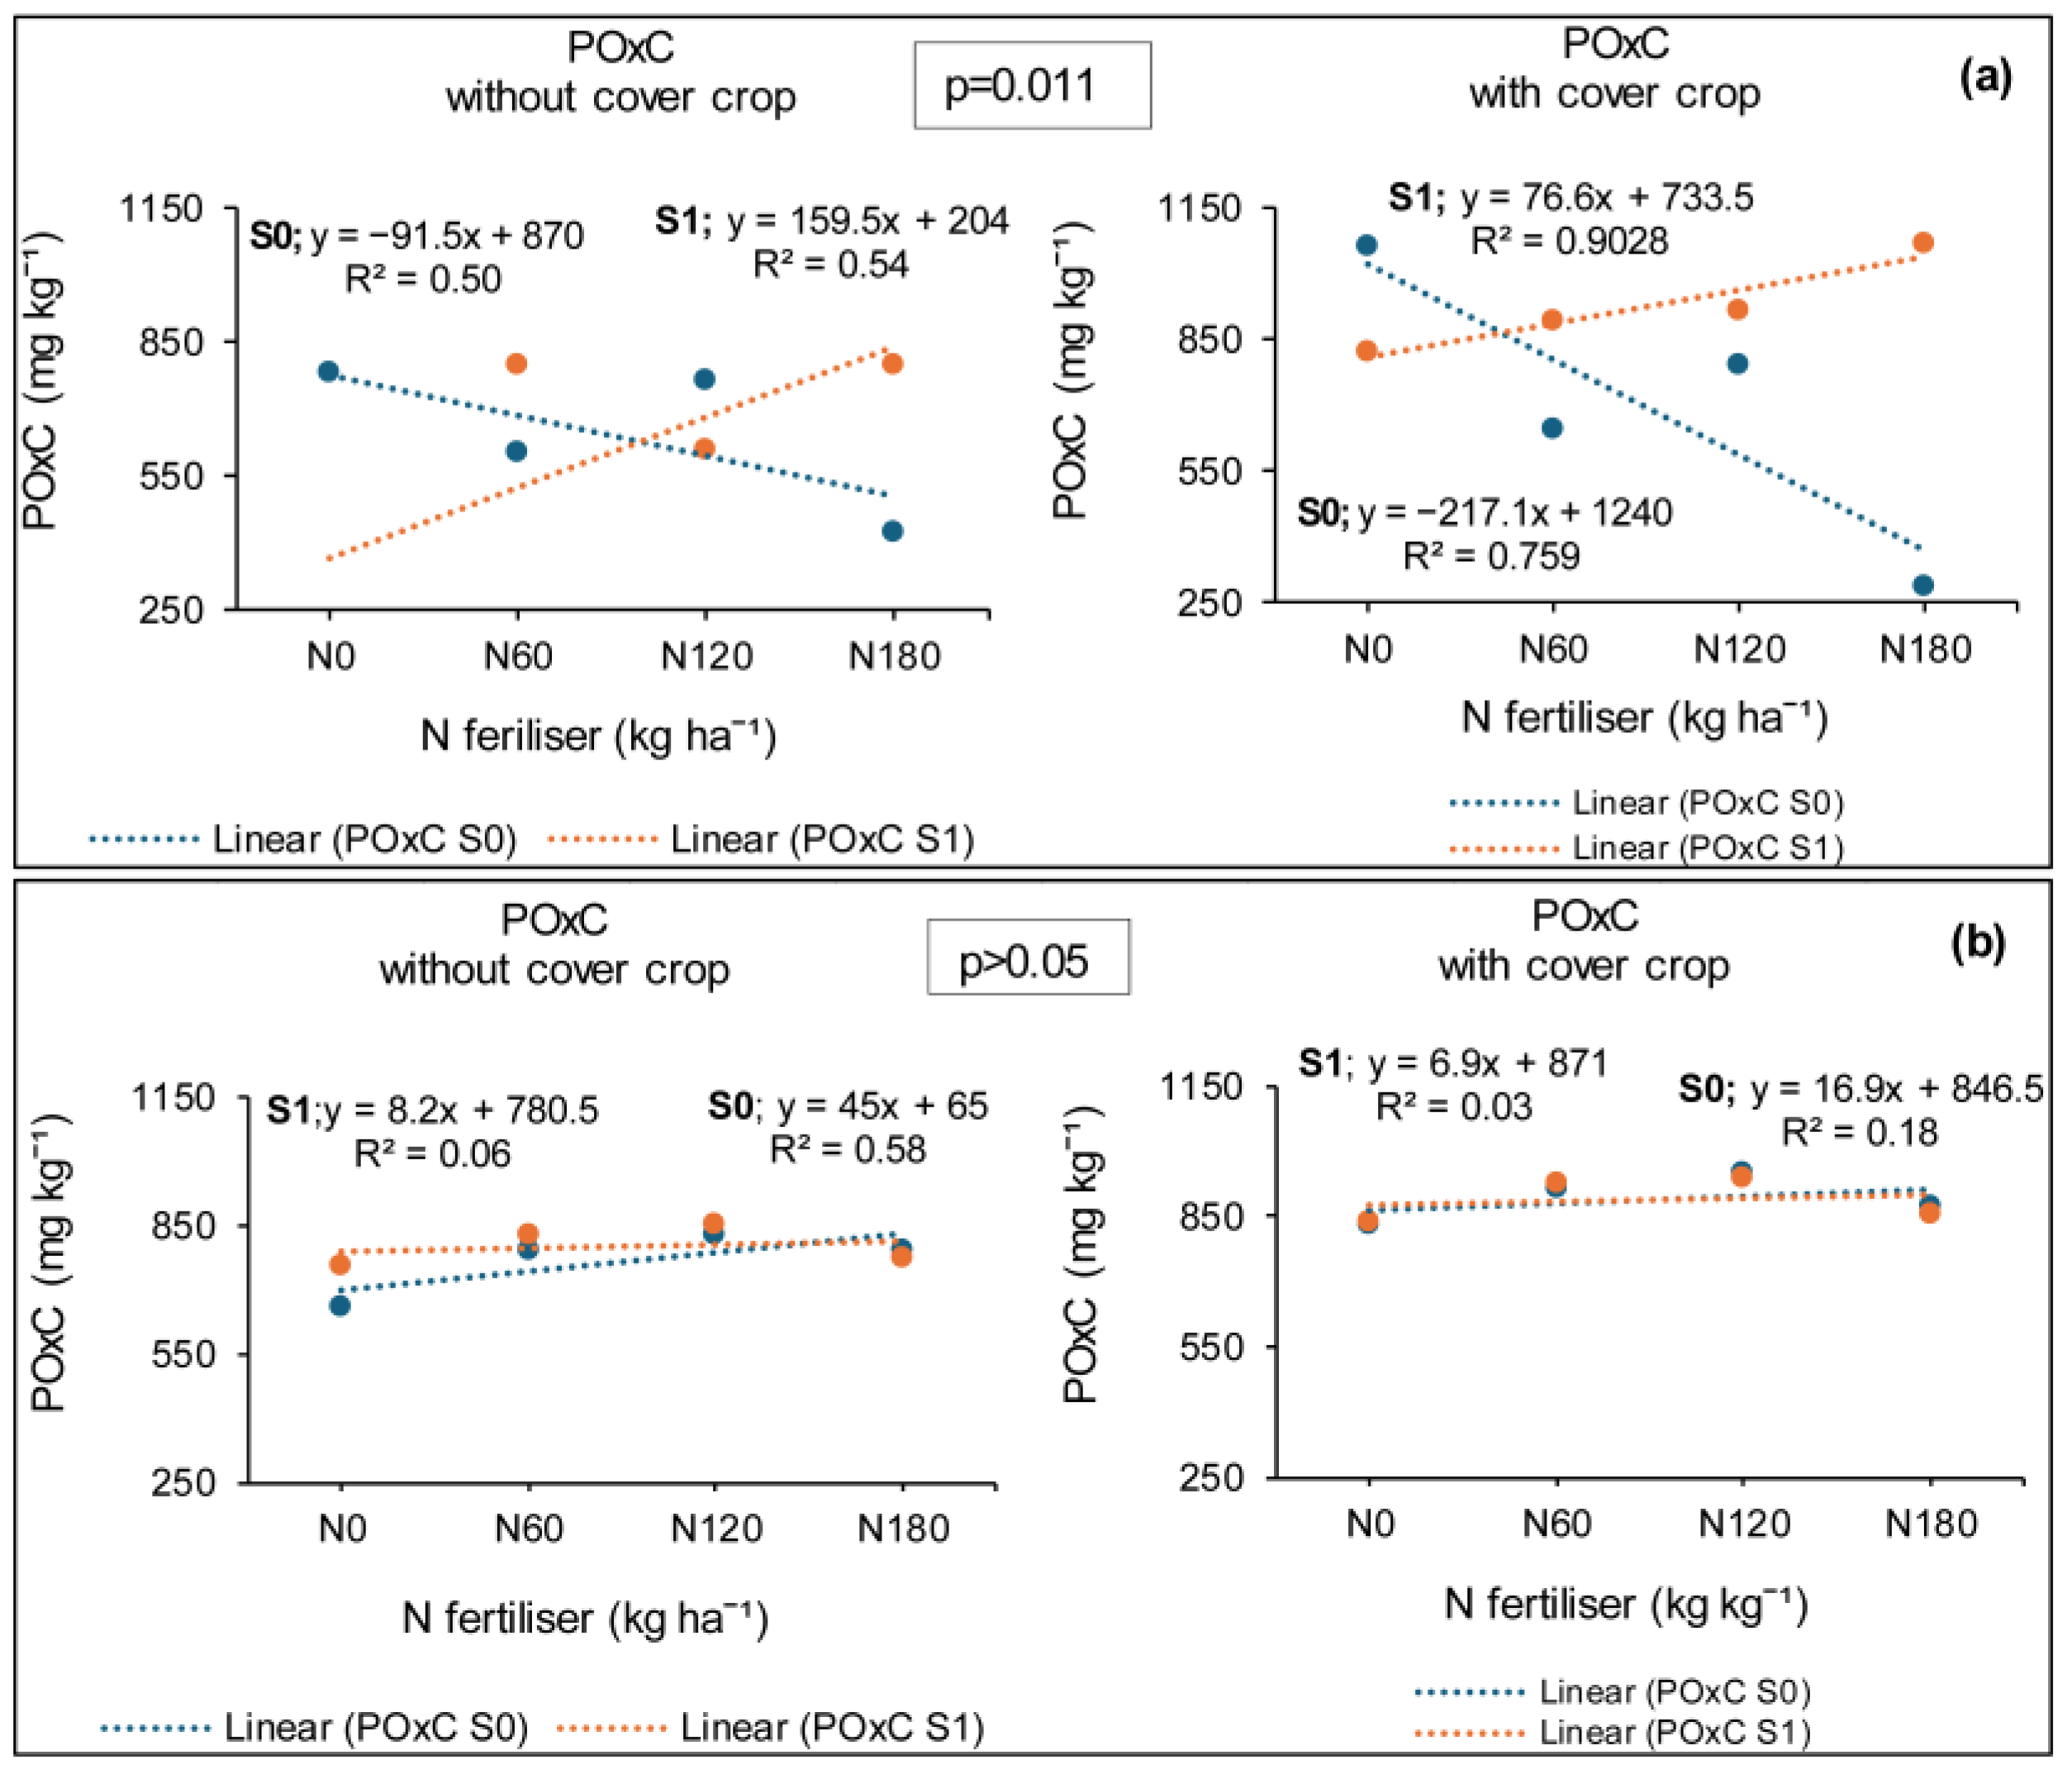
Soil POxC at Ofcolaco was not influenced by the main effects and their interaction in 2023 (Table 5). However, the treatments had POxC that ranged from 822 to 1104 mg. kg−1, though no significant variation was observed.
In 2024, POxC was significantly affected by cover crop and N fertiliser, while combined nano Zn and Cu and all interactions had no impact (Table 5). A 30% improvement in POxC was recorded under cover crop incorporation compared to treatments without it. Additionally, POxC increased by 22% when N fertiliser was applied at 180 kgN ha−1 compared to 0 kgN ha−1, although both rates were similar to 60 and 120 kgN ha−1 (Table 5).

3.5. Treatment Effects on Soil Organic Matter (SOM)

3.5.1. Syferkuil

There were significant effects of cover crop, combined nano Zn and Cu, N fertiliser, and all interactions observed at Syferkuil for the 2023 season. In 2024 the main factors and interactions were not significant, except for the combined nano Zn and Cu × N fertiliser.
In 2023, the SOM results regarding the absence of cover crop and combined nano Zn and Cu, at 60 kgN ha−1, resulted in a 0.23 percentage points increase in the SOM relative to the average of the other rates (Figure 9b). Still without cover crop, the 60 kgN ha−1 rate influenced a 0.17 percentage points improvement in the SOM compared to the average of 0 and 180 kgN ha−1 with combined nano Zn and Cu. The optimal rate of 60 kgN ha−1 did not vary from 120 kgN ha−1. Incorporating cover crop without combined nano Zn and Cu application resulted in a 0.31 percentage points increase in SOM at 120 kgN ha−1 compared to the average of 0, 60, and 180 kgN ha−1 (Figure 9b). When cover crop and combined nano Zn and Cu were applied, the SOM increased by 0.25 percentage points under 60 kgN ha−1 fertiliser application compared to the average of 0 and 120 kgN ha−1. However, 60 kgN ha−1 was comparable to 180 kgN ha−1.
The results in 2024 revealed a 0.33 percentage point increase in the SOM when 120 kgN ha−1 was applied without combined nano Zn and Cu, exceeding 60 kgN ha−1. On the contrary, the application of combined nano Zn and Cu improved the SOM by 0.07 percentage points under 60 kgN ha−1 relative to 120 kgN ha−1 (Figure 9a).

3.5.2. Ofcolaco

Soil organic matter in 2023 was significantly affected by cover crop and N fertiliser, while combined nano Zn and Cu was not. Interactive effects were significant for cover crop × combined nano Zn and Cu, as well as cover crop × combined nano Zn and Cu × N fertiliser only. In 2024, the SOM was significantly affected by cover crop incorporation, whereas combined nano Zn and Cu, N fertiliser, and all interactions did not yield significant effects (Figure 10a,c).
The results for 2023 showed that cover crop incorporation at Ofcolaco resulted in a 0.46 percentage point increase in the SOM compared to those without it (Figure 10a). Furthermore, without cover crop incorporation and combined nano Zn and Cu, the SOM was not affected regardless of N fertiliser (Figure 10b). However, combined nano Zn and Cu application without cover crop resulted in a 1.28 percentage points increase in SOM under 120 kgN ha−1 compared to the average of 0 and 60 kgN ha−1. On the other hand, cover crop incorporation without combined nano Zn and Cu led to a 1.83 percentage point increase in SOM under 120 kgN ha−1 compared to the average of 0 and 60 kgN ha−1 (Figure 10b). Moreover, no variation in the SOM was observed when cover crop and combined nano Zn and Cu were both applied, irrespective of N fertiliser application.
In 2024, SOM under cover cropping increased by 0.26 percentage points compared to plots without cover crop incorporation (Figure 10a).

3.6. Treatment Effects on Soil Microbial Activity (FDA)

3.6.1. Syferkuil

In 2023, the microbial activity (FDA) at Syferkuil was significantly affected by cover crop, while combined nano Zn and Cu and N fertiliser were not. Interactive effects were not observed, except for cover crop × combined nano Zn and Cu × N fertiliser.
An improvement of 68% FDA occurred upon incorporation of cover crop relative to treatments without it (Figure 11a). Regarding the interaction of combined nano Zn and Cu in 2023, there was no variation in FDA under no cover crop, irrespective of combined nano Zn and Cu and N fertiliser application. The same trend was observed under cover crop incorporation. However, the treatments under cover crop exceeded those without cover crop, where 120 kgN ha−1 without nanofertiliser was 108% higher than the average of all treatments without cover crop, except for 120 kgN ha−1 under combined nano Zn and Cu application (Figure 11a).
In 2024, FDA activity was significantly impacted by N fertiliser, while cover crop and combined nano Zn and Cu had no effect. The interaction effects of main factors were also observed for cover crop × N fertiliser and cover crop × combined nano Zn and Cu × N fertiliser, with the exception of combined nano Zn and Cu × N fertiliser. The absence of cover crop and combined nano Zn and Cu resulted in no variation in the FDA, regardless of N fertiliser application (Figure 11b). On the contrary, an average 124% FDA improvement was detected under 120 kgN ha−1 compared to the average of 0, 60, and 180 kgN ha−1 when combined nano Zn and Cu was applied without cover crop. Moreover, the FDA had no variation when cover crop and N fertiliser were applied without combined nano Zn and Cu. However, with combined nano Zn and Cu, the 180 kgN ha−1 rate had a 96% greater FDA than the 120 kgN ha−1 rate, but both rates were similar to 0 and 60 kgN ha−1 under cover crop incorporation (Figure 11b).

3.6.2. Ofcolaco

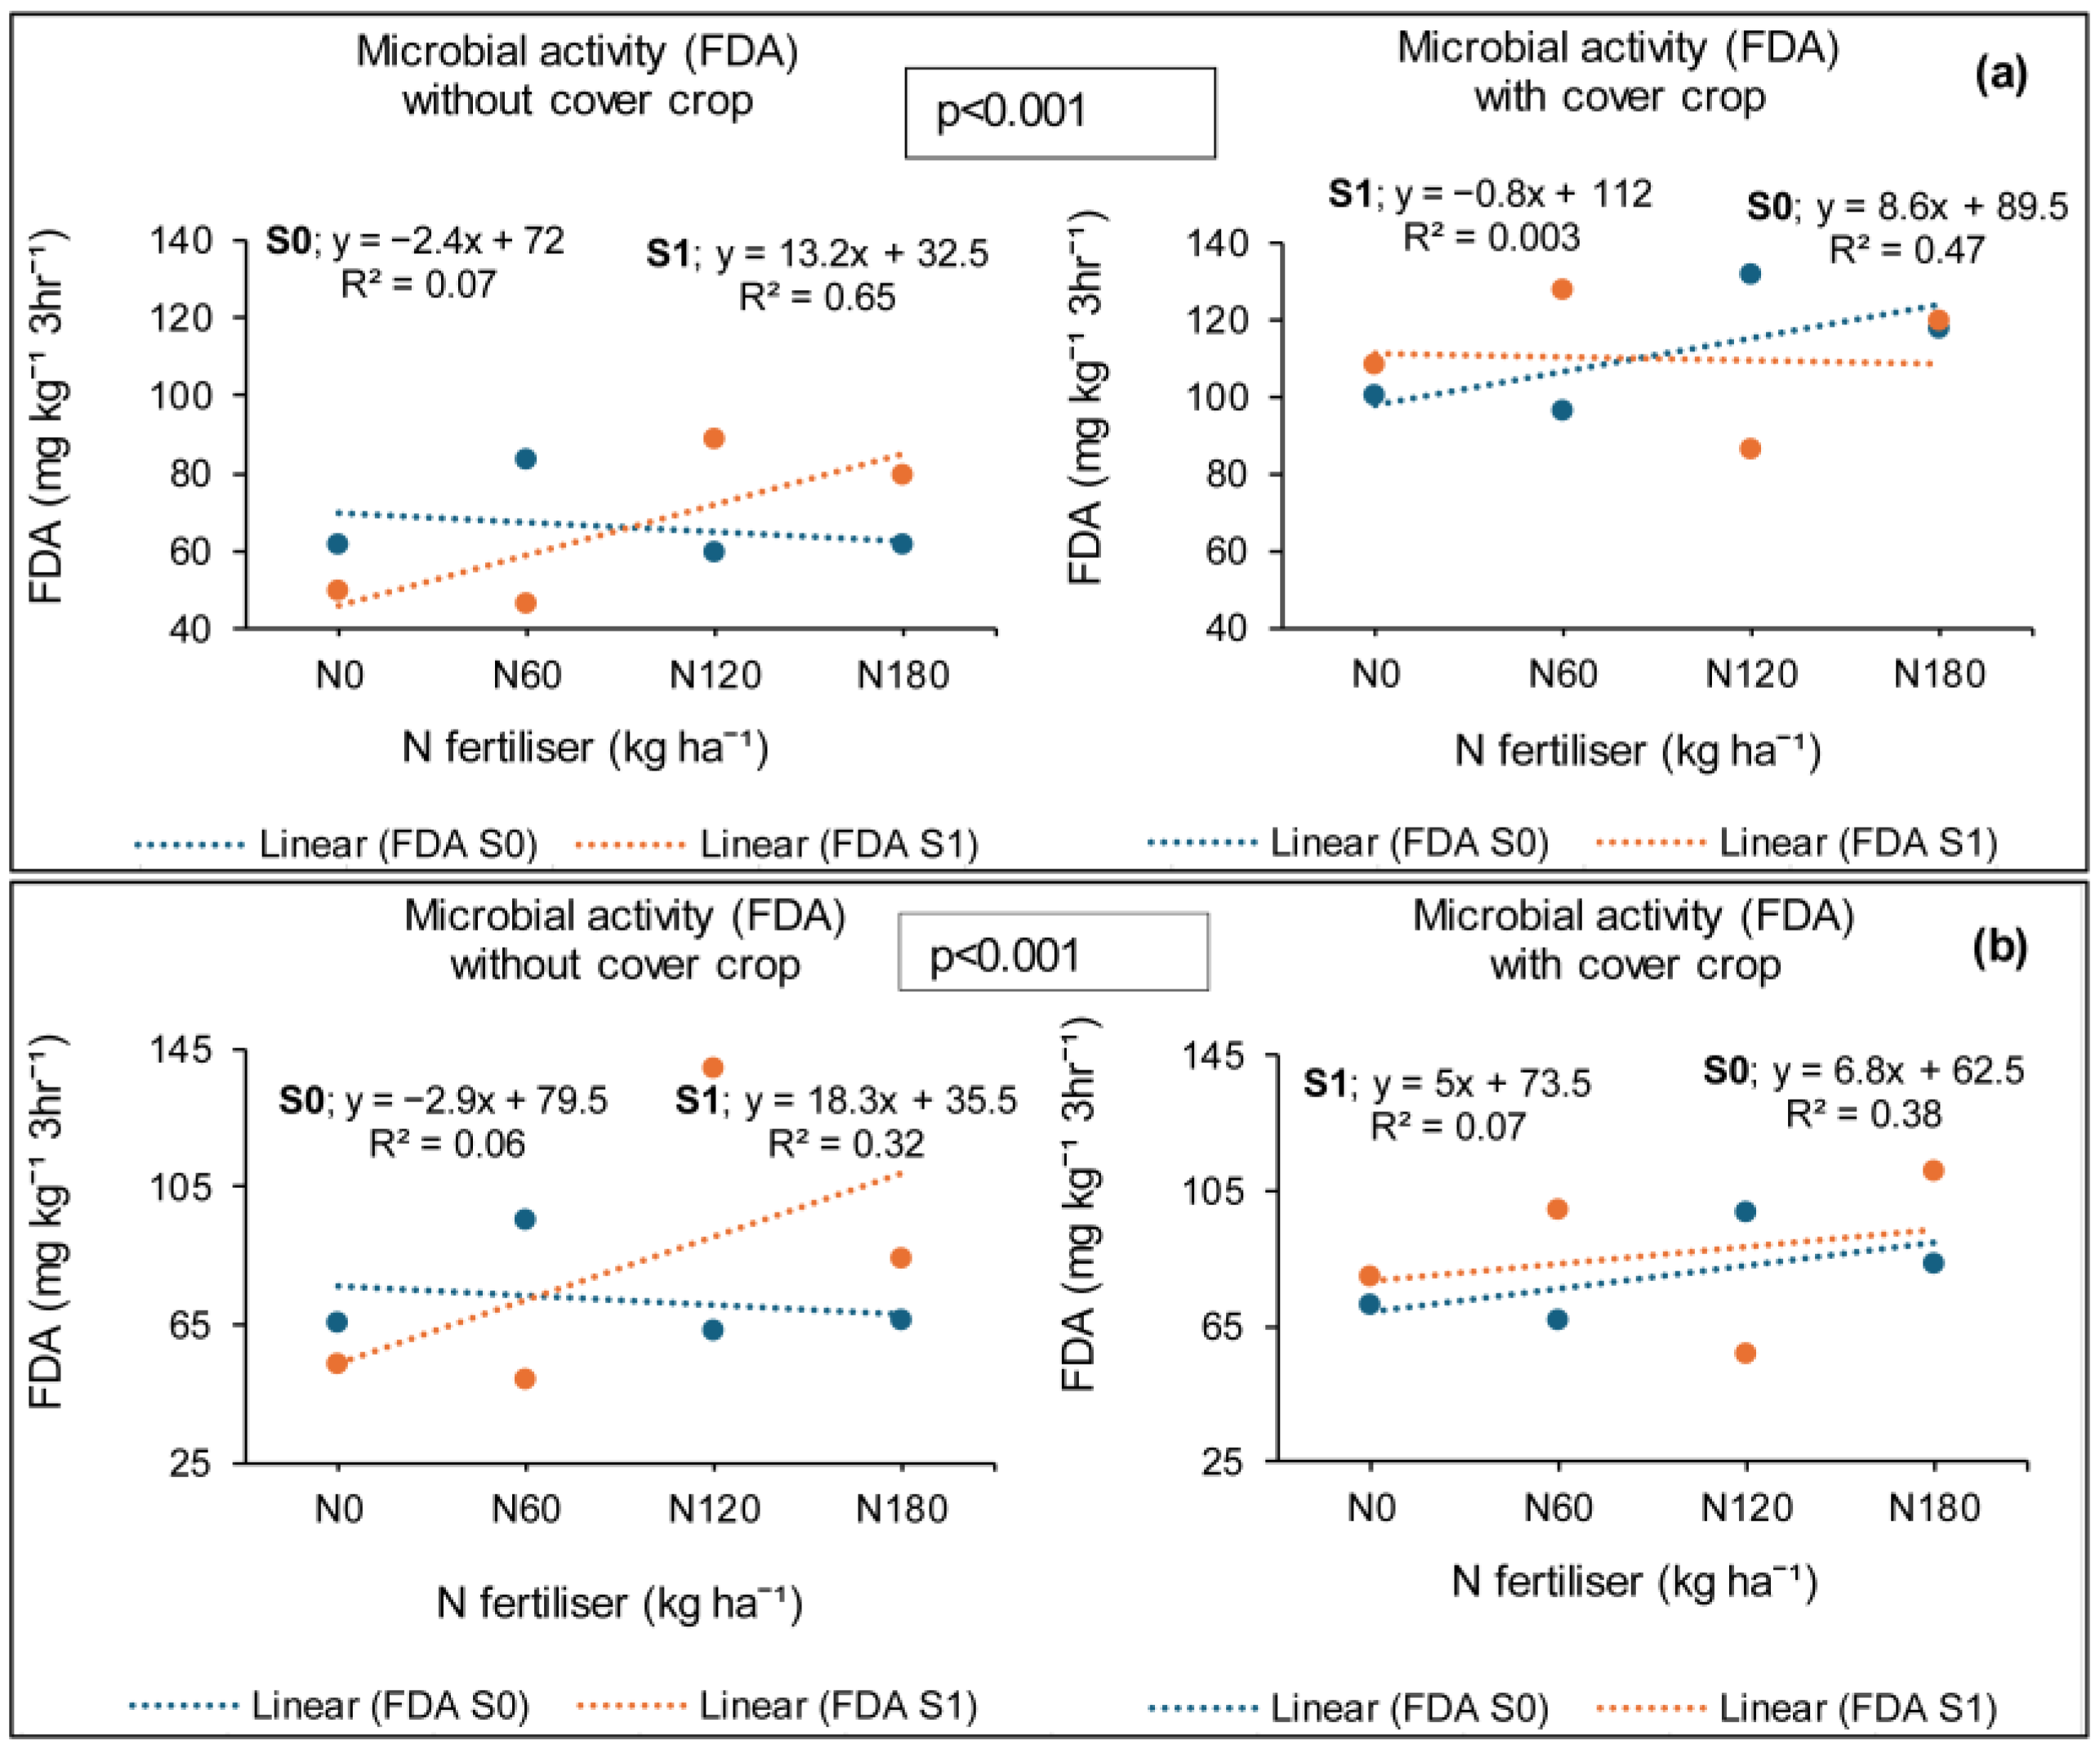
Soil FDA at Ofcolaco was significantly affected by cover crop and N fertiliser for the 2023 and 2024 season, with no significant interactions.
The microbial activity (FDA) for the 2023 season increased by 52% with cover crop incorporation compared to treatments without it (Figure 12a). Nitrogen fertiliser at 180 kgN ha−1 was among the highest performing rates, resulting in a 72% increase in FDA compared to 0 kgN ha−1. The optimal FDA performance rate was comparable at 120 and 60 kgN ha−1 (Figure 12b).
In 2024, treatments with cover crop increased the FDA by 40% relative to treatments without (Figure 12a), On the other hand, N fertiliser application of 180 kgN ha−1 also increased the FDA by 48% compared to the average of 0 and 60 kgN ha−1 (Figure 12b). Similarities in the FDA were observed between 180 kgN ha−1 and 120 kgN ha−1.

3.7. Treatment Effects on Urease Enzyme Activity

3.7.1. Syferkuil

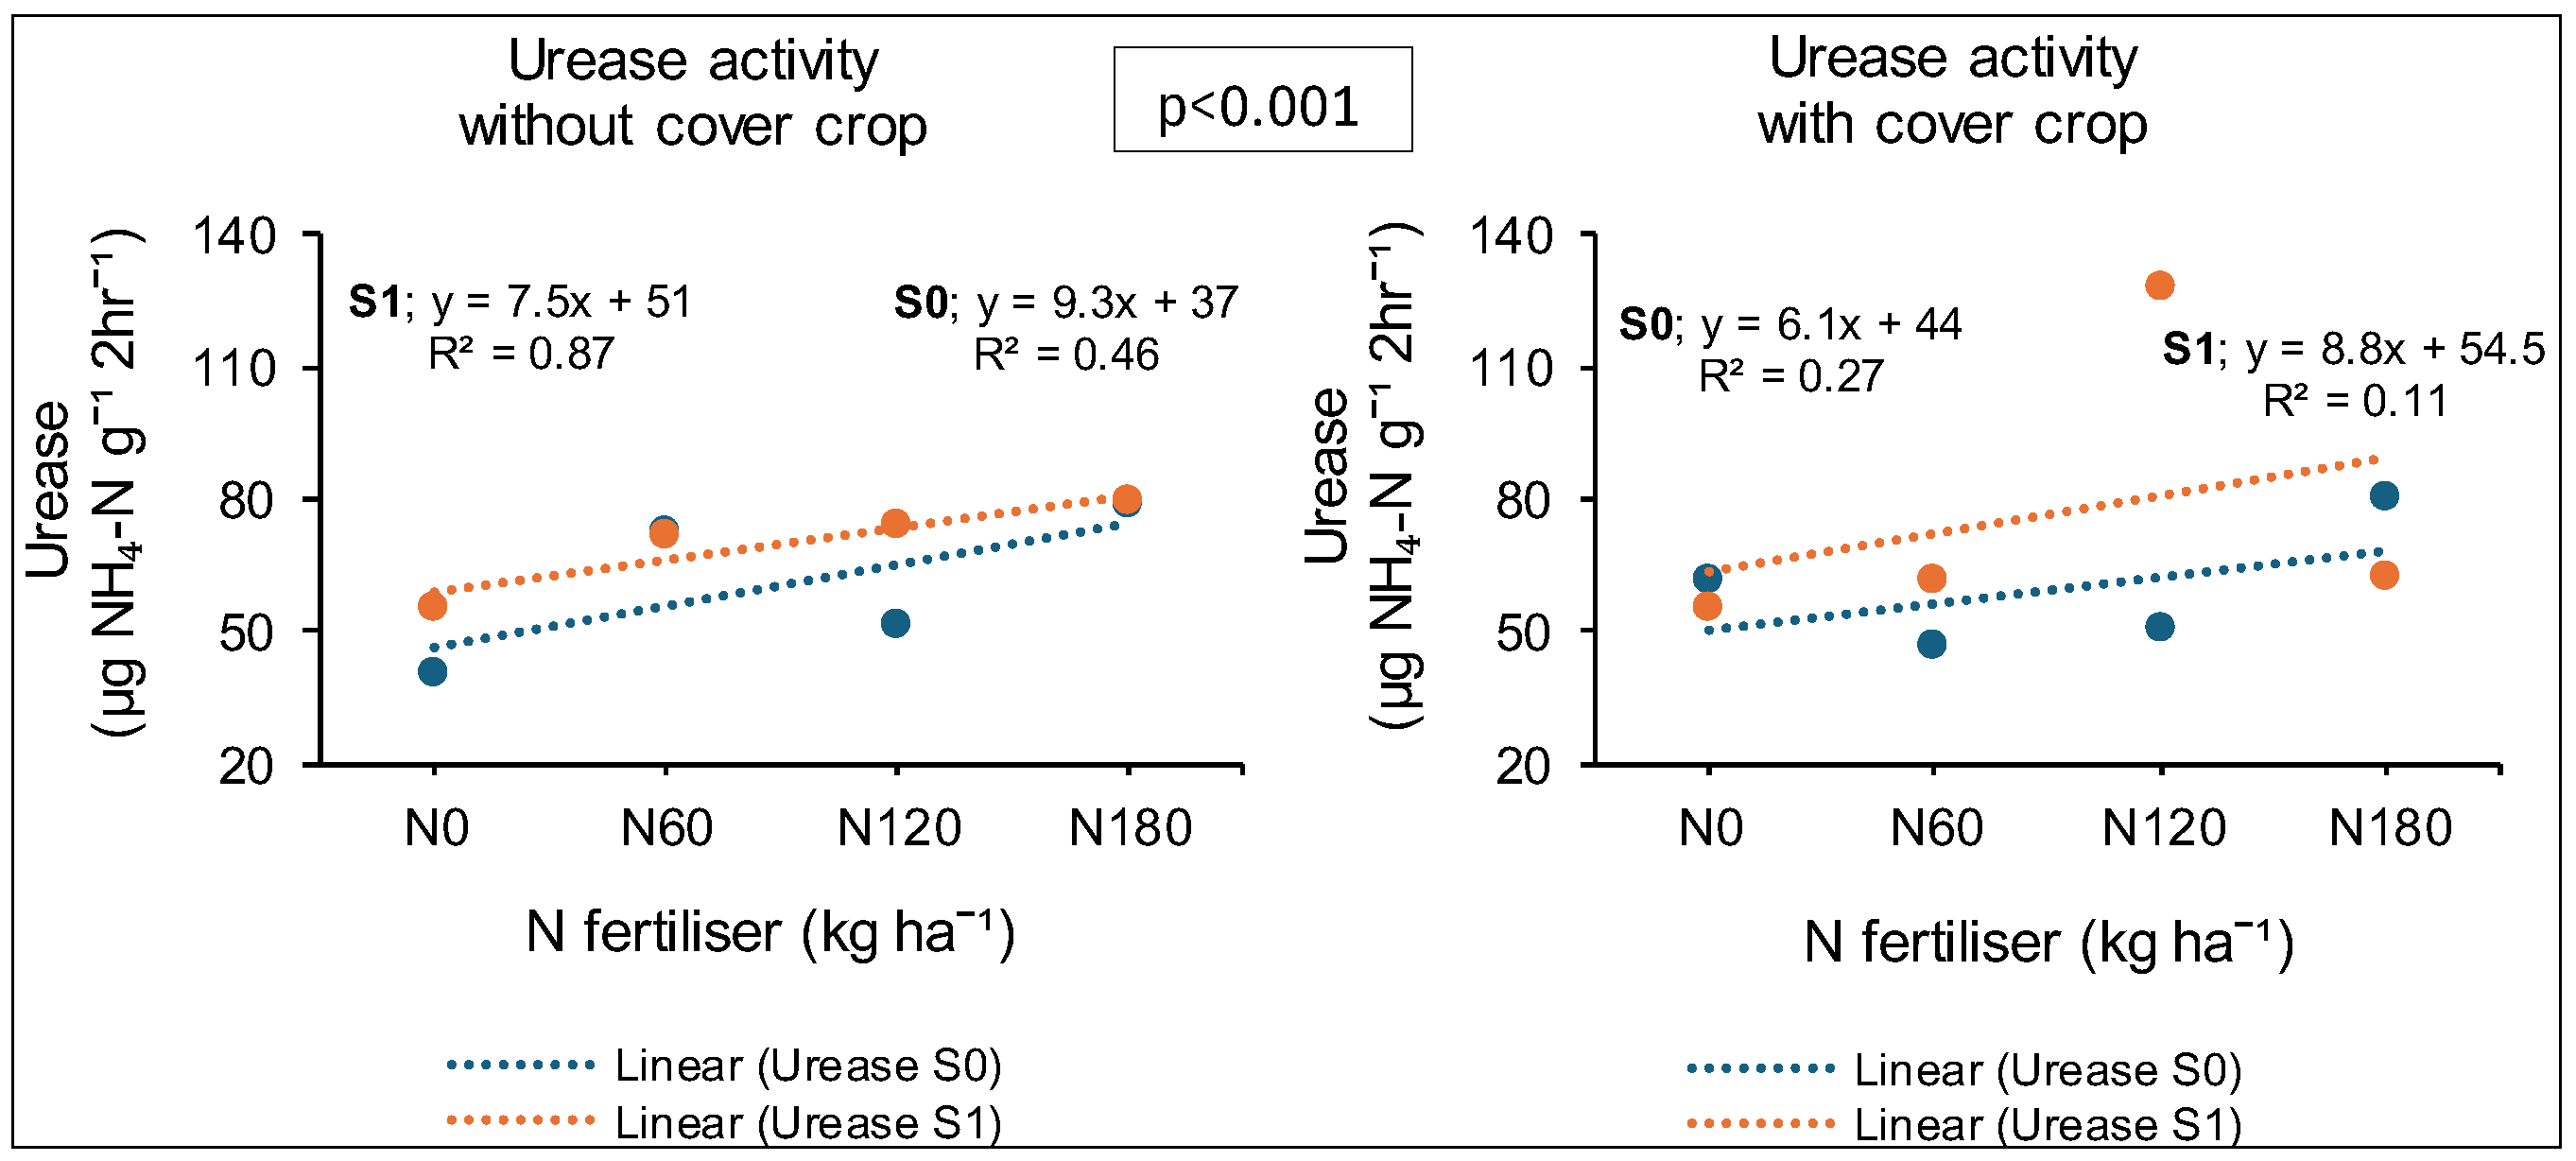
Combined nano Zn and Cu and N fertiliser significantly affected the urease activity at Syferkuil in 2023, while cover crop had no impact (Table 6). Additionally, significant interactions were observed on the parameter.
The results for 2023 revealed a 21% increase in activity under combined nano Zn and Cu compared to treatments without it. On the other hand, the N fertiliser rate of 120 kgN ha−1 increased the urease activity by 31% compared to the average of 0 and 60 kgN ha−1. The fertiliser rate of 120 kgN ha−1 was similar to the 180 kgN ha−1 rate (Table 6). Moreover, the absence of cover crop and combined nano Zn and Cu resulted in 95% higher activity under 180 kgN ha−1 compared to 0 kgN ha−1 (Figure 13). Nonetheless, in the absence of cover crops, the application of combined nano Zn and Cu did not influence the urease activity, irrespective of nitrogen fertiliser rates. An additional 74% more activity was found when cover crop was incorporated with N fertiliser at 180 kgN ha−1 in the absence of combined nano Zn and Cu, exceeding 60 kgN ha−1. Furthermore, the interaction of cover crop, combined nano Zn and Cu, and N fertiliser resulted in 117% higher urease activity under 120 kgN ha−1 relative to the average of 0 and 60 kgN ha−1 (Figure 13).
In 2024, the urease activity was significantly affected by the combined nano Zn and Cu and N fertiliser application, while cover crop and all interactions were not. Upon application of combined nano Zn and Cu, the urease activity increased by 21% compared to treatments without nanofertiliser. Meanwhile, N fertiliser resulted in 42% higher urease activity under 60 kgN ha−1 compared to the average of 120 and 180 kgN ha−1 (Table 6).

3.7.2. Ofcolaco

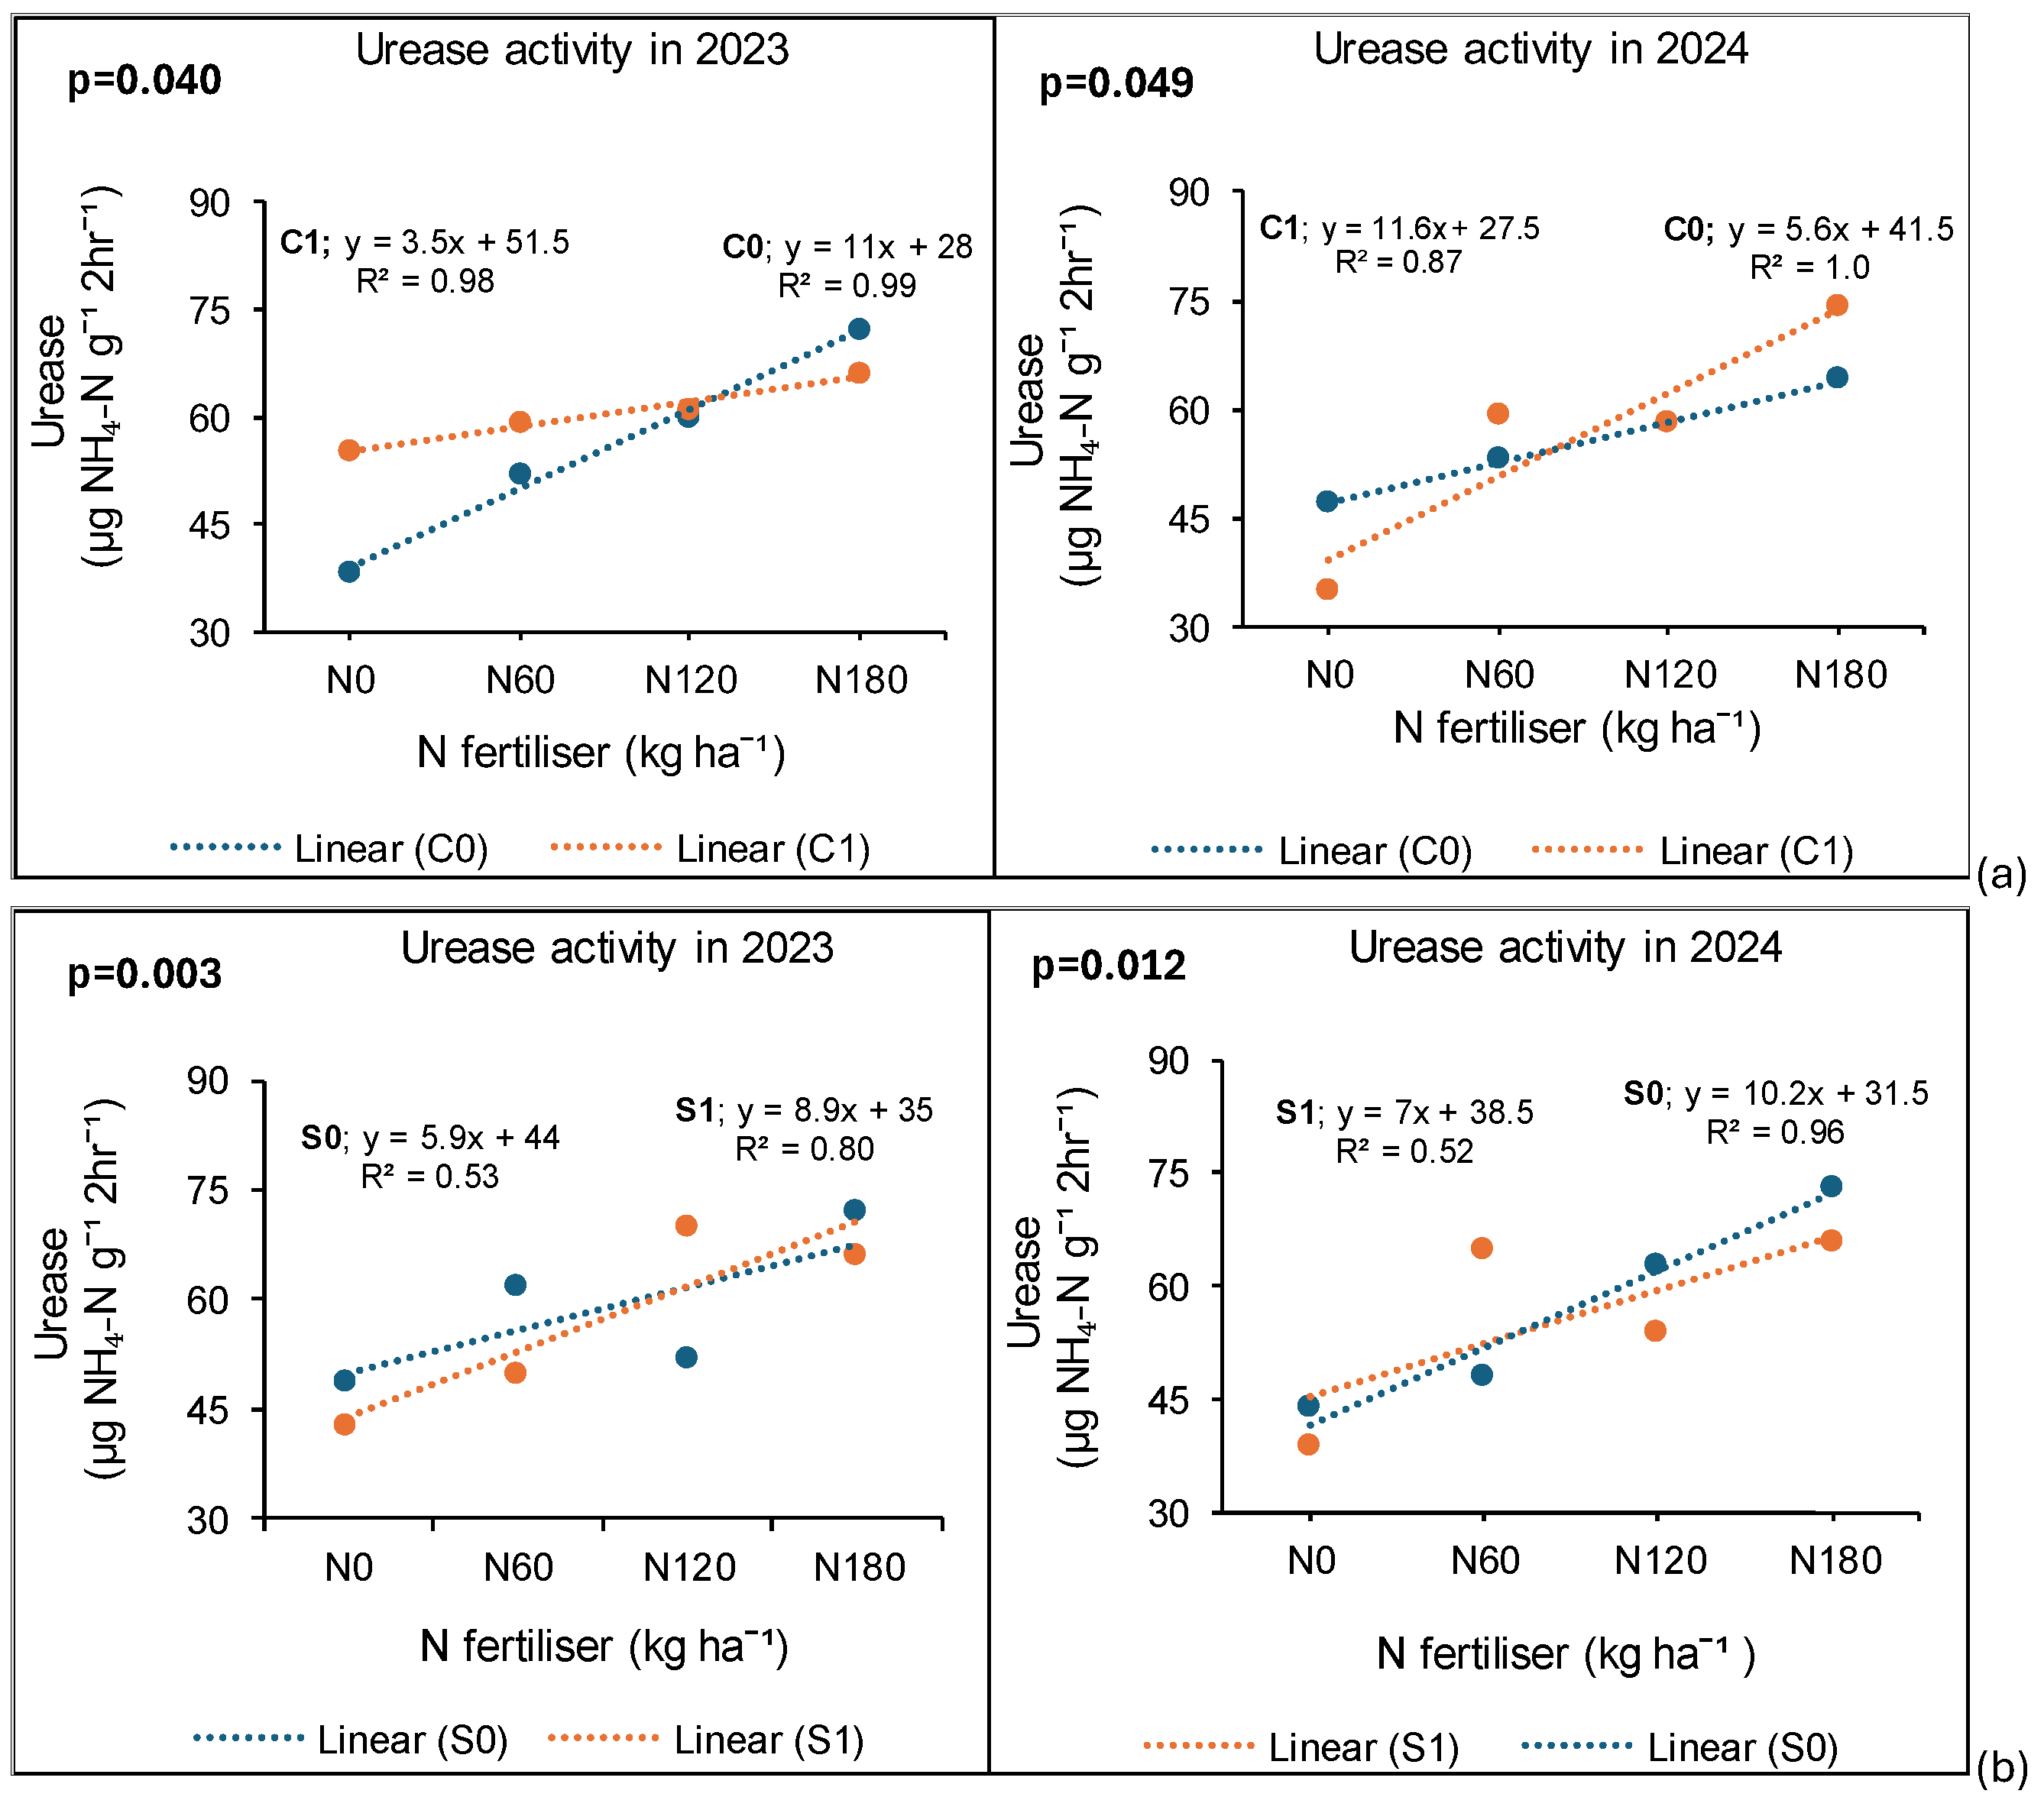
During the 2023 and 2024 season, the urease activity at Ofcolaco significantly varied due to N fertiliser, while cover crop and combined nano Zn and Cu had no impact. Also, interactive effects were observed under cover crop × N fertiliser and combined nano Zn and Cu × N fertiliser only.
In 2023, a result of 60% urease activity was observed without cover crop incorporation when 180 kgN ha−1 fertiliser was applied relative to the average of 0 and 60 kgN ha−1 (Figure 14a). The application rate of 180 kgN ha−1 did not vary from 120 kgN ha−1. On the other hand, with cover crop incorporation, no variation occurred, regardless of N fertiliser application rates (Figure 14a). On the other hand, without combined nano Zn and Cu, N fertiliser at 180 kgN ha−1 resulted in 43% higher urease activity than the average of 0 and 120 kgN ha−1 but maintained similarities with 60 kgN ha−1 (Figure 14b). The application of combined nano Zn and Cu also resulted in 51% greater activity at 120 kgN ha−1 averaged between 0 and 60 kgN ha−1, although there was no variation between 180 kgN ha−1 and 120 kgN ha−1 (Figure 14b).
In 2024, the interaction without cover crop did not affect the urease activity, regardless of N fertiliser application (Figure 14a). However, with cover crop, 180 kgN ha−1 resulted in 111% higher urease activity than 0 kgN ha−1, but the optimum rate did not vary from 60 and 120 kgN ha−1. Also, without combined nano Zn and Cu, N fertiliser at 180 kgN ha−1 resulted in an average 59% higher urease activity than the average of 0 and 60 kgN ha−1 (Figure 14b). Alternatively, the application of combined nano Zn and Cu and N fertiliser at 180 kgN ha−1 resulted in one of the highest activities, surpassing 0 kgN ha−1 by 69%. However, fertiliser application rates of 60 and 120 kgN ha−1 did not differ from 180 kgN ha−1 (Figure 14b).

3.8. Treatment Effects on Soil pH

3.8.1. Syferkuil

The 2023 season at Syferkuil revealed the significant effects of cover crop, combined nano Zn and Cu, and N fertiliser on soil pH. Interactive effects were also significant, with the exception of cover crop × combined nano Zn and Cu × N fertiliser.
The interaction of cover crop × N fertiliser resulted in 2.4% lower soil pH at 180 kgN ha −1 relative to 60 kgN ha−1 without cover crop. Meanwhile, with cover crop, the soil pH was 3.9% lower under the average of 60, 120, and 180 kgN ha−1 compared to 0 kgN ha−1, whereas 60 and 180 kgN ha−1 were similar (Figure 15a). Furthermore, an average pH decline of 3% was observed without combined nano Zn and Cu application when N fertiliser was applied at 60 and 180 kgN ha−1 relative to 0 kgN ha−1 (Figure 15b). However, similarities in pH were observed for 0 and 120 kgN ha−1. Meanwhile, combined nano Zn and Cu application resulted in an average 3% decline under N fertiliser rates 120 and 180 kgN ha−1 compared to 0 kgN ha−1 (Figure 15b).
In 2024, soil pH was significantly affected by N fertiliser, whereas cover crop, combined nano Zn and Cu, and all interactions were not significant, except for cover crop × N fertiliser. The absence of cover crop decreased pH by 2% under 180 kgN ha−1 compared to 0 kgN ha−1 (Figure 15c). No variation in soil pH was observed under 0, 60, and 120 kgN h−1. However, incorporating cover crop did not affect the soil pH, despite the application of N fertiliser (Figure 15c).

3.8.2. Ofcolaco

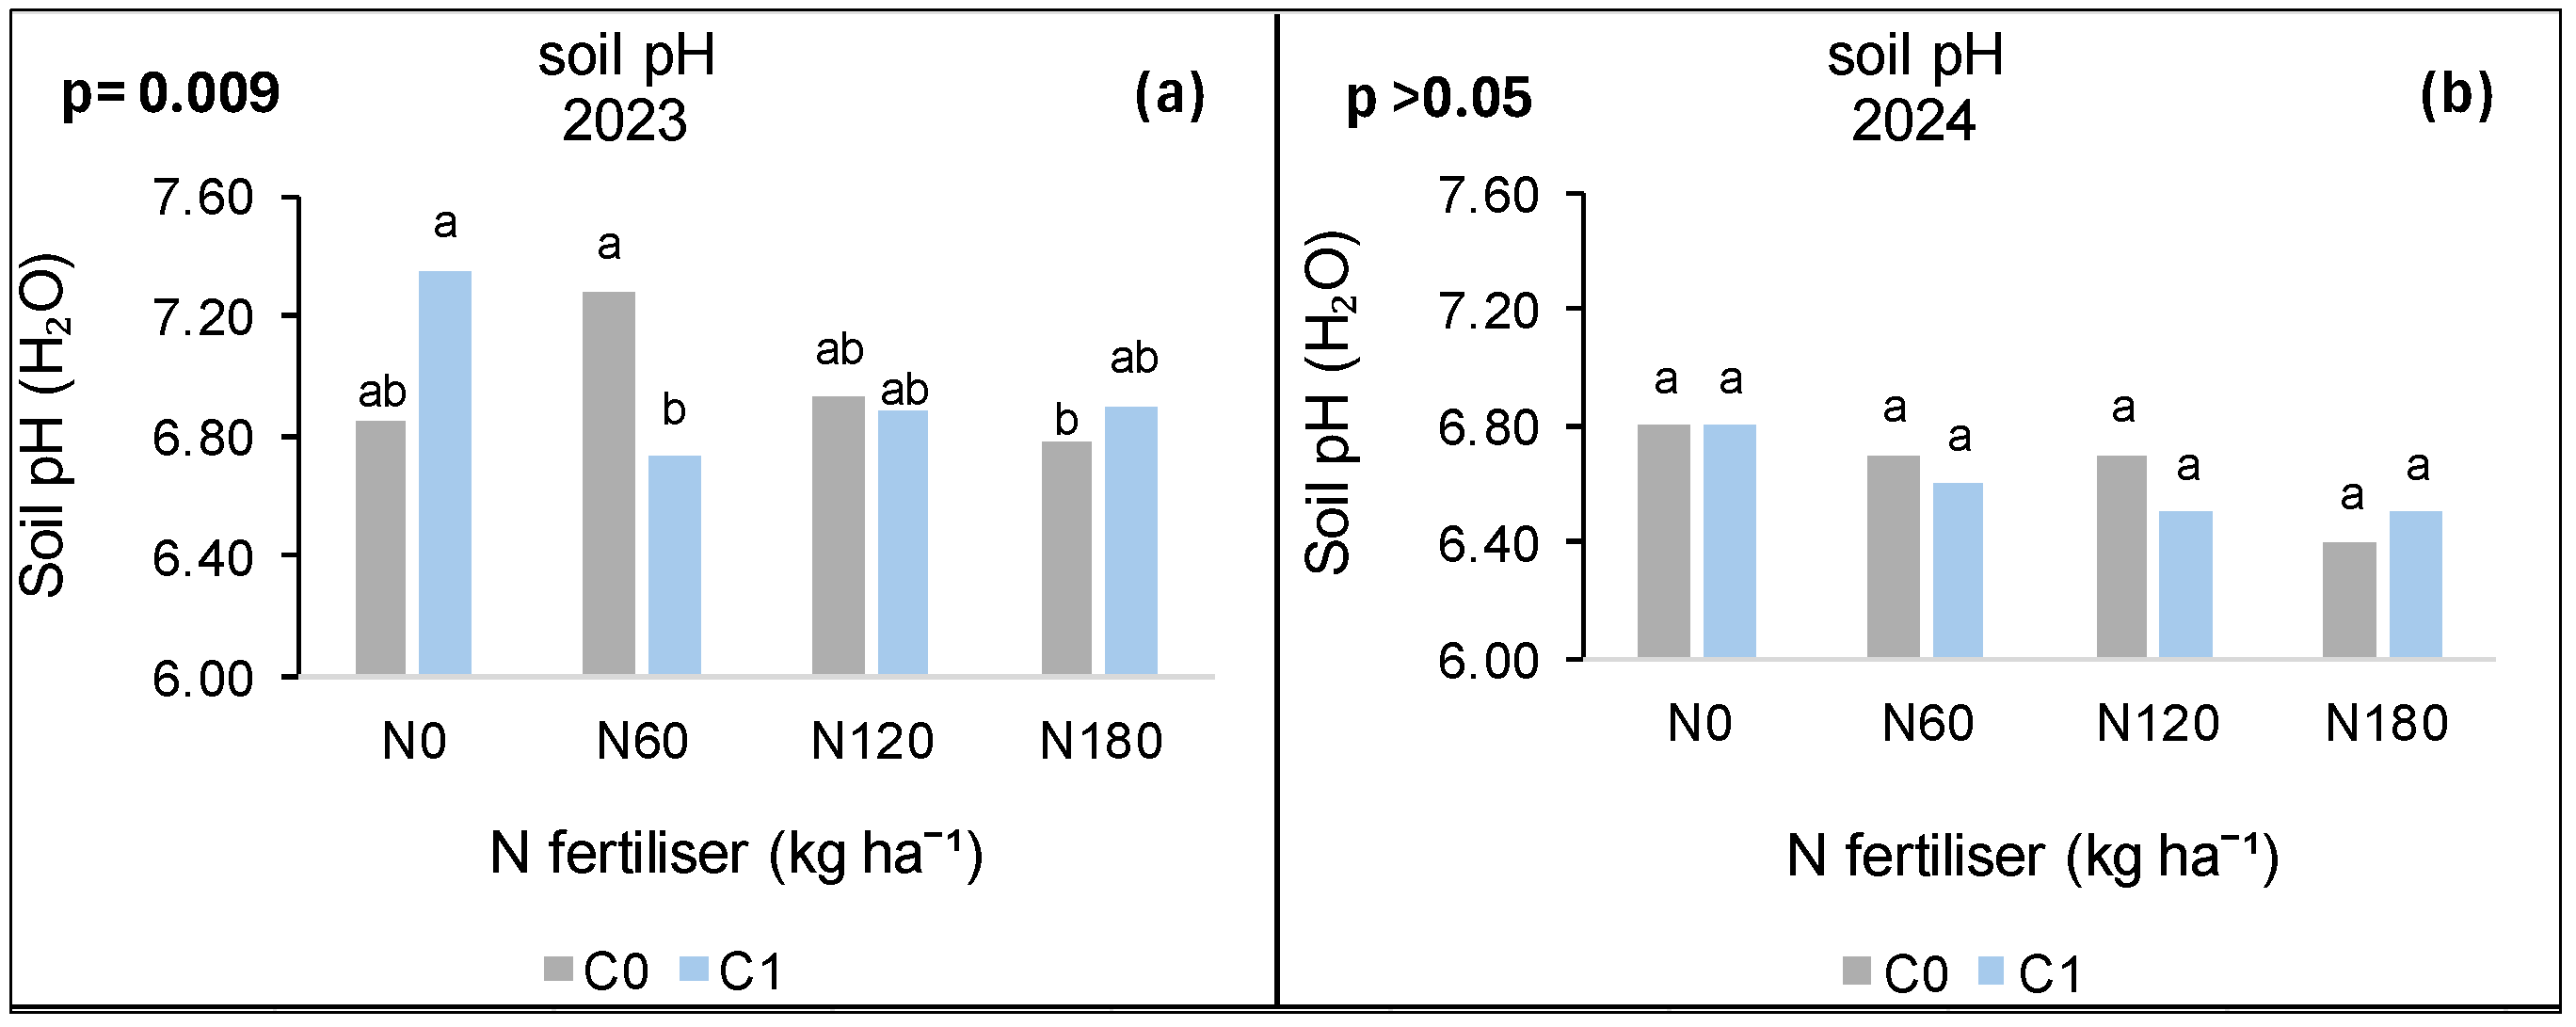
The soil pH at Ofcolaco was not affected by cover crop, combined nano Zn and Cu, and N fertiliser nor their interactions, except for cover crop × N fertiliser in 2023. On the contrary, the soil pH in 2024 was not affected by the main treatment factors nor their interactions (Figure 16b).
In 2023, the soil pH declined by 6.9% under 180 kgN ha−1 compared to 60 kgN ha−1 without cover crop incorporation (Figure 16a). However, both application rates had a similar pH values to those of 0 and 120 kgN ha−1. The incorporation of cover crop reduced the soil pH by 8.4% under 60 kgN ha−1 compared to 0 kgN ha−1, and both rates did not vary between 120 and 180 kgN ha−1 (Figure 16a).

3.9. Correlation Relationships Between the Selected Soil Biological Properties

3.9.1. Syferkuil

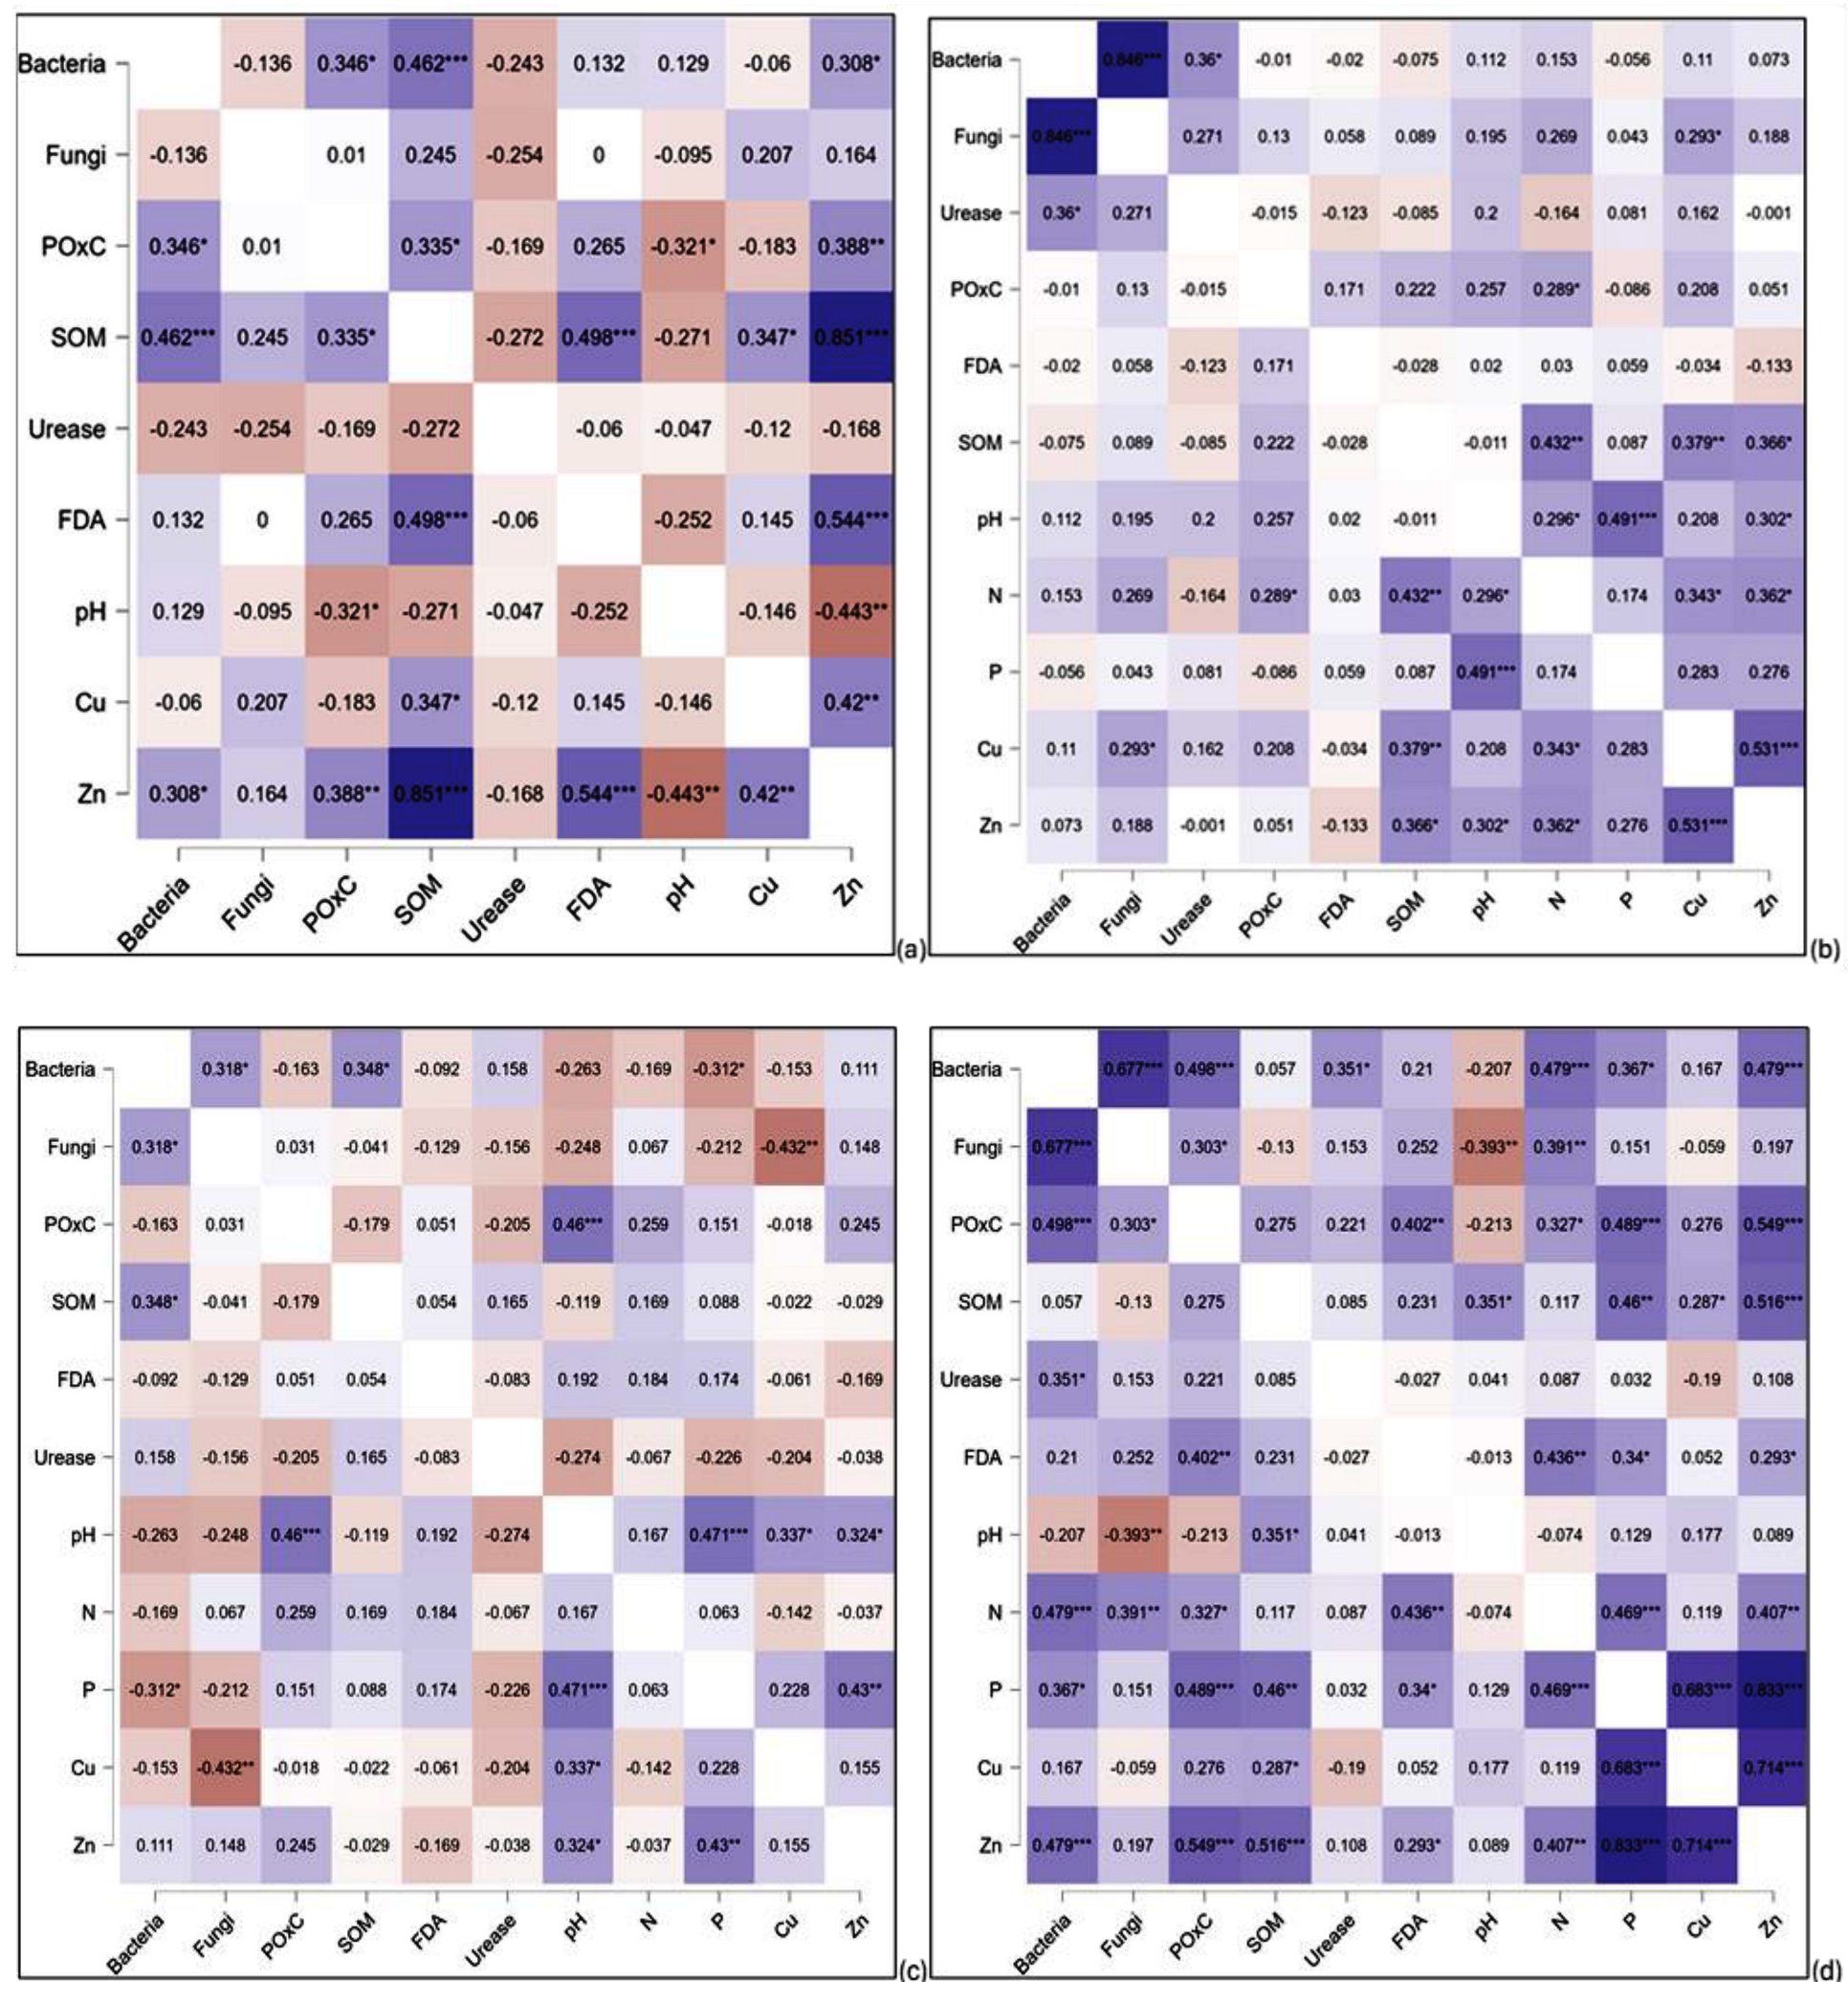
The 2023 season in Figure 17a shows a significant positive correlation among the SOM, bacterial populations, and POxC at Syferkuil. However, a negative correlation was observed between the POxC and soil pH, while the FDA and SOM had a positive correlation. Fungal populations had varied correlations with the selected parameters but were not significant (Figure 17a).
During the 2024 season, there was a significant positive correlation between bacterial and fungal populations as well as urease activity (Figure 17b). The other parameters had either positive or negative correlations among them but were not significant.

3.9.2. Ofcolaco

The heat map for 2023 indicates a significant positive correlation between bacterial and fungal populations, as well as a positive correlation between SOM and bacterial populations (Figure 17c). Soil POxC exhibited a significant positive correlation with pH. The remaining parameters exhibited either positive or negative correlations, but these were not statistically significant.
In 2024, significant positive correlations were also observed for bacterial and fungal populations, as well as POxC (Figure 17d). Soil POxC was further correlated positively to FDA, whereas urease activity had a significant positive correlation to bacterial populations. Positive correlation was also recorded between SOM and pH, while the latter was negatively correlated to fungal populations (Figure 17d).

4. Discussion

4.1. Bacterial Populations

The literature has emphasised that cover crops can improve microbial populations and their activities, among other benefits [47,48]. This study found that the addition of sunn hemp cover crop at Syferkuil for both seasons enhanced microbial populations and their activities, but the high soil pH at the location hindered further improvement. Ofcolaco had a contrasting outcome, with cover crop not affecting microbial populations during the 2023 season and a positive outcome in 2024. This aligns with Ropper [49], who observed inconsistent results regarding soil microbial activities and biological properties, especially under short term cover cropping practices. The non-responsive bacterial populations under cover crop could be due to lower SOM and the competition between soil microorganisms for the C source. The observed differences in bacterial populations and the other measured parameters between the two study sites could also be attributed to variation in climatic conditions when considering the hot and dry conditions at Ofcolaco. Furthermore, nanofertilisers have been found to negatively influence some biological soil properties, such as bacterial populations, possibly due to higher doses or poor interaction between the fertiliser and the plant [50]. The elevated soil pH could explain the results of the present study, which recorded a reduction in bacterial populations following the application of combined nano Zn and Cu. This, however, contradicts the findings by [51,52,53,54], who emphasised that the type of nanofertiliser and the status of soil fertility, among other factors, significantly influence their effects on soil properties. Kumar et al. [55] also reported that the positive influences of the nano fertilisers are attributed to their absorption efficiency, consequently releasing organic acids which enhance microbial populations. Regarding N fertiliser application, Basak et al. [56] also observed improved bacterial populations with N fertiliser input, although at slightly higher rates than 60 kgN ha−1. However, other studies cautioned that excessive or long-term fertilisation threatens microbial activity and populations through reduced SOM [57,58]. The bacterial population at Syferkuil showed an increase in response to the interaction between cover crop and nitrogen fertiliser in 2023, while Ofcolaco had increases in bacterial populations during 2024 due to nitrogen fertiliser application. The marginal increase in both locations could result from a reduction in microbial biomass due to elevated nitrogen concentration, which significantly exceeds the population increase, thereby decreasing the overall microbial population [59]. Seasonal variations in temperature and rainfall tend to affect soil microbial populations, as evidenced by the outcome in both study sites. Moreover, the method and duration of soil sample storage can also alter soil biological properties. A combination of cover crop, combined nano Zn and Cu, and N fertiliser had a positive effect on bacterial populations at Syferkuil in 2023, which could be attributed to the collective effects of all the treatment factors. To date, no research has examined the synergistic impact of cover crops, combined nano Zn and Cu, and N fertiliser rates on soil microbial populations and enzyme activity.

4.2. Fungal Populations

Soil fungal populations are significantly inhibited by elevated soil pH and low soil organic matter, which was somewhat evident in this study. Hence, no response was detected following the incorporation of cover crops in 2023 at Syferkuil and 2023 and 2024 at Ofcolaco. Fungal populations in this study were negatively impacted by combined nano Zn and Cu application, especially at Ofcolaco in 2023, which contrasted with an observation by Nibin et al. [53], where greater microbial populations with foliar application of nano NPK were reported. Though the nanofertiliser combination was different from this current study, this highlights the overall impact of nanofertilisers on soil bacterial and fungal populations. Additionally, Yadav et al. [60] indicated that nanoformulations often have unintended effects on some beneficial soil microorganisms that preserve soil fertility. This agrees with the results of this study, indicating a reduction or no response of fungal populations following the application of combined nano Zn and Cu. When applied judiciously, N fertiliser can positively influence microbial activity, hence the observed increase in fungal populations in this study during the 2023 season, a finding that was also observed by Basak et al. [56]. Further enhancement of the fungal populations was found in both locations when N fertiliser was applied alongside cover crop or combined nano Zn and Cu. In relation to the combination of nano fertiliser with N fertiliser, Meena et al. [52] also observed positive effects on microbial populations and activity. Each of the three treatment factors has been documented to benefit soil fertility and health in one way or another. Although their combined effect on soil properties has not been documented, high fungal populations were recorded under the combination.

4.3. Active Carbon (POxC)

Soil active carbon (POxC) quantifies the biologically active and readily decomposable portion of soil organic matter, serving as a carbon source for soil microbes and closely associated with microbial activity and nutrient cycling [61]. The enhanced POxC observed with cover crop incorporation in this study may be attributed to the immediate contribution of residues, which serve as a carbon source upon the onset of decomposition. Howe et al. [62] highlighted higher POxC under crop residue incorporation than fertilisation. On the other hand, it is not clear why POxC did not vary under all treatments and their interactions at Ofcolaco for the 2023 season, but Rayne and Aula [63] stated that management practices such as weeding and fertiliser application can cause a setback in SOM build-up, consequently affecting POxC derived from crop residues. Additionally, Abdalla et al. [64] suggested that increases in OC are usually observed over longer periods with consistent application of crop residues or organic manure, without which POxC diminishes. The differences in locations and their respective environmental conditions could also be a factor, an observation that was highlighted by Calderon et al. [1], perhaps also supporting the interactive outcome of cover crop, combined nano Zn and Cu, and N fertiliser observed at Syferkuil in 2023. The favourable response of POxC to the combined application of combined nano Zn and Cu observed in this study is corroborated by multiple literature sources. Nibin et al. [52,53,54] reported enhancements in soil properties after the application of nano fertilisers, despite variations in the types utilised in their research relative to this study. With the results of this study showing a decline in POxC at a higher N fertiliser rate, Vilakazi et al. [65] suggested that excess fertilisation tends to impede biological processes occurring through enzyme oxidation, ultimately affecting POxC and other soil parameters. At higher fertilisation rates, POxC tends to increase, indicating stimulated root growth and rhizodeposition by the crop. A suggestion by Howe et al. [62] called for further studies that focus on the interactive and individual effects of cover crop and fertilisation, among others, on POxC, as the information is lacking.

4.4. Microbial Activity (FDA)

Soil microbial activity usually improves upon incorporation of residues, which are a source of C [66,67]. Hence, the higher FDA observed under the cover crop during this study is justified, with the exception of Syferkuil in 2024. Sunn hemp is a high residue legume which, through N fixation, can enrich the rhizosphere with carbohydrates, organic acids and soil organic matter, subsequently stimulating the growth and activity of soil microbiota [68,69]. The crop residues tend to improve microbial activity by creating a suitable environment for the proliferation of soil microbes [8,62]. Additionally, the increased FDA upon N fertilisation could be attributed to enhanced root growth and the subsequent C inputs through root biomass and exudates, which are favourable to microbial growth [59,66]. Furthermore, the increased soil microbial activity could also be attributed to the high POxC, which is a source of structural and energy components and also provides a habitat for soil microorganisms [61]. Howe et al. [62] further highlighted that optimum fertiliser rates are key in establishing the build-up or loss of OC, which could explain the high FDA under 180 kgN ha−1. Monocropping has also been found to significantly affect the metabolic activity of soil microbes because of recalcitrant organic inputs that are returned to the soil as well as lower root exudates due to less root density, among other things [66,70]. The interactive effects of cover crop combined nano Zn and Cu, and N fertiliser were not significant throughout except for Syferkuil in 2023. This outcome could be due to several factors, but the primary reason could be that the organic matter from cover crop incorporation was not sufficient to enhance the FDA activity. This may also be supported by an observation from Gupta and Prakash [50], who observed that nanofertiliser often affects soil biological properties negatively, perhaps also influencing the outcome in this study when applied individually or in combination with cover crop and/or N fertiliser.

4.5. Soil Organic Matter

Although cover crops are known for their benefits on soil health and fertility, their effect varies with location and climatic conditions [71], which explains the varied effects on SOM in this study. The soil organic matter in this study responded differently to cover crop for the two seasons, with Ofcolaco responding positively in 2023 and 2024, while Syferkuil showed an improvement only in 2023 showing. The outcome at Syferkuil is similar to that of Pokhrel [72], who did not observe any improvement in SOM upon cover crop incorporation in a two-year study. According to Nascente et al. [73], the low SOM could be due to limited time for accumulation, since this is a process that takes place over longer periods, whereas the timeframe for this study was relatively short. The variations in climate, vegetation, and agricultural practices unique to each location may also be significant factors. Dinca et al. [57] also highlighted that excessive or long-term fertilisation has recurring negative effects on SOM accumulation due to reduced microbial activity, which could explain the lack of improvement at Ofcolaco and Syferkuil during the 2024 growing season. Additionally, Khardia et al. [51] found that the application of chemical fertilisers tends to reduce SOM content, an observation that was noted in this study at Syferkuil under higher N fertiliser application. The application of nanofertilisers has been shown to enhance plant growth, hence augmenting soil organic matter (SOM) production [74]. However, this was not evident for Ofcolaco in 2023 and 2024 and Syferkuil in 2023, as indicated by the absence of variation and a reduction in SOM content. This finding aligns with that of Pruthviraj et al. [75], who reported no impact on SOM following the application of nanofertilisers. However, an increasing trend in SOM was observed when cover crop, nano Zn and Cu and N fertiliser were combined at 60 and 120 kgN ha−1, although no study has been conducted regarding the effect of the aforementioned treatments on SOM or any other soil properties.

4.6. Urease Activity

This study found no significant difference in urease activity between cover crop incorporation and its absence for both locations and seasons. Enzyme activities are primarily influenced by carbon and organic matter sources, and factors such as N fertiliser, pH and soil properties [76,77]. The non-significant variation observed may be attributed to various properties that influence urease activity, which are not solely dependent on the incorporation of organic matter [77]. Ofcolaco exhibited no observable response to cover crop and combined nano Zn and Cu application, while Syferkuil showed elevated urease activity with combined nano Zn and Cu, aligning with the findings of Nibin et al. [53]. The positive response could also be attributed to the fact that nanofertilisers tend to enhance the production of humic acids, root exudates, and nitrogen availability, subsequently bolstering soil microbial growth and activity [78]. This further explains the increased urease activity under nano Zn and Cu, suggesting the availability of substrates and energy to promote the production of urease enzymes. The two study locations had increased urease activity when cover crop was incorporated alongside N fertiliser, showing greater potential than when applied individually, although this differed per season. This supports the findings of Dotaniya et al. [79], who highlighted that cover crops enhance urease activity in the soil. Having resulted in the highest urease activity at Syferkuil in 2023, the combination of sunn hemp cover crop, combined nano Zn and Cu, and N fertiliser appears to have been beneficial to urease enzyme activity, further indicating the crucial potential impact of the treatment combination. The individual treatments had varied effects on urease enzyme activity, however, their interaction revealed positive benefits. This was indicative of synergies where decomposing cover crop enriches soil life through enhanced nutrient cycling along with root exudates, which are also observed in nanofertilisers [6,80]. Nitrogen fertilisation further complements the use of cover crop and nanofertilisers through enhanced crop growth and biomass production [81], subsequently promoting healthier soil. Meena et al. [52] also found that the interaction of conventional and nanofertilisers improved microbial populations, consequently influencing soil enzymatic activities. To some extent, this validates the significant interactive outcome of combined nano Zn and Cu and N fertiliser regarding the urease activity in this study. Soil physicochemical properties, including pH, aggregate stability, and organic carbon, could explain the varied results observed in enzyme activity and microbial populations. The positive correlation between bacterial and fungal populations indicates their synergistic association relating to soil processes [82]. Meena and Rao [76] further indicated that the positive correlation between bacterial and fungal populations and FDA is due to their function in the soil being critically dependent on soil organic matter and nutrients.

4.7. Soil pH

Studies by Guo et al., [83]; Liang et al., [84] have shown that inorganic fertilisers can lower soil pH through the release of H+ ions. Concurrently, Liang et al. [84] noted that manure or cover crop residues may either decrease or increase soil pH, depending on the presence of organic acids, carbonates, and bicarbonates. The inconsistent pH results, irrespective of cover crop, combined nano Zn and Cu, N fertiliser, and their interactions, align with these findings. The highest soil pH was observed under cover crop without N application, while soil at Syferkuil remained generally alkaline, but a reduction was observed with increments in fertiliser rates. In contrast, soil pH at Ofcolaco remained unchanged, except for cover crop × N fertiliser in 2023. Basically, soil amendments such as cover crops and inorganic fertilisers have an impact on soil properties, but the impacts can either be positive, negative, or neutral, as is the case in this study with soil pH and several other soil parameters. The soil pH outcome at Ofcolaco for 2024 was corroborated by Liebig et al. [85] and Kutamahufa et al. [86], who reported no change in soil pH, especially in the short-term, due to low organic matter accumulation. Kumar, et al. [55] also found that applying nanofertilisers did not affect soil pH, which was partly the case for both seasons except Syferkuil in 2023. However, it is worth noting that soil pH is determined primarily by the parent material and does not usually exhibit change under short periods [87].

5. Conclusions and Recommendations

The study has proven the potential of sunnhemp cover crop, combined nano Zn and Cu and nitrogen fertiliser to improve bacterial populations, urease activity, FDA, POxC, soil organic matter, and soil pH. Furthermore, the study also revealed that lower doses of N fertiliser combined with sunn hemp cover crop and nano Zn and Cu are suitable for improving soil biological parameters and thus promoting soil health and sustainable farming practices. The results reflected positive outcomes of soil biological properties obtained in the shorter time frame further highlighting the potential for greater soil health improvements and reduced N fertiliser inputs upon continuous cover cropping. Therefore, future research should consider monitoring the spatio-temporal changes of the soil biological properties over longer periods with regard to cover crop incorporation and varied doses of nano Zn and Cu. Additionally, extensive evaluation of the residual effects of the treatment combinations on crop productivity and soil health across diverse agroecological regions is suggested.

Author Contributions

Conceptualization, M.M.M. and K.K.A.; Data curation, M.M.M.; Formal analysis, M.M.M.; Funding acquisition, K.K.A.; Investigation, M.M.M.; Methodology, M.M.M.; Project administration, K.K.A.; Resources, K.K.A.; Software, M.M.M.; Supervision, K.K.A., P.M.K. and M.A.K.; Visualization, M.M.M.; Writing—original draft, M.M.M.; Writing—review and editing, K.K.A., P.M.K. and M.A.K. All authors have read and agreed to the published version of the manuscript.

Funding

This research received external funding from the Department of Science, Technology, and Innovation (DSTI) and through the National Research Foundation (NRF). Grant number MND210719623882.

Institutional Review Board Statement

Not applicable.

Informed Consent Statement

Not applicable.

Data Availability Statement

The data will be available upon request.

Acknowledgments

The authors would like to acknowledge the Centre for Global Change, University of Limpopo, for assisting in this research.

Conflicts of Interest

The authors declare no conflicts of interest.

References

  1. Calderon, F.J.; Nielsen, D.; Acosta-Martinez, V.; Vigil, M.F.; Drew, L. Cover crop and irrigation effects on soil microbial communities and enzymes in semiarid agroecosystems of the central Great Plains of North America. Pedosphere 2016, 26, 192–205. [Google Scholar] [CrossRef]
  2. Haney, R.L.; Haney, E.B.; Smith, D.R.; Harmel, R.D.; White, M.J. The soil health tool-Theory and initial broad-scale application. Appl. Soil. Ecol. 2018, 125, 162–168. [Google Scholar] [CrossRef]
  3. Chen, Y.X.; Chen, X.H.; Tang, Y.Q.; Zhang, F.S.; Chen, X.P.; Zhang, C.C.; Liu, J.; Xu, K.W. Effect of nitrogen fertiliser on dry matter accumulation and yield in wheat/maize/soybean intercropping systems. Acta Pratacult. Sin. 2014, 23, 73. [Google Scholar]
  4. Delgado-Baquerizo, M.; Maestre, F.T.; Gallardo, A.; Bowker, M.A.; Wallenstein, M.D.; Quero, J.L.; Ochoa, V.; Gozalo, B.; García-Gómez, M.; Soliveres, S.; et al. Decoupling of soil nutrient cycles as a function of aridity in global drylands. Nature 2013, 502, 672–676. [Google Scholar] [CrossRef]
  5. Shukla, A.K.; Behera, S.K.; Prakash, C.; Patra, A.K.; Rao, C.S.; Chaudhari, S.K.; Das, S.; Singh, A.K.; Green, A. Assessing multi-micronutrients deficiency in agricultural soils of India. Sustainability 2021, 13, 9136. [Google Scholar] [CrossRef]
  6. Upadhyay, S.K.; Srivastava, A.K.; Rajput, V.D.; Chauhan, P.K.; Bhojiya, A.A.; Jain, D.; Chaubey, G.; Dwivedi, P.; Sharma, B.; Minkina, T. Root Exudates: Mechanistic Insight of Plant Growth Promoting Rhizobacteria for Sustainable Crop Production. Front. Microbiol. 2022, 13, 916488. [Google Scholar] [CrossRef] [PubMed]
  7. Zhang, T.; Chen, H.Y.H.; Ruan, H. Global negative effects of nitrogen deposition on soil microbes. ISME J. 2018, 12, 1817–1825. [Google Scholar] [CrossRef]
  8. Galindo, F.S.; Strock, J.S.; Pagliari, P.H. Impacts of corn stover management and fertiliser application on soil nutrient availability and enzymatic activity. Sci. Rep. 2022, 12, 1985. [Google Scholar] [CrossRef]
  9. Bebber, D.P.; Richards, V.R. A meta-analysis of the effect of organic and mineral fertilisers on soil microbial diversity. Appl. Soil Ecol. 2022, 175, 104450. [Google Scholar] [CrossRef]
  10. Lori, M.; Symnaczik, S.; Mäder, P.; De Deyn, G.; Gattinger, A. Organic farming enhances soil microbial abundance and activity-A meta-analysis and meta-regression. PLoS ONE 2017, 12, e0180442. [Google Scholar] [CrossRef]
  11. Nagula, S.; Ramanjaneyulu, A.V. Nano fertilisers: The next generation fertiliser. Biot. Res. Today 2020, 2, 905–907. [Google Scholar]
  12. Babu, S.; Singh, R.; Yadav, D.; Rathore, S.S.; Raj, R.; Avasthe, R.; Yadav, S.K.; Das, A.; Yadav, V.; Yadav, B.; et al. Nano fertilisers for agricultural and environmental sustainability. Chemosphere 2022, 292, 133451. [Google Scholar] [CrossRef]
  13. Wang, J.; Liu, L.; Gao, X.; Hao, J.; Wang, M. Elucidating the effect of biofertilisers on bacterial diversity in maize rhizosphere soil. PLoS ONE 2021, 16, e0249834. [Google Scholar] [CrossRef]
  14. Koudahe, K.; Samuel, C.; Djaman, A.K. Critical review of the impact of cover crops on soil properties. Int. Soil Water Conserv. Res. 2022, 10, 343–354. [Google Scholar] [CrossRef]
  15. Xie, Y.; Black, Z.E.; Xu, N.; Brecht, J.K.; Huff, D.M.; Zhao, X. Influence of Sunn Hemp Biomass Incorporation on Organic Strawberry Production. Horticulturae 2023, 9, 1247. [Google Scholar] [CrossRef]
  16. Blanco-Canqui, H.; Holman, J.D.; Schlegel, A.J.; Tatarko, J.; Shaver, T.M. Replacing fallow with cover crops in a semiarid soil: Effects on soil properties. Soil Sci. Soc. Am. J. 2013, 77, 1026–1034. [Google Scholar] [CrossRef]
  17. Blanco-Canqui, H.; Shapiro, C.A.; Wortmann, C.S.; Drijber, R.A.; Mamo, M.; Shaver, T.M.; Ferguson, R.B. Soil organic carbon: The value to soil properties. J. Soil Water Conserv. 2013, 68, 129A–134A. [Google Scholar] [CrossRef]
  18. DeLaune, P.D.; Mubvumba, P.; Lewis, K.L.; Keeling, J.W. Rye cover crop impacts soil properties in a long-term cotton system. Soil Sci. Soc. Am. J. 2019, 83, 1451–1458. [Google Scholar] [CrossRef]
  19. Saleem, M.; Pervaiz, Z.H.; Contreras, J.; Lindenberger, J.H.; Hupp, B.M.; Chen, D.; Zhang, Q.; Wang, C.; Iqbal, J.; Twigg, P. Cover crop diversity improves multiple soil properties via altering root architectural traits. Rhizosphere 2020, 16, 100248. [Google Scholar] [CrossRef]
  20. Hu, J.; Xianyu, Y. When nano meets plants: A review on the interplay between nanoparticles and plants. Nano Today 2021, 38, 101143. [Google Scholar] [CrossRef]
  21. Singh, P.; Singh, A.P. Nano materials in Soil Health Management and Crop Production: Potentials and Limitations. In Handbook of Nano Materials and Nanocomposites for Energy and Environmental Applications; Springer: Cham, Switzerland, 2021; pp. 1–25. [Google Scholar]
  22. Kah, M.; Kookana, R.S.; Gogos, A.; Bucheli, T.D. A critical evaluation of nanopesticides and nano fertilisers against their conventional analogues. Nat. Nanotechnol. 2018, 13, 677–684. [Google Scholar] [CrossRef]
  23. Elizabath, A.; Babychan, M.; Mathew, A.M.; Syriac, G.M. Application of Nanotechnology in Agriculture. Int. J. Pure App. Biosci. 2019, 7, 131–139. [Google Scholar] [CrossRef]
  24. Irewale, A.T.; Dimpka, C.O.; Agunbiade, F.O.; Oyeboade, O.A.; Elemike, E.E.; Oguzie, E.E. Unlocking sustainable agricultural development in Africa via bio-nanofertiliser application-challenges, opportunities and prospects. Sci. Afr. 2024, 25, e02276. [Google Scholar] [CrossRef]
  25. Mahapatra, D.M.; Satapathy, K.H.; Panda, B. Biofertilisers and nanofertilisers for sustainable agriculture: Phycoprospects and challenges. Sci. Total Environ. 2022, 803, 149990. [Google Scholar] [CrossRef] [PubMed]
  26. Hirzel, J.; Undurraga, P.; León, L.; Panichini, M.; Carrasco, J.; González, J.; Matus, I. Canola production and effect on soil chemical properties in response to different residue levels from three biannual crop rotations. Plant Prod. Sci. 2021, 24, 287–296. [Google Scholar] [CrossRef]
  27. Elsawy, H.; El-shahawy, A.; Ibrahim, M.; El-Halim, A.E.-H.A.; Talha, N.; Sedky, A.; Alfwuaires, M.; Alabbad, H.; Almeri, N.; Mahmoud, E. Properties of Recycled Nanomaterials and Their Effect on Biological Activity and Yield of Canola in Degraded Soils. Agriculture 2022, 12, 2096. [Google Scholar] [CrossRef]
  28. Kah, M.; Tufenkji, N.; White, J.C. Nano-enabled strategies to enhance crop nutrition and protection. Nat. Nanotechnol. 2019, 14, 532–540. [Google Scholar] [CrossRef] [PubMed]
  29. Duhan, J.S.; Kumar, R.; Kumar, N.; Kaur, P.; Nehra, K.; Duhan, K. Nanotechnology: The new perspective in precision agriculture. Biotechnol. Rep. 2017, 15, 11–23. [Google Scholar] [CrossRef] [PubMed]
  30. Soil Classification Working Group. Soil Classification. A Taxonomic System for South Africa; The Department of Agricultural Development: Pretoria, South Africa, 1991. [Google Scholar]
  31. Masete, F.M.; Munjonji, L.; Ayisi, K.K.; Bopape-Mabapa, M.P. Cowpea Growth and Nitrogen Fixation Performance under Different Mulch Treatments. Agriculture 2022, 12, 1144. [Google Scholar] [CrossRef]
  32. Bremner, J.M. Nitrogen-total. In Methods of Soil Analysis, Part 3, 5th ed.; Soil Science Society of America Book Series; SSSA: Madison, WI, USA, 1996; pp. 1085–1121. [Google Scholar]
  33. Blanck, E. Handbook of Soil Science; Springer: Berlin, Germany, 1931. [Google Scholar]
  34. Okalebo, J.; Gathua, K.; Woomer, P. Laboratory Methods of Soil and Plant Analysis: A Working Manual; TSBF-CIAT and SACRED Africa: Nairobi, Kenya, 2002. [Google Scholar]
  35. Garcia, D.J.; Cegarra, M.P.; Bernal, M.P.; Navarro, A.F. Comparative evaluation of methods employing alkali and sodium pyrophosphate to extract humic substances from peat. Commun. Soil Sci. Plant Anal. 1993, 24, 1481–1494. [Google Scholar] [CrossRef]
  36. Thomas, G.W. Soil pH and soil acidity. In Methods of Soil Analysis, Part 3, 5th ed.; Sparks, D.L., Page, A.L., Helmke, P.A., Loeppert, R.H., Thomas, G.W., Eds.; SSSA: Madison, WI, USA, 1996; pp. 475–490. [Google Scholar]
  37. Walkley, A.; Black, I.A. An examination of the Degtjaref method for determining soil organic matter and a proposed modification of the chromic acid titration method. Soil Sci. 1934, 37, 29–38. [Google Scholar] [CrossRef]
  38. Cooper, H.V.; Girkin, N.T.; Rosolem, C.; Sjögersten, S.; Lark, R.M. Longterm zero-tillage enhances the protection of soil carbon in tropical agriculture. Eur. J. Soil Sci. 2021, 72, 2477–2492. [Google Scholar] [CrossRef]
  39. Sanders, E.R. Aseptic laboratory techniques: Plating methods. J. Vis. Exp. 2012, 63, e3064. [Google Scholar] [CrossRef] [PubMed]
  40. Weil, R.R.; Islam, K.R.; Stine, M.A.; Gruver, J.B.; Samson-Liebig, S.E. Estimating active carbon for soil quality assessment: A simplified method for laboratory and field use. Am. J. Altern. Agric. 2003, 18, 3–17. [Google Scholar] [CrossRef]
  41. Prosser, J.A.; Speir, T.W.; Stott, D.E. Soil oxido-reductases and FDA hydrolysis. In Methods of Soil Enzymology; Dick, R.P., Ed.; SSSA Book Series 9; SSSA: Madison, WI, USA, 2011. [Google Scholar]
  42. Tabatabai, M.A.; Bremner, J.M. Assay of urease activity in soils. Soil Biol. Biochem. 1972, 4, 479–487. [Google Scholar] [CrossRef]
  43. Fertiliser Society of South Africa (FSSA-MVSA). Fertiliser Handbook, 6th ed.; The Fertiliser Society of South Africa: Pretoria, South Africa, 2007. [Google Scholar]
  44. Landon, J.R. Booker Tropical Soil Manual: A Handbook for Soil Survey and Agricultural Land Evaluation in the Tropics and Subtropics; Longman Scientific and Technical, Booker Tate Limited: London, UK, 1991. [Google Scholar]
  45. Havlin, J.L.; Tisdale, S.L.; Nelson, W.L.; Beaton, J.D. Soil Fertility and Fertilisers, 8th ed.; Prentice Hall: Upper Saddle River, NJ, USA, 2013; 528p. [Google Scholar]
  46. Horneck, D.A.; Sullivan, D.M.; Owen, J.S.; Hart, J.M. Soil Test Interpretation Guide, Oregon State University Extension Service. 2011. Available online: https://extension.oregonstate.edu/catalog/ec-1478-soil-test-interpretation-guide (accessed on 14 June 2023).
  47. Blanco-Canqui, H.; Shaver, T.M.; Lindquist, J.L.; Shapiro, C.A.; Elmore, R.W.; Francis, C.A.; Hergert, G.W. Cover crops and ecosystem services: Insights from studies in temperate soils. Agron. J. 2015, 107, 2449–2474. [Google Scholar] [CrossRef]
  48. Carver, R.E.; Nelson, N.O.; Abel, D.S.; Roozeboom, K.; Kluitenberg, G.J.; Tomlinson, P.J.; Williams, J.R. Impact of cover crops and phosphorus fertiliser management on nutrient cycling in no-tillage corn-soybean rotation. Kans. Agric. Exp. Stn. Res. Rep. 2017, 3, 5. [Google Scholar] [CrossRef]
  49. Ropper, W.R. Evaluating Soil Health in North Carolina. Ph.D. Thesis, North Carolina State University, Raleigh, NC, USA, 2018. [Google Scholar]
  50. Gupta, C.; Prakash, D. Effect of Nano-Fertilizers on Soil Microflora. Ann. Plant Sci. 2020, 9, 3846–3859. [Google Scholar]
  51. Khardia, N.; Meena, R.H.; Jat, G.; Sharma, S.; Kumawat, H.; Dhayal, S.; Meena, K.A.; Sharma, K. Soil Properties Influenced by the Foliar Application of Nano Fertilisers in Maize (Zea mays L.) Crop. Int. J. Plant Soil Sci. 2022, 34, 99–111. [Google Scholar] [CrossRef]
  52. Meena, R.H.; Jat, G.; Jain, D. Impact of foliar application of different nano-fertilisers on soil microbial properties and yield of Wheat. J. Environ. Biol. 2021, 42, 302–308. [Google Scholar] [CrossRef]
  53. Nibin, P.M.; Ushakumari, K.; Ishrath, P.K. Organic nano NPK formulations on soil microbial and enzymatic activities on post-harvest soil of Bhindi. Int. J. Curr. Microbiol. Appl. Sci. 2019, 8, 1814–1819. [Google Scholar] [CrossRef]
  54. Rajput, V.D.; Minkina, T.; Sushkova, S.; Tsitsuashvili, V.; Mandzhieva, S.; Gorovtsov, A.; Nevidomskyaya, D.; Gromakova, N. Effect of nanoparticles on crops and soil microbial communities. J. Soils Sediments 2018, 18, 2179–2187. [Google Scholar] [CrossRef]
  55. Kumar, Y. Nano fertilisers for sustainable crop production, higher nutrient use efficiency and enhanced profitability. Indian J. Fertil. 2021, 17, 1206–1214. [Google Scholar]
  56. Basak, N.; Biswas, S.; Tamang, A.; Basak, P. Impact of organic and mineral inputs onto soil biological and metabolic activities under long term rice-wheat cropping system in subtropical Indian inceptisols. J. Environ. Biol. 2016, 37, 83–89. [Google Scholar]
  57. Dinca, L.; Grenni, P.; Onet, C.; Onet, A. Fertilisation and soil microbial community: A review. Appl. Sci. 2022, 12, 1198. [Google Scholar] [CrossRef]
  58. Luo, P.; Han, X.; Wang, Y.; Han, M.; Shi, H.; Liu, N.; Bai, H. Influence of long-term fertilisation on soil microbial biomass, dehydrogenase activity, and bacterial and fungal community structure in a brown soil of northeast China. Ann. Microbiol. 2015, 65, 533–542. [Google Scholar] [CrossRef] [PubMed]
  59. Jian, S.; Li, J.; Chen, J.; Wang, G.; Mayes, M.A.; Dzantor, K.E.; Hui, D.; Luo, Y. Soil extracellular enzyme activities, soil carbon and nitrogen storage under nitrogen fertilisation: A meta-analysis. Soil Biol. Biochem. 2016, 101, 32–43. [Google Scholar] [CrossRef]
  60. Yadav, A.; Yadav, K.; Abd-Elsalam, K.A. Nanofertilisers: Types, Delivery and Advantages in Agricultural Sustainability. Agrochemicals 2023, 2, 296–336. [Google Scholar] [CrossRef]
  61. Woodings, F.S.; Margenot, A.J. Revisiting the permanganate oxidizable carbon (POXC) assay assumptions: POXC is lignin sensitive. Agric. Environ. Lett. 2023, 8, e20108. [Google Scholar] [CrossRef]
  62. Howe, J.A.; McDonald, M.D.; Burke, J.; Robertson, I.; Coker, H.; Gentry, T.J.; Lewis, K.L. Influence of fertiliser and manure inputs on soil health: A review. Soil Secur. 2024, 16, 100155. [Google Scholar] [CrossRef]
  63. Rayne, N.; Aula, L. Livestock Manure and the Impacts on Soil Health: A Review. Soil Syst. 2020, 4, 64. [Google Scholar] [CrossRef]
  64. Abdalla, Z.F.; El-Sawy, S.; El-Bassiony, A.E.M.; Jun, H.; Shedeed, S.; Okasha, A.M.; Bayoumi, Y.; El-Ramady, H.; Prokisch, J. Smart Fertilisers vs. Nano-fertilisers: A Pictorial Overview. Environ. Biodivers. Soil Secur. 2022, 6, 191–204. [Google Scholar] [CrossRef]
  65. Vilakazi, B.S.; Zengeni, R.; Mafongoya, P. The effects of different tillage techniques and N fertiliser rates on nitrogen and phosphorus in dry land agriculture. Agronomy 2022, 12, 2389. [Google Scholar] [CrossRef]
  66. Lange, M.; Eisenhauer, N.; Sierra, C.A.; Bessler, H.; Engels, C.; Griffiths, R.I.; Mellado-Vázquez, P.G.; Malik, A.A.; Roy, J.; Scheu, S.; et al. Plant diversity increases soil microbial activity and soil carbon storage. Nat. Commun. 2015, 6, 6707. [Google Scholar] [CrossRef]
  67. Liu, S.; Zhang, Y.; Zong, Y.; Hu, Z.; Wu, S.; Zhou, J.I.; Jin, Y.; Zou, J. Response of soil carbon dioxide fluxes, soil organic carbon and microbial biomass carbon to biochar amendment: A meta-analysis. Glob. Change Biol. Bioenergy 2016, 8, 392–406. [Google Scholar] [CrossRef]
  68. Li, J.; Zhao, X.; Maltais-Landry, G.; Paudel, B.R. Dynamics of Soil Nitrogen Availability Following Sunn Hemp Residue Incorporation in Organic Strawberry Production Systems. Hortscience 2021, 56, 138–146. [Google Scholar] [CrossRef]
  69. Khemtong, J.; Phakamas, N.; Somchit, P. Effects of urea and sunn hemp on nitrogen use efficiency and physiological traits related to Japonica rice yield. Int. J. Agric. Technol. 2023, 19, 997–1010. [Google Scholar]
  70. Mbuthia, L.W.; Acosta-Martínez, V.; DeBruyn, J.; Schaeffer, S.; Tyler, D.; Odoi, E.; Mpheshea, M.; Walker, F.; Eash, N. Long term tillage, cover crop, and fertilisation effects on microbial community structure, activity: Implications for soil quality. Soil Biol. Biochem. 2015, 89, 24–34. [Google Scholar] [CrossRef]
  71. Rahman, M.H.; Haque, K.S.; Khan, M.Z.H. A review on application of controlled released fertilisers influencing the sustainable agricultural production: A Cleaner production process. Environ. Technol. Innov. 2021, 23, 101697. [Google Scholar] [CrossRef]
  72. Pokhrel, S. Effects of Cover Crop Management on Biologically Related Soil Properties in a Mississippi Dryland Soybean System. Ph.D. Thesis, Mississippi State University, Mississippi State, MS, USA, 2013. [Google Scholar]
  73. Nascente, A.S.; Li, Y.C.; Crusciol, C.A.C. Cover crops and no-till effects on physical fractions of soil organic matter. Soil Tillage Res. 2013, 130, 52–57. [Google Scholar] [CrossRef]
  74. Sharma, B.; Tiwari, S.; Kumawat, K.C.; Cardinale, M. Nano-biofertilisers as bio-emerging strategies for sustainable agriculture development: Potentiality and their limitations. Sci. Total Environ. 2023, 860, 160476. [Google Scholar] [CrossRef]
  75. Pruthviraj, N.; Geetha, K.; Prakash, S.; Jayadeva, H.; Pushpa, K.; Shankar, A. Impact of different methods of nano fertilisers application on soil chemical properties and fertility status in sunflower growing soils. Mysore J. Agric. Sci. 2022, 56, 275–284. [Google Scholar]
  76. Meena, A.; Rao, K.S. Assessment of soil microbial and enzyme activity in the rhizosphere zone under different land use/cover of a semiarid region, India. Ecol. Process. 2021, 10, 16. [Google Scholar] [CrossRef]
  77. Moghimian, N.; Hosseini, S.M.; Kooch, Y.; Darki, B.Z. Impacts of changes in land use/cover on soil microbial and enzyme activity. Catena 2017, 157, 407–414. [Google Scholar] [CrossRef]
  78. Van der Voort, A.R.; Arai, Y. The role of nanotechnology in the fortification of plant nutrients and improvement of crop production. Appl. Sci. 2019, 9, 499. [Google Scholar] [CrossRef]
  79. Dotaniya, M.L.; Aparna, K.; Dotaniya, C.K.; Singh, M.; Regar, K.L. Role of soil enzymes in sustainable crop production. In Enzymes in Food Biotechnology; Kuddus, M., Ed.; Elsevier: Amsterdam, The Netherlands, 2019; pp. 569–589. [Google Scholar]
  80. Adetunji, A.T.; Ncube, B.; Mulidzi, R.; Lewu, F.B. Management impact and benefit of cover crops on soil quality: A review. Soil Tillage Res. 2020, 204, 104717. [Google Scholar] [CrossRef]
  81. Tang, L. Soil Fertility, Plant Nutrition and Nutrient Management. Plants 2025, 14, 34. [Google Scholar] [CrossRef] [PubMed]
  82. Uzoma, A.O. Bacteria and Fungi Population of Surface Soils under Various Land Use Types in Minna, Southern Guinea Savanna. Agric. Ext. J. 2019. Available online: https://ssrn.com/abstract=3669543 (accessed on 13 May 2025).
  83. Guo, M.; Song, W.; Kazda, R. Fertiliser value of lime-stabilized biosolids as a soil amendment. Agron. J. 2012, 104, 1679–1686. [Google Scholar] [CrossRef]
  84. Liang, Q.; Chen, H.; Gong, Y.; Fan, M.; Yang, H.; Lal, R.; Kuzyakov, Y. Effects of 15 years of manure and inorganic fertilisers on soil organic carbon fractions in a wheat- maize system in the North China Plain. Nutr. Cycl. Agroecosystems 2012, 92, 3. [Google Scholar] [CrossRef]
  85. Liebig, M.A.; Hendrickson, J.R.; Archer, D.W.; Schmer, M.A.; Nichols, K.A.; Tanaka, D.L. Short-term soil responses to late-seeded cover crops in a semi-arid environment. Agron. J. 2015, 107, 2011–2019. [Google Scholar] [CrossRef]
  86. Kutamahufa, M.; Matare, L.; Soropa, G.; Mashavakure, N.; Svotwa, E.; Mashingaidze, A.B. Forage legumes exhibit a differential potential to compete against maize and weeds and to restore soil fertility in a maize-forage legume intercrop. Acta Agric. Scand. Sect. B Soil Plant Sci. 2022, 72, 127–141. [Google Scholar] [CrossRef]
  87. Bhayal, D.; Khaddar, V.K.; Bhayal, L.; Yadav, T.C.; Bangar, K.S.; Singh, B. Effects of Sunnhemp green manuring and intercropping on soil properties. Int. J. Curr. Microbiol. Appl. Sci. 2018, 7, 371–384. [Google Scholar] [CrossRef]
Figure 1. Study sites description map [31].
Sustainability 17 09407 g001
Figure 2. Monthly average rainfall, maximum, and minimum temperatures at Syferkuil (a) and Ofcolaco (b) during 2023 and 2024.
Sustainability 17 09407 g002aSustainability 17 09407 g002b
Figure 3. Field layout of the experimental site, where ZnCu indicates plots with combined nano Zn and Cu application.
Sustainability 17 09407 g003
Figure 4. Effects of cover crop, combined nano Zn and Cu, and N fertiliser on bacterial populations at Syferkuil for 2023 (a) and 2024 (b); p < 0.05. S0: no combined nano Zn and Cu; S1: with combined nano Zn and Cu.
Sustainability 17 09407 g004
Figure 5. Effects of cover crop × N fertiliser on bacterial populations at Ofcolaco for 2023 (a) and 2024 (b); p < 0.05. C0: without cover crop; C1: with cover crop.
Sustainability 17 09407 g005
Figure 6. Effects of cover crop (a), combined nano Zn and Cu × N fertiliser on fungal populations at Syferkuil for 2023 (b) and 2024 (c); p < 0.05; Means separated by different letters are significantly different. C0: without cover crop; C1: with cover crop; S0: no combined nano Zn and Cu; S1: with combined nano Zn and Cu.
Sustainability 17 09407 g006
Figure 7. Effects of cover crop × combined nano Zn and Cu × N fertiliser on fungal populations at Ofcolaco for 2023 (a) and 2024 (b); p < 0.05. S0: no combined nano Zn and Cu; S1: with combined nano Zn and Cu.
Sustainability 17 09407 g007
Figure 8. Effects of cover crop × combined nano Zn and Cu × N fertiliser on POxC at Syferkuil for 2023 (a) and 2024 (b); p < 0.05. S0: no combined nano Zn and Cu; S1: with combined nano Zn and Cu.
Sustainability 17 09407 g008
Figure 9. Interactive effects of combined nano Zn and Cu × N fertiliser (a) and cover crop × combined nano Zn and Cu × N fertiliser (b) on SOM at Syferkuil for the 2024 and 2023, respectively; p < 0.05. S0: no combined nano Zn and Cu, S1: with combined nano Zn and Cu.
Sustainability 17 09407 g009
Figure 10. Effects of cover crop (a) and interaction of cover crop × combined nano Zn and Cu × N fertiliser (b,c) on SOM at Ofcolaco for the 2023 and 2024 season; p < 0.05; Means separated by different letters are significantly different. C0: without cover crop; C1: with cover crop; S0: no combined nano Zn and Cu, S1: with combined nano Zn and Cu.
Sustainability 17 09407 g010
Figure 11. Interactive effects of cover crop × combined nano Zn and Cu × N fertiliser on FDA at Syferkuil for the 2023 (a) and 2024 (b) season, p < 0.05. S0: no combined nano Zn and Cu, S1: with combined nano Zn and Cu.
Sustainability 17 09407 g011
Figure 12. Effects of cover crop incorporation (a) and N fertiliser (b) on FDA at Ofcolaco for the 2023 and 2024 season; p < 0.05; Means separated by different letters are significantly different. C0: no cover crop, C1: with cover crop. N0: 0 kg ha−1, N60: 60 kg ha−1, N120: 120 kg ha−1, N180: 180 kg ha−1 fertiliser application.
Sustainability 17 09407 g012
Figure 13. Interactive effects of cover crop × combined nano Zn and Cu × N fertiliser on urease activity at Syferkuil for 2023; p < 0.05. S0: no combined nano Zn and Cu, S1: with combined nano Zn and Cu.
Sustainability 17 09407 g013
Figure 14. Interactive effects of cover crop × N fertiliser (a) and combined nano Zn and Cu × N fertiliser (b) on urease activity at Ofcolaco for 2023 and 2024; p < 0.05. C0: without cover crop; C1: with cover crop; S0: no combined nano Zn and Cu, S1: with combined nano Zn and Cu.
Sustainability 17 09407 g014
Figure 15. Interactive effects of cover crop × N fertiliser (a,c) and combined nano Zn and Cu × N fertiliser (b) on soil pH at Syferkuil, respectively; p < 0.05; Means separated by different letters are significantly different. C0: without cover crop; C1: with cover crop; S0: no combined nano Zn and Cu; S1: with combined nano Zn and Cu.
Sustainability 17 09407 g015
Figure 16. Interactive effects of cover crop × N fertiliser on soil pH at Ofcolaco for 2023 (a) and 2024 (b), respectively; p < 0.05; Means separated by different letters are significantly different. C0: without cover crop; C1: with cover crop.
Sustainability 17 09407 g016
Figure 17. Correlation heat map for selected soil biological properties at Syferkuil (a,b) and Ofcolaco (c,d) for 2023 and 2024. Blue hue means positive correlation; Red hue means negative correlation. Significance levels: * p < 0.05; ** p < 0.01; *** p < 0.001.
Sustainability 17 09407 g017
Table 1. Pre-sown soil physicochemical properties of the two experimental sites.
SyferkuilOfcolaco* Soil Limits
Before Sunn HempAfter Sunn HempDifferenceBefore Sunn HempAfter Sunn HempDifference
pH (H2O)8.888.70-7.916.78--
¥ Ca846799-1208728->2000
¥ Mg619629+394163-84–600
¥ K316261-220143-80–200
¥ P6469+117104->15
¥ Cu4.613.73-7.415.19-0.75–100
¥ Zn5.986.76+7.438.88+3–150
N (%)0.080.09+0.060.07+0.15
OC (%)0.770.85+0.751.15+-
MWD1.111.21+1.321.70+-
TextureSandy clay loam Clay loam
* Critical soil test limits adapted from FSSA-MVSA (2007) [43]; Landon (1991) [44]; Havlin et al. (2013) [45]; and Horneck et al. (2011) [46]. ¥ nutrients in (mg. kg−1). Aggregate stability: MWD in (mm), OC: Organic carbon. Soil biological properties as affected by cover crop, combined nano Zn and Cu, and N fertiliser.
Table 2. Effects of cover crop, combined nano Zn and Cu, and N fertiliser on bacterial populations after canola production at Syferkuil.
Bacterial Populations (Log CFU mL−1)
20232024
Cover cropping (C)
C07.77 b (0.07)7.25 b (0.38)
C17.82 a (0.08)8.11 a (0.45)
HSD (p < 0.05)****
Nano Zn and Cu (S)
S07.82 a (0.09)7.70 a (0.45)
S17.77 b (0.07)7.65 a (0.47)
HSD (p < 0.05)**ns
Nitrogen (N)
N07.82 ab (0.07)7.75 a (0.47)
N607.83 a (0.09)7.76 a (0.46)
N1207.78 bc (0.07)7.71 a (0.46)
N1807.74 c (0.07)7.50 a (0.49)
HSD (p < 0.05)***ns
Significance levels: * p < 0.05; ** p < 0.01; *** p < 0.001; ns means not significant. Means separated by different letters in each column are significantly different.
Table 3. Effects of cover crop, combined nano Zn and Cu, and N fertiliser on bacterial populations after canola production at Ofcolaco.
Bacterial Populations (Log CFU mL−1)
20232024
Cover cropping (C)
C07.99 a (0.19)7.25 b (0.49)
C18.04 a (0.25)8.40 a (0.87)
HSD (p < 0.05)ns***
Nano Zn and Cu (S)
S08.09 a (0.19)7.74 a (0.78)
S17.95 b (0.24)7.54 a (0.83)
HSD (p < 0.05)*ns
Nitrogen (N)
N07.95 a (0.19)7.20 b (0.49)
N607.97 a (0.17)7.80 ab (0.79)
N1208.12 a (0.27)7.95 a (1.02)
N1808.02 a (0.23)7.62 ab (0.71)
HSD (p < 0.05)ns*
Significance levels: * p < 0.05; *** p < 0.001; ns means not significant. Means separated by different letters in each column are significantly different. Values in parentheses are standard deviation.
Table 4. Effects of cover crop, combined nano Zn and Cu, and N fertiliser on POxC after canola production.
POxC (mg kg−1)
20232024
Cover crop (C)
C0622 b (208)783 b (98)
C1811 a (250)888 a (104)
Pr > F (C)*****
Nano Zn and Cu (S)
S0669 b (232)827 a (118)
S1764 a (258)845 a (110)
Pr > F (S)***ns
N fertiliser (N)
N0717 a (120)768 b (100)
N60735 a (339)862 ab (100)
N120769 a (128)891 a (105)
N180645 b (325)823 ab (120)
Pr > F (N)****
Significance levels: * p < 0.05; ** p < 0.01; *** p < 0.001; ns means not significant. Means separated by different letters in each column are significantly different. Values in parentheses are standard deviation.
Table 5. Effects of cover crop, nano Zn and Cu, and N fertiliser on POxC after canola production.
POxC (mg kg−1)
20232024
Cover crop (C)
C0932 a (165)587 b (131)
C1982 a (121)762 a (103)
Pr > F (C)ns***
Nano Zn and Cu (S)
S0967 a (151)680 a (129)
S1945 a (141)668 a (164)
Pr > F (S)nsns
N fertiliser (N)
N01000 a (92)609 b (109)
N60939 a (149)634 ab (142)
N120950 a (161)716 ab (148)
N180937 a (174)741 a (156)
Pr > F (N)ns*
Significance levels: * p < 0.05; *** p < 0.001; ns means not significant. Means separated by different letters in each column are significantly different. Values in parentheses are standard deviation.
Table 6. Effects of cover crop, combined nano Zn and Cu, and N fertiliser on urease activity after canola production.
Urease (µg NH4-N g−1 2 hr−1)
20232024
Cover cropping (C)
C065 a (27)35 a (13)
C168 a (16)39 a (13)
Pr > F (C)nsns
Nano Zn and Cu (S)
S060 b (18)34 b (12)
S173 a (24)41 a (13)
Pr > F (S)****
N fertiliser (N)
N053 b (34)37 ab (14)
N6062 b (12)46 a (12)
N12076 a (12)33 b (6)
N18075 a (13)32 b (13)
Pr > F (N)****
Significance levels: * p < 0.05; *** p < 0.001; ns means not significant. Means separated by different letters in each column are significantly different. Values in parenthesis are standard deviation.
Disclaimer/Publisher’s Note: The statements, opinions and data contained in all publications are solely those of the individual author(s) and contributor(s) and not of MDPI and/or the editor(s). MDPI and/or the editor(s) disclaim responsibility for any injury to people or property resulting from any ideas, methods, instructions or products referred to in the content.