Abstract
Ensuring the sustainability of fisheries worldwide requires that scientific advice remain effective even when data and capacity are limited. To address these challenges, we propose a hierarchical assessment framework (HAF) capable of integrating auxiliary information, such as empirical indicators for fishing pressure, within a Bayesian state-space biomass dynamic modelling framework. The aim is to provide risk-equivalent advice to ensure that management does not penalise data-limited fisheries with undue precaution (and loss of potential yield), nor expose them to a higher risk of overexploitation. To achieve this, we evaluated performance using classification skill metrics, such as true skill, for stock status relative to maximum sustainable yield (MSY)-based reference points. Results demonstrate that incorporating auxiliary data, particularly fishing mortality indices from periods of high exploitation, substantially improves the accuracy of stock status classification. Adoption of hierarchical assessment frameworks will support targeted data collection and evidence-based, adaptive fisheries management.
1. Introduction
To ensure sustainability, fishery management must prevent overfishing and recover overfished stocks [1]. This requires assessing stock biomass and exploitation rates against objective relative to reference points and then predicting and monitoring the response of stocks to management. Where reference points provide targets, limits, thresholds, or baselines [2], targets are intended to be achieved on average, and limits are to be avoided with high probability. Similarly, while thresholds serve as triggers for management action, baselines correspond to historical periods when a stock was considered healthy. To assess the success of long-term management plans and monitor rebuilding [3,4], reference levels must be set and can be derived from models [5] or empirical indicators [6,7].
A primary management objective is sustainability. Limits identify when a stock’s productivity is impaired, e.g., the level of spawning stock biomass (SSB) at which recruitment is reduced. A key objective in many fisheries management advice frameworks is to achieve the maximum sustainable yield (MSY) [8]. For instance, the European Union’s Common Fisheries Policy [9] mandated the achievement of MSY by 2020. The tuna regional fisheries management organisation’s advice is based on the Kobe framework, which reports stock status relative to MSY-based reference points. Additionally, the Marine Stewardship Council (MSC) requires certified fisheries to demonstrate management strategies based on MSY objectives. Therefore, target reference points are generally based on MSY, and can be fractiles or multipliers [10].
Derivation of model-based reference points for BMSY (biomass at maximum sustainable yield) or FMSY (fishing mortality at MSY) is not always possible due to data limitations or model uncertainty. In such situations, proxy reference points may be used as alternatives, for example, setting FMSY corresponding to a value of spawning potential ratio [11] or relative to natural mortality [12]. However, even in data-rich situations M is difficult to estimate.
Ideally the risk of breaching biological limits should not be dictated by the quantity or quality of available information. In other words, risks should be equivalent across the data spectrum [13]. This means maintaining an acceptable probability of achieving objectives, such as safeguarding stock productivity, even when data are limited or uncertain. Data-limited fisheries should neither be penalised by excessive precaution (resulting in unnecessarily forgone yield) nor be exposed to a higher risk of stock depletion simply because of gaps in information and data. Therefore, assessment and management should provide risk-equivalent status determination to ensure that the level of risk tolerated is consistent and transparent, regardless of data quality or methodological complexity.
A challenge in fisheries advice frameworks is that biomass and exploitation rates are inherently unobservable and, therefore, are estimated by models. Stock assessment models depend on assumptions which are uncertain, e.g., about natural mortality, recruitment dynamics, vulnerability to fishing (selectivity), and stock structure. Therefore, even in data-rich situations, stock assessment models often rely on generic parameterisations or expert judgement.
Various issues have been identified, namely, overparameterized models resulting in bias and a lack of reproducibility, and limited access to model inputs, outputs, and code hindering independent verification [14]. Complex stock assessment models do not automatically yield more robust advice than simpler models, especially when data are limited, noisy, or not sufficiently informative, due to the risk of overfitting and model misspecification [15,16,17,18]. Some have advocated for simplification by replacing age-structured with biomass-based assessment models [19], which for fitting require time series of total catch and an index of abundance. When choosing models the selection must balance data availability, knowledge, and management needs with the risks of under and overfitting, favouring simplicity and transparency unless complexity is genuinely required for robust inference [20].
Biomass dynamic assessment models model the exploitable biomass of the stock based on a production function (with parameters for productivity and carrying capacity) and removals by fishing, assuming that the vulnerable biomass selected by the fishing gear is equivalent to the reproductive potential of the stock. Reducing the number of parameters by not accounting explicitly for any age-specific processes, such as size- (or age) dependent fishing mortality and lags between spawning and recruitment into the fishery, makes biomass dynamic models easier to fit and less prone to overfitting. However, estimates of status and reference points will still be biased if the underlying assumptions do not reflect the population and fisheries’ dynamics. For example, biomass dynamic model stock status estimates can be biassed in the presence of strongly dome-shaped selectivity due to differences between vulnerable and spawning biomass [21], and failing to account for lags between reproduction and recruitment into the fishery may overestimate the rate of rebuilding from low stock levels.
Biomass dynamic models are widely used when the information required for age- or size-structured methods is lacking. When indices of abundance are unavailable, biomass dynamic models have been run as catch-only models. However, such implementations are susceptible to bias due to reliance on generic assumptions and the lack of data for fitting and validation [22,23]. Catch-only models were originally intended for broad, global stock status assessments. Catch-only models require priors for current state and so cannot be run with default priors or without additional data to catch for fitting, as required for monitoring and adapting management interventions, which require updating with new data to estimate current state. An alternative in data-limited situations are length-based approaches [24,25], which can provide estimates of fishing mortality and offer the potential to calibrate biomass dynamic models.
The continuum of stock assessment methods available, from data-limited biomass dynamic models to data-rich age- and size-structured models, is explicitly recognised in hierarchical assessment frameworks [26,27]. For example, the Food and Agriculture Organisation of the United Nations (FAO) biennial reporting on the state of world marine fishery resources [28] defines three tiers, namely, Tier one: Stocks with formal numerical assessments conducted at national or regional levels. Tier two: Stocks without formal stock assessments, but for which enough data and information are available to infer status using surplus production model approaches. Tier three: Data-poor stocks, whose assessments can only be determined by applying weight-of-evidence methods and approaches. Hierarchical assessment frameworks provide a structured way to integrate alternative assessment approaches. Such frameworks are based on tier systems, where tiers represent different data limitations, and tier-specific stock assessment methods are defined, aiming for risk equivalence across tiers. It is essential that the risk of misclassifying stock status, i.e., overestimating biomass and inadvertently allowing overfishing or foregoing yield, remains equivalent across all tiers of data availability. Achieving risk equivalence requires calibration so that management decisions offer consistent levels of precaution and classification skill, irrespective of the underlying data quality.
Hierarchical assessment frameworks should also explicitly recognise that moving between tiers by increasing data quantity and quality, particularly through fisheries-independent surveys, can significantly reduce uncertainty in stock assessments; while adding low-quality or redundant data may offer little benefit or even increase uncertainty [29]. This allows for the consideration of the value of information to ensure that data collection is cost-effective [30], by identifying which types of data improve management outcomes and ensuring that limited resources are allocated efficiently [31,32].
Integrating auxiliary information, such as indices of fishing effort or length-based indicators, into biomass dynamic models provides a practical pathway for moving between data-limited and data-rich assessment tiers. In this context, it is required that management advice is reliable; defined as being robust, reproducible, and scientifically sound, such that the likelihood of failing to achieve management objectives remains acceptably low regardless of uncertainties in model assumptions or the quantity and quality of available data. Achieving reliability requires verification, validation, and calibration. Verification ensures that assessment methods are implemented correctly in accordance with the intended mathematical formulations. Validation tests whether the model, under reasonable assumptions, could plausibly have generated the observed data [33], thereby supporting the credibility of the advice [34]. Plausibility is the degree to which a model or scenario appears reasonable and is consistent with observed evidence and known processes. Calibration, often conducted through Management Strategy Evaluation (MSE), involves adjusting operational reference points in harvest control rules based on empirical indices to account for potential methodological biases and to ensure that management decisions are both defensible and effective across varying data and assessment contexts [13].
This study evaluates how biomass dynamic models can be integrated into hierarchical assessment frameworks to provide risk-equivalent, evidence-based management advice across a continuum of data- and capacity-limited fisheries. Using simulation testing for an Operating Model (OM), conditioned on 82 data-rich Northeast Atlantic stocks that span a range of life histories, we evaluate a biomass dynamic model fitted with varying combinations of catch, abundance indices, and auxiliary fishing mortality indicators derived from length-based approaches. We quantify the performance of these methods by their ability to correctly classify stock status relative to MSY-based reference points (BMSY and FMSY) and show how the use of auxiliary data can improve classification skill. The intention is to provide practical guidance for implementing hierarchical assessment frameworks to ensure transparent, robust, and risk-equivalent status determination in data-limited contexts and to support the FAO’s Ecosystem Approach to Fisheries by demonstrating how to operationalise these principles within a simulation-tested hierarchical assessment framework.
2. Materials and Methods
Hierarchical assessment frameworks provide a structured approach for selecting stock assessment methods based on data availability (Table 1) by guiding the selection of assessment methods based on available data, i.e., from length samples through catch time series to abundance indices and highlighting where additional information may benefit management advice. The hierarchical assessment framework presented here is based on a Bayesian state-space model. In data-limited situations, there may be auxiliary data that can be used to formulate informative priors or constraints when long time series of catch or abundance are missing or incomplete. We use the term auxiliary data to refer to any additional information that can supplement the primary input data used in the stock assessment model. Auxiliary data can include indices of fishing effort, fishing mortality, length-based indicators, fishery-independent surveys, industry-science partnerships [35], and citizen science, which are collected by alternative means to the main catch or abundance data.

Table 1.
Hierarchical assessment framework for biomass dynamic model to guide the selection of assessment methods based on available data.
Hierarchical assessment frameworks provide a structured approach for selecting stock assessment methods based on the available data and information. For instance, length-based approaches are valuable for inferring exploitation rates. When historical catch data exist but abundance indices are unavailable, biomass dynamic models with priors are commonly applied [22] (e.g., CMSY+, SRA+). If a comprehensive dataset is available, i.e., catches, abundance indices, and composition data, integrated assessments may be used [36]. By explicitly linking the choice of assessment method to data availability, the hierarchical assessment framework enables a systematic evaluation of the value of information; showing how additional data can improve the classification of stock status relative to reference points.
Matching model complexity to the quality and quantity of available data is required to achieve risk equivalence. Use of a hierarchical assessment framework approach ensures that management advice delivers consistent protection and sustainability in both data-rich and data-limited situations, without unfairly penalising fisheries with limited data, either through excessive precaution or by exposing them to a higher risk of stock depletion. It also creates an incentive to improve data collection, as reducing uncertainty allows for less restrictive, more tailored management responses, thereby advancing adaptive and evidence-based fisheries management.
Ensuring that management advice is scientifically defensible across this continuum requires validation and calibration of assessment models. Within a hierarchical assessment framework, the calibration of the different assessment approaches, measured by their accuracy in classifying stock status relative to targets and limits, ensures that the probability of misclassification remains consistent across all assessment tiers. However, traditional validation tools, such as cross-validation, are often infeasible in data-limited contexts due to the scarcity of observations. We therefore apply a simulation-based approach that uses an OM conditioned on a database of data-rich assessments to generate pseudo-data that may be available in a range of real-world data scenarios. This enables us to systematically evaluate the performance of alternative data sources, and model specifications and prior knowledge by quantifying their skill in classifying stock status relative to BMSY and FMSY.
2.1. Operating Model
Simulations allow a systematic comparison of the value of alternative data sources for classifying stock status. To do this, we used an OM conditioned on 82 data-rich Northeast Atlantic stocks that span a range of dynamics. Scenarios considered uncertainty about the stock-recruitment relationship, and biological reference points (BMSY, FMSY) were derived for each stock to evaluate sensitivity to biological uncertainty. Full details are given in Supplementary Materials (Tables S1–S3).
The database of stock assessment inputs and outputs for 82 stocks covering the entire Northeast Atlantic was used to condition the OM; referred to as the ICES FLR stock assessment database. The database is composed of objects of the ‘FLStock’ class, as defined in the FLR framework [37]. All 82 stocks are classified and assessed by ICES as Category 1 stocks (i.e., age-structured analytical stock assessments) and have a final assessment year of 2019 (n = 12), 2020 (n = 63), 2021 (n = 6), and 2022 (n = 1). The database contains 25 bony fish species (representative of 12 taxonomic families and nine taxonomic orders), as well as one crustacean, Pandalus borealis (ICES stock code pra.27.3a4a) (Figure 1). The database comprises harmonised assessment inputs and outputs from 12 different age-structure stock assessment frameworks, of which SAM [38] (n = 35) and Stock Synthesis [39] (SS3; n = 14) are the most frequent (Table S3).
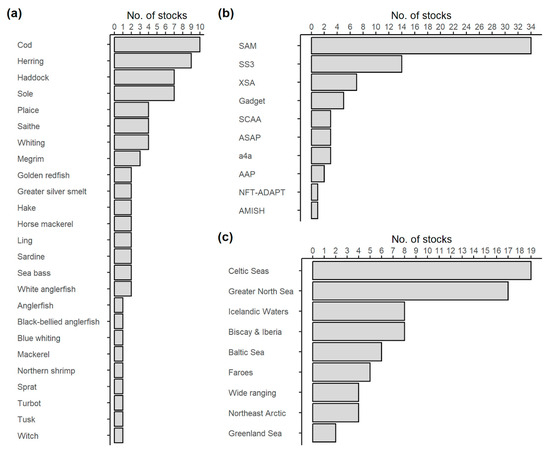
Figure 1.
Overview of ICES Category 1 stocks used as the OM; 82 Northeast Atlantic stocks classified by species and region. The stocks, assessed with age-structured models, provide the basis for generating pseudo-data and evaluating the performance of alternative assessment approaches; summaries of (a) species, (b) assessment method, and (c) area.
Statistical catch-at-age models, which use a combination of age, catch, and survey data to model stock dynamics, are also used (i.e., SSCA, ASAP, AMISH, NF-ADAPT, and APA).
The majority of the stocks occur in the North Sea (n = 19) and surrounding areas (e.g., Celtic Seas (n = 8) and Irish Sea (n = 7)); however, some stocks have a wide spatial distribution that spans multiple ICES ecoregions (e.g., Blue whiting, Micromesistius poutassou, in the Northeast Atlantic and adjacent waters; whb.27.1-91214).
For each stock in the ICES database, unfished spawner-per-recruit potential (SPR0) was calculated, and a steepness prior was obtained from FishLife [40]. Stock–recruitment relationships were then fitted as functions of steepness and virgin biomass, and reference points were derived by combining the stock-recruitment and spawner- and yield-per-recruit relationships [5]. To assess the robustness of management advice to uncertainty in the stock-recruitment relationship within the OM, both Beverton and Holt and Ricker models were fitted for each stock. This allowed for the derivation of MSY reference points consistent with the recruitment dynamics and associated uncertainties for each stock.
2.2. Stock Assessment
The stock assessment method used in this study is a Bayesian state-space biomass dynamic surplus production model (JABBA), developed for flexible and reproducible stock assessments in data-limited fisheries contexts [41]. The model represents population dynamics by a biomass-based production function rather than age-specific dynamics. The production functions by stock are summarised in the Appendix A; Figure A1. The approach replaces explicit modelling of stock-recruitment, individual growth, natural mortality, and selectivity with exploitable biomass, catch, and catch per unit effort (CPUE). Exploitable biomass () represents the fraction of total biomass vulnerable to fishing and is calculated as follows:
where:
- is the number of individuals at age and time ,
- is fleet selectivity at age and time ,
- is catch weight at age and time ,
- is the maximum age.
The general form of the biomass dynamics in JABBA is:
where:
- is the biomass at time ,
- is the surplus production at time ,
- is the catch in the interval time ,
- is the process error.
Alternative production functions can be specified, depending on assumptions about the relationship between biomass and productivity, namely:
Schaefer Model (symmetric parabolic curve):
Fox Model (asymmetric curve):
Pella—Tomlinson Model (flexible shape):
where determines the curve’s skewness ( reduces to the Schaefer model).
The model incorporates process error, estimated within the model, allowing for stochasticity in population dynamics.
Process Equation (Biomass Dynamics):
and observation error to account for uncertainty due to sampling:
Observation Equation (Abundance Index):
where is the abundance index at time , is catchability, and is observation error.
The JABBA framework was extended to allow auxiliary data, such as indices of fishing pressure (e.g., ), to be incorporated as priors or direct observations. These indices may be derived from length-based indicators or other sources, providing additional information to improve assessment performance, which is particularly valuable in data-limited situations.
Model Fitting
Bayesian inference is used to estimate posterior distributions of key stock status indicators, such as and . Priors for key parameters, including intrinsic population growth rate (), initial depletion (), and the shape parameter (), were derived from the OM stocks by fitting a Pella—Tomlinson production function to the equilibrium estimates of exploitable biomass and yield. The prior was either at the stock specific or taxonomic order level (average of stock values), to represent different levels of prior knowledge. In catch-only models a prior for current depletion was also included. In all cases a ratio between BMSY and virgin biomass of 0.4 was assumed. For scenarios with auxiliary data, priors were informed by exploitable biomass rather than spawning stock biomass to reduce bias.
Prior Predictive Modelling (PPM) is the first step in Bayesian analysis, and particularly valuable when data are limited. PPM involves specifying prior distributions for the model parameters and then generating posterior estimates without data [42]. The aim is to simulate outcomes based on default settings or expert knowledge without data as a “reality check”. This helps to identify the impact of assumptions, numerical instabilities, and model misspecifications before fitting the data. Simulations produce a prior predictive distribution for the range of plausible observations given the priors. This is of particular importance in data-limited situations since priors may have a large influence on outcomes. PPM therefore ensures that the impacts of the priors agree with stakeholder knowledge, prevents cherry picking, or late-stage discovery of model flaws. Thereby ensuring transparency and strengthening the credibility of subsequent Bayesian inference.
For each stock, the model was run across all relevant scenarios, and outputs were extracted for further evaluation. JABBA was fitted using Markov Chain Monte Carlo (MCMC) simulations to estimate posterior distributions of stock status indicators (e.g., B/BMSY, F/FMSY). For each assessment scenario, 90,000 MCMC iterations were run, with a burn-in of 15,000 and a thinning interval of 15, to ensure adequate mixing and convergence. All model fitting was performed in R, using the JABBA package (https://github.com/jabbamodel/JABBA accessed on 20 October 2025) and custom wrapper functions to automate data preparation, prior specification, and post-processing of results.
2.3. Observation Error Model
The Observation Error Model generates pseudo-data from the OM to be used by the stock assessment. Datasets are time series of total catch, where the index of abundance based on exploitable biomass, and an auxiliary index representing historical exploitation levels (i.e., F/FMSY) are proportional to the OM values, and priors for r and initial stock state (). In the case of catch-only models, a prior for current depletion is also required. Priors were generated either for each stock or by taxonomic order, e.g., the average value of Gadiformes was used for cod.
Observation error was incorporated for all abundance indices using a log-normal distribution with a standard deviation of 0.3, reflecting measurement uncertainty in survey and CPUE data. A lognormal observation error standard deviation (SD) of 0.3 was assumed for all stock indices, as this is consistent with published CVs for survey and CPUE data, and widely used practice in fisheries simulation studies [23]. The value of 0.3 represents a typical level of measurement error and allows comparison across stocks. Sensitivity analyses confirmed that the comparative findings related to method performance are robust to variation around this level.
An unbiased estimate of the biomass of landings and discards and an index for exploitation level in the form of F/FMSY were provided. The latter can potentially be derived, for example, from length-based methods and indicators.
In data-limited situations, priors are used for key parameters [43] and are generally developed based on assumptions about life-history relationships and spawning stock biomass (SSB). However, in biomass dynamic models the state variable is exploitable biomass, the portion of the stock that is vulnerable to fishing, rather than SSB. The relationship between SSB and exploitable biomass varies depending on selectivity patterns, maturity schedules, and the timing of fishing relative to spawning. Therefore, using priors derived from SSB in models based on exploitable biomass can introduce bias.
The values of r, FMSY, the ratio between BMSY/K, and initial depletion derived for the OM assume either Ricker or Beverton and Holt stock-recruitment relationships. FMSY is the proportion of the exploitable biomass at BMSY that produces MSY. Furthermore, values based on SSB and exploitable biomass are compared in Figure 2 to priors derived from FishLife [44]. There is little difference in r regardless of the assumed stock-recruitment relationship or the specification of biomass. The biggest difference is seen in the shape (BMSY/K), as the form of the stock-recruitment relationship determines the density dependence at large stock sizes. Most of the stocks have been exploited at levels below BMSY, so the value of K, and hence BMSY/K, is uncertain. FMSY is equal to the population growth rate at BMSY but does not to depend on the stock-recruitment relationship. There are large differences, however, between the priors from FishLife [44] and those based on the stock data. This suggests that priors should be developed on a case-by-case basis.
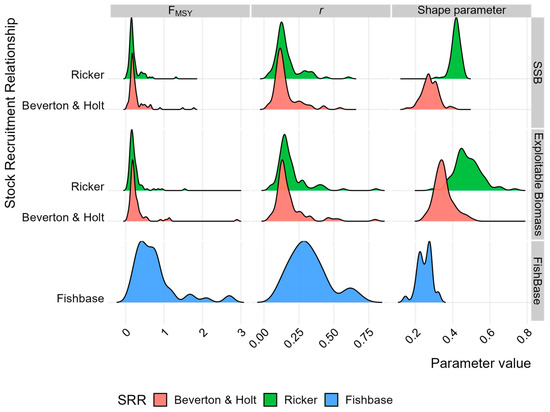
Figure 2.
Comparison of prior distributions for key parameters in the assessment models. Distributions of priors for population growth rate (r), initial depletion, and shape parameter (m) used in the Bayesian biomass dynamic models. Priors are derived from the ICES FLR database, either stock specific or by taxonomic order, and are critical for informing assessments in data-limited situations.
2.4. Scenarios
Three specifications for the biomass dynamic model were specified: (1) catch-only model (COM), (2) catch and abundance index models (IDX), and (3) catch and short index of the last 5 years model, fitted with additional auxiliary data (Aux). Each of these was fitted for alternative treatments related to quality of prior knowledge, either case specific or generic, based on taxonomic order. For catch-only models, we followed common practice and developed priors using SSB and the Beverton and Holt stock-recruitment relationship. For the shape, we assumed a Pella-Tomlinson production function, with the shape of BMSY/K = 0.4. To evaluate improved prior information, i.e., the value of information, we used (i) priors based on taxonomic order (COM generic) or stock specific values with low CVs (COM specific). For the index (IDX) and F/FMSY (Aux) scenarios, we used shape = 0.4 and priors based on exploitable biomass, since the values of r were similar for SSB and EB, it makes it easier to compare across scenarios, removing any bias due to using SSB. The scenarios, therefore, reflect different data availability and auxiliary information (Table 2). Assessment scenarios were compared to OMs conditioned on both Beverton and Holt and Ricker recruitment assumptions.
Table 2.
Assessment Scenarios.
3. Verification, Validation, and Calibration
To evaluate assessment performance, we used maximum sustainable yield (MSY) as the management objective, reflecting its status as a global standard in fisheries policy. Validation was conducted by comparing stock status estimates from JABBA (expressed as B/BMSY and F/FMSY) with the “true” values from the OM scenarios. To compare performance, we used two classification skill metrics: the area under the receiver operating characteristic curve [44,45] (AUC) and the true skill statistic [46,47] (true skill score). The AUC summarises classification skill across all possible thresholds, providing a measure of classification skill. The true skill score measures a model’s ability to correctly classify stock status relative to a reference level.
For each scenario, assessment model estimates were compared with true stock trajectories and reference points derived from the OM. Verification ensured that model algorithms correctly captured the intended population and fishery dynamics. Validation was conducted by comparing model estimates with the OM values. Calibration is performed by adjusting reference levels, i.e., classification thresholds, to maximise the true skill score (i.e., probability of correct stock classification) and can ensure that risk equivalence is maintained across hierarchical assessment framework tiers by setting thresholds (i.e., precautionary buffers) before limits are breached. These metrics provide an objective way to evaluate how alternative datasets, model configurations, and prior assumptions contribute to the reliability and consistency of management advice within a hierarchical, risk-equivalent framework.
3.1. True Skill Score
True skill score (true skill score) measures the ability to correctly classify stock status and is calculated as follows:
where sensitivity is the proportion of correctly classified positive cases (true positives), and specificity is the proportion of correctly classified negative cases (true negatives). True skill score values range from −1 to 1, with 1 indicating perfect classification skill (all stocks correctly classified), 0 indicating no skill beyond random chance (equivalent to a coin toss), and negative values indicating performance worse than random.
TSS = sensitivity + specificity − 1
True skill score was calculated for each assessment model scenario by comparing the model’s estimated stock status classifications relative to BMSY and FMSY against the “true” status from the OM. This four-quadrant classification framework follows the standard Kobe plot approach used in fisheries management, where stocks are categorised as follows: not overfished nor experiencing overfishing (B ≥ BMSY & F ≤ FMSY, green); not overfished but experiencing overfishing (B ≥ BMSY & F > FMSY &, orange); both overfished and experiencing overfishing (B < BMSY & F > FMSY &, red) or; overfished but not experiencing overfishing (B < BMSY & F ≤ FMSY, yellow).
True skill score can be calculated for the estimates of BMSY and FMSY, or after calibration, where the reference level is chosen to maximise true skill score. An alternative is to use the balanced success score (BSS), which provides an alternative measure of classification performance that balances sensitivity and specificity as it gives equal weight to both the correct classification of positive and negative outcomes, which is valuable if the prevalence of positive and negative cases in the dataset is uneven.
3.2. Area Under the Curve (AUC)
The Area Under the Curve (AUC) metric, quantifies the overall discriminatory ability of the assessment model across different classification thresholds. The AUC is derived from receiver operating characteristic curves that plot sensitivity against 1-specificity across varying threshold values. AUC values range from 0 to 1, with
- 0.5, indicating no discriminative ability (equivalent to random guessing)
- 0.7 ≤ AUC < 0.8, indicating acceptable discrimination
- 0.8 ≤ AUC < 0.9, indicating excellent discrimination
- AUC ≥ 0.9, indicating outstanding discrimination
4. Results
Stock status in the final year of the OM is summarised as a phase plot in Figure 3, which plots the terminal year values of F/FMSY against SSB/BMSY; SSB and F are from the ICES FLR database, and the reference points depend on the choice of the stock-recruitment relationship. Points represent stocks, colours indicate the assumed stock-recruitment relationship (purple is Ricker), and the quadrants indicate stock status, B/BMSY ≥ 1, F/FMSY ≤ 1 (green), B/BMSY < 1, F/FMSY ≤ 1 (yellow), B/BMSY < 1, F/FMSY > 1 (red), and B/BMSY ≥ 1, F/FMSY > 1 (orange). Also shown are the distributions of F/FMSY and SSB/BMSY.
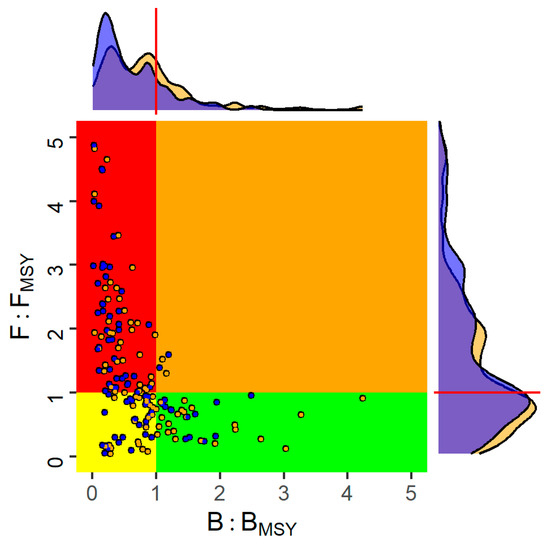
Figure 3.
Kobe phase plot showing the joint distribution of fishing mortality and spawning stock biomass relative to MSY reference points indicated by quadrants. Green: sustainable (SSB ≥ BMSY and F < FMSY), yellow: rebuilding (SSB < BMSY and F ≤ FMSY), orange: overfishing (SSB ≥ BMSY and F > FMSY), and red: overfished and subject to overfishing (SSB < BMSY and F > FMSY). Points represent stocks, with colours indicating stock-recruitment assumption; Ricker (blue) and Beverton and Holt (yellow).
The proportion of stocks classified as subject to overfishing (F > FMSY) is not that sensitive to the choice of stock-recruitment relationship, while the probability of being overfished (SSB < BMSY) is greater when a Ricker relationship is assumed, as estimates of BMSY are generally higher for the Ricker stock-recruitment relationship (Figure A1). This means that management advice based on FMSY is robust to the assumed stock-recruitment relationship, but advice based on BMSY is not.
Historical status for the OM is summarised in Figure 4, trends are similar for the two stock-recruitment relationships, but the status is more optimistic under the Beverton and Holt stock relationship assumption.
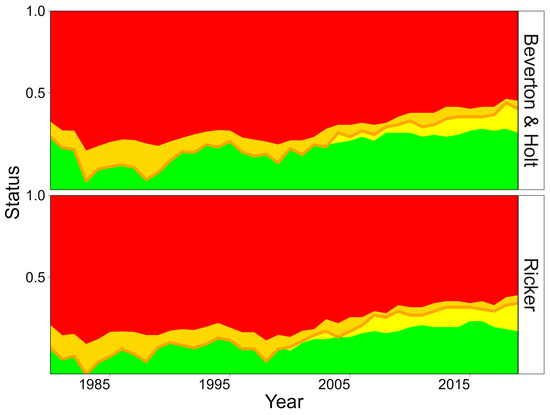
Figure 4.
Stock status of OM stocks relative to reference points (BMSY and FMSY) under two stock-recruitment relationships. Proportion of stocks in each Kobe quadrant: green: sustainable (SSB ≥ BMSY and F < FMSY), yellow: rebuilding (SSB < BMSY and F ≤ FMSY), orange: overfishing (SSB ≥ BMSY and F > FMSY), and red: overfished and subject to overfishing (SSB < BMSY and F > FMSY). The thick orange line denotes the boundary between overfished stocks (B < BMSY).
Historically stocks in the Northeast Atlantic have been overexploited but following the implementation of the ICES advice rule in 2008 stock have started to recover. However, there is no explicit BMSY target in ICES, as advice is based on F targets and biomass limits. So, while F has been reduced many stocks are still below BMSY. Recently, while the proportion of stock F < FMSY has declined many have predicted here to not recovered above BMSY.
The estimated historical status is summarised in Figure 5; the orange line corresponds to the OM values from the previous figure. The quantities in the prior predictive model and index runs provide reference cases against which the alternative assessment specifications can be compared. The catch-only models provide the “current state-of-the-art” for data-poor methods, which we aim to improve by using auxiliary information. Without data for fitting the prior predictive models overestimates the proportion of stocks where B/BMSY < 1; i.e., large stocks can explain the observed catches. The data-moderate assessment with an index of abundance captures trends, but classification by Kobe quadrant. This is because the OM is based on SSB and the biomass dynamic model on exploitable biomass. Using an index for the last five years shows little improvement over the prior predictive model run. For the catch-only method with a stock specific (COM Specific) prior, current status is unsurprisingly well estimated; however, historical estimates do not capture the trend, i.e., a skipping rope effect where the terminal points are fixed but intermediate values can be anywhere. Using a generic depletion prior (COM Generic) results in performance that is only slightly better than the prior predictive model run, i.e., the model is only informed by the priors and cannot be formally validated based on observations.
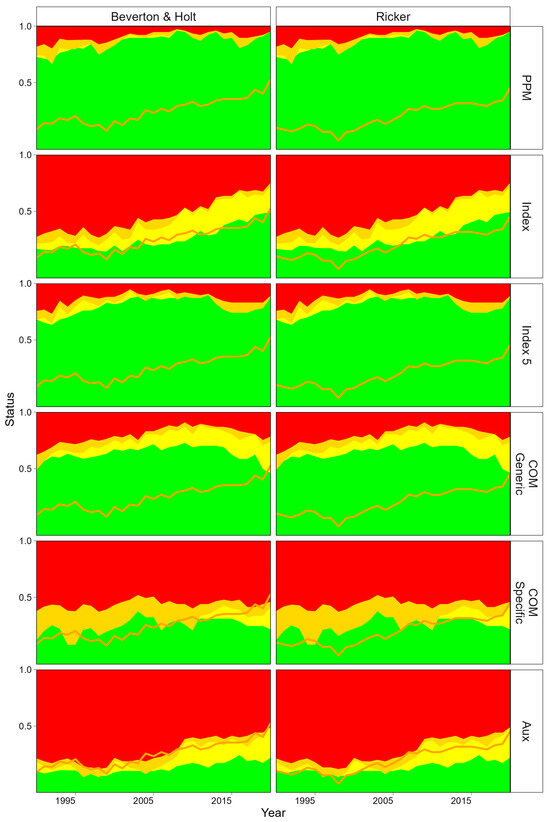
Figure 5.
Stock status classification by assessment scenario relative to BMSY and FMSY. For the OM these are based on SSB and instantaneous fishing mortality. For the biomass dynamic model estimates these are based on exploitable biomass and harvest rate. Proportion of stocks in each Kobe quadrant for alternative assessment scenarios: prior predictive model (PPM), data-moderate (full index), data-limited (5-year index), two catch-only models (COM Generic and COM Specific) and data-limited (5-year index), but with auxiliary fishing mortality indices (Aux). The orange thick line indicates the “true” proportion of stocks for which B > BMSY of the operating model. The figure highlights the influence of priors, catch history, and auxiliary data on classification performance, with colour coding as in Figure 4, with the thick orange line denoting the “true” boundary between overfished stocks (B < BMSY) of the Operating model.
An example of using classification skill to evaluate indicators (or model estimates) is provided in Figure 6. For the OM these are based on SSB and instantaneous fishing mortality. For the biomass dynamic model estimates these are based on exploitable biomass and harvest rate, since values are relative to MSY-based reference points quantities are dimensionless and so comparable. This evaluates how well an auxiliary indicator (in this case, an index proportional to F/FMSY) can classify true stock status, represented by the OM. The indicators compared are estimates from the biomass dynamic model fitted with the auxiliary indicator (upper panels) and the prior predictive model (lower panels). The first panel shows the distributions of the indicator values (blue) and OM values (red), revealing bias in the indicator relative to the OM values. The second panel provides a visual representation of classification by plotting estimates against OM values. The quadrants show the number of True Positives (correctly identified stocks that are above B/BMSY), False Positives (incorrectly classified as being above B/BMSY), True Negatives (correctly identified stocks below B/BMSY), and False Negatives (incorrectly classified as being below B/BMSY).
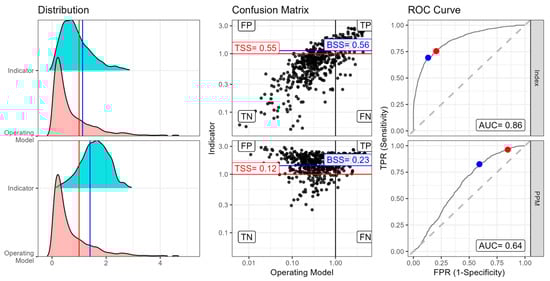
Figure 6.
Illustration of classification performance for two assessment methods: Index (top) and prior predictive model (bottom). (Left): Distributions of indicator values (blue) and true OM values (red). (Centre): Confusion matrices showing correct and incorrect classifications. (Right): receiver operating characteristic curves, with Area Under the Curve (AUC) and true skill statistic (true skill score) values. The blue point indicates the default reference level (B/BMSY = 1), and the red point indicates the improvement in the true skill score by calibrating the reference level.
The third panel plots the receiver operating characteristic (ROC) curves. The receiver operating characteristic curve plots the true positive rate (sensitivity) against the false positive rate (1-specificity). The Area Under the Curve (AUC) serves as a metric of classification performance. The biomass dynamic model conditioned with an Index achieved an AUC of 0.86, compared to 0.64 for the Prior predictive model. This shows the superior classification of the biomass dynamic model with the auxiliary index. The true skill statistic (true skill score) is calculated as sensitivity plus specificity-1. The Index achieves a true skill score of 0.55, indicating moderate classification skill, while the Prior predictive model’s true skill score of only 0.12 suggests poor discriminatory ability. The best skill score represents the optimal classification threshold after calibration, which improved from 0.34 to 0.55 for the Index, demonstrating the value of adjusting reference levels and how calibration can substantially enhance the performance of assessment methods. The receiver operating characteristic analysis quantifies model performance and allows calibration by choosing a reference level with the best true skill score, providing a means to improve classification accuracy even when working with biassed methods.
The AUC and true skill score metrics allow for comparisons of the performance of the methods across the tiers of the hierarchical assessment framework for all the OM stocks. The AUC indicates whether a model estimate has good discriminatory power, for predicting whether SSB or F is increasing or decreasing, but it ignores the choice of threshold. Uncalibrated models can yield a high AUC but poor true skill score, since true skill score depends on the choice of threshold and BMSY or FMSY may be biassed. Therefore, we first summarise the AUC metric across methods (Figure 7), true skill score (Figure 8), and then the calibrated true skill score (Figure 9). The distributions for biomass and harvest rate are summarised by assessment scenarios and stock-recruitment relationships. Scenarios are grouped by benchmark, catch-only model and Aux; the benchmark scenarios provide the potential range of outcomes, i.e., from the worst (prior predictive model without data) to the best (with an index of relative abundance). In addition to scenarios using the full time series of standardised abundance indices (“Index”), there is an additional scenario (“Index 5”) in which only the most recent five years of CPUE data were used. This scenario is designed to simulate data-limited conditions where only recent CPUE information is available, such as in newly monitored fisheries or cases where incomplete historical data is available. Catch-only model evaluates the performance of the data-limited assessments with only catch; and Aux evaluates the value of different auxiliary relative F datasets (Aux, Aux 5, Aux Low, Aux High, and Aux High-Low).
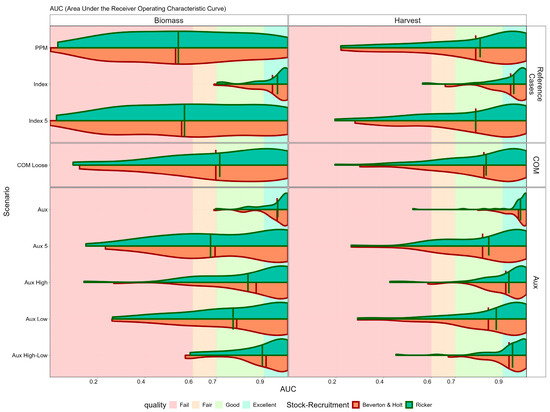
Figure 7.
Area Under the Curve (AUC) distributions for biomass and harvest status classification across assessment scenarios. AUC values for the prior predictive model, Index, catch-only models, and models using auxiliary F/FMSY data (including full time series and targeted historical periods), are shown for both Beverton and Holt (red) and Ricker (green) stock-recruitment relationships. Higher AUC values indicate better overall classification skill, with F-based indicators showing strong performance for harvest status. The results are robust to the assumed stock-recruitment relationship.
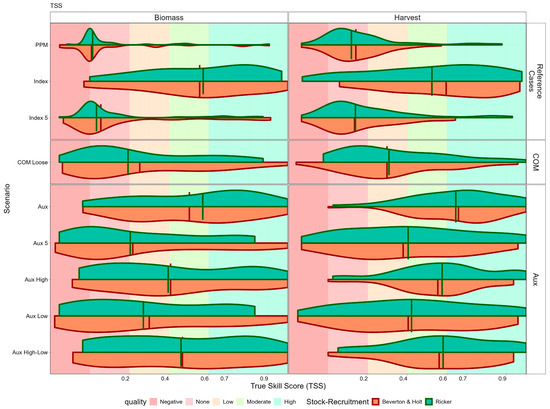
Figure 8.
True skill statistic (true skill score) for each assessment method and status category across all stocks. True skill score values for classifying stocks into Kobe quadrants (green: sustainable, yellow: rebuilding, orange: growth overfishing, red: overfished/overfishing), are evaluated for the final year (2019), all years, and relative to a historical reference period. Coloured backgrounds indicate skill quality from negative (red) to high (green). The figure demonstrates the comparative skill of Index and F-based methods, and the impact of data scenario and stock-recruitment assumption.
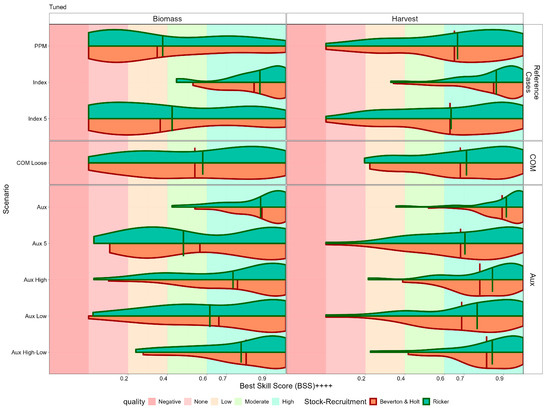
Figure 9.
Calibrated best skill score for each assessment method and status category. Violin plots of best skill score values across stocks show the improvement in classification skill after calibrating reference levels using receiver operating characteristic analysis. Results are presented for both Beverton and Holt as well as Ricker stock-recruitment relationships, and for all status categories. Calibration enhances performance, especially for F-based methods and in rebuilding and sustainable categories.
Classification skill (true skill score) achieved under each scenario, is summarised in Figure 7. For biomass status (left panels), the full Index scenario (using all available CPUE years) typically achieves “Moderate” to “High” skill. The full series of auxiliary data (Aux) perform as well as the index, five years of recent data (Aux 5) perform better than five years of CPUE. Historical auxiliary data, e.g., obtained from five years of archived data, improved skill. The summary of the AUC shows that assessments that incorporate full-time series (indices or auxiliary) data achieve high AUC values and so exhibit “good” or “excellent” performance. In contrast, catch-only models and the prior predictive model scenario show highly variable performance (i.e., random), particularly for biomass classification. Models using auxiliary data from periods of high exploitation (Aux High) perform nearly as well as those using the full-time series. Using indices of fishing mortality substantially improves the reliability of stock status classification compared to catch-only approaches.
True skill score for the model estimates of FMSY and BMSY is summarised in Figure 8. Assessment with high classification skill will have a distribution skewed to the right. The prior predictive model has no skill, as true skill score is close to 0. Using an abundance index improves the true skill score, as the median moderate skill shows. Although for some stocks, skill is still low. Patterns are found across the methods and stock-recruitment assumptions. For biomass classification (left panels), the full Index method achieves “Moderate” to “High” skill (green-shaded regions). The F-based methods perform better for harvest than for biomass, and Aux High consistently perform the best, with skill levels comparable to the full Index. The Aux 5 method (using only five years of fishing mortality data) shows the weakest performance among the F-based approaches; however, it still outperforms the prior predictive model and catch-only model scenarios. The stock-recruitment relationship has a bigger impact on performance for biomass than for harvest classification. Even limited time series of F data, from periods of high exploitation can provide classification skills comparable to full time series approaches.
Reference levels can be calibrated using the receiver operating characteristic curves to maximise true skill score by selecting thresholds, i.e., a point on the receiver operating characteristic curve that minimise the Euclidean distance to the perfect classification point (TPR = 1, FPR = 0). The calibrated true skill scores are shown in Figure 9. Auxiliary data with indices from low and high periods of exploitation perform nearly as well as full time series approaches. Short-term indices from the recent periods (Aux 5) show more limited improvement through calibration and appear to be case specific. This shows again that even limited historical information about fishing mortality, particularly from high-exploitation periods, can provide robust classification when calibrated.
After calibration using receiver operating characteristic curve thresholds (Figure 9), the Index 5 scenario maintains intermediate classification skill—demonstrating that even limited contemporary CPUE data can meaningfully inform status classification. However, the highest skill is consistently observed when longer data series or auxiliary indices from informative exploitation periods are available.
Skill for classifying stock into the four states is summarised in Figure 10, which evaluates the ability of each assessment scenario to classify stock status into the four Kobe states (green, yellow, orange, red), both historically and in the most recent year. This provides a comparison across data and knowledge availability.
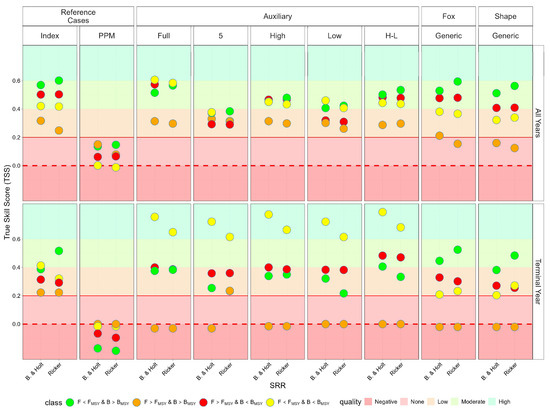
Figure 10.
True skill score for the reference level historical baseline (2020) across all assessment methods. Comparison of true skill score values when using a historical baseline as the reference level, highlighting how skill varies by method and status category. The figure underscores the value of historical F data (Aux High, Aux High-Low) and the importance of calibration for achieving risk-equivalent classification in data-limited contexts.
Incorporating auxiliary information, particularly indices of fishing mortality from periods of high exploitation, substantially improves classification skill. Methods that include full time series of abundance or F indices consistently achieve a higher true skill statistic (true skill score) compared to catch-only models. Even when only limited historical F data are available, classification skill remains comparable to that achieved with the full time series.
The ability to correctly classify varies by method. F-based and index-based approaches show the highest skill in distinguishing green and red states, with moderate to high true skill score values. In contrast, catch-only and prior predictive model scenarios frequently misclassify stocks, particularly in the yellow and orange states, reflecting limited discriminatory power when only catch data or generic priors are used.
In the terminal year, methods using auxiliary data maintain high classification skill. For historical stock status, auxiliary data methods continue to outperform catch-only and prior-based approaches. Models using the auxiliary time series can track transitions between Kobe states over time, capturing periods of overexploitation and recovery. Catch-only models, however, tend to underestimate historical trends and often fail to detect changes in stock status, leading to poor skill in reconstructing the historical trajectory of stocks.
Assuming the correct production function shape, does not have much effect. Integrating auxiliary data, i.e., indices of fishing mortality from periods of high exploitation, improves the ability to classify stock status across all Kobe states, both historically and in the most recent year.
Integration of auxiliary data can substantially improve the classification skill of biomass dynamic models in data-limited contexts. Methods incorporating full time series of abundance or F/FMSY indices consistently outperformed catch-only and prior-based approaches, achieving moderate to high true skill score and the best (i.e., calibrated) skill score values for both biomass and harvest status classification. Even when only a limited period of F data from high exploitation was available, classification skill approached that observed in data-moderate scenarios.
5. Discussion
The aim was to develop a framework capable of delivering robust, risk-equivalent, and transparent advice across varying levels of data availability [48]. To do this, we proposed a hierarchical assessment framework based on quantitative biomass dynamic models, which can also integrate a broad array of qualitative and semi-quantitative data, expert knowledge, and other information [49].
Simulation testing was conducted to evaluate methods for inclusion within the hierarchical assessment framework by conducting a systematic comparison of the performance of approaches ranging from prior-only-based methods [50] to those integrating empirical auxiliary information (e.g., indices of effort or fishing mortality derived from length-based indicators) to data-moderate alternatives. To ensure that bias is not increased with uncertainty [51,52], we implemented rigorous tools for verification, validation, and calibration.
It was demonstrated that incorporating historical auxiliary data on fishing mortality (F), especially from periods of high exploitation, can substantially improve the classification skill of stock status when integrated into biomass dynamic models.
Although not evaluated here using auxiliary data with long time series of catch and CPUE may improve model fits, this could be evaluated using appropriate model diagnostics and we recommend future research in this area.
Calibration further enhances the reliability of stock status classification and helps overcome the limitations of short time series, supporting robust advice even when only limited information is available. These findings demonstrate the value of using auxiliary data for F in biomass dynamic models as an alternative to catch-only methods when relative abundance indices are unavailable.
FMSY estimates tend to be relatively consistent across the assumed stock-recruitment relationships. In contrast, BMSY is highly sensitive to the assumed form of the stock-recruitment function, with Ricker-type recruitment usually resulting in higher BMSY estimates compared to Beverton and Holt. Therefore, advice based on fishing mortality will provide more robust management advice than that based on biomass-based reference points, especially when recruitment dynamics are not well established. Harvest control rules based on F and trends in biomass are likely to perform better than those using BMSY as a limit or target in the absence of reliable recruitment information.
Maintaining consistent probabilities of achieving management objectives across data-limited, moderate, and rich contexts, i.e., ensuring risk equivalence, is challenging. Hierarchical assessment frameworks can help achieve comparable risk levels despite differences in data quality, allowing yield cost trade-offs to be evaluated. For example, if higher uncertainty requires more precautionary management action, then there will be a value of information as collecting data will have value by increasing catch. Calibration of biological reference points (such as FMSY and BMSY) or application of precautionary buffers where uncertainty is high will help ensure that management advice remains both effective and consistent, irrespective of underlying data richness.
Uncertainty in stock status assessments tends to increase as data availability decreases, and the application of generic data-limited models can introduce substantial risk of misclassification compared to data-rich approaches [53]. Benchmarking using data-rich assessments [54], via simulation testing, cross-validation, or retrospective analysis, assumes that data-rich assessments provide the gold standard, i.e., the most reliable and accurate estimates of true stock status available [55]. However, Edgar et al., [14] highlighted critical limitations and biases in current fisheries stock assessment, models used for advice should be formally validated against empirical observations or independent datasets to enable the acceptance, rejection, or weighting of alternative modelling hypotheses. Therefore, future research should systematically compare the classification skill and misclassification risks of alternative assessment methods using a consistent set of stocks and datasets using validation against observations. Such comparative benchmarking will identify scenarios where specific methods underperform, guiding model selection, and supporting the design of adaptive management procedures that uphold risk equivalence across the data spectrum.
Maintaining a constant risk tolerance across data-rich and data-limited fisheries is implicit within precautionary management approaches. This requires that the probability of exceeding biological limits does not increase due to lower data availability or added uncertainty, precaution can be applied through control rules with buffers or thresholds or both to ensure limits are not breached. This helps to guarantee that all fisheries, regardless of assessment quality, are given the same level of protection against depletion, in line with international best practices and the foundational principles of the precautionary approach
5.1. Auxiliary Data
It was shown that use of auxiliary data can substantially improve the classification skill of biomass dynamic models in data-limited contexts. Methods incorporating full time series of abundance or F/FMSY indices consistently outperformed catch-only and prior-based approaches, achieving moderate to high true skill score for both biomass and harvest status classification. Even when only a limited period of F data from high exploitation was available, classification skill approached that observed in data-moderate scenarios. This underscores the value of targeted auxiliary data collection for improving fisheries assessments.
5.2. Limitations
The chief limitations of this study were the use of a simulation framework conditioned on ICES data-rich stocks, which may not capture the diversity of data-limited fisheries globally, and the simplifications in the OMs based on data-rich assessments that, although realistic, cannot fully represent the complexity of ecological and fishery processes. However, the approach provides a basis for the verification, validation, and calibration of assessment methods as well as practical guide for the prioritisation of data collection and monitoring.
Robust decision-making involves five key stages: (1) defining the problem; (2) assigning values to possible courses of action; (3) taking action; (4) reviewing the outcomes and the value of the decision taken; and (5) extracting lessons to inform future management cycles [56]. We used open loop simulation by comparing assessment estimates to OM values, concentrating on steps one and two. We did not conduct closed loop simulation Management Strategy Evaluation (MSE) to account for feedback between the assessment, management procedure, and implementation. MSE frameworks primarily concentrate on one, two, and three. Effective fisheries management also depends on performing implementation reviews and adaptive learning. Hierarchical assessment frameworks can not only help in the initial choice of assessment approach to match available data to reference points and harvest control rules (stages 1–3) but also provide an operational framework for empirically evaluating performance (stage 4) and adapting advice or management strategies over time (stage 5).
By embedding verification, validation, and calibration as part of skill-based evaluation of model performance within a tiered system, hierarchical assessment frameworks enable transparent, evidence-based implementation reviews. This ensures that management advice is continually refined as new data, methods, and lessons emerge, supporting adaptive fisheries management and the operationalisation of learning-by-doing in complex and evolving resource systems.
6. Conclusions
Providing assessments for data-limited fisheries is a challenge, particularly given the potential bias of catch-only methods. There is a need for alternatives that can incorporate auxiliary information. Therefore, we evaluated the use of a hierarchical assessment frameworks using classification skill metrics to objectively evaluate the improvement in the estimation of stock status when auxiliary data are available. The performance of biomass dynamic models that rely solely on priors was poor; however, adding auxiliary data in the form of indices of relative abundance or exploitation rates significantly improved classification skill. Testing different types of auxiliary data for use in a hierarchical assessment framework can help identify the costs and benefits of collecting or data-mining different datasets.
Supplementary Materials
The following supporting information can be downloaded at: https://www.mdpi.com/article/10.3390/su17219383/s1. Table S1. List of species (and taxonomy) included in our dataset. Stock details the ICES stock ID, WG refers to the ICES working group that currently assesses the stock, Model is the stock assess-ment framework applied, and Years details the temporal span (start and end year) of the assess-ment. Stock-specific areas are broadly characterised based on ICES Divisions and ecoregions. Tax-onomic information (Family and Order) for each species were sourced from FishBase (Froese & Pauly, 2022). Table S2. Established reference points by stock. BMSY, Btrigger, Blim and Bpa values have been rounded to the nearest whole number. FMSY values have been rounded to two decimal places. Table S3. Stock assessment frameworks used in our dataset. All assessment frameworks are age structured and are applied to ICES Category 1 stocks.
Author Contributions
Conceptualization, L.T.K. and H.W.; methodology, L.T.K. and H.W.; software, L.T.K., H.W. and I.M.; validation, L.T.K.; formal analysis, L.T.K., H.W., M.C., I.M. and R.S.; investigation, L.T.K., H.W., M.C., I.M. and R.S.; resources, L.T.K., H.W. and M.C.; data curation, L.T.K. and M.C.; writing—original draft preparation, L.T.K. and M.C.; writing—review and editing, L.T.K., H.W., M.C., I.M. and R.S.; visualisation, L.T.K. and M.C.; supervision, L.T.K.; project administration, L.T.K. and R.S. All authors have read and agreed to the published version of the manuscript.
Funding
No funding was provided for this project.
Institutional Review Board Statement
Not applicable.
Informed Consent Statement
Not applicable.
Data Availability Statement
The simulation analysis conducted is available at https://github.com/laurieKell/haf 20 October 2025.
Acknowledgments
During the preparation of this manuscript/study, the authors used Writeful (2025.36.0) for the purpose of grammar checking. The authors have reviewed and edited the output and take full responsibility for the content of this publication.
Conflicts of Interest
The authors declare no conflicts of interest.
Abbreviations
The following abbreviations are used in this manuscript:
| Abbreviation | Definition |
| AUC | Area Under the Curve |
| BDM | Biomass Dynamic Model |
| BMSY | Biomass at Maximum Sustainable Yield |
| COM | Catch-Only Model |
| CPUE | Catch Per Unit Effort |
| CV | Coefficient of Variation |
| FAO | Food and Agriculture Organisation |
| FMSY | Fishing Mortality at Maximum Sustainable Yield |
| FLR | Fisheries Library in R (R-based assessment toolbox) |
| HAF | Hierarchical Assessment Framework |
| ICES | International Council for the Exploration of the Sea |
| JABBA | Just Another Bayesian Biomass Assessment |
| MSE | Management Strategy Evaluation |
| MSY | Maximum Sustainable Yield |
| OM | Operating Model |
| PPM | Prior Predictive Model |
| SPR0 | Unfished Spawner-Per-Recruit Potential |
| SSB | Spawning Stock Biomass |
| SRR | Stock-Recruitment Relationship |
| SS3 | Stock Synthesis (assessment framework) |
Appendix A

Figure A1.
Production functions for the ICES FLR stock database, derived from spawning stock biomass and exploitable biomass, assuming either a Beverton and Holt or Ricker stock-recruitment relationship.
Figure A1.
Production functions for the ICES FLR stock database, derived from spawning stock biomass and exploitable biomass, assuming either a Beverton and Holt or Ricker stock-recruitment relationship.

References
- Hilborn, R.; Amoroso, R.O.; Anderson, C.M.; Baum, J.K.; Branch, T.A.; Costello, C.; De Moor, C.L.; Faraj, A.; Hively, D.; Jensen, O.P.; et al. Effective fisheries management instrumental in improving fish stock status. Proc. Natl. Acad. Sci. USA 2020, 117, 2218–2224. [Google Scholar] [CrossRef]
- Reeves, R.R. The origins and character of ‘aboriginal subsistence’ whaling: A global review. Mamm. Rev. 2002, 32, 71–106. [Google Scholar] [CrossRef]
- Caddy, J.F.; Agnew, D.J. An overview of recent global experience with recovery plans for depleted marine resources and suggested guidelines for recovery planning. Rev. Fish Biol. Fish. 2004, 14, 43–112. [Google Scholar] [CrossRef]
- Garcia, S.M.; Zerbi, A.; Aliaume, C.; Do Chi, T.; Lasserre, G. The Ecosystem Approach to Fisheries. Issues, Terminology, Principles, Institutional Foundations, Implementation and Outlook; FAO Fisheries Technical Paper, No. 443; Food and Agriculture Organization: Rome, Italy, 2003; pp. 1–71. [Google Scholar]
- Sissenwine, M.P.; Shepherd, J.G. An alternative perspective on recruitment overfishing and biological reference points. Can. J. Fish. Aquat. Sci. 1987, 44, 913–918. [Google Scholar] [CrossRef]
- Punt, A.E.; Campbell, R.A.; Smith, A.D.M. Evaluating empirical indicators and reference points for fisheries management: Application to the broadbill swordfish fishery off eastern Australia. Mar. Freshw. Res. 2001, 52, 819–832. [Google Scholar] [CrossRef]
- Miethe, T.; Pitchford, J.W.; Dytham, C.; Righton, D. Reference points for the length-based indicator Lmax5% for use in the assessment of data-limited stocks. ICES J. Mar. Sci. 2019, 76, 2125–2139. [Google Scholar]
- Earle, M. Maximum sustainable yield in the EU’s Common Fisheries Policy: A rational approach to fisheries management in practice. ICES J. Mar. Sci. 2021, 78, 2173–2186. [Google Scholar] [CrossRef]
- Elleby, C.; Domínguez, I.P.; Nielsen, R.; Nielsen, M.; Hoff, A. Introducing maximum sustainable yield targets in fisheries could enhance global food security. Commun. Earth Environ. 2025, 6, 33. [Google Scholar] [CrossRef]
- Mildenberger, T.K.; Berg, C.W.; Kokkalis, A.; Hordyk, A.R.; Wetzel, C.; Jacobsen, N.S.; Punt, A.E.; Nielsen, J.R. Implementing the precautionary approach into fisheries management: Biomass reference points and uncertainty buffers. Fish Fish. 2022, 23, 73–92. [Google Scholar]
- Mace, P.M.; Sissenwine, M.P. How much spawning per recruit is enough? Can. J. Fish. Aquat. Sci. 1993, 50, 2548–2556. [Google Scholar]
- Quinn, T.J.; Deriso, R.B. Quantitative Fish Dynamics; Oxford University Press: New York, NY, USA, 1999. [Google Scholar]
- Fischer, S.H.; De Oliveira, J.A.; Mumford, J.D.; Kell, L.T. Risk equivalence in data-limited and data-rich fisheries management: An example based on the ICES advice framework. Fish Fish. 2023, 24, 231–247. [Google Scholar] [CrossRef]
- Edgar, G.J.; Bates, A.E.; Krueck, N.C.; Baker, S.C.; Stuart-Smith, R.D.; Brown, C.J. Stock assessment models overstate sustainability of the world’s fisheries. Science 2024, 385, 860–865. [Google Scholar] [CrossRef]
- Cotter, A.J.R.; Burt, L.; Paxton, C.G.M.; Fernandez, C.; Buckland, S.T.; Pan, J.X. Are stock assessment methods too complicated? Fish Fish. 2004, 5, 125–154. [Google Scholar] [CrossRef]
- Maunder, M.N.; Piner, K.R. Contemporary fisheries stock assessment: Many issues still remain. ICES J. Mar. Sci. 2015, 72, 7–21. [Google Scholar] [CrossRef]
- Ralston, S.; Punt, A.E.; Hamel, O.S.; DeVore, J.D.; Conser, R.J. A meta-analytic approach to quantifying scientific uncertainty in stock assessments. Fish. Bull. 2011, 109, 217–231. [Google Scholar]
- Li, C.; Deroba, J.J.; Miller, T.J.; Legault, C.M.; Perretti, C.T. An evaluation of common stock assessment diagnostic tools for choosing among state-space models with multiple random effects processes. Fish. Res. 2024, 273, 106968. [Google Scholar] [CrossRef]
- Froese, R.; Pauly, D. Taking stock of global fisheries. Science 2024, 385, 824–825. [Google Scholar] [CrossRef]
- Ward, E.J.; Holmes, E.E.; Thorson, J.T.; Collen, B. Complexity is costly: A meta-analysis of parametric and non-parametric methods for short-term population forecasting. Oikos 2014, 123, 652–666. [Google Scholar] [CrossRef]
- Wang, S.P.; Maunder, M.N.; Aires-da-Silva, A. Selectivity’s distortion of the production function and its influence on management advice from surplus production models. Fish. Res. 2014, 158, 181–193. [Google Scholar] [CrossRef]
- Ovando, D.; Free, C.M.; Jensen, O.P.; Hilborn, R. A history and evaluation of catch-only stock assessment models. Fish Fish. 2022, 23, 616–630. [Google Scholar] [CrossRef]
- Roa-Ureta, R.H.; Amorim, P.; Segurado, S. Probability ogives for trends in stock biomass and fishing mortality from landings time series. Fish Fish. 2024, 25, 823–836. [Google Scholar] [CrossRef]
- Kell, L.T.; Minto, C.; Gerritsen, H.D. Evaluation of the skill of length-based indicators to identify stock status and trends. ICES J. Mar. Sci. 2022, 79, 1202–1216. [Google Scholar] [CrossRef]
- Kell, L.T.; Sharma, R. An evaluation of the robustness of length-based stock assessment approaches for sustainable fisheries management in data and capacity limited situations. Sustainability 2025, 17, 4791. [Google Scholar] [CrossRef]
- Kuparinen, A.; Mäntyniemi, S.; Hutchings, J.A.; Kuikka, S. Increasing biological realism of fisheries stock assessment: Towards hierarchical Bayesian methods. Environ. Rev. 2012, 20, 135–151. [Google Scholar] [CrossRef]
- Hordyk, A.R.; Loneragan, N.R.; Prince, J.D. An evaluation of an iterative harvest strategy for data-poor fisheries using the length-based spawning potential ratio assessment methodology. Fish. Res. 2015, 171, 20–32. [Google Scholar] [CrossRef]
- Sharma, R.; Barange, M.; Agostini, V.; Barros, P.; Gutierrez, N.L.; Vasconcellos, M.; Fernandez Reguera, D.; Tiffay, C.; Levontin, P. (Eds.) Review of the State of World Marine Fishery Resources—2025; FAO Fisheries and Aquaculture Technical Paper, No. 721; FAO: Rome, Italy, 2025. [Google Scholar] [CrossRef]
- Xia, M.; Carruthers, T.; Kindong, R.; Dai, L.; Geng, Z.; Dai, X.; Wu, F. How can information contribute to management? Value-of-information (VOI) analysis on Indian Ocean striped marlin (Kajikia audax). Front. Mar. Sci. 2021, 8, 646174. [Google Scholar] [CrossRef]
- Mäntyniemi, S.; Kuikka, S.; Rahikainen, M.; Kell, L.T.; Kaitala, V. The value-of-information in fisheries management: North Sea herring as an example. ICES J. Mar. Sci. 2009, 66, 2278–2283. [Google Scholar] [CrossRef]
- Hansen, G.J.A.; Jones, M.L. The value-of-information in fishery management. Fisheries 2008, 33, 340–348. [Google Scholar] [CrossRef]
- Chen, Y.; Chen, L.; Stergiou, K. Impacts of data quantity on fisheries stock assessment. Aquat. Sci. 2003, 65, 92–98. [Google Scholar] [CrossRef]
- Hodges, J.S.; Dewar, J.A.; Center, A. Is It You or Your Model Talking? A Framework for Model Validation; RAND Corporation: Santa Monica, CA, USA, 1992. [Google Scholar]
- Saltelli, A.; Bammer, G.; Bruno, I.; Charters, E.; Di Fiore, M.; Didier, E.; Nelson Espeland, W.; Kay, J.; Lo Piano, S.; Mayo, D.; et al. Five ways to ensure that models serve society: A manifesto. Nature 2020, 582, 482–484. [Google Scholar] [CrossRef]
- Mackinson, S.; Brigden, K.; Craig, J.; Clarke, E.D.; Angus, C.; Pert, C.C. The road to incorporating Scottish pelagic industry data in science for stock assessments. Front. Mar. Sci. 2023, 10, 1075345. [Google Scholar] [CrossRef]
- Maunder, M.N.; Punt, A.E. A review of integrated analysis in fisheries stock assessment. Fish. Res. 2013, 142, 61–74. [Google Scholar] [CrossRef]
- Kell, L.T.; Mosqueira, I.; Grosjean, P.; Fromentin, J.M.; Garcia, D.; Hillary, R.; Jardim, E.; Mardle, S.; Pastoors, M.A.; Poos, J.J.; et al. FLR: An open-source framework for the evaluation and development of management strategies. ICES J. Mar. Sci. 2007, 64, 640–646. [Google Scholar] [CrossRef]
- Nielsen, A.; Berg, C.W. Estimation of time-varying selectivity in stock assessments using state-space models. Fish. Res. 2014, 158, 96–101. [Google Scholar] [CrossRef]
- Methot, R.D., Jr.; Wetzel, C.R. Stock synthesis: A biological and statistical framework for fish stock assessment and fishery management. Fish. Res. 2013, 142, 86–99. [Google Scholar] [CrossRef]
- Thorson, J.T. Predicting recruitment density dependence and intrinsic growth rate for all fishes worldwide using a data-integrated life-history model. Fish Fish. 2020, 21, 237–251. [Google Scholar] [CrossRef]
- Winker, H.; Carvalho, F.; Kapur, M. JABBA: Just Another Bayesian Biomass Assessment. Fish. Res. 2018, 204, 275–288. [Google Scholar] [CrossRef]
- Gabry, J.; Simpson, D.; Vehtari, A.; Betancourt, M.; Gelman, A. Visualization in Bayesian workflow. J. R. Stat. Soc. Ser. A Stat. Soc. 2019, 182, 389–402. [Google Scholar] [CrossRef]
- Cortés, E. Life history patterns and correlations in sharks. Rev. Fish. Sci. 2000, 8, 299–344. [Google Scholar] [CrossRef]
- Hanley, J.A.; McNeil, B.J. The meaning and use of the area under a receiver operating characteristic (ROC) curve. Radiology 1982, 143, 29–36. [Google Scholar] [CrossRef]
- Zhou, X.H.; Obuchowski, N.A.; McClish, D.K. Statistical Methods in Diagnostic Medicine, 1st ed.; Wiley-Interscience: New York, NY, USA, 2002. [Google Scholar] [CrossRef]
- Alouche, O.; Tsoar, A.; Kadmon, R. Assessing the accuracy of species distribution models: Prevalence, kappa and the true skill statistic (TSS). J. Appl. Ecol. 2006, 43, 1223–1232. [Google Scholar] [CrossRef]
- Peirce, C.S. The numerical measure of the success of predictions. Science 1884, 93, 453–454. [Google Scholar] [CrossRef]
- Massiot-Granier, F.; Prévost, E.; Chaput, G.; Moore, J.-S.; Otero, J.; Taylor, J. Embedding stock assessment within an integrated hierarchical Bayesian life cycle modelling framework: An application to Atlantic salmon in the northeast Atlantic. ICES J. Mar. Sci. 2014, 71, 1653–1670. [Google Scholar] [CrossRef]
- Maunder, M.N.; Punt, A.E. Challenges in stock assessment for data-limited fisheries. Fish. Res. 2015, 188, 139–157. [Google Scholar]
- Sagarese, S.R.; Ralston, S.; Field, J.C. Moving beyond “catch-only” models: A framework for data-limited stock assessment. Fish. Res. 2018, 204, 289–297. [Google Scholar]
- Chong, L.; Punt, A.E.; Dichmont, C.M. Uncertainty and bias in data-limited stock assessments: Quantifying confidence in reference points. Mar. Policy 2020, 120, 104117. [Google Scholar]
- Ono, K.; Punt, A.E.; Rivot, E. Model performance analysis for Bayesian biomass dynamics models using bias, precision and reliability metrics. Fish. Res. 2012, 125–126, 173–183. [Google Scholar] [CrossRef]
- Miyagawa, M.; Okamura, H.; Ichinokawa, M. Which fisheries and biological factors affect the misclassification of stock status determined by data-limited methods? Fish. Res. 2023, 257, 106491. [Google Scholar] [CrossRef]
- Dai, L.; Zhou, S.; Smith, A.D.M.; Zhang, A.; Li, T.; Yin, S.; Wang, Y. Evaluating Catch-Only Methods to Inform Fisheries Management: Testing and Calibration Using Data-Rich Stocks. Front. Mar. Sci. 2022, 9, 939177. [Google Scholar] [CrossRef]
- Cope, J.M. The good practices of practicable alchemy in the stock assessment continuum: Fundamentals and principles of analytical methods to support science-based fisheries management under data and resource limitations. Fish. Res. 2024, 270, 106859. [Google Scholar] [CrossRef]
- Rangel, A.; Camerer, C.; Montague, P.R. A framework for studying the neurobiology of value-based decision making. Nat. Rev. Neurosci. 2008, 9, 545–556. [Google Scholar] [CrossRef] [PubMed]


Disclaimer/Publisher’s Note: The statements, opinions and data contained in all publications are solely those of the individual author(s) and contributor(s) and not of MDPI and/or the editor(s). MDPI and/or the editor(s) disclaim responsibility for any injury to people or property resulting from any ideas, methods, instructions or products referred to in the content. |
© 2025 by the authors. Licensee MDPI, Basel, Switzerland. This article is an open access article distributed under the terms and conditions of the Creative Commons Attribution (CC BY) license (https://creativecommons.org/licenses/by/4.0/).