Abstract
This study analyzes how environmental, social and governance (ESG) factors affect the valuation of listed companies in Central Europe. It therefore validates the financial incentives for corporates in this region to embark on or continue with sustainable business models. It discusses the theoretical foundations of the impact of ESG factors on company value, examining both firm- and investor-centered approaches. The empirical section analyzes the main market valuation indicators based on earnings per share, book value, enterprise value and EBITDA for all companies listed on stock exchanges in the region for which Sustainalytics ESG risk ratings were calculated. The econometric modeling uses the generalized least squares method. The research evidences that companies with strong ESG risk ratings, reflecting sustainable business models, trade at a premium vs. their ESG-weaker peers. This suggests that investors place significant value on sustainability and effective ESG risk management practices. Additionally, this study reveals a non-linear relationship between ESG ratings and market valuations. While investors may show less differentiation among companies with low ESG risk, they impose substantial penalties on those with poor ESG management. From a practical perspective, the findings support investing in ESG risk management and corporate governance as effective strategies to raise company valuation and generate financial benefits for shareholders. The study also indicates that ESG ratings can be applied in forecasting company valuations, which is an important consideration for investors. This study makes an original contribution by providing insights focused on Central European markets, where empirical research on sustainability standards remains in the early stages of development.
1. Introduction
This study investigates whether the share prices on Central European stock exchanges are consistent with the hypothesis that factors related to environmental and social governance (ESG) factors are having a material impact on companies’ financial performance and, consequently, on valuations. This will indirectly answer the question of whether sustainability risk remains relevant for investors in Central Europe (CE), where ESG remains a relatively nascent topic.
Consequently, the study provides a regional perspective of the ongoing debate as to whether ESG factors have a robust material impact on the company valuation and consequently should be incorporated into asset pricing models. While there is increasing evidence that there is at least a non-negative relationship between ESG performance and company valuation, the evidence from less advanced markets remains fairly fragmented, which motivated the present research.
As ESG remains a relatively nascent topic in the CE market, this study focuses on the easiest source of information for investors, namely ESG reporting and ratings. This perspective assumes that investors would first integrate the information that is easiest to obtain and does not require additional costs or significant additional analysis. This study provides evidence that, even in markets where the ESG dialog is at an early stage, ESG ratings can have a significant impact on the valuation of companies. It contributes to the debate on whether ESG issues can translate into higher company valuations in the context of Central European (CE) stock markets.
The remainder of this study is organized as follows. First, we frame the research topic in the context of observed business practices as well as previous theoretical and empirical research. The review also discusses the concept of the TCFD reporting standard and ESG rating. The first section is concluded by narrowing down the key research propositions. The second section presents the research methodology, while the subsequent section presents the results and discusses the main findings. This is followed by concluding remarks.
1.1. Empirical Evidence
Fifteen years have already passed since the United Nations Global Compact survey evidenced that over 90% of approx. 1000 chief executive officers around the world consider environmental, social and governance (ESG)-related aspects critical for the success of businesses (UNGC, [1]). The physical data has reaffirmed the increase in the average global temperatures of over 1 °C above pre-industrial averages (Bilgili et al. [2]), consecutive years of increasing sea levels (Barrow-Gilies et al. [3]) and increased frequency and strength of extreme weather events (Alifu, H. [4]), which have clear and frequently direct impacts on business operations. Despite this, many companies are still only considering adapting their business models to climate change.
On a positive note, the growing awareness of the potential impacts of climate change is beginning to translate into increased shareholder interest in how companies examine their operations and validate the resilience of their business models. The last decade has revealed the massive impact that climate change can have on not only business, but also the entire economy. This includes physical risks, as the increasing frequency of extreme weather events not only multiplies insurance costs but also lead to regular business disruptions and undermine core business operations.
Empirical evidence confirms that both companies and investors are increasingly focusing on environmental, social and governance (ESG) factors. McKinsey reported [5] that more than 90% of S&P 500 companies already regularly publish ESG reports, while PWC [6] forecasts that ESG-focused institutional investments are on track to reach USD 33.9 trillion by 2026. An IFAC survey [7] evidenced that 95% of 1350 large companies already cover ESG issues in their regular reporting, with two-thirds seeking external certification. As evidenced by Nosratabadi et al. [8], stakeholder interest also reflects the growing focus of environmental and business research on sustainable business models. This prompts the question as to whether this increased focus of the business and research community is motivated by true financial considerations (as evidenced by Falcle et al. [9]), or is more of a bubble or a fad (Ooi et al. [10]) that can consequently be seen as a passing trend from a rational investor perspective.
Until recently, ESG reporting was largely voluntary. In recent years, however, a growing number of public authorities and reporting organizations have introduced formal requirements in this respect. This seems justified as a public sector requirement, as authorities—faced with climate risks at the macro level—need granular information to assess risks and decide on appropriate policies. However, it is important to note that even pure accounting associations, which do not have such a macro agenda, are also trying to push companies towards more comprehensive ESG reporting (examples include the sustainability standards S1 and S2 introduced into IFRS reporting). This reaffirms that climate-related information is treated as not only of interest to external stakeholders, but also material for the company itself or its shareholders. With the growing need for mandatory reporting, investors are increasingly trying to factor this data into their investment decisions.
1.2. Literature Context
Historically, as Hart and Zingales [11] pointed out, the corporate finance literature has integrated environmental, social and governance issues along two main streams: shareholder value and stakeholder theory. The stakeholder approach is based on the concept of corporate and social responsibility, and argues that customers and shareholders are increasingly demanding that companies integrate non-financial objectives into their operations and thus have a social duty to contribute to combating climate change. The shareholder perspective, on the other hand, focuses only on the monetary aspect, arguing that ESG management should represent a tangible increase in value.
Research has focused on the link between ESG factors and financial performance or investment premiums, leaving aside the non-financial aspects (such as those reflected in stakeholder theory; represented, e.g., by Ioannou and Serafeim [12]). We believe that such a financial perspective is more in line with the perspective of investors in the stock market, where the underlying paradigm is that companies should remain focused on maximizing financial value for their shareholders and where the non-financial objectives are seen more as additional tools that can help to achieve the desired financial outcome. The latter means that, even if some ESG aspects are considered non-financial, a de facto monetary value can be assigned to them by quantifying their indirect effects (e.g., consumer preferences for ESG-conscious brands can be indirectly captured through increased sales for companies that offer them). Following the meta-analysis by Atz et al. [13], the discussion is organized along a distinction between firm- and investor-centered approaches.
1.2.1. ESG Impact of the Firm’s Financials
The firm-centered approach addresses the question of whether the appropriate inclusion of ESG issues into corporate strategy planning and—as a first step—into corporate reporting can materially improve a company’s financial performance. Consistent with previous meta-analyses, Atz et al. [13] concluded that there is a strong positive relationship between sustainability and financial performance. This finding appears to be broadly consistent with most theoretical research. The literature identifies several channels (Giese et al. [14]) through which the management of ESG factors may affect financial outcomes.
The first—deeply rooted in risk management theory—argues that ESG management allows companies to better identify and consequently better manage their risks. Given that ESG issues translate into incremental risk factors, ESG management helps to identify so-called acute and systemic risks. Incorporating an ESG framework starts with a more accurate understanding of these risks and, as a result, leads directly to an improvement in corporate risk management practices (Kanno [15]). Most recently, Dobrick et al. [16] evidenced that risk factors related to all three core dimensions of ESG are relevant explanatory variables in multifactor asset pricing models across all considered geographies.
The increased awareness that results from the implementation of an ESG framework within a company acts de facto as additional information, replacing some of the uncertainty of future outcomes with quantifiable risks. This information can then be used by companies to make informed decisions about which risks they are justified to take and which to reduce. In particular, the analysis of acute risks helps to identify and manage risks of sudden loss of value (Hoepner et al. [17]) and to decide which of them need to be insured, while the analysis of systemic risks enables preparation for medium- or long-term cost and revenue drivers; for example, by gaining a better understanding of possible regulatory actions (Bax et al. [18]). Such additional information should lead to better forecasting of related changes and, thus, limit the unintended impact of such risks on the volatility of the company’s results.
Secondly, increased ESG awareness can contribute to cost optimization. More informed management of climate-related costs and better social policies and governance practices can be expected to more than offset the associated governance costs (Nurn and Tan [19]). This typically includes a reduction related to lower environmental penalties or fees that companies can better predict and therefore avoid, especially in the context of evolving environmental regulations (Henisz and McGlinch, [20]).
While these initial two channels are focused on optimizing the existing business model, the subsequent ones are based on the assumption that an ESG framework can be integrated into the overall management of the company, not just risk management. As such, it is assumed that the framework can also contribute to earnings and better strategic management, ultimately leading to the definition of a new, more sustainable business model. This logic is also reflected in the TCFD recommendations, which accompany one of the most common comprehensive ESG frameworks (see Figure 1). The TCFD [21] approach encourages companies to place ESG management directly under the C-suite, effectively requiring management to consider not only the risks and costs associated with ESG factors but also the opportunities created by the ESG context. This means that ESG management becomes an incremental part of defining the company’s strategy, which can have a longer-term impact on revenues and profitability.
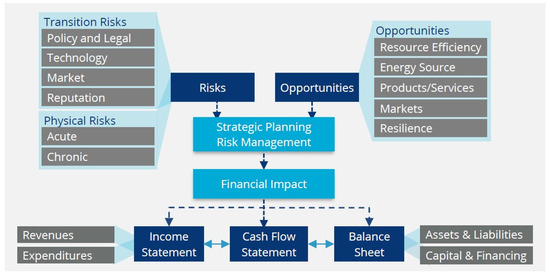
Figure 1.
TCFD framework for climate-related risks, opportunities and financial impacts, as per TCFD Report [21] p. 8.
Following this logic, the adoption of an ESG approach may lead to more optimal strategy adjustments. With the TCFD approach, companies gain longer-term awareness of ESG issues, which is expected to lead to more optimal investment choices (see, e.g., Alsayegh et al. [22], Riding and Mooney [23]). Companies that are better able to analyze future ESG trends may avoid being locked into declining technologies and may be more adept at becoming leaders in solutions that are increasingly profitable in the context of climate change and sustainable business model challenges. This positively impacts capital allocation.
Focusing on opportunities can also help to increase revenues. Companies aware of the ESG context can identify new products earlier or differentiate their product range or target market earlier (Henish et al. [20]) to benefit from trends, which typically more than offsets the loss of revenues from conventional business operations. In addition, companies adopting an integrated ESG approach would typically not miss out on quick payback investments that promote resource efficiency. Customer focus (de facto embedded in the S and G elements of the ESG approach) can help to strengthen the brand, which can be crucial to building competitive advantage and avoiding reputational costs (Nobanee et al. [24]) or building competitiveness among future employees and business partners.
Lastly, the channels also include the impact on financing costs. There is growing evidence that some financing instruments (particularly green bonds) allow companies to obtain financing at a more attractive cost compared to less ESG-conscious competitors, which at least leads to a lower weighted average cost of capital. This is partly due to the fact that many investors are tied to ESG-aware incentive strategies, which can give a company priority for selection by portfolio investors (Amel-Zadeh and Serafeim [25]). Particularly in slightly shallower funding markets, the sustainable business model may face greater availability of funding than those dealing with the difficult legacy of emissions and lacking adequate ESG processes (El Ghoul et al. [26]). There is also some limited evidence of the so-called positive feedback loop, meaning that the inclusion of ESG frameworks incentivizes stakeholders to provide relevant information, which further reduces the asymmetry and may lead to improvements in the company’s practices (Sulkowski [27]). Interestingly, De Lucia et al. [28] showed that the positive channel is strongest when firms focus on promoting higher employee productivity, including implementing equal opportunity policies. Finally, in the context of Central Europe, it is important to highlight the role of compliance with business partners’ standards. There is an increasing number of global players who would reject a competitively priced product from a supplier that may be significantly behind its competitors in terms of its emissions footprint.
An interesting stream of research is also focused on investigating the link between specific ESG actions of the companies and their financial performance. For example, Angelaki et al. [29] highlighted a strong correlation between green computing practices and improved economic outcomes. On the other hand, there is also growing evidence of so-called “greenwashing” (as documented, e.g., by Badhwar et al. [30]), where corporate actions seem to be more related to positive publicity, while their sustainability impact remains questionable.
1.2.2. ESG Impact on Investors’ Returns
Virtually all channels that improve financial results or forecast accuracy ultimately lead to an increase in a company’s valuation. From an investor’s perspective, all the above channels should have a positive impact on the risk–return profile, leading to higher valuations. The key question for an investor is to what extent such additional information translates into higher returns. If (as per classical investment theory) such ESG improvements are already in place and their value is properly reflected in the share price, the resulting higher valuation may be more difficult for an investor to monetize.
The second argument remains focused on the risk—reward concept. The implementation of ESG reporting contributes to increased transparency of ESG risks and opportunities, thereby reducing agency costs and the information gap between the company and its stakeholders (Carroll and Shabana [31]). More directly, as evidenced by Puente de la Vega Caceres [32], it can also contribute to the decrease in operational, compliance and financial costs. Finally, it also contributes to a better risk—reward for shares of companies with higher ESG standards compared to the blind pool.
A counterargument to this theory is that an increasing number of investors face certain climate-related investment constraints. To the extent that such constraints are not purely risk/reward-driven, this may translate into a higher demand for shares of companies with higher ESG standards. This, in turn, may already be inflating entry prices, largely offsetting the investment benefits mentioned above. There is already considerable evidence (e.g., Khan et al. [33] and Barka et al. [34]) that ESG factors can play a role in the mispricing of companies and therefore be seen as market friction. Moreover, there is also growing evidence that investors have learned to distinguish greenwashing and, thus, impact valuation is penalizing such practices (see Xu [35] for a recent review).
Compared to the firm-centered evidence, the literature on the existence of higher returns is much less conclusive. In their meta-analysis, Atz et al. [13] found that only about 38% out of 3000 of the analyzed studies published after 2015 show a difference in returns between ESG and conventional investments. This is in line with the earlier findings of Revelli and Viniani [36], who found no costs or benefits of socially responsible investing. Consequently, there seems to be insufficient evidence for the existence of a so-called ESG alpha. This may not be inconsistent with the thesis of higher valuation but may also be related to so-called “green bubbles” phenomena, as discussed, for example, by Ghosh et al. [37]. If such overvaluation of stocks based on their ESG profile is present at the investors’ entry, then such an investor will not face higher returns unless such premiums increase during their investment period.
1.2.3. Literature Coverage of Various ESG Measures and Geographical Markets
When comparing the methodologies used in ESG studies, there are significant differences in the variables used as a proxy for ESG standards and ESG-related risks.
The first group of studies focuses on business-model-related risks. Such studies typically allow for some cross-industry comparisons and focus on SIC codes or key environmental KPIs (e.g., emissions levels or production volumes) as the main variables. The second group of studies seeks to answer the question of whether ESG awareness and standards at the company level can lead to differentiation in their financial performance or returns. Such research typically uses sustainability indices, quality of ESG reporting or certification outcomes. Examples include the use of the MSCI KLD index as a proxy for ESG standards in the analysis of green bonds (Bauer and Hann [38]). As pointed out by van Zaaten [39] most recent studies are also increasingly using variables with the aim of measuring the direct contribution to the Sustainable Development Goals (Bauckloh et al. [40]), partly in response to the critiques that ESG risks cannot really be seen as a measure of the environmental and social performance (e.g., Busch et al. [41]). A novel approach has been presented by Gerefalakis and Dimitras [42], where the authors offer a methodology that includes not only a weighting scheme for ESG factors but also allows the integration of the quality measure of the narrative information stemming from corporate reporting.
As mentioned in the Introduction, empirical research varies considerably in the geographical and sectoral scope. While there are numerous studies on US (Fatemi et al. [43]), UK (Li et al. [44]) and European firms (including Verbeeten et al. [45] for German and Koundouri et al. [46] for companies included in the STOXX Europe ESG Leaders index), there is also an increasing number of studies covering developed local markets. Examples include Zheng et al. [47], Zhao et al. [48] and Xu et al. [49] covering China; da Silva and de Mascena [50] covering Brazil; Naimy et al. [51] covering Asia and Al-Hiyari and Kolsi [52] and Chininga et al. [53] covering Africa. There is also a distinct research focus on specific industries. Examples include Bătae et al. [54] with a focus on European banks, Simsek and Cankaya [55] who studied banks from G8 countries, Naeem et al. [56] on energy companies, Sandberg et al. [57] with a focus on the food industry and Petelos [58] et al. looking at agriculture and tourism. While the overall results tend to consistently show ESG awareness as one of the drivers of firm value, local research can provide a better understanding of the nature of this impact. The local market characteristics, such as the design of political institutions and integration into global value chains, can influence both the strength and the nature of the interdependence between ESG and financial performance (Friede et al. [59], Gillan at al. [60]).
To this end, empirical research on the impacts of ESG factors on stock market valuation remains particularly fragmented in Central Europe, where companies have been relatively late in adopting ESG practices compared to more advanced economies. The results so far are mixed. In the firm-centered approach, several authors such as Czaja-Cieszyńska and Kordela [61], Czerwińska and Kaźmierkiewicz [62] and Janicka and Sajnóg [63] find a positive correlation between ESG reporting practices and firm valuation, while others such as Tarczyńska-Luniewska et al. [64] and Buła et al. [65] do not find a strong case for implementing ESG practices, and a comparative analysis by M. Baran et al. [66] shows significant differences in impact even within a small sample of companies. Such mixed findings may be related to the fact that, as Chojnacka and Jadanowska [67] show, early adoption of ESG practices remains predominantly regulatory-driven. Such a regulatory rather than a risk- or management-driven approach may slow down the actual business impact of such practices. Jabłecki [68] provided some specific arguments showing slightly lower financing costs for ESG-conscious companies. At the regional level, a study by Siwiec and Karkowska [69] found a positive relationship between the disclosure of ESG activities and the financial performance of companies as measured by ROA, suggesting that the relationship is strongest for financial companies.
Regarding the investor-centered approach, Liberadzki et al. [70] provided some positive evidence (based on both case studies and a large sample). On the regional front, M. Hadaś-Dyduch et al. [71] showed many similarities between Poland and the Visegrád countries. The study by Chen et al. [72] suggests that the relationship is stronger for large firms, while the empirical evidence is insignificant for smaller firms.
Consequently, these authors conclude that empirical research verifying the link between ESG standards and market valuations remains relatively underdeveloped in Central Europe, which justifies a contribution to filling the research gap in this area. In line with the findings of the firm and investor-centered research, we decided to focus on verifying the link between ESG issues and financial performance as this is most relevant from a management perspective and most appropriate at the stage when companies are still assessing the depth of the ESG approach to be implemented.
1.3. Research Hypothesis
In this study, we investigate the hypothesis that companies with strong ESG performance (as represented by a better ESG risk rating) tend to trade at a premium relative to their peers in less developed markets such as Central European ones. Confirmation of this hypothesis would suggest that ESG ratings provide a robust proxy for measuring the net impact of the “discount” reflected in companies’ valuations that can be attributed to a higher overall level of climate risk affecting a particular company or its business model, with the “premium” offered to those who can best manage these risks. This research follows a similar study, narrowed to Polish companies, by Chmielewska and Kluza [73], which found a relatively robust positive relationship between a better ESG risk rating and higher company market valuation, measured by P/BV and enterprise value to EBITDA ratios, for the largest companies listed on the Warsaw Stock Exchange (members of the WIG20 and mWIG40 indices).
Companies listed on CE markets remain relatively diversified, both in terms of size and the sectors they represent. The underlying business models present different levels of vulnerability to climate change, social and governance issues and consequently different levels of ESG risk exposure. Similarly, while many of the companies are well integrated into international value chains, there remains a relatively large group whose activities remain focused on local or regional markets. These factors alone mean that companies differ significantly in their awareness of ESG-related management issues and are subject to different formal or informal (e.g., capital group-driven) reporting obligations.
For the above reasons, we believe that it would be premature to expect a granular understanding of various ESG issues in these markets, so the focus of this study was to understand whether one could make a credible financial case for improving companies’ ESG practices. A key research challenge is the fact that a significant proportion of the companies listed on these exchanges are neither rated for ESG nor do they provide regular ESG reporting.
Similarly, as companies listed on Central European stock exchanges are typically relatively new to ESG reporting, it is difficult to identify tangible environmental indicators (other than possibly Scope 1 CO2 emissions) that would be consistently reported by a large group of companies. For these reasons, we chose to use external ratings rather than individual disclosure aspects. The Sustainalytics risk rating was selected given the availability of data. This rating captures both “exposure to material industry-specific ESG risks and an issuer’s management of these risks” (Sustainalytics [74]).
2. Materials and Methods
The analysis covers companies with a Sustainalytics ESG risk rating listed on the Warsaw Stock Exchange (Poland), Prague Stock Exchange (Czech Republic), Budapest Stock Exchange (Hungary), Bucharest Stock Exchange (Romania) and Ljubljana Stock Exchange (Slovenia). The selection of markets was driven by their similar development phase and business environment background (all selected countries are already EU members but still face some legacy issues related to their previous transition out of the post-Soviet bloc), which justifies the initial hypothesis that companies from this region are likely to be viewed by investors through similar optics.
Similarly to Koundouri et al. [46], to test the hypothesis presented in Section 1.2, the valuation of companies as reflected in commonly used (in the capital market context) valuation multiples was analyzed in this study. The authors selected P/E (price to earnings per share), P/BV (price to book value per share), EV/EBITDA (enterprise value to earnings before interest, taxes, depreciation and amortization) and EV/Revenues (enterprise value to revenues) ratios as those which are most widely used in capital market analysis in CE.
To avoid the risk of bias of random data points, the valuations reflected recent share price performance (measured as a two-month average over June and July 2024) and the most recent financial results available.
2.1. ESG Risk Rating
The ESG risk rating developed by Morningstar Group’s Sustainalytics [74] was used as an explanatory variable (“Rating”). This rating represents the overall level of ESG risk to which a company is exposed, as well as the adequacy of the company’s management of these risks. As explained below, this measure captures both the unmanageable risk, which cannot be easily mitigated but needs to be understood and quantified, and the manageable risk that the company is able to manage effectively. To this end, the methodology estimates based on the company’s business model the overall ESG risk level that company is exposed to but also identifies the manageable part of such risk. In parallel, based on the review of company’s ESG and risk management practices, it estimates the level of ESG risks that are effectively managed by this company. This allows the creation of a consolidated rating, which measures (i) the scale of ESG risks, understood as the balance ESG threats and opportunities that characterize the company’s operations (company’s exposure in Figure 2), (ii) the quality of the company’s ESG management approach (understood as the efficiency with which the company handles manageable part of such exposure—managed risks in Figure 2) and (iii) the gap in the ESG risk management (a sum of unmanageable risks the company is exposed to and the residual amount of manageable risk that the company fails to effectively control—unmanaged risks in Figure 2).
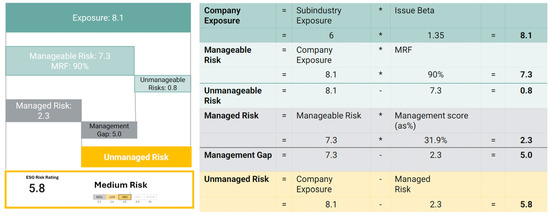
Figure 2.
Scoring structure for Sustainalytics ESG risk ratings, Sustainalytics [74].
Morningstar’s rating methodology consists of two steps. The first identifies the key ESG risk factors affecting a particular sub-sector and assesses the company’s exposure to these specific factors across four key layers (products, financials, events and geography). The second aspect evaluates how the company addresses these factors by analyzing the so-called management gap, which represents the appropriate actions that have not yet been taken in such a company to understand the risks and manage the controllable part. The methodology for calculating the aggregated risk score is illustrated in Figure 2.
Based on this aggregated risk measure, the companies were then grouped onto the rating scale, where a higher (worse) rating value can consequently mean higher ESG risk and/or lower management quality. Conversely, a lower rating (better rating) means lower environmental, social and governance vulnerability of the company’s business model and better ESG practices implemented in the company (Sustainalytics [74]).
2.2. Data Sample and Variable Used
It is important to note that there is a limited number of companies with these ESG risk scores on the stock exchanges analyzed. This reflects the immaturity of these markets in terms of the implementation of ESG practices. All 83 of these companies were included in this research. While the sample may appear relatively small, it was considered important to capture stocks that remain fairly liquid. Most of the remaining stocks traded in the Central European exchanges are either highly illiquid or miss the ESG risk data. Both of those factors would likely result in excessive use of proxy variables, which would inevitably increase bias in the results.
We decided to introduce control variables for the key sectors (in line with some findings in the literature) given that the companies listed on the CE exchanges represent sectors that vary significantly in terms of the severity of climate risks. We also considered adding other control variables (such as beta parameters or size), but ultimately decided to exclude them in order to reduce the risk of spurious correlations or other biases that might artificially increase the fit of the model. Given that ESG risk ratings in CE markets are available for a limited group of the largest and most liquid companies, this group is relatively aligned from this perspective. The variables used in this study together with their sources are presented and explained in Table 1.

Table 1.
Variables used in this study.
2.3. Model Specifications
Four groups of models of the following general form were analyzed in this study. In order to limit the influence of the original differentiation of the variables on the modeling results, in particular, the influence of extreme values (outliers), the independent variable (ESG_Rating) and the dependent variables (Ratio) were logarithmized.
where
Ln(Ratioi) = α + β⋅Ln(ESG_Ratingi)n + Φ SECTORi + εi,
- Ratio: The dependent variable in the individual models—PBV, PE, EVRev and EVEBITDA ratios;
- ESG_Rating: The independent variable, ESG risk rating score;
- SECTOR: A set of dummy variables representing the specific sectors (banks, health, utilities, trade, oil and mining);
- n: The power to which the ESG_Rating variable is raised in the individual models, n = 1, 2, 3 depending on the model;
- i: The i-th company (observation);
- α, β, Φ: Regression coefficients (Φ is a set of coefficients for the respective dummy variables); in the basic model (without SECTOR variables), Φ is set to 0.
- ε: The error term.
Notes: The EV/EBITDA ratio does not apply to banks, so models for this ratio were estimated on the sample excluding banks; for PE models, a dummy variable for Romania was also included in the equation.
The modeling was initially carried out for basic specifications with Φ = 0 using ordinary least squares (OLS) with robust errors. The results obtained for each financial indicator as a single independent variable were encouraging as even in this simplest form, they supported the research hypothesis. However, low R2 values indicated the presence of other independent variables with a significant impact on Y. Consequently, models with industry variables were estimated. The second and third powers of the ESG_Rating variable were also included in the models based on the results of the Ramsey RESET test, which checks whether the linear form of the model (with respect to a quadratic or cubic function) is the best model that can be selected.
In separate procedures, the variables corresponding to each country were checked (these procedures are not included in the publication due its limited size). They did not reveal any differentiation, except for a model with the PE indicator, where Romania stood out as a significant factor (see Section 3: Results).
The generalized least squares (GLS) method was additionally applied in cases where the EV/Revenues and P/E ratios were characterized by the heteroscedasticity of the variance in the error term, which can lead to biased coefficient estimators (see Tables 4 and 5). This is a standard procedure to remove the changing variance of ε that violates OLS assumptions (Greene [75]). GLS models were calculated using the method of Swamy and Arora. The collinearity of the variables was also checked.
3. Results
The modeling carried out provided a number of meaningful results. The direction of the relationship studied can already be observed by analyzing the correlation coefficients between the variables, which are all negative (see Table 2); this is in line with the theory, which suggests that companies with lower (i.e., better) ESG risk have higher valuation.
Table 2.
Linear correlations between ESG_Rating and individual dependent variables.
However, this does not provide detailed information on the statistical significance between the variables. As banks were the most represented companies in the sample (15 companies), the correlations of individual financial ratios with the ESG risk rating are presented for the whole sample and excluding banks. The correlations shown are for the original data, before logarithmization.
Variance inflation factors (VIFs) were then used to check for collinearity of the variables. The variables in each model specification are characterized by the absence of any collinearity; see the last column in Table 3, Table 4, Table 5 and Table 6 for the VIF results for the respective models.
Table 3.
Models for the dependent variable LN_PBV; estimation with robust errors.
Table 4.
Models for the dependent variable LN_PE; estimation with robust errors.
Table 5.
Models for the dependent variable LN_EVRev; estimation with robust errors.
Table 6.
Models for the dependent variable LN_EVEBITDA; estimation with robust errors.
The results from the main modeling, which was carried out based on the methodology described in the previous section, consistently evidenced the existence of a negative interdependence between ESG risk rating and company valuation, i.e., a better (lower) ESG risk rating is associated with a higher company valuation. The best-fitting models for each financial ratio are presented on the right-hand side of the tables, i.e., Table 3 (d), Table 4 (e), Table 5 (e) and Table 6 (d). Figures with quantile-to-quantile residual plots are presented in Appendix A for these models (Figure A1). All these models are characterized by a relatively high R-squared (34–65%), joint significance of the regressors, significance of the ESG rating variable and several control variables and no heteroscedasticity.
The above finding, supported by each model, leads to the conclusion that a better ESG rating (i.e., lower on the Sustainalytics scale) can indeed translate into a premium valuation of the underlying companies relative to the blind pool of listed companies. This result is consistent with 58% of the studies included in the meta-analysis by Whelan et al. [76]. The strongest evidence was confirmed when using price to book value and enterprise value to revenues as proxies for company valuations.
In identifying the best model specification, it is interesting to note that transforming the risk rating variable (“LN_ESG_Rating”) by raising it to the second and third power improves the model parameters; for reference, compare column (b) with columns (c) and (d) in Table 3, Table 4, Table 5 and Table 6. Not only was the statistical significance of the key relationship strengthened, as measured by all information criteria, but the overall R coefficient also improved. Only in the case of EV/EBITDA specifications did the simple logarithm-based specification (see column (a) in Table 6) have a better significance (p-value) of the ESG_Rating variable coefficient than other specifications.
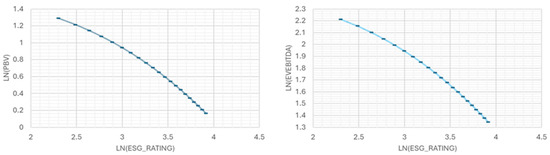
Such non-linearity suggests that companies that either have a significantly higher exposure to climate risk or lag significantly behind their peers in terms of ESG standards may face a higher valuation penalty. At the same time, the ESG premium tends to be relatively moderate as long as the differences in ESG ratings are relatively small and the risk is not considered excessive. The shape of this relationship for the variable LN_ESG_Rating to the power of three is shown in Figure 3. These results are similar to the non-linearity conclusions confirmed by Dayal et al. [77] and Alfalih [78] for other markets. One possible explanation is the popularity of red-flagging as one of the main tools for incorporating ESG information into investment decisions (as shown, for example, by Van Duuren et al. [79]) or the more pronounced role of ESG factors in the case of companies that tend to be over or undervalued (as per Khan et al. [33]).
Another result that is also consistent with previous empirical research (Giese et al. [80]) is the statistical relevance of the industry control variables. This is consistent with the hypothesis that ESG standards are evaluated by investors in the specific industry context. A given industry may trade at a discount or premium relative to the overall market because of its specific climate exposure or because of completely different aspects (prospects, dynamics, strategic importance). This should not undermine the fact that there is some relative premium or discount between companies in the same industry related to how they position their business model with respect to climate risk considerations and how advanced they are in managing the related risk exposure. Therefore, ESG standards should not be assessed in isolation from industry-specific considerations. The industry control variables were the most comparative in the P/BV models with linear and non-linear specifications as this ratio is the most stable over time among those analyzed (see Table 3, columns (b)–(d)).
The inclusion of sector-specific variables may also help to partly address the critique of Bauckloh et al. [40] that the ESG scores may fail to capture the overall risks of the company’s business model as defined in the context of the Sustainable Development Goals. Capturing the industry dummies allows the impact to be recalibrated. It is, however, premature to conclude that the significance of these additional variables signals investors’ sensitivity to the global environmental concerns—i.e., that investors are more likely to pay a premium for companies with truly sustainable business models even vs. true sustainability champions among companies active in a polluting sector. This may, however, be a good starting point for further research.
Another important result relates to regional differentiation. The addition of the country-specific control variables had no significant positive impact on the underlying model specifications. This is consistent with the hypothesis that investors treat CE equities as an aggregate asset class rather than as competing investment opportunities. Especially for the liquid companies, it is expected that the majority of investors are portfolio investors rather than opportunistic stock pickers. At the same time, it is interesting to note that country-specific legacy ESG issues (e.g., coal in Poland and gas in Hungary) do not seem to affect valuations beyond what is already reflected in the ESG rating. The only exception is the Romanian control variable in the specification, where P/E is measured as the dependent variable (see Table 4). At the same time, the inclusion of this variable does not distort the overall characteristics of the other interdependencies, suggesting that the country variable in this example may simply correct the overall valuation for the country-specific aspects (such as investor sentiment or macro factors) that are not necessarily related to ESG. This is consistent with the observation that average P/E valuation levels in Romania do not appear to fully reflect the regional pattern.
Overall, the country-level conclusions provide some positive evidence in favor of continuing joint analyses for the regional markets. However, the above conclusions regarding the country control variables should be taken with a pinch of salt as companies listed on the Warsaw Stock Exchange represent about 70% of the analyzed sample.
The most robust model specifications were obtained overall for the dependent variables P/BV and EV/Revenue. This is not surprising as these are the two ratios that are least prone to fluctuations. Book value moves much less than net profit, and similarly, revenues move much less than EBITDA. Consequently, the best-fitting models obtained for the P/BV and EV/Revenues dependent variables confirm a noticeable stability in the relationship between ESG risk ratings and longer-term company valuations.
Consistent with the prior research and the above discussion, all the results provide relatively robust evidence in favor of the hypothesis that ESG rating remains statistically important in determining the company’s valuation and that inferior ratings also cause reduced valuation in markets, such as Central Europe, where ESG risk management practices are not widespread.
4. Discussion and Conclusions
This research provides compelling evidence that ESG risk ratings, and consequently a shift towards more sustainable business models, can contribute significantly to explaining valuation differences among large listed companies in Central European countries. The worse the ESG rating (controlling for industry variables), the less favorable the valuation. These findings suggest that investors are willing to pay a premium to invest in companies with robust ESG standards, especially those that remain at the forefront of the industry, and that the potential benefits of integrated ESG management (in terms of better risk management and business model fine-tuning) outweigh the costs associated with introducing such management controls into investors’ valuation practices. While the value added reflected in the ratings varies across sectors, the direction remains consistent across industries. This provides a strong argument for listed company management investing time in enhancing risk practices with a view to achieving an improved company-level ESG rating.
The study also indicates that ESG ratings could be used to forecast company valuations, which is an important consideration for investors. Clearly, ESG ratings are exogenous to current market valuation indicators. Keeping track of changes in a company’s ESG risk management activities and their outcomes can provide valuable information for future price adjustments.
Interesting findings relate to the non-linear characteristics of ESG risk ratings and valuation interdependence. The preference for the second and third power of the ESG rating variable in the models indicates that a worse ESG rating deteriorates the company’s valuation more than proportionally compared to the linear relationship. Small differences in ESG risk ratings, if favorable, do not have such a large impact on valuation. This may also be an important conclusion for investors, as observing the relative ESG standards of close peers may provide a basis for adjusting investment strategy. This suggests that there may be a relatively high cost to be paid for ignoring the sustainability trend and for lagging behind the peer group in this context. At the same time, however, the costs to be paid for becoming clear leader may not always be sufficiently rewarded by the shareholders. This may give clear guidance to management in respect of steering the company’s transition and to shareholders when defining the incentives schemes.
While the proposed research provided conclusive reconfirmation of the research hypothesis, further research would be needed to better understand the characteristics of the influence. In particular, inclusion of alternative ESG risk measures that would allow for differentiation between the key dimensions could give more guidance as to what type of ESG actions should be focused on as a priority. Analyzing a wider group of companies (in particular, including smaller companies or those outside public markets) could also elucidate the extent to which the observed relationship is driven by fundamentals on the company side, or, rather, the reaction in terms of the shareholders’ expectations or other outside pressures. It would also be interesting to combine the list of companies analyzed in this research into the wider research on European companies, which could help to determine whether there is a “regional” characteristic of the relationship.
The results of this study encourage further research on a regional basis and suggest that equity investors in Central European countries tend to view ESG issues in a consistent manner and incorporate them into valuation decision models. This can serve as additional argument for corporate managers that the costs of implementing ESG management practices can be successfully offset by the benefits of this (including avoiding being penalized for substandard risk management practices) and consequently help to increase the company’s value. Therefore, the managers are encouraged to (i) better understand and quantify ESG risks and improve transparency in sharing the conclusion with the company’s stakeholders and (ii) make informed decisions regarding the scale of manageable ESG risks that their company can take.
The above results also have practical implications for shareholders, implying that ESG objectives do not require compromise on the returns and, consequently, shareholders can expect to benefit from improvements in ESG risk management standards. These benefits justify questioning the managers on the scale of ESG risks and pushing for results of stress scenarios (including in relation to ESG risks that may be outside of the company’s control), which may become particularly relevant when managing shares portfolio of multiple companies.
Disclaimer Regarding Morningstar Sustainalytics’ ESG Risk Rating Methodology: Morningstar Sustainalytics’ ESG Risk Ratings measure a company’s exposure to industry-specific material ESG risks and how well a company is managing those risks. This multi-dimensional way of measuring ESG risk combines the concepts of management and exposure to arrive at an assessment of ESG risk, i.e., a total unmanaged ESG risk score or the ESG Risk Rating, that is comparable across all industries. Sustainalytics’ ESG Risk Ratings provide a quantitative measure of unmanaged ESG risk and distinguish between five levels of risk: negligible, low, medium, high and severe.
Author Contributions
Conceptualization: K.K. and A.C.; data curation: K.K.; software: K.K.; formal analysis: K.K. and A.C.; investigation: K.K. and A.C.; methodology: K.K. and A.C.; validation: K.K.; visualization: K.K.; project administration: K.K.; writing—original draft: K.K. and A.C.; writing–review and editing: K.K. and A.C. All authors have read and agreed to the published version of the manuscript.
Funding
This research received no external funding.
Institutional Review Board Statement
Not applicable.
Informed Consent Statement
Not applicable.
Data Availability Statement
The original data presented in the study are openly available in the repository at https://osf.io/q6z7b (accessed on 23 September 2025).
Conflicts of Interest
The authors declare no conflicts of interest.
Abbreviations
The following abbreviations are used in this manuscript:
| BV | Book Value |
| CE | Central Europe or Central European |
| EBIT | Earnings before Interest and Tax |
| EBITDA | Earnings before Interest and Tax adjusted for Depreciation and Amortization |
| ESG | Environmental, Social and Governance |
| EV | Enterprise Value |
| GLS | Generalized Least Squares |
| LN | Logarithm |
| OLS | Ordinary Least Squares |
| P | Price (in ratio definitions) |
| P/E | Price to Earnings per Share Ratio |
| P/BV | Price to Book Value Ratio |
| VIFs | Variance inflation factors |

References
- UN Global Compact and Accenture, A New Era of Sustainability. 2010. Available online: https://d306pr3pise04h.cloudfront.net/docs/news_events%2F8.1%2FUNGC_Accenture_CEO_Study_2010.pdf (accessed on 23 September 2025).
- Bilgili, M.; Tumse, S.; Nar, S. Comprehensive overview on the present state and evolution of global warming, climate change, greenhouse gasses and renewable energy. Arab. J. Sci. Eng. 2024, 49, 14503–14531. [Google Scholar] [CrossRef]
- Barrow-Gillies, E.; Blunden, J.; Boyer, T. A Look at 2022: Takeaway points from the state of the climate. Bull. Am. Meteor. Soc. 2023, 104, 810–820. [Google Scholar] [CrossRef]
- Alifu, H.; Hirabayashi, Y.; Imada, Y.; Shiogama, H. Enhancement of river flooding due to global warming. Sci. Rep. 2022, 12, 20687. [Google Scholar] [CrossRef]
- McKinsey. Does ESG Really Matter—And Why? 2022. Available online: https://www.mckinsey.com/capabilities/sustainability/our-insights/does-esg-really-matter-and-why (accessed on 23 August 2024).
- PWC. ESG-Focused Institutional Investment Seen Soaring 84% to USD 33.9 Trillion in 2026, Making Up 21.5% of Assets Under Management: PwC Report. 2022. Available online: https://www.pwc.com/id/en/media-centre/press-release/2022/english/esg-focused-institutional-investment-seen-soaring-84-to-usd-33-9-trillion-in-2026-making-up-21-5-percent-of-assets-under-management-pwc-report.html (accessed on 2 September 2024).
- IFAC. The State of Play: Sustainability Disclosure and Assurance, 2019–2021 Trends and Analysis. 2023. Available online: https://ifacweb.blob.core.windows.net/publicfiles/2023-02/IFAC-State-of-Play-Sustainability-Assurance-Disclosures_0.pdf (accessed on 2 November 2024).
- Nosratabadi, S.; Mosavi, A.; Shamshirband, S.; Zavadskas, E.K.; Rakotonirainy, A.; Chau, K.W. Sustainable business models: A review. Sustainability 2019, 11, 1663. [Google Scholar] [CrossRef]
- Falcke, L.; Zobel, A.K.; Comello, S.D. How firms realign to tackle the grand challenge of climate change: An innovation ecosystems perspective. J. Prod. Innov. Manag. 2024, 41, 403–427. [Google Scholar] [CrossRef]
- Ooi, K.L.; Binti Ab Aziz, N.; Lau, W.Y. The Psychology of Greenwashing and ESG Disclosures. In Following the Crowd: Psychological Drivers of Herding and Market Overreaction; Springer Nature: Singapore, 2025; pp. 189–198. [Google Scholar]
- Hart, O.; Zingales, L. Companies Should Maximize Shareholder Welfare Not Market Value; ECGI-Finance Working Paper; ECGI: Brussels, Belgium, 2017. [Google Scholar]
- Ioannou, I.; Serafeim, G. What drives corporate social performance? The role of nation-level institutions. J. Int. Bus. Stud. 2012, 43, 834–864. [Google Scholar] [CrossRef]
- Atz, U.; Van Holt, T.; Liu, Z.Z.; Bruno, C.C. Does sustainability generate better financial performance? review, meta-analysis, and propositions. J. Sustain. Financ. Investig. 2023, 13, 802–825. [Google Scholar] [CrossRef]
- Giese, G.; Lee, L.E.; Melas, D.; Nagy, Z.; Nishikawa, L. Foundations of ESG investing: How ESG affects equity valuation, risk, and performance. J. Portf. Manag. 2019, 45, 69–83. [Google Scholar] [CrossRef]
- Kanno, M. Does ESG performance improve firm creditworthiness? Financ. Res. Lett. 2023, 55, 103894. [Google Scholar] [CrossRef]
- Dobrick, J.; Klein, C.; Zwergel, B. ESG as risk factor. J. Asset Manag. 2025, 26, 44–70. [Google Scholar] [CrossRef]
- Hoepner, A.G.; Oikonomou, I.; Sautner, Z.; Starks, L.T.; Zhou, X.Y. ESG shareholder engagement and downside risk. Rev. Financ. 2024, 28, 483–510. [Google Scholar] [CrossRef]
- Bax, K.; Sahin, Ö.; Czado, C.; Paterlini, S. ESG, risk, and (tail) dependence. Int. Rev. Financ. Anal. 2023, 87, 102513. [Google Scholar] [CrossRef]
- Nurn, C.W.; Tan, G. Obtaining Intangible and Tangible Benefits from Corporate Social Responsibility. Int. Rev. Bus. Res. Pap. 2010, 6, 360–371. [Google Scholar]
- Henisz, W.J.; McGlinch, J. ESG, material credit events, and credit risk. J. Appl. Corp. Financ. 2019, 31, 105–117. [Google Scholar] [CrossRef]
- Michael, R.B. Final Report: Recommendations of the Task Force on Climate-Related Financial Disclosures; TCFD (Task Force on Climate-Related Financial Disclosures): Basel, Switzerland, 2017; Available online: https://assets.bbhub.io/company/sites/60/2021/10/FINAL-2017-TCFD-Report.pdf (accessed on 15 August 2024).
- Alsayegh, M.F.; Abdul Rahman, R.; Homayoun, S. Corporate sustainability performance and firm value through investment efficiency. Sustainability 2022, 15, 305. [Google Scholar] [CrossRef]
- Riding, S.; Mooney, A. Investors Blast EU’s Omission of Oil from ESG Disclosures. Financial Times, 2020. Available online: https://www.ft.com/content/07083de6-c4d4-4f1b-8dc4-c4490e670216 (accessed on 11 September 2024).
- Nobanee, H.; Al Hamadi, F.Y.; Abdulaziz, F.A.; Abukarsh, L.S.; Alqahtani, A.F.; AlSubaey, S.K.; Almansoori, H.A. A bibliometric analysis of sustainability and risk management. Sustainability 2021, 13, 3277. [Google Scholar] [CrossRef]
- Amel-Zadeh, A.; Serafeim, G. Why and how investors use ESG information: Evidence from a global survey. Financ. Anal. J. 2018, 74, 87–103. [Google Scholar] [CrossRef]
- El Ghoul, S.; Guedhami, O.; Kwok, C.C.; Mishra, D.R. Does corporate social responsibility affect the cost of capital? J. Bank. Financ. 2011, 35, 2388–2406. [Google Scholar] [CrossRef]
- Sulkowski, A.J. Sustainability (or ESG) reporting: Recent developments and the potential for better, more proactive management enabled by blockchain. SSRN 2021. [Google Scholar] [CrossRef]
- De Lucia, C.; Pazienza, P.; Bartlett, M. Does good ESG lead to better financial performances by firms? Machine learning and logistic regression models of public enterprises in Europe. Sustainability 2020, 12, 5317. [Google Scholar] [CrossRef]
- Angelaki, E.; Garefalakis, A.; Kourgiantakis, M.; Sitzimis, I.; Passas, I. ESG Integration and Green Computing: A 20-Year Bibliometric Analysis. Sustainability 2025, 17, 3266. [Google Scholar] [CrossRef]
- Badhwar, A.; Islam, S.; Tan, C.S.L.; Panwar, T.; Wigley, S.; Nayak, R. Unraveling green marketing and greenwashing: A systematic review in the context of the fashion and textiles industry. Sustainability 2024, 16, 2738. [Google Scholar] [CrossRef]
- Carroll, A.B.; Shabana, K.M. The business case for corporate social responsibility: A review of concepts, research and practice. Int. J. Manag. Rev. 2010, 12, 85–105. [Google Scholar] [CrossRef]
- Puente De La Vega Caceres, A. Drivers of value creation and the effect of ESG risk rating on investor perceptions through financial metrics. Sustainability 2024, 16, 5347. [Google Scholar] [CrossRef]
- Khan, M.A.; Hassan, M.K.; Maraghini, M.P.; Paolo, B.; Valentinuz, G. Valuation effect of ESG and its impact on capital structure: Evidence from Europe. Int. Rev. Econ. Financ. 2024, 91, 19–35. [Google Scholar] [CrossRef]
- Barka, Z.; Hamza, T.; Mrad, S. Corporate ESG scores and equity market misvaluation: Toward ethical investor behavior. Econ. Model. 2023, 127, 106467. [Google Scholar] [CrossRef]
- Xu, M.; Tse, Y.K.; Geng, R.; Liu, Z.; Potter, A. Greenwashing and market value of firms: An empirical study. Int. J. Prod. Econ. 2025, 284, 109606. [Google Scholar] [CrossRef]
- Revelli, C.; Viviani, J.L. Financial performance of socially responsible investing (SRI): What have we learned? A meta-analysis. Bus. Ethics Eur. Rev. 2015, 24, 158–185. [Google Scholar] [CrossRef]
- Ghosh, B.; Papathanasiou, S.; Dar, V.; Kenourgios, D. Deconstruction of the green bubble during COVID-19 international evidence. Sustainability 2022, 14, 3466. [Google Scholar] [CrossRef]
- Bauer, R.; Hann, D. Corporate environmental management and credit risk. SSRN 2010. [Google Scholar] [CrossRef]
- Van Zanten, J.A. Measuring Companies’ Environmental and Social Impacts: An analysis of ESG Ratings and SDG Scores. Organ. Environ. 2025, 38, 403–439. [Google Scholar] [CrossRef]
- Bauckloh, T.; Dobrick, J.; Höck, A.; Utz, S.; Wagner, M. In partnership for the goals? The level of agreement between SDG ratings. J. Econ. Behav. Organ. 2024, 217, 664–678. [Google Scholar] [CrossRef]
- Busch, T.; Johnson, M.P.; Schnippering, M. A change will do you good: Does continuous environmental improvement matter? Organ. Environ. 2022, 35, 551–578. [Google Scholar] [CrossRef]
- Garefalakis, A.; Dimitras, A. Looking back and forging ahead: The Weighting of ESG Factors. Ann. Oper. Res. 2020, 294, 151–189. [Google Scholar] [CrossRef]
- Fatemi, A.; Glaum, M.; Kaiser, S. ESG performance and firm value: The moderating role of disclosure. Glob. Financ. J. 2018, 38, 45–64. [Google Scholar] [CrossRef]
- Li, Y.; Gong, M.; Zhang, X.Y.; Koh, L. The impact of environmental, social, and governance disclosure on firm value: The role of CEO power. Br. Account. Rev. 2018, 50, 60–75. [Google Scholar] [CrossRef]
- Verbeeten, F.H.; Gamerschlag, R.; Möller, K. Are CSR disclosures relevant for investors? Empirical evidence from Germany. Manag. Decis. 2016, 54, 1359–1382. [Google Scholar] [CrossRef]
- Koundouri, P.; Pittis, N.; Plataniotis, A. The impact of ESG performance on the financial performance of European area companies: An empirical examination. Environ. Sci. Proc. 2022, 15, 13. [Google Scholar]
- Zheng, J.; Khurram, M.U.; Chen, L. Can green innovation affect ESG ratings and financial performance? evidence from Chinese GEM listed companies. Sustainability 2022, 14, 8677. [Google Scholar] [CrossRef]
- Zhao, C.; Guo, Y.; Yuan, J.; Wu, M.; Li, D.; Zhou, Y.; Kang, J. ESG and corporate financial performance: Empirical evidence from China’s listed power generation companies. Sustainability 2018, 10, 2607. [Google Scholar] [CrossRef]
- Xu, J.; Liu, F.; Shang, Y. R&D investment, ESG performance and green innovation performance: Evidence from China. Kybernetes 2021, 50, 737–756. [Google Scholar]
- da Silva, F.E.D.; Mascena, K.M.C.D. The Relationship Between ESG and Financial Performance in Brazilian Companies. Rev. Adm. UFSM 2024, 17, e3. [Google Scholar] [CrossRef]
- Naimy, V.; El Khoury, R.; Iskandar, S. ESG versus corporate financial performance: Evidence from East Asian Firms in the industrials sector. Stud. Appl. Econ. 2021, 39, 1–24. [Google Scholar] [CrossRef]
- Al-Hiyari, A.; Kolsi, M.C. How do stock market participants value ESG performance? Evidence from Middle Eastern and North African Countries. Glob. Bus. Rev. 2024, 25, 934–956. [Google Scholar] [CrossRef]
- Chininga, E.; Alhassan, A.L.; Zeka, B. ESG ratings and corporate financial performance in South Africa. J. Account. Emerg. Econ. 2023, 14, 692–713. [Google Scholar] [CrossRef]
- Bătae, O.M.; Dragomir, V.D.; Feleagă, L. Environmental, social, governance (ESG), and financial performance of European banks. Account. Manag. Inf. Syst. 2020, 19, 480–501. [Google Scholar] [CrossRef]
- Simsek, O.; Cankaya, S. Examining the relationship between ESG scores and financial performance in banks: Evidence from G8 countries. Press Acad. Procedia 2021, 14, 169–170. [Google Scholar] [CrossRef]
- Naeem, N.; Cankaya, S.; Bildik, R. Does ESG performance affect the financial performance of environmentally sensitive industries? A comparison between emerging and developed markets. Borsa Istanb. Rev. 2022, 22, 128–140. [Google Scholar] [CrossRef]
- Sandberg, H.; Alnoor, A.; Tiberius, V. Environmental, social, and governance ratings and financial performance: Evidence from the European food industry. Bus. Strategy Environ. 2023, 32, 2471–2489. [Google Scholar] [CrossRef]
- Petelos, E.; Antonaki, D.; Angelaki, E.; Lemonakis, C.; Alexandros, G. Enhancing Public Health and SDG 3 Through Sustainable Agriculture and Tourism. Sustainability 2025, 17, 6253. [Google Scholar] [CrossRef]
- Friede, G.; Busch, T.; Bassen, A. ESG and financial performance: Aggregated evidence from more than 2000 empirical studies. J. Sustain. Financ. Investig. 2015, 5, 210–233. [Google Scholar] [CrossRef]
- Gillan, S.L.; Koch, A.; Starks, L.T. Firms and social responsibility: A review of ESG and CSR research in corporate finance. J. Corp. Financ. 2021, 66, 101889. [Google Scholar] [CrossRef]
- Czaja-Cieszyńska, H.E.; Kordela, D. Sustainability Reporting in Energy Companies—Is There a Link between Social Disclosures, the Experience and Market Value? Energies 2023, 16, 3642. [Google Scholar] [CrossRef]
- Czerwińska, T.; Kaźmierkiewicz, P. ESG rating in investment risk analysis of companies listed on the public market in Poland. Econ. Notes Rev. Bank. Financ. Monet. Econ. 2015, 44, 211–248. [Google Scholar] [CrossRef]
- Janicka, M.; Sajnóg, A. The ESG Reporting of EU Public Companies. Does the Company’s Capitalisation Matter? Sustainability 2022, 14, 4279. [Google Scholar] [CrossRef]
- Tarczyńska-Luniewska, M.; Flaga-Gieruszyńska, K.; Ankiewicz, M. Exploring the nexus between fundamental strength and market value in energy companies: Evidence from environmental, social, and corporate governance perspective in Poland. Front. Energy Res. 2022, 10, 91092. [Google Scholar] [CrossRef]
- Buła, R.; Foltyn-Zarychta, M.; Krawczyńska, D. Disentangling ESG: Environmental, social and governance ratings and financial performance of Polish listed companies. RPEiS 2024, 86, 149–178. [Google Scholar] [CrossRef]
- Baran, M.; Kuźniarska, A.; Makieła, Z.J.; Sławik, A.; Stuss, M.M. Does ESG reporting relate to corporate financial performance in the context of the energy sector transformation? Evid. Pol. Energ. 2022, 15, 477. [Google Scholar] [CrossRef]
- Chojnacka, E.; Jadanowska, E. Usefulness and benefits of disclosing non-financial information–results of a survey conducted among companies listed on the Warsaw Stock Exchange. Theor. J. Account. 2020, 106, 45–66. [Google Scholar]
- Jabłecki, J. Doing well while doing good: The elusive quest for green bond returns. J. Impact ESG Investig. 2023, 3, 45–60. [Google Scholar] [CrossRef]
- Siwiec, K.; Karkowska, R. Relationship between ESG and Financial Performance of Companies in the Central and Eastern European Region. Cent. Eur. Econ. J. 2024, 11, 178–199. [Google Scholar] [CrossRef]
- Liberadzki, M.; Jaworski, P.; Liberadzki, K. Spread analysis of the sustainability-linked bonds tied to an issuer’s greenhouse gases emissions reduction target. Energies 2021, 14, 7918. [Google Scholar] [CrossRef]
- Hadaś-Dyduch, M.; Puszer, B.; Czech, M.; Cichy, J. Green bonds as an instrument for financing ecological investments in the V4 countries. Sustainability 2022, 14, 12188. [Google Scholar] [CrossRef]
- Chen, S.; Song, Y.; Gao, P. Environmental, social, and governance (ESG) performance and financial outcomes: Analyzing the impact of ESG on financial performance. J. Environ. Manag. 2023, 345, 118829. [Google Scholar] [CrossRef]
- Chmielewska, A.; Kluza, K. ESG risk rating and company valuation: The case of the Warsaw Stock Exchange. RPEiS 2024, 86, 179–197. [Google Scholar] [CrossRef]
- Sustainalytics. “The ESG Risk Ratings. Methodology Abstract”, Morningstar Sustainalytics, Version 3.1.1; Sustainalytics: Toronto, ON, Canada, 2024.
- Greene, W.H. Econometric Analysis, 5th ed.; Prentice Hall: Hoboken, NJ, USA, 2003; pp. 201–211. [Google Scholar]
- Whelan, T.; Atz, U.; Van Holt, T.; Clark, C. ESG and Financial Performance: Uncovering the Relationship by Aggregating Evidence from 1000 Plus Studies Published Between 2015–2020; NYU Stern Publication: New York, NY, USA, 2021. [Google Scholar]
- Dayal, S.; Soni, T.K.; Aggarwal, R.; Hotwani, R. Linking ESG Disclosure to Firm Performance and Risk: An International Perspective. Indian J. Financ. 2024, 18, 36–55. [Google Scholar] [CrossRef]
- Alfalih, A.A. The role of sustainable entrepreneurship and corporate social performance on social innovation: The case of the private industrial sector in Saudi Arabia. J. Knowl. Econ. 2022, 13, 1928–1943. [Google Scholar] [CrossRef]
- Van Duuren, E.; Plantinga, A.; Scholtens, B. ESG integration and the investment management process: Fundamental investing reinvented. J. Bus. Ethics 2016, 138, 525–533. [Google Scholar] [CrossRef]
- Giese, G.; Nagy, Z.; Lee, L.E. Deconstructing ESG ratings performance: Risk and return for E, S, and G by time horizon, sector, and weighting. J. Portf. Manag. 2021, 47, 94–111. [Google Scholar] [CrossRef]
Disclaimer/Publisher’s Note: The statements, opinions and data contained in all publications are solely those of the individual author(s) and contributor(s) and not of MDPI and/or the editor(s). MDPI and/or the editor(s) disclaim responsibility for any injury to people or property resulting from any ideas, methods, instructions or products referred to in the content. |
© 2025 by the authors. Licensee MDPI, Basel, Switzerland. This article is an open access article distributed under the terms and conditions of the Creative Commons Attribution (CC BY) license (https://creativecommons.org/licenses/by/4.0/).