Efficiency Assessments and Regional Disparities of Green Cold Chain Logistics for Agricultural Products: Evidence from the Three Northeastern Provinces of China
Abstract
1. Introduction
2. Index Selection and Model Construction
2.1. Indicators and Data
2.1.1. Indicator Selection
2.1.2. Data Sources and Processing
2.2. Model Construction
2.2.1. Super-Efficiency SBM Model Construction
2.2.2. ML Index Measurement Method
3. Efficiency Evaluation Results
3.1. Static Efficiency Calculation Results
3.2. Dynamic Efficiency Decomposition Results
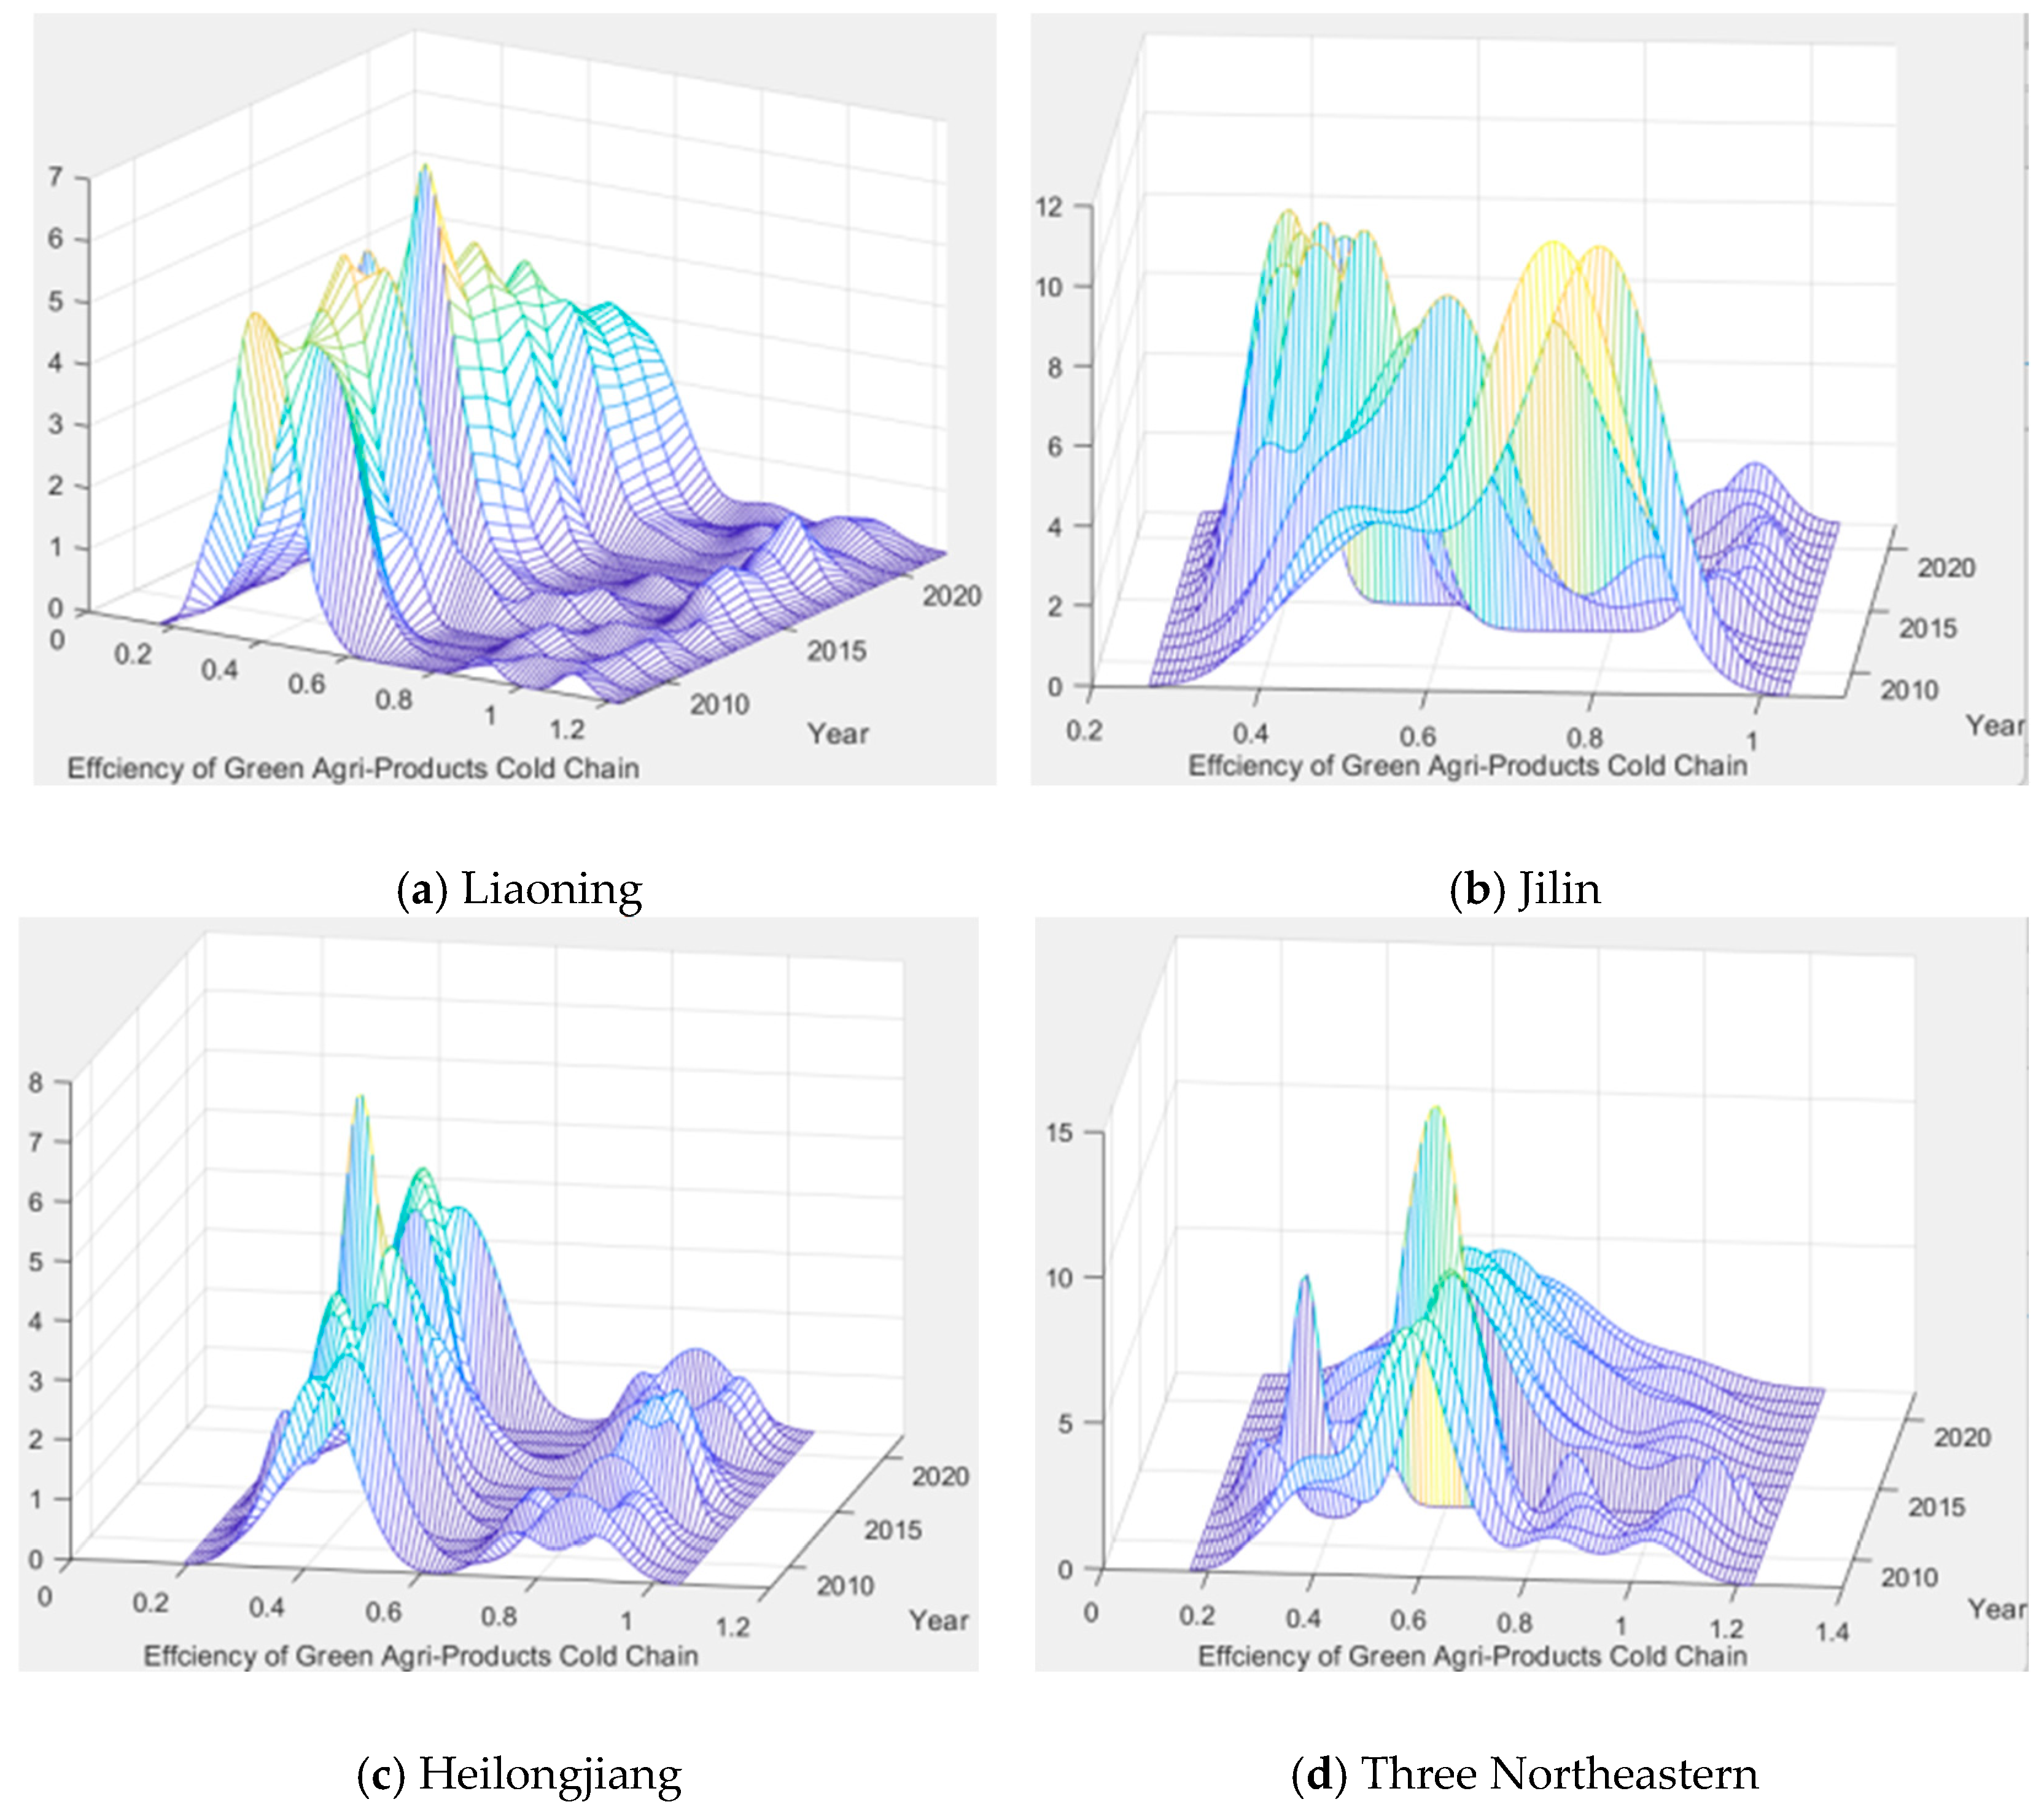
3.3. Spatial Differentiation Characteristics of Efficiency Based on Kernel Density Analysis
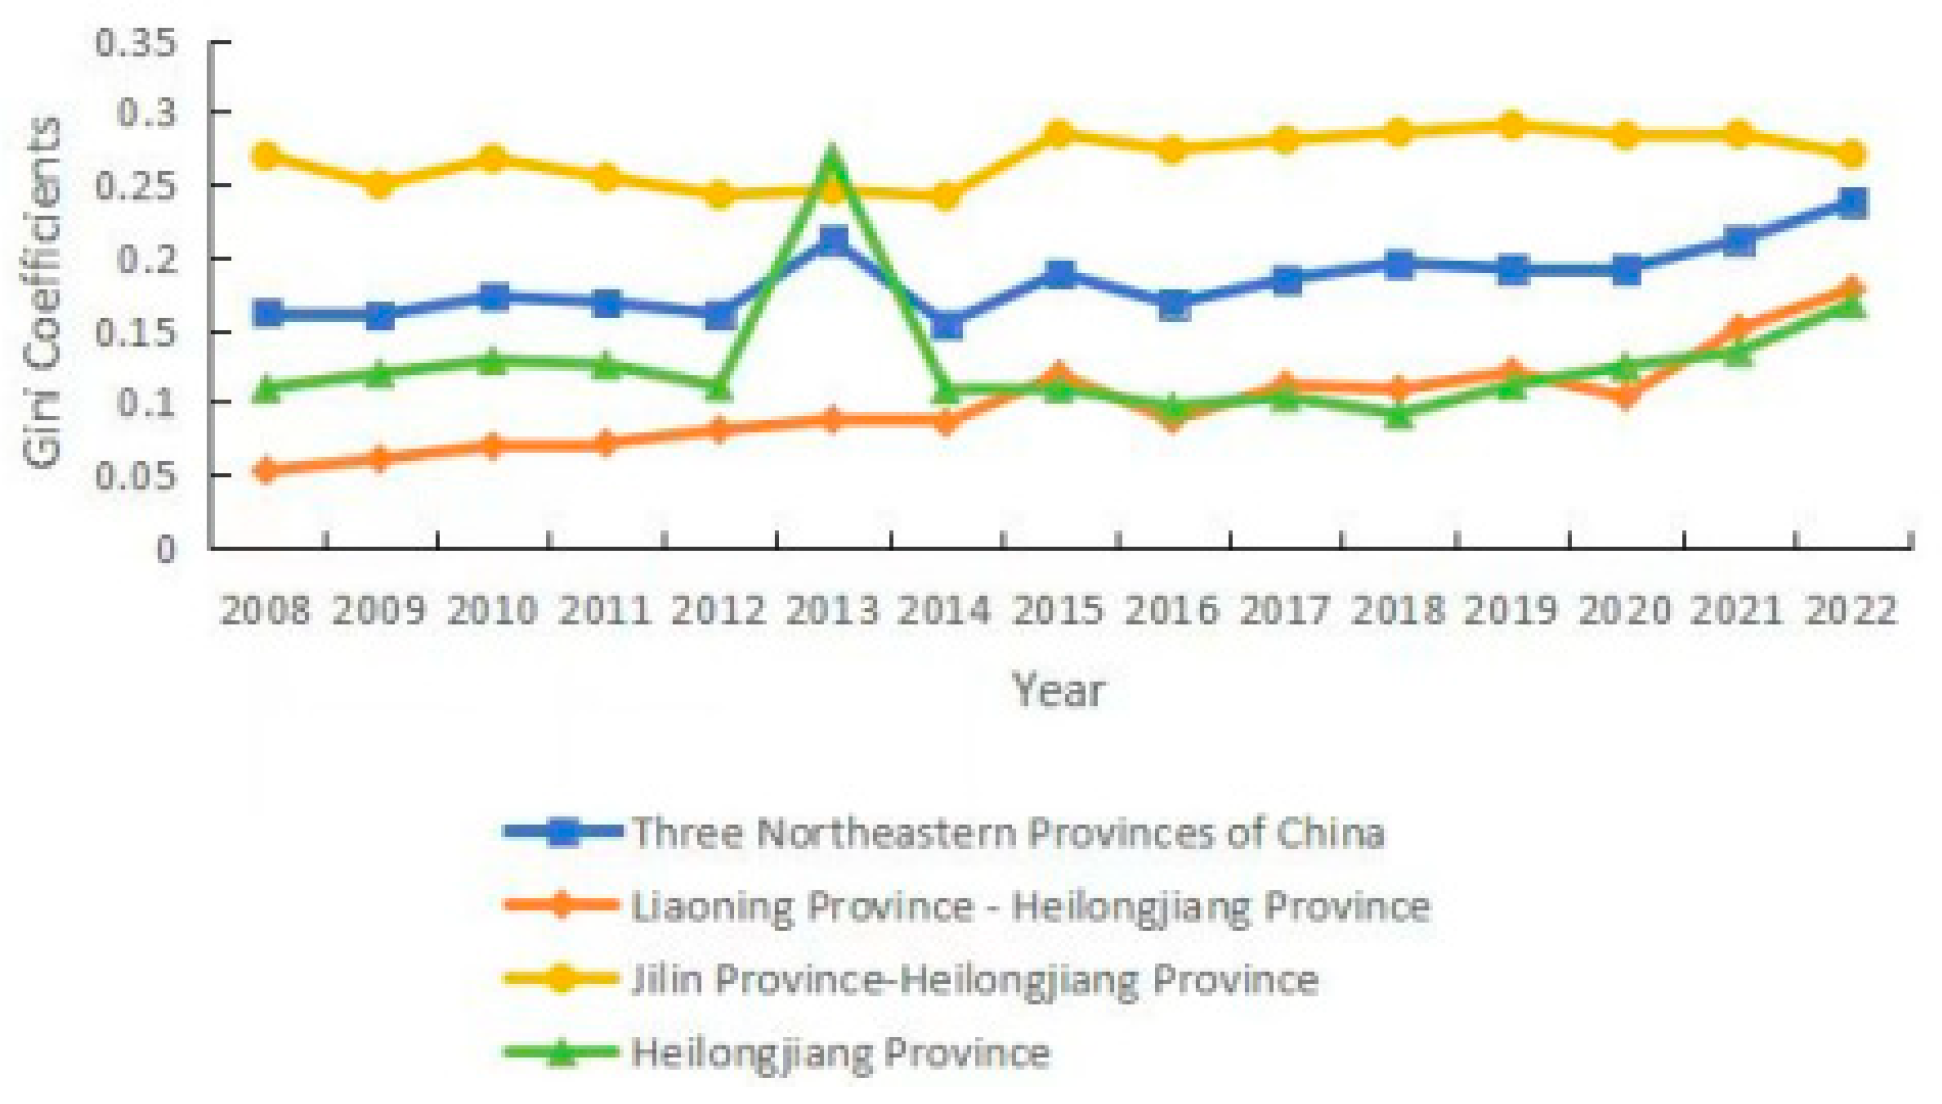
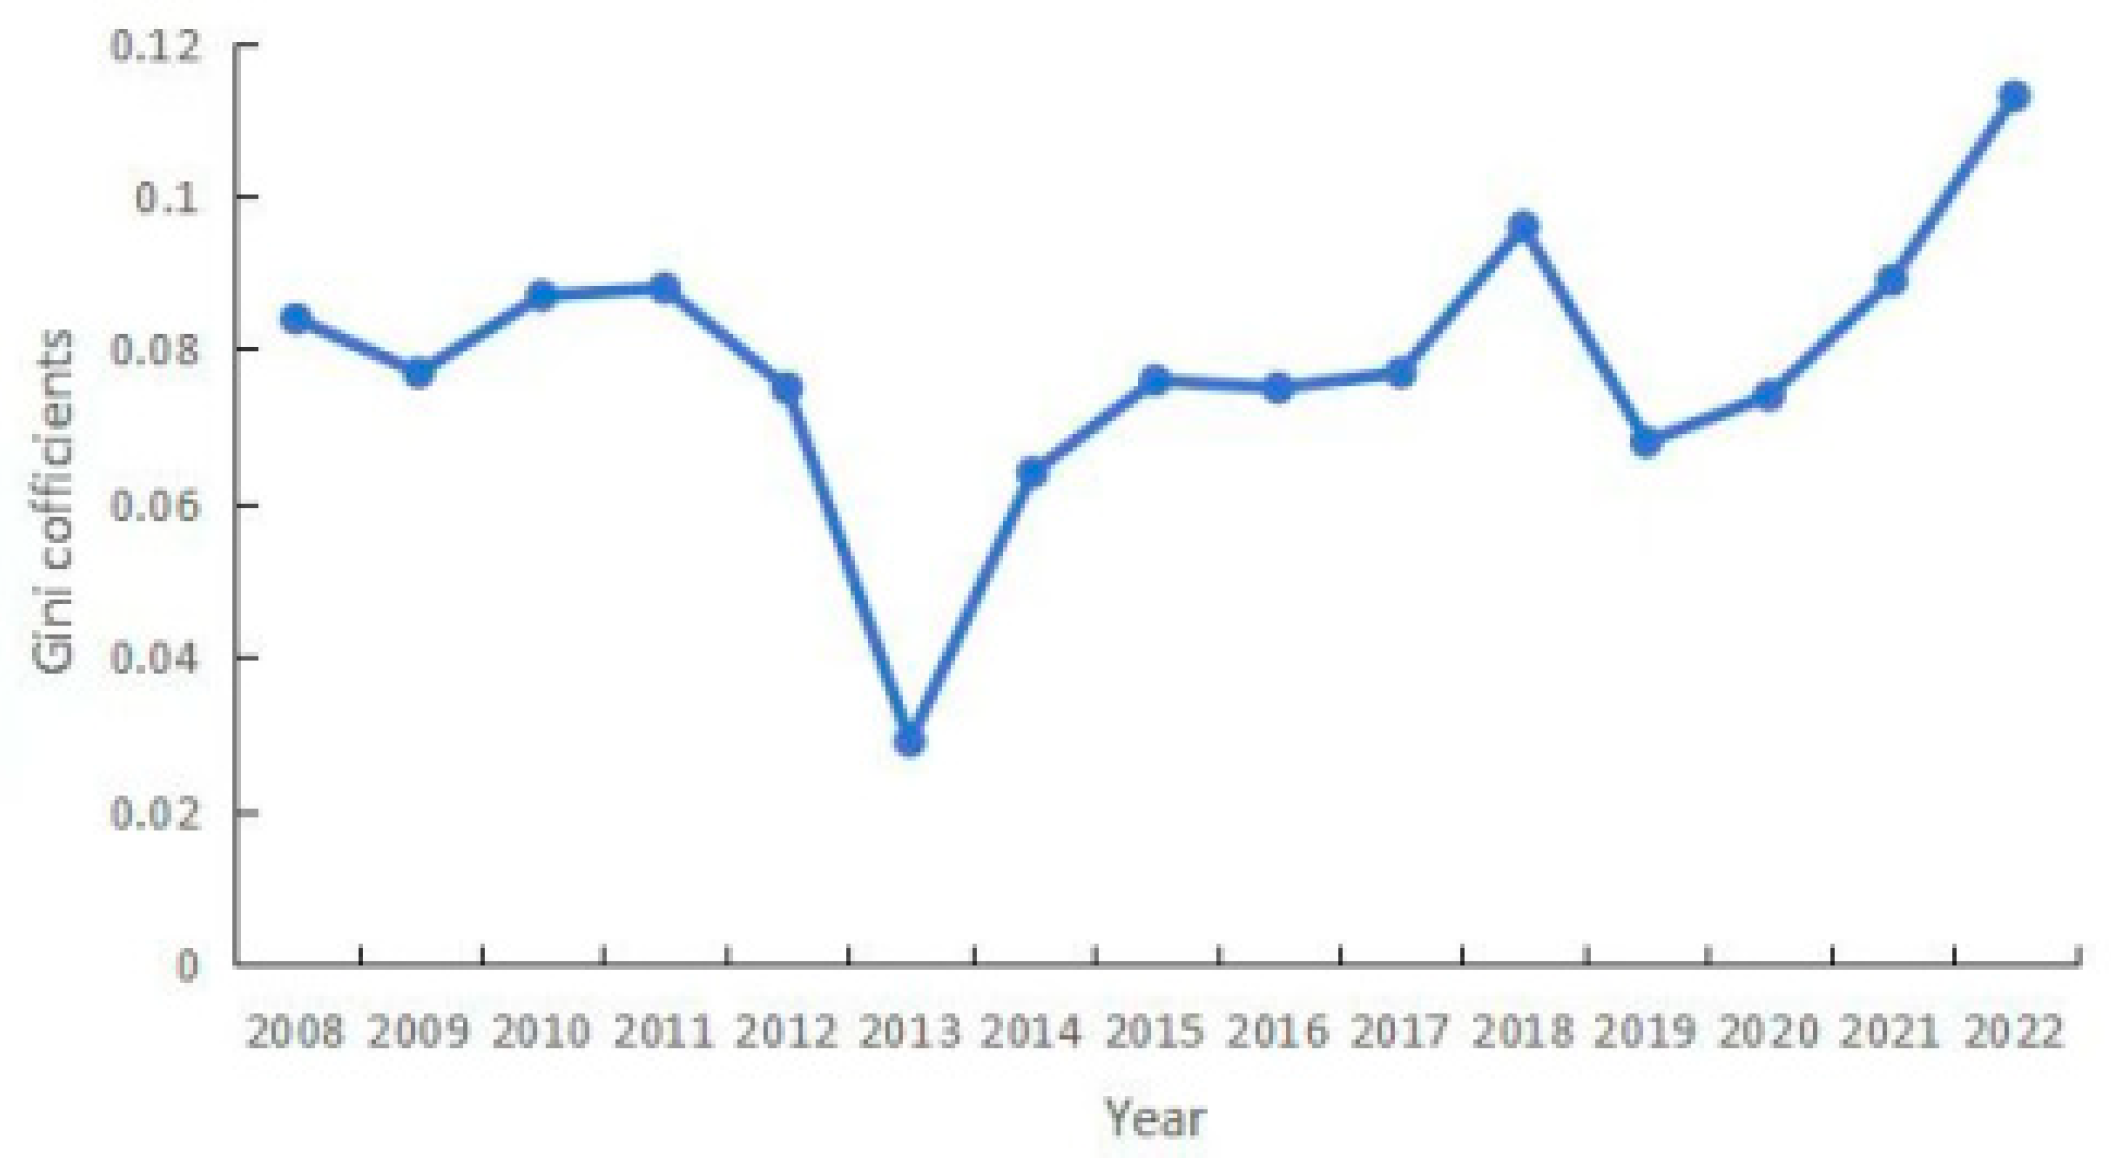
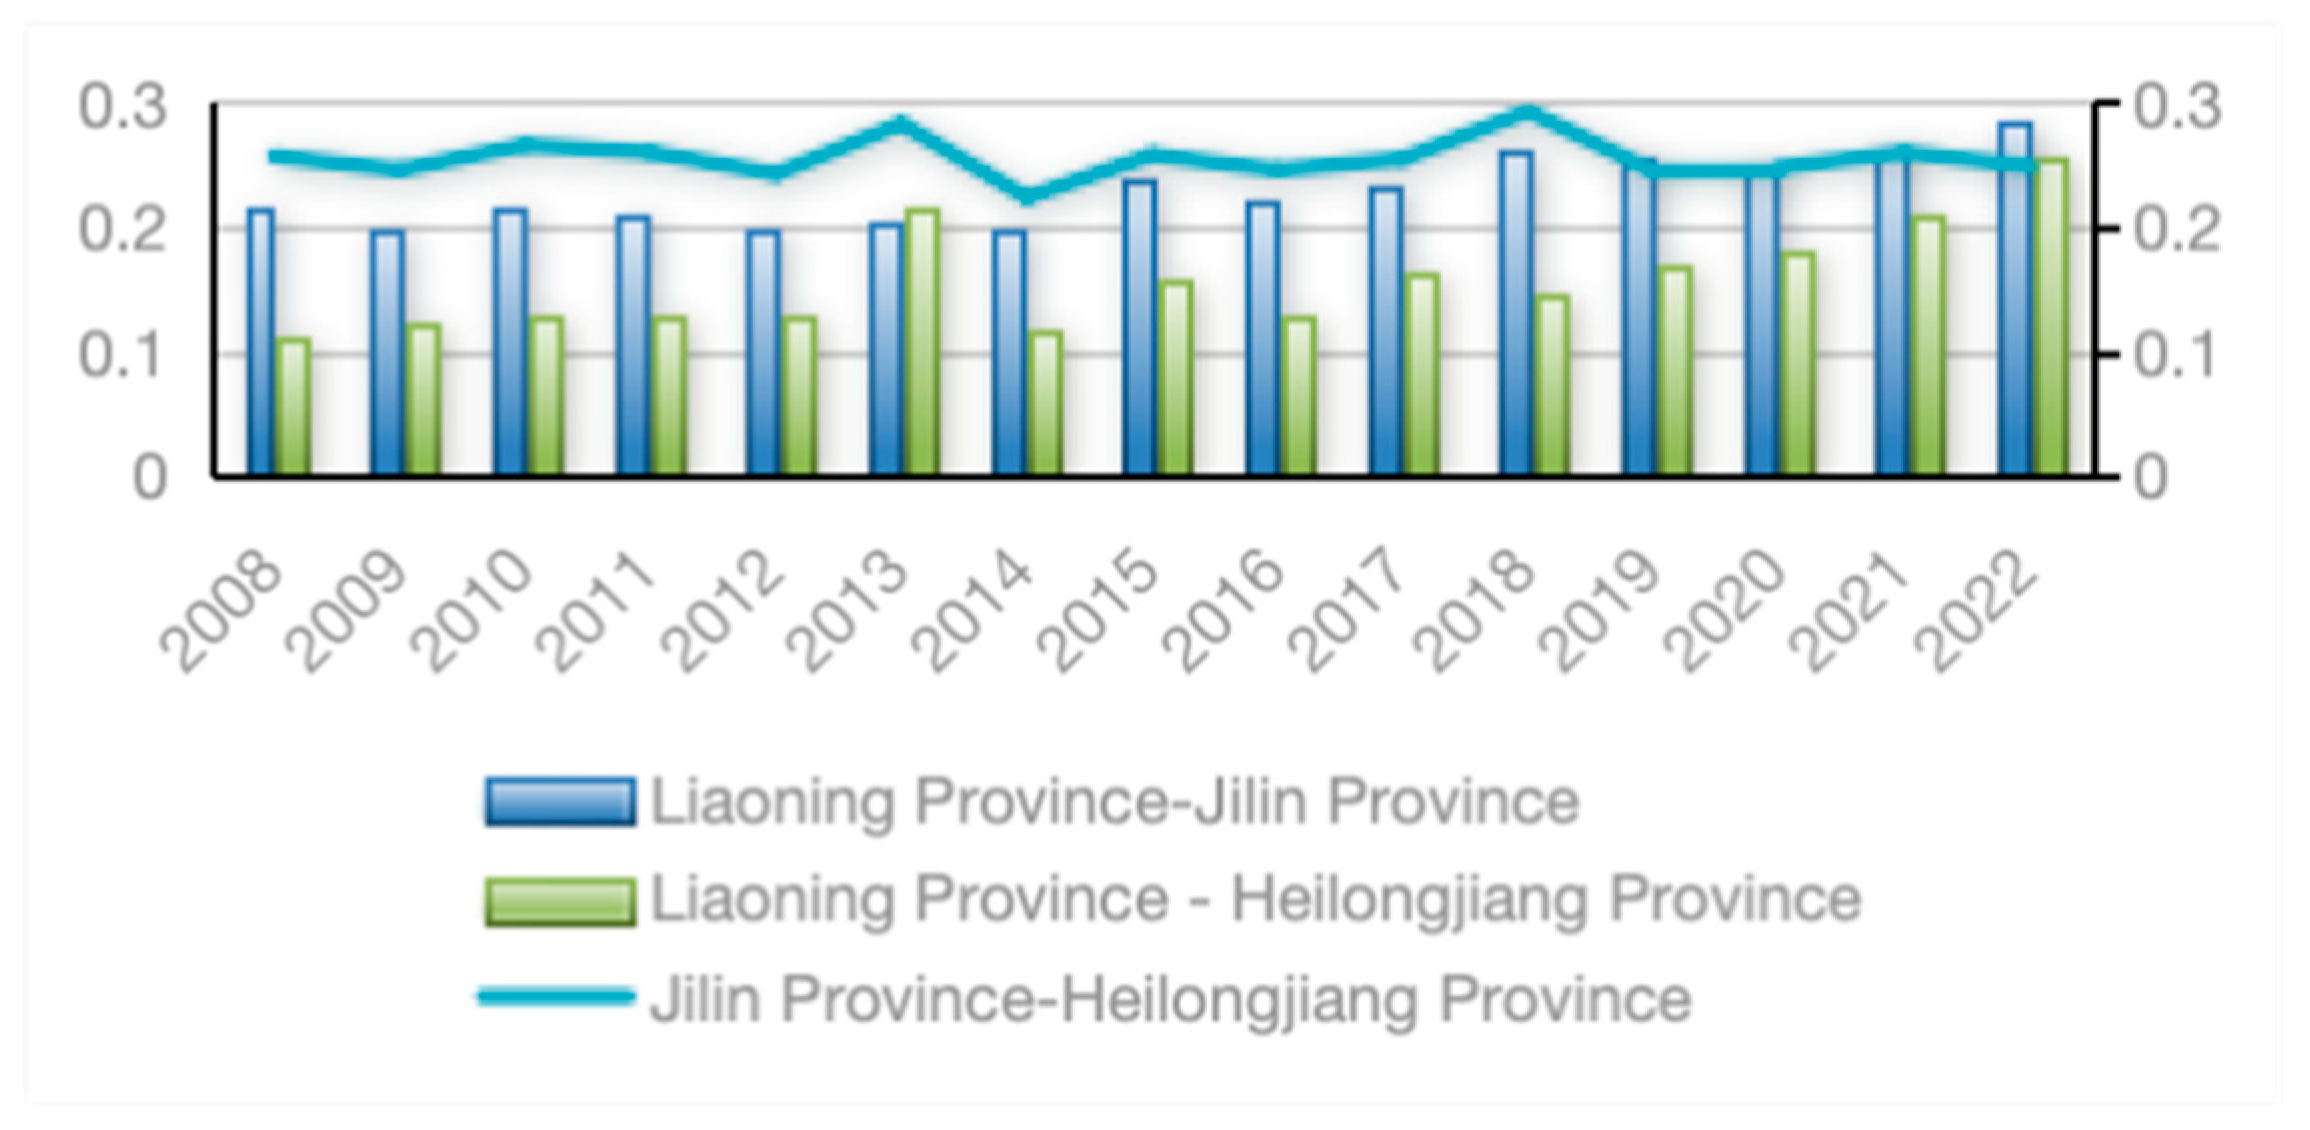
3.4. Spatial Difference Decomposition of Efficiency Based on the Dagum Gini Coefficient
4. Empirical of the Regional Differentiation Causes of Efficiency Based on the Tobit Model
4.1. Influencing Variables and Data
4.2. Model Specification
4.3. Empirical Results
5. Discussion and Conclusions
5.1. Economic Development as the Primary Driver of Efficiency and Regional Disparities
5.2. Randomness of Polarization and Inevitability of Regional Efficiency Disparities
5.3. The Regional “Digitalization Paradox” and the Marginal Negative Utility of Government Sectors
6. Policy Recommendations and Research Implications
7. Limitations and Future Research Directions
Author Contributions
Funding
Institutional Review Board Statement
Informed Consent Statement
Data Availability Statement
Acknowledgments
Conflicts of Interest
References
- Yang, B.; Han, J.; Yang, L.; Ren, Q.; Yang, X. Evaluation System of China’s Low-Carbon Cold Chain Logistics Development Level. Smart Agric. 2023, 5, 44–51. [Google Scholar]
- Mercier, S.; Villeneuve, S.; Mondor, M.; Uysal, I. Time-temperature management along the food cold chain: A review of recent developments. Compr. Rev. Food Sci. Food Saf. 2017, 16, 647–667. [Google Scholar] [CrossRef] [PubMed]
- Zailani, S.; Iranmanesh, M.; Nikbin, D.; Jumadi, H.B. Environmental Outcome of Green Technology Innovation Adoption in the Transportation Industry in Malaysia. Asian J. Technol. Innov. 2014, 22, 286–301. [Google Scholar] [CrossRef]
- Du, G.; Li, W. Does innovative city building promote green logistics efficiency? Evidence from a quasi-natural experiment with 285 cities. Energy Econ. 2022, 10, 114–118. [Google Scholar]
- Kim, T.H.; Ryu, S.K. A Study on the Green Growth Policy and Government Support-Focusing on the Green Logistics. Int. Commer. Inf. Rev. 2012, 14, 315–344. [Google Scholar] [CrossRef]
- Kang, M.-H.; Kim, S.-T. A Study on Korea’s Green Logistics Activation Policy in the Age of the Fourth Industrial Revolution. Korea Trade Rev. 2021, 46, 81–97. [Google Scholar]
- Deng, M.; Li, Y.; Wang, L.; Huang, W.; Zeng, X. Green development efficiency of cold chain logistics based on the super-SBM-GML index model. J. Cent. South Univ. For. Technol. 2024, 44, 189–200. [Google Scholar]
- Rodrigue, J.-P.; Notteboom, T. The Cold Chain and its Logistics. In The Geography of Transport Systems, 3rd ed.; Routledge: Oxfordshire, UK, 2009. [Google Scholar]
- Hans, J. Green logistics is defined as efforts to examine ways of reducing these externalities and achieving a more sustainable balance between environmental, economic and social objectives. J. Clean. Prod. 2011, 19, 1719–1729. [Google Scholar]
- Batista, L.; Bourlakis, M.; Smart, P.; Maull, R. In search of a circular supply chain archetype-a content-analysis-based literature review. Prod. Plan. Control 2018, 29, 438–451. [Google Scholar] [CrossRef]
- Fugate, B.S.; Mentzer, J.T.; Stank, T.P. Logistics Performance: Efficiency, Effectiveness, and Differentiation. J. Bus. Logist. 2010, 31, 43–62. [Google Scholar] [CrossRef]
- Hong, S.; Jiang, H.; Cheng, S.; Huang, Y.; Feng, C. A study on the policy effects of the establishment of Guangdong–Hong Kong–Macao greater bay area on logistics efficiency. Sustainability 2023, 15, 1078. [Google Scholar] [CrossRef]
- Liu, G.; Hu, J.; Yang, Y.; Xia, S.; Lim, M.K. Vehicle routing problem in cold Chain logistics: A joint distribution model with carbon trading mechanisms. Resour. Conserv. Recycl. 2020, 156, 104715. [Google Scholar] [CrossRef]
- Chen, H.; Zhang, Y. Research on the path of sustainable development of China’s logistics industry driven by capital factors. Sustainability 2023, 15, 297. [Google Scholar] [CrossRef]
- Jia, X. Research on the optimization of cold chain logistics distribution path of agricultural products E-commerce in urban ecosystem from the perspective of carbon neutrality. Front. Ecol. Evol. 2022, 10, 966111. [Google Scholar] [CrossRef]
- Jung, S.; Son, J.; Kim, C.; Chung, K. Efficiency Measurement Using Data Envelopment Analysis (DEA) in Public Healthcare: Research Trends from 2017 to 2022. Processes 2023, 11, 811. [Google Scholar] [CrossRef]
- Bonasia, M.; Kounetas, K.; Oreste, N. Assessment of regional productive performance of European health systems under a metatechnology framework. Econ. Model. 2020, 84, 234–248. [Google Scholar] [CrossRef]
- Chorfi, Z.; Berrado, A.; Benabbou, L. An integrated DEA-based approach for evaluating and sizing health care supply chains. J. Model. Manag. 2020, 15, 201–231. [Google Scholar]
- Krmac, E.; Mansouri Kaleibar, M. A comprehensive review of data envelopment analysis (DEA) methodology in port efficiency evaluation. Marit. Econ. Logist. 2022, 25, 817–881. [Google Scholar] [CrossRef]
- Wang, B.; Tian, Y. Green and Low-Carbon Efficiency Assessment of Urban Agglomeration Logistics Industry: Evidence from China’s Beig-Tian-Hebei Metropolitan Area (2008–2020). Sustainability 2023, 15, 11833. [Google Scholar]
- Ye, C.; Chen, N.; Weng, S.; Xu, Z. Regional Sustainability of Logistics Efficiency in China along the Belt and Road Initiative Considering Carbon Emissions. Sustainability 2022, 14, 9506. [Google Scholar] [CrossRef]
- Tone, K. A slacks-based measure of efficiency in data envelopment analysis. Eur. J. Oper. Res. 2001, 130, 498–509. [Google Scholar] [CrossRef]
- Fried, H.O.; Lovell, C.A.K.; Schmidt, S.S.; Yaisawarng, S. Accounting for Environmental Effects and Statistical Noise in Data Envelopment Analysis. J. Product. Anal. 2002, 17, 157–174. [Google Scholar]
- Tone, K. Dealing with Undesirable Outputs in DEA: A Slacks-Based Measure (SBM) Approach; GRIPS Research Report Series; National Graduate Institute for Policy Studies (GRIPS): Tokyo, Japan, 2003; pp. 44–45. [Google Scholar]
- Tone, K. A slacks-based measure of super-efficiency in data envelopment analysis. Eur. J. Oper. Res. 2002, 143, 32–41. [Google Scholar] [CrossRef]
- Jiang, X.; Ma, J.; Zhu, H.; Guo, X.; Huang, Z. Evaluating the Carbon Emissions Efficiency of the Logistics Industry Based on a Super-SBM Model and the Malmquist Index from a Strong Transportation Strategy Perspective in China. Int. J. Environ. Res. Public Health 2020, 17, 8459. [Google Scholar] [CrossRef]
- Schøyen, H.; Bjorbæk, C.T.; Steger-Jensen, K.; Bouhmala, N.; Burki, U.; Jensen, T.E.; Berg, Ø. Measuring the contribution of logistics service delivery performance outcomes and deep-sea container liner connectivity on port efficiency. Res. Transp. Bus. Manag. 2018, 28, 66–76. [Google Scholar] [CrossRef]
- Rashidi, K.; Cullinane, K. Evaluating the sustainability of national logistics performance using Data Envelopment Analysis. Transp. Policy 2019, 74, 35–46. [Google Scholar] [CrossRef]
- Huang, Q.H.; Dai, L. Research on the evaluation of logistics performance of key provinces and cities in China under the “Belt and Road” initiative. Mod. Manag. Sci. 2021, 1, 61–67. [Google Scholar]
- Gan, W.; Yao, W.; Huang, S. Evaluation of Green Logistics Efficiency in Jiangxi Province Based on Three-Stage DEA from the Perspective of High-Quality Development. Sustainability 2022, 14, 797. [Google Scholar] [CrossRef]
- Wang, Q.; Zhang, Y. Comprehensive Evaluationof the Silk Road Economic Belt “Core Zone” Logistics Efficiency and Differentiate Provincial and Country Comparison. Mod. Manag. Sci. 2016, 24, 152–157. [Google Scholar]
- Guan, L.; Zhao, W. Evaluation of the efficiency of rural infrastructure supply based on DEA-Malmquist. Stat. Decis. Mak. 2020, 36, 172–175. [Google Scholar]
- Carayannis, E.G.; Grigoroudis, E.; Goletsis, Y. A multilevel and multistage efficiency evaluation of innovation systems: A multi-objective DEA approach. Expert Syst. Appl. 2016, 62, 63–80. [Google Scholar] [CrossRef]
- Cheng, C.; Mu, W. Study on the impact of environmental regulation on the green development of logistics industry—An empirical test from Beijing-Tianjin-Hebei region. J. Clean. Prod. 2021, 40, 107–114. [Google Scholar]
- Wang, Y.; Xin, L. The impact of China’s trade with economies participating in the Belt and Road Initiative on the ecological total factor energy efficiency of China’s logistics industry. J. Clean. Prod. 2020, 276, 124196. [Google Scholar] [CrossRef]
- Gan, W.; Xu, Y.; Huang, W.; Ding, R.; He, D. Research on total factor productivity of logistics industry in Jiangxi Province based on DEA-Malmquist. J. Clean. Prod. 2015, 18, 108–114. [Google Scholar]
- Gan, W.; Yao, W.; Liu, Z. Evaluation of the Impact of Logistics Industry on Regional Economic Vitality from the Perspective of National Logistics Hub Construction. Logist. Technol. 2020, 39, 16–22. [Google Scholar]
- Luo, M.; Wen, T. Exploring the Development Factors of Fresh Cold Chain Logistics in China: A Methodology Based on Fuzzy Analytic Hierarchy Process. Manag. Sci. Eng. 2024, 13, 683–694. [Google Scholar] [CrossRef]
- Yang, B.; Bai, X.; Bai, L. Evaluation of carbon emission efficiency of logistics industry in Jiangsu based on PCA and DEA. Jiangsu Univ. Sci. Technol. 2018, 8, 171–176. [Google Scholar]
- Jebbor, I.; Benmamoun, Z.; Hachimi, H. Forecasting supply chain disruptions in the textile industry using machine learning: A case study. Ain Shams Eng. J. 2024, 15, 103116. [Google Scholar] [CrossRef]
- Jones, M.C.; Marron, J.S.; Sheather, S.J. A Brief Survey of Bandwidth Selection for Density Estimation. Publ. Am. Stat. Assoc. 1996, 91, 401–407. [Google Scholar] [CrossRef]
- Ran, W.; Liu, R.; Liu, S. Area Differences in Regional Logistics Efficiency and the Law Governing Its Temporal and Spatial Evolution. J. Adv. Transp. 2022, 3596524. [Google Scholar] [CrossRef]
- Zhu, T.X.; Song, H. Assessing Logistics Industry Efficiency and Identifying Determinants in Shijiazhuang, China–A Comprehensive Analysis. Promet-Traffic Transp. 2025, 37, 185–199. [Google Scholar] [CrossRef]
- Zhou, T.; Li, W. Analysis on Logistics Efficiency Measurement of New Western Land-Sea Corridor under the Background of “Double Carbon” and Ecological Environment Protection. J. Environ. Public Health 2023, 8642841. Available online: https://onlinelibrary.wiley.com/doi/full/10.1155/2023/8642841 (accessed on 1 March 2025). [CrossRef]
- Nicoletti, B.; Appolloni, A. Green Logistics 5.0: A review of sustainability-oriented innovation with foundation models in logistics. Eur. J. Innov. Manag. 2024, 27, 542–561. [Google Scholar] [CrossRef]
- Wilson, G.; Horsey, B.; Stone, R. Implementing concepts from green logistics in the turkey production supply chain. Front. Sustain. 2024, 5, 1416964. [Google Scholar] [CrossRef]
- Zhu, Z.; Zhao, S.; Liu, J.; Wang, M.; Lv, X. Evaluation of carbon emissions for fresh food last-mile delivery: A comparative analysis of two refrigeration methods. Case Stud. Therm. Eng. 2024, 60, 104787. [Google Scholar] [CrossRef]
- Delfmann, W.; Ten Hompel, M.; Kersten, W.; Schmidt, T.; Stölzle, W. Logistics as a science: Central research questions in the era of the fourth industrial revolution. Logist. Res. 2018, 11, 1–13. [Google Scholar]
- Rühlin, V.; Scherrer, M.; Crijns-Graus, W.; Worrell, E. Marginal abatement cost curves for cold food supply chains–A hybrid adoption of the practice-based and supply-chain practice view. J. Clean. Prod. 2025, 518, 145902. [Google Scholar] [CrossRef]
- Kouhizadeh, M.; Zhu, Q.; Sarkis, J. Circular economy performance measurements and blockchain technology: An examination of relationships. Int. J. Logist. Manag. 2023, 34, 720–743. [Google Scholar] [CrossRef]
- Wang, Y.; Jiang, Q.; Guan, X.; Guan, X. Recycling channel design and coordination in a reverse supply chain with customer green preference. Transp. Res. Part E Logist. Transp. Rev. 2023, 179, 103329. [Google Scholar] [CrossRef]
- Dubey, R.; Bryde, D.J.; Dwivedi, Y.K.; Graham, G.; Foropon, C.; Papadopoulos, T. Dynamic digital capabilities and supply chain resilience: The role of government effectiveness. Int. J. Prod. Econ. 2023, 258, 108790. [Google Scholar] [CrossRef]
- Jing, W.; Zhang, L. Environmental regulation, economic opening and China’s industrial green technology progress. Econ. Res. 2014, 49, 34–47. [Google Scholar]
- Fu, H.; Zhou, T.; Zhang, S.; Wang, Q. The impact of government subsidy and weather on environmentally sustainable investment decision for agricultural supply chain. PLoS ONE 2023, 18, e0285891. [Google Scholar] [CrossRef]
- Liu, Z.; Huang, N.; Han, C.; Yang, M.; Zhao, Y.; Sun, W.; Arya, V.; Gupta, B.B.; Shi, L. An optimal decision for fresh products’ cold chain considering freshness and carbon emission reduction. Br. Food J. 2024, 126, 2477–2499. [Google Scholar] [CrossRef]
- Mankiw, N.G.; Romer, D.; Weil, D.N. A contribution to the empirics of economic growth. Q. J. Econ. 1992, 107, 407–437. [Google Scholar] [CrossRef]
- Hausman, J.A. Specification tests in econometrics. Econometrica 1978, 46, 1251–1271. [Google Scholar] [CrossRef]
- Greene, W.H. Econometric Analysis, 5th ed.; Pearson Education: London, England, 2003. [Google Scholar]
- Wooldridge, J.M. Econometric Analysis of Cross Section and Panel Data, 2nd ed.; MIT Press: Cambridge, MA, USA, 2010. [Google Scholar]
- Mundlak, Y. On the pooling of time series and cross section data. Econometrica 1978, 46, 69–85. [Google Scholar] [CrossRef]
- Wooldridge, J.M. Correlated random effects models with unbalanced panels. J. Econom. 2019, 211, 137–150. [Google Scholar] [CrossRef]
- Chu, H.; Feng, T. Issues and Solutions Concerning the Development Model of Agricultural Product Cold Chain Logistics in Heilongjiang Province. Heilongjiang Sci. 2020, 11, 154–155. [Google Scholar]
- Wang, X.; Zhang, Q. Construction of a Cold Chain Logistics System for Fresh Agricultural Products Based on the Internet of Things: Framework, Mechanism, and Path. J. Nanjing Agric. Univ. 2016, 16, 31–41. [Google Scholar]
- Tu, J. Research on the Spatial-Temporal Evolution and Drivers of China’s Green Logistics Efficiency. Price Theory Pract. 2025, 6, 213–218+238. [Google Scholar]
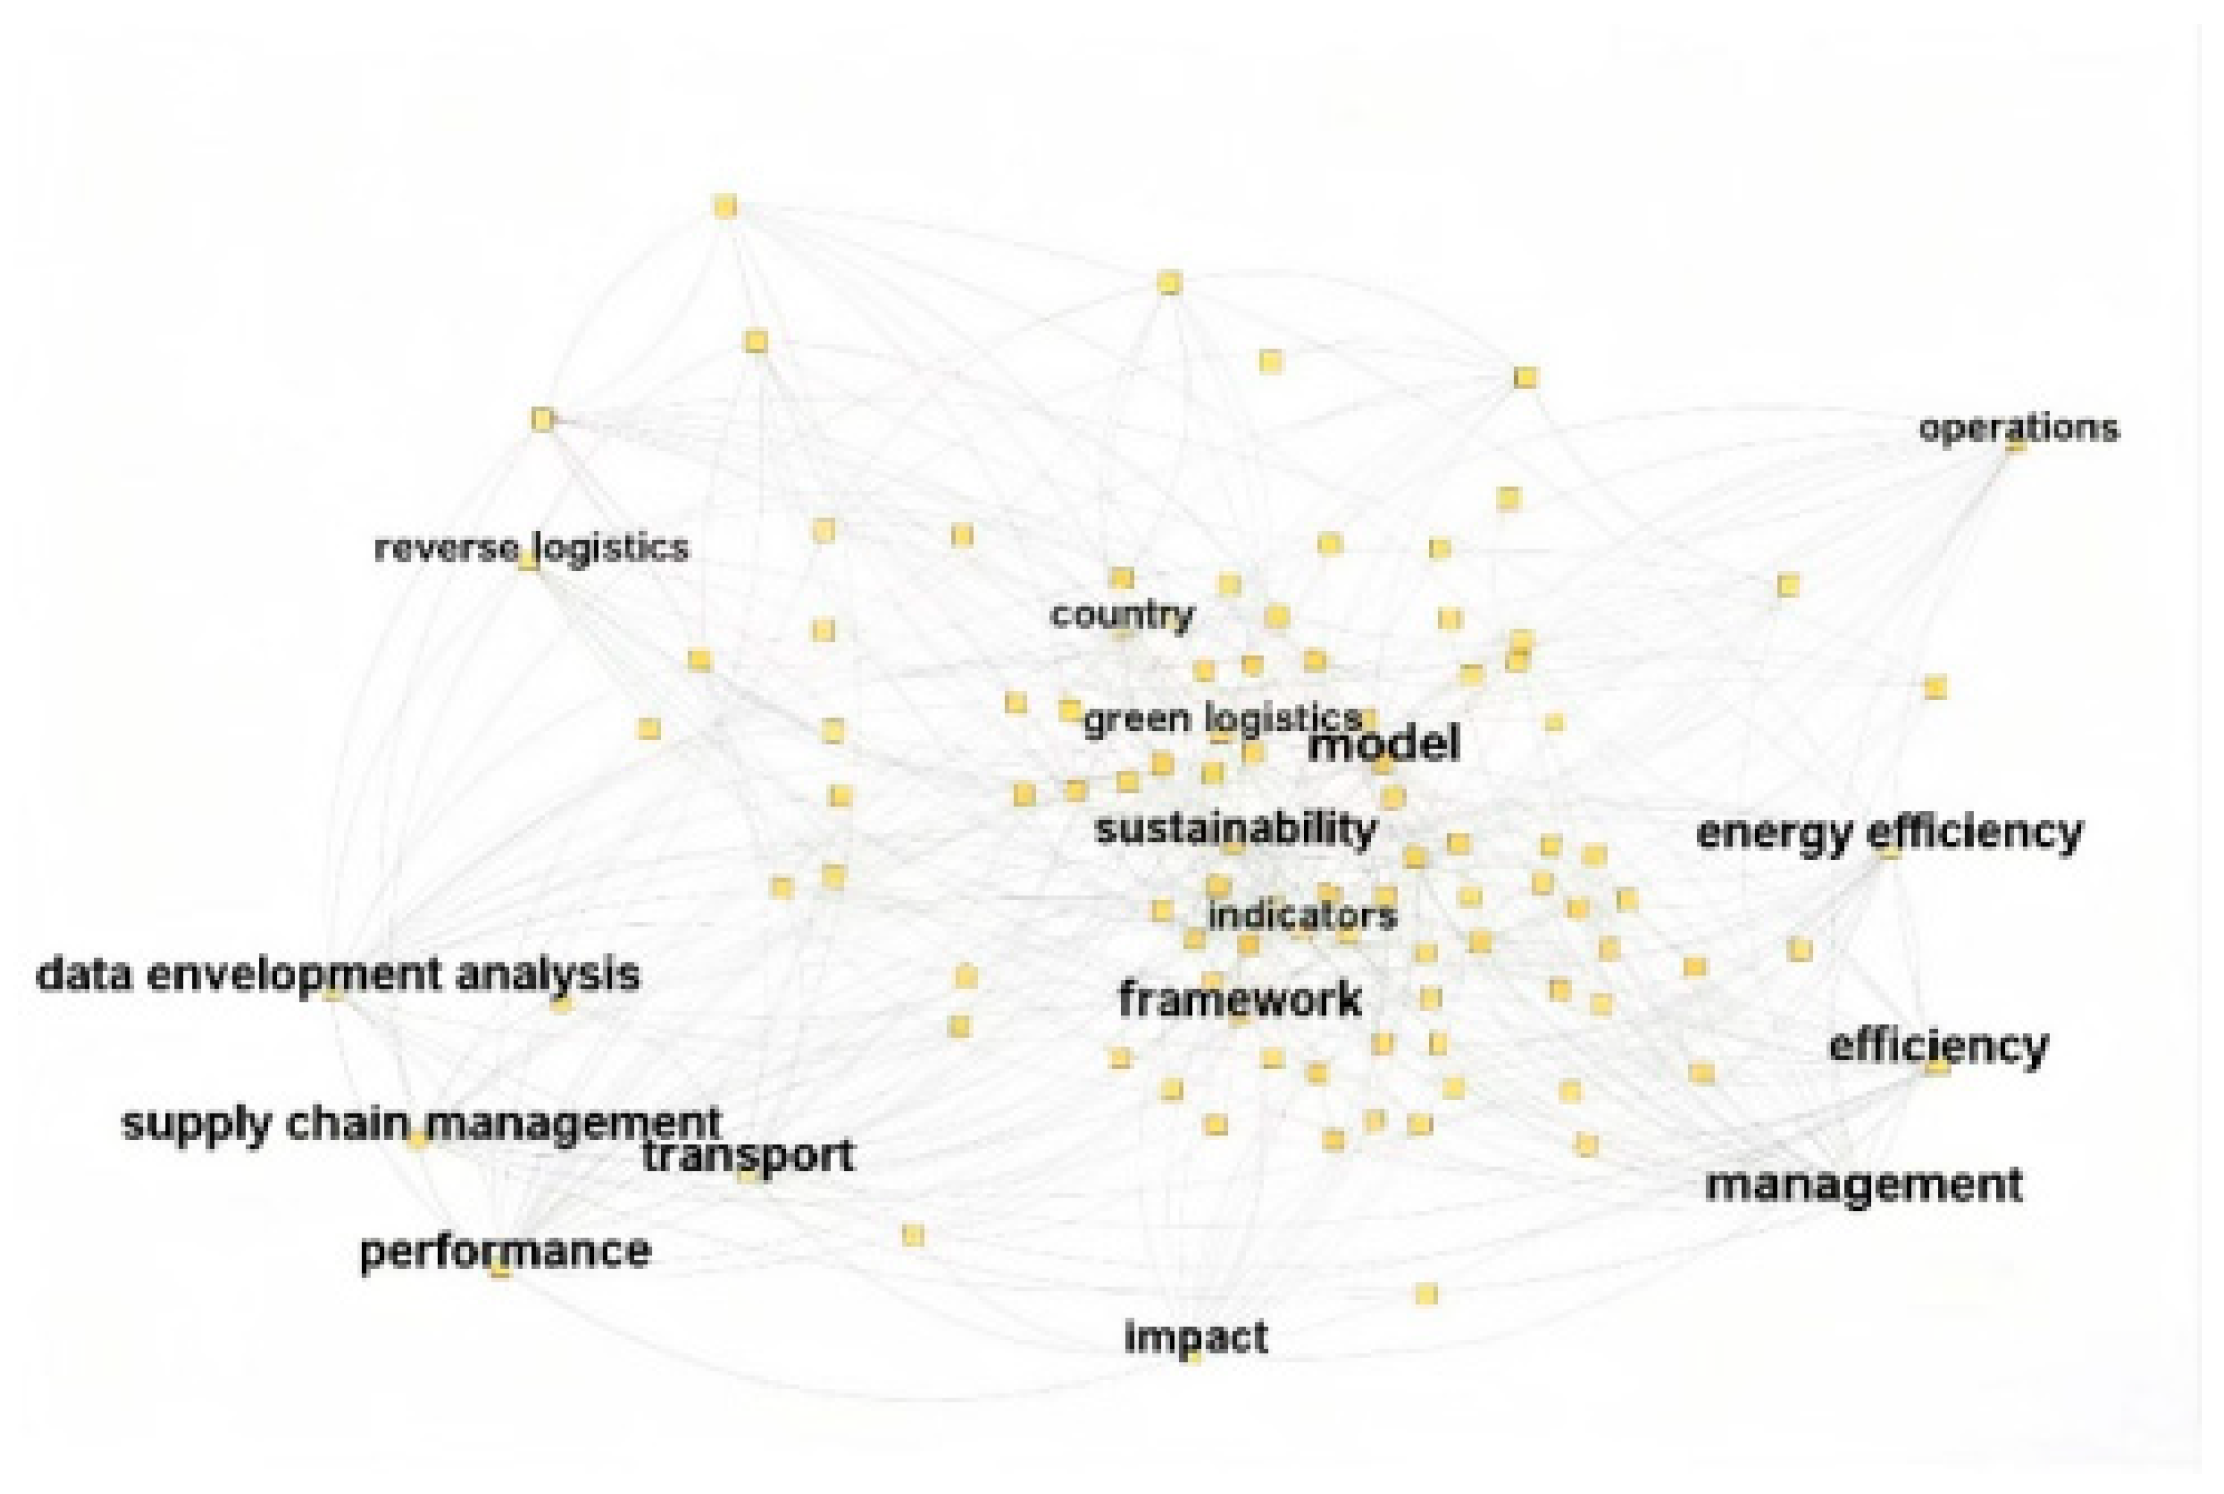
| Indicator Name | Frequency |
|---|---|
| Carbon emissions from the logistics industry | 30 |
| Fixed asset investment | 29 |
| Energy consumption of the logistics industry | 26 |
| Employment in the logistics industry | 24 |
| Freight turnover | 12 |
| Agricultural product freight volume | 8 |
| Value added of the tertiary industry | 8 |
| Total output value of the logistics industry | 1 |
| Indicator Type | Primary Indicator | Secondary Indicator | |
|---|---|---|---|
| Input | Labor input | Employment in the logistics industry | Number of employees in transportation, storage, and postal services |
| Capital input | Regional fixed asset investment | Total fixed asset investment in each region | |
| Energy input | Energy consumption of the logistics industry | Converted into standard coal equivalent | |
| Infrastructure input | Total mileage of transportation routes | Total highway mileage within the region | |
| Output | Desirable output | Value added of the tertiary industry | Regional value added of the tertiary sector |
| Freight turnover | Regional freight turnover | ||
| Agricultural product freight volume | Sum of meat, eggs, aquatic products, vegetables, fruits, and milk | ||
| Undesirable output | Carbon emissions from the logistics industry | Estimated following the 2006 IPCC Guidelines for National Greenhouse Gas Inventories | |
| Parameter | Definition |
|---|---|
| Number of input indicators, set to 4 | |
| Number of desirable output indicators, set to 3 | |
| Number of undesirable output indicators, set to 1 | |
| Calculated efficiency value of agricultural green cold-chain logistics | |
| Slack variable for the -th input indicator, representing input redundancy (negative deviation) | |
| Slack variable for the -th desirable output indicator, representing output shortfall (positive deviation) | |
| Slack variable for the -th undesirable output indicator, representing the excess that needs to be reduced (negative deviation) | |
| Number of cities, set to 34 | |
| Number of periods, set to 15 | |
| The -th input indicator | |
| The -th desirable output indicator | |
| The -th undesirable output indicator | |
| The -th input of city in period | |
| The -th desirable output of city in period | |
| The -th undesirable output of city in period | |
| Weight variable of city in period | |
| Optimal input of city in period | |
| Optimal desirable output of city in period | |
| Optimal undesirable output of city in period |
| Year | Liaoning | Jilin | Heilongjiang | Three Northeastern |
|---|---|---|---|---|
| 2008 | 0.37 | 0.49 | 0.32 | 0.38 |
| 2009 | 0.36 | 0.45 | 0.31 | 0.36 |
| 2010 | 0.36 | 0.47 | 0.31 | 0.37 |
| 2011 | 0.38 | 0.48 | 0.31 | 0.38 |
| 2012 | 0.38 | 0.45 | 0.32 | 0.37 |
| 2013 | 0.38 | 0.45 | 0.38 | 0.40 |
| 2014 | 0.41 | 0.48 | 0.35 | 0.41 |
| 2015 | 0.46 | 0.50 | 0.35 | 0.43 |
| 2016 | 0.46 | 0.53 | 0.37 | 0.44 |
| 2017 | 0.48 | 0.52 | 0.36 | 0.45 |
| 2018 | 0.50 | 0.60 | 0.38 | 0.48 |
| 2019 | 0.50 | 0.47 | 0.37 | 0.45 |
| 2020 | 0.49 | 0.47 | 0.35 | 0.44 |
| 2021 | 0.52 | 0.46 | 0.35 | 0.46 |
| 2022 | 0.51 | 0.39 | 0.31 | 0.41 |
| Average | 0.44 | 0.48 | 0.34 | 0.41 |
| Year | EC | TC | PEC | SEC | ML Index |
|---|---|---|---|---|---|
| 2008–2009 | 0.975 | 0.976 | 0.984 | 0.991 | 0.952 |
| 2009–2010 | 0.929 | 1.083 | 0.961 | 0.966 | 1.006 |
| 2010–2011 | 0.995 | 1.035 | 0.943 | 1.055 | 1.030 |
| 2011–2012 | 1.005 | 0.987 | 0.946 | 1.062 | 0.992 |
| 2012–2013 | 0.907 | 1.128 | 0.911 | 0.996 | 1.023 |
| 2013–2014 | 1.076 | 0.987 | 1.101 | 0.977 | 1.061 |
| 2014–2015 | 0.858 | 1.207 | 0.939 | 0.913 | 1.035 |
| 2015–2016 | 0.994 | 1.054 | 1.129 | 0.881 | 1.048 |
| 2016–2017 | 0.968 | 1.037 | 0.972 | 0.996 | 1.004 |
| 2017–2018 | 1.232 | 0.860 | 1.026 | 1.200 | 1.059 |
| 2018–2019 | 0.997 | 0.939 | 0.981 | 1.017 | 0.936 |
| 2019–2020 | 1.205 | 0.812 | 1.075 | 1.121 | 0.978 |
| 2020–2021 | 0.941 | 1.071 | 0.988 | 0.952 | 1.007 |
| 2021–2022 | 1.090 | 0.836 | 0.966 | 1.128 | 0.911 |
| Average | 1.012 | 1.001 | 0.994 | 1.018 | 1.003 |
| City | EC | TC | PEC | SEC | ML Index |
|---|---|---|---|---|---|
| Shenyang | 0.998 | 1.090 | 0.998 | 1.000 | 1.088 |
| Dalian | 1.002 | 1.067 | 0.996 | 1.006 | 1.069 |
| Anshan | 0.983 | 1.026 | 0.983 | 1.000 | 1.009 |
| Fushun | 1.033 | 0.974 | 1.039 | 0.995 | 1.006 |
| Benxi | 1.025 | 0.983 | 0.999 | 1.026 | 1.007 |
| Dandong | 1.041 | 0.959 | 1.000 | 1.041 | 1.000 |
| Jinzhou | 1.037 | 0.977 | 1.001 | 1.035 | 1.013 |
| Yingkou | 1.038 | 0.977 | 1.037 | 1.000 | 1.014 |
| Fuxin | 1.049 | 0.953 | 1.002 | 1.047 | 1.000 |
| Liaoyang | 1.002 | 1.010 | 1.002 | 1.000 | 1.012 |
| Panjin | 1.039 | 0.983 | 1.038 | 1.001 | 1.021 |
| Tieling | 1.072 | 0.947 | 1.069 | 1.003 | 1.015 |
| Chaoyang | 1.049 | 0.963 | 1.052 | 0.996 | 1.010 |
| Huludao | 1.029 | 0.971 | 1.007 | 1.022 | 1.000 |
| Changchun | 0.965 | 1.023 | 0.986 | 0.979 | 0.987 |
| Jinlin | 0.931 | 1.058 | 0.931 | 1.000 | 0.985 |
| Siping | 0.945 | 1.032 | 1.000 | 0.945 | 0.975 |
| Liaoyuan | 1.001 | 0.987 | 0.995 | 1.006 | 0.988 |
| Tonghua | 1.007 | 0.983 | 1.007 | 1.001 | 0.990 |
| Baishan | 1.063 | 0.937 | 1.064 | 0.999 | 0.996 |
| Songyuan | 1.002 | 0.978 | 1.002 | 1.000 | 0.980 |
| Baicheng | 0.971 | 0.992 | 0.921 | 1.054 | 0.964 |
| Haerbin | 0.910 | 1.083 | 0.925 | 0.984 | 0.986 |
| Qiqihaer | 0.974 | 0.999 | 0.918 | 1.061 | 0.974 |
| Jixi | 1.027 | 0.978 | 0.973 | 1.056 | 1.004 |
| Hegang | 1.003 | 0.999 | 1.000 | 1.004 | 1.003 |
| Shuangyashan | 1.031 | 0.978 | 1.009 | 1.022 | 1.009 |
| Daqing | 1.036 | 0.988 | 1.036 | 1.000 | 1.023 |
| Yichun | 1.028 | 0.976 | 0.988 | 1.041 | 1.003 |
| Jiamusi | 1.008 | 0.987 | 0.959 | 1.051 | 0.995 |
| Qitaihe | 0.999 | 1.004 | 1.004 | 0.994 | 1.003 |
| Mudanjiang | 0.988 | 0.998 | 0.949 | 1.041 | 0.986 |
| Heihe | 1.015 | 0.975 | 0.957 | 1.061 | 0.990 |
| Suihua | 0.969 | 1.008 | 0.927 | 1.046 | 0.977 |
| Average | 1.008 | 0.995 | 0.993 | 1.015 | 1.002 |
| Year | Intra-Regional Differences | Between-Region Disparities | Over-Dispersion Density | |||
|---|---|---|---|---|---|---|
| Gw | Contribution Rate (%) | Gb | Contribution Rate (%) | Gt | Contribution Rate (%) | |
| 2008 | 0.039 | 24.368 | 0.084 | 52.242 | 0.038 | 23.39 |
| 2009 | 0.04 | 24.973 | 0.077 | 48.449 | 0.042 | 26.578 |
| 2010 | 0.044 | 25.482 | 0.087 | 50.466 | 0.042 | 24.051 |
| 2011 | 0.043 | 25.466 | 0.088 | 52.018 | 0.038 | 22.516 |
| 2012 | 0.042 | 25.904 | 0.075 | 46.695 | 0.044 | 27.401 |
| 2013 | 0.062 | 29.262 | 0.029 | 13.791 | 0.120 | 56.947 |
| 2014 | 0.042 | 27.533 | 0.064 | 41.667 | 0.047 | 30.800 |
| 2015 | 0.051 | 27.077 | 0.076 | 40.511 | 0.061 | 32.412 |
| 2016 | 0.044 | 25.974 | 0.075 | 44.470 | 0.05 | 29.556 |
| 2017 | 0.049 | 26.412 | 0.077 | 41.470 | 0.06 | 32.118 |
| 2018 | 0.048 | 24.545 | 0.096 | 49.227 | 0.051 | 26.227 |
| 2019 | 0.051 | 26.812 | 0.068 | 35.543 | 0.072 | 37.644 |
| 2020 | 0.049 | 25.596 | 0.074 | 38.426 | 0.069 | 35.978 |
| 2021 | 0.059 | 27.891 | 0.089 | 42.062 | 0.064 | 30.048 |
| 2022 | 0.067 | 28.389 | 0.113 | 47.652 | 0.057 | 23.960 |
| Variable | Liaoning | Jilin | Heilongjiang |
|---|---|---|---|
| β | −0.1978 *** (−4.53) | −0.1594 *** (−3.60) | −0.6300 *** (−12.99) |
| PC | 0.0000 *** (3.54) | 0.0000 ** (2.32) | 0.0000 (1.39) |
| TRD | −0.0000 (−0.76) | 0.0013 (1.29) | −0.0001 * (−1.82) |
| TIV_GDP | 0.0001 (0.16) | −0.0007 (−0.68) | 0.0010 ** (2.22) |
| LTV_GDP | 0.0002 * (1.74) | −0.0002 (−0.16) | 0.0004 *** (15.80) |
| IAP | 0.0000 *** (4.30) | −0.0000 (−1.31) | −0.0000 ** (−2.17) |
| STE | −0.0001 (−0.64) | 0.0006 (1.54) | −0.0001 (−1.58) |
| EPGR | 0.0025 (0.81) | −0.0020 (−0.38) | −0.0006 (−0.88) |
| REAS | −0.0209 *** (−3.34) | −0.0357 (−1.54) | −0.0403 *** (−4.71) |
| α | 0.0128 (0.70) | 0.0306 (0.99) | 0.2054 *** (8.20) |
| R2 | 0.3972 | 0.1516 | 0.8776 |
| Variable | Fisher-ADF | Fisher-PP | ||
|---|---|---|---|---|
| p-Value | Stationarity | p-Value | Stationarity | |
| lnPC | 0.0001 | Stationary | 0.0000 | Stationary |
| TIV_GDP | 0.0000 | Stationary | 0.0000 | Stationary |
| LTV_GDP | 0.0000 | Stationary | 0.0000 | Stationary |
| lnIAP | 0.0000 | Stationary | 0.0000 | Stationary |
| TRD | 0.0000 | Stationary | 0.0000 | Stationary |
| REAS | 0.0000 | Stationary | 0.0000 | Stationary |
| Explanatory Variable | Liaoning | Jilin | Heilongjiang |
|---|---|---|---|
| lnPC | 0.0810 *** (4.6421) | 0.3123 *** (4.7024) | 0.0491 *** (5.1594) |
| TRD | 0.0004 * (1.8505) | -- | −0.0002 ** (−2.5739) |
| TIV_GDP | -- | -- | 0.0025 *** (5.9441) |
| LTV_GDP | 0.0003 * (1.6900) | 0.0056 ** (2.1943) | 0.0004 *** (14.9836) |
| lnIAP | 0.1087 *** (9.0695) | −0.1323 ** (−3.5319) | −0.0046 *** (−6.9546) |
| REAS | −0.0648 *** (−6.3628) | −0.1229 *** (−3.5584) | −0.0605 *** (−8.0458) |
Disclaimer/Publisher’s Note: The statements, opinions and data contained in all publications are solely those of the individual author(s) and contributor(s) and not of MDPI and/or the editor(s). MDPI and/or the editor(s) disclaim responsibility for any injury to people or property resulting from any ideas, methods, instructions or products referred to in the content. |
© 2025 by the authors. Licensee MDPI, Basel, Switzerland. This article is an open access article distributed under the terms and conditions of the Creative Commons Attribution (CC BY) license (https://creativecommons.org/licenses/by/4.0/).
Share and Cite
Chen, C.; Liu, S.; Zhang, X. Efficiency Assessments and Regional Disparities of Green Cold Chain Logistics for Agricultural Products: Evidence from the Three Northeastern Provinces of China. Sustainability 2025, 17, 9367. https://doi.org/10.3390/su17219367
Chen C, Liu S, Zhang X. Efficiency Assessments and Regional Disparities of Green Cold Chain Logistics for Agricultural Products: Evidence from the Three Northeastern Provinces of China. Sustainability. 2025; 17(21):9367. https://doi.org/10.3390/su17219367
Chicago/Turabian StyleChen, Chao, Sixue Liu, and Xiaojia Zhang. 2025. "Efficiency Assessments and Regional Disparities of Green Cold Chain Logistics for Agricultural Products: Evidence from the Three Northeastern Provinces of China" Sustainability 17, no. 21: 9367. https://doi.org/10.3390/su17219367
APA StyleChen, C., Liu, S., & Zhang, X. (2025). Efficiency Assessments and Regional Disparities of Green Cold Chain Logistics for Agricultural Products: Evidence from the Three Northeastern Provinces of China. Sustainability, 17(21), 9367. https://doi.org/10.3390/su17219367


