Article

Efficiency Assessments and Regional Disparities of Green Cold Chain Logistics for Agricultural Products: Evidence from the Three Northeastern Provinces of China

School of Economics and Management, Liaoning University of Technology, Jinzhou 121001, China
*
Author to whom correspondence should be addressed.
Sustainability 2025, 17(21), 9367; https://doi.org/10.3390/su17219367
Submission received: 8 September 2025 / Revised: 16 October 2025 / Accepted: 16 October 2025 / Published: 22 October 2025
(This article belongs to the Section Economic and Business Aspects of Sustainability)

Abstract

Balancing the development of agricultural cold chain logistics with ecological conservation remains a critical challenge for green cold chain logistics in China’s three northeastern provinces. This study evaluates the efficiency of green cold chain logistics to promote synergy between logistics development and ecological sustainability. Using CiteSpace for keyword co-occurrence analysis and literature extraction, an evaluation index system comprising eight input and output indicators was constructed. The super-efficiency Slacks-Based Measure (SBM) model and the Malmquist–Luenberger (ML) productivity index were employed to assess efficiency from static and dynamic perspectives, respectively. Kernel density estimation was used to examine spatial distribution patterns, and the Dagum Gini coefficient was applied to decompose regional disparities. The results indicate that (1) overall efficiency remains relatively low, with ML index changes primarily driven by technological progress; (2) substantial regional differences exist among the three provinces in terms of distribution location, shape, and degree of polarization; and (3) inter-regional disparities are the main source of variation. A Tobit model further identified the key influencing factors, indicating that the level of economic development, growth of the tertiary industry, and informatization are the main drivers. These findings provide valuable insights for optimizing regional green cold chain logistics and promoting sustainable agricultural development.

1. Introduction

With the rapid growth of China’s economy, consumers are increasingly favoring high-quality food ingredients, particularly fresh agricultural products. China’s cold chain logistics sector has entered a stage of accelerated development, characterized by continuous expansion in infrastructure and market demand. However, this growth is accompanied by a rise in greenhouse gas emissions [1]. As one of the country’s major agricultural production bases and a key supplier of fresh products, the three northeastern provinces have witnessed further expansion of cold chain logistics, driven by both supply-side capacity and demand-side growth. The emergence of fresh food e-commerce has pushed regional demand for agricultural cold chain logistics to unprecedented levels. This system requires a consistently stable low-temperature environment, leading to significant consumption of fossil fuels or electricity. Under conditions of underdeveloped cold chain infrastructure, the associated carbon emissions have become an even more pressing issue [2]. Consequently, the development of green logistics has emerged as a central objective of both technological innovation and policy initiatives within the logistics industry, stimulating extensive research from diverse perspectives. For instance, Zailani Suhaiza et al. (2014) [3] analyzed the relationship between technological innovation and green logistics; Du Gang et al. (2022) [4] argued that innovation-oriented cities can significantly enhance green logistics efficiency; and TH Kim et al. (2012) [5] and MH Kang et al. (2021) [6] discussed the crucial role of policy guidance in promoting green logistics development. As a high-latitude region with substantial cold chain logistics demand, the three northeastern provinces are representative in terms of both supply and demand scales and their distinctive regional characteristics [7]. Reconciling the tension between the development of agricultural cold chain logistics and the goal of ecological conservation thus remains not only a central challenge for advancing green cold chain logistics in the three northeastern provinces but also serves as a reminder of the long and complex journey ahead for China’s green logistics transformation.
There is currently no authoritative definition of green cold chain logistics. Drawing on the conceptual foundations of cold chain logistics [8] and green logistics [9], green cold chain logistics can be defined as a logistics practice that maintains products within a specified low-temperature range throughout the entire process from harvesting or production to consumption while seeking a sustainable balance among environmental, economic, and social objectives. Green logistics fundamentally depends on optimizing resource allocation across all operational stages, a process closely associated with improvements in logistics efficiency [10]. Fugate B.S. et al. (2010) [11] and Hong Shuquan et al. (2023) [12] identify logistics efficiency as one of the core indicators for evaluating the development level of the logistics sector. In the context of agricultural cold chain logistics, it is essential not only to maintain the optimal temperature range for fresh products to minimize spoilage but also to address environmental constraints such as refrigeration energy consumption and carbon emission intensity [13]. Logistics efficiency reflects the rationality of resource allocation in areas such as refrigerated equipment utilization and transportation route planning, directly influencing the post-harvest loss rate of fresh agricultural products, which ranges from 15% to 30% [14]. Therefore, analyzing logistics efficiency is crucial for fostering synergy between the advancement of agricultural cold chain logistics and the achievement of ecological sustainability [15].
Data Envelopment Analysis (DEA) has long been recognized as one of the most effective approaches for measuring efficiency [16,17,18,19]. However, traditional DEA models require proportional adjustments to all slack variables, which fails to capture the heterogeneous flexibility of factor adjustments in real production systems and also does not account for the potential influence of undesirable outputs or environmental variables [20,21]. To address these limitations, Tone (2001) [22] proposed the non-radial Slacks-Based Measure (SBM) model, which relaxes the proportional improvement constraint of traditional models and allows heterogeneous adjustment paths for slack variables. Nevertheless, this model still cannot distinguish among efficient decision-making units (DMUs). Subsequently, Fried et al. (2002) [23] developed the three-stage DEA model to incorporate environmental variables, but this model likewise cannot rank efficient DMUs. To overcome these issues, Tone further introduced the undesirable-output SBM model (2002) [24] and the super-efficiency SBM model (2003) [25]. The former incorporates undesirable outputs into the analysis but remains unable to differentiate DMUs located on the efficiency frontier, as efficiency scores are constrained to unity. In contrast, the latter enables efficiency scores greater than one for efficient units, thereby providing a more accurate reflection of their relative advantages and effectively resolving the ranking issue among multiple efficient DMUs [26]. Because of its ability to surpass the unity constraint, accommodate multiple inputs and both desirable and undesirable outputs, and perform reliably with small samples, the super-efficiency SBM model has been widely applied in logistics efficiency assessments, including port logistics evaluation [27], national green logistics sustainability analysis [28], and logistics performance evaluation research [29].
The inputs in agricultural green cold chain logistics encompass various factors such as labor, capital, and energy, while the outputs include not only desirable outcomes such as logistics capacity but also undesirable outcomes such as carbon emissions. Building upon the theoretical framework of production frontier analysis, this study extends the traditional model of a “single desirable output” to incorporate both desirable and undesirable outputs, thereby constructing a frontier model specifically tailored to the context of green cold chain logistics for agricultural products. As authoritative statistical data on green logistics in China’s three northeastern provinces have only recently become available, large-sample empirical studies remain infeasible. Consequently, this study adopts the super-efficiency SBM model to conduct a static evaluation of the green cold chain logistics efficiency for agricultural products in the three provinces. To address the limitations of traditional frontier models that neglect slack variables, a non-radial optimization approach is applied. By introducing the design of “efficiency values greater than 1,” the model effectively differentiates efficient units on the frontier, achieving a more precise fitting and measurement of the “green cold chain logistics frontier for agricultural products.” Moreover, compared with the traditional Malmquist index, the ML index explicitly incorporates undesirable outputs on the production side, making it more suitable for assessing green logistics efficiency. The ML productivity index is employed to analyze dynamic efficiency changes, aiming to more accurately capture the current development status of green cold chain logistics efficiency and identify key challenges in its advancement. Building on these analyses, a Tobit model is further applied to explore the factors underlying regional efficiency disparities, thereby providing a basis for more targeted policy recommendations to support the sustainable development of agricultural cold chain logistics in the three northeastern provinces.
The primary objective of this study is to scientifically assess the efficiency of agricultural green cold chain logistics in China’s three northeastern provinces, identify the sources and determinants of regional disparities, and thereby narrow efficiency gaps and enhance overall performance. From a long-term perspective, this research aims to reconcile the tension between the development of agricultural cold chain logistics and the ecological development goals of these provinces.
The marginal contributions of this paper are twofold. First, recognizing the energy-intensive nature of agricultural cold chain logistics, this study integrates the concept of green development into the efficiency evaluation framework by constructing a production frontier model specifically designed for agricultural green cold chain logistics, thereby providing a new analytical perspective for related research. Second, the study not only offers a comprehensive characterization of regional heterogeneity in agricultural green cold chain logistics efficiency across the three provinces but also explores the underlying drivers of these disparities and puts forward targeted policy recommendations, contributing both theoretical insights and practical implications to advance the green transformation of agricultural cold chain logistics.

2. Index Selection and Model Construction

2.1. Indicators and Data

2.1.1. Indicator Selection

The measurement of logistics efficiency primarily examines the quantitative relationship between the total inputs and total outputs of the logistics sector [30,31,32,33]. Accordingly, this study classifies the evaluation indicators for agricultural green cold chain logistics efficiency into two dimensions, inputs and outputs, with the latter further subdivided into desirable and undesirable outputs.
First, word frequency statistics were employed to conduct a preliminary screening of indicators, without distinguishing among input, desirable output, and undesirable output categories at this stage. The specific procedures and analytical steps are as follows.
Step 1: Relevant literature was retrieved from the Web of Science and JSTOR databases using keywords closely aligned with the theme of this study. The core search terms included “Green logistics index construction,” “Carbon constraints,” “Agricultural green logistics index construction,” “Logistics efficiency indicators,” and “Green logistics indicators.” A total of 374 publications were identified.
Step 2: Using CiteSpace, duplicate records were identified and removed, resulting in 333 valid publications. A keyword co-occurrence analysis was then performed on the filtered literature, covering the period from 2005 to 2025. Subsequently, a keyword co-occurrence knowledge map was generated, as illustrated in Figure 1. In this map, nodes represent consensus-based core topics, while links represent the strength of associations between them.
Step 3: Keyword frequency statistics were obtained from the keyword co-occurrence results. To prevent generic terms directly related to the research theme—such as “green logistics,” “cold chain logistics,” and “agricultural products”—from dominating the frequency rankings due to repeated appearances, these baseline terms were excluded. The top 25 high-frequency keywords were then extracted, representing research topics that have received greater scholarly attention. The literature associated with these high-frequency keywords was subsequently reviewed, and keyword frequency statistics relevant to the construction of the indicator system were compiled.
Step 4: To ensure that the indicator selection accurately reflects regional characteristics, current government priorities and policy orientations were also considered. Using the keywords “green logistics,” “cold chain logistics,” and “agricultural cold chain logistics,” relevant policy documents were collected from the official websites of central government agencies in China as well as from the provincial governments of the three northeastern provinces. Frequency statistics were then performed on the policy content related to the construction of the indicator system.
Step 5: The frequency statistics derived from Steps 3 and 4 were combined and integrated to produce the final indicator system frequency statistics, which are presented in Table 1.
Furthermore, this study finds that existing evaluation systems for green logistics efficiency have primarily focused on capital input, labor input, and energy input [34,35,36,37]. However, logistics infrastructure also plays a crucial role in influencing logistics efficiency [38]. Therefore, this study incorporates logistics infrastructure as an additional input indicator in evaluating the efficiency of green cold chain logistics. Regarding output indicators, since cold chain logistics involves substantial consumption of fossil fuels and electricity, it inevitably generates a certain level of carbon dioxide emissions. Following the approach of Yang B. (2018) [39], this study uses carbon emissions as an undesirable output indicator. Based on the above analysis, the constructed evaluation system is outlined in Table 2.
Specifically, (1) Labor input refers to the total number of workers engaged in positions related to the logistics system. This indicator effectively reflects the intensity of labor input in the industry and serves as an important quantitative measure of the logistics sector’s scale. Due to the lack of statistical data on employees in the agricultural cold chain logistics industry of the three northeastern provinces, this study adopts the number of employees in the transportation, warehousing, and postal industries as a proxy indicator for measuring labor input. Although an indirect measure, it can still reflect the reserve capacity of such personnel. When the workforce is experienced and stable, it can more effectively implement relevant green standards and thereby promote improvements in green logistics efficiency. (2) Capital input denotes the long-term financial and resource investments made by enterprises or institutions to construct, upgrade, and maintain the logistics system. Fixed asset investment reflects the intensity of capital allocation in regional logistics system construction, encompassing total capital expenditures on new infrastructure, equipment replacement, and technological upgrading. In this study, fixed asset investment is used as a proxy for capital input in green cold chain logistics equipment. Increased capital investment facilitates equipment upgrades, and advanced technologies—through precise temperature control—can reduce the spoilage rate of agricultural products, thereby enhancing logistics efficiency. (3) Energy input represents the total consumption of various energy resources, directly or indirectly, during transportation, warehousing, loading, and unloading processes, with the primary objective of maintaining logistics system operations. This study selects energy consumption in the logistics industry as the key indicator to capture energy utilization during logistics operations. This parameter effectively assesses both regional environmental carrying capacity and the effectiveness of green logistics implementation. For instance, when traditional cold storage or refrigerated trucks operate with low energy efficiency or outdated refrigeration equipment, energy consumption increases, resulting in a decline in green cold chain logistics efficiency. (4) Infrastructure input refers to investments in both traditional fixed assets and digital infrastructure that support efficient logistics operations, covering transportation networks, warehousing facilities, technical equipment, and information systems. A well-developed transportation network can reduce the average distance between production areas and markets, thereby lowering per-unit energy consumption and carbon emissions, which in turn enhances green cold chain logistics efficiency. This study uses the total length of transportation routes as a proxy indicator for traditional infrastructure input in the cold chain logistics of the three northeastern provinces.
(5) Value added of the tertiary industry represents the sum of newly created value and the transferred value of fixed assets in the tertiary sector within a given period in a country or region. The expansion of cold chain logistics can drive the value added of the tertiary industry, and its rate of change indirectly reflects the output efficiency of green cold chain logistics. (6) Freight turnover refers to the total product of freight volume and transportation distance completed by transport vehicles within a given period. As a core indicator for measuring the transportation scale and operational efficiency of the logistics industry, freight turnover directly reflects the output level of logistics activities. Given constant total energy consumption, a higher freight turnover implies greater efficiency of energy input per unit. (7) Agricultural product freight volume denotes the total weight or volume of agricultural products transported within a given period and serves as a key indicator for measuring the output of agricultural product logistics. In this study, agricultural product freight volume is selected as the core desirable output indicator for green cold chain logistics. Under constant input conditions, a higher freight volume indicates higher efficiency. (8) Carbon emissions from the logistics industry denote the total greenhouse gas emissions generated directly or indirectly throughout the logistics chain. This serves as the core undesirable output indicator for evaluating the degree of greening in the logistics industry. In the context of green cold chain logistics, high carbon emissions often result from inefficient practices such as outdated refrigeration equipment, circuitous transport routes, or low load factors, all of which increase per-unit energy consumption in the transport of agricultural products. A higher value of this indicator corresponds to lower green cold chain logistics efficiency.

2.1.2. Data Sources and Processing

This study selects 34 major cities across the three northeastern provinces as the sample for evaluating the efficiency of agricultural green cold chain logistics. The primary data were obtained from the China City Statistical Yearbook, China Energy Statistical Yearbook, Tertiary Industry Statistical Yearbook, and the statistical bulletins on national economic and social development of each region, covering the period from 2008 to 2022.
Before model estimation, the dataset underwent a comprehensive examination to identify and address missing values and outliers. Because the selected indicators are expressed in different measurement units, they cannot be directly applied to the model. To ensure comparability and meet model requirements, the Min–Max normalization method was employed for data standardization. This approach strictly maps all indicator values onto a defined target range, exhibits strong adaptability, and is not constrained by the underlying data distribution. Drawing on the data processing approach proposed by Jebbor et al. (2024) [40] and in alignment with the analytical framework of this study, the normalization procedure is formulated as follows in Equation (1).
X i = 0.9 × ( X i min X ) max X min X + 0.1 ,
where X i denotes the normalized indicator value, X i is the original indicator value, min X represents the minimum value of the indicator, and max X represents the maximum value of the indicator.

2.2. Model Construction

2.2.1. Super-Efficiency SBM Model Construction

In this study, each city is regarded as an independent DMU, and a super-efficiency SBM model is constructed. Equation (2) is used to measure the efficiency of agricultural green cold chain logistics in each city, where θ * represents the super-efficiency value obtained after minimizing the objective function. In this formulation, the numerator reflects input redundancy, while the denominator captures output shortfalls. Specifically, when θ * > 1, the city performs more efficiently than other cities on the efficient frontier; when θ * < 1, the city exhibits significant input waste or insufficient output; and when θ * = 1, the city lies exactly on the efficiency frontier without super-efficiency properties.
Equation (3) defines the linear constraint on the input matrix, thereby constructing the optimal input boundary for the allocation of agricultural green cold chain logistics resources and determining the minimum necessary input for city k in period t . Equation (4) specifies the linear constraint on the desirable output matrix, which establishes the optimal boundary for logistics outcomes and determines the maximum attainable desirable output for city k in period t . Equation (5) introduces the constraint on the undesirable output matrix, which constructs the optimal boundary for green development in agricultural cold chain logistics and determines the minimum undesirable output for city k in period t . Equation (6) further incorporates the non-negativity constraints on the DMU weights as well as the slacks for input redundancy, output shortfalls, and undesirable output surpluses, ensuring that the results derived from Equations (3)–(5) directly correspond to the observed redundancy in inputs, insufficiency in desirable outputs, and excess in undesirable outputs.
Despite its advantages, this model also presents several limitations in practical application. First, all inputs and outputs must be non-negative; otherwise, the redundancy rate would lose its economic interpretability. Second, the model is sensitive to extreme outliers—for instance, when a particular variable takes an exceptionally small value, the corresponding DMU may be incorrectly identified as an “extremely efficient DMU,” thereby distorting the frontier and leading to overly estimated efficiency scores for other valid DMUs. Third, missing values should also be avoided, as DMUs with incomplete data are excluded from estimation, which reduces the effective sample size and may affect model robustness.
θ * = min 1 + 1 m i = 1 m S i x x i k t 1 1 n   +   q j = 1 n S j y y j k t + l = 1 q S l b b l k t ,
x i k t t = 1 T j = 1 n λ j k t x i k t S i x , i = 1 , 2 , , m ,
y j k t t = 1 T j = 1 n λ j k t y j k t + S j y , j = 1 , 2 , , n ,
λ j k t 0 , S i x 0 , S j y 0 , S l b 0 ,
The definitions of the parameters in the model are presented in Table 3, where some parameter values are determined based on the sample data analyzed in this study.

2.2.2. ML Index Measurement Method

In this study, the ML productivity index is decomposed into the efficiency change index (EC) and the technological change index (TC), allowing the efficiency of agricultural green cold chain logistics to be examined from two distinct perspectives. Specifically, the EC index captures the pure efficiency changes in each city over the observation period, while the TC index reflects the changes in technological progress across cities during the same period. The decomposition formula is expressed in Equation (7).
M L c t + 1 = E C c × T C c ,
M L c t + 1 x i t , y j t , x i t + 1 , y j t + 1 = E c t x i t + 1 , y j t + 1 , b l t + 1 E c t x i t , y j t , b l t × E c t + 1 x i t + 1 , y j t + 1 , b l t + 1 E c t + 1 x i t , y j t , b l t 1 2 ,
The EC and TC indices are calculated separately, as shown in Equation (8). Specifically, x i t and y j t denote the inputs and desirable outputs in period t , and x i t + 1 , y j t + 1 denote the inputs and desirable outputs in period t   +   1 . B l t and B l t + 1 denote the undesirable outputs in periods t and t   +   1 , respectively, while E c t and E c t + 1 denote the distance functions. When M L > 1, the city’s efficiency of green cold chain logistics for agricultural products is improving, when M L < 1, it is decreasing. Furthermore, it should be emphasized that the calculation of the M L index is highly sensitive to fluctuations in undesirable output data. Hence, ensuring the accuracy of these measurements is crucial for producing reliable and consistent results. In addition, when the M L index is computed based on an unbalanced panel dataset, DMUs with missing values are automatically excluded, which may consequently reduce the regional representativeness of the sample.

3. Efficiency Evaluation Results

3.1. Static Efficiency Calculation Results

The super-efficiency SBM model is applied to measure the static efficiency of green cold chain logistics for agricultural products in the three northeastern provinces over the period 2008–2022. For each province, the reported efficiency value represents the average across its sample cities. The detailed results are presented in Table 4.
From a provincial perspective, the annual average efficiency of green cold chain logistics for agricultural products in Liaoning Province was 0.44. Between 2008 and 2013, the efficiency remained relatively low and stable, reaching its minimum value of 0.36. Thereafter, it exhibited a mild upward trend, peaking at 0.52 in 2021. Overall, from 2015 to 2021, the efficiency level of green cold chain logistics in Liaoning Province can be characterized as moderate.
The overall trend in the other two provinces was broadly comparable to that of Liaoning, though with some notable differences. In Jilin Province, the efficiency of green cold chain logistics for agricultural products was already close to a moderate level in the early years, recording a value of 0.49 in 2008. Although the efficiency fluctuated only slightly during 2008–2013, it showed a marginal decline, reaching a minimum of 0.45. Subsequently, the province experienced a marked upward trajectory, with the efficiency rising to its highest value of 0.60 in 2018. However, this was followed by a steep decline, with the lowest efficiency falling to 0.39 in 2022. As a result, Jilin’s annual average efficiency remained relatively low at 0.48.
Heilongjiang Province exhibited the lowest performance among the three provinces, with an annual average efficiency of only 0.34. Between 2008 and 2013, its efficiency level was slightly below that of Liaoning and markedly lower than that of Jilin. During the subsequent phase of growth in green cold chain logistics efficiency, Heilongjiang demonstrated limited momentum, with the highest value reaching only 0.38. From 2018 to 2022, its efficiency continued to decline, ultimately falling back to the minimum level of 0.31 at the end of the observation period.
Overall, the efficiency of green cold chain logistics for agricultural products in the three northeastern provinces remains relatively low. Among them, Jilin Province maintained a leading position for most of the study period, whereas Heilongjiang consistently exhibited the lowest efficiency levels. Liaoning Province, however, demonstrated stronger resilience and a clearer upward trajectory of efficiency improvement. By 2022, its efficiency value had reached 0.51, showing a distinct advantage over the other two provinces. These findings suggest that Liaoning is likely to achieve green development at a faster pace while continuing to improve efficiency within its cold chain logistics sector.

3.2. Dynamic Efficiency Decomposition Results

While the super-efficiency SBM model can accurately measure the efficiency level of each city in a given year, the Malmquist index directly captures the dynamic changes in efficiency over time. It further decomposes the index into two components—technical efficiency change and technological progress—serving as an important complement to the super-efficiency SBM analysis. In this study, the ML index of green cold chain logistics efficiency for agricultural products in the three northeastern provinces from 2008 to 2022 is examined from both temporal (yearly) and spatial (city-level) perspectives. Moreover, comprehensive technical efficiency change (EC) is further decomposed into pure technical efficiency change (PEC) and scale efficiency change (SEC). Specifically, PEC reflects improvements in technical efficiency after controlling for scale effects, whereas SEC captures the extent to which the production scale of agricultural green cold chain logistics approaches the optimal level. The detailed results are presented in Table 5 and Table 6.
As shown in Table 5, the average annual value of the ML index is 1.003, indicating that the efficiency of green cold chain logistics for agricultural products in the three northeastern provinces increased by an average of 0.3% during the observation period. From 2008 to 2013, the ML index exhibited a fluctuating upward trajectory, reaching its peak of 1.061 in 2014, before turning downward and declining steadily to its lowest value of 0.911 in 2022. Overall, the performance of the ML index across the three provinces aligns closely with the static efficiency results, displaying an initial increase followed by a gradual decline.
The average annual value of technical efficiency change in the three northeastern provinces is 1.012, suggesting that under the existing technological conditions, efficiency improved by approximately 1.2% per year. During the observation period, technical efficiency fluctuated mainly below the mean line, with its lowest value of 0.858 recorded in 2015 and its highest value of 1.232 in 2018. The trend of technical efficiency change does not fully correspond to that of the ML index. Regarding PEC and SEC, PEC dominated comprehensive technical efficiency change only during 2014–2016, whereas in the remaining years, SEC served as the main contributor. This finding indicates that improvements in pure technical efficiency were insufficient, explaining why technical efficiency change values fell below 1 in several years. In contrast, scale efficiency performed relatively well, suggesting that production in most years operated near an optimal scale. This outcome is closely related to a series of local government policies that encouraged the development of agricultural cold chain logistics, thereby contributing to efficiency improvements.
The average value of technological progress is 1.001, implying that technological advancement in agricultural green cold chain logistics across the three northeastern provinces was positive throughout the observation period. In other words, given the same level of inputs, the potential output of green cold chain logistics increased slightly. Before 2015, the technological progress index fluctuated around the mean, peaking at 1.207 in 2015, but subsequently declined to its lowest value of 0.812 in 2020. Overall, the trends of comprehensive technical efficiency and technological progress diverged substantially, with the ML index being largely driven by variations in technological progress.
As shown in Table 6, the annual average growth rate of technical efficiency for agricultural green cold chain logistics across all cities was 0.8%. Among them, 11 cities recorded technical efficiency change values below 1, accounting for 32.35%, while the remaining 23 cities exhibited values above 1. Harbin experienced the sharpest decline in technical efficiency, with an average annual growth rate of −9%, whereas Tieling achieved the most rapid improvement, at 7.2%. Regarding scale efficiency change and pure technical efficiency change, 27 cities (79.41%) recorded scale efficiency change values greater than 1. Qiqihar and Heihe achieved the highest average annual growth rates of 6.1%, indicating that these cities have largely mitigated redundant input factors and benefited from favorable scale effects that have enhanced technical efficiency. For Shenyang, Anshan, Yingkou, Liaoyang, Jilin, Songyuan, and Daqing, the scale efficiency change values were equal to 1, suggesting that their changes in technical efficiency were entirely driven by pure technical efficiency. From the perspective of pure technical efficiency change, the overall annual average growth rate across all cities was −0.7%. Sixteen cities recorded values below 1, with Qiqihar posting the lowest at −8.2%, indicating that these cities have not yet fully realized their efficiency potential under the current technological conditions. Consequently, compared with other cities, they must reduce undesirable outputs more rapidly to achieve efficiency gains.
With respect to technological progress, the overall annual average growth rate across all cities was −0.5%, which is lower than that of technical efficiency change. Only 14 cities (41.17%) had technological progress change values greater than or close to 1, with Baishan recording the lowest rate at −6.3%. From an overall perspective, the annual average ML index for all cities in the three northeastern provinces during 2008–2022 was 1.002, which exceeds 1, indicating a slight overall improvement in green cold chain logistics efficiency. Among the cities, Shenyang exhibited the fastest growth, with an average annual rate of 8.8%. In terms of overall trend, the variations in technological progress closely mirrored those of the ML index, suggesting that the improvement in the efficiency of agricultural green cold chain logistics in the three northeastern provinces was primarily driven by technological advancements—consistent with the earlier findings.

3.3. Spatial Differentiation Characteristics of Efficiency Based on Kernel Density Analysis

Kernel density analysis estimates the probability density of a random variable and describes its distribution pattern through a smooth and continuous density curve. F x denotes the estimated density value at point x , and the calculation formula is expressed as follows.
F ( x ) = 1 N h i = 1 N K x i x ¯ h ,
K ( ) denotes the kernel function, and this study adopts the Gaussian kernel algorithm; N is the sample size. X i represents the independently distributed observations, that is, the efficiency values of agricultural green cold chain logistics for each city in each province across different years. X ¯ denotes the sample mean and h is the bandwidth parameter. Jones et al. (1996) [41] verified that Silverman’s empirical formula ensures optimality for normally distributed data. Therefore, this study applies Silverman’s empirical formula to calculate the bandwidth parameter, as shown in Equation (10), where σ denotes the sample standard deviation and I Q R represents the interquartile range of the sample.
h = 1.06 × min σ , I Q R 1.34 × N 1 5 ,
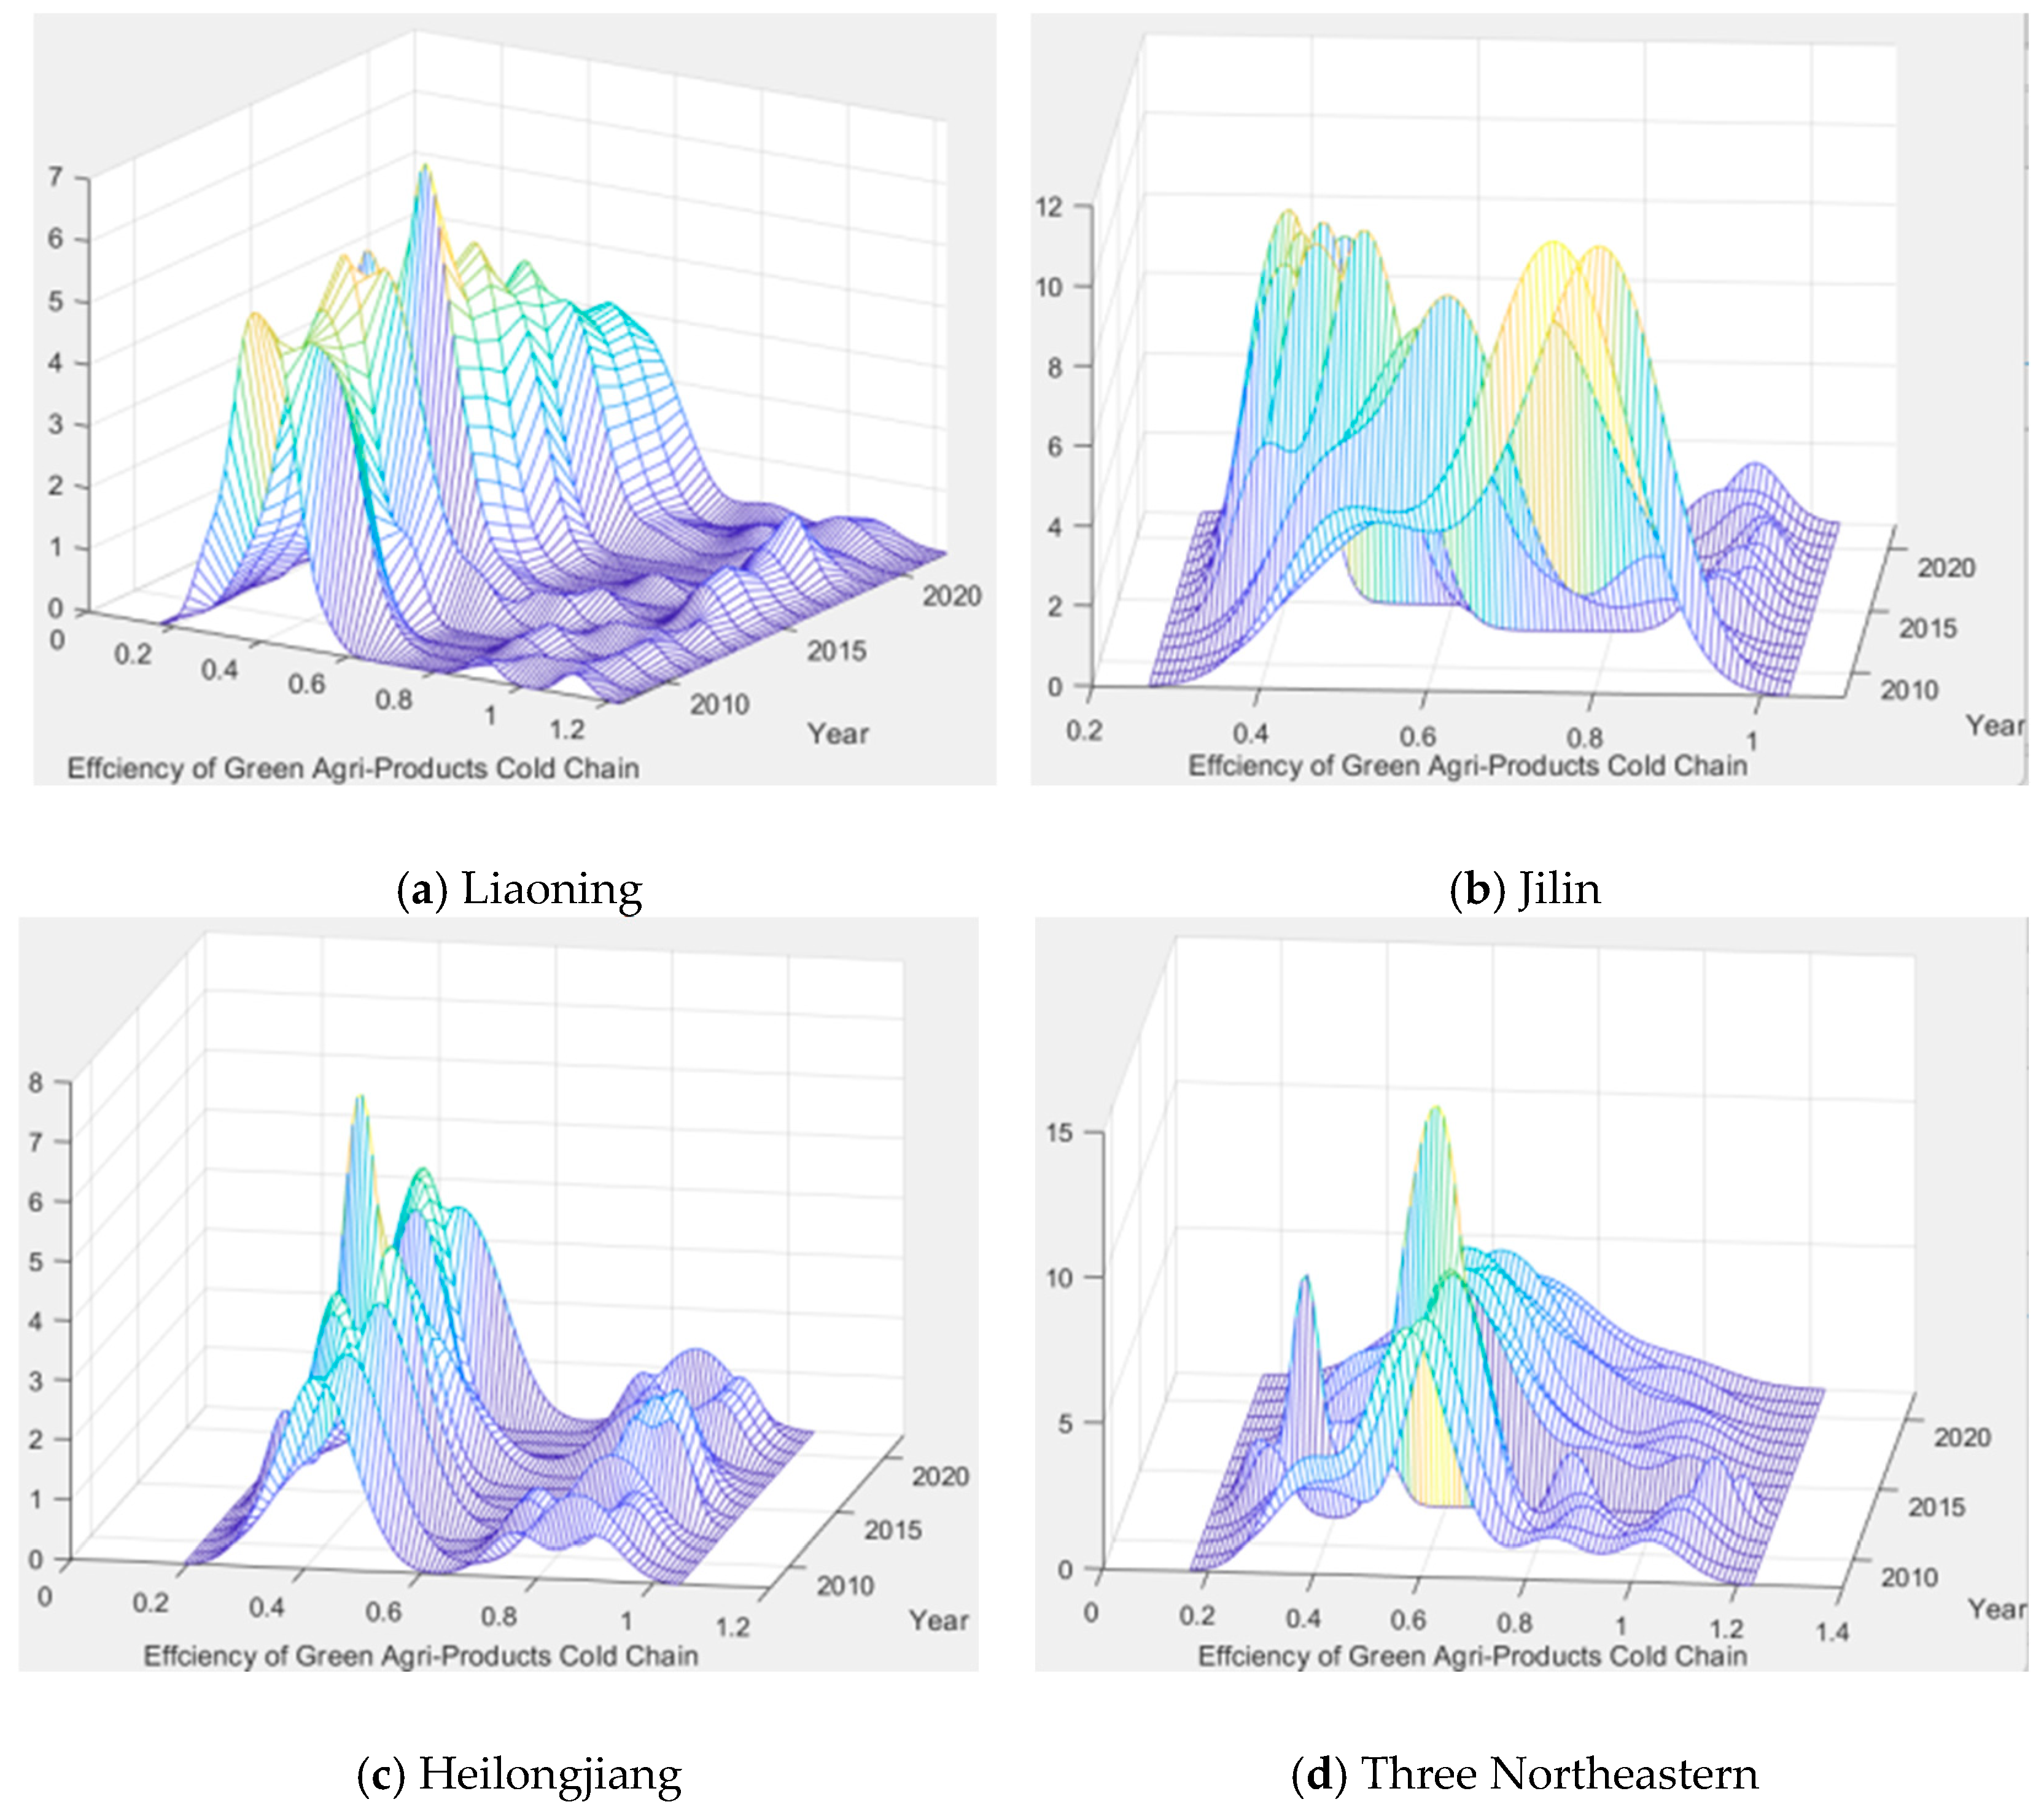
Kernel density analyses were conducted in MATLAB 2022 for four objects—Liaoning, Jilin, Heilongjiang, and the Northeastern region as a whole. The results are shown in Figure 2.

3.4. Spatial Difference Decomposition of Efficiency Based on the Dagum Gini Coefficient

The Dagum Gini coefficient overcomes the limitations of other methods that cannot account for overlapping data distributions, and it enables a more refined decomposition of the sources of group disparities. This coefficient can be decomposed into three components: the within-group coefficient (Gw), the between-group coefficient (Gb), and the transvariation intensity coefficient (Gt). In this study, these components, respectively, represent efficiency differences within the three northeastern provinces, efficiency differences between provinces, and the net disparities arising from overlapping distributions of agricultural green cold chain logistics efficiency across the three provinces.
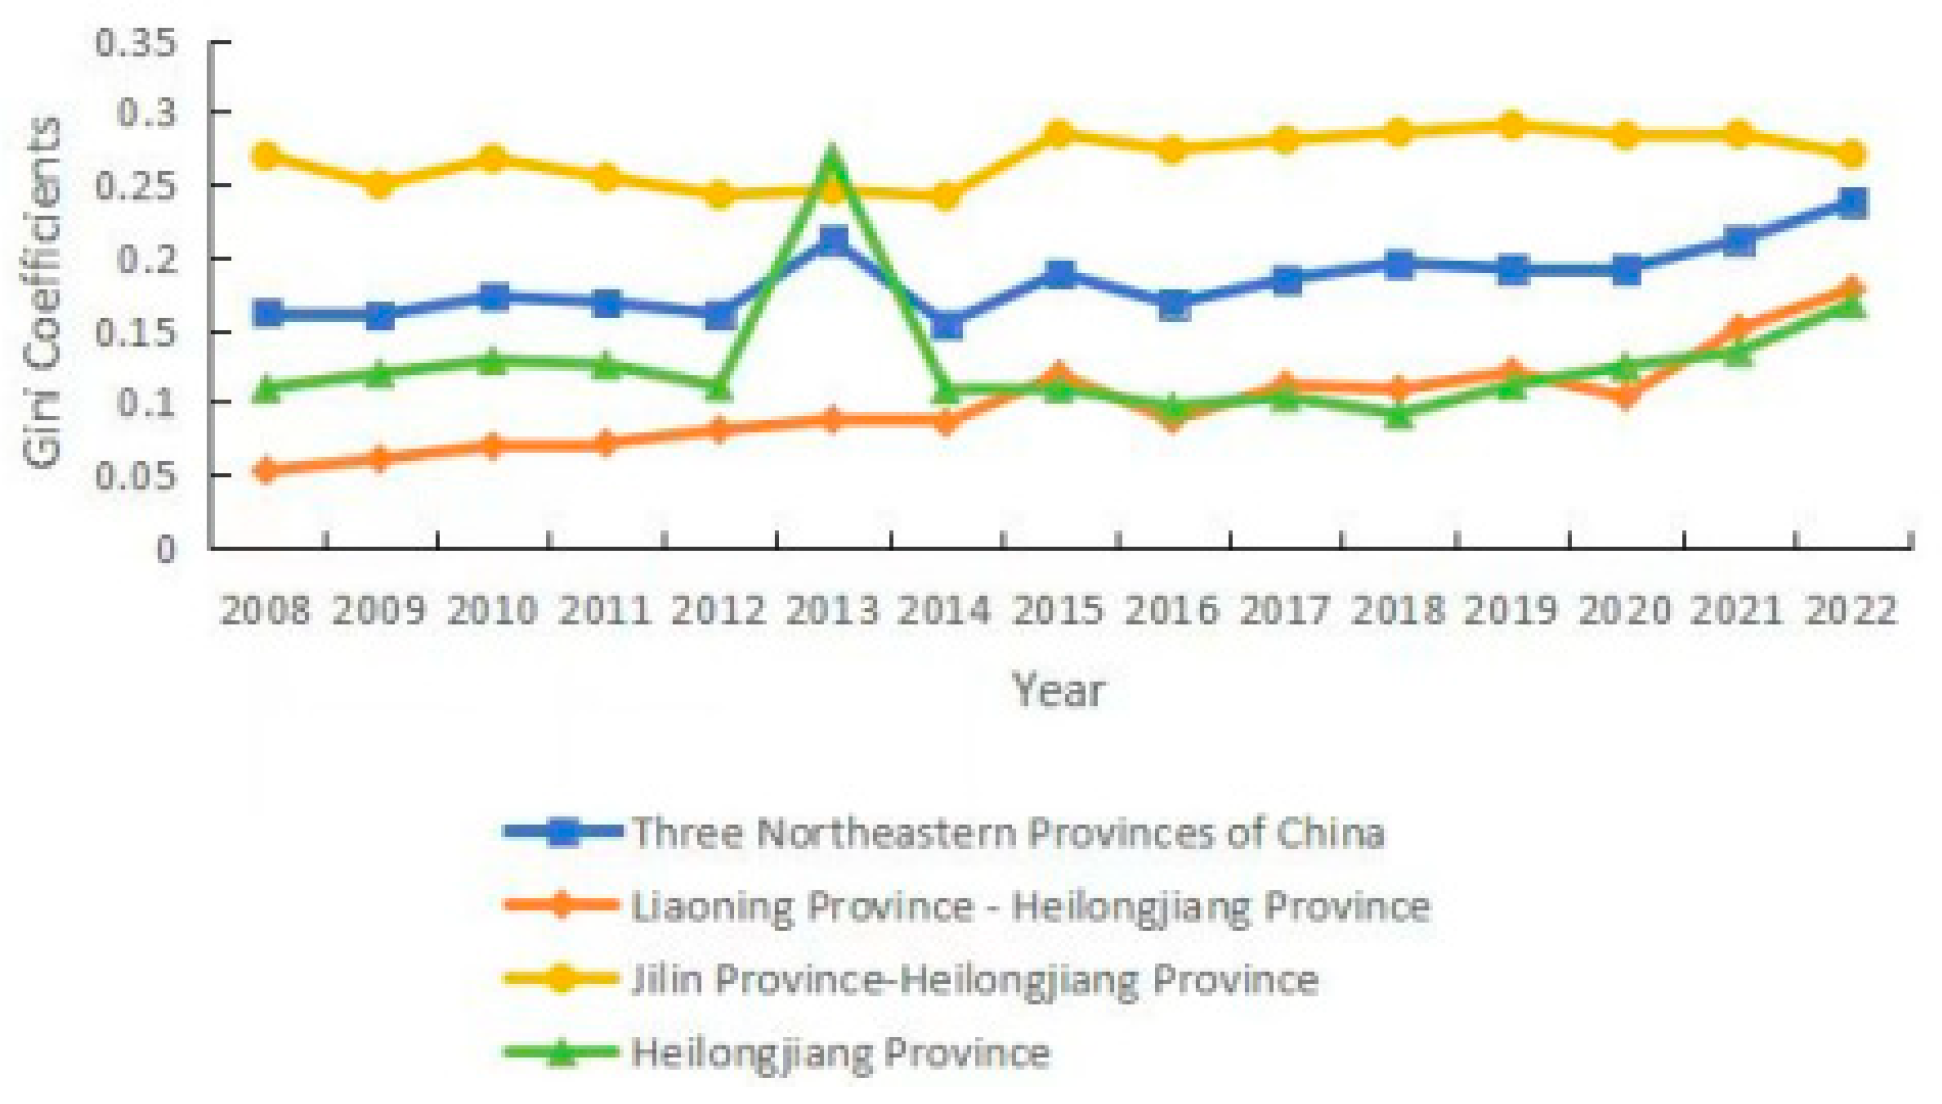
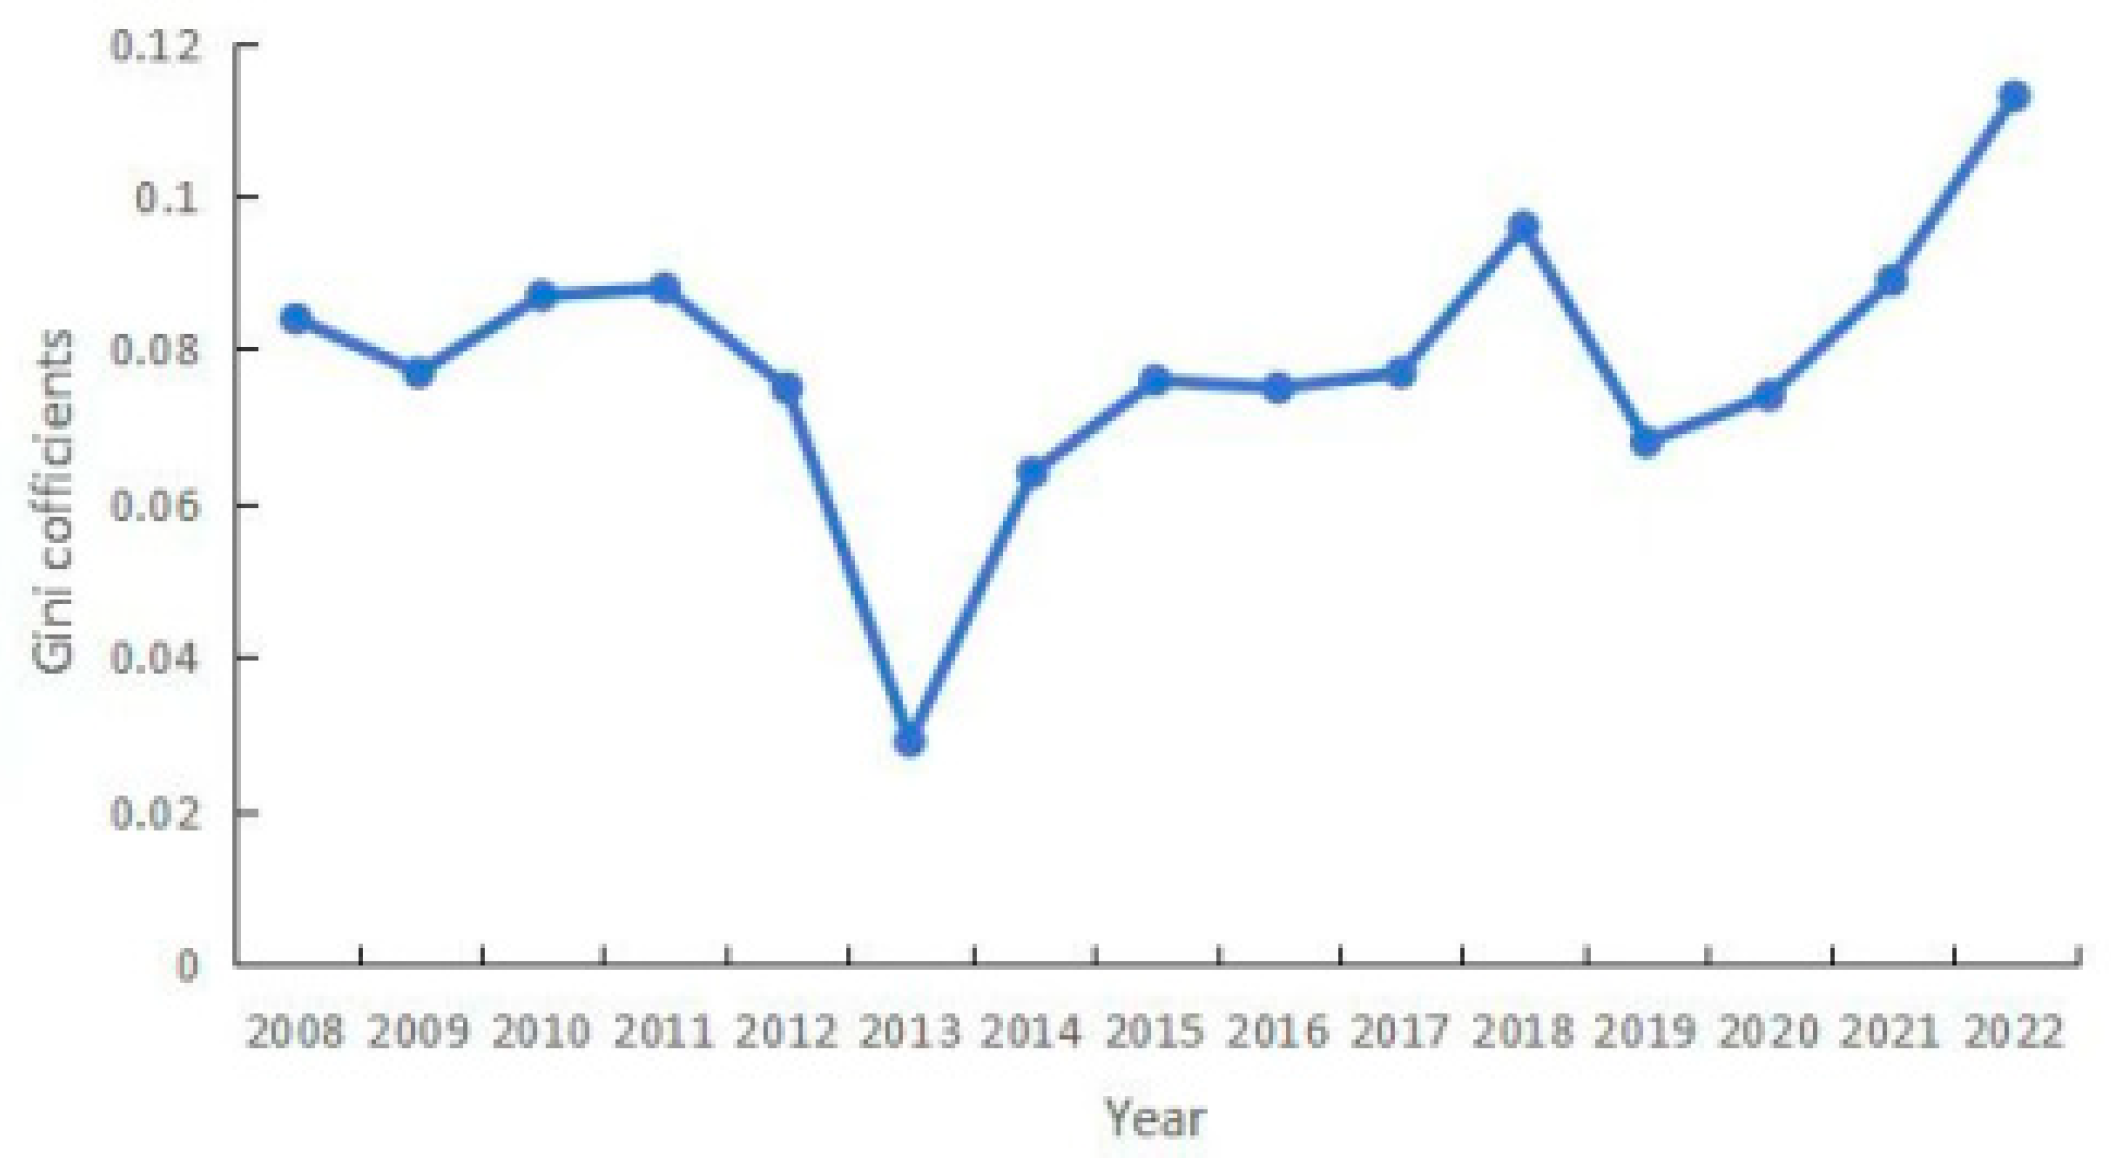
The sample is divided into four groups—Liaoning Province, Jilin Province, Heilongjiang Province, and the overall three-province region. For each group, the within-group Gini coefficient, the between-group Gini coefficient, as well as the sources and contributions of disparities, are computed. Specifically, the overall Gini coefficient for the three northeastern provinces and the within-group Gini coefficients for the three provinces are displayed as a line chart (Figure 3), while the inter-regional Gini coefficient of the three provinces as a whole is plotted as a line chart (Figure 4).
As shown in Figure 3, at the overall level, the total Gini coefficient of agricultural green cold chain logistics efficiency in the three northeastern provinces exhibited a gradual upward trend, reflecting a clear widening of regional disparities. At the provincial level, Liaoning Province experienced two notable surges in 2014 and 2020, with the latter being more pronounced and ultimately reaching its highest level in 2022. This suggests that intra-provincial disparities in Liaoning’s agricultural green cold chain logistics efficiency expanded steadily throughout the observation period. In contrast, Jilin Province showed fluctuations of relatively limited magnitude, indicating a comparatively stable pattern of internal disparities. In Heilongjiang Province, however, intra-provincial differences fluctuated more sharply: the coefficient rose rapidly in 2012, peaked in 2013, declined sharply in 2014, returned to its previous level, and began to rise again after 2018. This pattern indicates that intra-provincial disparities in Heilongjiang’s agricultural green cold chain logistics efficiency continued to widen in the later years of the observation period.
As shown in Figure 4, inter-provincial disparities in the agricultural green cold chain logistics efficiency of the three northeastern provinces from 2008 to 2022 followed three distinct phases, each displaying a generally “U-shaped” trajectory. The first phase, spanning 2008–2010, featured an initial decline in the inter-regional Gini coefficient from 2008 to 2009, followed by a rebound from 2009 to 2010. The second phase, from 2011 to 2018, was the longest. During this period, the coefficient declined steadily between 2011 and 2013, reflecting a continuous narrowing of inter-provincial disparities and reaching its lowest point in 2013-the lowest of the entire observation period. Subsequently, the coefficient began to rise again from 2013 to 2018, indicating a renewed expansion of disparities. The third phase, covering 2018–2022, began with a brief contraction in disparities between 2018 and 2019, followed by a sharp increase from 2019 onward, ultimately peaking in 2022. This indicates that inter-provincial disparities in agricultural green cold chain logistics efficiency expanded significantly during the later years of the study period.
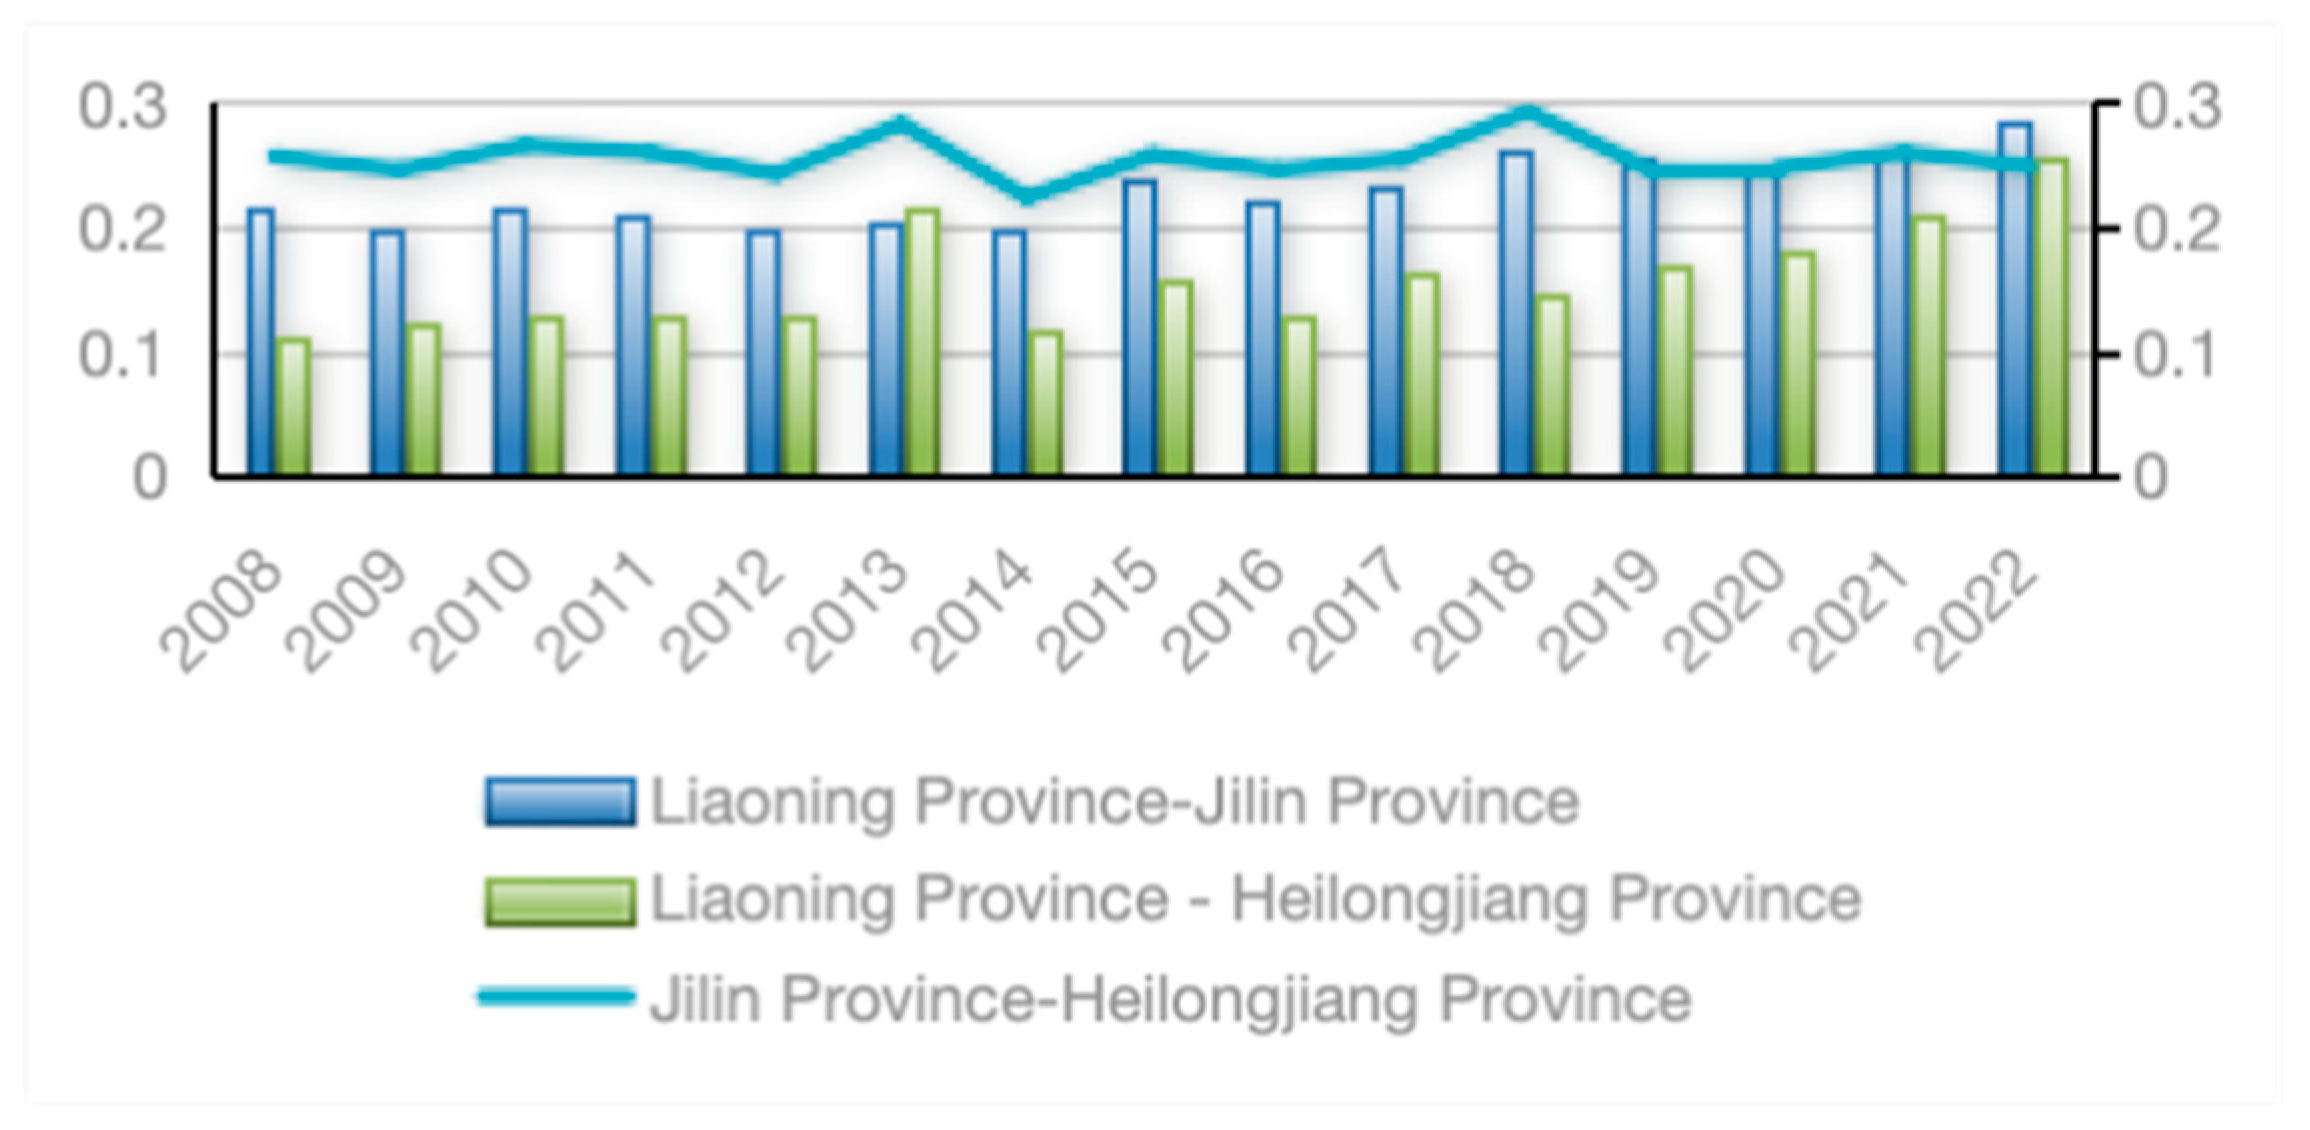
Furthermore, the pairwise inter-provincial Gini coefficients obtained from the decomposition of the overall inter-regional Gini coefficient are plotted as a line chart, as shown in Figure 5.
As shown in Figure 5, at the regional level, the disparity between Jilin Province and Heilongjiang Province was consistently larger than that between Liaoning Province and the other two provinces. However, during 2019–2022, the gap between Liaoning and Jilin exceeded that between Jilin and Heilongjiang, making Liaoning and Jilin the two provinces exhibiting the greatest inter-regional differences. In contrast, the disparity between Liaoning and Heilongjiang remained the smallest overall. Although the inter-regional Gini coefficient between Liaoning and Heilongjiang surpassed that between Jilin and Heilongjiang in 2022, it remained lower than the gap between Liaoning and Jilin.
Regarding the trend of disparities, the regional gap between Liaoning and Jilin fluctuated frequently over the observation period but showed an overall upward trajectory, suggesting a continuous widening of differences between the two provinces. The disparity coefficient between Liaoning and Heilongjiang rose sharply in 2013, temporarily surpassing that between Liaoning and Jilin, but reverted to its previous level in 2014 and subsequently began to increase steadily. Overall, the inter-regional Gini coefficients across the three provincial pairings demonstrate that disparities between Liaoning and the other two provinces have been steadily expanding, whereas disparities between Jilin and Heilongjiang have gradually narrowed. The overall Gini coefficient values and their respective contribution rates are presented in Table 7.
As shown in Table 7, the primary source of disparities in the efficiency of agricultural green cold chain logistics among the three northeastern provinces is inter-regional differences, followed by transvariation intensity. The contribution rate of inter-regional differences declined in both 2013 and 2019, with the decrease in 2013 being more pronounced. These declines suggest that inter-regional disparities in efficiency narrowed during those years. However, in 2014 and 2020, the contribution rate rebounded to its previous level, suggesting that efficiency gaps across the three provinces began to widen again.
From the perspective of transvariation intensity, its contribution rate increased in 2013 but decreased in 2014, moving in the opposite direction to inter-regional differences. Considering the dynamic contributions of both indicators, it can be inferred that in 2013, relative disparities in agricultural green cold chain logistics efficiency narrowed while absolute disparities expanded, whereas in 2014, the opposite occurred—relative disparities widened while absolute disparities contracted.

4. Empirical of the Regional Differentiation Causes of Efficiency Based on the Tobit Model

4.1. Influencing Variables and Data

The improvement of logistics efficiency is influenced by multiple factors, including economic development [42], the advancement of the tertiary industry [43], and the degree of informatization [44]. As green logistics efficiency represents a vertical extension of traditional logistics efficiency into the realm of sustainable development, its determinants are more explicitly associated with environmental dimensions [45]. For instance, Wilson G. et al. (2024) [46] highlight that environmental protection plays a central role among the drivers of green logistics, whereas Zhu Z. et al. (2024) [47] emphasize that the determinants of agricultural green cold chain logistics efficiency encompass not only direct logistics efficiency factors but also the specific effects of environmental variables.
Building on this theoretical foundation, the present study identifies the key influencing factors from four perspectives: economic development, informatization, tertiary industry development, and environmental protection.
From the perspective of economic development, Delfmann et al. (2018) [48] argue that increases in per capita GDP stimulate demand for high-quality fresh agricultural products through higher household income and consumption upgrading, thereby driving the need for efficient, stable, and widely accessible green cold chain logistics services. In addition, a higher ratio of total regional imports and exports to GDP reflects a greater degree of economic openness. The expansion of cross-border agricultural trade enhances the economic feasibility for cold chain enterprises to adopt in green technologies and optimize operational models, which in turn indirectly promotes logistics efficiency [49].
With respect to tertiary industry development, an increasing share of tertiary industry value added in GDP indicates a more mature service sector, facilitating the flow of capital and technology from industries such as finance and information services into agricultural cold chain logistics. This process contributes to equipment upgrading and efficiency improvement [50]. Wang et al. (2023) [51] further contend that a higher ratio of total logistics turnover to local GDP improves facility load factors and reduces empty running rates, thereby lowering energy waste and distributing the fixed costs associated with green technologies more effectively.
From the perspective of informatization, the number of internet access ports serves as a proxy for digital infrastructure and information connectivity. Enhanced informatization facilitates the integration of real-time traffic and logistics data, reduces redundant transport routes, and minimizes unnecessary operation of cold storage systems, thereby decreasing fuel and electricity consumption [52].
In terms of environmental protection, Jing and Zhang. (2014) [53] note that improved sewage treatment efficiency can reduce regulatory compliance costs for cold chain operations, freeing up resources for investment in green technologies. Moreover, a higher proportion of regional fiscal expenditure on environmental protection provides direct financial support for the construction of green cold chain facilities, thereby accelerating the deployment of advanced technologies [54]. The professional competence of personnel in regional environmental agencies also plays a vital role, as effective supervision of energy-saving and emission-reduction standards, coupled with targeted environmental guidance and technical support, can directly promote the optimization of cold chain logistics processes [55].
Accordingly, this study selects eight variables as the influencing factors of agricultural green cold chain logistics efficiency: per capita GDP (PC), the ratio of total regional import and export trade to GDP (TRD), the proportion of tertiary industry value added to GDP (TIV_GDP), the ratio of total logistics turnover to regional GDP (LTV_GDP), the number of internet access ports (IAP), sewage treatment efficiency (STE), the proportion of regional environmental protection fiscal expenditure to total government expenditure (EPGR), and the number of employees in regional environmental agencies (REAS). Data for these variables were collected for 34 major cities in the three northeastern provinces from 2008 to 2022, based on the China City Statistical Yearbook.
Furthermore, to address potential regional heterogeneity in influencing factors among the three provinces, this study follows the approach of Mankiw et al. (1992) [56]. Drawing on the convergence hypothesis within economic growth theory, a β-convergence test is applied as a preliminary method for variable selection. The conditional β-convergence tests were conducted separately for each province, with results presented in Table 8.
As shown in Table 8, the β values for Liaoning, Jilin, and Heilongjiang are −0.1978, −0.1594, and −0.063, respectively—all negative—indicating that agricultural green cold-chain logistics efficiency in the three provinces exhibits conditional β-convergence. This finding suggests a long-term tendency toward convergence in efficiency levels across regions.
Among the explanatory variables, sewage treatment efficiency (STE) and the proportion of regional environmental protection fiscal expenditure to total government expenditure (EPGR) are consistently insignificant across all three provinces. Therefore, these two variables are excluded from the subsequent analysis. Consequently, six key variables are retained as the determinants of agricultural green cold-chain logistics efficiency: per capita GDP (PC), the ratio of total regional import and export trade to GDP (TRD), the proportion of tertiary industry value added to GDP (TIV_GDP), the ratio of total logistics turnover to regional GDP (LTV_GDP), the number of internet access ports (IAP), and the number of employees in regional environmental agencies (REAS).
To mitigate potential heteroskedasticity arising from differences in measurement units, PC and IAP are logarithmically transformed, with the processed variables hereafter denoted as lnPC and lnIAP, respectively.

4.2. Model Specification

The empirical analysis in this study is conducted using panel data. To prevent the risk of spurious regression, both the Fisher–ADF and Fisher–PP panel unit root tests are applied to all variables, with the results presented in Table 9. The test outcomes indicate that all variables are stationary, confirming the suitability of the data for subsequent econometric modeling.
In specifying the econometric model, it is first necessary to consider whether spatial effects exist across regions. The spatial autocorrelation analysis of agricultural green cold-chain logistics efficiency in the three northeastern provinces yields a Moran’s Index of −0.108 with a p-value of 0.325, indicating that spatial correlation is insignificant and can therefore be excluded from the model specification.
Second, since the estimated values of agricultural green cold-chain logistics efficiency across regions and years range between 0 and 2—implying a truncated distribution—the Tobit regression model is selected as the primary econometric framework.
Third, it is essential to determine whether a fixed-effects or random-effects specification is more appropriate. Although the Hausman test proposed by Hausman (1978) [57] is widely applied, prior studies have noted several limitations: the test may lose statistical power or produce unreliable results in the presence of heteroskedasticity or autocorrelation [58], when the sample size is relatively small, or when explanatory variables exhibit multicollinearity [59]. Moreover, the orthogonality assumption underlying random effects rarely holds in practice and rejecting the random-effects model provides only statistical confirmation rather than substantive justification. Therefore, model selection should be guided by theoretical reasoning rather than relying solely on statistical tests [60,61]. Given the relatively small dataset used in this study, the Hausman test is susceptible to size distortion; consequently, the fixed-effects panel Tobit model is ultimately adopted.
When each province is analyzed individually, the cross-sectional dimension includes only one observational unit per province. Under such circumstances, individual fixed effects are perfectly collinear with the model’s constant term, rendering parameter estimation infeasible. Consequently, this study employs a time-fixed-effects Tobit model, as defined in Equation (11).
Z k t = β 1 ln P C k t + β 2 T R D k t + β 3 T I V _ G D P k t + β 4 L I V _ G D P k t + β 5 ln I A P k t + β 6 R E A S k t + γ t + ε k t ,
In this model, the explained variable Z k t represents the agricultural green cold-chain logistics efficiency of city k at time t , β i denotes the regression coefficients, with i taking values of 1, 2, …, 6, where γ t is the time fixed effect term, representing individual-specific unobservable factors, and ε k t is the random error term.

4.3. Empirical Results

To further examine the regional disparities in the efficiency of agricultural green cold chain logistics across the three northeastern provinces, this study conducts separate empirical analyses for Liaoning, Jilin, and Heilongjiang. To alleviate multicollinearity and remove insignificant variables, a stepwise regression approach is employed, and the final estimation results are reported in Table 10.
Furthermore, a robustness test is performed by reducing the sample size to assess the stability of the parameter estimates. Given the limited availability of data, only the observations for 2008 and 2009—two years that were significantly affected by the global financial crisis—are excluded. The robustness results are largely consistent with the empirical findings presented in Table 10, with no changes observed in the direction of the coefficients. As the robustness outcomes closely align with the original model estimates, they are therefore not reported separately here.
The empirical results for Liaoning Province show that the coefficient of per capita GDP is 0.0810 and is significantly positive at the 1% level. The coefficient for the ratio of total import and export trade to GDP is 0.0004, significant at the 10% level, while the coefficient for the ratio of total logistics turnover to regional GDP is 0.0003, also significant at the 10% level. Moreover, the coefficient for Internet access ports is 0.1087, significantly positive at the 1% level. These findings suggest that improvements in Liaoning’s overall economic development, the expansion of the tertiary industry, and the advancement of digital infrastructure jointly contribute to higher efficiency in agricultural green cold chain logistics. The coefficient for the number of employees in regional environmental agencies is −0.0648, indicating that an increase in environmental agency staffing does not necessarily enhance environmental governance and may, in fact, have a negative impact on logistics efficiency.
For Jilin Province, the coefficient of per capita GDP is 0.3123, significantly positive at the 1% level, and the coefficient of the ratio of total logistics turnover to regional GDP is 0.0056, significant at the 5% level. This indicates that higher levels of overall economic development and tertiary-industry expansion enhance the efficiency of agricultural green cold chain logistics in Jilin. However, the coefficient of Internet access ports is −0.1323, significant at the 5% level, and the coefficient of employees in regional environmental agencies is −0.1229, significant at the 1% level. These findings suggest that both digitalization and the increase in environmental agency staffing have, paradoxically, hindered improvements in logistics efficiency in Jilin Province.
For Heilongjiang Province, the coefficient of per capita GDP is 0.0491, significantly positive at the 1% level, while the coefficient of the ratio of total import and export trade to GDP is −0.0002, significant at the 5% level, suggesting that the impact of economic development on green cold chain logistics efficiency in Heilongjiang is ambiguous. The coefficients of the share of tertiary-industry value added in GDP (0.0025) and the ratio of total logistics turnover to regional GDP (0.0004) are both significantly positive at the 1% level, indicating that the expansion of the tertiary sector promotes higher logistics efficiency. Regarding informatization and environmental governance, both Internet access ports (−0.0046) and the number of employees in environmental agencies (−0.0605) are significantly negative at the 1% level, implying that the current levels of digital and environmental inputs may be acting as constraints rather than enhancing the efficiency of agricultural green cold chain logistics in Heilongjiang Province.

5. Discussion and Conclusions

5.1. Economic Development as the Primary Driver of Efficiency and Regional Disparities

Using the super-efficiency SBM model to measure the static efficiency of agricultural green cold chain logistics in the three northeastern provinces, the results show that the overall efficiency level remains low. The ML index analysis further indicates that efficiency in the region increased by an annual average of 0.3% during the observation period, displaying an initial rise followed by a subsequent decline. Over the past decade, the sluggish economic growth of the three provinces has made it difficult to sustain the rapid development of agricultural green cold chain logistics. Among them, Jilin Province exhibits the strongest influence of per capita GDP on logistics efficiency, making it the leading province in agricultural green cold chain logistics performance. As residents’ living standards improve, the growing demand for fresh agricultural products stimulates the upgrading of the cold chain logistics industry. Particularly in Jilin, consumers place increasing emphasis on the freshness and nutritional preservation of specialty agricultural products such as Yanbian rice and Changbai Mountain ginseng, prompting the province to strengthen policy support for cold chain infrastructure. However, since Jilin’s cross-border agricultural trade primarily involves storable commodities, the demand for cold chain services in this sector remains weak. Consequently, the estimated coefficient for the ratio of total import and export trade to GDP in Jilin is statistically insignificant.
The super-efficiency SBM analysis also reveals that Heilongjiang Province has the lowest efficiency level in agricultural green cold chain logistics. Although the coefficient of per capita GDP is significantly positive, the coefficient of the ratio of total import and export trade to GDP is significantly negative. The main reason lies in the dominance of fresh primary agricultural exports—such as fruits, vegetables, meat, and poultry—to Russia. As Chu He et al. (2020) [62] noted, these products are highly sensitive to international market price fluctuations and typically yield profit margins below 10%, making it difficult for enterprises to absorb the high costs of green technological upgrading. Consequently, firms tend to continue relying on traditional cold chain models, thereby limiting improvements in green cold chain logistics efficiency in Heilongjiang.
In contrast, Liaoning Province demonstrates a steady upward trend in green cold chain logistics efficiency. The rightward shift in the kernel density curve at the end of the study period compared with the initial year indicates stronger development resilience. This improvement can be largely attributed to the significant positive impact of the ratio of total import and export trade to GDP on agricultural green cold chain logistics efficiency. According to the Liaoning Statistical Yearbook, agricultural trade in the province has continued to expand, with the share of import and export trade in GDP showing an upward trajectory. To accommodate the growing scale of cross-border agricultural circulation, the provincial government has encouraged private investment in the cold chain logistics industry. Through policy guidance and industrial scaling, logistics enterprises have dispersed the costs of adopting green technologies—such as photovoltaic refrigeration systems and hydrogen-powered refrigerated vehicles—thereby enhancing the overall efficiency of agricultural green cold chain logistics in Liaoning Province.

5.2. Randomness of Polarization and Inevitability of Regional Efficiency Disparities

Kernel density analysis reveals that the three northeastern provinces exhibit distinct characteristics in terms of distribution position, shape, and polarization, indicating substantial disparities in the efficiency of agricultural green cold chain logistics. Moreover, intra-provincial differences in Liaoning show a persistently widening trend. Although the kernel density curves of Liaoning, Jilin, and Heilongjiang display relatively low peaks, they generally maintain a unimodal shape throughout the observation period. This suggests that polarization in agricultural green cold chain logistics efficiency is not pronounced, implying that most cities within each province perform close to the average efficiency level. Such results are largely consistent with differences in overall urban development and the ratio of total logistics turnover to regional GDP.
At the aggregate level, the three provinces did not exhibit a clear bifurcation pattern in efficiency during most years. However, in 2014, the overall kernel density curve for the region became bimodal. Examination of the 2014 ML index values across all cities reveals no consistent spatial clustering among cities corresponding to the two peaks, suggesting that the observed polarization that year was largely random rather than structural in nature.
The Dagum Gini coefficient analysis demonstrates a marked expansion of inter-provincial disparities in agricultural green cold chain logistics efficiency across the three provinces. For a considerable period, the efficiency gap between Jilin and Heilongjiang exceeded that between Liaoning and the other two provinces, but this pattern reversed during the later stage of the observation period. Overall, the inter-provincial differences between Liaoning and the other two provinces have continued to broaden, whereas the gap between Jilin and Heilongjiang has gradually narrowed. The primary source of efficiency disparities lies in inter-provincial differences, followed by transvariation intensity. This outcome is structurally inevitable, as Liaoning has demonstrated superior performance in comprehensive economic development, tertiary-industry expansion, and digitalization in recent years. Empirical evidence further supports this finding: except for the number of environmental agency employees—which shows a significantly negative coefficient across all three models—only Liaoning’s significant variables exhibit uniformly positive effects on agricultural green cold chain logistics efficiency. Hence, the inter-provincial disparities among the three northeastern provinces primarily stem from uneven levels of key influencing factors, whereas intra-provincial disparities among cities remain relatively limited.

5.3. The Regional “Digitalization Paradox” and the Marginal Negative Utility of Government Sectors

In terms of informatization, the coefficient of Internet access ports has a significant positive effect on the efficiency of agricultural green cold chain logistics in Liaoning Province, but a significant negative effect in Jilin and Heilongjiang. This finding indicates that a more developed digital infrastructure does not necessarily translate into higher sectoral efficiency. The results confirm the existence of a “digitalization paradox” in agricultural green logistics across the three northeastern provinces. According to Wang et al. (2016) [63], the degree of information sharing among nodes within the cold-chain Internet of Things (IoT) system is a key determinant of operational efficiency. The underlying cause of this paradox likely lies in the misalignment between the level of information sharing and the coordination of digital infrastructure—specifically, a mismatch between informatization and the coupling strength of agricultural green cold chain logistics efficiency.
Liaoning has effectively capitalized on its expanding Internet access network to establish a province-wide public logistics information platform. By developing a real-time traffic information-sharing system, the province has reduced empty miles and fuel consumption, thereby improving the efficiency of agricultural green cold chain logistics. In contrast, most cold-chain enterprises in Heilongjiang and Jilin have yet to deploy IoT-based temperature-control systems or route-optimization algorithms. As a result, traffic information cannot be synchronized with cold-chain transport demand in real time, leading to mismatches in digital management across the supply chain and exacerbating the waste of electricity and fuel.
Regarding environmental governance, the impact of the number of employees in regional environmental agencies on agricultural green cold chain logistics efficiency varies slightly across the three provinces but remains consistently negative. Using the number of environmental personnel as a proxy for environmental performance is clearly inadequate, as it fails to capture the quality or effectiveness of governance, potentially biasing the analysis of its relationship with logistics efficiency. Nevertheless, the empirical results reveal a statistically significant negative association between environmental agency staffing and logistics efficiency, suggesting that an increase in personnel does not enhance efficiency but instead contributes to its decline. Because this variable primarily reflects staffing within government institutions, the findings indicate the presence of a “marginal negative utility” effect among environmental regulatory authorities in the three northeastern provinces. Tu Jian (2025) [64] argues that stricter environmental regulation can increase firms’ green investment burdens, thereby reducing logistics efficiency. The root cause lies in internal bureaucratic processes within government environmental departments, which raise operational costs for logistics enterprises and ultimately constrain the improvement of regional green logistics efficiency.

6. Policy Recommendations and Research Implications

The overall efficiency of agricultural green cold chain logistics in the three northeastern provinces remains relatively low, and the regional disparities in efficiency are closely linked to varying degrees of policy support across provinces. To further improve efficiency and narrow regional gaps, this study puts forward several policy recommendations based on the aforementioned empirical findings.
First, local governments should implement differentiated incentive mechanisms to encourage logistics enterprises to adopt green energy and pursue technological innovation in green cold chain logistics. Key policy tools may include the establishment of dedicated funds for agricultural green logistics, financial subsidies, and tax incentives for green logistics enterprises. At present, cold chain enterprises face high initial costs for adopting green technologies and may experience sustained operational pressure over time. Given differences in enterprise resources and regional logistics infrastructure, subsidy standards should be designed with both sectoral and regional differentiation. Governments should offer one-time subsidies for technology upgrading and equipment replacement, such as providing at least 10% of the investment amount for the procurement of automated loading and unloading systems or solar-powered cold storage facilities that enhance operational efficiency and energy conservation. In regions with underdeveloped logistics infrastructure, the subsidy proportion should be appropriately increased. For the transportation stage, operational subsidies should be granted to green-energy vehicles, with the amount calculated based on refrigerated-truck mileage. The duration of subsidies can be determined by vehicle performance, and in colder regions, the period should be extended to promote the regular use of green vehicles. Moreover, governments should provide substantial tax reductions for enterprises engaged in green logistics R&D, thereby fostering independent innovation. Simultaneously, government agencies should accelerate the implementation of green cold chain standards—such as the standardization of cold storage components and transport modules—and encourage enterprises to integrate green certification and testing mechanisms into agricultural logistics. Finally, environmental regulators should strengthen institutional frameworks by incorporating agricultural cold chain logistics into the scope of environmental supervision and developing sector standards and regulatory protocols for this industry.
Second, governments should take the lead in embedding the concept of the sharing economy into agricultural green cold chain logistics. The sharing model should focus on three dimensions: infrastructure sharing, information sharing, and order sharing. Shared green logistics infrastructure can increase the utilization rate of idle facilities and alleviate shortages of green logistics resources within some enterprises. Governments should promote the development of shared cold storage platforms that integrate scattered storage resources and provide on-demand services or establish regional green joint-distribution centers in designated areas managed by professional operators. Beyond storage, these centers should provide green refrigerated vehicle services to promote intensive and circular distribution. Government agencies should also collaborate to establish a unified cold chain logistics information platform. This platform would enhance coordination between information sharing and digital infrastructure across the three northeastern provinces, reducing mismatches between informatization and logistics efficiency. It should provide data on the utilization status of shared facilities, as well as comprehensive service information across the agricultural cold chain, including real-time traffic conditions, weather forecasts, and optimized routing recommendations. Meanwhile, authorities could use the platform for precise monitoring of cold chain transport data, improving both the effectiveness and accountability of green logistics subsidies. Order sharing—representing a higher level of information integration—should primarily target small, dispersed orders across regions and time. It can be implemented through the information platform or operated independently by a fourth-party public logistics trading platform. Importantly, order sharing should include major producers in agricultural areas. Once registered on the platform, vehicles from either logistics enterprises or upstream firms with transport qualifications can be automatically matched with orders through algorithmic scheduling, significantly reducing the empty-load rate of green transport vehicles and improving overall efficiency.
Third, promoting green financial innovation is essential for advancing agricultural green cold chain logistics. Although the industry’s scale has expanded steadily, the level of financial support for green logistics varies considerably across regions. One of the core challenges in enhancing efficiency and narrowing gaps lies in resolving the financing difficulties faced by cold chain enterprises, especially small and medium-sized firms that remain constrained by commercial banks’ risk aversion. Green financial innovation should focus on two dimensions: green credit and carbon finance. Regarding green credit, financial institutions should design tailored financial products for agricultural logistics and leverage digital logistics data to evaluate firms’ creditworthiness. By integrating information from shared platforms, banks can more accurately assess firms’ operational performance and asset quality, thereby developing data-driven, risk-adjusted green credit products that support low-carbon, digitalized logistics. Carbon finance, in turn, represents the most direct channel for providing financial returns on green investments. For agricultural cold chain logistics, carbon-finance mechanisms should evolve along two directions. First, the diversification of carbon assets should be expanded, as tradable carbon assets can emerge at multiple stages of the supply chain, though their quality varies. However, current carbon-accounting practices remain narrow, and carbon-pricing mechanisms are still immature. Second, carbon finance should be integrated with green credit and green bonds to form innovative hybrid products. As carbon-asset valuation systems and credit assessment frameworks mature, carbon assets will play a greater role in mobilizing capital and incentivizing sustained green investment.
Nonetheless, the implementation of these policy recommendations must rest on a sound economic foundation and align with regional development trajectories. Ultimately, economic growth remains the fundamental driver of improvements in agricultural green cold chain logistics efficiency. Each region should define its strategic positioning and formulate long-term logistics plans to avoid both undercapacity and resource misallocation. Reducing carbon emissions in agricultural cold chain logistics is a systemic undertaking that requires the coordinated engagement of enterprises, production factors, and public resources.

7. Limitations and Future Research Directions

Despite its contributions, this study has several limitations that warrant further investigation and refinement in future research.
First, data constraints have posed notable challenges, particularly regarding the appropriateness and completeness of indicator selection. For instance, the use of the value added of the tertiary industry as an output indicator and the number of employees in environmental institutions as a proxy for environmental performance remains open to debate. Some potentially more representative indicators could not be included due to data unavailability. Similar limitations apply to the measurement of undesirable outputs. For example, undesirable outputs in agricultural cold chain logistics could include cold chain waste generation; however, because relevant data were inaccessible, this study relied on carbon emissions from the logistics industry as a proxy. As data collection and statistical coverage improve, future research should refine both the measurement of green cold chain logistics efficiency and the modeling of regional heterogeneity through the adoption of more accurate and comprehensive indicators.
Second, the empirical analysis did not account for potential temporal structural effects. In the econometric model, certain macroeconomic variables may undergo regime shifts, and some may even exhibit opposite relationships before and after such transitions. Given the relatively short time span of the dataset used—and the fact that all variables passed stationarity tests—the empirical results may be affected by sample constraints. Future studies should pay closer attention to structural changes in time-series data and further refine the analytical framework to more precisely capture the dynamic relationships among variables.
Third, the analysis of the determinants of regional disparities in agricultural green cold chain logistics efficiency still warrants deeper and more systematic exploration. The current discussion primarily draws upon spatial features revealed in efficiency measurements and the results of empirical estimation. To uncover the underlying drivers of regional differentiation and formulate more effective policy recommendations, future research could combine field surveys, expanded data collection, and big data mining techniques. These approaches would provide a more comprehensive and scientifically grounded understanding of the sources of efficiency heterogeneity across regions.

Author Contributions

Conceptualization, C.C.; methodology, S.L.; validation, X.Z. All authors have read and agreed to the published version of the manuscript.

Funding

This research was funded by the National Social Science Fund of China, Grant No. 23BJY212; the Basic Scientific Research Project of Liaoning Provincial Department of Education, Grant No. LJ112410154043 & LJ112510154003; and the Doctoral Research Start-up Fund for Humanities and Social Sciences of Liaoning University of Technology, Grant No. XBKH2024002.

Institutional Review Board Statement

Not applicable.

Informed Consent Statement

Not applicable.

Data Availability Statement

Data and codes are available upon request.

Acknowledgments

The authors thank the anonymous referees for their invaluable comments on an earlier version of this manuscript.

Conflicts of Interest

The authors declare no conflicts of interest.

References

  1. Yang, B.; Han, J.; Yang, L.; Ren, Q.; Yang, X. Evaluation System of China’s Low-Carbon Cold Chain Logistics Development Level. Smart Agric. 2023, 5, 44–51. [Google Scholar]
  2. Mercier, S.; Villeneuve, S.; Mondor, M.; Uysal, I. Time-temperature management along the food cold chain: A review of recent developments. Compr. Rev. Food Sci. Food Saf. 2017, 16, 647–667. [Google Scholar] [CrossRef] [PubMed]
  3. Zailani, S.; Iranmanesh, M.; Nikbin, D.; Jumadi, H.B. Environmental Outcome of Green Technology Innovation Adoption in the Transportation Industry in Malaysia. Asian J. Technol. Innov. 2014, 22, 286–301. [Google Scholar] [CrossRef]
  4. Du, G.; Li, W. Does innovative city building promote green logistics efficiency? Evidence from a quasi-natural experiment with 285 cities. Energy Econ. 2022, 10, 114–118. [Google Scholar]
  5. Kim, T.H.; Ryu, S.K. A Study on the Green Growth Policy and Government Support-Focusing on the Green Logistics. Int. Commer. Inf. Rev. 2012, 14, 315–344. [Google Scholar] [CrossRef]
  6. Kang, M.-H.; Kim, S.-T. A Study on Korea’s Green Logistics Activation Policy in the Age of the Fourth Industrial Revolution. Korea Trade Rev. 2021, 46, 81–97. [Google Scholar]
  7. Deng, M.; Li, Y.; Wang, L.; Huang, W.; Zeng, X. Green development efficiency of cold chain logistics based on the super-SBM-GML index model. J. Cent. South Univ. For. Technol. 2024, 44, 189–200. [Google Scholar]
  8. Rodrigue, J.-P.; Notteboom, T. The Cold Chain and its Logistics. In The Geography of Transport Systems, 3rd ed.; Routledge: Oxfordshire, UK, 2009. [Google Scholar]
  9. Hans, J. Green logistics is defined as efforts to examine ways of reducing these externalities and achieving a more sustainable balance between environmental, economic and social objectives. J. Clean. Prod. 2011, 19, 1719–1729. [Google Scholar]
  10. Batista, L.; Bourlakis, M.; Smart, P.; Maull, R. In search of a circular supply chain archetype-a content-analysis-based literature review. Prod. Plan. Control 2018, 29, 438–451. [Google Scholar] [CrossRef]
  11. Fugate, B.S.; Mentzer, J.T.; Stank, T.P. Logistics Performance: Efficiency, Effectiveness, and Differentiation. J. Bus. Logist. 2010, 31, 43–62. [Google Scholar] [CrossRef]
  12. Hong, S.; Jiang, H.; Cheng, S.; Huang, Y.; Feng, C. A study on the policy effects of the establishment of Guangdong–Hong Kong–Macao greater bay area on logistics efficiency. Sustainability 2023, 15, 1078. [Google Scholar] [CrossRef]
  13. Liu, G.; Hu, J.; Yang, Y.; Xia, S.; Lim, M.K. Vehicle routing problem in cold Chain logistics: A joint distribution model with carbon trading mechanisms. Resour. Conserv. Recycl. 2020, 156, 104715. [Google Scholar] [CrossRef]
  14. Chen, H.; Zhang, Y. Research on the path of sustainable development of China’s logistics industry driven by capital factors. Sustainability 2023, 15, 297. [Google Scholar] [CrossRef]
  15. Jia, X. Research on the optimization of cold chain logistics distribution path of agricultural products E-commerce in urban ecosystem from the perspective of carbon neutrality. Front. Ecol. Evol. 2022, 10, 966111. [Google Scholar] [CrossRef]
  16. Jung, S.; Son, J.; Kim, C.; Chung, K. Efficiency Measurement Using Data Envelopment Analysis (DEA) in Public Healthcare: Research Trends from 2017 to 2022. Processes 2023, 11, 811. [Google Scholar] [CrossRef]
  17. Bonasia, M.; Kounetas, K.; Oreste, N. Assessment of regional productive performance of European health systems under a metatechnology framework. Econ. Model. 2020, 84, 234–248. [Google Scholar] [CrossRef]
  18. Chorfi, Z.; Berrado, A.; Benabbou, L. An integrated DEA-based approach for evaluating and sizing health care supply chains. J. Model. Manag. 2020, 15, 201–231. [Google Scholar]
  19. Krmac, E.; Mansouri Kaleibar, M. A comprehensive review of data envelopment analysis (DEA) methodology in port efficiency evaluation. Marit. Econ. Logist. 2022, 25, 817–881. [Google Scholar] [CrossRef]
  20. Wang, B.; Tian, Y. Green and Low-Carbon Efficiency Assessment of Urban Agglomeration Logistics Industry: Evidence from China’s Beig-Tian-Hebei Metropolitan Area (2008–2020). Sustainability 2023, 15, 11833. [Google Scholar]
  21. Ye, C.; Chen, N.; Weng, S.; Xu, Z. Regional Sustainability of Logistics Efficiency in China along the Belt and Road Initiative Considering Carbon Emissions. Sustainability 2022, 14, 9506. [Google Scholar] [CrossRef]
  22. Tone, K. A slacks-based measure of efficiency in data envelopment analysis. Eur. J. Oper. Res. 2001, 130, 498–509. [Google Scholar] [CrossRef]
  23. Fried, H.O.; Lovell, C.A.K.; Schmidt, S.S.; Yaisawarng, S. Accounting for Environmental Effects and Statistical Noise in Data Envelopment Analysis. J. Product. Anal. 2002, 17, 157–174. [Google Scholar]
  24. Tone, K. Dealing with Undesirable Outputs in DEA: A Slacks-Based Measure (SBM) Approach; GRIPS Research Report Series; National Graduate Institute for Policy Studies (GRIPS): Tokyo, Japan, 2003; pp. 44–45. [Google Scholar]
  25. Tone, K. A slacks-based measure of super-efficiency in data envelopment analysis. Eur. J. Oper. Res. 2002, 143, 32–41. [Google Scholar] [CrossRef]
  26. Jiang, X.; Ma, J.; Zhu, H.; Guo, X.; Huang, Z. Evaluating the Carbon Emissions Efficiency of the Logistics Industry Based on a Super-SBM Model and the Malmquist Index from a Strong Transportation Strategy Perspective in China. Int. J. Environ. Res. Public Health 2020, 17, 8459. [Google Scholar] [CrossRef]
  27. Schøyen, H.; Bjorbæk, C.T.; Steger-Jensen, K.; Bouhmala, N.; Burki, U.; Jensen, T.E.; Berg, Ø. Measuring the contribution of logistics service delivery performance outcomes and deep-sea container liner connectivity on port efficiency. Res. Transp. Bus. Manag. 2018, 28, 66–76. [Google Scholar] [CrossRef]
  28. Rashidi, K.; Cullinane, K. Evaluating the sustainability of national logistics performance using Data Envelopment Analysis. Transp. Policy 2019, 74, 35–46. [Google Scholar] [CrossRef]
  29. Huang, Q.H.; Dai, L. Research on the evaluation of logistics performance of key provinces and cities in China under the “Belt and Road” initiative. Mod. Manag. Sci. 2021, 1, 61–67. [Google Scholar]
  30. Gan, W.; Yao, W.; Huang, S. Evaluation of Green Logistics Efficiency in Jiangxi Province Based on Three-Stage DEA from the Perspective of High-Quality Development. Sustainability 2022, 14, 797. [Google Scholar] [CrossRef]
  31. Wang, Q.; Zhang, Y. Comprehensive Evaluationof the Silk Road Economic Belt “Core Zone” Logistics Efficiency and Differentiate Provincial and Country Comparison. Mod. Manag. Sci. 2016, 24, 152–157. [Google Scholar]
  32. Guan, L.; Zhao, W. Evaluation of the efficiency of rural infrastructure supply based on DEA-Malmquist. Stat. Decis. Mak. 2020, 36, 172–175. [Google Scholar]
  33. Carayannis, E.G.; Grigoroudis, E.; Goletsis, Y. A multilevel and multistage efficiency evaluation of innovation systems: A multi-objective DEA approach. Expert Syst. Appl. 2016, 62, 63–80. [Google Scholar] [CrossRef]
  34. Cheng, C.; Mu, W. Study on the impact of environmental regulation on the green development of logistics industry—An empirical test from Beijing-Tianjin-Hebei region. J. Clean. Prod. 2021, 40, 107–114. [Google Scholar]
  35. Wang, Y.; Xin, L. The impact of China’s trade with economies participating in the Belt and Road Initiative on the ecological total factor energy efficiency of China’s logistics industry. J. Clean. Prod. 2020, 276, 124196. [Google Scholar] [CrossRef]
  36. Gan, W.; Xu, Y.; Huang, W.; Ding, R.; He, D. Research on total factor productivity of logistics industry in Jiangxi Province based on DEA-Malmquist. J. Clean. Prod. 2015, 18, 108–114. [Google Scholar]
  37. Gan, W.; Yao, W.; Liu, Z. Evaluation of the Impact of Logistics Industry on Regional Economic Vitality from the Perspective of National Logistics Hub Construction. Logist. Technol. 2020, 39, 16–22. [Google Scholar]
  38. Luo, M.; Wen, T. Exploring the Development Factors of Fresh Cold Chain Logistics in China: A Methodology Based on Fuzzy Analytic Hierarchy Process. Manag. Sci. Eng. 2024, 13, 683–694. [Google Scholar] [CrossRef]
  39. Yang, B.; Bai, X.; Bai, L. Evaluation of carbon emission efficiency of logistics industry in Jiangsu based on PCA and DEA. Jiangsu Univ. Sci. Technol. 2018, 8, 171–176. [Google Scholar]
  40. Jebbor, I.; Benmamoun, Z.; Hachimi, H. Forecasting supply chain disruptions in the textile industry using machine learning: A case study. Ain Shams Eng. J. 2024, 15, 103116. [Google Scholar] [CrossRef]
  41. Jones, M.C.; Marron, J.S.; Sheather, S.J. A Brief Survey of Bandwidth Selection for Density Estimation. Publ. Am. Stat. Assoc. 1996, 91, 401–407. [Google Scholar] [CrossRef]
  42. Ran, W.; Liu, R.; Liu, S. Area Differences in Regional Logistics Efficiency and the Law Governing Its Temporal and Spatial Evolution. J. Adv. Transp. 2022, 3596524. [Google Scholar] [CrossRef]
  43. Zhu, T.X.; Song, H. Assessing Logistics Industry Efficiency and Identifying Determinants in Shijiazhuang, China–A Comprehensive Analysis. Promet-Traffic Transp. 2025, 37, 185–199. [Google Scholar] [CrossRef]
  44. Zhou, T.; Li, W. Analysis on Logistics Efficiency Measurement of New Western Land-Sea Corridor under the Background of “Double Carbon” and Ecological Environment Protection. J. Environ. Public Health 2023, 8642841. Available online: https://onlinelibrary.wiley.com/doi/full/10.1155/2023/8642841 (accessed on 1 March 2025). [CrossRef]
  45. Nicoletti, B.; Appolloni, A. Green Logistics 5.0: A review of sustainability-oriented innovation with foundation models in logistics. Eur. J. Innov. Manag. 2024, 27, 542–561. [Google Scholar] [CrossRef]
  46. Wilson, G.; Horsey, B.; Stone, R. Implementing concepts from green logistics in the turkey production supply chain. Front. Sustain. 2024, 5, 1416964. [Google Scholar] [CrossRef]
  47. Zhu, Z.; Zhao, S.; Liu, J.; Wang, M.; Lv, X. Evaluation of carbon emissions for fresh food last-mile delivery: A comparative analysis of two refrigeration methods. Case Stud. Therm. Eng. 2024, 60, 104787. [Google Scholar] [CrossRef]
  48. Delfmann, W.; Ten Hompel, M.; Kersten, W.; Schmidt, T.; Stölzle, W. Logistics as a science: Central research questions in the era of the fourth industrial revolution. Logist. Res. 2018, 11, 1–13. [Google Scholar]
  49. Rühlin, V.; Scherrer, M.; Crijns-Graus, W.; Worrell, E. Marginal abatement cost curves for cold food supply chains–A hybrid adoption of the practice-based and supply-chain practice view. J. Clean. Prod. 2025, 518, 145902. [Google Scholar] [CrossRef]
  50. Kouhizadeh, M.; Zhu, Q.; Sarkis, J. Circular economy performance measurements and blockchain technology: An examination of relationships. Int. J. Logist. Manag. 2023, 34, 720–743. [Google Scholar] [CrossRef]
  51. Wang, Y.; Jiang, Q.; Guan, X.; Guan, X. Recycling channel design and coordination in a reverse supply chain with customer green preference. Transp. Res. Part E Logist. Transp. Rev. 2023, 179, 103329. [Google Scholar] [CrossRef]
  52. Dubey, R.; Bryde, D.J.; Dwivedi, Y.K.; Graham, G.; Foropon, C.; Papadopoulos, T. Dynamic digital capabilities and supply chain resilience: The role of government effectiveness. Int. J. Prod. Econ. 2023, 258, 108790. [Google Scholar] [CrossRef]
  53. Jing, W.; Zhang, L. Environmental regulation, economic opening and China’s industrial green technology progress. Econ. Res. 2014, 49, 34–47. [Google Scholar]
  54. Fu, H.; Zhou, T.; Zhang, S.; Wang, Q. The impact of government subsidy and weather on environmentally sustainable investment decision for agricultural supply chain. PLoS ONE 2023, 18, e0285891. [Google Scholar] [CrossRef]
  55. Liu, Z.; Huang, N.; Han, C.; Yang, M.; Zhao, Y.; Sun, W.; Arya, V.; Gupta, B.B.; Shi, L. An optimal decision for fresh products’ cold chain considering freshness and carbon emission reduction. Br. Food J. 2024, 126, 2477–2499. [Google Scholar] [CrossRef]
  56. Mankiw, N.G.; Romer, D.; Weil, D.N. A contribution to the empirics of economic growth. Q. J. Econ. 1992, 107, 407–437. [Google Scholar] [CrossRef]
  57. Hausman, J.A. Specification tests in econometrics. Econometrica 1978, 46, 1251–1271. [Google Scholar] [CrossRef]
  58. Greene, W.H. Econometric Analysis, 5th ed.; Pearson Education: London, England, 2003. [Google Scholar]
  59. Wooldridge, J.M. Econometric Analysis of Cross Section and Panel Data, 2nd ed.; MIT Press: Cambridge, MA, USA, 2010. [Google Scholar]
  60. Mundlak, Y. On the pooling of time series and cross section data. Econometrica 1978, 46, 69–85. [Google Scholar] [CrossRef]
  61. Wooldridge, J.M. Correlated random effects models with unbalanced panels. J. Econom. 2019, 211, 137–150. [Google Scholar] [CrossRef]
  62. Chu, H.; Feng, T. Issues and Solutions Concerning the Development Model of Agricultural Product Cold Chain Logistics in Heilongjiang Province. Heilongjiang Sci. 2020, 11, 154–155. [Google Scholar]
  63. Wang, X.; Zhang, Q. Construction of a Cold Chain Logistics System for Fresh Agricultural Products Based on the Internet of Things: Framework, Mechanism, and Path. J. Nanjing Agric. Univ. 2016, 16, 31–41. [Google Scholar]
  64. Tu, J. Research on the Spatial-Temporal Evolution and Drivers of China’s Green Logistics Efficiency. Price Theory Pract. 2025, 6, 213–218+238. [Google Scholar]
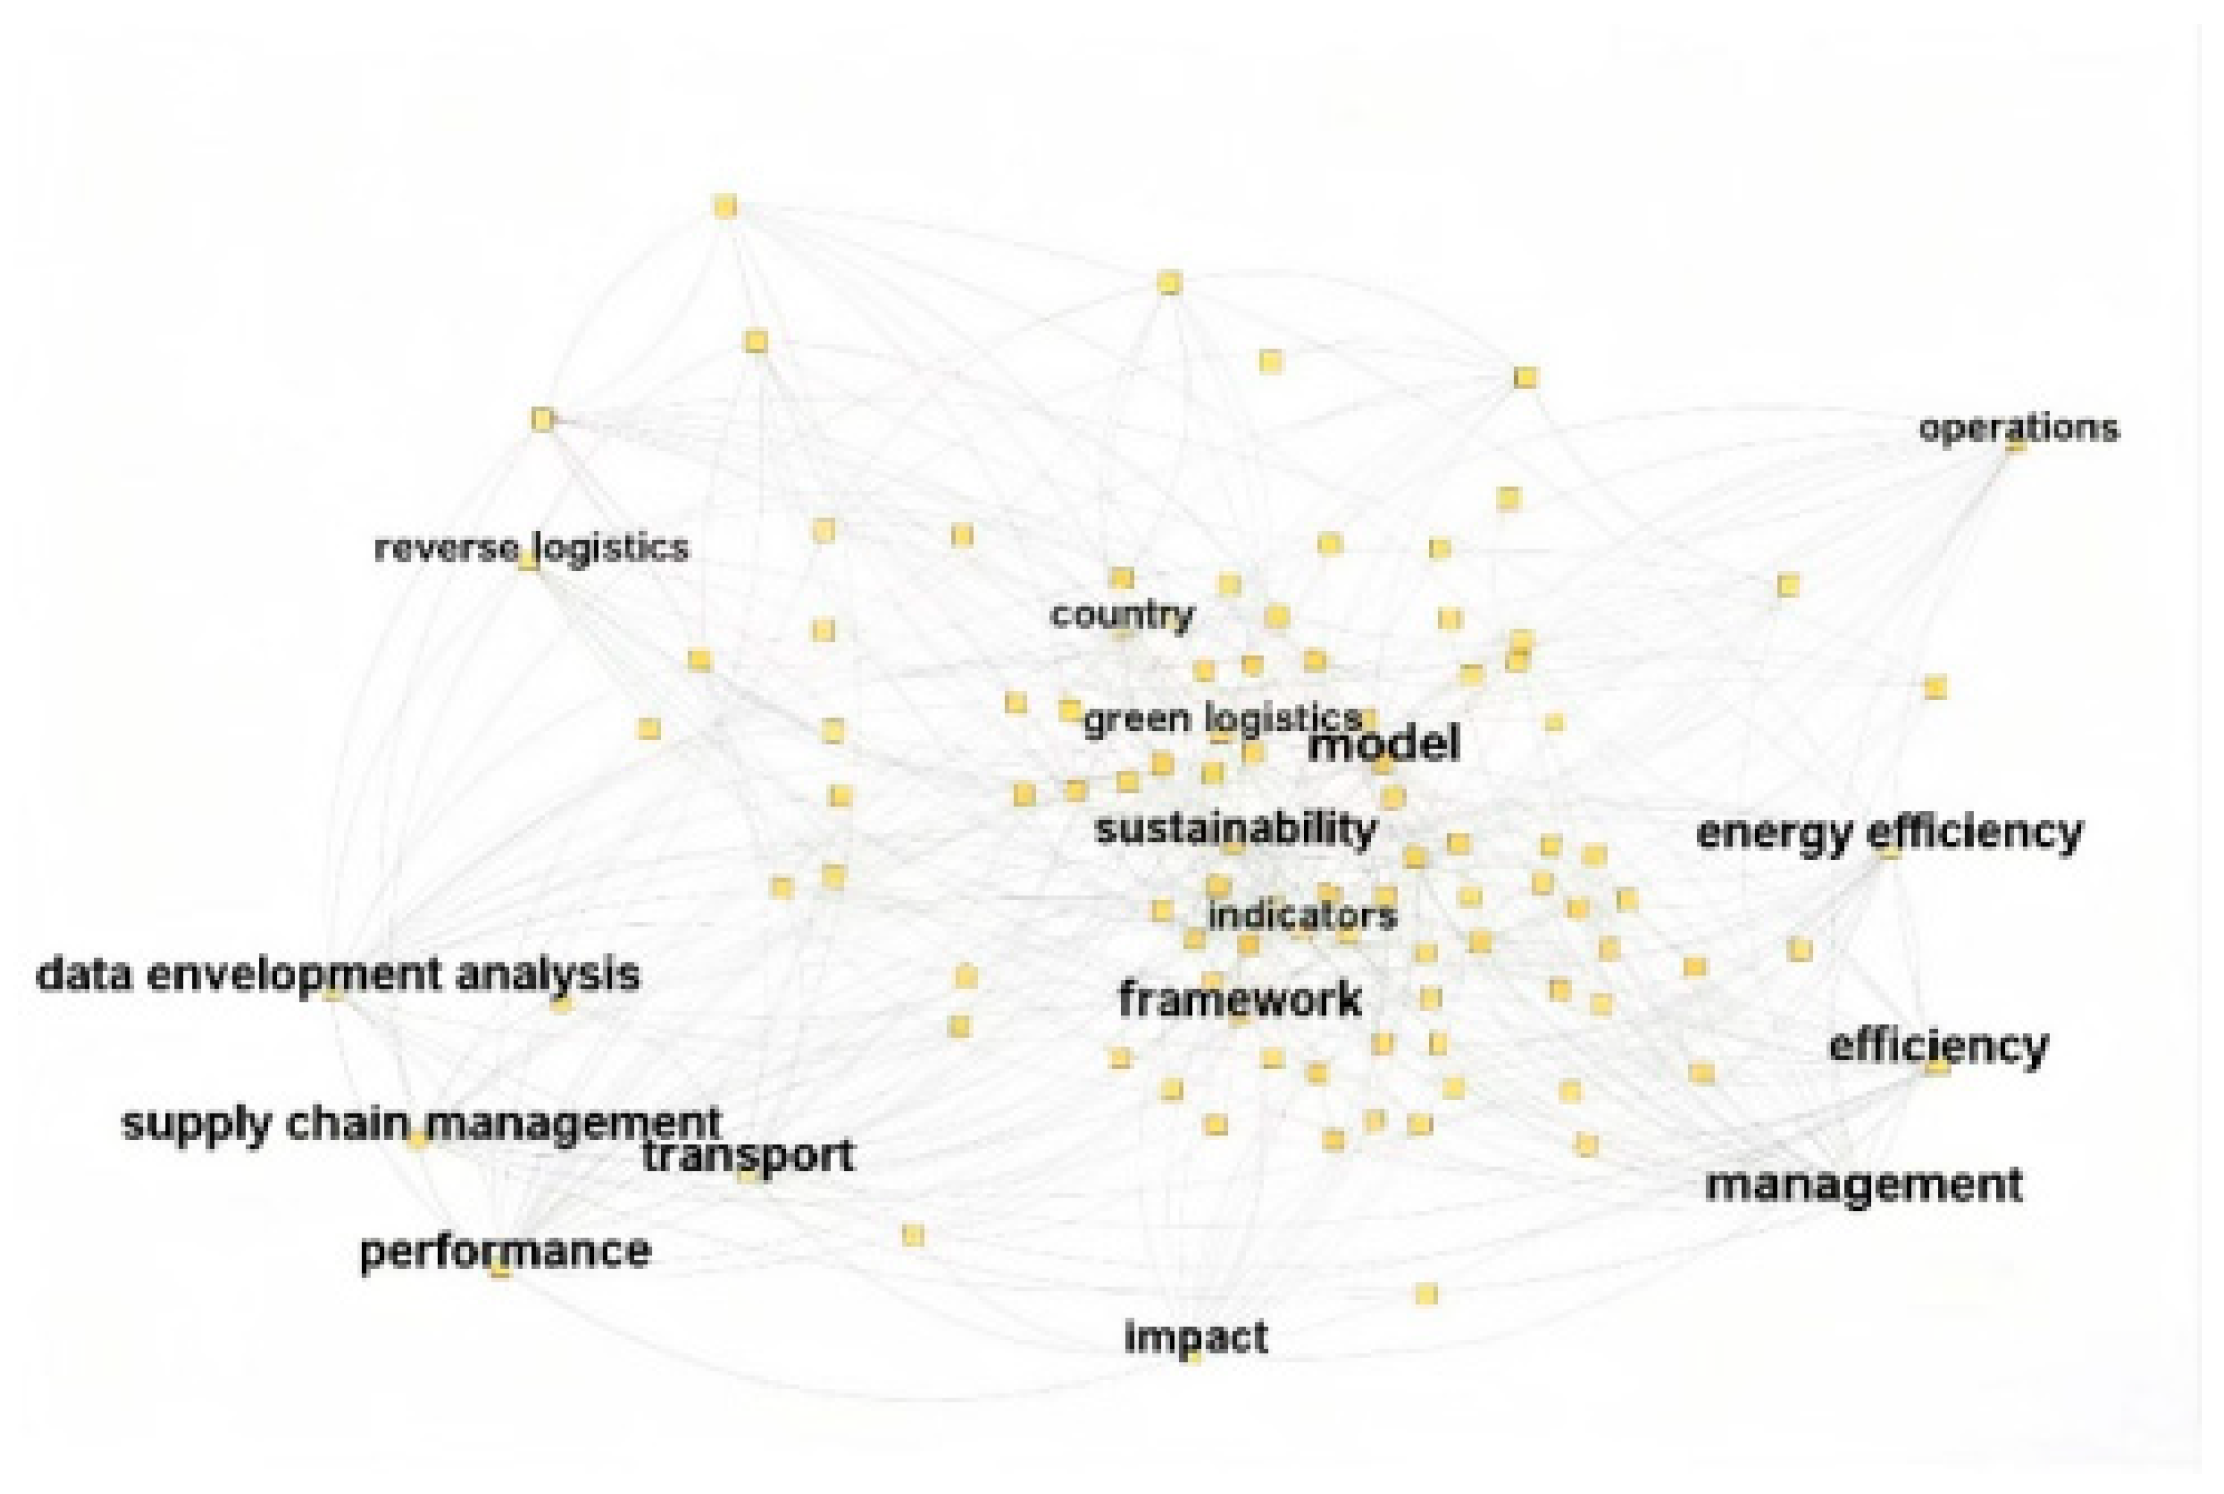
Figure 1. Keyword Co-occurrence Knowledge Map.
Sustainability 17 09367 g001
Figure 2. Distribution Patterns of Green Cold Chain Logistics Efficiency for Agricultural Products in the Three Northeastern Provinces and Each Individual Province.
Sustainability 17 09367 g002
Figure 3. Gini Coefficients of the Overall Sample and Within-Group Differences.
Sustainability 17 09367 g003
Figure 4. Gini Coefficients of Overall Inter-Regional Differences.
Sustainability 17 09367 g004
Figure 5. Gini Coefficients of Agricultural Green Cold Chain Logistics Efficiency Between Different Regions.
Sustainability 17 09367 g005
Table 1. Word Frequency Results.
Indicator NameFrequency
Carbon emissions from the logistics industry30
Fixed asset investment29
Energy consumption of the logistics industry26
Employment in the logistics industry24
Freight turnover12
Agricultural product freight volume8
Value added of the tertiary industry8
Total output value of the logistics industry1
Table 2. Evaluation System for Green Cold Chain Logistics Efficiency of Agricultural Products.
Indicator TypePrimary IndicatorSecondary Indicator
InputLabor inputEmployment in the logistics industry Number of employees in transportation, storage, and postal services
Capital inputRegional fixed asset investment Total fixed asset investment in each region
Energy inputEnergy consumption of the logistics industryConverted into standard coal equivalent
Infrastructure inputTotal mileage of transportation routesTotal highway mileage within the region
OutputDesirable outputValue added of the tertiary industryRegional value added of the tertiary sector
Freight turnoverRegional freight turnover
Agricultural product freight volumeSum of meat, eggs, aquatic products, vegetables, fruits, and milk
Undesirable outputCarbon emissions from the logistics industryEstimated following the 2006 IPCC Guidelines for National Greenhouse Gas Inventories
Table 3. Definitions of Parameters and Assigned Values.
ParameterDefinition
m Number of input indicators, set to 4
n Number of desirable output indicators, set to 3
q Number of undesirable output indicators, set to 1
θ * Calculated efficiency value of agricultural green cold-chain logistics
S i x Slack variable for the i -th input indicator, representing input redundancy (negative deviation)
S j y Slack variable for the j -th desirable output indicator, representing output shortfall (positive deviation)
S l b Slack variable for the l -th undesirable output indicator, representing the excess that needs to be reduced (negative deviation)
k Number of cities, set to 34
T Number of periods, set to 15
x i The i -th input indicator
y j The j -th desirable output indicator
b l The l -th undesirable output indicator
x i k t The i -th input of city k in period t
y j k t The j -th desirable output of city k in period t
b l k t The l -th undesirable output of city k in period t
λ j k t Weight variable of city k in period t
λ j k t x i k t Optimal input of city k in period t
λ j k t y j k t Optimal desirable output of city k in period t
λ j k t b l k t Optimal undesirable output of city k in period t
Table 4. Efficiency Values of Green Cold Chain Logistics for Agricultural Products in the Three Northeastern Provinces, from 2008–2022.
YearLiaoningJilinHeilongjiangThree Northeastern
20080.370.490.320.38
20090.360.450.310.36
20100.360.470.310.37
20110.380.480.310.38
20120.380.450.320.37
20130.380.450.380.40
20140.410.480.350.41
20150.460.500.350.43
20160.460.530.370.44
20170.480.520.360.45
20180.500.600.380.48
20190.500.470.370.45
20200.490.470.350.44
20210.520.460.350.46
20220.510.390.310.41
Average0.440.480.340.41
Table 5. Annual ML Index and Its Decomposition for the Three Northeastern Provinces.
YearECTCPECSECML Index
2008–20090.9750.9760.9840.9910.952
2009–20100.9291.0830.9610.9661.006
2010–20110.9951.0350.9431.0551.030
2011–20121.0050.9870.9461.0620.992
2012–20130.9071.1280.9110.9961.023
2013–20141.0760.9871.1010.9771.061
2014–20150.8581.2070.9390.9131.035
2015–20160.9941.0541.1290.8811.048
2016–20170.9681.0370.9720.9961.004
2017–20181.2320.8601.0261.2001.059
2018–20190.9970.9390.9811.0170.936
2019–20201.2050.8121.0751.1210.978
2020–20210.9411.0710.9880.9521.007
2021–20221.0900.8360.9661.1280.911
Average1.0121.0010.9941.0181.003
Table 6. City-Level ML Index and Its Decomposition for the Three Northeastern Provinces.
CityECTCPECSECML Index
Shenyang0.9981.0900.9981.0001.088
Dalian1.0021.0670.9961.0061.069
Anshan0.9831.0260.9831.0001.009
Fushun1.0330.9741.0390.9951.006
Benxi1.0250.9830.9991.0261.007
Dandong1.0410.9591.0001.0411.000
Jinzhou1.0370.9771.0011.0351.013
Yingkou1.0380.9771.0371.0001.014
Fuxin1.0490.9531.0021.0471.000
Liaoyang1.0021.0101.0021.0001.012
Panjin1.0390.9831.0381.0011.021
Tieling1.0720.9471.0691.0031.015
Chaoyang1.0490.9631.0520.9961.010
Huludao1.0290.9711.0071.0221.000
Changchun0.9651.0230.9860.9790.987
Jinlin0.9311.0580.9311.0000.985
Siping0.9451.0321.0000.9450.975
Liaoyuan1.0010.9870.9951.0060.988
Tonghua1.0070.9831.0071.0010.990
Baishan1.0630.9371.0640.9990.996
Songyuan1.0020.9781.0021.0000.980
Baicheng0.9710.9920.9211.0540.964
Haerbin0.9101.0830.9250.9840.986
Qiqihaer0.9740.9990.9181.0610.974
Jixi1.0270.9780.9731.0561.004
Hegang1.0030.9991.0001.0041.003
Shuangyashan1.0310.9781.0091.0221.009
Daqing1.0360.9881.0361.0001.023
Yichun1.0280.9760.9881.0411.003
Jiamusi1.0080.9870.9591.0510.995
Qitaihe0.9991.0041.0040.9941.003
Mudanjiang0.9880.9980.9491.0410.986
Heihe1.0150.9750.9571.0610.990
Suihua0.9691.0080.9271.0460.977
Average1.0080.9950.9931.0151.002
Table 7. Sources of Disparities and Contribution Rates in Agricultural Green Cold Chain Logistics Efficiency in the Three Northeastern Provinces.
YearIntra-Regional DifferencesBetween-Region DisparitiesOver-Dispersion Density
GwContribution Rate (%)GbContribution Rate (%)GtContribution Rate (%)
20080.03924.3680.08452.2420.03823.39
20090.0424.9730.07748.4490.04226.578
20100.04425.4820.08750.4660.04224.051
20110.04325.4660.08852.0180.03822.516
20120.04225.9040.07546.6950.04427.401
20130.06229.2620.02913.7910.12056.947
20140.04227.5330.06441.6670.04730.800
20150.05127.0770.07640.5110.06132.412
20160.04425.9740.07544.4700.0529.556
20170.04926.4120.07741.4700.0632.118
20180.04824.5450.09649.2270.05126.227
20190.05126.8120.06835.5430.07237.644
20200.04925.5960.07438.4260.06935.978
20210.05927.8910.08942.0620.06430.048
20220.06728.3890.11347.6520.05723.960
Table 8. Conditional β-Convergence of Agricultural Green Cold Chain Logistics Efficiency in Each Province.
VariableLiaoningJilinHeilongjiang
β−0.1978 ***
(−4.53)
−0.1594 ***
(−3.60)
−0.6300 ***
(−12.99)
PC0.0000 ***
(3.54)
0.0000 **
(2.32)
0.0000
(1.39)
TRD−0.0000
(−0.76)
0.0013
(1.29)
−0.0001 *
(−1.82)
TIV_GDP0.0001
(0.16)
−0.0007
(−0.68)
0.0010 **
(2.22)
LTV_GDP0.0002 *
(1.74)
−0.0002
(−0.16)
0.0004 ***
(15.80)
IAP0.0000 ***
(4.30)
−0.0000
(−1.31)
−0.0000 **
(−2.17)
STE−0.0001
(−0.64)
0.0006
(1.54)
−0.0001
(−1.58)
EPGR0.0025
(0.81)
−0.0020
(−0.38)
−0.0006
(−0.88)
REAS−0.0209 ***
(−3.34)
−0.0357
(−1.54)
−0.0403 ***
(−4.71)
α0.0128
(0.70)
0.0306
(0.99)
0.2054 ***
(8.20)
R20.39720.15160.8776
Note: ***, **, and * denote significance at the 1%, 5%, and 10% levels, respectively.
Table 9. Results of Fisher-ADF and Fisher-PP Panel Unit Root Tests.
VariableFisher-ADFFisher-PP
p-ValueStationarityp-ValueStationarity
lnPC0.0001Stationary0.0000Stationary
TIV_GDP0.0000Stationary0.0000Stationary
LTV_GDP0.0000Stationary0.0000Stationary
lnIAP0.0000Stationary0.0000Stationary
TRD0.0000Stationary0.0000Stationary
REAS0.0000Stationary0.0000Stationary
Table 10. Panel Tobit Model Regression Results.
Explanatory VariableLiaoningJilinHeilongjiang
lnPC0.0810 ***
(4.6421)
0.3123 ***
(4.7024)
0.0491 ***
(5.1594)
TRD0.0004 *
(1.8505)
--−0.0002 **
(−2.5739)
TIV_GDP----0.0025 ***
(5.9441)
LTV_GDP0.0003 *
(1.6900)
0.0056 **
(2.1943)
0.0004 ***
(14.9836)
lnIAP0.1087 ***
(9.0695)
−0.1323 **
(−3.5319)
−0.0046 ***
(−6.9546)
REAS−0.0648 ***
(−6.3628)
−0.1229 ***
(−3.5584)
−0.0605 ***
(−8.0458)
Note: ***, **, and * denote significance at the 1%, 5%, and 10% levels, respectively.
Disclaimer/Publisher’s Note: The statements, opinions and data contained in all publications are solely those of the individual author(s) and contributor(s) and not of MDPI and/or the editor(s). MDPI and/or the editor(s) disclaim responsibility for any injury to people or property resulting from any ideas, methods, instructions or products referred to in the content.