Article

Long-Term Divergence in Green Exposure Trajectories and Economic Determinants in Urban China

1
School of Land Engineering, Chang’an University, Xi’an 710064, China
2
College of Soil and Water Conservation Science and Engineering, Northwest A&F University, Yangling 712100, China
3
Xi’an Center of Mineral Resources Survey, China Geological Survey, Xi’an 710100, China
4
TianfuJiangxi Laboratory, Chengdu 641419, China
*
Authors to whom correspondence should be addressed.
Sustainability 2025, 17(20), 9345; https://doi.org/10.3390/su17209345
Submission received: 21 August 2025 / Revised: 13 October 2025 / Accepted: 17 October 2025 / Published: 21 October 2025
(This article belongs to the Section Health, Well-Being and Sustainability)

Abstract

Urban greening is increasingly promoted as a means to achieve sustainable and inclusive development. However, it remains unclear whether the expansion of green infrastructure reduces spatial and socioeconomic inequalities or reinforces them. This study examines the long-term dynamics of green space exposure in 287 Chinese cities from 2000 to 2020 using geospatial and statistical data. While median green coverage and exposure increased by 126% and 135%, spatial disparities also grew. Eastern cities consistently showed higher levels of exposure, and national-level improvements did not translate into proportional narrowing of interregional gaps. Granger causality tests indicate a bidirectional relationship between economic growth and green exposure at the national level. This relationship varies across regions. Cities in the east, center, and northeast exhibit strong mutual effects, while other regions show weaker or unidirectional linkages. In North China, economic development and green exposure are entirely disconnected. These differences have led to divergent patterns in exposure equity. Despite a 44% national decline in the Gini index, disparities persisted, most notably in northeastern China. The results suggest that area-based greening targets are insufficient to address inequality. Planning strategies that consider population exposure and regional conditions are needed to improve the inclusiveness of urban greening. This study offers evidence for designing more equitable greening approaches in rapidly urbanizing areas.

1. Introduction

Urbanization is among the most profound transformations of the 21st century, with nearly 70% of the global population projected to reside in cities by 2050. While cities drive economic innovation, their rapid expansion often intensifies environmental stress [1], including air pollution [2], biodiversity loss [3], and climate-related hazards [4,5]. In this context, urban green space has emerged as a key lever for promoting sustainable, resilient, and livable cities. Green infrastructure not only mitigates ecological risks but also enhances public health, fosters social cohesion, and underpins long-term urban resilience [6,7,8,9]. As a result, ensuring equitable access to green space has become a core priority in global sustainability frameworks, including the United Nations Sustainable Development Goals [10,11].
China provides a particularly relevant context for examining the evolving role of urban greening amid rapid development. Over the past two decades, the country has shifted from a growth-centric urbanization model to one increasingly guided by ecological priorities [12,13,14]. This shift has been driven by mounting environmental concerns, institutional reforms, and national initiatives, notably through the Ecological Civilization agenda and national strategies such as the National New-type Urbanization Plan (2014–2020) and the Urban Green Space System Planning guidelines [15,16]. These frameworks have spurred substantial expansion in urban green coverage, as cities compete to integrate green infrastructure into their planning systems [12]. However, the ecological benefits of these gains, particularly who accesses them and how equitably they are distributed, remain poorly understood. Green space exposure, defined as the population-weighted availability of accessible green areas, has emerged as a more socially meaningful and equity-relevant metric than green coverage alone. While coverage quantifies the physical extent of vegetation within urban boundaries, exposure explicitly captures how such resources are spatially aligned with where people live, thereby providing a clearer measure of actual human benefit [17]. Comparative work in the Global North and South has shown that citywide increases in greening often fail to deliver equitable benefits when measured only by coverage [18]. Empirical studies have demonstrated that relying solely on coverage may misrepresent environmental equity: for example, greenspace coverage tends to overestimate exposure in densely populated areas of East China while underestimating it in sparsely populated western regions [19].
This divergence is not merely a function of land cover and population distribution, but also reflects the influence of policy-driven greening strategies that are often shaped by local economic priorities and institutional capacity [20,21]. Evidence suggests that the relationship between green space exposure and economic development is not only reciprocal but structurally mediated. Cities with stronger fiscal capacity and institutional frameworks are more likely to implement effective greening strategies, leading to higher levels of green exposure [22,23]. In turn, increased exposure can enhance urban livability, attract investment, and support economic growth [24,25]. Yet this feedback loop is not uniformly equitable [22,26]. When greening efforts are embedded in capital-intensive redevelopment, they risk reinforcing existing socioeconomic divides. The exposure inequality was pronounced across Global South cities, including China, with substantial disparity between income groups and between urban cores and peripheries [27]. Such disparities suggest that the same structural forces driving economic advantage may also shape the distribution of green resources. Differences in development stage and planning capacity can also result in disproportionate gains [28]. Residents in newly developed districts was found enjoying significantly higher green exposure than those in older neighborhoods, indicating that urban renewal tends to concentrate environmental benefits in more recent developments [29]. Nevertheless, empirical work on green space exposure in China remains limited in scope, often constrained by short timeframes, narrow geographic focus, and insufficient analytical integration. This has hindered systematic understanding of how green accessibility and economic inequality have co-evolved at scale.
To address these gaps, this study conducts a two-decade, nationwide analysis of green space exposure across 287 Chinese cities from 2000 to 2020. We ask not only how green space has expanded, but who has benefited from it, and whether this expansion has contributed to greater environmental equity or reinforced existing inequalities. Specifically, we investigate three interrelated questions: (1) How have urban green space coverage and population-weighted exposure changed over space and time, and what spatial disparities have emerged? (2) What is the nature of the causal relationship between economic development and green exposure, and how does it vary across regions? (3) To what extent have green exposure and economic inequality been coupled or decoupled during China’s urban transformation? By integrating remote sensing data, socioeconomic statistics, spatial analysis, and inequality metrics, this study aims to offer empirical insights for advancing environmentally justice and sustainable urban transitions—not only in China, but also in rapidly urbanizing regions worldwide.

2. Data Sources

2.1. Satellite Imagery for Green Space Extraction

This study utilized the Google Earth Engine platform (https://earthengine.google.com/) to obtain atmospherically and geometrically corrected Landsat (Landsat 7–8) data for the entire country from 2000 to 2020. All images have a spatial resolution of 30 m. To ensure data quality, a simple cloud score algorithm provided in GEE was employed. This algorithm assesses images based on the relative cloud amount for each pixel (score ranging from 0 to 100), and pixels with high cloud potential were filtered out using a threshold of 30, thus retaining clear ground information. Furthermore, to mitigate the spectral differences between different satellite sensors, a sensor harmonization procedure was implemented using Landsat 8 as the reference, thereby ensuring the temporal comparability of the multi-source imagery.

2.2. Urban Boundaries

This study adopted the Global Urban Boundaries (GUBs) dataset [30], which is derived from the 30 m resolution Global Artificial Impervious Area (GAIA) data [31]. Urban core areas are identified through kernel density analysis, and refined urban boundaries are delineated using an automated neighborhood expansion algorithm, followed by boundary smoothing to enhance spatial coherence. The GUB dataset provides global coverage of cities and settlements with a minimum area of 1 km2. In our analysis, we used GUB data at five time points (2000, 2005, 2010, 2015, and 2020) to dynamically delineate changing urban boundaries over the study period. To delineate the study area, the GUB data were integrated with 1:4,000,000-scale vector data from the National Fundamental Geographic Information System of China, enabling the extraction of urban boundaries for 326 major prefecture-level cities across the country.

2.3. Socioeconomic Data

This study utilized annual high-resolution gridded population datasets from the WorldPop project for the period 2000–2020. The WorldPop dataset integrates diverse data sources—including national census records, remote sensing imagery, land use information, and nighttime light data—and applies machine learning algorithms, such as random forest models, to estimate population distribution [32]. The resulting gridded data have a spatial resolution of approximately 100 m, enabling detailed assessment of the spatiotemporal dynamics of population distribution and change. This dataset is well-suited for analyzing urban population size, density, and their evolution over time.
Annual gross domestic product (GDP) statistics at the prefecture level were obtained from the China City Statistical Yearbook for the years 2000–2020. The dataset includes 287 prefecture-level cities and focuses primarily on local per capita GDP. To ensure data integrity, missing or inconsistent records were either imputed using reasonable assumptions or excluded based on data quality standards. The finalized per capita GDP data provide consistent, city-level economic indicators for evaluating urban economic development trends across China. The study covers 2000–2020, the earliest period with consistent national data. Green coverage and exposure were derived for 326 cities, while econometric analyses use 287 cities with complete GDP and population series.

3. Methods

3.1. Green Space Extraction and Exposure Modeling

Normalized Difference Vegetation Index (NDVI) is an effective method for extracting green space information from remote sensing images, which is widely used in urban green space research [33]. The formula is as follows:
N D V I = N I R R N I R + R
where NIR and R are the reflectance value of the near-infrared and red channels, respectively.
Annual maximum NDVI values were derived from atmospherically corrected Landsat 7 and 8 imageries using a combination of linear interpolation and Savitzky–Golay (S–G) smoothing to reduce temporal noise. Following extensive empirical testing and comparative analysis under varying geographical and climatic conditions, a threshold of NDVI > 0.34 was established for consistent identification of urban green spaces across China.
To quantify residents’ access to green space, a population-weighted green space exposure index was employed [27], which captures the spatial concordance between population distribution and vegetation presence. The index is defined as:
G E d = i = 1 M P i × G i d i = 1 M P i
where P i represents the population of pixel i , G i d represents the fractional green space coverage within a circular buffer of radius d around pixel i, d = 500 m in this study; M denotes is the total number of pixels within the city, and G E d represents the city-level population-weighted green space exposure. The NDVI threshold (0.34) was selected based on a comparison with Wu et al. (2023) [27]. Sensitivity analysis (with threshold ranging from 0.26 to 0.44) confirmed that temporal trends of green exposure remain statistically stable (R2 > 0.985) across thresholds (see Supplementary Tables S1 and S2).

3.2. Spatiotemporal Analysis

This study constructed an integrated analytical framework of “spatial pattern–temporal evolution” to examine the spatial dependence and long-term dynamics of urban green space. Spatially, both global and local Moran’s I indices were employed to assess the spatial autocorrelation and clustering characteristics of urban green space distribution at the national and regional levels. Specifically, global Moran’s I ( I ) was used to evaluate the overall spatial autocorrelation and heterogeneity of urban green space distribution, while the local Moran’s I ( I i ) was used to further identify local spatial clustering patterns at the city-specific level, such as statistically significant hot spots and cold spots.
Temporally, the Theil–Sen median slope estimator and the Mann–Kendall (MK) trend test were used to quantify long-term trends in urban green space coverage and population-weighted green exposure from 2000 to 2020. Specifically, the Sen’s slope was calculated for both city-level time series and for aggregated regional panels, enabling the detection of heterogeneous urban and regional trajectories [34]. The MK test was used to assess the statistical significance of the detected trends without assuming a specific distribution, making it particularly suitable for non-linear or non-normally distributed environmental time series. The MK test was applied at both the city and regional levels to detect whether long-term changes in green coverage and exposure were statistically significant across scales.

3.3. Causal Inference Methods

To systematically examine the interaction mechanism between urban green space and economic development, this study adopted the Granger Causality Test to scientifically identify the direction of the causal relationship between the two.
To ensure the stationarity of our core variables and avoid spurious regression, we first conducted Augmented Dickey–Fuller (ADF) tests. The results showed that in some regions the natural logarithm of per capita GDP (ln(AGDP)) contains a unit root and is non-stationary, while its first-difference, Δln(AGDP), is stationary. Likewise, the first-difference of the natural logarithm of the urban green space ratio, Δln(UGR), also passes the stationarity test. Consequently, to guarantee reliable results and maintain methodological consistency across all regions, all subsequent Granger causality tests and panel regression models in this study are based on Δln(AGDP) and Δln(UGR). This treatment allows us to focus on the dynamic linkage between the growth rate of economic development and the growth rate of urban green space exposure.
The core principle of the Granger Causality Test is: if the lagged terms of variable X can significantly improve the prediction accuracy of variable Y, then X is said to be the Granger cause of Y. In this study, by setting Δln(UGR) and Δln(AGDP) as both explanatory and explained variables, we tested whether the lagged terms of the variables have significant predictive power, thereby determining the existence and direction of causality. Based on existing research (references), the test results were divided into three types: (1) unidirectional causality; (2) bidirectional causality; (3) no significant Granger relationship. Panel data regression model can be expressed as Equations (3) and (4):
Δ ln ( A G D P i t ) = α 1 Δ ln ( U G R i t ) + u i + ε i t
Δ ln ( U G R i t ) = β 1 Δ ln ( A G D P i t ) + u i + ε i t
where u represents the intercept term reflecting individual sample measurement, and ε represents the disturbance term that varies with time and individual. The concept of elasticity can be applied to the concept of a system with causal relationships. α represents the “economy–greenness elasticity” in first differences. It measures the short-term effect of built-up-area greenness growth on per capita GDP growth: when the greenness ratio increases by 1%, per capita GDP grows by approximately α %. β represents the “greenness–economy elasticity” in first differences. It measures the short-term effect of per capita GDP growth on built-up-area greenness growth: when per capita GDP increases by 1%, the greenness ratio grows by approximately β %.

3.4. Inequality Measures

The study adopted classic indicators for quantifying inequality in economics—the Gini Coefficient and the Lorenz Curve—to quantitatively depict the spatial matching degree between the distribution of urban green space resources and the level of economic development, and to measure the distribution patterns of green space resources in space and under different economic development conditions.
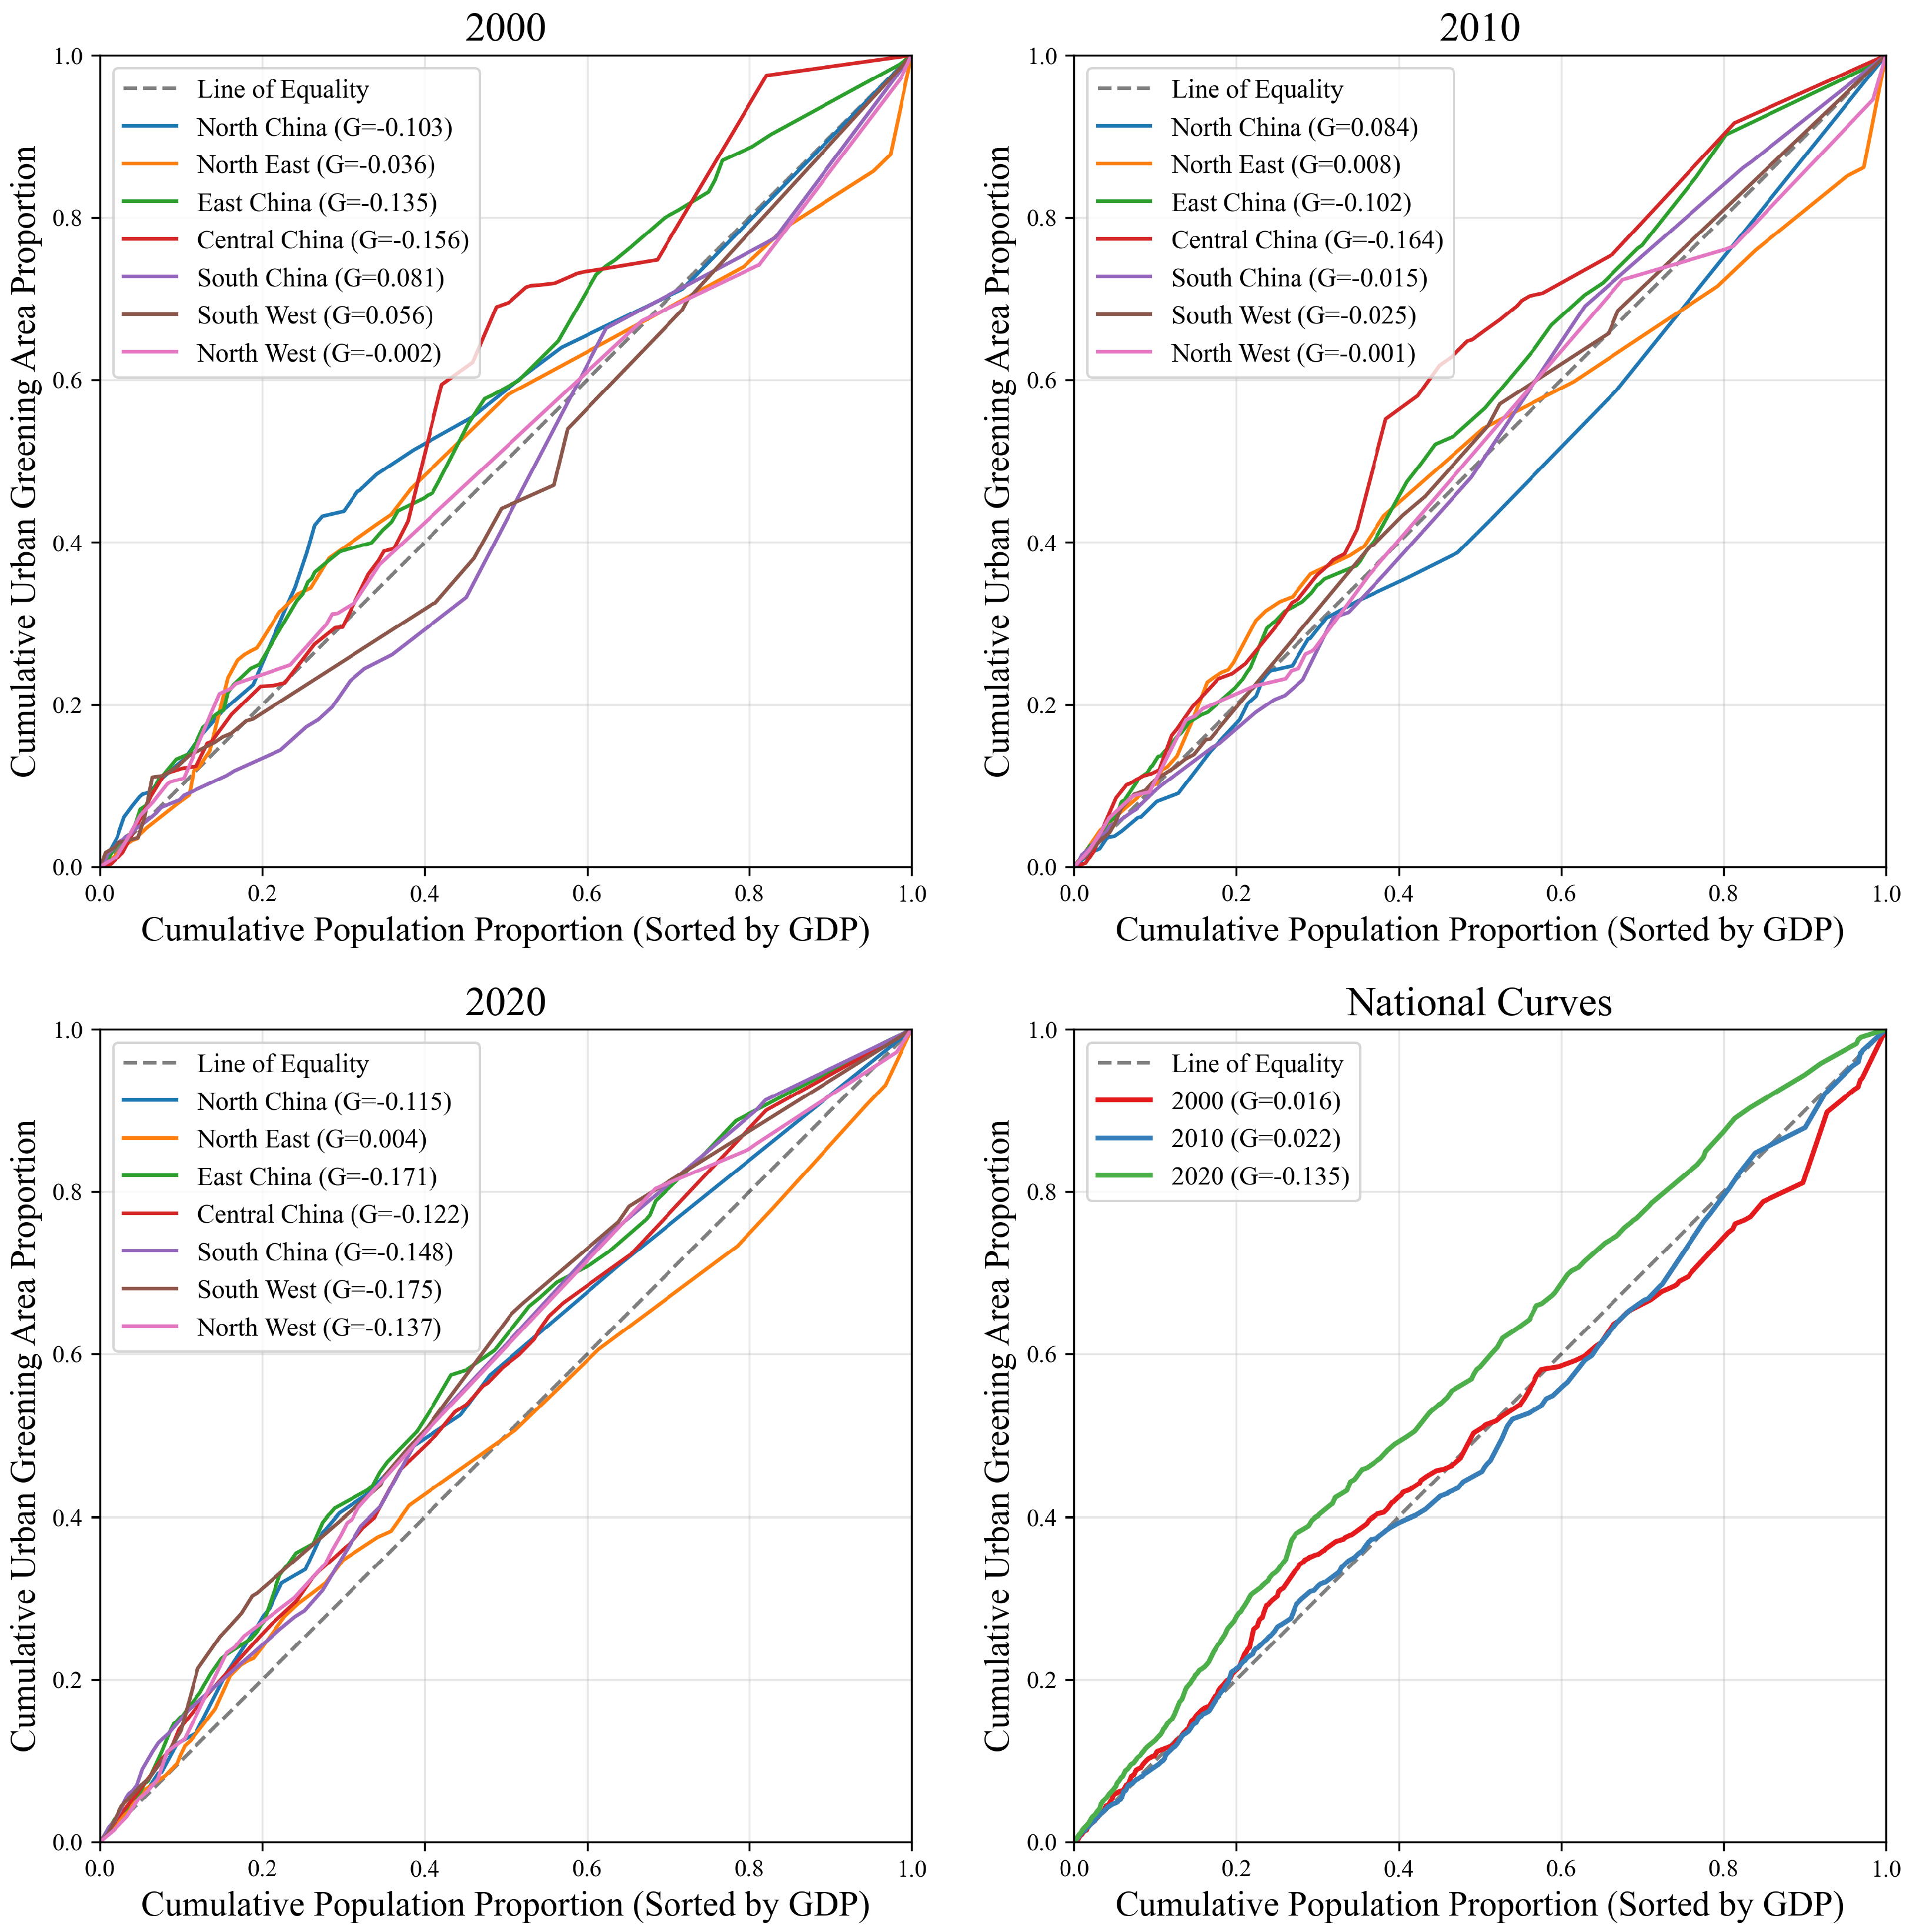
The Lorenz curve visually reflects the degree of resource allocation imbalance by plotting the cumulative proportion of indicators for each city sorted by per capita GDP (such as cumulative population proportion) against the cumulative proportion of green space-related indicators. Among them, the horizontal axis of the curve represents the cumulative proportion of indicators for each city sorted by per capita GDP, such as cumulative population proportion. The vertical axis is the corresponding cumulative proportion of green space-related indicators for the city. The closer the curve is to the 45° line, the more balanced the resource allocation is; conversely, the more unequal it is. Based on the Lorenz curve, the Gini coefficient is calculated. The Gini coefficient ranges from 0 to 1, and a smaller value indicates a more balanced spatial distribution.

4. Results

4.1. Spatiotemporal Distribution of Urban Green Space Coverage and Exposure

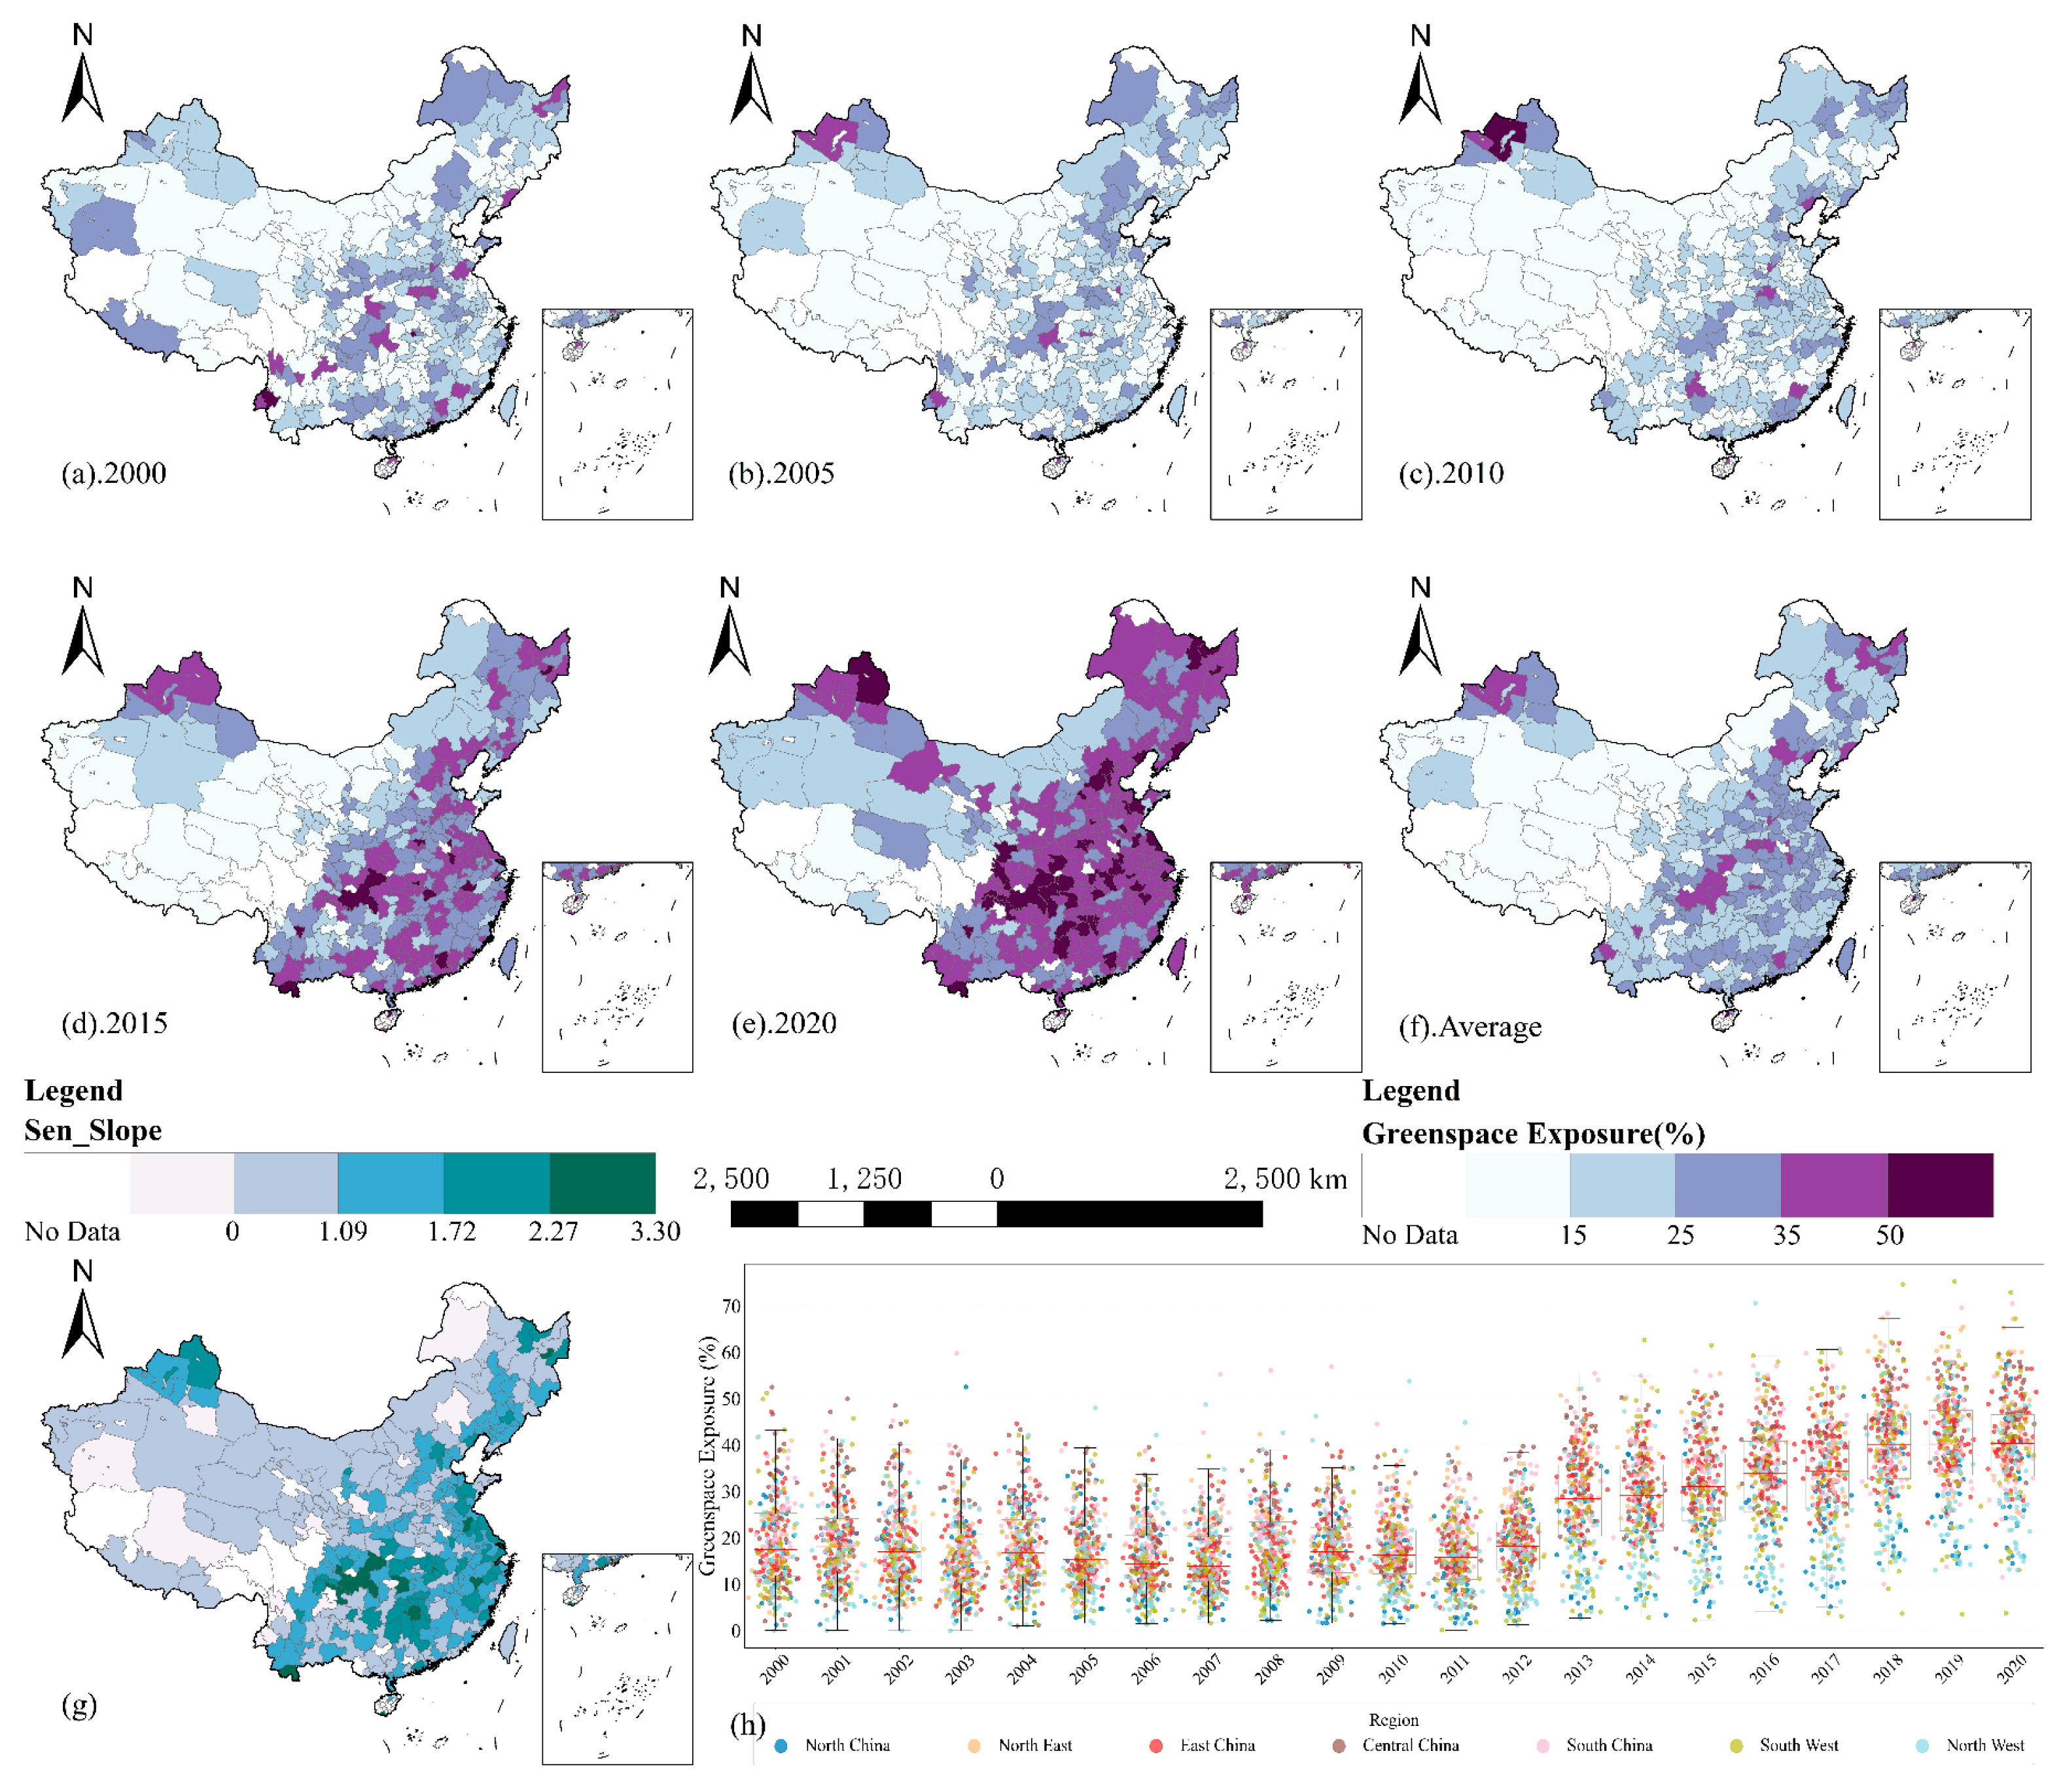
The city-level greenspace exposure was validated against the China-only subset of Wu et al. (2023) [27], which are reported in Table S1, with overall correlation coefficient of 0.87. Between 2000 and 2020, the built-up area of 326 prefecture-level cities in China expanded by 290%, reflecting the scale and speed of urbanization nationwide. This rapid spatial growth reshaped land use patterns and drove significant changes in urban green space coverage, which increased steadily during the same period. However, the expansion was uneven across regions: eastern cities consistently exhibited higher coverage, driven by greater ecological investment and planning capacity, while most western cities remained below the national average, with the exception of isolated ecological zones such as the northern Tianshan region. Although 82.3% of cities showed significant increases in coverage, fewer than 2% experienced declines, mostly in the underdeveloped west. A marked growth acceleration occurred after 2011 and intensified post-2018, coinciding with major environmental policy shifts. Yet, persistently high spatial variability, particularly in northern and inland regions (Figure 1), indicates that a coverage-focused approach alone has not reduced regional inequalities.
Green space exposure, measuring population-level accessibility to green space, presents a more equitable lens (Figure 2). Its spatial pattern parallels coverage but more directly reflects social benefit: eastern cities consistently outperformed western ones. Nationally, median exposure rose from ~17% in 2000 to ~40% in 2020, with a notable upturn after 2018. However, exposure disparities widened over time—unlike coverage, which remained stably unequal, exposure saw growing intercity variability. This divergence likely reflects differences in planning effectiveness, urban form, and mobility infrastructure.
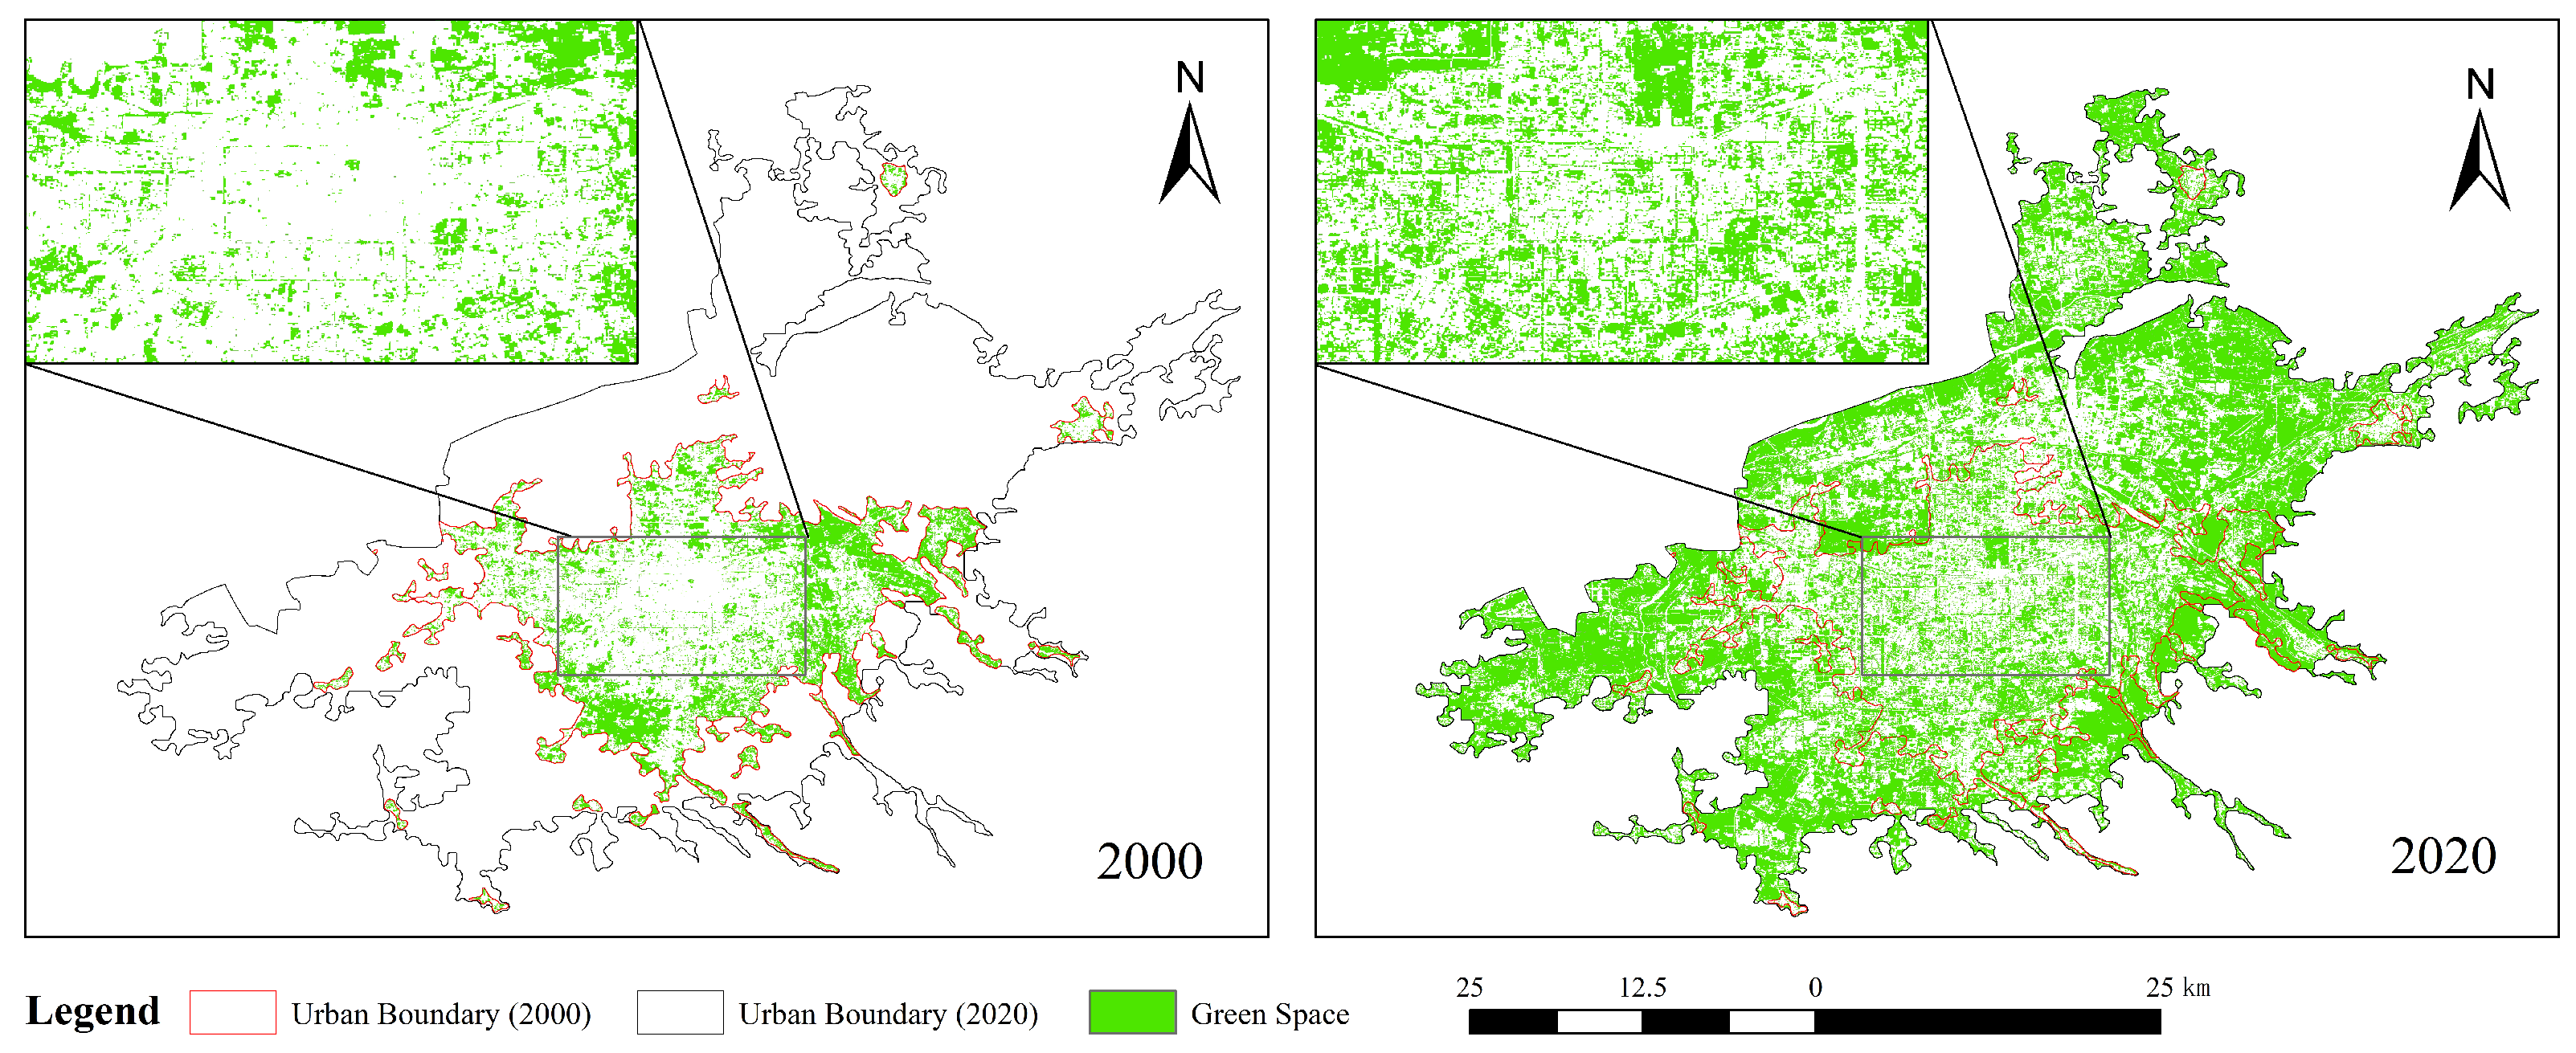
Taking Xi’an as an example, its urban green coverage rose from 30.55% to 57.21%, and green exposure from 12.31% to 39.94%. As shown in Figure 3, Xi’an’s green spaces evolved from sparse and fragmented to a connected network (including main roads, parks, and residential greening), achieving a dual improvement in both greening level and quality. This reflects the synchronized evolution of urban expansion and green infrastructure development, driven by economic policies such as the “Western Development Strategy,” showcasing the positive role of economic development in urban ecological improvement and a shift towards a high-quality, sustainable urban development model.
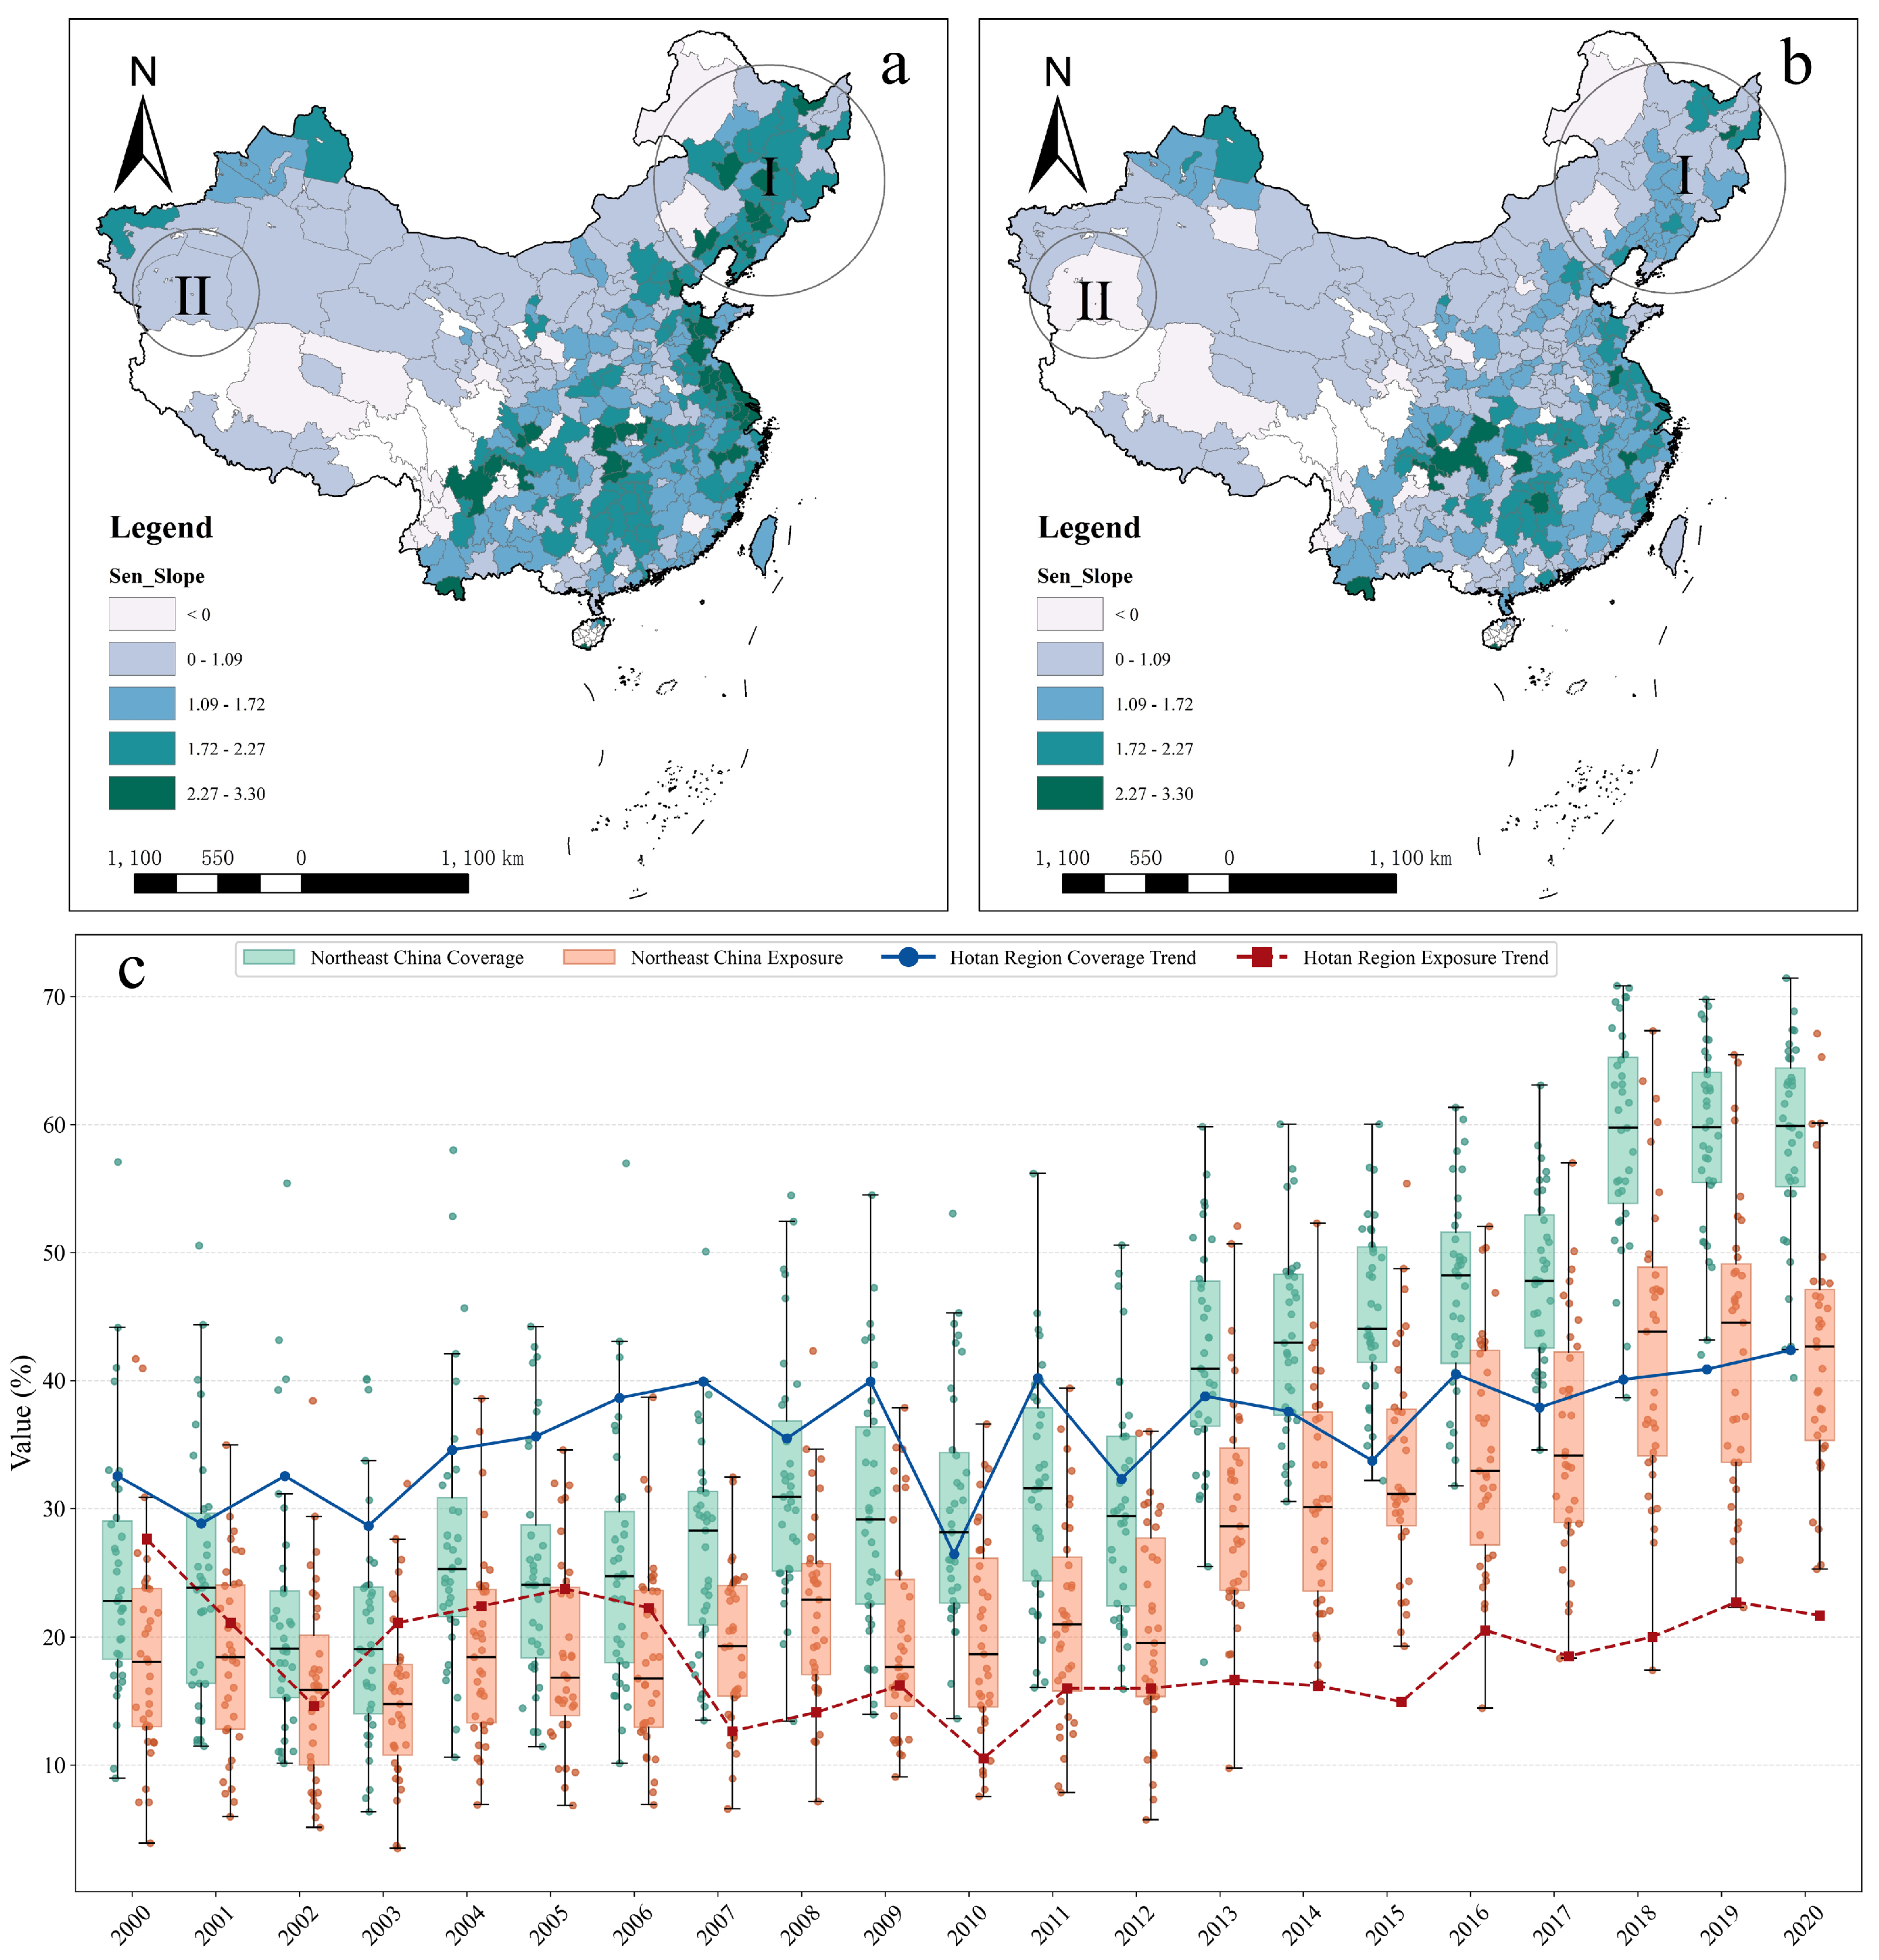
However, the positive trajectory observed in Xi’an does not hold across all cities. Although coverage and exposure often follow similar trends, they represent fundamentally different aspects of urban greening. Coverage reflects the physical supply of green space, while exposure reflects the extent to which this supply is accessible to the population. Their divergence reveals a structural disconnect, where expanded green areas do not necessarily translate into meaningful or equitable benefits for residents. As shown in Figure 4, Hotan experienced continuous green coverage growth but a slight decline in exposure, while in Northeast China (Region I), both rates increased but the disparity between them widened, with exposure growth failing to keep pace with coverage. This highlights the significant divergence in green exposure trajectories under varying economic development models and urbanization pathways. The findings suggest a need to move beyond aggregate greening targets toward spatially responsive planning. Integrating green infrastructure into high-density and underserved areas through pocket parks, green corridors, and walkable networks may better align ecological provision with equitable access.

4.2. Causal Interaction Between Economic Development and Green Exposure

Granger causality tests were conducted to examine whether a directional relationship exists between economic development and urban green space exposure. To ensure robustness, we tested for variable stationarity using ADF unit root tests and assessed potential long-run relationships with Johansen cointegration tests; the results (Tables S3 and S4) confirm that the econometric assumptions are satisfied and support the validity of our Granger causality and panel regression analyses. At the national level, Granger test (Table 1) indicate a statistically significant bidirectional causal relationship at the 1% level, with per capita GDP significantly predicting changes in green-space exposure, and exposure also significantly Granger-causing economic growth. These dynamics are further supported by panel regression coefficients in Table 2, where a 1% increase in GDP per capita was associated with a 0.31% increase in exposure, while a 1% increase in exposure was associated with a 0.436% increase in GDP per capita, indicating a robust and reciprocal relationship between ecological improvement and economic expansion at national scale.
However, this relationship exhibits substantial regional variation, with distinct patterns in causal directionality and elasticity strength. In East, Central, and North-East China, both causal directions are statistically significant at the 1% level, with elasticity coefficients ranging from 0.29 to 0.576—signaling a strongly reciprocal association between economic development and green-space exposure, and suggesting these regions have achieved a high degree of integration between fiscal investment, spatial planning, and environmental service delivery. In contrast, the South-West and North-West regions display a unidirectional pattern in which GDP per capita significantly influences green-space exposure (p < 0.05), but not the reverse, indicating that economic growth facilitates ecological improvements even where green investments do not yet generate measurable economic feedback. South China exhibits the inverse structure: green-space exposure significantly contributes to subsequent GDP growth (p = 0.02), while the reverse is not significant—suggesting that in land-scarce, high-density settings, improving green accessibility can act as an indirect input to economic performance. North China shows no significant causal relationship in either direction (p > 0.13), which, coupled with low and non-significant regression coefficients, points to a possible decoupling between economic and ecological dynamics under mature or spatially constrained urban development conditions. These findings confirm the spatial heterogeneity of ecological–economic linkages and highlight the uneven extent to which green systems are functionally embedded within local development trajectories.

4.3. Spatial Coupling of Environmental and Economic Inequality

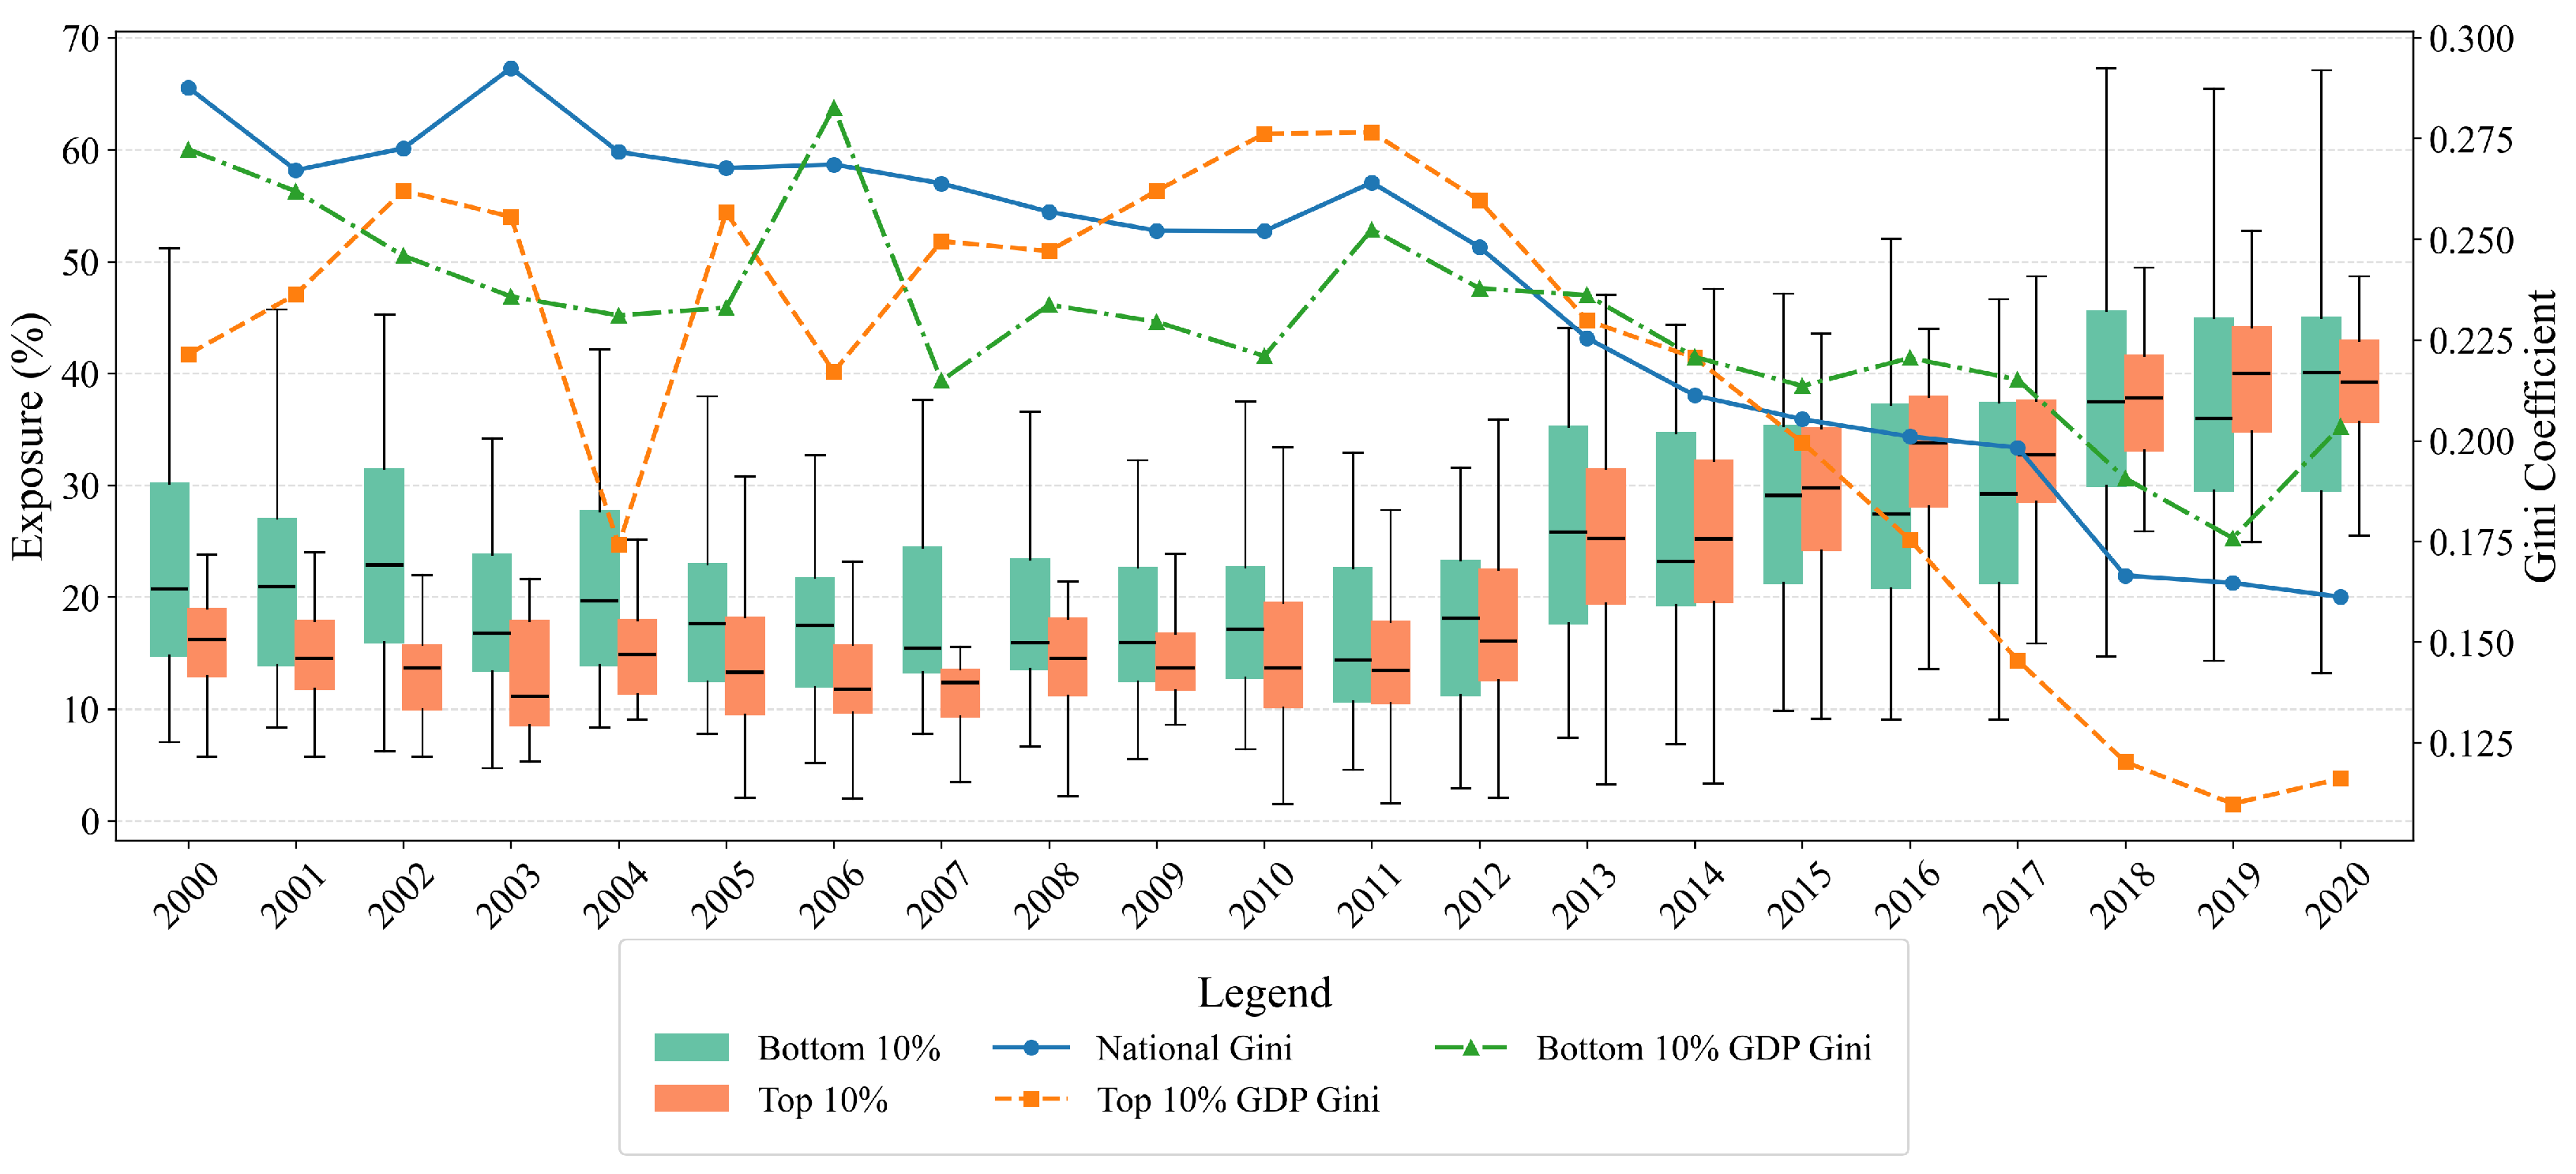
The evolution of green space exposure across economic strata in Chinese cities exhibited substantial shifts between 2000 and 2020 (Figure 5). During the early period (2000–2011), cities in the top decile of GDP per capita consistently showed lower levels of green exposure compared to those in the bottom decile. The median and upper quartile of green exposure in high-GDP cities remained below those observed in lower-GDP cities, while intra-group disparities were wider among the latter, as reflected by broader interquartile ranges and whiskers. From 2011 onwards, green exposure levels in wealthier cities increased significantly. By 2014, the median green exposure in high-GDP cities had surpassed that of lower-GDP cities, indicating a phase of accelerated ecological improvement among wealthier urban areas.
Spatial equity in green exposure also improved over the same period, as evidenced by the declining Gini coefficients. Nationally, the green exposure Gini dropped from 0.29 in 2000 to 0.16 in 2020, representing a 44% reduction. High-GDP cities experienced a larger decline in inequality, with their Gini falling from 0.22 to 0.12 (a 47.5% decrease), compared to a reduction from 0.27 to 0.20 (25.3%) among low-GDP cities. While a temporary rebound in the Gini index was observed among wealthier cities before 2010, the overall trend suggests sustained progress toward more equitable green space distribution across both high- and low-income cities. These trajectories collectively indicate a general narrowing of spatial disparities in green exposure over the two decades.
Changes in the Lorenz curves further illustrate the shifts in green space distribution (Figure 6). In 2000, regional Lorenz curves exhibited mixed concave and convex shapes, reflecting fragmented patterns of green distribution. By 2010, curves across most regions approached the equality line, suggesting enhanced intra-regional equity. However, by 2020, Lorenz curves became increasingly convex, particularly across the lower half of the population rank, indicating that low-GDP cities were receiving a disproportionately larger share of green resources relative to their population sizes. This pattern was particularly evident in regions such as Southwest and Central China. Additionally, the 2020 Lorenz curve for Northeast China displayed a bifurcated structure, with convexity among lower-GDP cities and concavity among higher-GDP cities. This indicates a differentiated distribution in which peripheral, less-developed cities benefitted disproportionately, whereas wealthier urban cores received relatively less green space per capita, underscoring persistent intra-regional disparities. These patterns collectively highlight a shift toward more favorable green space access among lower-income cities, but also demonstrate that economically stronger cores continue to face internal inequalities despite overall national improvements.

5. Discussion

5.1. Interpretations of Green Exposure Inequaltiy in China

This study systematically examined the spatial and socioeconomic evolution of urban green space exposure across 287 Chinese cities from 2000 to 2020, focusing on how patterns of green accessibility interacted with economic development and environmental equity. National-level trends revealed considerable gains in population-weighted exposure, particularly after 2011, reflecting the institutional impact of top-down ecological strategies, such as the Ecological Civilization framework and national urban greening policies [12,13,16]. However, these improvements were geographically uneven, with eastern cities consistently exhibiting higher levels of exposure than their western counterparts—a pattern shaped by variations in governance capacity, public investment, and planning implementation [19]. These spatiotemporal disparities which often aligned with national policy inflection points underscore the importance of institutional responsiveness in shaping green equity outcomes. Consistent with prior exposure-based studies in China and internationally, we observe a national decline in exposure inequality alongside persistent interregional disparities; however, our two-decade, multi-city perspective enables a more granular diagnosis of where and why these disparities persist [27,35].
Exposure gains were not strictly aligned with economic strength. In the early 2000s, rapid expansion in high-GDP cities often led to peripheral green space loss, constraining population-level green access despite aggregate growth. In contrast, lower-GDP cities, subject to less developmental pressure, retained larger green stock, although their exposure benefits were contingent upon local governance and land use choices. This dynamic contributed to a post-2010 “green tilt,” whereby some lower-income cities achieved disproportionate exposure gains, partly enabled by redistributive environmental instruments such as ecological compensation and targeted restoration programs [36,37]. The scope of this redistribution varied: western and inland provinces with targeted green investment (e.g., “Greening the West”) often achieved more measurable equity improvements than economically similar regions without such support [38].
Nonetheless, persistent intra-urban inequalities in wealthier cities reveal deep structural limitations in current greening approaches. Urban morphology, characterized by high density, leapfrog development, and land use fragmentation, significantly influenced exposure outcomes [39,40]. Even where green space expanded overall, access remained concentrated in affluent or newly developed districts, leaving socioeconomically disadvantaged neighborhoods underserved [41,42]. In cities marked by high land values and privatized development patterns, green infrastructure was often sited in gated communities or peri-urban zones, compromising its public welfare function and weakening the distributive effectiveness of green investment [43]. Similar challenges have been documented in other rapidly urbanizing contexts such as Latin America and South Asia, where green expansion often coincides with socio-spatial segregation [44,45]. This suggests that exposure inequality is not unique to China but reflects a broader structural tension between urban growth, land markets, and environmental justice. These patterns exhibit urban greening strategies centered on quantity may fall short in advancing environmental justice without exposure-sensitive planning frameworks. Moreover, limited administrative capacity and fiscal constraints in many cities restricted their ability to implement central ecological directives effectively, reinforcing a mismatch between national goals and local delivery. These findings reaffirm that the green economy’s benefits are highly context-dependent, shaped by spatial, institutional, and socio-political contingencies rather than guaranteed by investment alone. This insight highlights the importance of incorporating governance and fiscal capacity into comparative assessments of urban greening outcomes, as institutional asymmetries may explain why cities with similar economic levels display divergent exposure trajectories [46]. This reinforces the need for differentiated policy instruments—such as performance-linked fiscal transfers and technical assistance for green equity planning—that address disparities in capacity and institutional readiness.

5.2. Limitations

Several limitations of this study should also be acknowledged. First, a single uniform threshold cannot fully capture vegetation heterogeneity across diverse ecological zones and may introduce uncertainty into greenspace extraction, although we conducted a sensitivity analysis using multiple NDVI thresholds. Second, exposure was measured within a 500 m buffer, an empirical proxy that does not reflect variations in mobility, park quality, or cultural preferences. Third, population data were derived from WorldPop, which, despite being widely used, may introduce uncertainties at fine spatial scales. Finally, the analysis relied primarily on GDP per capita as a proxy for economic development, without explicitly accounting for institutional or social variables such as fiscal autonomy, planning capacity, or public health infrastructure. In addition, the study emphasizes spatial associations rather than explicit causal mechanism identification; while we document temporal coupling and statistical relationships, establishing causal pathways was beyond our design, and future work should employ quasi-experimental strategies or mechanism-focused models that incorporate institutional indicators. These limitations point to directions where further research is needed.

5.3. Policy Implications and Future Work

To foster truly sustainable and socially inclusive urban environments, future planning must move beyond aggregate green area targets to incorporate explicit exposure-based metrics and justice-oriented governance models. Urban policies should adopt locally adapted strategies that tackle both inter-city and intra-city disparities—from expanding access in fast-growing or spatially fragmented cities to embedding public green space into marginalized communities in affluent regions. Building administrative and fiscal support for lower-income municipalities is equally critical to prevent green development from deepening existing inequalities. Future studies should also link greenspace exposure to other wellbeing outcomes, such as health benefits, social cohesion, and climate resilience, to better capture the multidimensional value of equitable greening [47,48]. Moreover, comparative research across countries could help assess whether the Chinese experience is generalizable to other fast-urbanizing regions and inform the design of globally relevant green equity indicators [49]. Finally, mainstreaming green equity goals into zoning, transportation, and housing policy will be essential to anchor green accessibility within the urban fabric. Moving beyond symbolic greening, this equity-centered approach can amplify the ecological, health, and social benefits of urban green space—thereby aligning with the SDGs’ call for inclusive, resilient, and sustainable cities.

6. Conclusions

This study assessed how urban green space exposure evolved in relation to economic development and spatial inequality across 287 Chinese cities from 2000 to 2020. Green coverage and population-weighted exposure increased by 41% and 135%, yet the distribution of these gains remained uneven, with eastern cities persistently ahead of western and inland regions. National exposure inequality declined by 44% in Gini terms, but marked regional and intra-urban disparities persisted, including fragmented distributions in Northeast China. At the national scale, exposure and economic development were bidirectionally related; a one-percent increase in GDP corresponded to a 0.39-percent rise in exposure, and the reverse association was also present. The coupling varied across regions: eastern, central, and northeastern cities showed reciprocal relationships; southwestern and northwestern cities exhibited primarily GDP-to-exposure effects; South China showed exposure-to-GDP effects; and North China showed no significant association. After 2011, higher-income cities accelerated exposure gains and achieved sharper reductions in inequality, contributing to divergent equity trajectories. These results indicate that area-based greening targets alone are insufficient. Advancing green equity requires exposure-oriented indicators in planning, stronger governance capacity in under-resourced regions, and priority to underserved communities. Embedding equity goals into spatial planning, transport, and housing can ensure that gains in greenery translate into broad, durable benefits for environmental performance, environmental justice, and inclusive urban wellbeing.

Supplementary Materials

The following supporting information can be downloaded at: https://www.mdpi.com/article/10.3390/su17209345/s1, Section S1: Cross-validation against an external greenspace–exposure dataset; Section S2: NDVI threshold Sensitivity analysis; Section S3: Regional divisions of Chinese cities used in this study; Section S4: Econometric Test; Section S5: Policy Inflection Points Associated with Accelerated Ecological Improvement in China (2000–2020).

Author Contributions

Conceptualization, M.L.; methodology, R.L.; software, R.L.; validation, R.L.; formal analysis, R.L.; investigation, R.L.; data curation, R.L., G.Z.; writing—original draft preparation, R.L. and M.L.; writing—review and editing, M.L., G.Z., D.Z., X.L. and P.Z.; visualization, R.L.; supervision, M.L.; project administration, M.L.; funding acquisition, D.Z., M.L. and G.Z. All authors have read and agreed to the published version of the manuscript.

Funding

This research was funded by the National Natural Science Foundation of China under grant number 42301092, the Fundamental Research Funds for the Central Universities under project numbers 300102354201 and 2452025020, and the Youth Talent Lift Program of the Shaanxi Association for Science and Technology under project number 20220708.

Data Availability Statement

The raw data supporting the conclusions of this article will be made available by the authors, upon reasonable request.

Acknowledgments

We also acknowledge the Google Earth Engine and NASA Landsat programs for providing the open-access data that made this analysis possible.

Conflicts of Interest

The authors declare no conflicts of interest.

References

  1. Argüeso, D.; Evans, J.P.; Pitman, A.J.; Di Luca, A. Effects of city expansion on heat stress under climate change conditions. PLoS ONE 2015, 10, e0117066. [Google Scholar] [CrossRef]
  2. Marlier, M.E.; Jina, A.S.; Kinney, P.L.; DeFries, R.S. Extreme air pollution in global megacities. Curr. Clim. Change Rep. 2016, 2, 15–27. [Google Scholar] [CrossRef]
  3. Li, G.; Fang, C.; Li, Y.; Wang, Z.; Sun, S.; He, S.; Qi, W.; Bao, C.; Ma, H.; Fan, Y.; et al. Global impacts of future urban expansion on terrestrial vertebrate diversity. Nat. Commun. 2022, 13, 1628. [Google Scholar] [CrossRef] [PubMed]
  4. Bu, F.; Mahmoud, H.A.; Alzoubi, H.M.; Ramazanovna, N.K.; Gao, Y. Do financial inclusion, natural resources and urbanization affect the sustainable environment in emerging economies. Resour. Policy 2023, 87, 104292. [Google Scholar] [CrossRef]
  5. Chen, W.; Wang, G.; Zeng, J. Impact of urbanization on ecosystem health in Chinese urban agglomerations. Environ. Impact Assess. Rev. 2023, 98, 106964. [Google Scholar] [CrossRef]
  6. Herath, P.; Bai, X. Benefits and co-benefits of urban green infrastructure for sustainable cities: Six current and emerging themes. Sustain. Sci. 2024, 19, 1039–1063. [Google Scholar] [CrossRef]
  7. Lin, B.B.; Egerer, M.H. Global social and environmental change drives the management and delivery of ecosystem services from urban gardens: A case study from Central Coast, California. Glob. Environ. Change 2020, 60, 102006. [Google Scholar] [CrossRef]
  8. Paudel, S.; States, S.L. Urban green spaces and sustainability: Exploring the ecosystem services and disservices of grassy lawns versus floral meadows. Urban For. Urban Green. 2023, 84, 127932. [Google Scholar] [CrossRef]
  9. Yang, X.; Duan, C.; Chen, B.; Wang, H. socio-economic value of urban green spaces in mitigating waterlogging and enhancing well-being. Resour. Conserv. Recycl. 2025, 212, 108010. [Google Scholar] [CrossRef]
  10. Lorenzo-Sáez, E.; Lerma-Arce, V.; Coll-Aliaga, E.; Oliver-Villanueva, J.V. Contribution of green urban areas to the achievement of SDGs. Case study in Valencia (Spain). Ecol. Indic. 2021, 131, 108246. [Google Scholar] [CrossRef]
  11. Xiong, J.; Yue, W.; Xia, H.; Wang, T.; Liu, Y.; Pijanowski, B.C. Will China’s territorial spatial planning policies enhance land use sustainability? An integrated assessment under global environmental change. Resour. Environ. Sustain. 2025, 21, 100228. [Google Scholar] [CrossRef]
  12. Guo, Y.; Yang, L.; Wang, L.; Li, H.; Ge, Q. Assessment of ecological civilization construction from the perspective of environment and health in China. Eco-Environ. Health 2024, 3, 281–289. [Google Scholar] [CrossRef]
  13. Ji, J.S.; Tao, Z.; Miao, H.; Cole-Hunter, T.; Li, X.; Rojas-Rueda, D.; Cai, W. Greenness and averted mortality in 390 cities in China (2000–2020). Lancet Reg. Health–West. Pac. 2025, 54, 101283. [Google Scholar] [CrossRef] [PubMed]
  14. Wang, C.; Liu, Y.; Chen, J.; Yu, C. Turning points of the relationship between human activity and environmental quality in China. Sustain. Cities Soc. 2025, 119, 106123. [Google Scholar] [CrossRef]
  15. Xu, Z.; Zhang, Z.; Li, C. Exploring urban green spaces in China: Spatial patterns, driving factors and policy implications. Land Use Policy 2019, 89, 104249. [Google Scholar] [CrossRef]
  16. Zhou, Q.; van den Bosch, C.C.K.; Chen, Z.; Wang, X.; Zhu, L.; Chen, J.; Lin, Y.; Dong, J. China’s Green space system planning: Development, experiences, and characteristics. Urban For. Urban Green. 2021, 60, 127017. [Google Scholar] [CrossRef]
  17. Chen, Y.; La Rosa, D.; Yue, W. Does urban sprawl lessen green space exposure? Evidence from Chinese cities. Landsc. Urban Plan. 2025, 257, 105319. [Google Scholar] [CrossRef]
  18. Huang, Y.; Lin, T.; Zhang, G.; Jones, L.; Xue, X.; Ye, H.; Liu, Y. Spatiotemporal patterns and inequity of urban green space accessibility and its relationship with urban spatial expansion in China during rapid urbanization period. Sci. Total Environ. 2022, 809, 151123. [Google Scholar] [CrossRef]
  19. Chen, B.; Tu, Y.; Wu, S.; Song, Y.; Jin, Y.; Webster, C.; Xu, B.; Gong, P. Beyond green environments: Multi-scale difference in human exposure to greenspace in China. Environ. Int. 2022, 166, 107348. [Google Scholar] [CrossRef]
  20. Boulton, C.; Dedekorkut-Howes, A.; Byrne, J. Factors shaping urban greenspace provision: A systematic review of the literature. Landsc. Urban Plan. 2018, 178, 82–101. [Google Scholar] [CrossRef]
  21. Rambhia, M.; Volk, R.; Rismanchi, B.; Winter, S.; Schultmann, F. Prioritizing urban green spaces in resource constrained scenarios. Resour. Environ. Sustain. 2024, 16, 100150. [Google Scholar] [CrossRef]
  22. Ai, H.; Zhou, Z. Inhibit or promote: The inverse-U-shape effect of greenspace on economic growth. Environ. Impact Assess. Rev. 2023, 100, 107094. [Google Scholar] [CrossRef]
  23. Wu, L.; Kim, S.K. Does socioeconomic development lead to more equal distribution of green space? Evidence from Chinese cities. Sci. Total Environ. 2021, 757, 143780. [Google Scholar] [CrossRef]
  24. Bockarjova, M.; Botzen, W.J.W.; Van Schie, M.H.; Koetse, M.J. Property price effects of green interventions in cities: A meta-analysis and implications for gentrification. Environ. Sci. Policy 2020, 112, 293–304. [Google Scholar] [CrossRef]
  25. Jiang, X.; Fu, W.; Li, G. Can the improvement of living environment stimulate urban innovation?—Analysis of high-quality innovative talents and foreign direct investment spillover effect mechanism. J. Clean. Prod. 2020, 255, 120212. [Google Scholar] [CrossRef]
  26. Heo, S.; Nori-Sarma, A.; Kim, S.; Lee, J.T.; Bell, M.L. Do persons with low socioeconomic status have less access to greenspace? Application of accessibility index to urban parks in Seoul, South Korea. Environ. Res. Lett. 2021, 16, 084027. [Google Scholar] [CrossRef]
  27. Wu, S.; Chen, B.; Webster, C.; Xu, B.; Gong, P. Improved human greenspace exposure equality during 21st century urbanization. Nat. Commun. 2023, 14, 6460. [Google Scholar] [CrossRef] [PubMed]
  28. Chen, J.; Kinoshita, T.; Li, H.; Luo, S.; Su, D. Which green is more equitable? A study of urban green space equity based on morphological spatial patterns. Urban For. Urban Green. 2024, 91, 128178. [Google Scholar] [CrossRef]
  29. Chen, B.; Wu, S.; Song, Y.; Webster, C.; Xu, B.; Gong, P. Contrasting inequality in human exposure to greenspace between cities of Global North and Global South. Nat. Commun. 2022, 13, 4636. [Google Scholar] [CrossRef] [PubMed]
  30. Li, X.; Gong, P.; Zhou, Y.; Wang, J.; Bai, Y.; Chen, B.; Hu, T.; Xiao, Y.; Xu, B.; Yang, J.; et al. Mapping global urban boundaries from the global artificial impervious area (GAIA) data. Environ. Res. Lett. 2020, 15, 094044. [Google Scholar] [CrossRef]
  31. Gong, P.; Li, X.; Wang, J.; Bai, Y.; Chen, B.; Hu, T.; Liu, X.; Xu, B.; Yang, J.; Zhang, W.; et al. Annual maps of global artificial impervious area (GAIA) between 1985 and 2018. Remote Sens. Environ. 2020, 236, 111510. [Google Scholar] [CrossRef]
  32. Stevens, F.R.; Gaughan, A.E.; Linard, C.; Tatem, A.J. Disaggregating census data for population mapping using random forests with remotely-sensed and ancillary data. PLoS ONE 2015, 10, e0107042. [Google Scholar] [CrossRef] [PubMed]
  33. Bille, R.A.; Jensen, K.E.; Buitenwerf, R. Global patterns in urban green space are strongly linked to human development and population density. Urban For. Urban Green. 2023, 86, 127980. [Google Scholar] [CrossRef]
  34. Wang, X.; Xiao, J.; Li, X.; Cheng, G.; Ma, M.; Zhu, G.; Arain, M.A.; Black, T.A.; Jassal, R.S. No trends in spring and autumn phenology during the global warming hiatus. Nat. Commun. 2019, 10, 2389. [Google Scholar] [CrossRef] [PubMed]
  35. Zhang, X.; Chen, J.; Wang, H.; Yang, D. From policy synergy to equitable greenspace: Unveiling the multifaceted effects of regional cooperation upon urban greenspace exposure inequality in China’s megacity-regions. Appl. Geogr. 2025, 174, 103472. [Google Scholar] [CrossRef]
  36. Gu, Y.; Wu, Y.; Liu, J.; Xu, M.; Zuo, T. Ecological civilization and government administrative system reform in China. Resour. Conserv. Recycl. 2020, 155, 104654. [Google Scholar] [CrossRef]
  37. Yu, Z.; Ma, W.; Hu, S.; Yao, X.; Yang, G.; Yu, Z.; Jiang, B. A simple but actionable metric for assessing inequity in resident greenspace exposure. Ecol. Indic. 2023, 153, 110423. [Google Scholar] [CrossRef]
  38. Yan, F.; Pang, J.; Liu, Y.; An, X.; Wang, X.; Liu, X.; Shen, L.; Chen, Y. Quantification and sensitivity assessment of Chinese provincial ecological compensation in the perspective of carbon deficit redistribution. Sci. Rep. 2024, 14, 22547. [Google Scholar] [CrossRef]
  39. Pradhan, K.; Rajabifard, A.; Aryal, J.; Crompvoets, J. Dissecting multidimensional morphology of urban sprawl: Framework for policy intervention. Cities 2025, 157, 105627. [Google Scholar] [CrossRef]
  40. Wang, B.; Wang, Y.; Wu, X. Impact of land use compactness on the habitat services from green infrastructure in Wuhan, China. Urban For. Urban Green. 2023, 84, 127927. [Google Scholar] [CrossRef]
  41. Haaland, C.; van Den Bosch, C.K. Challenges and strategies for urban green-space planning in cities undergoing densification: A review. Urban For. Urban Green. 2015, 14, 760–771. [Google Scholar] [CrossRef]
  42. Lin, B.; Meyers, J.; Barnett, G. Understanding the potential loss and inequities of green space distribution with urban densification. Urban For. Urban Green. 2015, 14, 952–958. [Google Scholar] [CrossRef]
  43. Fan, P.; Xu, L.; Yue, W.; Chen, J. Accessibility of public urban green space in an urban periphery: The case of Shanghai. Landsc. Urban Plan. 2017, 165, 177–192. [Google Scholar] [CrossRef]
  44. Bakhtsiyarava, M.; Moran, M.; Ju, Y.; Zhou, Y.; Rodriguez, D.A.; Dronova, I.; de Pina, M.d.F.R.P.; de Matos, V.P.; Skaba, D.A. Potential drivers of urban green space availability in Latin American cities. Nat. Cities 2024, 1, 842–852. [Google Scholar] [CrossRef]
  45. Hamza, M.; Edwards, R.C.; Beaumont, J.D.; De Pretto, L.; Torn, A. Access to natural green spaces and their associations with psychological wellbeing for South Asian people in the UK: A systematic literature review. Soc. Sci. Med. 2024, 359, 117265. [Google Scholar] [CrossRef]
  46. Wang, H.; Li, W.; Xiao, H.; Wang, D. Horizontal ecological compensation and urban inclusive green growth: Evidence from China. Front. Public Health 2024, 12, 1415309. [Google Scholar] [CrossRef] [PubMed]
  47. Twohig-Bennett, C.; Jones, A. The health benefits of the great outdoors: A systematic review and meta-analysis of greenspace exposure and health outcomes. Environ. Res. 2018, 166, 628–637. [Google Scholar] [CrossRef] [PubMed]
  48. Li, Y.; Svenning, J.-C.; Zhou, W.; Zhu, K.; Abrams, J.F.; Lenton, T.M.; Ripple, W.J.; Yu, Z.; Teng, S.N.; Dunn, R.R.; et al. Green spaces provide substantial but unequal urban cooling globally. Nat. Commun. 2024, 15, 7108. [Google Scholar] [CrossRef]
  49. Przewoźna, P.; Inglot, A.; Mielewczyk, M.; Mączka, K.; Matczak, P. Accessibility to urban green spaces: A critical review of WHO recommendations in the light of tree-covered areas assessment. Ecol. Indic. 2024, 166, 112548. [Google Scholar] [CrossRef]
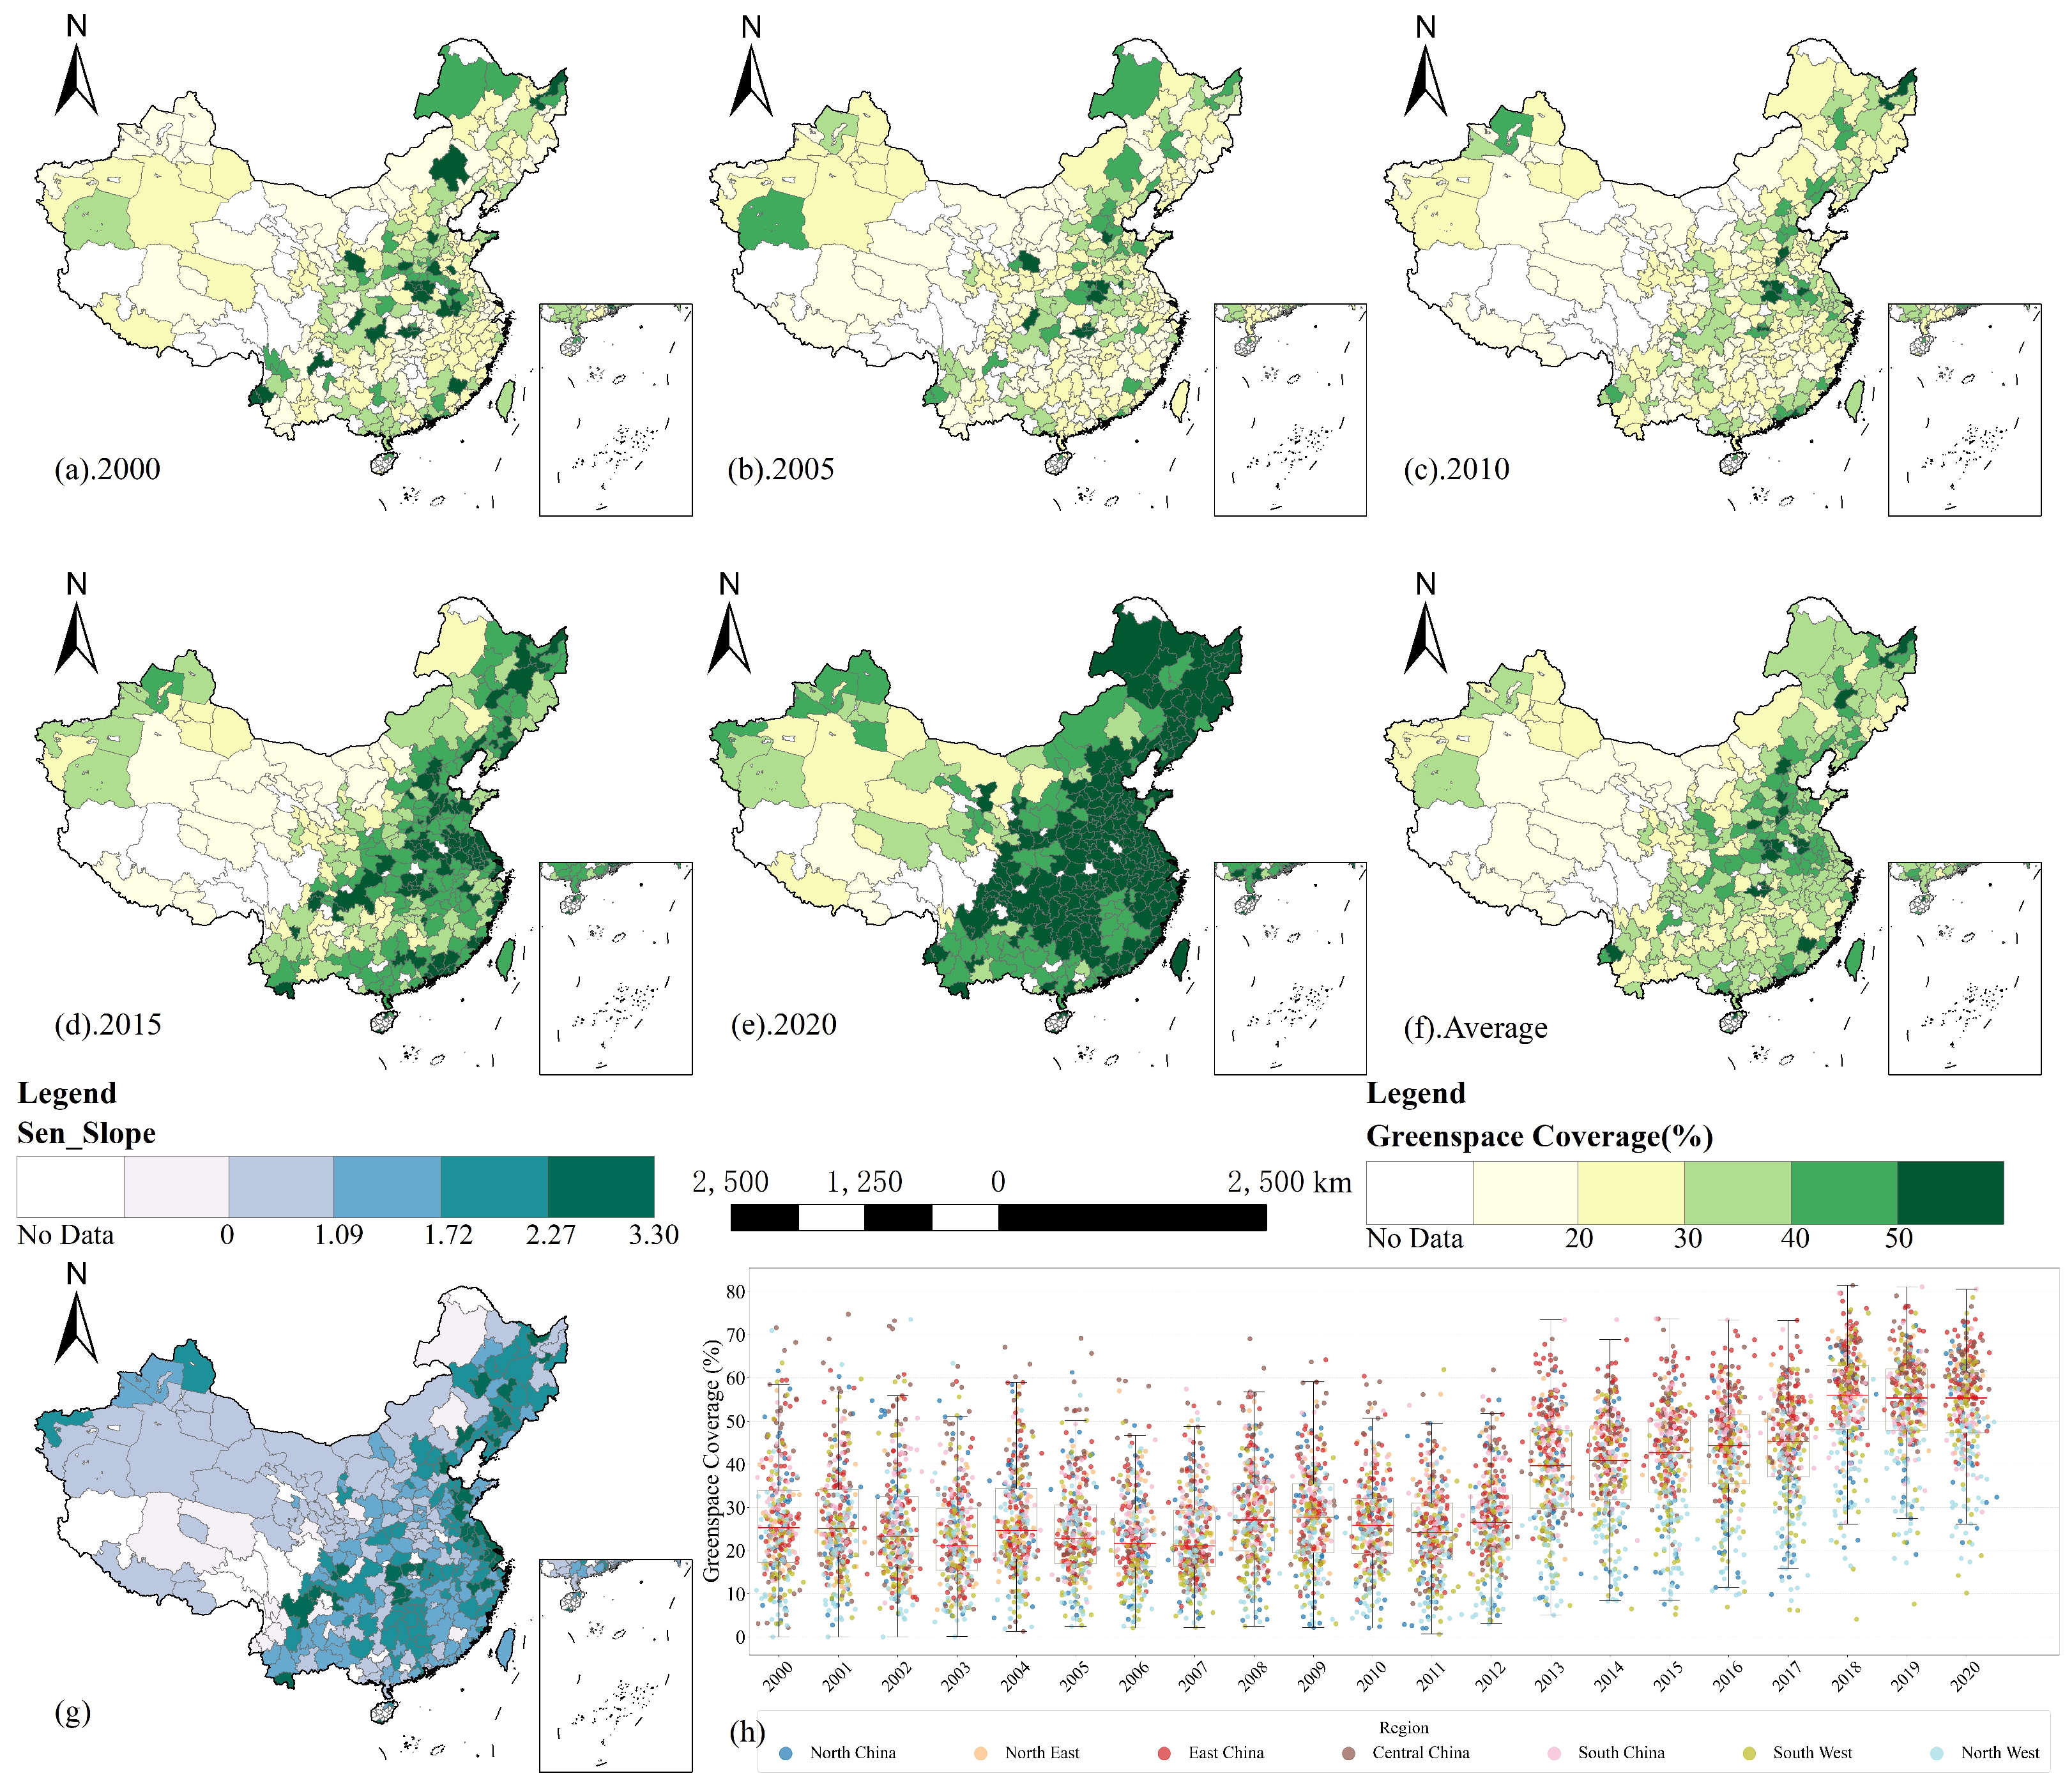
Figure 1. Spatial and temporal dynamics of urban green-space coverage in 326 major Chinese cities (2000–2020). Panels (ae) map city-level green-space coverage in 2000, 2005, 2010, 2015, and 2020, respectively; (f) shows the 21-year average coverage; (g) displays Sen’s slope of annual change in coverage (percentage points per year); and (h) presents year-by-year scatterplots of coverage trends for each region (with regional division showing in Supplemental Information Figure S1). Darker colors indicate higher levels of population-weighted green-space exposure.
Sustainability 17 09345 g001
Figure 2. Spatial and temporal dynamics of urban green-space exposure in 326 major Chinese cities (2000–2020). Panels (ae) map city-level green-space exposure (%) in 2000, 2005, 2010, 2015, and 2020, respectively; (f) shows the 21-year average exposure; (g) displays Sen’s slope of annual change in exposure (percentage points per year); and (h) presents year-by-year scatterplots of exposure trends for each region. Darker colors indicate higher levels of population-weighted green-space exposure.
Sustainability 17 09345 g002
Figure 3. Urban expansion and green space evolution in Xi’an, 2000–2020.
Sustainability 17 09345 g003
Figure 4. Divergent Dynamics of Green Coverage and Exposure in Hotan and Northeast China (2000–2020). (a) Spatial distribution of Sen’s slope for annual green-coverage changes across China, highlighting Region I (Northeast China). (b) Spatial distribution of Sen’s slope for annual green-exposure change, highlighting Region II (Hotan). (c) Temporal profiles of green-space metrics from 2000 to 2020: boxplots show annual distributions of green coverage (mint) and exposure (peach) in Northeast China (Region I), with overlaid lines showing Sen’s trends for coverage (solid blue) and exposure (dashed red) in Hotan (Region II).
Sustainability 17 09345 g004
Figure 5. Temporal trends of greenspace exposure (boxplots for bottom 10% and top 10% GDP cities) and inequality (national and group-specific Gini coefficients) in Chinese cities, 2000–2020.
Sustainability 17 09345 g005
Figure 6. Lorenz curves illustrating regional and national disparities in urban green space exposure in Chinese cities for 2000, 2010, and 2020.
Sustainability 17 09345 g006
Table 1. Granger Causality Test Results.
RegionNull HypothesisF-Statisticp-Value
ChinaΔ ln(AGDP) → Δ ln(UGR)25.0140.000 ***
Δ ln(UGR) → Δ ln(AGDP)19.1180.000 ***
East ChinaΔ ln(AGDP) → Δ ln(UGR)9.1670.000 ***
Δ ln(UGR) → Δ ln(AGDP)13.3130.000 ***
Central ChinaΔ ln(AGDP) → Δ ln(UGR)8.6330.000 ***
Δ ln(UGR) → Δ ln(AGDP)6.2620.000 ***
South WestΔ ln(AGDP) → Δ ln(UGR)2.0650.084 *
Δ ln(UGR) → Δ ln(AGDP)2.4480.045 **
South ChinaΔ ln(AGDP) → Δ ln(UGR)1.2480.289
Δ ln(UGR) → Δ ln(AGDP)2.9450.020 **
North ChinaΔ ln(AGDP) → Δ ln(UGR)1.6290.165
Δ ln(UGR)→Δ ln(AGDP)1.7770.132
North EastΔ ln(AGDP)→Δ ln(UGR)5.2060.000 ***
Δ ln(UGR)→Δ ln(AGDP)3.6470.006 ***
North WestΔ ln(AGDP)→Δ ln(UGR)2.7770.026 **
Δ ln(UGR)→Δ ln(AGDP)1.3310.257
Note: *, ** and *** indicate significance at 1%, 5% and 10% levels, respectively.
Table 2. Panel Data Regression Analysis Results.
RegionNull HypothesisCoefficient
ChinaΔ ln(AGDP) → Δ ln(UGR)0.31 ***
Δ ln(UGR) → Δ ln(AGDP)0.436 ***
East ChinaΔ ln(AGDP) → Δ ln(UGR)0.308 ***
Δ ln(UGR) → Δ ln(AGDP)0.576 ***
Central ChinaΔ ln(AGDP) → Δ ln(UGR)0.449 ***
Δ ln(UGR) → Δ ln(AGDP)0.473 ***
South WestΔ ln(AGDP) → Δ ln(UGR)0.324 ***
Δ ln(UGR) → Δ ln(AGDP)0.465 ***
South ChinaΔ ln(AGDP) → Δ ln(UGR)0.18 ***
Δ ln(UGR) → Δ ln(AGDP)0.377 ***
North ChinaΔ ln(AGDP) → Δ ln(UGR)0.195 ***
Δ ln(UGR) → Δ ln(AGDP)0.192 ***
North EastΔ ln(AGDP) → Δ ln(UGR)0.29 ***
Δ ln(UGR) → Δ ln(AGDP)0.309 ***
North WestΔ ln(AGDP) → Δ ln(UGR)0.323 ***
Δ ln(UGR) → Δ ln(AGDP)0.45 ***
Note: *** indicate significance at 10% levels, respectively.
Disclaimer/Publisher’s Note: The statements, opinions and data contained in all publications are solely those of the individual author(s) and contributor(s) and not of MDPI and/or the editor(s). MDPI and/or the editor(s) disclaim responsibility for any injury to people or property resulting from any ideas, methods, instructions or products referred to in the content.