1. Introduction
Against the backdrop of rapid global urbanization, urban public safety has become an increasingly core issue in urban planning, management, and governance. As population concentration and urban structural complexity rise, the frequent occurrence of safety incidents imposes higher demands on city systems. The United Nations’ 2030 Agenda for Sustainable Development lists “building safe, inclusive, and sustainable cities” as Sustainable Development Goal 11, underscoring the global strategic importance of urban safety [
1]. Urban safety is not only about protecting residents’ lives and property, but also directly affects social stability, economic vitality, and the capacity for sustainable development [
2]. In this context, constructing safe and livable cities is a key pathway to improving residents’ well-being [
3]. Urban safety constitutes not only a core component of urban governance but also a fundamental prerequisite for sustainable development. Within the framework of sustainability—which encompasses the social, economic, and environmental dimensions—safety serves as a cross-cutting element. Socially, secure environments strengthen community cohesion, enhance public trust, and promote inclusiveness. Economically, improved safety conditions stimulate investment, enhance residents’ productivity, and reduce social and financial losses associated with urban risks. Environmentally, safety-oriented planning measures such as optimized lighting, transport organization, and green open spaces contribute to healthier and more livable urban ecosystems. According to the United Nations Sustainable Development Goal 11 (“Make cities inclusive, safe, resilient, and sustainable”), safety is not only an outcome but also a foundation of sustainability. Therefore, understanding and mitigating urban safety hazards are vital steps toward achieving inclusive, resilient, and sustainable cities. Consequently, it has become an urgent topic in urban studies and public policy to understand the multidimensional factors influencing urban safety and to explore spatial intervention strategies that can enhance it [
4]. In this regard, explainable machine learning tools such as SHAP (SHapley Additive exPlanations) and two-dimensional Partial Dependence Plots (2D PDPs) provide new opportunities to uncover variable contributions, nonlinear interactions, and threshold effects, thereby supporting more transparent and evidence-based analyses of urban safety.
The built environment of cities not only shapes people’s daily behavioral patterns but also significantly affects the spatial distribution of safety hazards (including but not limited to crime-related incidents) and residents’ subjective sense of safety. Several classic theories in sociology and criminology provide a theoretical foundation for this understanding. For example, Routine Activity Theory posits that crime occurs when a motivated offender, a suitable target, and the absence of a capable guardian converge in time and space, with the built environment strongly influencing these three factors [
5]. Similarly, Crime Pattern Theory emphasizes that urban structures and people’s mobility patterns jointly determine the spatial concentration of potential criminal behaviors [
6]. Meanwhile, the Broken Windows Theory suggests that if a community shows signs of persistent disorder—such as graffiti, garbage accumulation, and building deterioration—it sends signals of neglect and lack of order, which may induce more serious crimes [
7]. Such disorder not only reduces residents’ sense of security but also weakens the community’s ability to deter crime. From the perspective of spatial design, Defensible Space Theory highlights that rational organization and design of space can enhance residents’ sense of control over their environment, thereby suppressing crime [
4]. This theory later evolved into the Crime Prevention Through Environmental Design (CPTED) strategy, which advocates enhancing lighting, improving visual permeability, strengthening natural surveillance, and creating a stronger sense of territoriality to deter potential unlawful behavior. While these theories were originally developed to explain crime, their spatial logic provides valuable insights for understanding broader urban safety hazards. In summary, the built environment is not only the physical carrier of urban functions but also an important determinant of urban safety, and its mechanisms and spatial differences warrant deeper exploration.
Crowdsourcing is a way of collecting data and identifying problems by engaging the public in specific tasks. With the development of geographic information technologies and the growing awareness of citizen participation, Volunteered Geographic Information (VGI) has become an important supplementary tool in urban research. Goodchild first proposed the concept of VGI and likened citizens to “human sensors,” emphasizing its unique role in reflecting urban spatial conditions in real time [
8]. Compared to traditional official statistics, crowdsourced data has advantages such as timeliness, high spatial resolution, and the ability to reflect subjective perceptions, providing sharper and broader perspectives for urban safety research. For example, Shelton analyzed geographic data from social media to reveal spatial inequalities among urban social groups, showing that VGI helps identify structural problems in cities [
9]. See compared the data quality contributed by experts and non-experts, finding that differences were limited in specific tasks, indicating the potential reliability of VGI under certain conditions [
10]. Later, See systematically reviewed research on VGI and citizen science, pointing out their wide applications in urban planning, environmental management, and disaster response [
11]. Haklay further proposed a classification model of VGI participation depth, from passive information receipt to active analytical engagement, highlighting how different forms of participation influence data quality and governance outcomes [
12]. Poland’s launch of the National Safety Threat Map (NSTM, Krajowa Mapa Zagrożeń Bezpieczeństwa) (
Table 1) in 2016 provides a paradigmatic case for the application of VGI in public safety. Overall, VGI enables broad social participation at a relatively low cost, compensating for the limitations of traditional crime statistics by providing broader coverage of both criminal and non-criminal safety hazards, and offers strong support for data-driven urban governance—especially in identifying safety hotspots and devising targeted interventions.
Current studies on the relationship between the built environment and urban safety have traditionally relied on official crime statistics or surveys. However, such data often fail to capture residents’ subjective perceptions of safety risks in daily life, making it difficult to reveal the true spatial patterns of urban safety hazards [
6,
13]. Moreover, some studies have found that official data may suffer from institutional bias, causing systemic overestimation of crime rates in certain areas and thereby undermining objectivity [
14]. In recent years, the rise in crowdsourced platforms and VGI has offered new possibilities to complement traditional data [
12], but systematic research on the coupling mechanisms between crowdsourced safety hazard data and built environment features remains scarce. Such gaps hinder the full exploration of their potential in urban safety assessment and spatial governance. Methodologically, traditional approaches often rely on linear or logistic regression, which can reveal correlations between certain variables and crime rates but struggle to handle high-dimensional multi-source data, complex variable interactions, and nonlinear relationships. They also lack interpretability in explaining how factors influence outcomes [
15]. Recently, machine learning methods have been introduced into urban safety hazard research due to their strong fitting capacity and pattern recognition advantages [
16]. Some studies have also employed crowdsourced data to capture residents’ perceptions of safety risks [
17]. However, most of these works remain at the level of macro-correlation analysis and lack quantitative modeling and in-depth interpretation of the relationship between micro-level built environment features and perceived safety hazards. In particular, the interpretability of models remains underdeveloped. Thus, there is a pressing need to introduce models that combine high predictive accuracy with strong interpretability, integrating crowdsourced safety data to systematically reveal the complex mechanisms linking built environment features with safety hazards. Using machine learning together with interpretability techniques such as SHAP can enable fine-grained and visualized analyses of the “built environment–safety hazard” relationship, thereby providing scientific support for precise spatial governance and policymaking.
Building on this background, this study focuses on Cracow, Poland, to explore the spatial mechanisms linking built environment features with residents’ reported safety hazards. We integrate multi-source data, including street-level built environment elements (such as POI functional diversity, green space coverage, lighting, transportation node density, and housing prices) and crowdsourced safety hazard reports from the NSTM platform, to construct a spatial database and conduct machine learning modeling. To improve model interpretability and usability, we further employ SHAP (Shapley Additive Explanations) to explain the model results, clarify the extent and direction of each variable’s influence on urban safety hazards, and enhance transparency and operational value.
The NSTM dataset used in this study covers a wider range of urban safety hazards than conventional crime data. Unlike traditional crime-based analyses, the present research expands the scope to encompass both criminal and non-criminal risks—such as traffic accidents, environmental threats, and other public safety concerns.
Expected innovations and contributions: This study is the first to conduct high-resolution spatial coupling analysis between crowdsourced safety hazard data (NSTM) and street-level built environment features, thereby improving data granularity and local sensitivity in urban safety research. By introducing the SHAP interpretability approach, the study enhances readability and transparency while retaining machine learning’s predictive performance, overcoming the “black-box” bottleneck in urban research applications. The results provide quantitative support for city managers to design more targeted spatial optimization strategies, particularly useful for data-driven urban safety hazard governance and place-based interventions. Through this work, we aim to provide empirical evidence for how built environments affect residents’ perceived safety hazards and to offer a transferable paradigm for integrating crowdsourced data and interpretable AI in urban studies.
3. Machine Learning Modeling and Interpretability Analysis of Built Environment and Safety Hazards
3.1. Safety Hazard Data in Cracow, Poland
The NSTM (National Safety Threat Map) platform, administered by the Polish National Police, allows citizens to anonymously mark safety hazards—such as traffic violations, noise disturbances, and suspicious behavior—thereby enabling real-time sensing and spatial representation of urban safety hazards. Residents are encouraged to proactively report a wide range of problems, including illegal parking, noise nuisances, and drug-related activities. The platform has become an important auxiliary tool for public security agencies to identify safety hazard hotspots and optimize police deployment [
68].
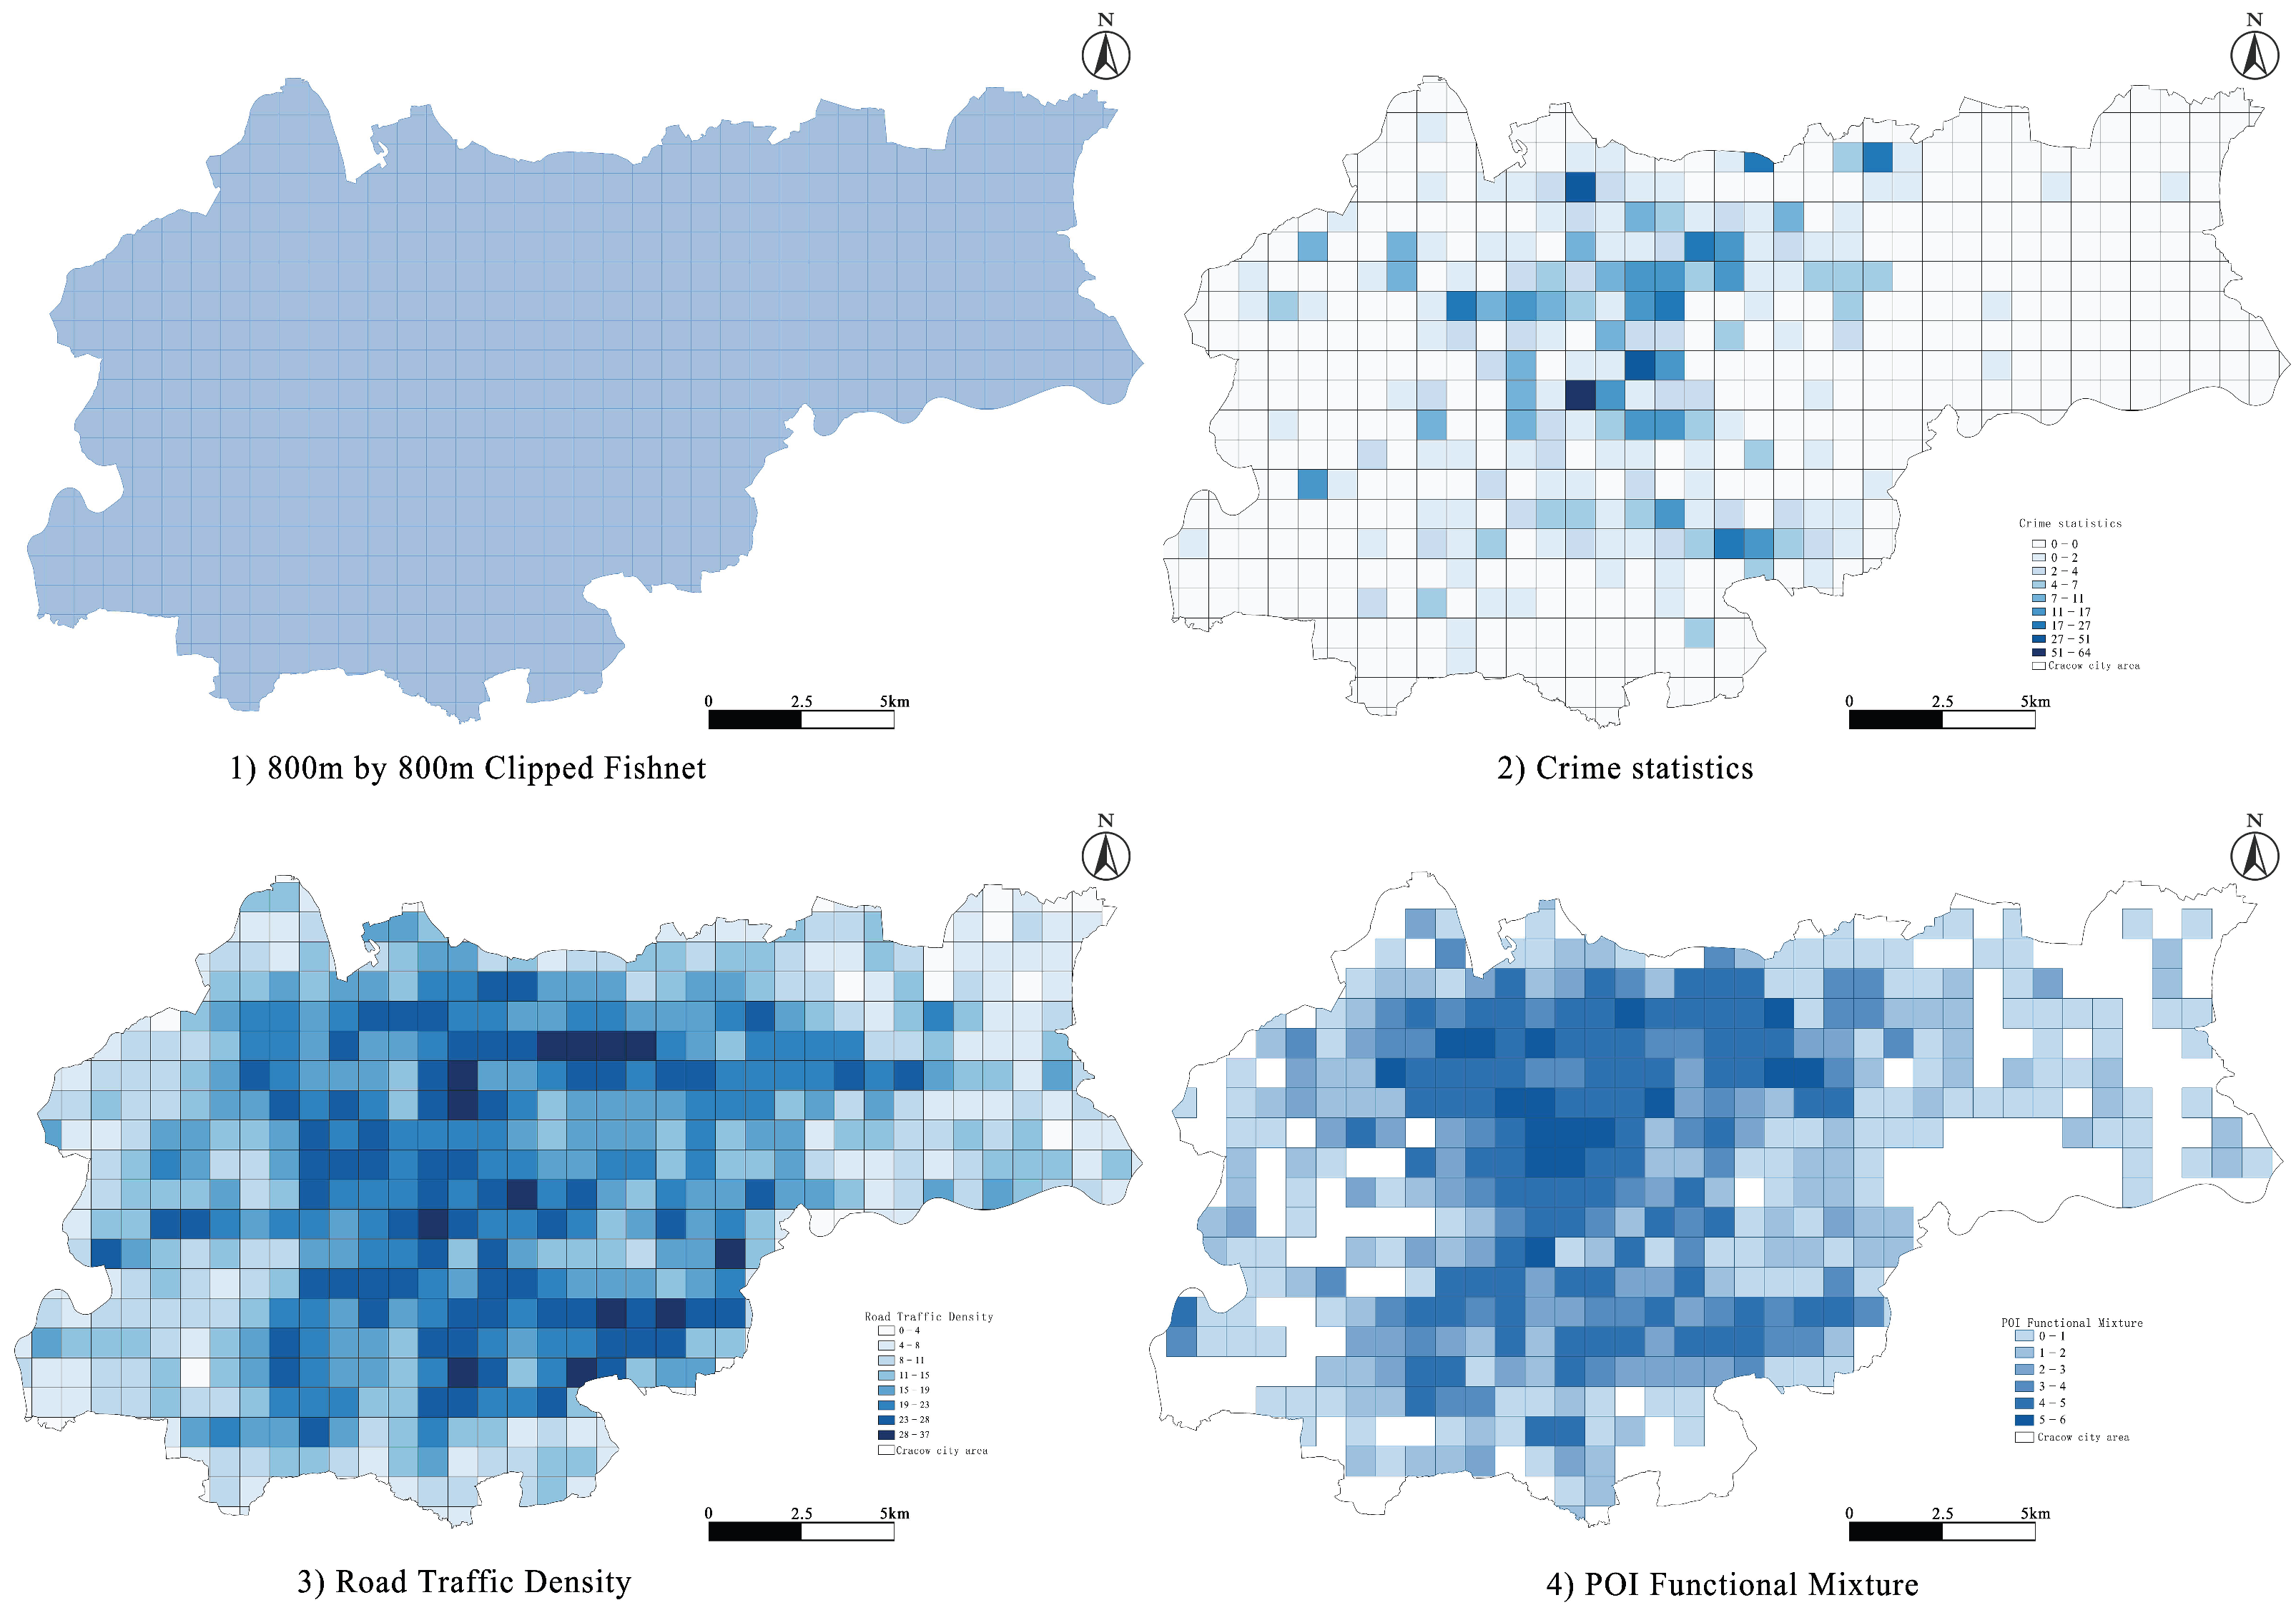
To quantify the impact of built-environment factors on urban safety hazards and to identify the key spatial elements influencing residents’ propensity to report hazards, this study builds a machine-learning model using built-environment data for Cracow together with hazard locations reported via NSTM. During data preprocessing, the study area was partitioned into 800 m × 800 m fishnet grids as the spatial analysis unit (
Figure 1). Thirteen built-environment indicators were overlaid onto each grid cell, and the number of NSTM reports within each cell was counted as the response variable to construct the dataset. The dataset was randomly split into a training set (80%) and a test set (20%) to ensure objectivity and generalizability in model performance evaluation.
3.2. Model Performance Comparison
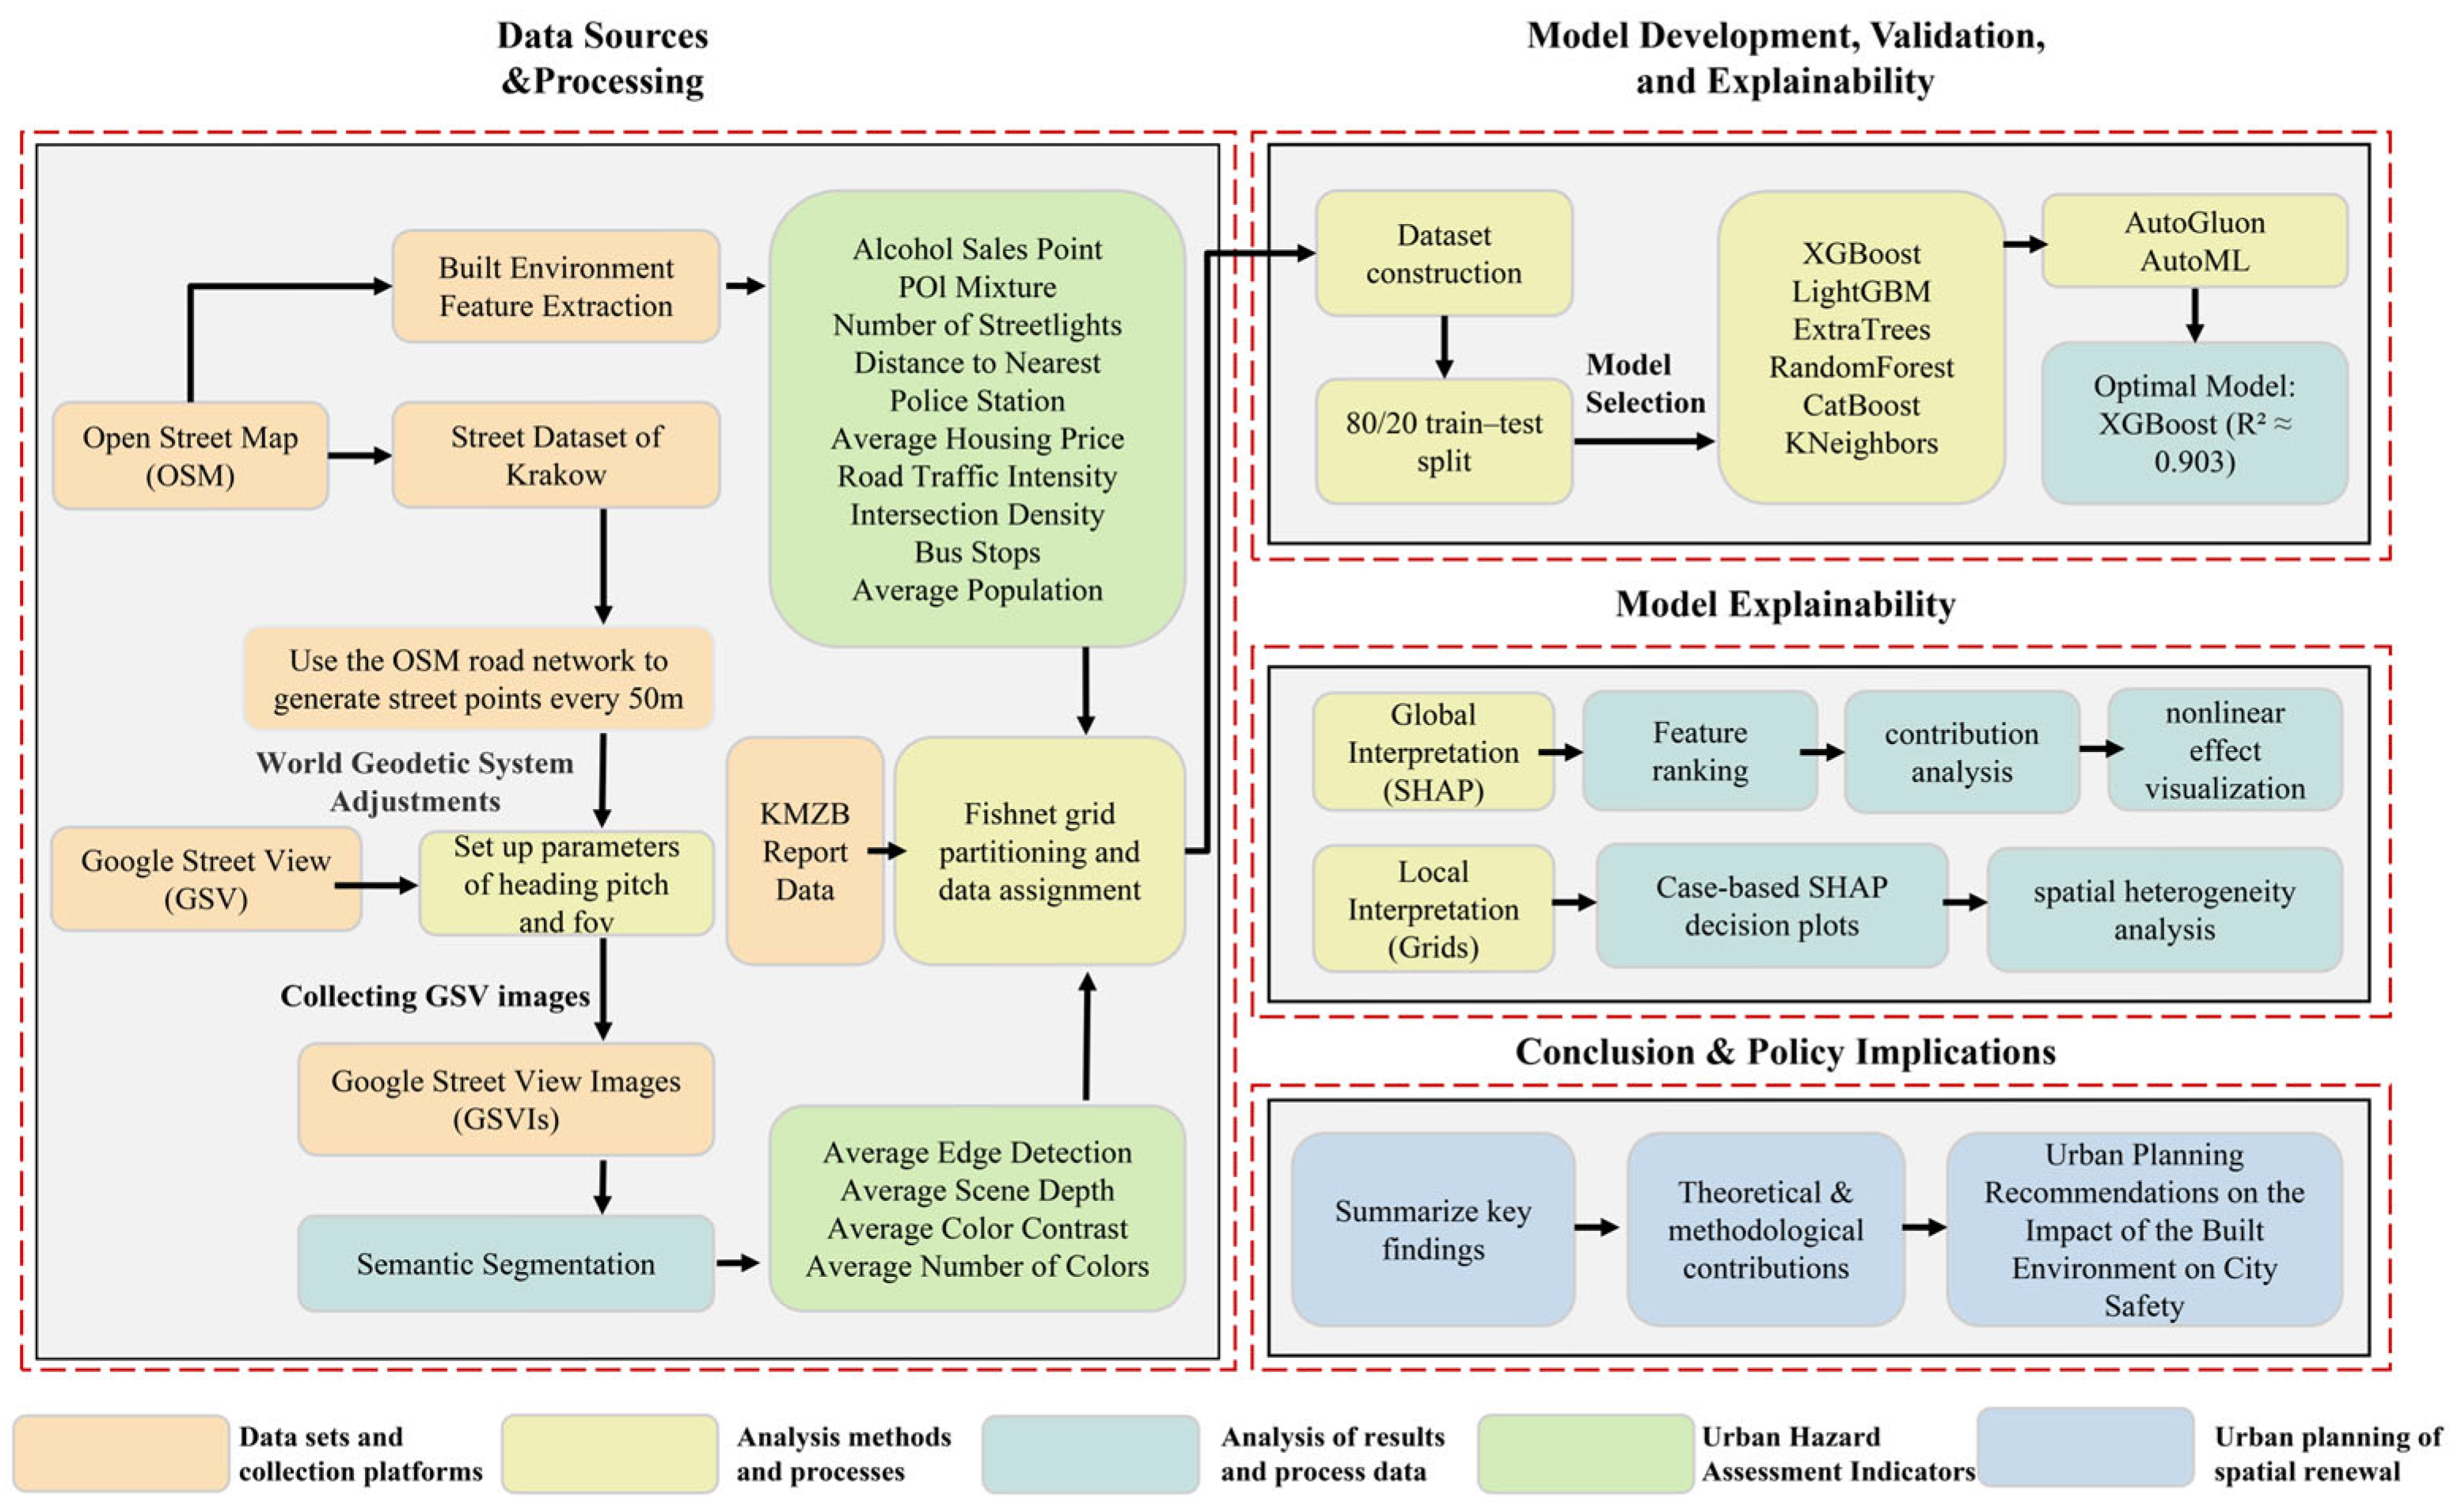
In the study of the built environment and urban safety hazards, constructing predictive models that are both stable in performance and interpretable is the foundation for analyzing underlying variable mechanisms (
Figure 2). However, traditional machine learning methods often rely on manually completing multiple steps, such as feature preprocessing, model selection, and hyperparameter optimization. This approach is not only labor-intensive but also limited in tuning efficiency and modeling accuracy when faced with heterogeneous multi-source data and complex variable structures. Particularly during model integration and cross-validation, each algorithm must be evaluated and compared individually, which greatly increases experimental time and computational cost.
To improve overall modeling efficiency and ensure the robustness and generalizability of the results, this study introduced AutoGluon (version 1.4.0, developed by Amazon Web Services, Washington, DC, USA), an automated machine learning (AutoML) framework. With its end-to-end training pipeline, AutoGluon automates processes ranging from data cleaning and feature engineering to parallel multi-model training and ensemble fusion. Within a specified time budget, the framework is able to automatically tune a variety of algorithms—including XGBoost, LightGBM, CatBoost, Random Forest, linear models, K-Nearest Neighbors (KNN), and neural networks—while further improving model performance through bagging and ensemble architectures. This strategy not only substantially reduces reliance on manual tuning experience but also provides a high-quality modeling foundation for subsequent feature-importance-based interpretability analysis, thereby ensuring both scientific rigor and practical value of the research findings.
In this study, AutoGluon was employed for multi-model comparison and hyperparameter tuning. During model integration and cross-validation, a training time budget of 7200 s (2 h) was allocated, with five-fold cross-validation enabled. Six baseline models were preliminarily evaluated: XGBoost, LightGBM, ExtraTrees, Random Forest, CatBoost, and KNeighbors. At the early stage of modeling, AutoGluon automatically executed preprocessing for both numerical and categorical features, including missing-value imputation, numerical normalization, and categorical encoding transformations. Throughout multiple rounds of cross-validation, the system efficiently searched and optimized the key hyperparameters of candidate models. Model performance was uniformly evaluated using the coefficient of determination (R
2), with results recorded for each validation round. Ultimately, AutoGluon generated a performance leaderboard (see
Table 2), showing the average R
2 scores and corresponding training times of each algorithm on the validation set, thereby providing an intuitive comparison of model accuracy and efficiency.
According to the integrated evaluation results, the model with the best validation performance (i.e., the highest average R2 value) was selected as the candidate scheme and entered the next stage of fine-tuned training and parameter adjustment, aimed at further improving stability and generalization ability.
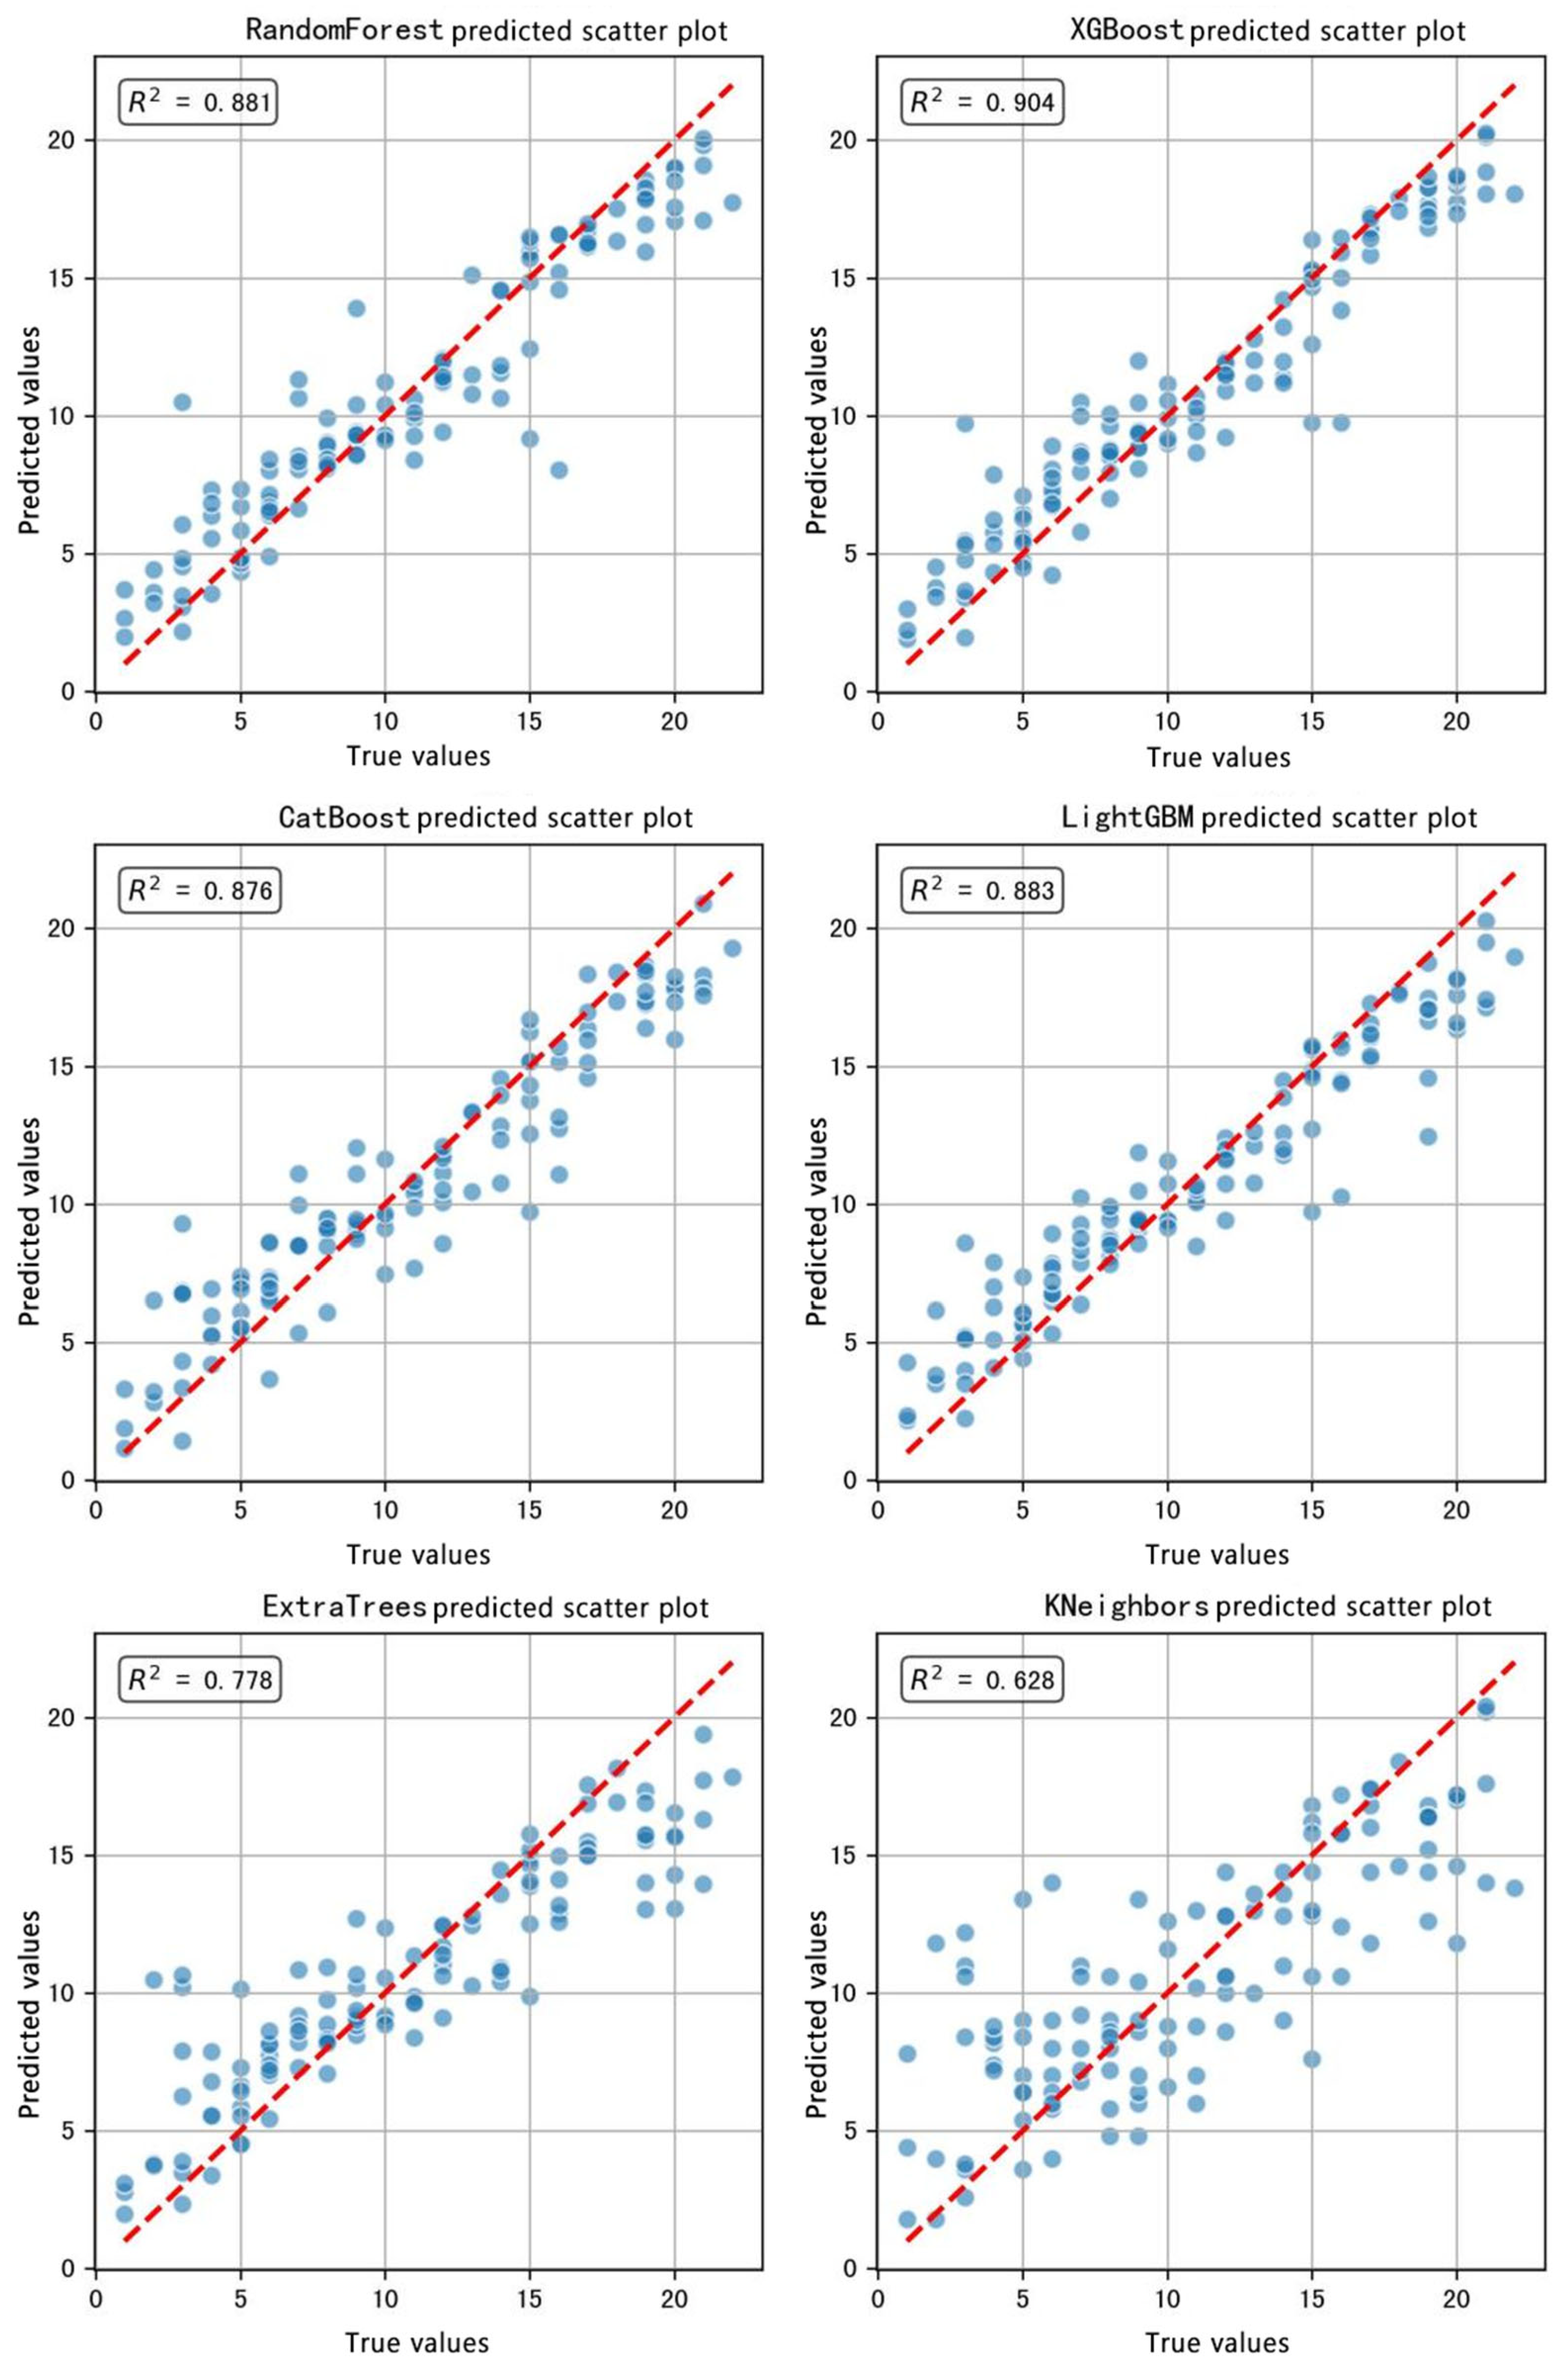
Figure 3 presents scatter plots of prediction performance for safety hazard scores on the test set under different base regressors using AutoGluon. Each subplot compares predicted values (
y-axis) against true values (
x-axis). The red dashed line (y = x) indicates ideal prediction performance, while the blue scatter points represent the distribution of predicted and actual values for each test sample. The coefficient of determination (R
2) for each model is also annotated in the upper-left corner.
Among the models, XGBoost exhibited the closest clustering of scatter points around the diagonal, with the smallest deviation and the highest fitting quality (R2 = 0.904). Random Forest, LightGBM, and CatBoost performed slightly below XGBoost, but their predicted distributions remained concentrated near the diagonal, with relatively small errors and overall satisfactory fits. In contrast, ExtraTrees and KNeighbors achieved moderate accuracy, with more dispersed scatter distributions. Taken together, the performance across R2 values and the aggregation trend between predicted and true values suggest that XGBoost provides the best fitting ability and generalization performance in this study. Consequently, XGBoost was ultimately selected as the core regression model for subsequent feature interpretation and mechanism analysis.
3.3. Model Training
Based on the comparative results from the previous stage, this study concentrated the training time budget on the best-performing model—XGBoost—allocating 7200 s for retraining. Although preliminary hyperparameter optimization had already been conducted under the multi-model parallel framework, the time resources in that stage were distributed across multiple algorithms. In this phase, a more focused search space and computational resources were dedicated specifically to XGBoost, enabling deeper fine-tuning of its hyperparameters. With a longer single-model training duration, five-fold cross-validation was performed again to examine the robustness of the model and minimize the influence of random fluctuations on the final outcome.
Through this targeted retraining process, a regression model with improved accuracy and greater stability was obtained, providing a solid numerical foundation for subsequent feature-importance analysis and interpretability of influencing mechanisms. In the preliminary retraining, XGBoost achieved an R2 of 0.859, demonstrating notable gains over the baseline.
Finally, taking the R2 metric as the primary criterion, XGBoost was selected as the main model and underwent secondary fine-tuned training. After repeated five-fold cross-validation, the XGBoost model achieved the highest R2 value of 0.903 on the test set, with an RMSE of 1.785, outperforming all other candidate models. Its robustness and interpretability establish it as the fundamental framework for the subsequent SHAP-based explanatory analysis.
4. Evaluating the Impact of Public Space Environment on Urban Safety Hazards
4.1. Feature Importance and Correlation Analysis
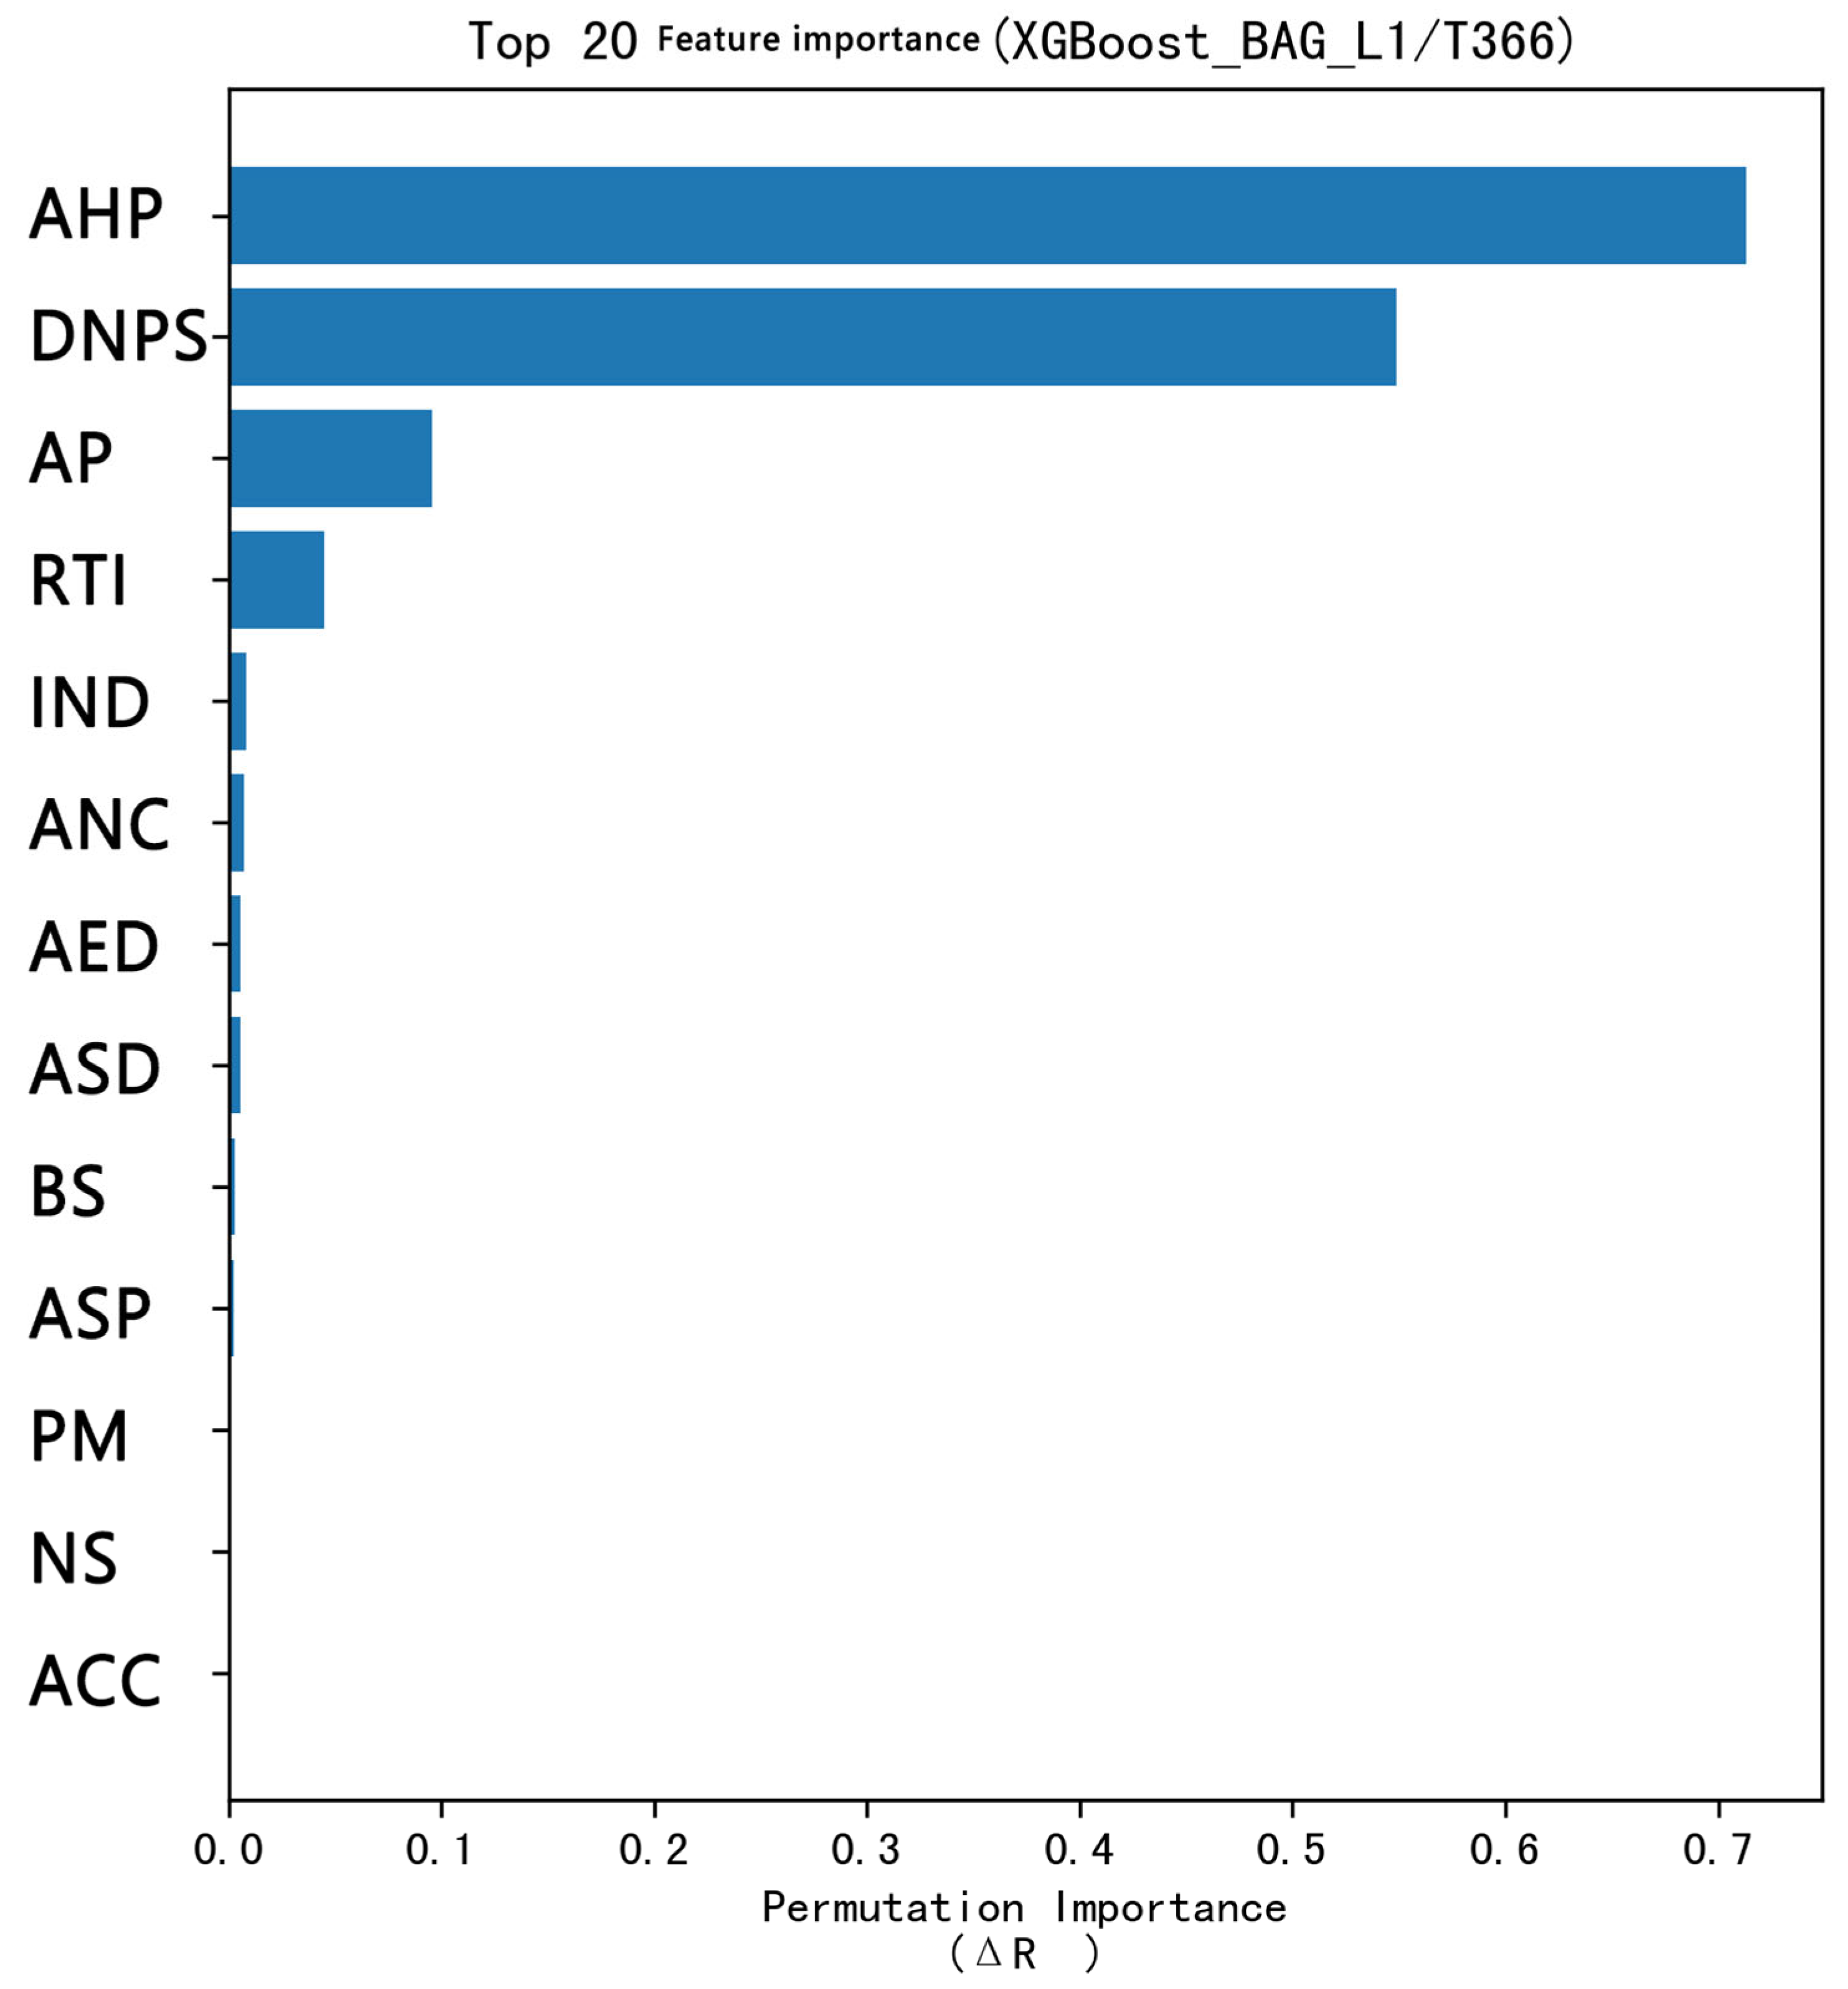
The selection of built-environment features in this study was based on multiple dimensions, including three-dimensional urban morphology, road transportation, and socio-economic and demographic factors, leading to the construction of 13 indicators. After completing the training and validation of the XGBoost model, the relative contributions of these 13 built-environment indicators to urban safety hazards were assessed using permutation importance (measured by the change in ΔR
2). As illustrated in
Figure 4, average housing price, distance to the nearest police station, and average population density ranked at the top, thereby revealing critical patterns in how built-environment characteristics shape urban safety hazards.
Figure 4 presents the results of feature-importance evaluation for built-environment variables, derived from the XGBoost model (XGBoost_BAG_L1/T366). By applying the permutation importance method and using ΔR
2 variation as the evaluation criterion, the impacts of 13 built-environment features on model performance were systematically compared.
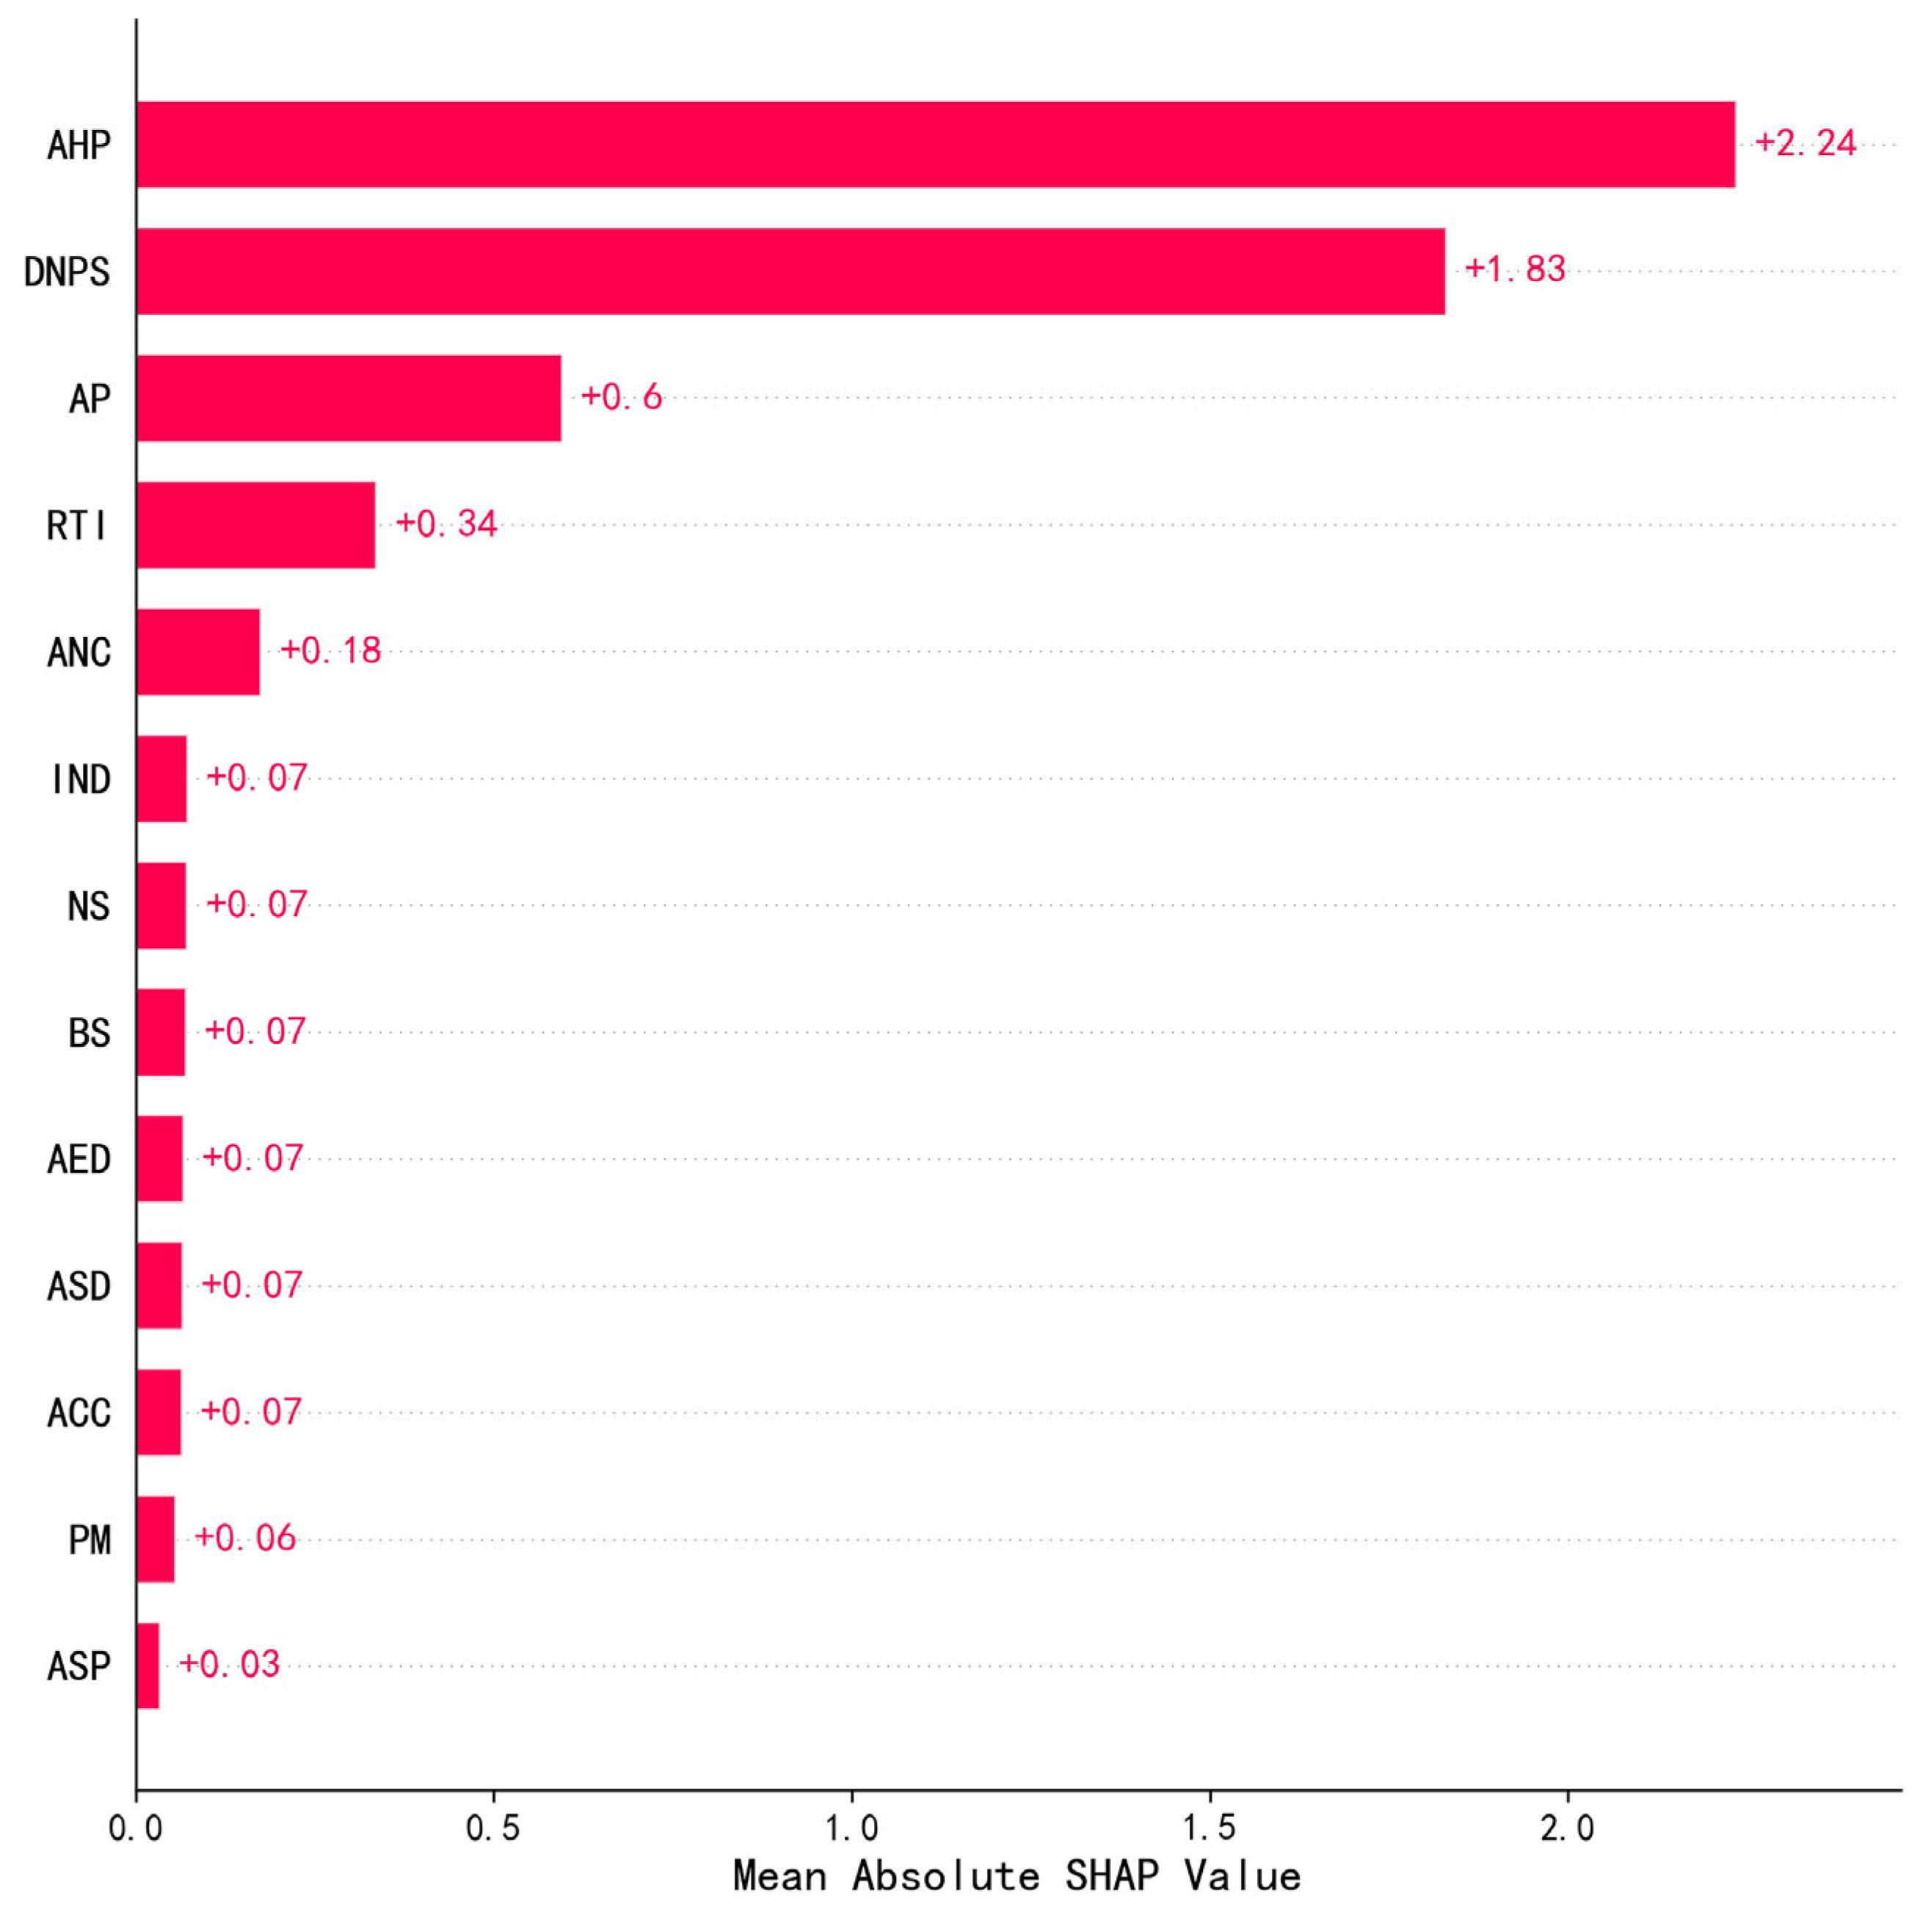
The results indicate that “average housing price” is the most influential variable. Its permutation led to the sharpest decline in model performance (ΔR2 ≈ 0.7), suggesting that this variable plays a dominant role in explaining spatial disparities in residents’ perceptions of safety hazards. This finding reflects a strong correlation between urban economic value and residents’ perceived safety. The “distance to the nearest police station” ranked second, highlighting that accessibility to policing facilities significantly affects residents’ perceptions of environmental safety hazards. This result corroborates the core principle of Crime Prevention Through Environmental Design (CPTED) theory, which emphasizes the link between environmental monitoring and residents’ perceived safety, extending beyond crime to broader urban safety hazards. Additionally, “average population density” also showed notable explanatory power, suggesting that the degree of population aggregation may indirectly influence safety-hazard outcomes by shaping human behaviors and interaction patterns.
By contrast, factors such as road traffic density, number of intersections, and visual features extracted from street-view images (e.g., average number of colors, edge detection, scene depth, color contrast) had relatively lower marginal impacts on model performance. Nevertheless, as constitutive elements of the built environment, these factors still provide complementary explanatory value within the multi-source perception framework.
Overall, the model results highlight urban economic attributes, safety accessibility, and population density as the key variables shaping residents’ spatial safety-hazard experiences. Moreover, they validate the effectiveness of integrating multi-source spatial data with machine learning for urban safety-hazard modeling. These findings offer both data support and theoretical grounding for identifying and intervening in high-risk urban spaces.
4.2. Two-Dimensional Partial Dependence Analysis: Synergistic Mechanisms of Built Environment Features
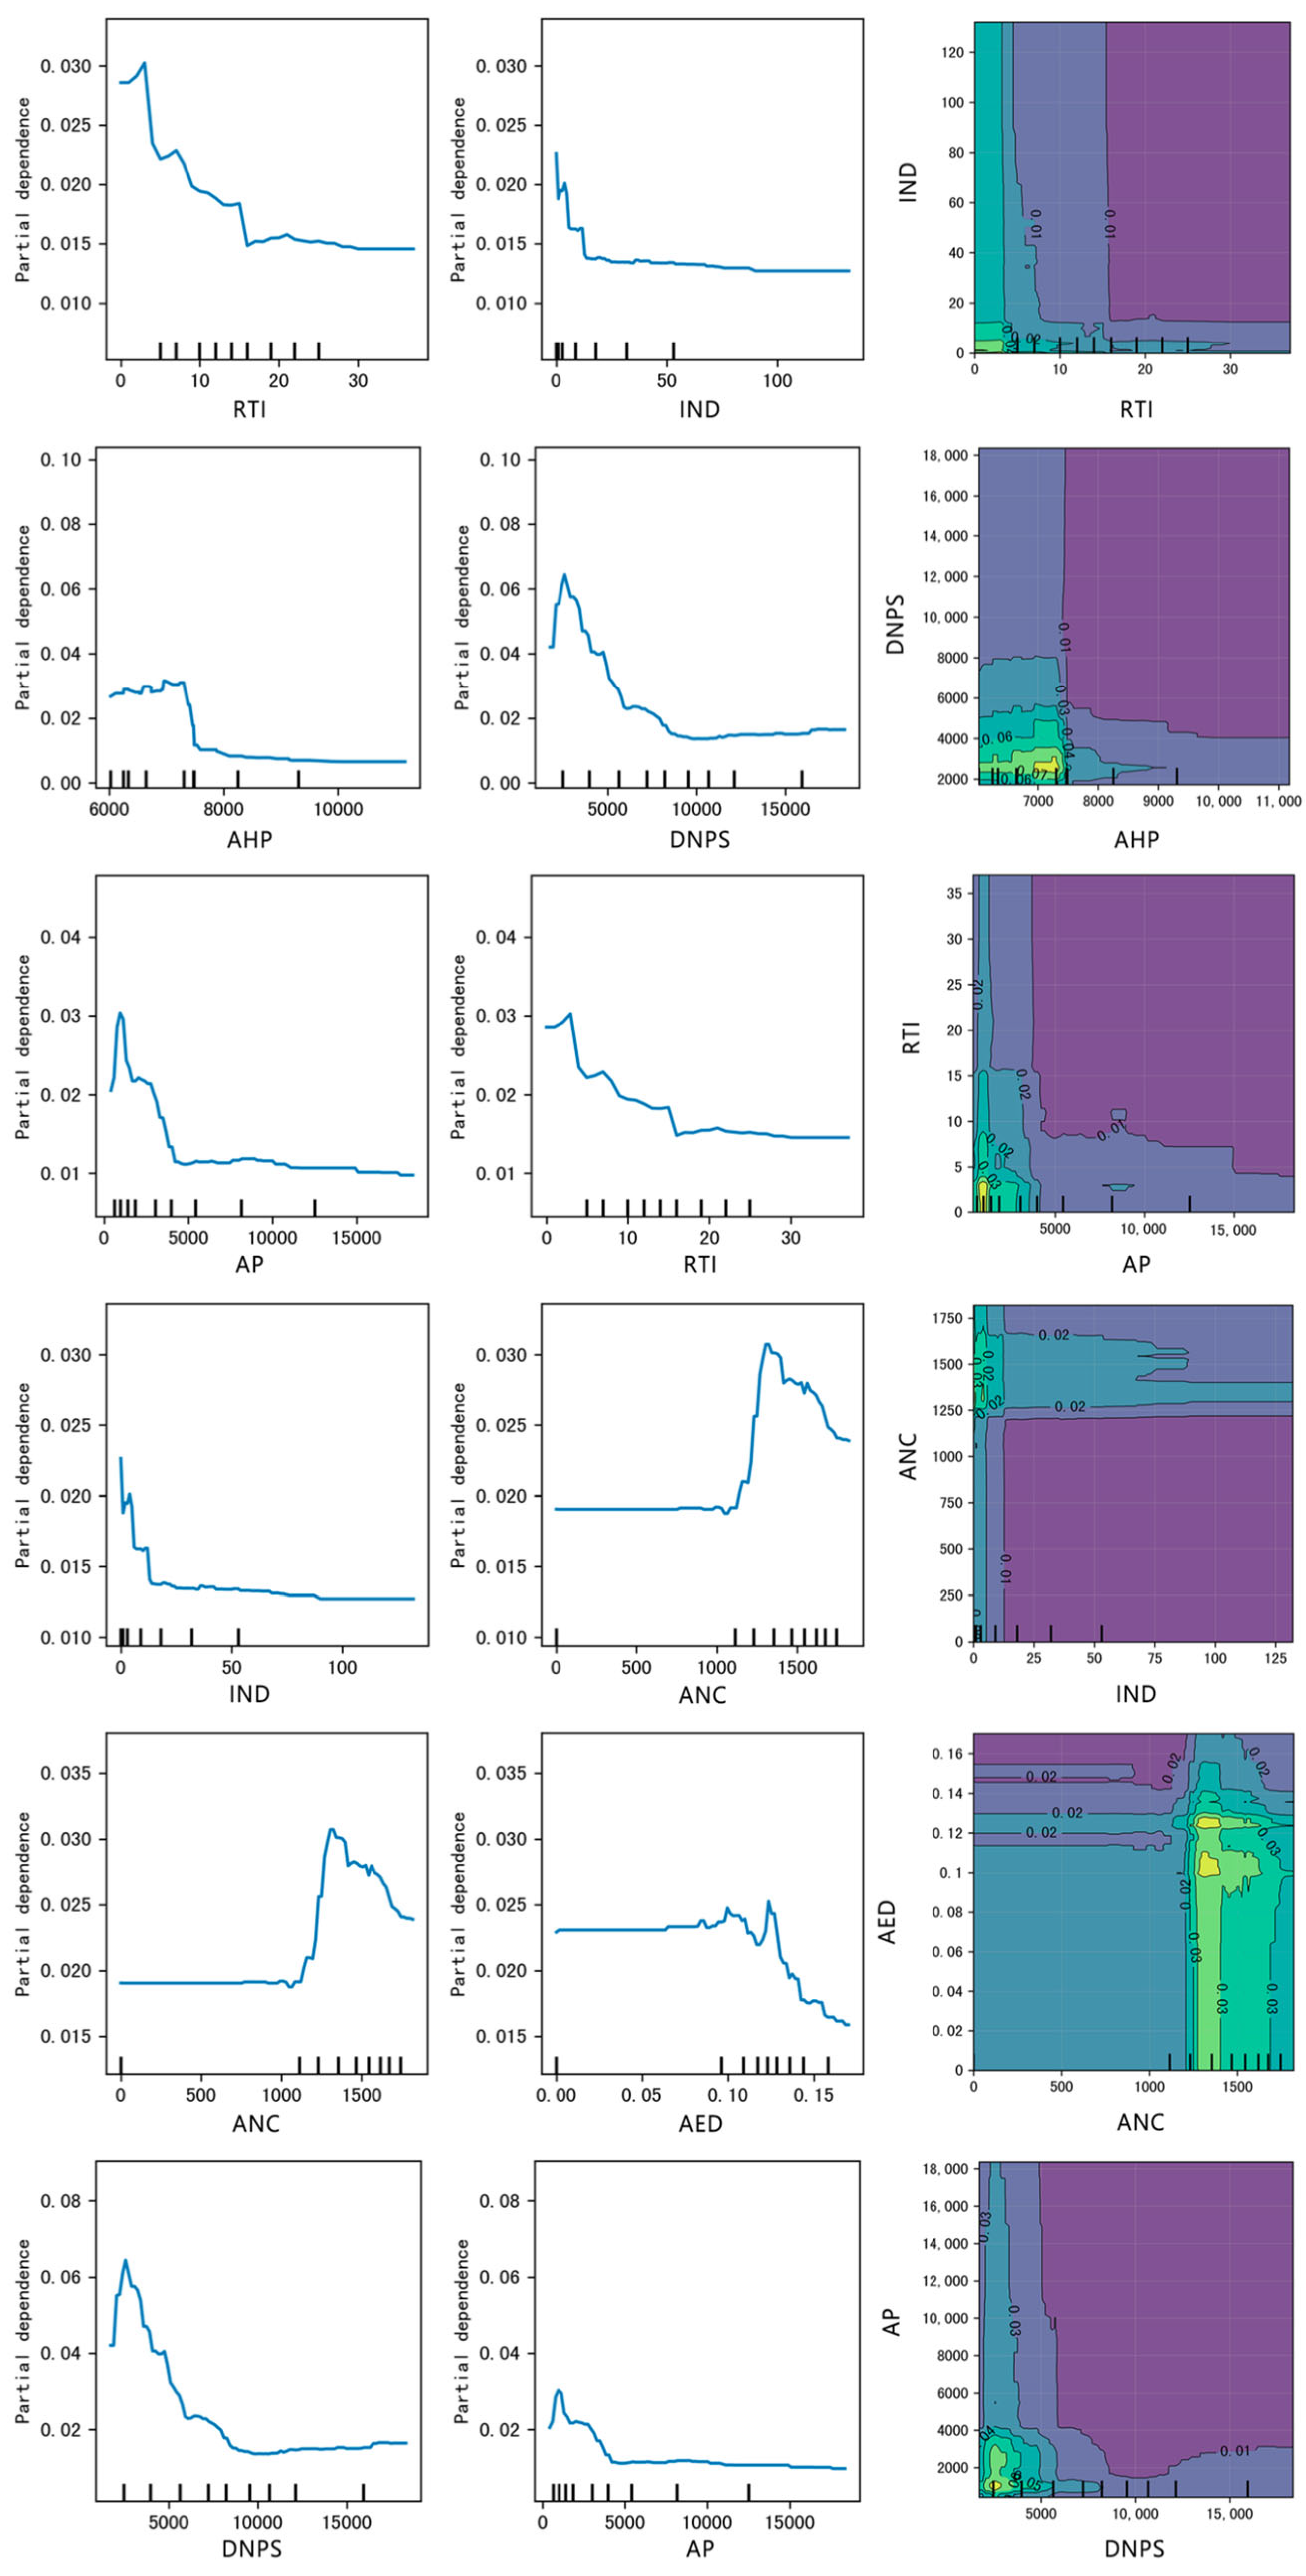
To further reveal the nonlinear coupling relationships among different built-environment elements, this study selected the top seven core variables based on the feature-importance ranking (
Figure 5). Following the principle of covering key urban dimensions such as transportation systems, socio-economic attributes, visual perception, and public services, six pairs of representative variables were constructed for a two-dimensional partial dependence plot (2D PDP) analysis. This allowed systematic exploration of synergistic gains, marginal effects, and resource-allocation thresholds of built-environment factors, with the aim of providing quantitative support for the prevention and optimization of urban safety hazards.
Road traffic intensity reflects the transport load of an area, while intersection density measures the connectivity and diversion capacity of the road network. Their interaction illustrates a “mobility efficiency–pathway choice” mechanism: heavy traffic pressure requires high-density nodes for effective diversion; otherwise, congestion may occur, increasing safety-hazard risks. When road traffic exceeds 25 and intersection density falls below 50, the predicted safety-hazard score rises to about 0.015, indicating systemic safety-hazard risk from inadequate node support under high flow. By contrast, when intersection density increases to around 70–90 and traffic intensity remains moderate (10–15), the predicted safety-hazard score falls below 0.02, forming an optimized “medium flow + high node density” combination. Under extreme conditions (traffic > 25, node density > 90), the response curve flattens but remains slightly lower than in the high-flow, low-node scenario, reflecting diminishing marginal returns.
Average housing price serves as a proxy for socio-economic capital, while distance to the nearest police station represents the accessibility of safety resources. This pairing reflects the spatial coupling of “economic value–safety provision.” Results show that high-value areas lacking corresponding safety services are more prone to safety hazards. When police distance exceeds 12,000 m, even housing prices above 9000 yield predicted values around 0.02–0.03, suggesting that the absence of safety services weakens locational advantages. Conversely, when housing prices are between 8000 and 10,000 and police distance shortens to 5000–7000 m, predicted safety-hazard scores fall below 0.075, reflecting the synergistic “high value–high safety” effect. Once the distance to police stations drops below 3000 m, further reductions in safety-hazard scores plateau, revealing a rational threshold for safety-resource allocation, beyond which excessive density provides no additional benefit.
Average population density represents baseline travel demand, while road traffic intensity reflects supply capacity. Their interaction evaluates the dynamic “population pressure–transport capacity” relationship, revealing how the supply–demand balance between infrastructure and aggregation shapes safety-hazard outcomes. When high population density (>12,000) combines with high traffic load (>25), predicted safety-hazard scores exceed 0.01, signaling systemic bottlenecks. The optimal balance occurs with a population of around 8000–10,000 and a traffic intensity of 10–15, reducing predicted values below 0.03. At low population levels (<5000), expansions in road capacity yield limited reduction in safety hazards, underscoring the importance of demand-side effects.
Color count reflects visual richness, while edge-detection values capture spatial texture complexity. Their interaction reflects the relationship between “visual stimulus–cognitive load” and safety hazards: moderate complexity mitigates the insecurity caused by monotony, while excessive texture may generate distraction and risk. When the color count is <800 and edge values exceed 0.12, predicted safety-hazard scores rise above 0.02, indicating that mismatched monotony and high texture increase safety-hazard risk. With richer colors (>1200) and moderate edge values (0.08–0.10), the lowest safety-hazard responses approach 0.035, forming the optimal low-risk zone. Once edge values exceed 0.15, additional colors fail to reduce safety hazards further, indicating saturation in visual complexity.
Intersections, as spatial nodes, influence pedestrian aggregation and interaction probabilities, while color diversity enhances visual appeal and may mitigate environmental safety hazards. Their interaction reflects a “node vitality–visual anchor” synergy. When intersection density exceeds 80 but color count remains below 1000, predicted safety-hazard scores remain around 0.015, showing that isolated nodes cannot generate sufficient attraction and may increase safety-hazard risks. At intermediate densities (60–80) with color counts of 1200–1400, safety-hazard scores drop below 0.025, verifying the combined effect of “nodes + visuals” in hazard reduction. Beyond 1500 colors, the improvement effect plateaus, with only slight further reductions, cautioning against visual overload.
The distance to police stations reflects the accessibility of safety services, while population density determines demand intensity. This combination evaluates how “resource efficiency–service equity” influences safety-hazard prevention. When population exceeds 14,000 and police distance exceeds 10,000 m, predicted safety-hazard scores rise above 0.02, showing that inadequate safety coverage leads to elevated safety-hazard risks. The optimal zone occurs at population levels of 8000–12,000 with police distance of 4000–6000 m, where safety-hazard scores fall below 0.06. In low-density areas (<6000), variations in police distance have limited influence on safety-hazard levels, supporting prioritization of resource allocation based on population density.
Taken together, these six variable pairs—covering multiple dimensions and guided by both XGBoost importance rankings and urban planning theory—maximize the revelation of nonlinear interaction effects between key factors. The visualized results from 2D PDP analysis provide intuitive and interpretable quantitative evidence to inform urban design and decision-making.
4.3. SHAP-Based Global Interpretability
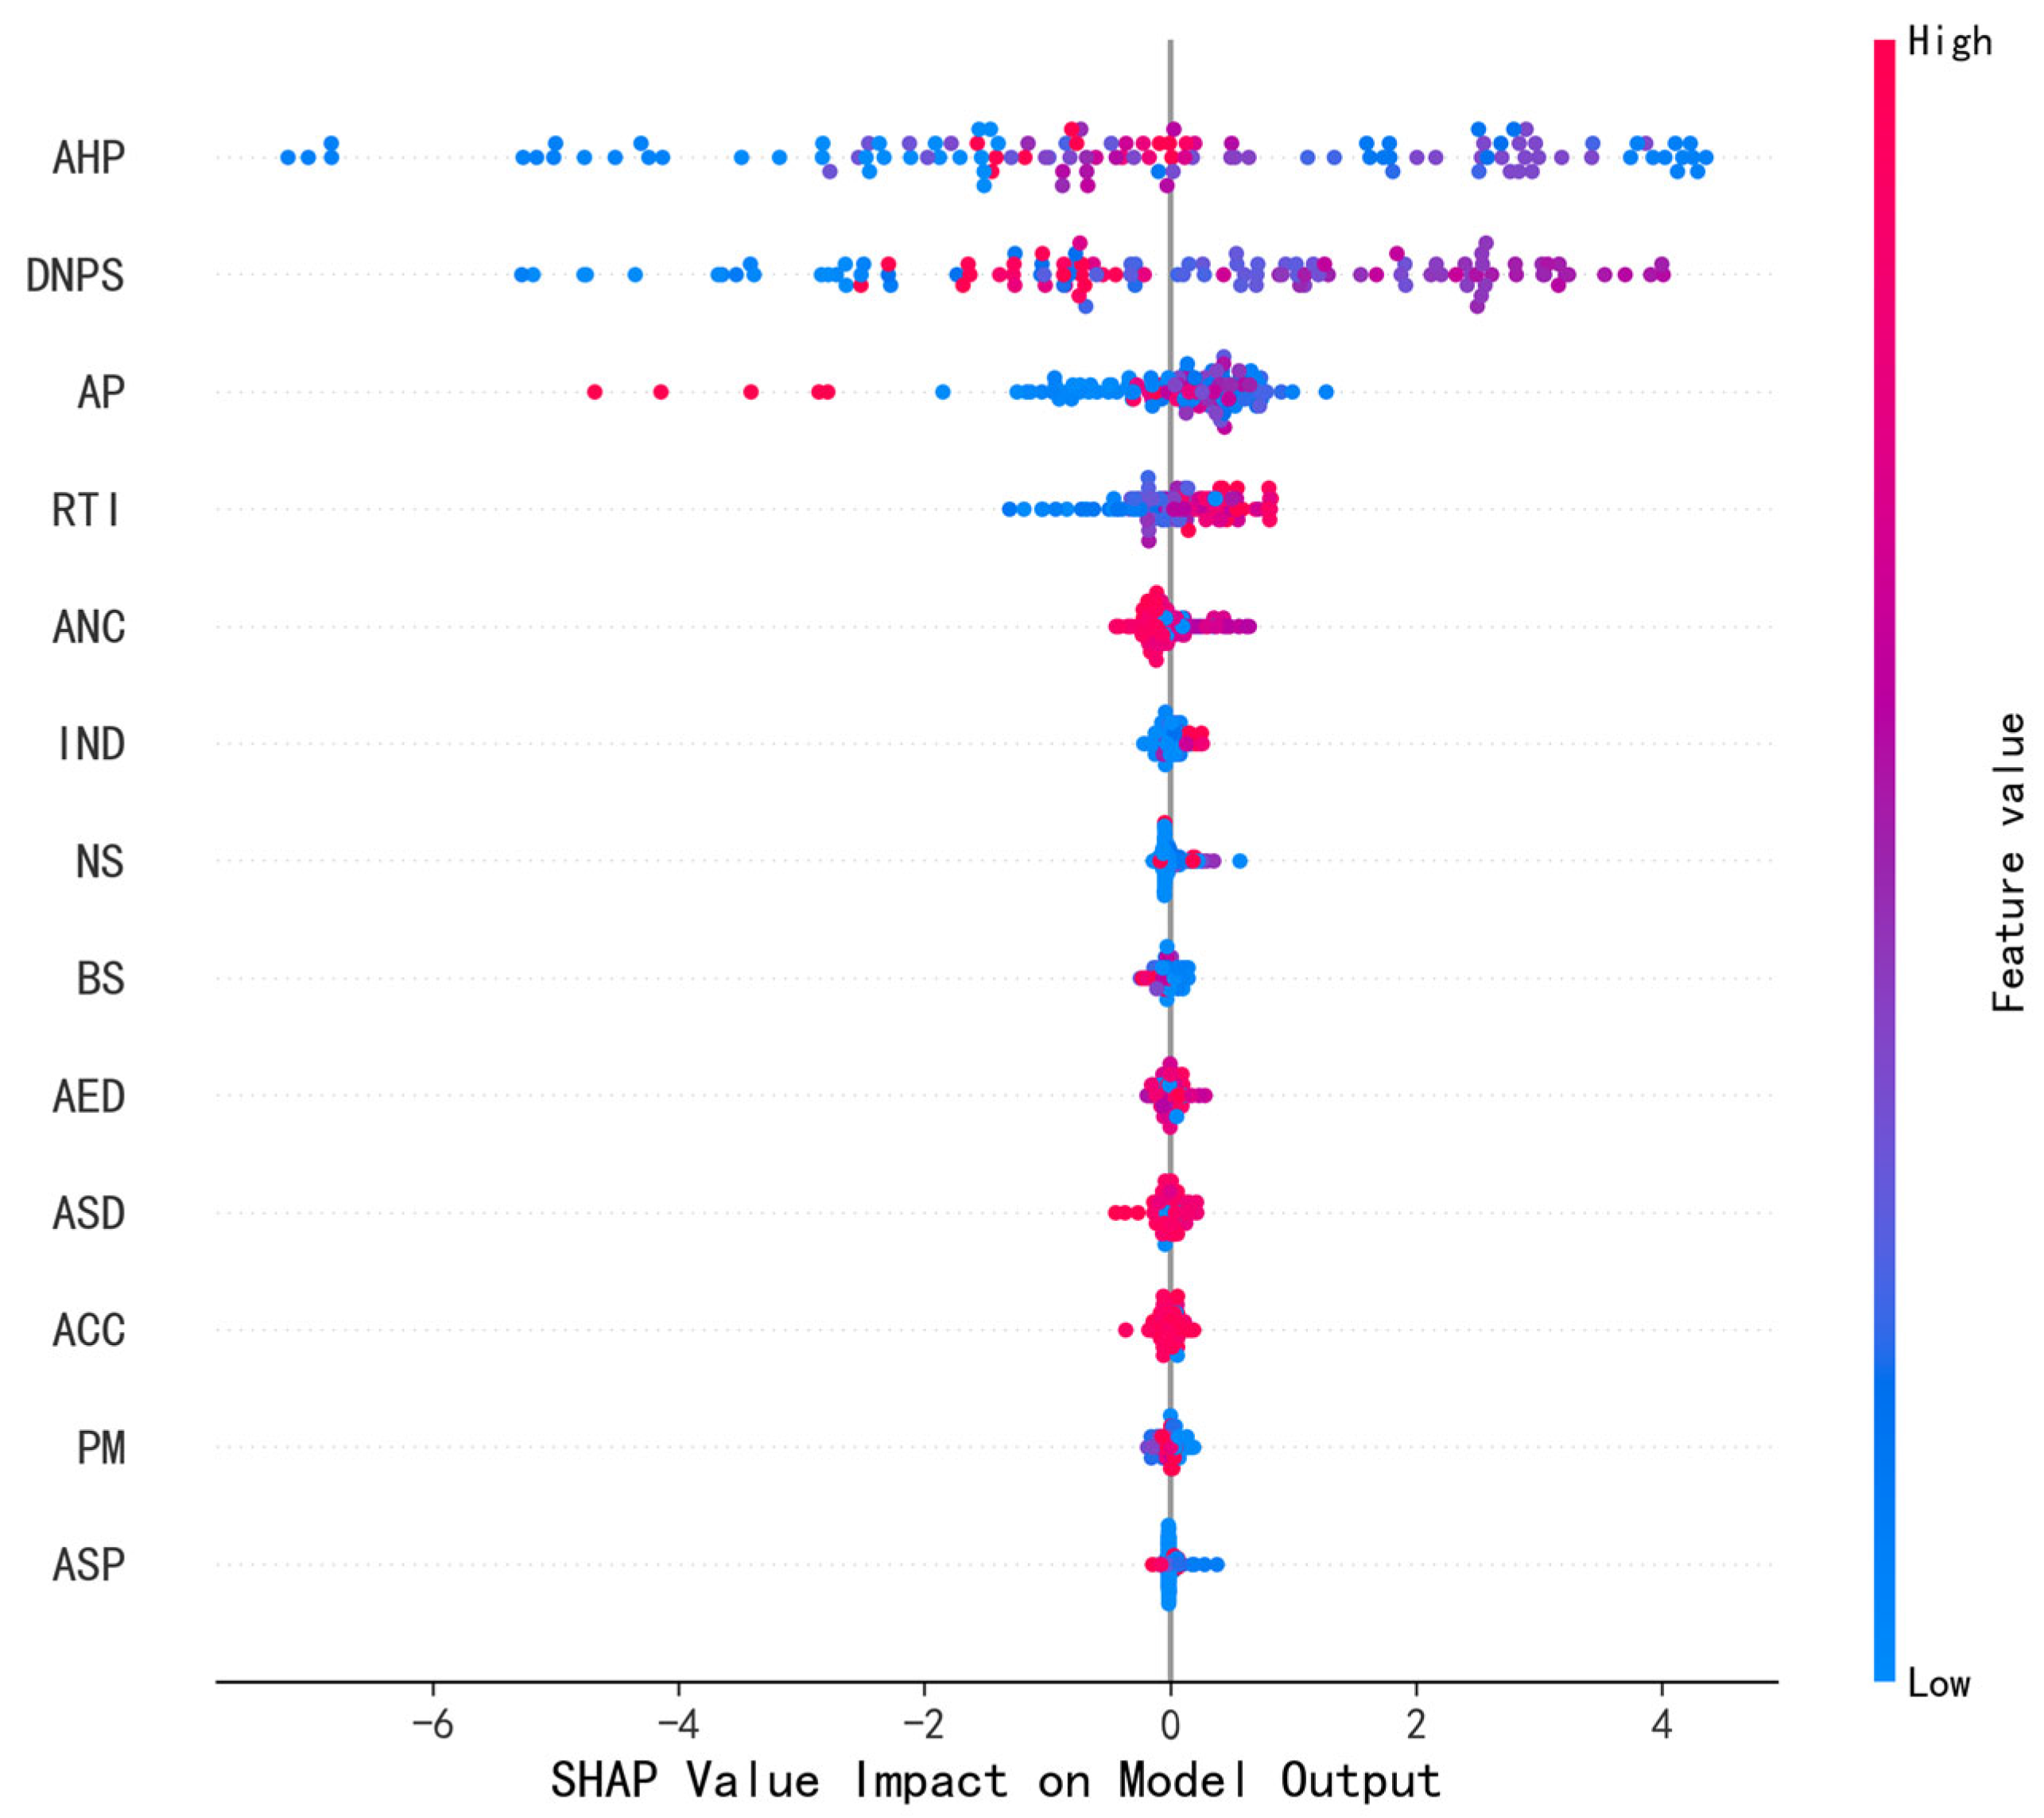
Figure 6 presents the SHAP global explanation results based on the XGBoost model, including the ranking of built-environment features in terms of their importance to urban safety-hazard predictions, as well as the distribution of their influence direction and intensity on the model outputs. The results are analyzed from two perspectives: feature importance and influence trends.
From the bar chart of mean absolute SHAP values (
Figure 6), it is clear that average housing price has the highest mean SHAP value, indicating that the model is most sensitive to variations in residential cost with respect to residents’ perceived safety. Distance to the nearest police station ranks second, suggesting that accessibility of policing facilities also has a significant impact on safety-hazard evaluation. Other indicators of relatively high importance include average population density, road traffic features, and average color count, reflecting the combined influence of population distribution, transport accessibility, and the visual environment on residents’ perception of urban safety hazards. The importance of the remaining features decreases in sequence. While these features still provide auxiliary contributions to the overall model predictions, their relative effects are weaker. Collectively, the evaluation highlights residential cost and spatial distribution of policing facilities as the core determinants of urban safety hazards, followed by population density, transportation network elements (e.g., road traffic, number of intersections, bus stops), and visual attributes (e.g., average color count, edge detection, scene depth, color contrast); while factors such as functional land-use mix play relatively minor roles.
On the scatter plots of SHAP values (
Figure 7), color gradients represent each feature’s contribution across its range of values: blue dots for low feature values and red dots for high feature values. For the average housing price, most red points fall on the positive side, suggesting that higher housing prices are generally associated with higher safety-hazard scores—that is, residents tend to link high-cost housing areas with better residential environments, stronger security management, and more stable social order. Conversely, blue points (low housing prices) are mostly associated with negative contributions, implying that low-price areas are more likely to correspond to lower safety-hazard scores in the model. For distance to the nearest police station, high values (i.e., longer distances) are mainly blue and skew negative, while low values (shorter distances) are red and positive. This indicates that closer proximity to policing facilities makes a significant positive contribution to perceived safety—districts with higher police coverage density are more likely to foster improved safety-hazard perception. For bus-stop density, high-density areas generally yield positive SHAP values, showing that more concentrated public transport nodes increase residents’ perceptions of accessibility, vitality, and potential safety hazards. By contrast, low-density (blue) regions reduce safety-hazard scores. Similarly, average color count and average scene depth tend to fall in the positive SHAP-value range at higher values, suggesting that visual diversity and spatial layering enhance street-scene attractiveness and strengthen perceived safety. For road traffic density, however, some high-value (red) points fall into the negative range, implying that excessive traffic pressure may reduce residents’ sense of safety. Streetlight count and road intersections exhibit slight positive contributions at higher values, suggesting that improved night lighting and greater accessibility through node distribution modestly enhance safety-hazard perception. Other features, such as POI functional diversity, alcohol-sales outlet density, color contrast, and average edge detection, show point clouds clustered near zero, indicating minimal or unstable effects on model outputs.
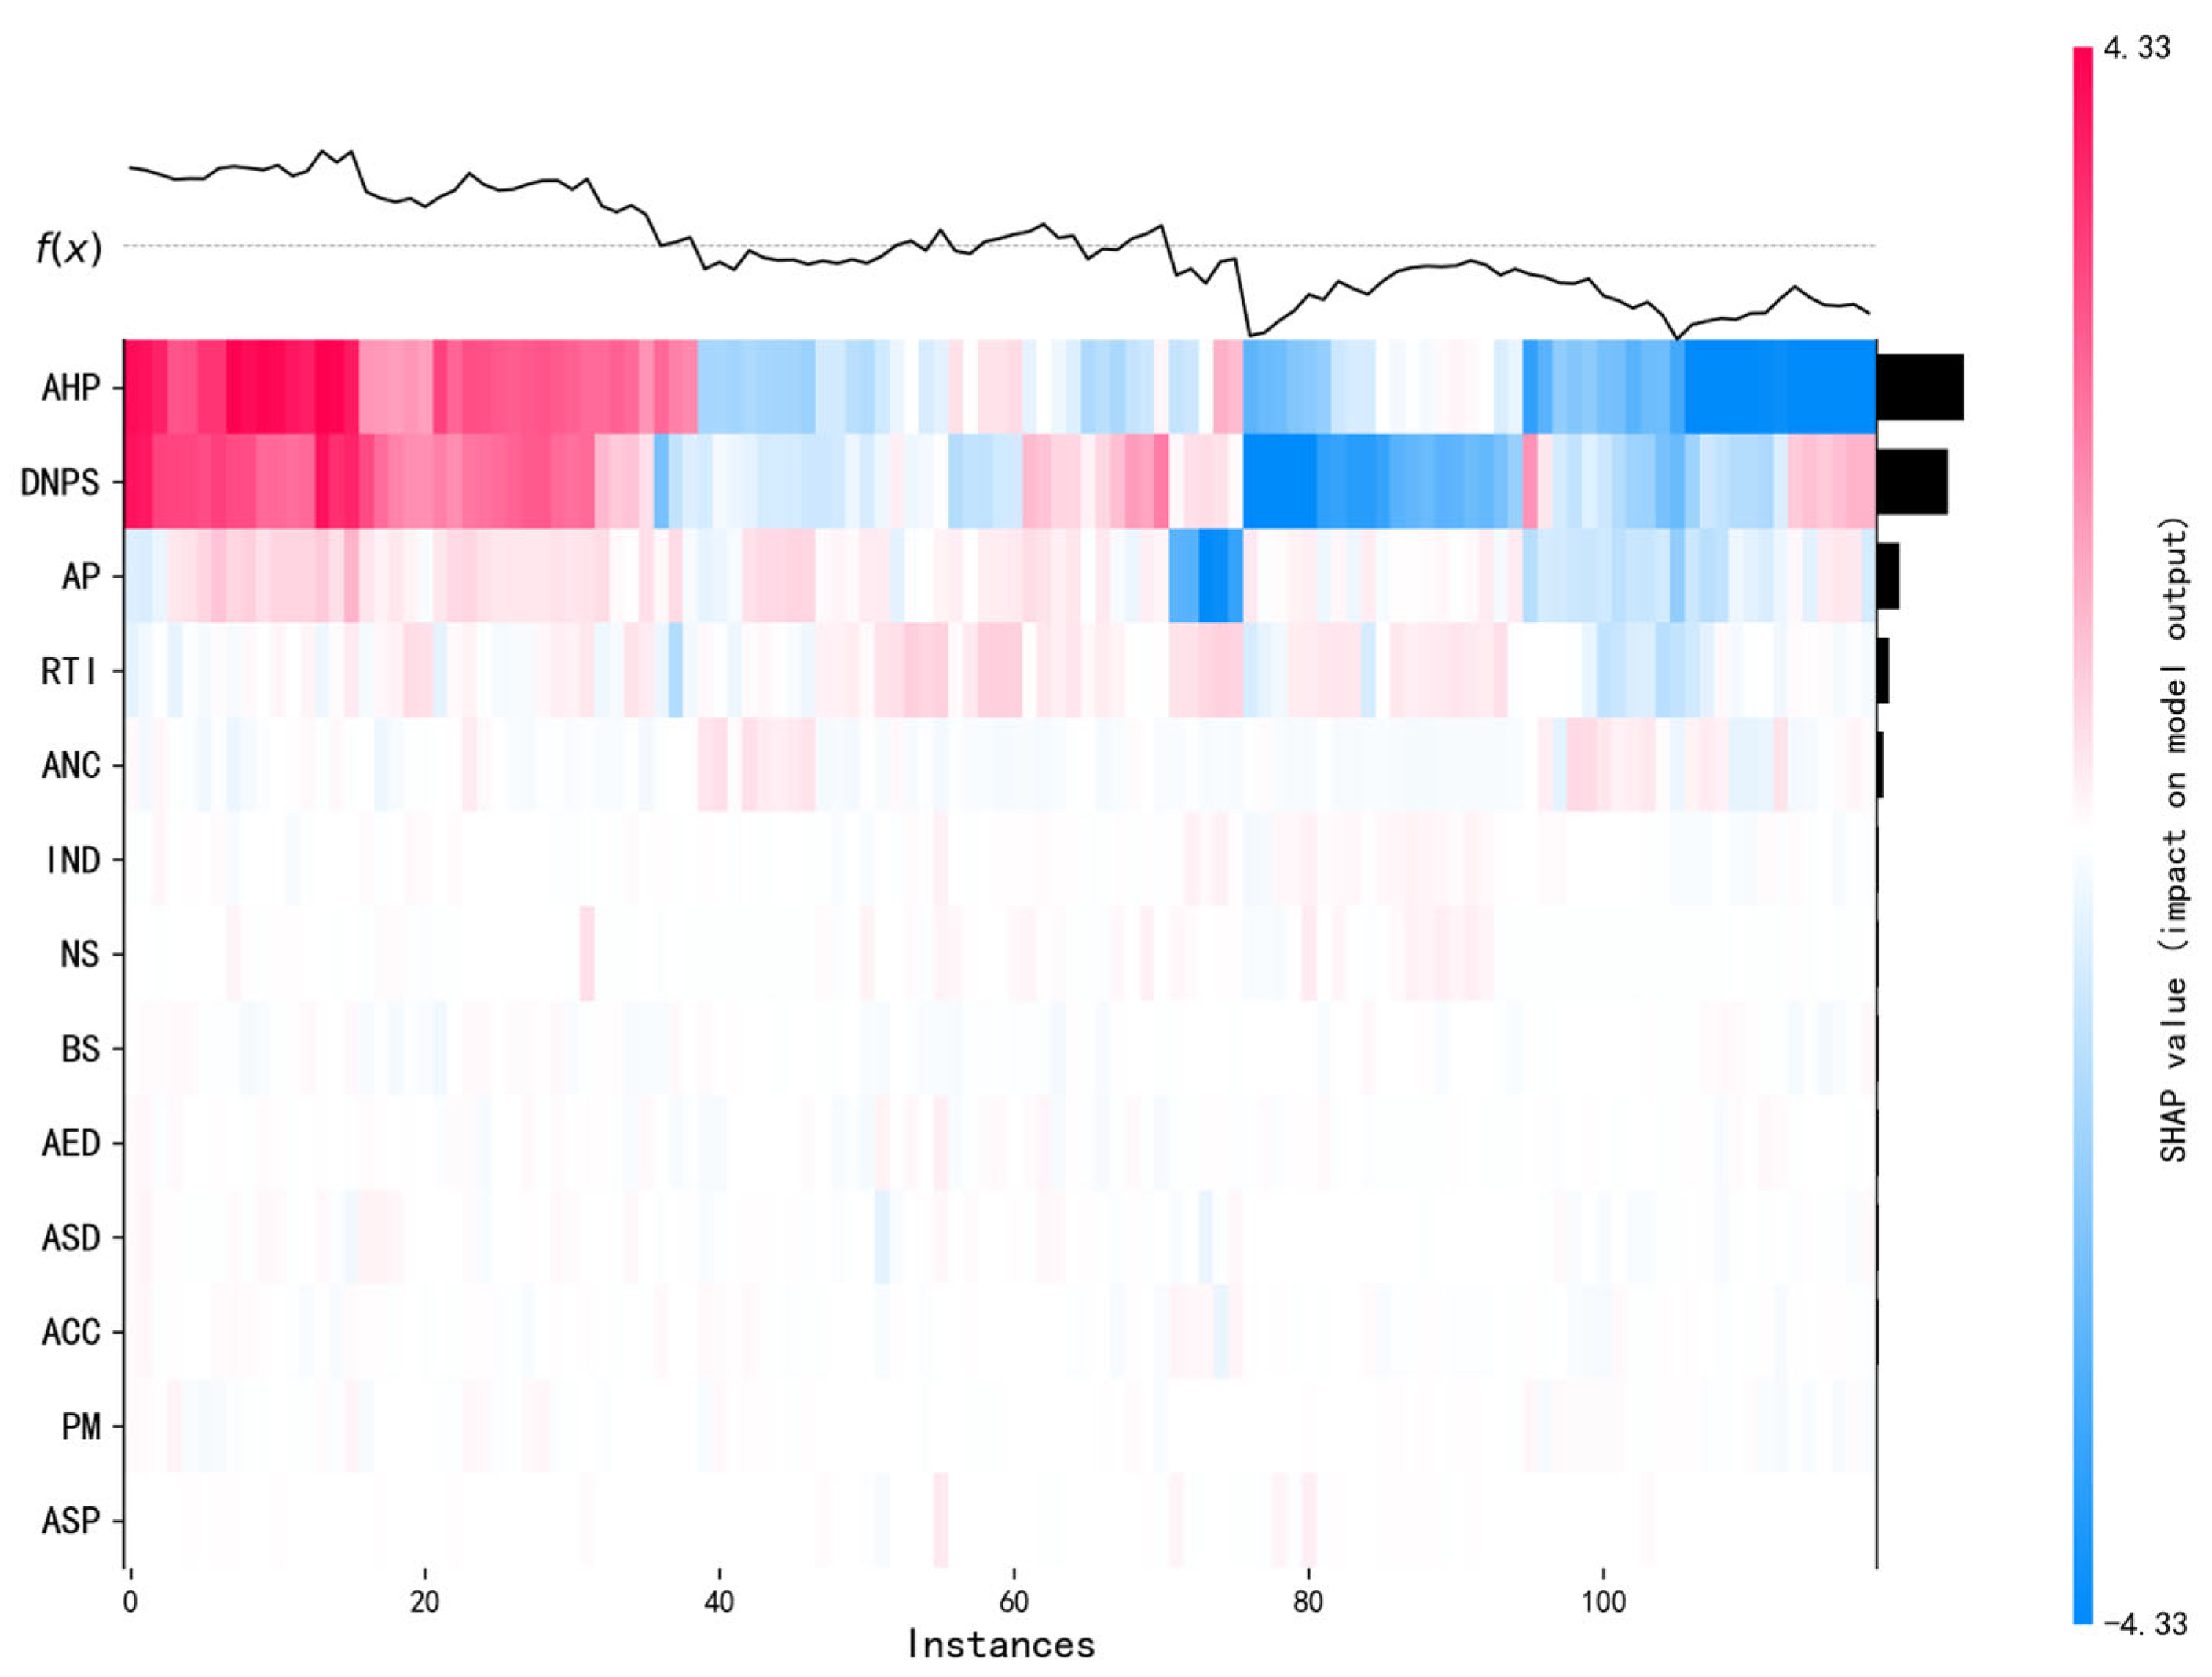
Figure 8 presents the feature-contribution heatmap based on SHAP values. From the figure, it can be observed that “average housing price” appears as deep red in most samples, indicating a significant positive contribution to safety-hazard evaluation and serving as the strongest driver of the overall model output. This suggests that higher housing prices are often associated with stronger perceived safety, possibly reflecting the role of better living environments and supporting facilities in enhancing residents’ sense of security. The “distance to the nearest police station” follows closely, exhibiting an alternating pattern of deep red and deep blue across many samples. This indicates a complex influence: greater distances from police facilities may weaken residents’ sense of perceived safety, while closer deployments may reinforce safety-hazard perception. Thus, this variable makes a substantial contribution to safety-hazard evaluation as well. The “average population” variable displays relatively darker shades in certain samples, suggesting that population density exerts a moderating effect on safety-hazard outcomes in specific areas. By contrast, transportation and lighting-related indicators such as “road traffic,” “number of intersections,” and “streetlight count” generally appear in lighter colors, implying weaker overall effects, though notable contributions can still be found in localized samples. Visual-related variables such as “average color count,” “average color contrast,” and “average scene depth” also show mostly light shading, reflecting limited explanatory power in the model. Nevertheless, they do produce certain positive or negative fluctuations in specific instances. Additionally, “POI functional diversity” and “number of alcohol outlets” appear relatively uniform and faint across the heatmap, suggesting only minor overall effects, though they may hold localized significance under particular conditions. In sum, the heatmap provides an intuitive representation of how different built-environment features influence safety-hazard predictions. It highlights both the dominant drivers and the more localized, context-dependent effects, offering valuable insights into the underlying logic of the model and the relationship between urban spatial features and safety-hazard outcomes.
4.4. Local Interpretability
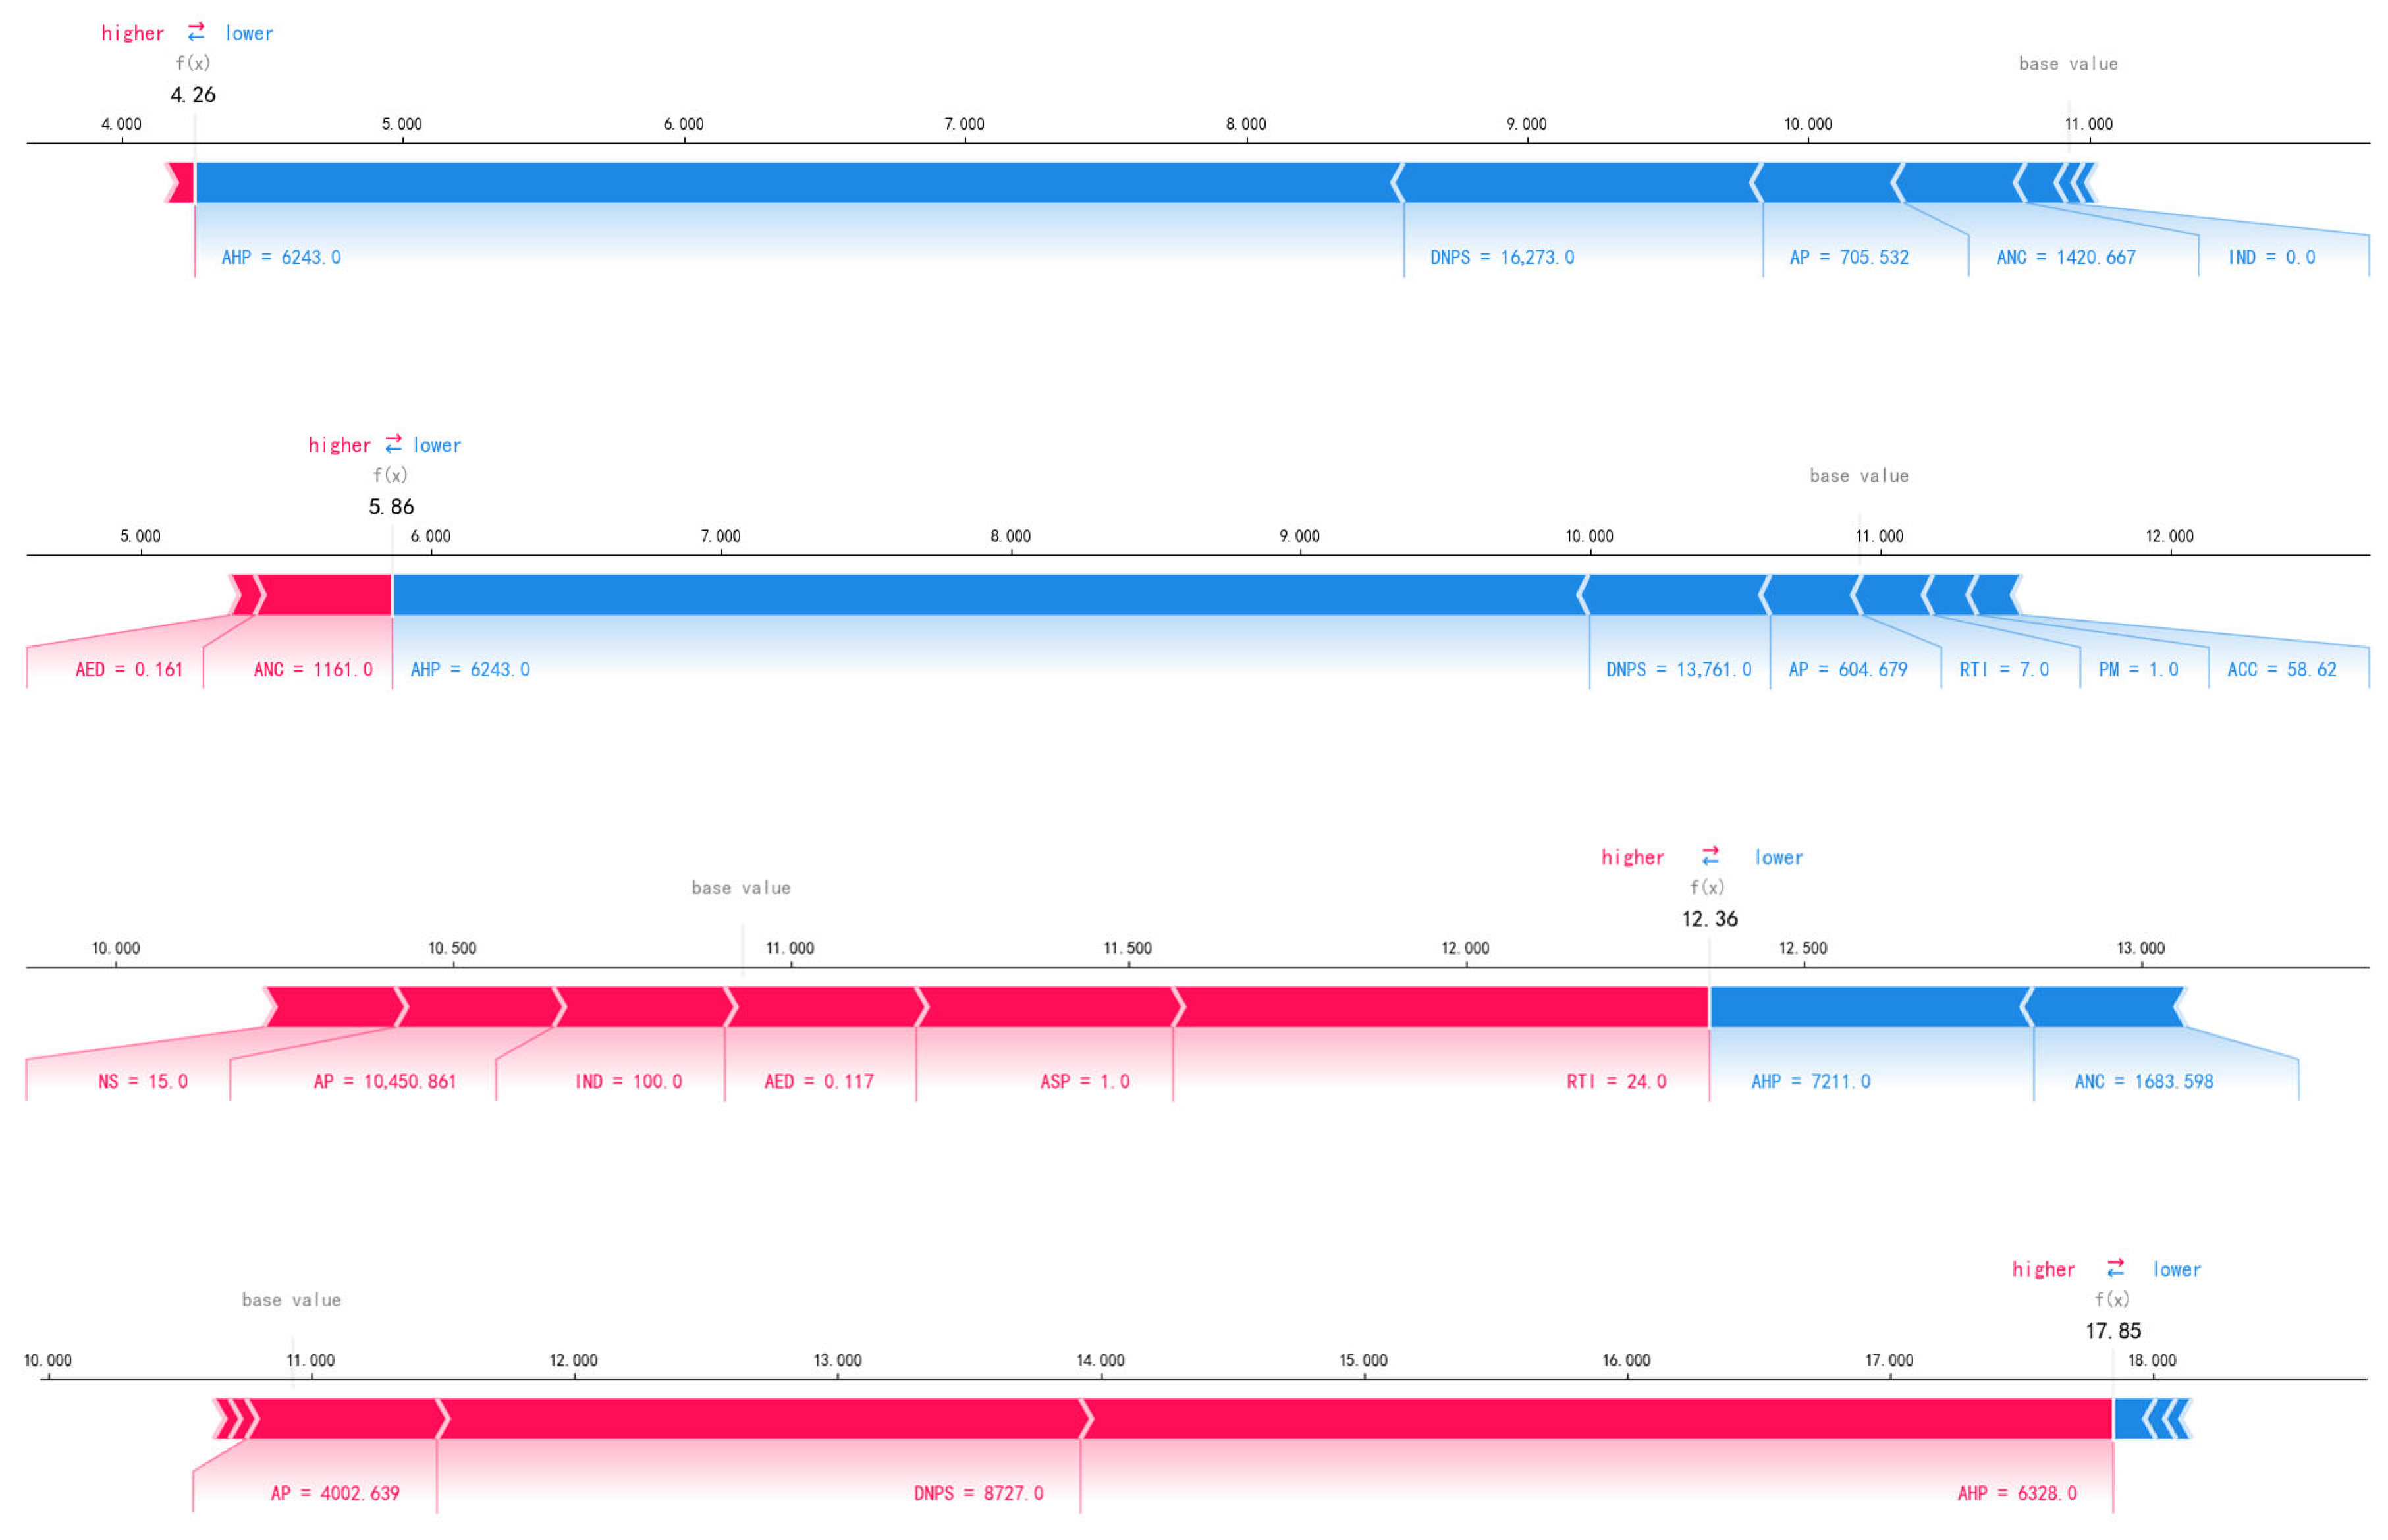
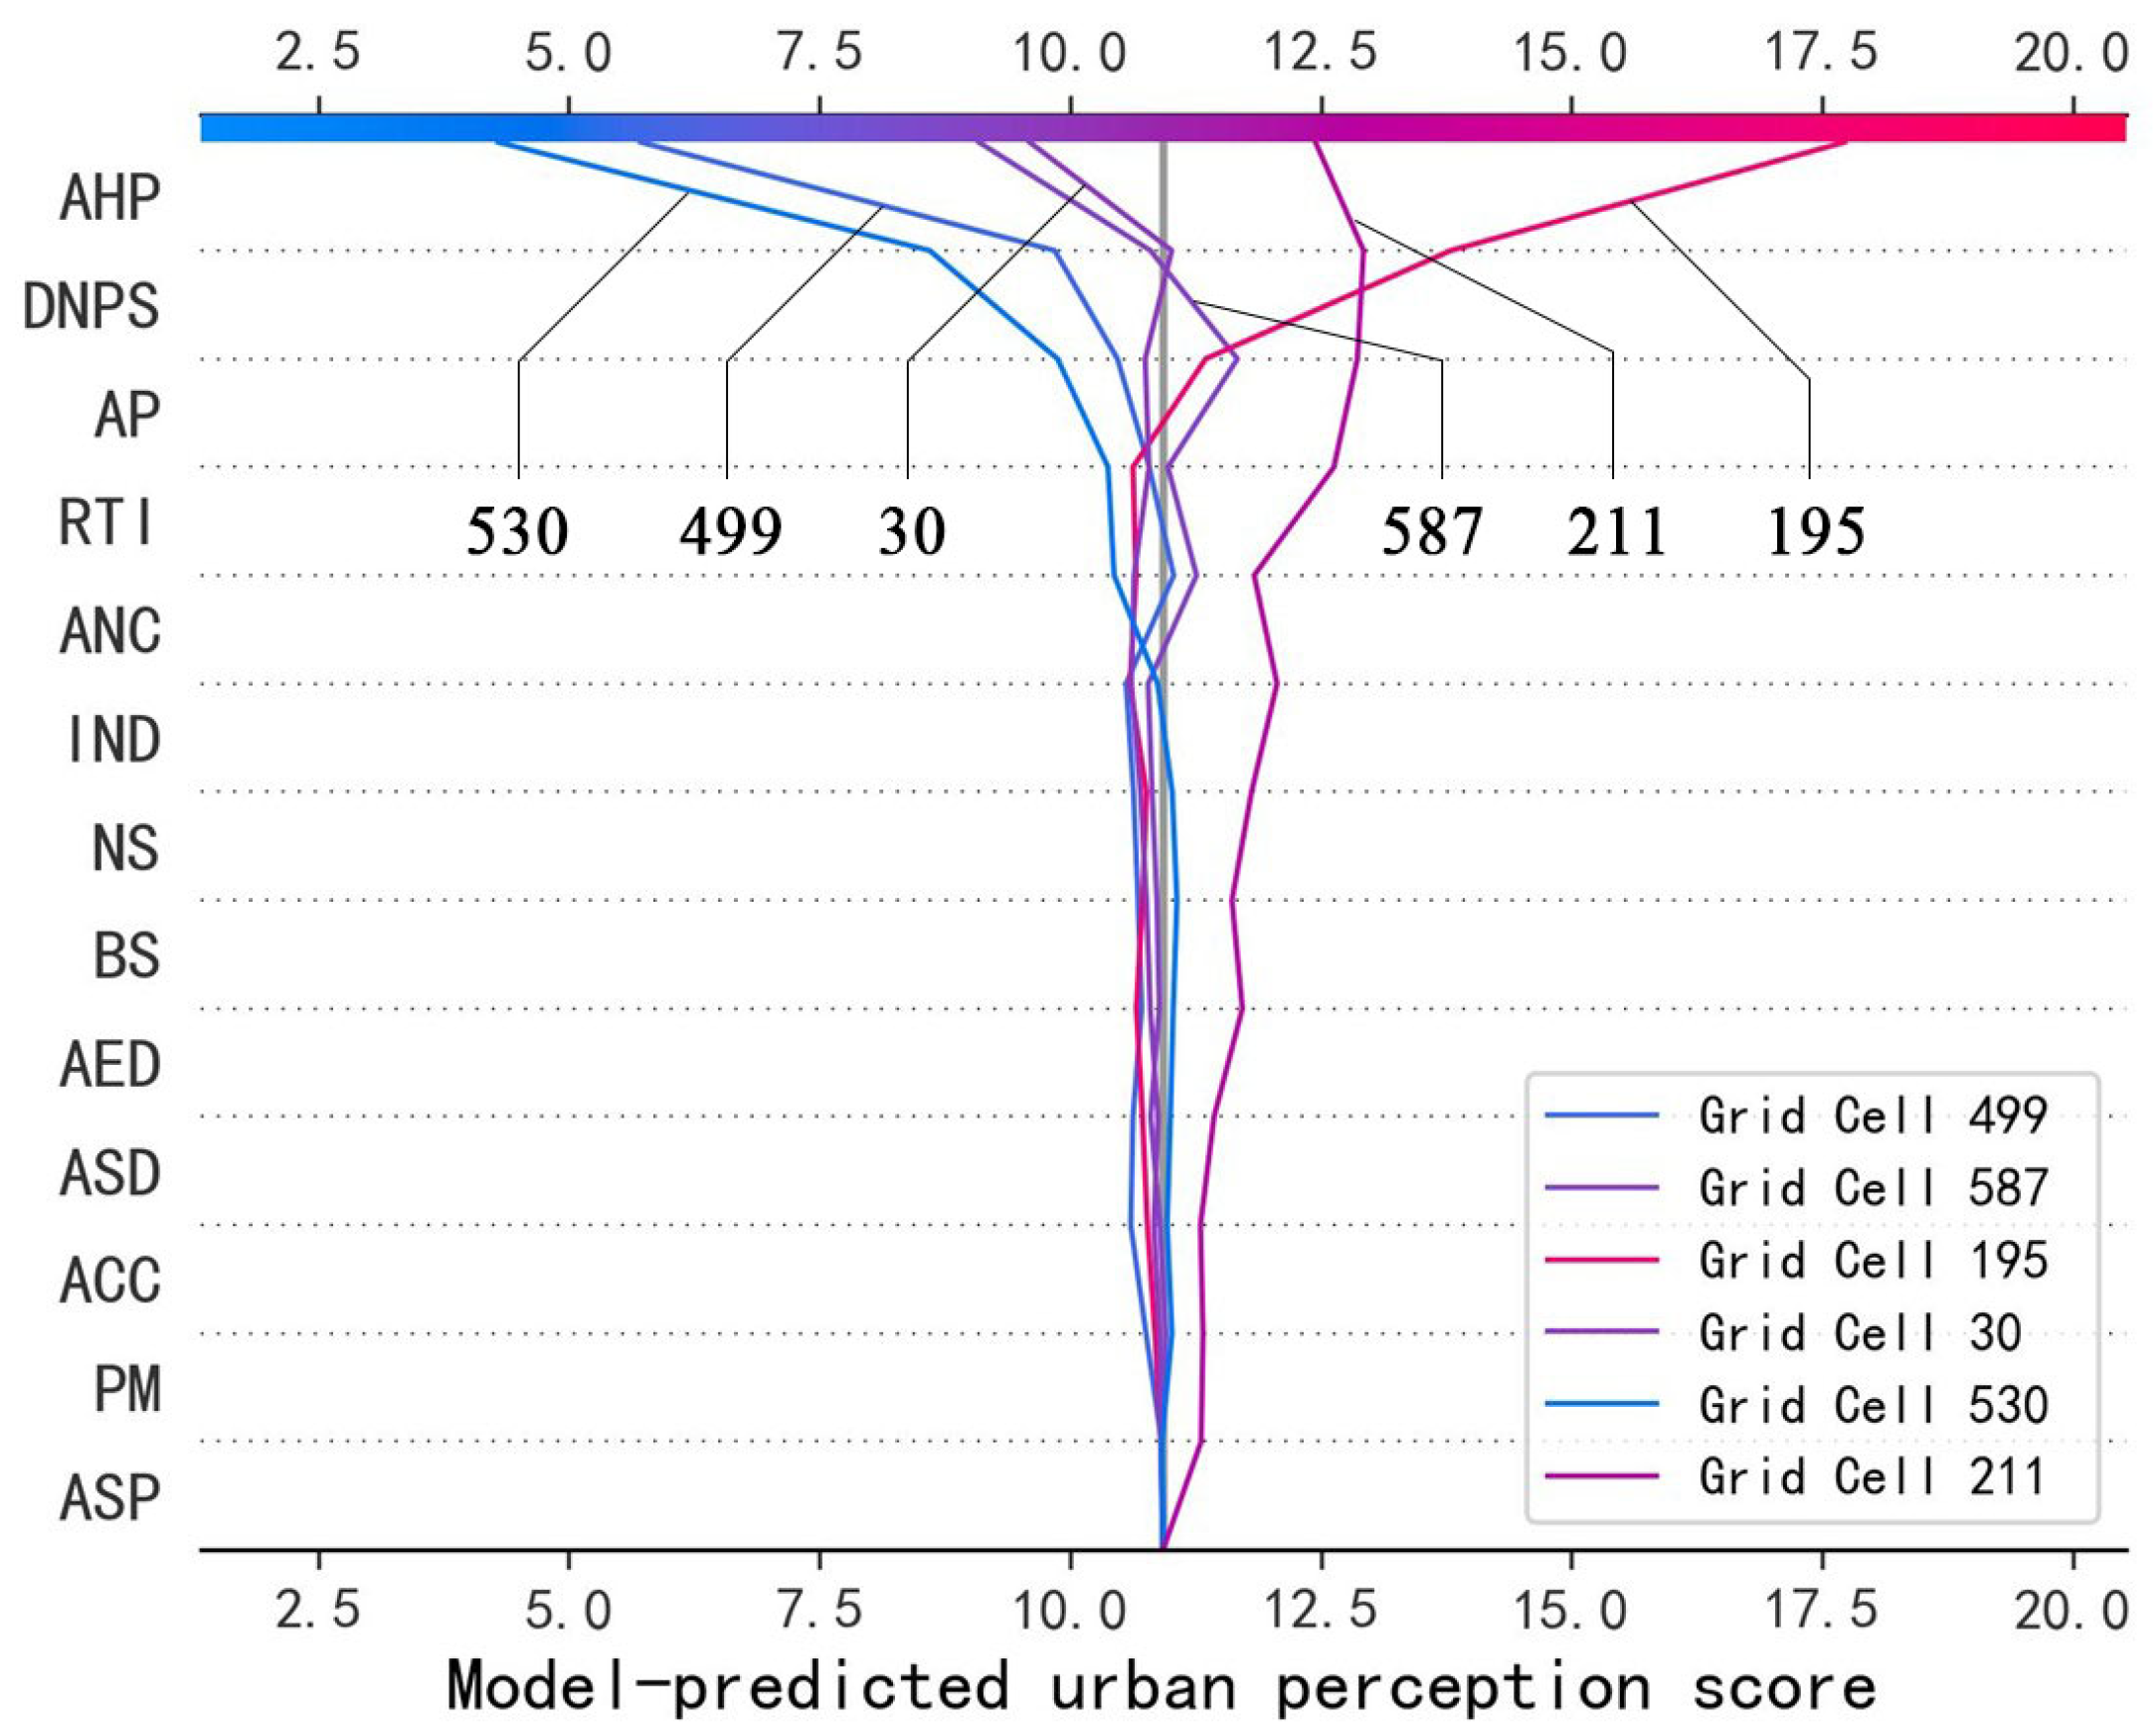
To reveal the local driving factors behind the differences in predicted scores of urban spatial safety hazards across different neighborhoods, this study selected six representative grid cells and conducted local interpretation and analysis of each sample’s prediction results using SHAP values. Specifically, grid cells (No. 30, 195, 211, 499, 530, and 587) were selected, and force plots (
Figure 9) were generated to display only the top eight features with the highest SHAP values for each sample, with feature values retained to three decimal places.
The results indicate that variables such as population density, road traffic intensity, and intersection density generally exert significant positive effects on safety-hazard scores, while factors such as average housing price and the distribution of police stations act as negative constraints in most samples. Moreover, certain visual perception features (e.g., average scene depth, color count, and edge detection) also exert differentiated impacts at the neighborhood level: when streetscapes appear enclosed or cluttered, safety-hazard tendencies are significantly amplified, whereas higher visual openness and environmental cleanliness help mitigate hazards. It is noteworthy that the direction and magnitude of variable effects vary spatially across grid cells. For instance, in densely populated areas, the combined effect of average population and traffic intensity markedly increases safety-hazard levels, whereas in areas with higher housing prices and adequate police coverage, the impact of these adverse factors is substantially diminished. Overall, the local interpretation results confirm the model’s comprehensive sensitivity to built environment and perception indicators, highlighting the dominant role of population, traffic, and physical environment in hazard formation, while also revealing the moderating value of economic level and public safety facilities in risk mitigation. This suggests that the spatial distribution of urban safety hazards is not driven by a single factor, but rather the outcome of interactions among multiple factors, thereby underscoring the importance of differentiated governance and targeted interventions at the micro-spatial scale.
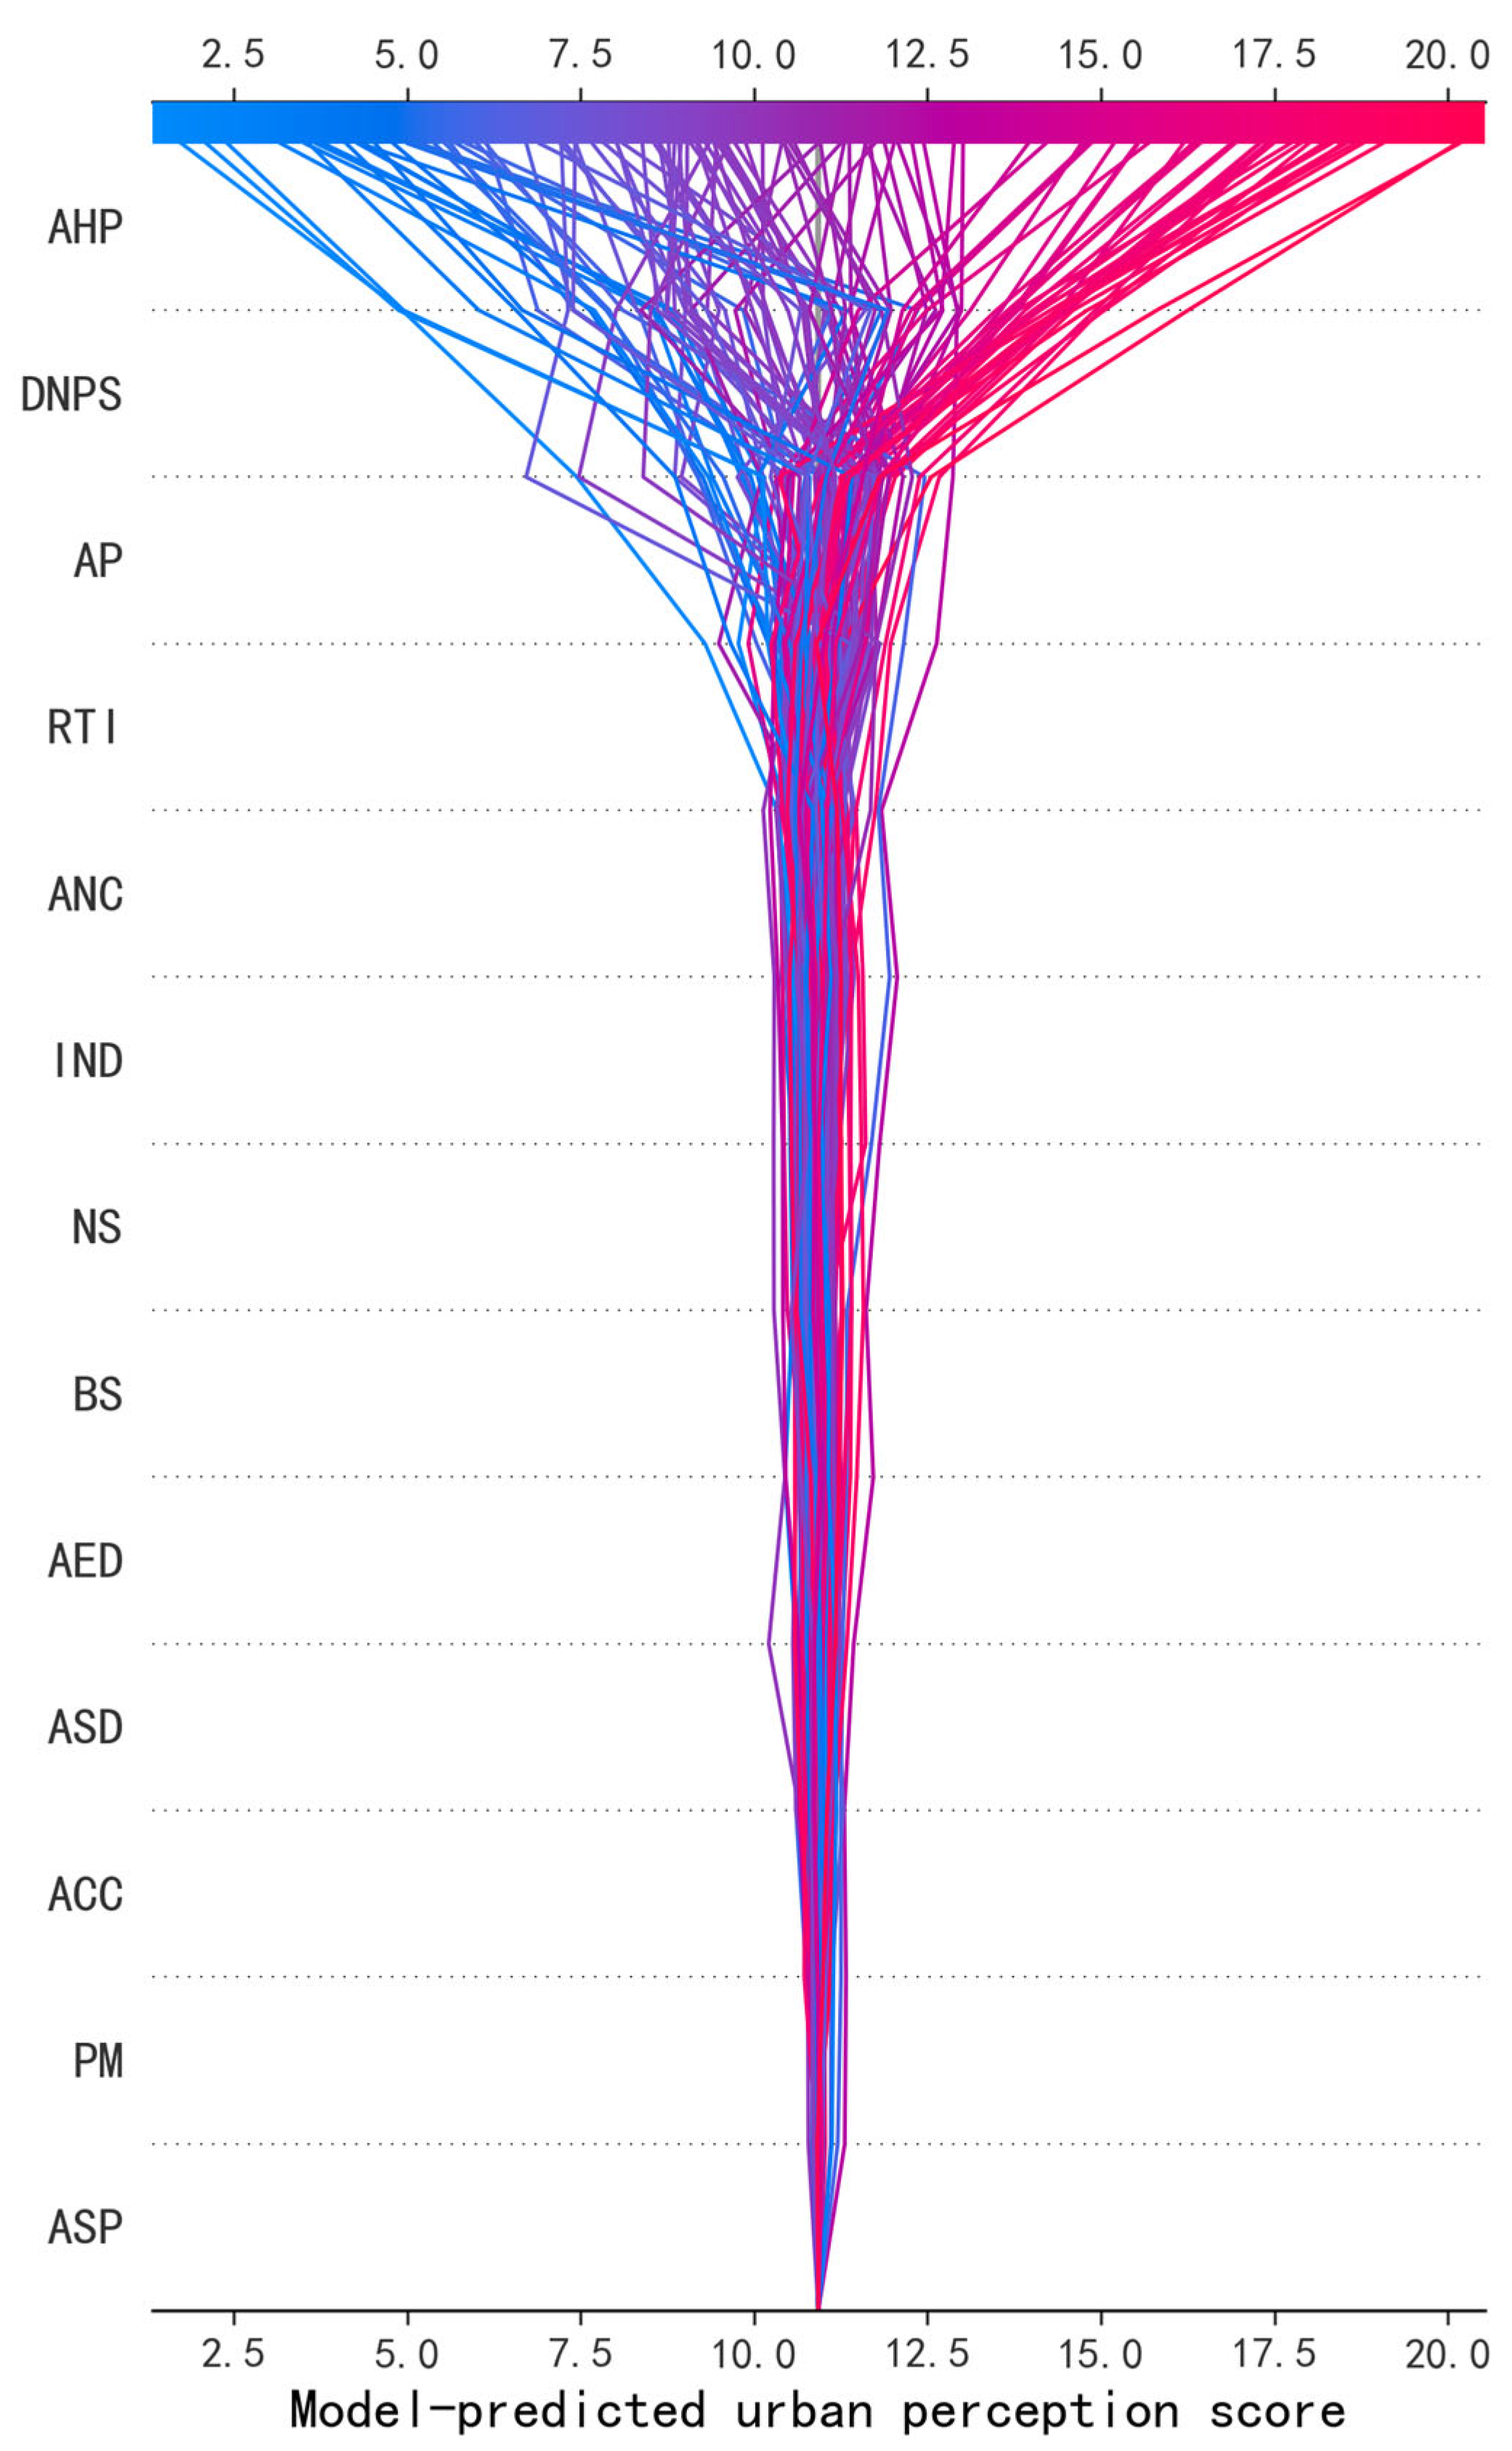
Figure 10 illustrates the SHAP local explanation curves for six representative grid cells, while
Figure 11 presents the SHAP value distribution for all 584 grid cells across the study area. By jointly examining the local and global perspectives, the comparison of feature contribution directions and magnitudes reveals the multiple driving pathways and regional heterogeneity of urban spatial safety hazards.
This analysis underscores the differentiated safety-hazard outcomes associated with built environment characteristics across various types of neighborhoods, thereby providing quantitative evidence to support hazard prevention and spatial governance at the grid-cell scale.
4.5. Interaction Effects Analysis
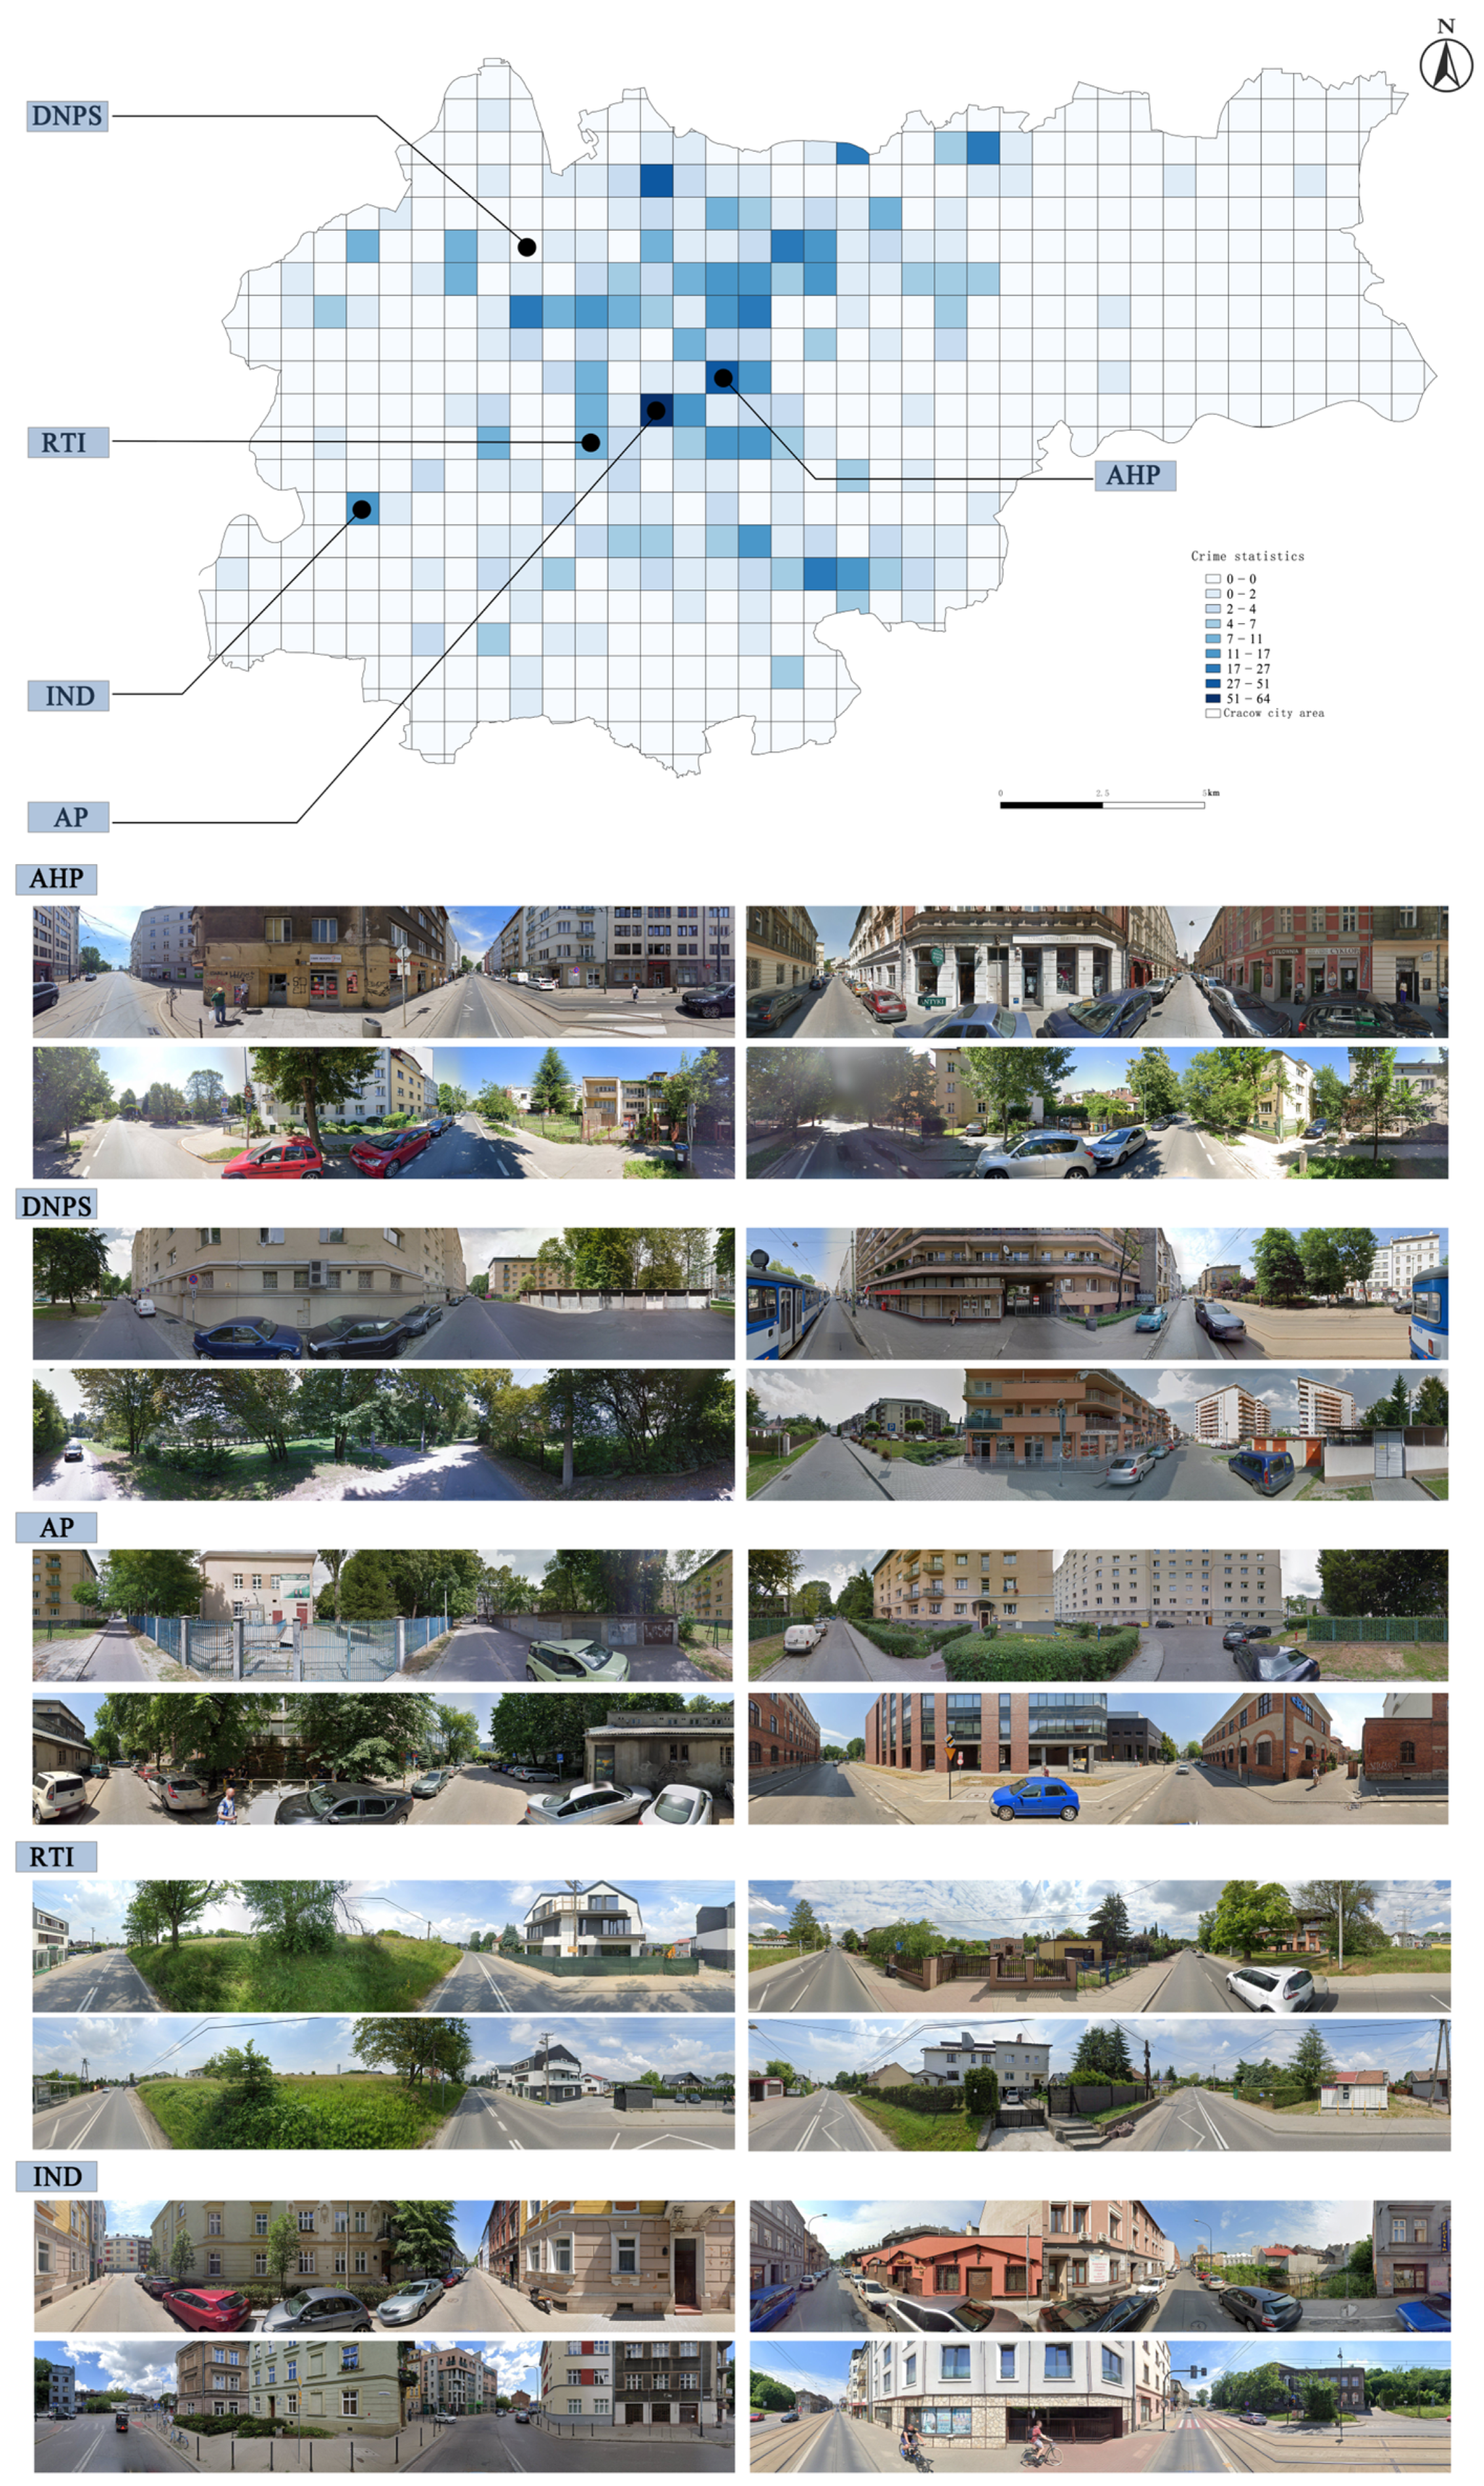
To further enhance the intuitiveness of the interaction effects analysis,
Figure 12 and
Figure 13 present case-based demonstrations of typical 800 m × 800 m grid cells.
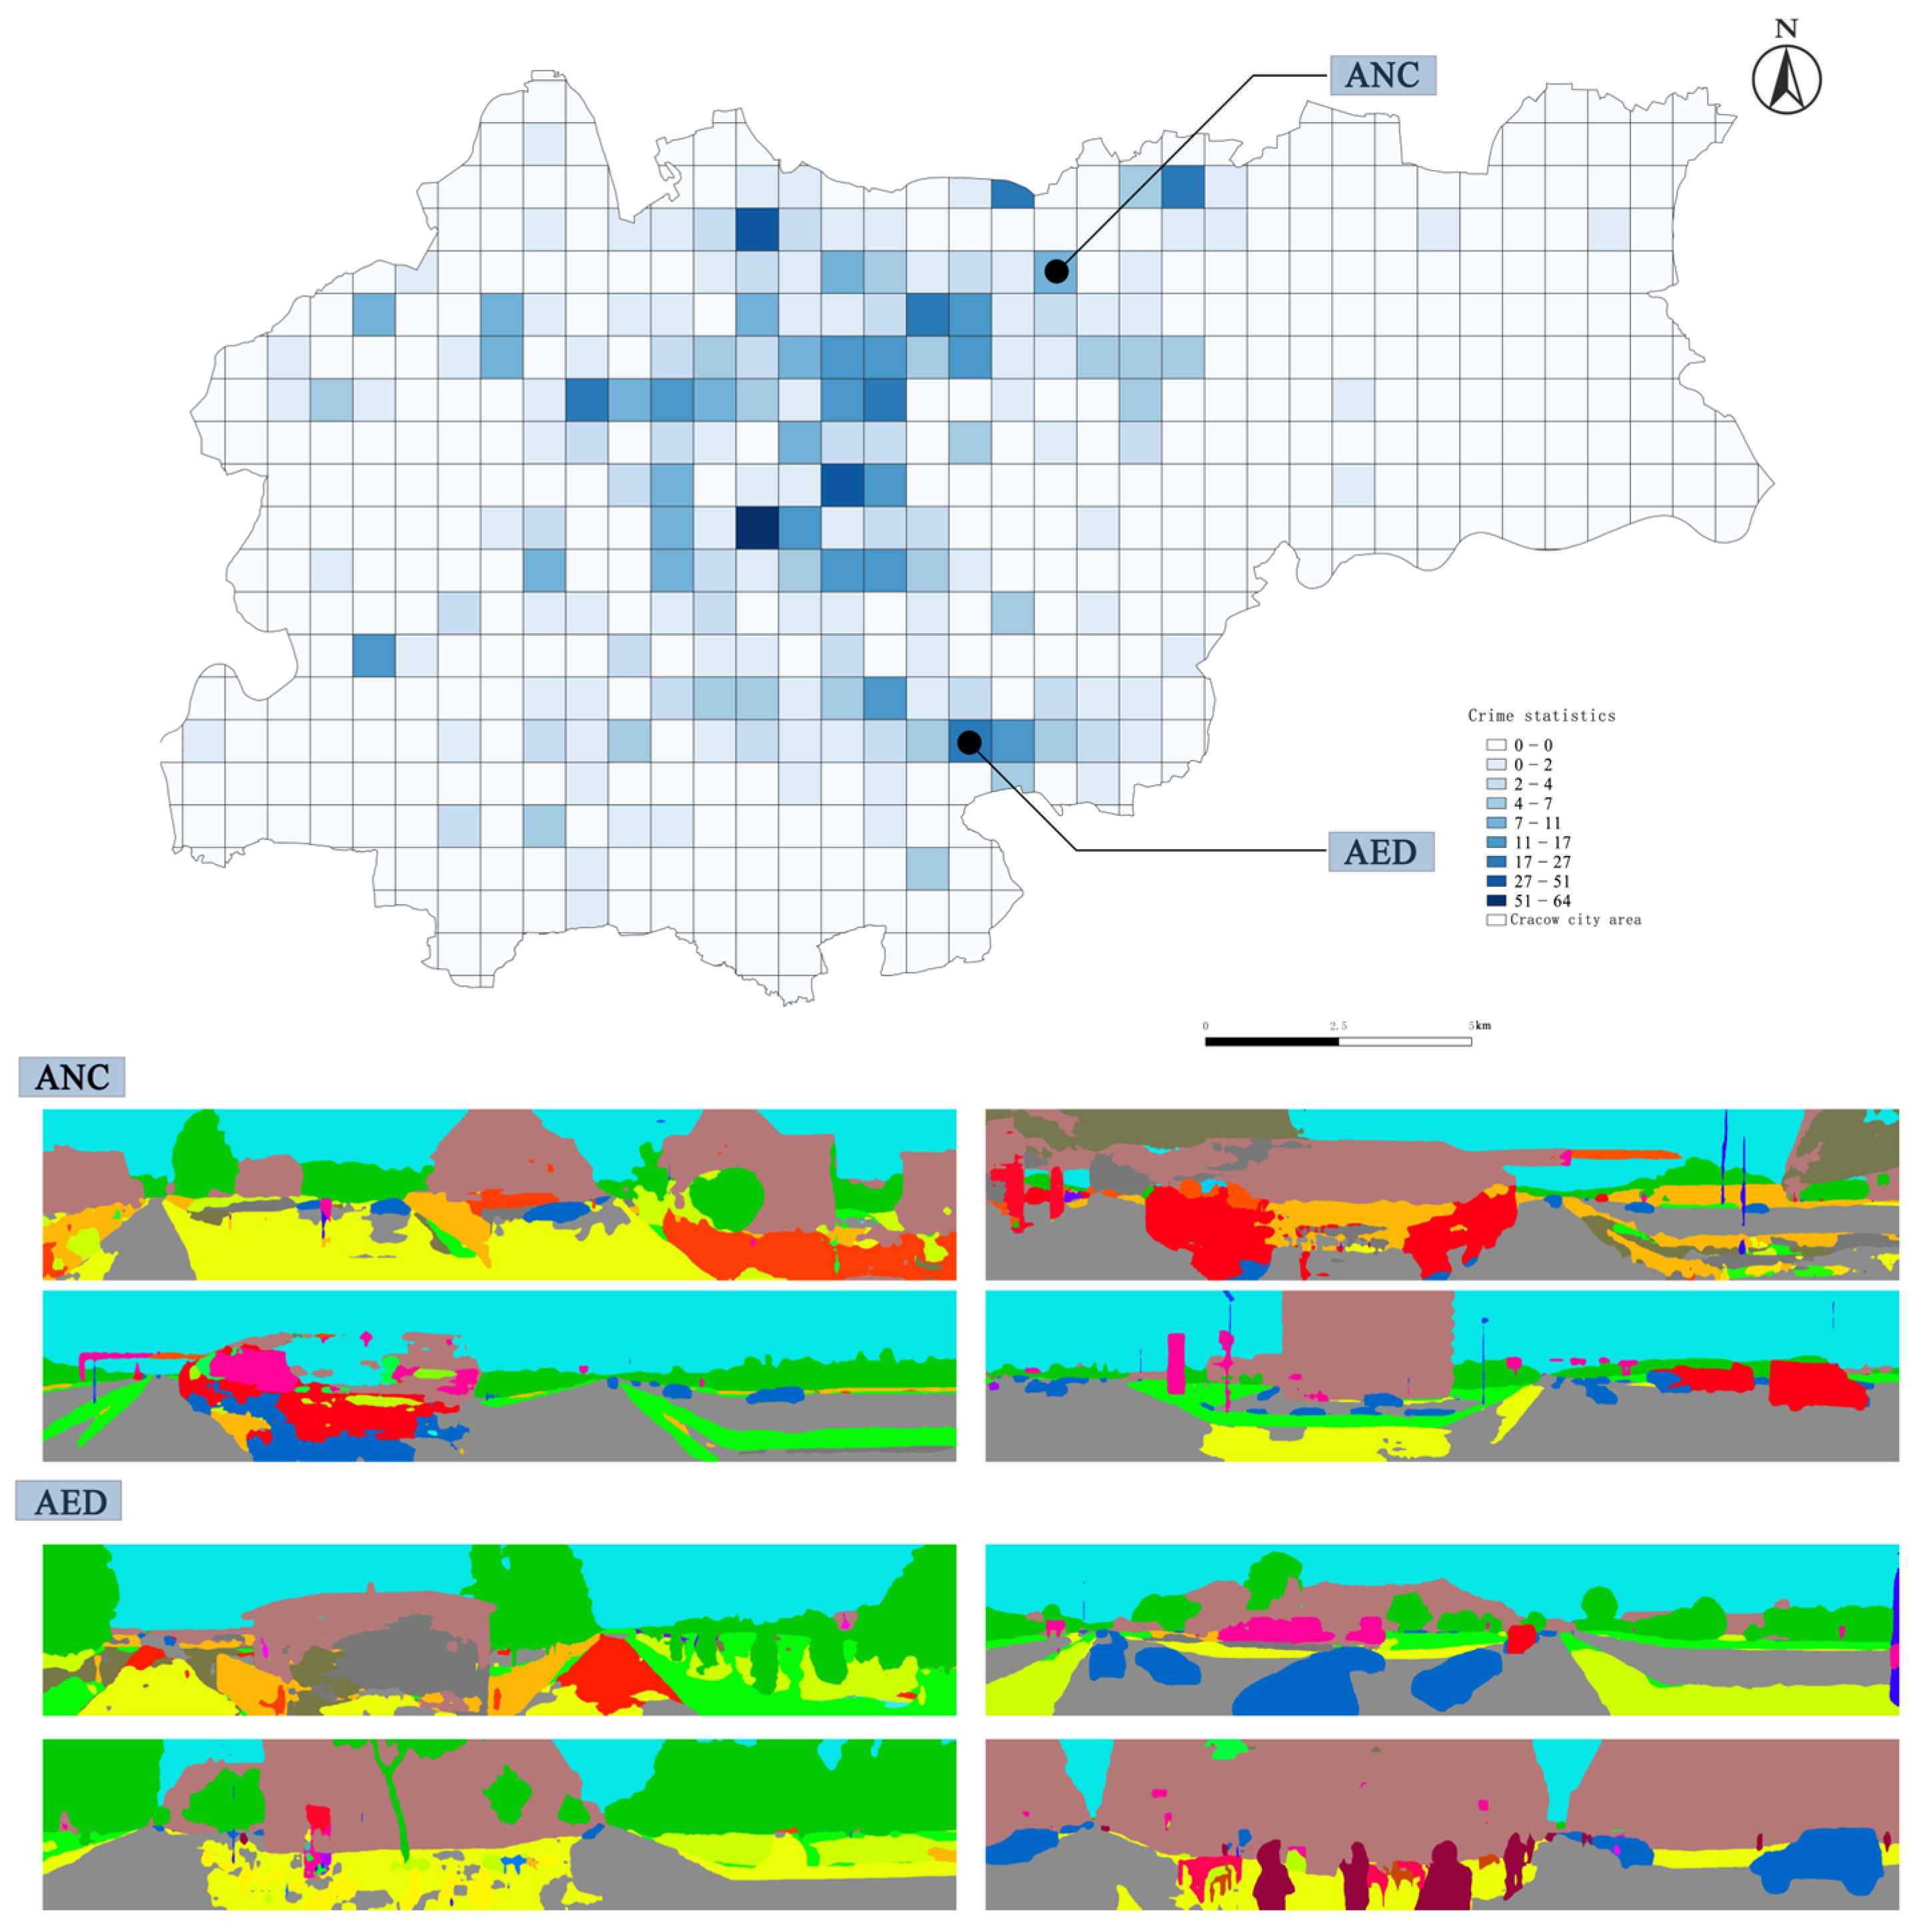
Figure 12 illustrates the spatial distribution of seven core factors identified in the interaction analysis, together with representative street view images of corresponding grid cells. These examples highlight the heterogeneity of built environment features across different urban areas. By visually inspecting the street-level imagery, one can directly observe how elements such as road traffic intensity, intersection density, population density, and average housing price are manifested in spatial patterns, thereby providing perceptual support for the subsequent SHAP-based quantitative interaction analysis.
Figure 13 further deconstructs the representative grid cells through semantic segmentation of street view imagery, illustrating how visual complexity features such as “average color count” and “average edge density” are reflected in real street environments. The results show that differences in the proportions of vegetation, buildings, and roads among grids directly shape the structure of visual information, which in turn produces distinct nonlinear interaction effects in predicting safety hazards. This case-based illustration not only supplements the numerical findings but also helps elucidate the mechanisms by which visual environmental features interact with spatial structural factors.
On this basis,
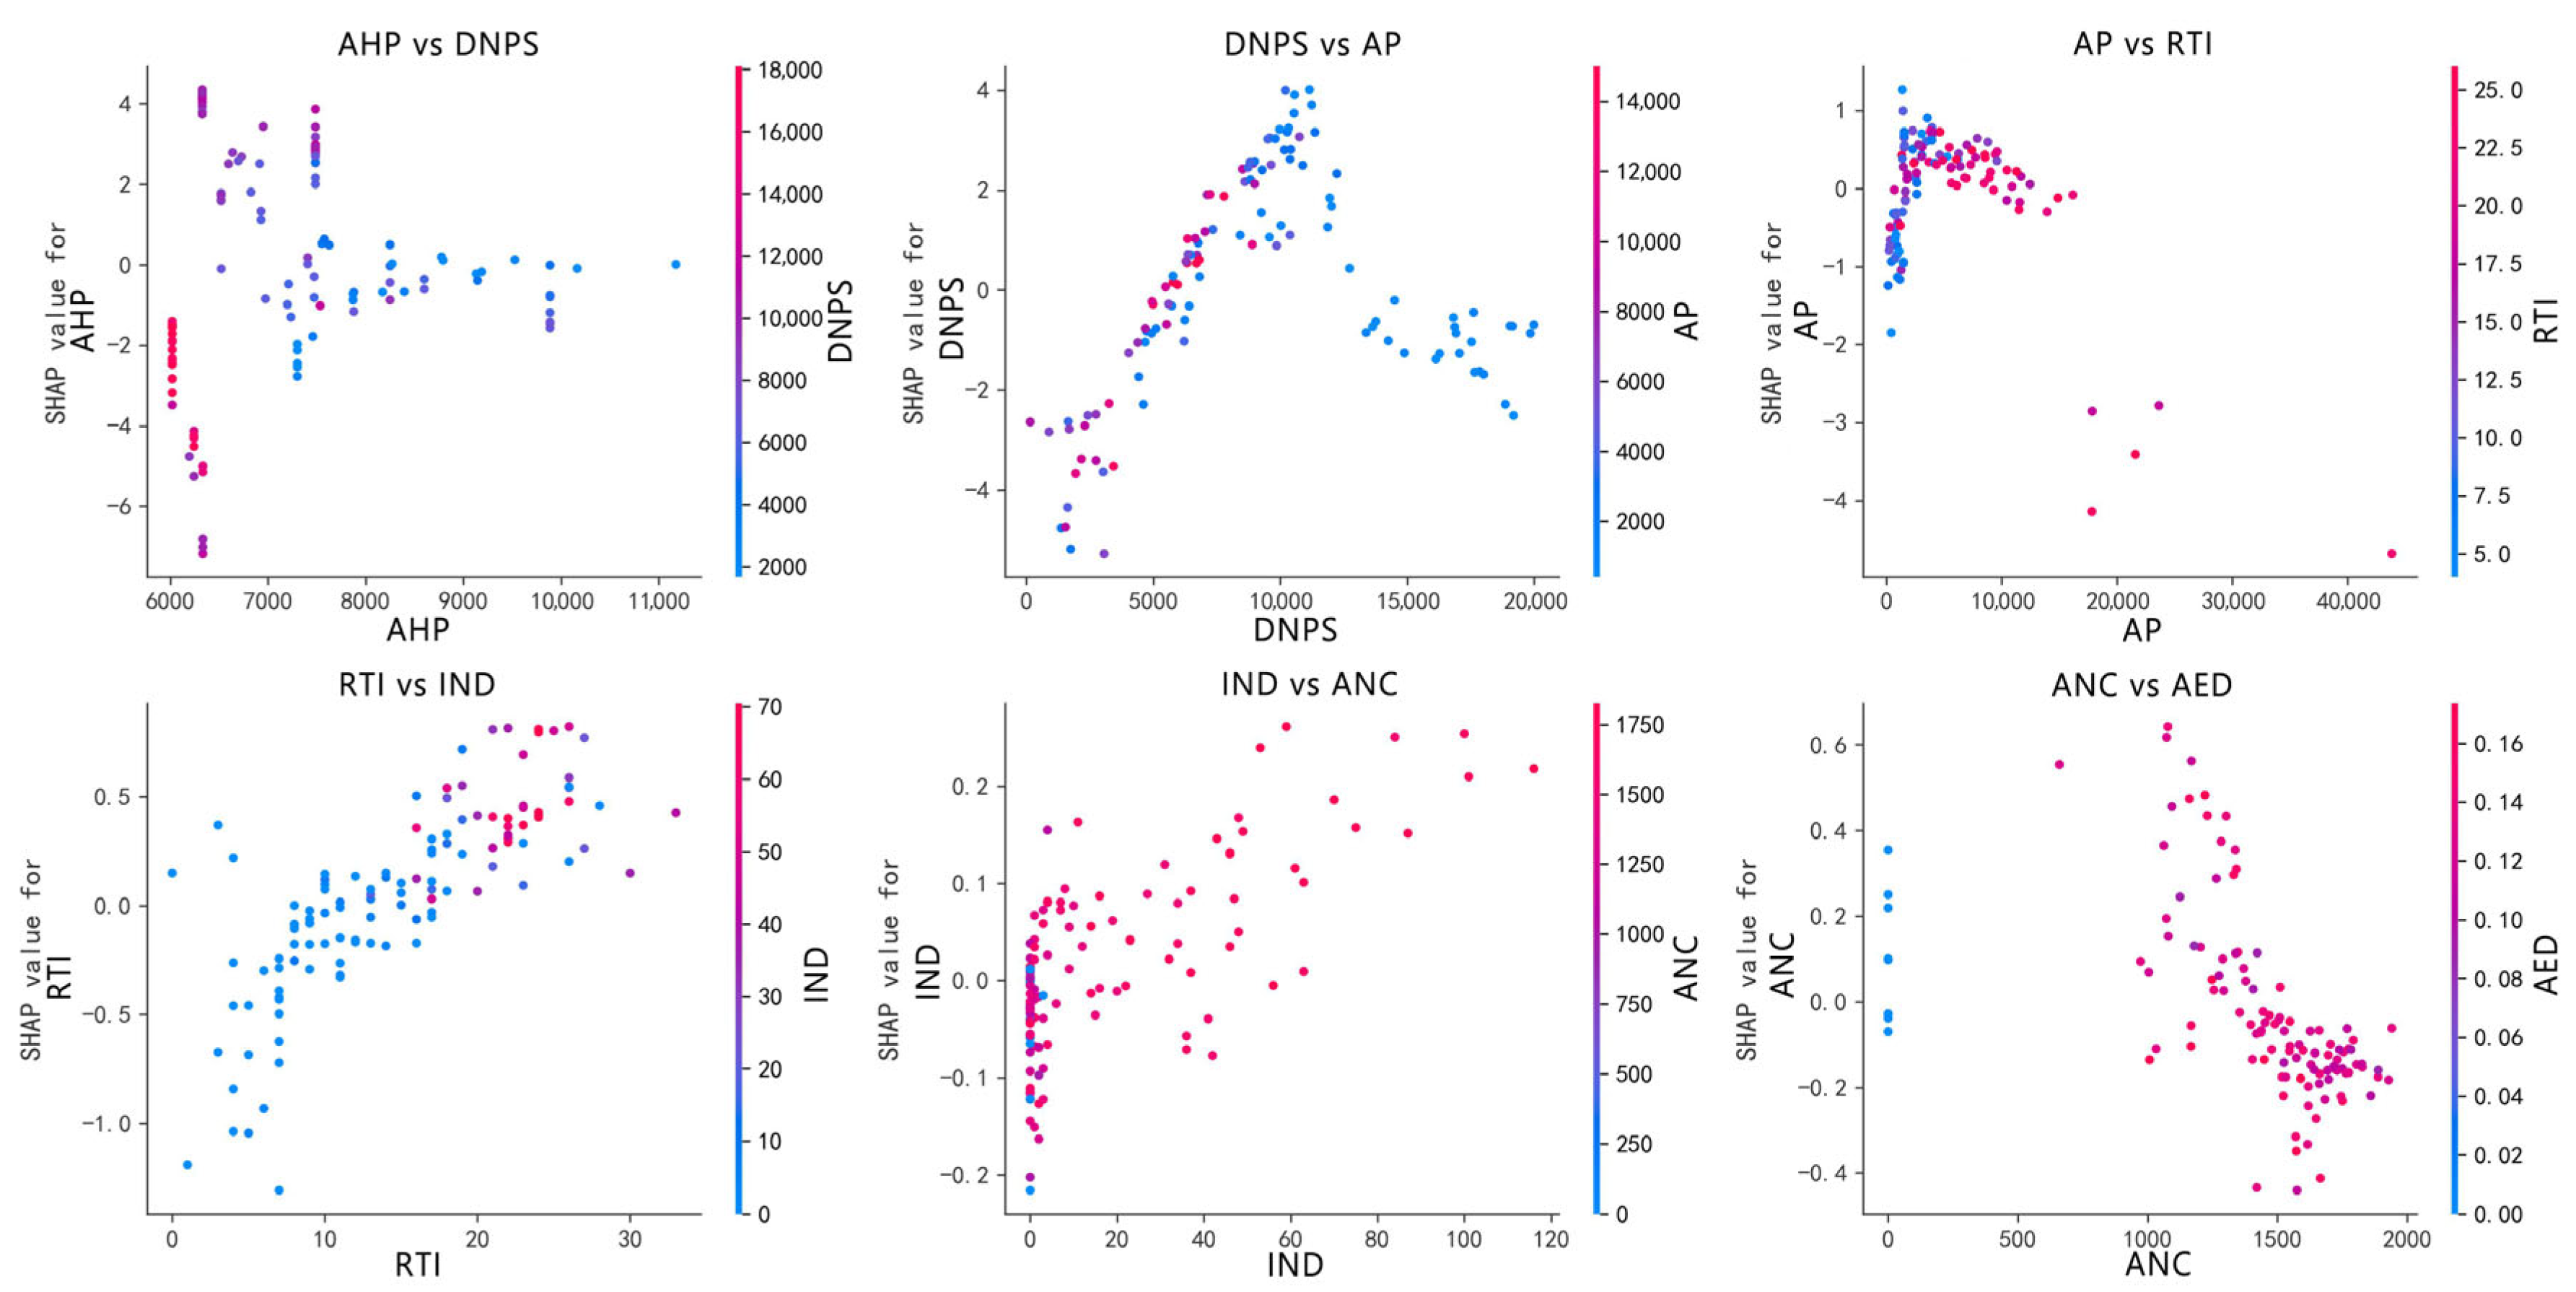
Figure 14 presents SHAP dependence plots for pairwise combinations of key built environment features, visually revealing how synergistic effects and mutual constraints jointly shape safety-hazard predictions at the grid-cell level. Through in-depth analysis of six representative variable interactions, this study identifies a series of characteristic nonlinear coupling patterns.
For the interaction between average housing price and distance to the nearest police station, we find that when housing prices fall within 6000–8000 PLN/m2 and the nearest police station is located within 12 km, SHAP values increase significantly. This indicates that moderately high residential costs, combined with favorable accessibility to policing facilities, jointly enhance residents’ perceived safety in the built environment. Conversely, when housing prices are below 7000 PLN/m2 and policing facilities are far away, SHAP values shift negative, reflecting a marked decline in safety perception.
The interaction between distance to the nearest police station and average population density reveals a collaborative mechanism between spatial accessibility and population concentration. As police-station distance gradually increases within 0–10 km, SHAP values also rise, particularly in areas with a population density greater than 4000 residents, underscoring the importance of policing facilities in densely populated zones. However, when police-station distance exceeds 10 km and population density drops below 4000, SHAP values sharply decline, suggesting that sparsely populated areas rely more heavily on policing service radii.
The third analysis examines average population and road traffic intensity. Within the range of 2000–15,000 residents, SHAP values exhibit an overall positive trend regardless of traffic intensity, peaking at around 4000 residents before gradually leveling off or declining. When population density surpasses 15,000 and traffic intensity falls between 15 and 25, SHAP values decrease to approximately −3 to −4, indicating that the combination of high population density and strong traffic load may exacerbate safety hazards.
For road traffic intensity and intersection density, their synergistic relationship appears as follows: when road traffic does not exceed 10 and the number of intersections is fewer than 20, SHAP values are slightly positive, but the overall impact remains negative. As traffic intensity rises above 15 and intersections reach 20–30, SHAP values approach neutrality. Beyond these thresholds, with further increases in both variables, SHAP values continue to rise, suggesting that a denser traffic network, once a certain threshold is crossed, positively contributes to perceived safety—possibly due to improved traffic order and stronger spatial control.
The interaction between intersection density and average color count shows that when intersections equal zero, an increase in color richness elevates SHAP values slowly from about −0.2 to 0. As intersection density increases simultaneously, when color counts range between 1250 and 1750, SHAP values shift firmly into positive territory, indicating that rich visual landscapes in traffic-node-dense areas help enhance urban safety perception.
The interaction between average color count and average edge-detection value reveals the nonlinear impact of urban visual complexity. When the color count is near zero, edge-detection values exert a slightly positive SHAP contribution. Within the color count range of 1000–1500, edge-detection values clustering around 0.08–0.16 significantly boost SHAP values in a positive direction. However, as the color count exceeds 1500, SHAP values gradually turn negative, suggesting that overly complex or visually overloaded streetscapes may induce discomfort, thereby weakening residents’ sense of safety.
In sum, the SHAP dependence plots systematically uncover the nonlinear structural effects of the built environment on safety-hazard predictions. Housing costs, policing accessibility, and population density collectively form the foundational core of safety perception, while traffic density, street intersections, and visual features exhibit strong enhancing or suppressing effects under different thresholds. These interaction patterns not only reflect the dynamic coupling and nonlinear characteristics of urban variables but also emphasize that the “intermediate ranges” of feature values are often the critical nodes where synergistic benefits emerge.
This implies that reducing urban safety hazards should not rely solely on maximizing a single dimension, but rather on achieving organic coordination and structural balance across multiple built-environment factors. The findings provide a data-driven, scientific basis for urban governance and spatial design, supporting the implementation of fine-grained and multi-scalar strategies for optimizing urban safety.
This chapter, through feature-importance evaluation, two-dimensional partial dependence analysis, global and local SHAP interpretability, and interaction-effect analysis, systematically reveals the multidimensional mechanisms by which built-environment factors influence the prediction of urban safety-hazard predictions. The results demonstrate that average housing price, distance to the nearest police station, and average population density serve as the core driving factors of safety hazards; meanwhile, transportation structures and visual landscapes also exert important synergistic effects under specific conditions, with particularly notable benefits emerging within intermediate threshold ranges. These findings not only enrich the understanding of the spatial mechanisms underlying safety-hazard distribution but also provide valuable data support for policy formulation and planning interventions.
5. Discussion
5.1. Summary of Findings
This study demonstrates that urban safety hazards are not determined by a single factor but by the joint influence of multiple dimensions, including economic attributes, security accessibility, population density, transportation structures, and visual environments. Among these, average housing price, distance to the nearest police station, and average population density emerged as the most critical variables.
PDP and SHAP interaction analyses revealed that optimal safety perception often occurs within moderate thresholds. For example, “moderate traffic flow + high intersection density,” “medium-to-high housing price + moderate police coverage,” and “rich color + moderate texture complexity” produced strong positive effects. Extreme conditions, by contrast—such as high flow with low connectivity, high housing cost with distant policing, or high density with congestion—reduced safety perception and showed diminishing or negative marginal effects.
Although visual perception variables ranked lower in global importance, they contributed synergistic gains in specific ranges, reflecting the multidimensional and nonlinear nature of urban safety mechanisms.
Despite variations in the causes and outcomes of the analyzed safety hazards, the findings hold clear practical significance. By identifying shared spatial patterns and threshold effects—such as the impacts of population density, policing accessibility, and traffic intensity—this study demonstrates that diverse urban risks are shaped by a limited set of built-environment determinants. These results provide policymakers with generalizable, evidence-based principles to formulate integrated strategies that can simultaneously mitigate multiple safety hazards, thereby enhancing urban resilience and sustainability.
5.2. Policy Implications for Urban Development
While each category of safety hazard has distinct characteristics, their spatial distributions are governed by common environmental mechanisms. Policymakers therefore need not treat each hazard type in isolation; instead, they can regulate shared structural conditions—for example, improving police accessibility in high-density zones or optimizing traffic management in congested areas—to simultaneously reduce diverse safety risks.
Unlike earlier studies that focused on isolated variables, our results highlight the importance of dynamic coupling and nonlinear interactions across dimensions. For policymakers, this implies that extreme one-dimensional interventions may not always be effective. Instead, balanced, coordinated, and threshold-oriented strategies are required. For instance, prioritizing police deployment in high-population areas is more impactful than in low-density zones; increasing intersection density is effective in moderate-to-high traffic contexts but less so in extreme conditions. Streetscape design should aim for richness without visual overload, ensuring a sense of comfort and order.
Moreover, SHAP enhances model transparency and interpretability, enabling both experts and non-experts to understand variable contributions to safety-hazard evaluation and facilitating data-driven, evidence-based policy design.
Finally, these insights underscore that urban safety serves as a cornerstone of sustainable development. Improving perceived safety reinforces the social, economic, and environmental pillars of sustainability—strengthening community cohesion, attracting investment, and promoting environmentally sound design. Thus, effective safety-hazard governance contributes directly to the triple bottom line of sustainability and should be embedded in broader urban development strategies.
5.3. Methodological Contributions
This study contributes methodologically in several ways:
By integrating economic, demographic, transportation, and visual features, it breaks away from single-source data limitations in safety-hazard evaluation.
By combining XGBoost with SHAP, it achieves both predictive accuracy and interpretability, capturing nonlinear interactions while clarifying variable effects on urban safety risks.
By applying 2D PDP and SHAP interaction plots, it identifies cooperative mechanisms and threshold effects, offering quantifiable references for spatial governance of safety hazards.
These methods provide scalable tools not only for macro-level planning but also for micro-level safety-hazard governance.
5.4. Limitations and Future Work
Several limitations remain. First, NSTM crowdsourced data may suffer from reporting bias, as perceived safety depends on individual cognition and digital access. Second, safety-hazard measurement relies on model-based predictions rather than large-scale resident surveys, suggesting a need for cross-validation with subjective data sources such as questionnaires or social media. Third, while our feature set covers economic, demographic, transport, and visual dimensions, it omits certain socio-demographic and cultural variables that may also play an important role in shaping safety perceptions, such as the share of migrants, religiosity, residents’ income levels, and the average age of the population. The absence of these variables is primarily due to current data limitations, but we are in communication with Statistics Poland to obtain access for future integration. Finally, though XGBoost with SHAP provides strong interpretability, different algorithms may yield variations. Future work could explore interpretable deep learning models or causal inference approaches. Overall, this study lays a methodological foundation for modeling urban safety hazards, while highlighting the need for more dynamic, integrated, and multi-method approaches to enhance policy relevance and to support sustainable urban development.
5.5. Ethical Considerations
The use of crowdsourced data and machine learning in urban safety-hazard research raises important ethical concerns. First, privacy and data protection must be safeguarded, as georeferenced reports may inadvertently reveal sensitive information about individuals or communities. Anonymization, data aggregation, and strict compliance with data protection regulations (e.g., GDPR in the European context) are essential to mitigate these risks. Second, crowdsourced data often reflect uneven participation, with disadvantaged groups potentially underrepresented due to limited digital access. This raises concerns of algorithmic bias, whereby safety-hazard governance strategies could unintentionally privilege certain populations while neglecting others. Third, the interpretability of machine learning models, while advanced by SHAP, must be communicated responsibly to non-expert stakeholders to avoid misinterpretation or overreliance on safety-hazard predictions. Addressing these ethical challenges requires transparency in data use, inclusivity in data collection, and accountability in applying predictive models for policy decisions.
6. Conclusions
Based on multi-source built environment data, this study constructed and validated an urban safety hazard evaluation model integrating XGBoost and SHAP interpretability analysis. From dimensions of economic attributes, policing accessibility, population density, transportation structures, and visual landscapes, it systematically identified the key drivers of safety hazards and their nonlinear interactions.
The results show that average housing price, distance to the nearest police station, and average population density are the core determinants of safety-hazard variation. Importantly, many variables exhibited cooperative effects within mid-range thresholds—such as moderate traffic with high intersection density or high housing value with sufficient police coverage—indicating that hazards can be reduced most effectively through balanced interventions rather than extreme one-dimensional policies.
This research demonstrates that combining machine learning with interpretability analysis enables fine-grained, transparent assessment of the built environment–safety relationship. The findings not only enrich theoretical understanding of urban safety mechanisms but also provide quantitative, actionable guidance for governance and spatial planning.
In practice, the proposed approach offers feasible pathways for policymakers to design targeted interventions and optimize resource allocation under limited budgets. Beyond safety-hazard governance, the framework also highlights the potential of integrating crowdsourced data with explainable AI in broader urban research fields. Taken together, the study underscores that urban safety is a core dimension of sustainable urban development, directly linking the findings to the mission of Sustainability and contributing to data-driven, people-centered urban governance.
Despite the diversity of safety hazards examined, the integrative analytical framework proposed in this study captures their underlying commonalities, providing a transferable and generalizable tool for evidence-based urban safety-hazard management.
Viewed through the lens of sustainability, urban safety emerges as a cornerstone of sustainable urban development—enhancing social trust, improving residents’ well-being, and strengthening urban resilience. By embedding explainable machine learning within the sustainable city framework, the study contributes to the broader vision of creating inclusive, resilient, and sustainable urban environments, as outlined in the United Nations Sustainable Development Goal 11.
