Article

Renewable Energy Transition and Sustainable Economic Growth in South Asia: Insights from the CO2 Emissions Policy Threshold

by
Mustapha Mukhtar
1,*,†,
Idris Abdullahi Abdulqadir
1,2,*,† and
Hassan Sani Abubakar
3
1
School of Economics and Management, Guangdong University of Petrochemical Technology, Maoming 525000, China
2
Department of Economics and Development Studies, Federal University Dutse, Ibrahim Aliyu Bye-Pass, Dutse 7156, Jigawa State, Nigeria
3
School of Physics, University of Electronic Science and Technology of China—UESTC, Chengdu 611731, China
*
Authors to whom correspondence should be addressed.
These authors contributed equally to this work.
Sustainability 2025, 17(20), 9289; https://doi.org/10.3390/su17209289
Submission received: 28 August 2025 / Revised: 25 September 2025 / Accepted: 13 October 2025 / Published: 19 October 2025
(This article belongs to the Topic CO2 Capture and Renewable Energy, 2nd Edition)

Abstract

This article examines the asymmetric effects of renewable energy on sustainable economic growth across six South Asian countries from 2000 to 2023, employing panel data and threshold regression analysis. The findings indicate that CO2 emissions must remain below a threshold of 2.38% to support the integration of renewable energy with sustainable growth. Furthermore, access to clean energy and technologies should exceed 3.38%, and urbanization must be managed at a complementary threshold of 3.21%. These results are consistent with various studies investigating the renewable energy transition’s economic impacts globally. It is recommended that South Asia focus on reducing CO2 emissions below the identified threshold, enhancing clean energy access and innovation above the designated thresholds, and supporting urban growth as part of its policy initiatives. Such actions are essential for fostering economic growth and ensuring the sustainability of the region. The study recommends that the South Asian region take decisive steps to reduce CO2 emissions and enhance access to clean energy while accommodating urban population growth. It highlights the importance of transitioning to renewable energy to stimulate economic growth and maintain trade and foreign direct investment (FDI) as a viable part of the gross domestic product. The study suggests that investments in Gross Capital Formation (GCF), trade, and FDI will yield long-term benefits, although short-term policy adjustments may disrupt resource allocation and hinder economic and renewable energy development. Future research should explore the complex interactions between CO2 emissions, clean energy access, FDI, and trade, particularly in light of recent trade policies, including U.S. tariffs. Investigating these relationships through advanced methodologies, such as machine learning, could provide valuable insights into drivers of renewable energy transition and economic outcomes.

1. Introduction

The world has witnessed the accelerated transition to renewable energy and environmental sustainability, but this development has been a mirage for South Asian economies for decades [1,2,3]. However, the renewable energy transition involves shifting from traditional non-renewable energy to renewable energy like hydropower, biomass, geothermal, wind, and solar, driven by rapid transformation and increasing energy security. Conversely, the region’s energy system is still underdeveloped, with traditional fuels, such as coal, accounting for approximately 44% of all energy generation in South Asia, except for India’s recent renewable energy transition landmark [3]. According to the International Energy Agency (IEA) report for 2025, it was revealed that global energy demand in 2024 grew by 2.2%, exceeding the energy supply for all energy generated [4]. Furthermore, the report also revealed that the growth in energy-related emissions continues to rise, resulting from global economic growth. This effect has resulted in rising urbanization and increasing energy demand in general, and across South Asian economies in particular, thereby putting more pressure on energy infrastructure. The global increase in carbon dioxide emissions (CO2) has influenced the recent record of global high temperatures. However, a topic on the CO2 emission policy threshold to renewables will be a momentous debate to explore.
Recently, President Donald Trump’s tariff policies have exacerbated the challenges, as the policy affects Indian’s imports of natural gas (uncompetitive pricing resulted in putting gas out of the power mix), leaving the economy with economic loss from unutilized gas-fired power plants. Perhaps Trump’s announcement can motivate the governments of these countries to pursue a transition to renewable energy consumption. The fundamental question to ask is whether renewable energy transitions have the potential to promote sustainable growth in South Asian countries. Qudrat-Ullah [1] discovered the comparative and integrated analysis of green energy transition and environmental sustainability in South Asian countries. The study also proposes various policy options and strategies to improve green energy and environmental policies in South Asia, including the establishment of a coherent policy framework, the enhancement of regional cooperation and collaboration, the utilization of information technology and data analytics, the prioritization of sustainability and resilience, and the engagement with diverse stakeholders and partners. Murshed et al. [2] unveiled the impact of trade and tourism development on the pathways of transition to renewable energy infrastructures in South Asian economies. The findings from the panel data from econometric studies, which addressed cross-sectional dependency and slope heterogeneity, indicated that increased intra-regional trade among South Asian economies positively influences the International Inbound Tourism Demand (IITD) in South Asia. Similarly, Rana and Gróf [5] found strong evidence of the transition from traditional fuels to the new renewable energy in South Asian countries. The study proposes long-term planning for renewable energy development, taking into account the diversified population and dispersed geographical locations, while addressing all important issues. Noor et al. [6] discovered the impact of renewable and non-renewable energy on sustainable development in South Asian countries using autoregressive distributed lag (ARDL) models over the period 1995–2019. Their findings revealed a long-term relationship between energies and sustainable development in South Asia.
In another strand of the literature, Zeb et al. [7] uncovered the impact of renewable energy on deteriorating ecological footprints using a panel quantile regression approach on South Asian countries over the period 1991 to 2022. Their finding revealed that renewable energy worsens the ecological footprint in the short run, while in the medium to long term, it intensifies. Miao et al. [8] uncovered the impact of fossil fuels as not only harming sustainable growth but also exhibiting negative spatial spillover effects on panel data of South Asian countries over the period 2000–2020. Rahman et al. [9] unveiled the effect of population growth and economic growth on renewable energy and environmental sustainability using the STIRPAT model on panel data of South Asian countries over the period 1972–2021. While GDP has a substantial long-term impact, population and GDP have a beneficial but short-term impact on South Asian countries. Additionally, the study found that burning fossil fuels contributes greatly to the level of gas emissions in the atmosphere. Furthermore, nuclear and renewable energy contribute significantly to the reduction of pollution in South Asian nations. Hassan et al. [10] revealed the influence of urbanization and trade openness on renewable energy consumption in South Asia using panel data from 1990 to 2018. Their findings revealed cointegration and long-term linkages among the variables, while renewable energy consumption improves the environmental quality. Zulfiqar et al. [11] uncovered the impact of FDI and innovation on renewable energy in South Asian countries using Fully Modified and Dynamic Ordinary Least Squares models on panel data over the period 2000 to 2021. The study highlights the important roles that green energy production, green technological innovation, and financial development play in assessing the quality of the environment throughout South Asia. Given the divergent views presented above, it is worthwhile to investigate the renewable energy transition and sustainable growth in South Asian countries.
Considering studies beyond South Asian countries, Triki et al. [12] discovered the link between renewable energy transition and sustainable development of the Ha’il region using time series analysis from 2002 to 2023. According to the findings, these three SDGs (SDG7, SDG12, and SDG13) are essential to the Ha’il region’s sustainable development. Raihan et al. [13] unveiled the impact of FDI and globalization on the renewable consumption in Mexico using time series analysis spanning from 1970 to 2022. According to the study, Mexico’s carbon emissions rise by 1.05% and 1.41% over the long term and by 1.81% and 1.85% over the short term for every 1% increase in GDP and energy use. Rather, a 1% increase in foreign direct investment and globalization has a positive impact on Mexico’s ecosystem level by lowering carbon emissions by 0.5% and 0.03% over the long term, while falling by 0.28% and 0.01% over the short term. Wang et al. [14] uncovered the impact of renewable energy, urbanization, and trade on CO2 emissions and economic growth in a panel of 122 countries over the period 1998 to 2018. According to the study, urbanization boosts economic growth in all income levels while raising carbon emissions in all but high-income nations. While the use of renewable energy reduces carbon emissions and stimulates economic growth, industrialization raises both of these factors. Imran et al. [15] found strong evidence of energy consumption, resource curse, and economic development in Brazil, Russia, India, China, and South Africa (BRICS) countries over the period from 1991 to 2022. Their results show that non-renewable energy use and carbon emissions both have a pronouncedly favorable impact on both short- and long-term economic growth in the BRICS countries. The impact of non-renewable energy consumption is very noticeable. Chen et al. [16] uncovered the nexus between green finance, renewable energy, and sustainable tourism using panel data from 30 provinces in China from 2005–2023. According to their study, renewable energy and green finance greatly increase tourism, which lowers medical costs and carbon emissions. The findings also demonstrate a strong correlation between the expansion of tourism-related activities and technological innovation. Additionally, the panel causality analysis demonstrates that the variables under study have robust bidirectional causal relationships. It is apparent and glaring to observe that the impact of the renewable energy consumption on economic growth has diverged beyond the South Asian economies.
Conversely, the renewable energy consumption does affect South Asian sustainable growth. Whether this impact was observed or not, it would not provide policymakers and economists with appropriate policy tools unless they prescribe an inflection point in the nexuses investigated. In this article, we have found overwhelming evidence of the presence of an inflection point along the nexus between renewable energy consumption on sustainable economic growth in South Asian countries using a dynamic threshold regression approach and a gap in the literature. Considering the literature gap, the study presents the testable hypotheses supporting the major study findings as follows:
Hypothesis 1: 
The level of renewable energy consumption plays a significant role in promoting sustainable economic growth in South Asia.
Hypothesis 2: 
When the impact of the CO2 emissions level is below or above a certain threshold, its effect on the renewable energy consumption in South Asia may change from positive to negative or vice versa.
Hypothesis 3: 
When the impact of access to clean energy and technology is below or above a certain threshold, its effect on the renewable energy consumption in South Asia may change from positive to negative or vice versa.
Hypothesis 4: 
When the impact of urban population growth is below or above a certain threshold, its effect on the renewable energy consumption in South Asia may change from positive to negative or vice versa.
The novelty of this study stems from its departure from the perspective advanced in the above debate by employing two-regime structural equation threshold analysis. It is pertinent to observe that the present study is not the same as the previous studies in terms of views, perspectives, periodicity, and methods, considering the nexus between renewable energy transition and sustainable economic growth in South Asian economies.
The topic is still open to further debate, as the theme has not received the exhaustive scholarly attention it deserves and has limited coverage in the literature. The objective of this study is to explore the asymmetric effect of CO2 emissions, access to clean energy, and urbanization on the nexus between renewable energy consumption and economic growth in South Asian countries. Next, the data and empirical strategy supporting the findings of this article are presented in the forthcoming section.

2. Data and Methods

2.1. The Data

This study utilizes panel data on South Asian countries (including Bangladesh, Bhutan, India, Maldives, Nepal, and Sri Lanka) spanning from 2000 to 2023, sourced from the World Bank Development Indicators (WDI) [17]. A detailed description of all variables is provided in Appendix A Table A1.

2.2. Definition of Variables

2.2.1. Dependent Variable

Economic growth (growth). The study utilized an annual growth rate of gross domestic product, an indicator of the dependent variable.

2.2.2. Independent Variable

Renewable energy (renewable energy use). The study employs renewable energy consumption as the share of renewable energy in total final energy consumption as an independent variable. The choice of this variable was motivated by the literature [5,9,11].

2.2.3. Threshold Variable

The study utilized the following variables as threshold variables supported by the literature gap and hypothesis development: Carbon dioxide (CO2) emissions (total) excluding LULUCF (Mt CO2e), access to clean fuels and technologies for cooking share of population, and urban population percentage of people living in urban areas [18,19].

2.2.4. Control Variable

The specific control variables include trade share of GDP (TOP), foreign direct investment net inflow share of GDP (FDI), gross capital formation share of GDP (GCF), and labor force participation rate as a percentage of total population ages 15–64 (LFP). These variables are supported by the previous studies [2,11,19].

2.3. Model Specification

To examine the premise of the testable hypotheses, the study investigates the asymmetric effect of the renewable energy consumption on sustainable economic growth in South Asian countries over the period 2000–2023. The study utilized panel data with a model specified as follows.
g r o w t h i t = α 0 + α 1 r e n e w a b l e i t + k = 1 n α k c o n t r o l i t + u i t
where t denotes year; α 0 denotes constant; [ α 1 , α j ] denote estimated coefficients; and u i t random term. Introducing the threshold investigation in the pertinent model above, we employ the threshold effect test following the approach in Hansen [20], Shi and Shi [18,19,21,22] to build a two-regime structural equation in the threshold variable of interest. g r o w t h i t = θ 1 x i t + u 1 i t   if   q t γ θ 2 x i t + u 2 i t   if   q t > γ . The model is specified as follows.
g r o w t h i t = β 0 +   β 1 r e n e w a b l e i t I ( e m i s s i o n s i t γ 1 ) + I ( e m i s s i o n s i t > γ 2 ) +   k = 1 n β k c o n t r o l i t + μ i t
where β 0 denotes constant; [ β 1 , β k ] denote estimated coefficients; and μ i t random term.
g r o w t h i t = ϕ 0 +   ϕ 1 r e n e w a b l e i t I ( a c c e s s i t γ 1 ) + I ( a c c e s s i t > γ 2 ) +   k = 1 n ϕ k c o n t r o l i t + μ i t
where ϕ 0 denotes constant; [ ϕ 1 , ϕ k ] denote estimated coefficients; below the threshold, γ 1 , while above the threshold, γ 2 and μ i t , denote random term.
g r o w t h i t = ψ 0 +   ψ 1 r e n e w a b l e i t I ( u r b a n i z a t i o n i t γ 1 ) + I ( u r b a n i z a t i o n i t > γ 2 ) +   k = 1 n ψ k c o n t r o l i t + μ i t
where ψ 0 denotes constant; [ ψ 1 , ψ k ] denote estimated coefficients; below the threshold, γ 1 , while above the threshold, γ 2 and u t , denote random term.
Equally, the models (1–4) presented above are utilized as an empirical strategy modeling the nexuses between renewable energy consumption and sustainable growth in South Asia. The next subsection will present the results from the above testable empirical models.

3. Results

Considering the structure of the hypothesis and the models discussed in the preceding sections, this section will explore and present the major findings therein. First, we present the preliminary data analysis to address the statistical prerequisite. Second, we present the short- and long-run analysis. Third, we present the benchmark models’ results of the dynamic panel threshold effect test and threshold estimation, respectively.

3.1. Stylized Facts

Figure 1 presents the visualization of the economic growth outcome variables. The quintile distribution of economic growth revealed the highest and lowest quintile distribution within the framework of the mean, maximum, and minimum distributive statistics in our sample panel data of South Asian economies. A glossary looks at the box, and the whisker plot of renewable energy consumption shows the spread of the distributions with Bhutan and Nepal belonging to the highest quintile distribution in renewable energy potentials, followed by Sri Lanka, then Bangladesh and India, while the least is the Maldives. On the other hand, the spread of renewable energy compared to the economic growth revealed that India has the highest growth potential, followed by Bangladesh, then Sri Lanka, and others, as renewable energy transformation comes along with an economic cost. This insinuation makes economic sense in light of India’s recent renewable energy transition landmark.
Conversely, access to clean energy and technology boxplot of the quintile distribution revealed the spread of access to clean energy across the region. There is a presence of outliers in the observations; the presence of an outlier may likely distort the exact structure of the distributions. Meanwhile, the carbon emissions boxplot shows India has the highest quintile distribution, and Bhutan comes in with the lowest quintile distribution of CO2 emissions, a question that calls for a significant policy threshold.

3.2. Preliminary Data Analysis

Descriptive Statistics

Table 1 Panel A shows the renewable energy consumption and sustainable economic growth in South Asian countries. The trend presentation was strongly supported by their estimated means and standard deviations [3.334; 24.293] and [2.368; 1.412], respectively. Similarly, other variables also exhibit parallel trends as CO2 emissions, access, urbanization, and FDI have mean and standard deviations [2.745; 3.725; 3.302, & 3.972] and [2.617; 1.139; 0.328, & 0.955], respectively. The mean and standard deviations of trade, GCF, and LFP are [3.380; 3.380; 4.000] and [1.553; 1.553; 0.157], respectively.
In Table 1, Panel B, the pairwise correlation test results revealed a negative and significant correlation between sustainability, renewable energy, labor force, and urbanization, and a positive and significant correlation between CO2 emissions, trade, FDI, and GCF, respectively.
Table 2 presents the Im, Pesaran, and Shin. [23] panel unit root test. The results from the unit root tests revealed that all variables are integrated of order one I (I), while only FDI and GCF are level stationary.

3.3. Benchmark Model: Threshold Effect Tests and Estimations

Following the existing literature by Shi and Shi [21], Abdulqadir [18], Almulhim [24] Zeb et al. [7] and Hansen [20], this section will focus on the primary objective of the article by investigating the asymmetric/threshold effect of CO2 emissions along the nexus between renewable energy consumption and sustainable growth in South Asian countries.
In Table 3, the threshold effect test for CO2 emissions alongside other complementary variables is presented. It is observed that there is strong evidence of a significant threshold effect test on the following variables: CO2 emissions [CO2 = 2.38%], access to clean energy [Access = 3.37%], and urbanization [urban = 3.21%], respectively.
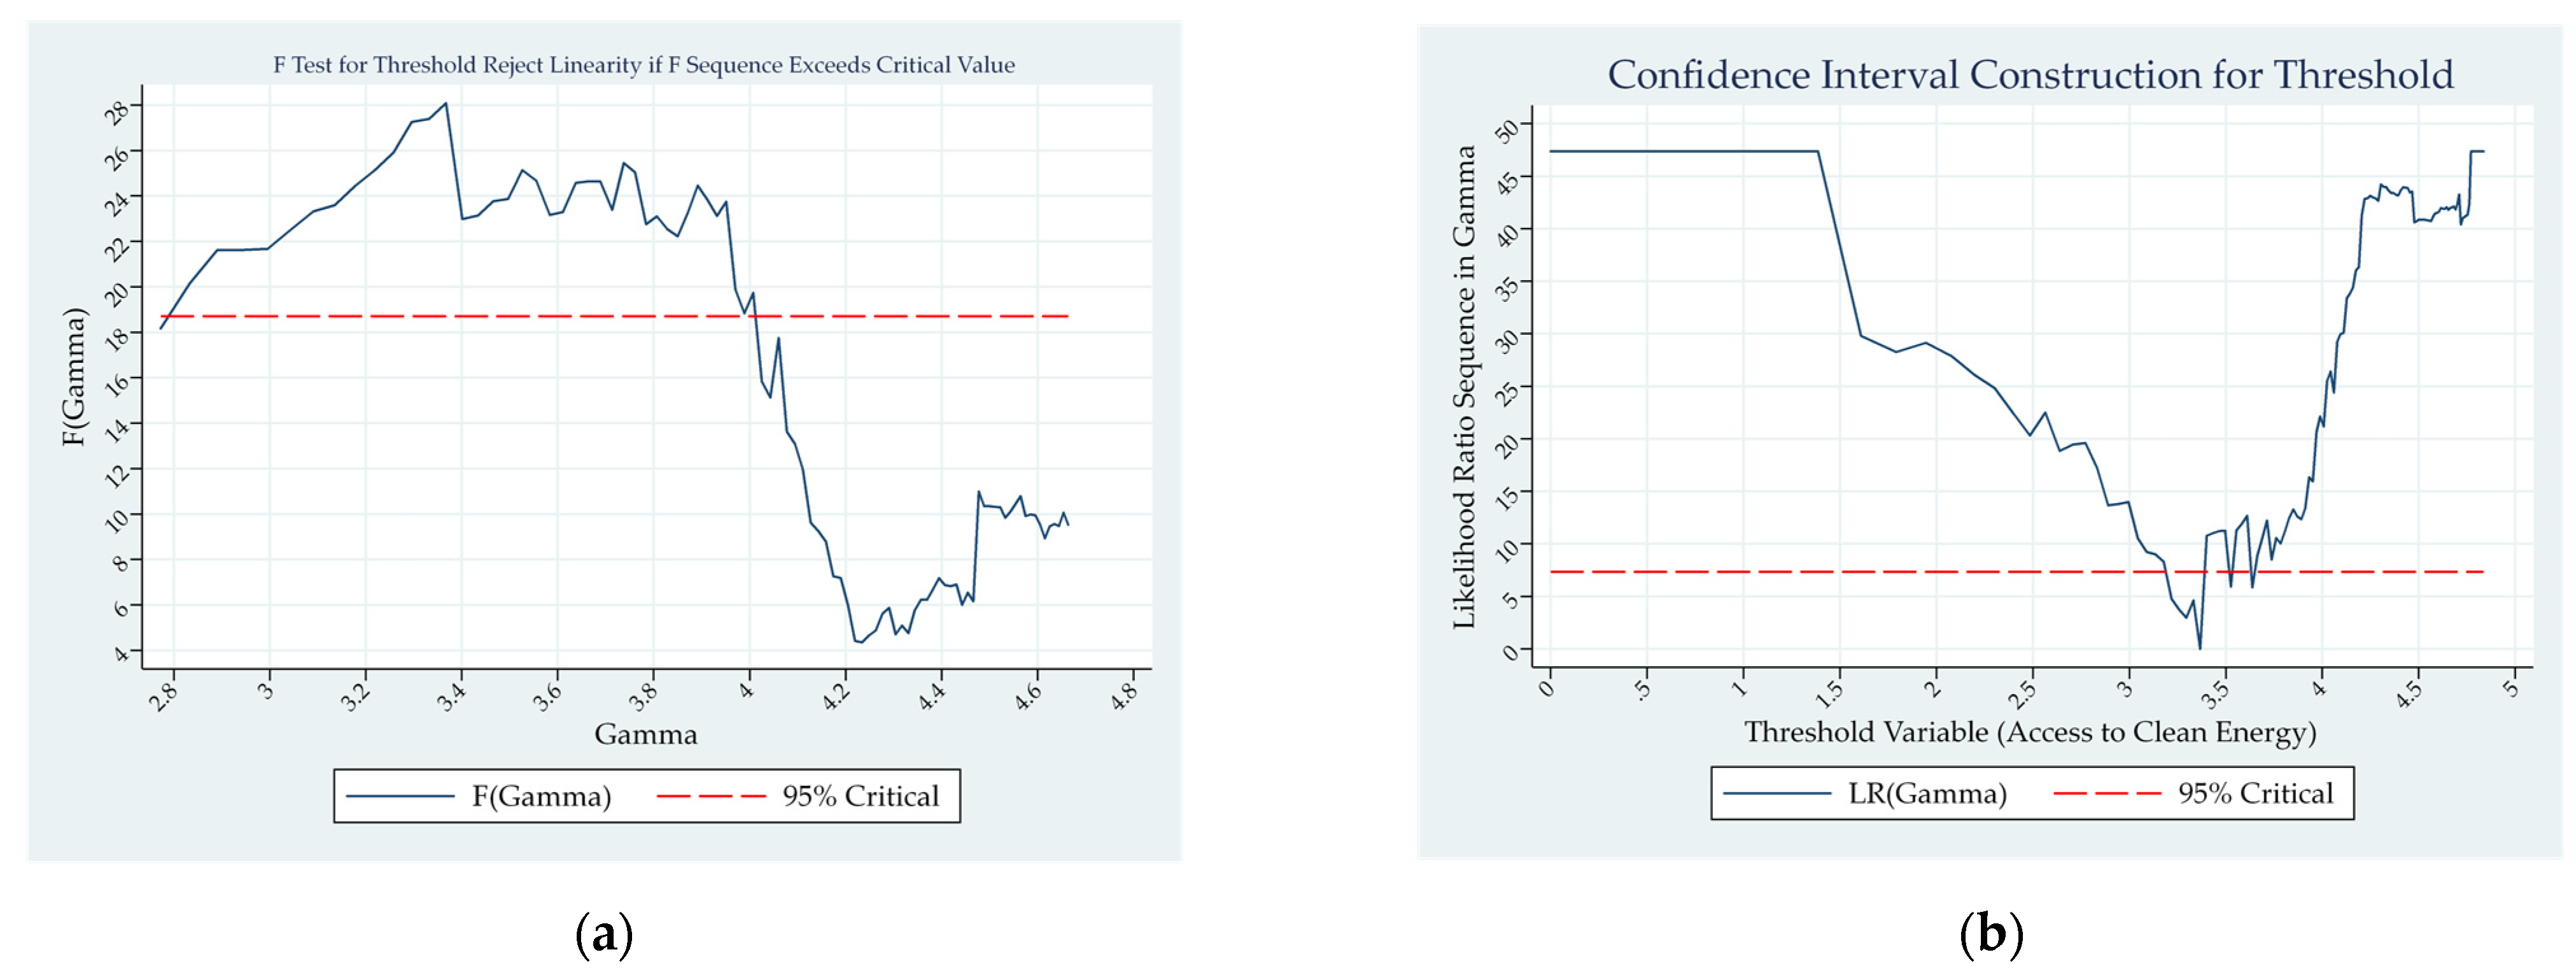
Considering the level of CO2 emissions as a threshold variable, its impact on the level of renewable energy development can either be negative or positive on the dependent variable, economic growth. In this study, the result from the threshold effect test revealed the existence of a significant threshold estimate of [CO2 = 2.38%]. Table 4, Panel A, presents the threshold impact estimations of the variables at regime 1 (below the threshold) and regime 2 (above the threshold), respectively. Below the threshold, the impact of renewable energy consumption on South Asian countries is negative and statistically significant at −0.164, and the impact further declines to a negative and statistically significant −0.217 above the threshold at 1% level (Figure 2b).
The critical mass of access to clean energy and innovation is considered as a threshold variable. Its impact on the level of renewable energy transition can either be negative or positive on economic growth. In this study, the result from the threshold effect test revealed the existence of a significant threshold estimate of [Access = 3.37%]. In Table 4, panel B presents the threshold impact estimations of the variables at regime 1 (below the threshold) and regime 2 (above the threshold), respectively. Below the threshold, the impact of access to clean energy and innovation is positive 0.062 and not statistically significant, while the impact changes to a negative and statistically significant −0.112 above the threshold at 1% level (Figure 3b).
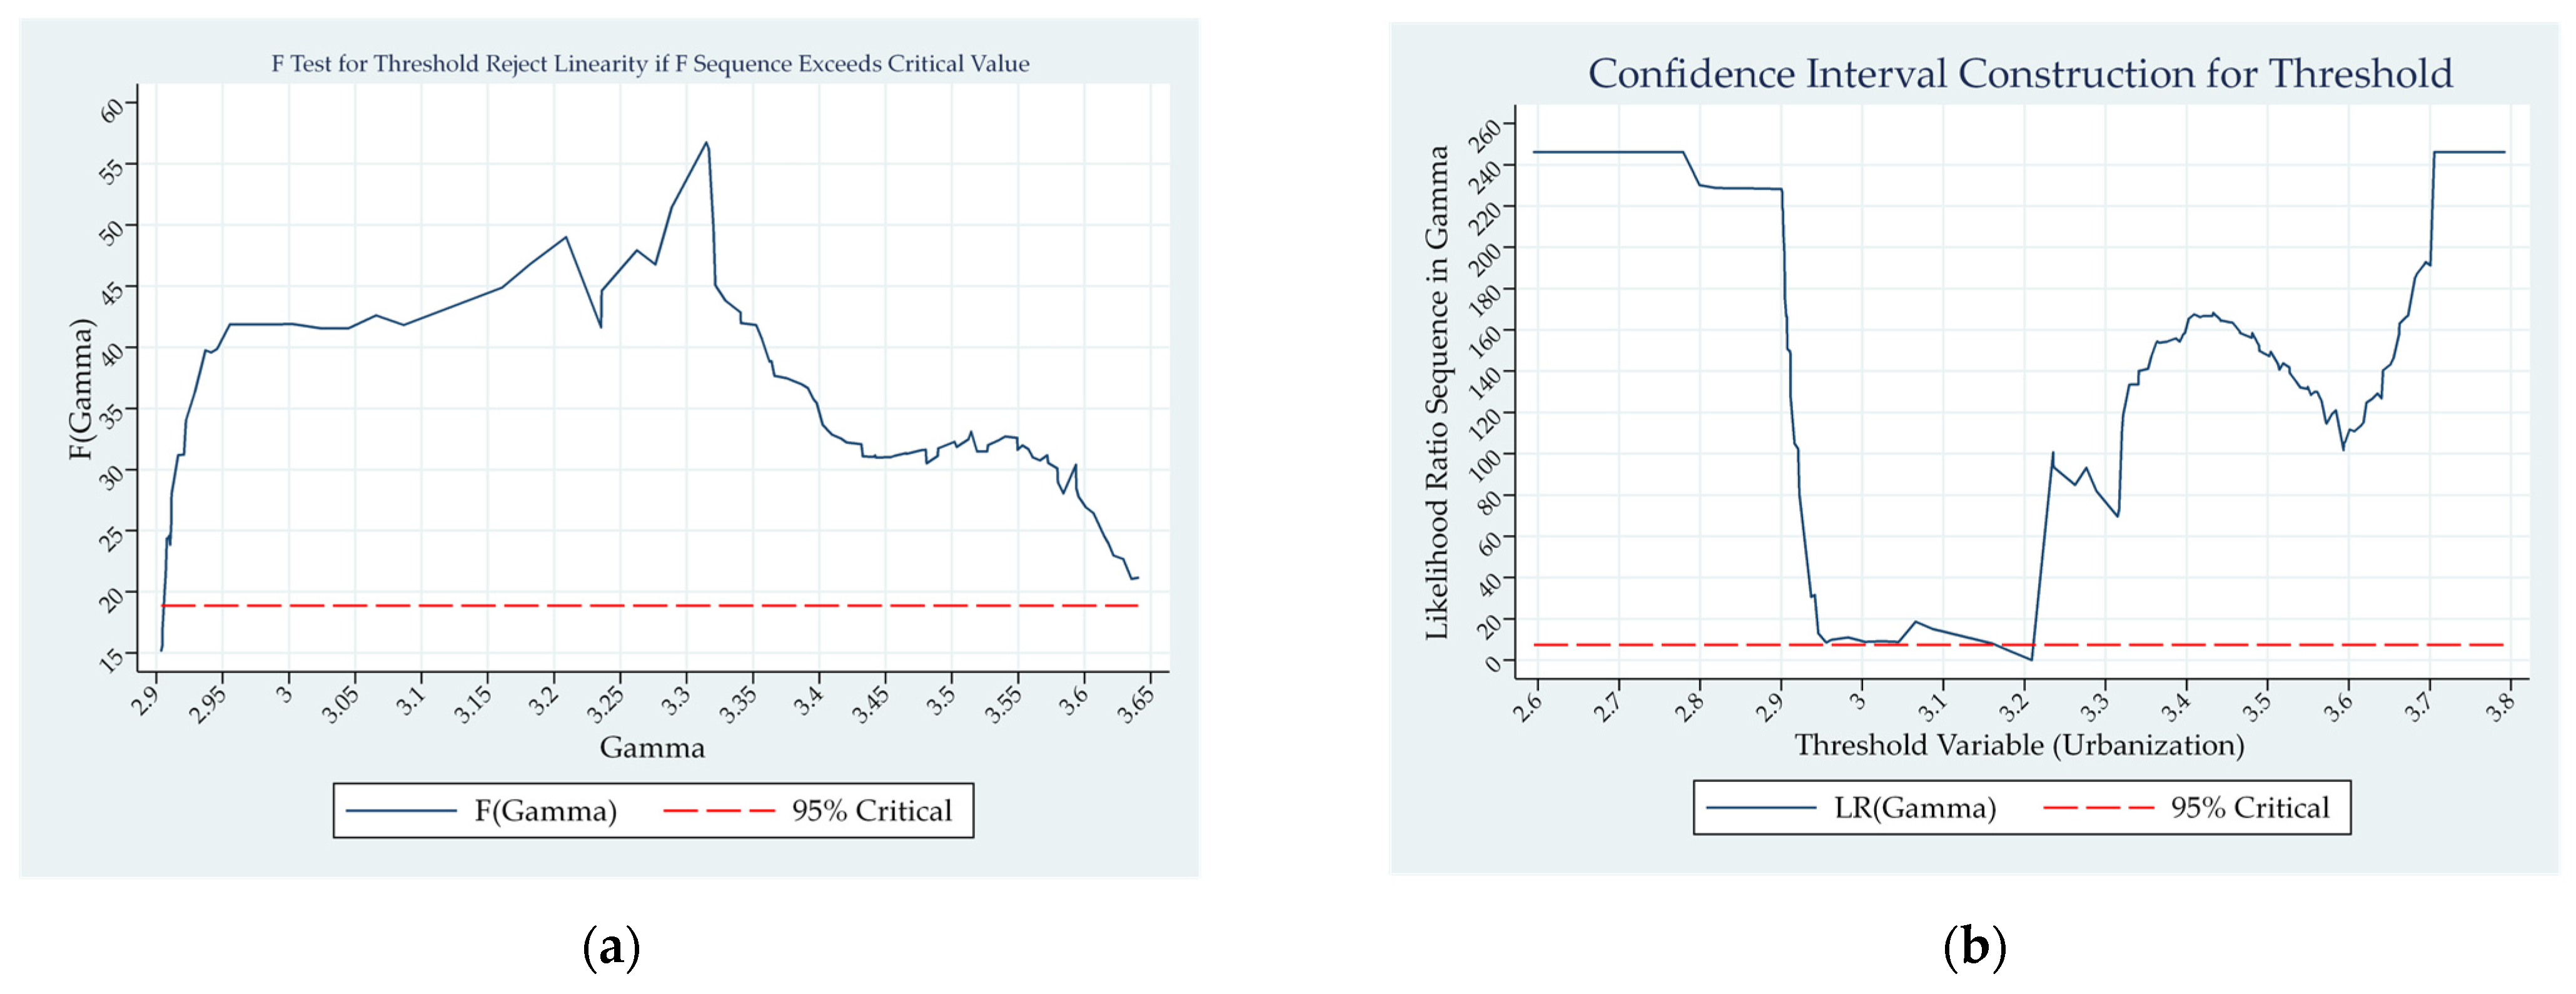
The critical mass of urbanization is considered as a threshold variable. Its impact on the level of renewable energy transition can either be negative or positive on economic growth. In this study, the result from the threshold effect test revealed the existence of a significant threshold estimate of [urbanization = 3.21%]. In Table 4, Panel C presents the threshold impact estimations of the variables at regime 1 (below the threshold) and regime 2 (above the threshold), respectively. Below the threshold, the impact of urbanization is negative, −0.096 significant at 1% level, while the impact rises negatively, −0.0076, but is not statistically significant above the threshold (Figure 4b).

4. Discussion

In this section, the major findings of this article are discussed using the joint panel unit root test and dynamic panel threshold regression approach to investigate the long-run relationship between the transition to renewable energy consumption and economic growth in South Asian countries. The results from the panel unit root test reported in Table 2 confirm that there is mean-reverting as all variables are stationary in first difference. The stationarity properties nullify the possibility of the long-run elasticity estimates being spurious. The corroborated findings from the panel unit test and the significant impact of the dynamic panel threshold regression estimates revealed a long-run relationship between the transition to renewable energy consumption and economic growth in South Asian countries. Consequently, Hypothesis 1 is confirmed.
When the CO2 emissions critical threshold is below 2.38%, the impact of the estimated coefficient of renewable energy consumption transition is −0.164, and the effect on economic growth in South Asia is negative and statistically significant at the 1% level. However, when this critical level of CO2 emissions exceeds 2.38%, the impact of the estimated coefficient of renewable energy consumption transition declines to −0.217 and is statistically significant at a 1% level. The negative magnitude of renewable energy is referred to as the underutilized or underdeveloped stage of renewable energy development. This implies the CO2 emissions threshold that should be avoided in the nexus of renewable energy transition for sustainable economic growth of South Asian countries over the period 2000–2023. Consequently, Hypothesis 2 is confirmed.
When the critical level of access to clean energy and innovation is below the threshold of 3.37%, the impact of the estimated coefficient of renewable energy consumption transition is 0.062, and the effect on economic growth in South Asia is positive but not statistically significant. However, when the critical level of access to clean energy and innovation exceeds the threshold of 3.37%, the impact of the estimated coefficient of renewable energy consumption transition becomes negative, −0.112, and is statistically significant at a 1% level. This implies that the renewable energy transition is still at its developing stage, with great potential for South Asian countries. Furthermore, access to clean energy and innovation threshold should be encouraged in the nexus of renewable energy transition for sustainable economic growth of South Asian countries over the period 2000–2023. Consequently, Hypothesis 3 is confirmed.
When the critical level of the urban population is below the threshold of 3.21%, the impact of the estimated coefficient of renewable energy consumption transition is −0.096, and the effect on economic growth in South Asia is positive and statistically significant at a 1% level. However, when the critical level of urban population exceeds the threshold of 3.21%, the impact of the estimated coefficient of renewable energy consumption transition changes to −0.0076 but is not statistically significant. This implied urbanization threshold should be complemented in the nexus of renewable energy transition for sustainable economic growth of South Asian countries over the period 2000–2023. Consequently, Hypothesis 4 is confirmed.

5. Conclusions

In conclusion, this article investigates the asymmetric effect of renewable energy on sustainable economic growth in six South Asian countries using panel data analysis over the period 2000–2023. Using panel data and the threshold regression analysis as an empirical strategy, we have found overwhelming evidence to support and respond to the fundamental testable research hypotheses in this article.
The findings are established as follows: (1) CO2 emissions below the threshold of 2.38% should be kept for renewable energy and sustainable economic growth in South Asian countries. (2) Access to clean energy and technologies above the threshold of 3.38% should be promoted for renewable energy and sustainable economic growth in South Asian countries. (3) Lastly, the complementary urbanization threshold of 3.21% is to be checked for renewable energy and sustainable economic growth in South Asian countries. This result aligns with research conducted by He and Huang [25]. They examined the types of economic impacts of the renewable energy transition in China. Wu et al. [26] unveiled the impact of economic growth and workforce reallocation in China. Li et al. [27] investigated East and Southeast Asia’s energy transition viewpoints. Olabi and Abdelkareem [28] examined climate change and renewable energy. Noor et al. [6] investigated how non-renewable and renewable energy affect South Asian sustainable development. An analysis of the Yangtze River Economic Belt’s carbon emissions, energy consumption shift, and industrial structure upgrading was conducted by Guo and Yan. [29]. Derouez and Ifa [30] evaluated the energy transition in Southeast Asia for sustainability.
This finding is consistent with the nonlinear regression studies by Qi and Li [31] on the threshold impacts of renewable energy use on economic expansion under energy transformation and Abdulqadir [18] on the growth threshold-effect on the use of renewable energy in the sub-Saharan African oil-producing nations. Chen et al. [32] used a threshold model on a sample of 103 countries from 1995 to 2015 to examine the relationship between economic growth and renewable energy transformations. Abdulqadir [19,22] investigated how sub-Saharan Africa may achieve the Sustainable Development Goals (SDGs) through urbanization, renewable energy, and carbon dioxide emissions.
Consistent with the findings from this study, it is recommended that the South Asian region should mitigate CO2 emissions below the estimated threshold and promote access to clean energy and innovation above the estimated threshold, while complementing the urban population growth as a matter of policy relevance. The policy implications of accelerated transition to renewable energy are that the region’s economic growth, GCF, trade, and FDI shares of gross domestic product will be maintained at least at certain thresholds. Considering the findings from this article, we believe that promoting investment in GCF, trade, and FDI would have a positive impact on the region in the long run. In the short run, revisiting some of the existing policies could possibly distort the optimal allocation of resources to achieve the desired economic growth and renewable energy development of the region.
Future research direction should focus on other fundamental factors that could likely promote the sustained transition to renewable energy development. Given considerable concern on exploring the asymmetric impact of CO2 emissions, access to clean energy, FDI, and trade in the nexus between renewable energy transition and inclusive economic growth in South Asian countries and beyond will be a significant topic for future research. Future studies might benefit from including a wider range of issues, particularly Donald Trump’s recent reciprocal tariff and how it affects renewable development in South Asian countries. Emphasis should focus on such policy indices and technical breakthroughs to provide a more comprehensive picture of the factors driving the renewable energy transition. In order to properly capture the intricate interactions and potential threshold effects between renewable energy and economic results, researchers could also investigate nonlinear or machine learning models.

Author Contributions

Conceptualization, I.A.A., H.S.A. and M.M.; methodology, I.A.A.; software, I.A.A. and H.S.A.; validation, I.A.A. and M.M.; investigation, I.A.A.; resources, M.M. and H.S.A.; data curation, I.A.A.; writing—original draft preparation, I.A.A.; writing—review and editing, M.M. and H.S.A.; visualization, I.A.A. and H.S.A.; supervision, M.M.; project administration, I.A.A.; funding acquisition, M.M. All authors have read and agreed to the published version of the manuscript.

Funding

This research was funded by the projects of talent recruitment of GDUPT under the Grant. no XJ2022000901.

Institutional Review Board Statement

Not applicable.

Informed Consent Statement

Not applicable.

Data Availability Statement

The raw data supporting the conclusions of this article will be made available by the authors on request.

Conflicts of Interest

The authors declare no conflicts of interest.

Abbreviations

The following abbreviations are used in this manuscript:
SDGsSustainable Development Goals
BRICSBrazil, Russia, India, China, and South Africa
ARDLAutoregressive distributed lag
IEAInternational Energy Agency
STIRPATStochastic Impacts by Regression on Population, Affluence, and Technology

Appendix A

Table A1. Data definition and source.
VariablesSymbolsDefinitionSource
Economic growth growth Annual % growth rate of GDP constant 2015 WDI
Renewable energy consumptionenergyRenewable energy consumption is the share of renewable energy in total final energy consumption.WDI
Access to clean energyaccessAccess to clean fuels and technologies for cooking (% of population)WDI
CO2 emissionsemissionsCarbon dioxide (CO2) emissions (total) excluding LULUCF (Mt CO2e)WDI
Urbanization urbanUrban population (% of people living in urban areas)
Trade opennesstradeTrade (% of GDP)WDI
Foreign direct investmentfdiNet inflows (% of GDP)WDI
Gross capital formationgcfGross capital formation (% of GDP) WDI
Labor forcelaborLabor force participation rate, total (% of total pop-ulation ages 15–64)WDI

References

  1. Qudrat-Ullah, H. A Review and Analysis of Green Energy and the Environmental Policies in South Asia. Energies 2023, 16, 7486. [Google Scholar] [CrossRef]
  2. Murshed, M.; Mahmood, H.; Alkhateeb, T.T.Y.; Banerjee, S. Calibrating the impacts of regional trade integration and renewable energy transition on the sustainability of international inbound tourism demand in South Asia. Sustainability 2020, 12, 8341. [Google Scholar] [CrossRef]
  3. Lal SR, S.; Herbert GM, J.; Arjunan, P.; Suryan, A. Advancements in renewable energy transition in India: A review. Energy Sources Part A Recover. Util. Environ. Eff. 2025, 47, 2024921. [Google Scholar] [CrossRef]
  4. Cozzi, L.; Martinos, A.; Spencer, T. Global Energy Review 2025. 2025. Available online: https://iea.blob.core.windows.net/assets/5b169aa1-bc88-4c96-b828-aaa50406ba80/GlobalEnergyReview2025.pdf (accessed on 25 August 2025).
  5. Rana, A.; Gróf, G. Assessment of the Electricity System Transition towards High Share of Renewable Energy Sources in South Asian Countries. Energies 2022, 15, 1139. [Google Scholar] [CrossRef]
  6. Noor, M.; Khan, D.; Khan, A.; Rasheed, N. The impact of renewable and non-renewable energy on sustainable development in South Asia. Environ. Dev. Sustain. 2024, 26, 14621–14638. [Google Scholar] [CrossRef]
  7. Zeb, A.; Shuhai, N.; Ullah, O. Navigating sustainability and economic growth: The dual influence of green economic growth and technological innovation on environmental outcomes in South Asia. Environ. Dev. Sustain. 2025, 1–26. [Google Scholar] [CrossRef]
  8. Miao, Y.; Bukhari, A.A.A.; Bukhari, W.A.A.; Ahmad, S.; Hayat, N. Why fossil fuels stifle green economic growth? An envi-ronmental management perspective in assessing the spatial spillover impact of energy consumption in South Asia. J. Environ. Manag. 2025, 373, 123471. [Google Scholar] [CrossRef]
  9. Rahman, H.; Voumik, L.C.; Akter, S.; Radulescu, M. New insights from selected South Asian countries on the determinants of GHG emissions. Energy Environ. 2025, 36, 958–978. [Google Scholar] [CrossRef]
  10. Hassan, M.U.; Siddique, H.M.A.; Sumaira; Alvi, S. Impacts of industrialization, trade openness, renewable energy consumption, and urbanization on the environment in South Asia. Environ. Dev. Sustain. 2025, 1–24. [Google Scholar] [CrossRef]
  11. Zulfiqar, M.; Fatima, A.; Ullah, M.R.; Huo, W.; Pervaiz, A.; Ghafoor, S. The triple threat: How green technology innovation, green energy production, and financial development impact environmental quality? Nat. Resour. Forum 2025, 49, 160–176. [Google Scholar] [CrossRef]
  12. Triki, R.; Mahmoud, S.M.; Bahou, Y.; Boudabous, M.M. Assessing Renewable Energy Adoption to Achieve Sustainable De-velopment Goals in Ha’il Region. Sustainability 2025, 17, 6097. [Google Scholar] [CrossRef]
  13. Raihan, A.; Ridwan, M.; Zimon, G.; Rahman, J.; Tanchangya, T.; Bari, A.M.; Atasoy, F.G.; Chowdhury, A.I.; Akter, R. Dynamic effects of foreign direct investment, globalization, economic growth, and energy consumption on carbon emissions in Mexico: An ARDL approach. Innov. Green Dev. 2025, 4, 100207. [Google Scholar] [CrossRef]
  14. Wang, Q.; Li, C.; Li, R. How does renewable energy consumption and trade openness affect economic growth and carbon emissions? International evidence of 122 countries. Energy Environ. 2025, 36, 187–211. [Google Scholar] [CrossRef]
  15. Imran, M.; Alam, S.; Jijian, Z.; Ozturk, I.; Wahab, S.; Doğan, M. From resource curse to green growth: Exploring the role of energy utilization and natural resource abundance in economic development. Nat. Resour. Forum 2025, 49, 2025–2047. [Google Scholar] [CrossRef]
  16. Chen, S.; Paramaiah, C.; Kumar, P.; Khan, S.; Haomu, Q. Toward sustainable tourism: Insights from green financing and re-newable energy. Energy Strat. Rev. 2025, 57, 101618. [Google Scholar] [CrossRef]
  17. World Bank. World Development Indicators, WDI, 2025, [Online]. Available online: https://databank.worldbank.org/source/world-development-indicators/Type/TABLE/preview/on%20South%20Asian%20Countries (accessed on 25 August 2025).
  18. Abdulqadir, I.A. CO2 emissions policy thresholds for renewable energy consumption on economic growth in OPEC member countries. Int. J. Energy Sect. Manag. 2023, 17, 1074–1091. [Google Scholar] [CrossRef]
  19. Abdulqadir, I.A. Urbanization, renewable energy, and carbon dioxide emissions: A pathway to achieving sustainable devel-opment goals (SDGs) in sub-Saharan Africa. Int. J. Energy Sect. Manag. 2024, 18, 248–270. [Google Scholar] [CrossRef]
  20. Hansen, B.E. Sample Splitting and Threshold Estimation. Econometrica 2000, 68, 575–603. [Google Scholar] [CrossRef]
  21. Shi, X.; Shi, D. Impact of Green Finance on Renewable Energy Technology Innovation: Empirical Evidence from China. Sustainability 2025, 17, 2201. [Google Scholar] [CrossRef]
  22. Abdulqadir, I.A. Growth threshold-effect on renewable energy consumption in major oil-producing countries in sub-Saharan Africa: A dynamic panel threshold regression estimation. Int. J. Energy Sect. Manag. 2021, 15, 496–522. [Google Scholar] [CrossRef]
  23. Im, K.S.; Pesaran, M.; Shin, Y. Testing for unit roots in heterogeneous panels. J. Econ. 2003, 115, 53–74. [Google Scholar] [CrossRef]
  24. Almulhim, A.A.; Inuwa, N.; Chaouachi, M.; Samour, A. Testing the Impact of Renewable Energy and Institutional Quality on Consumption-Based CO2 Emissions: Fresh Insights from MMQR Approach. Sustainability 2025, 17, 704. [Google Scholar] [CrossRef]
  25. He, Y.; Huang, P. Exploring the Forms of the Economic Effects of Renewable Energy Consumption: Evidence from China. Sustainability 2022, 14, 8212. [Google Scholar] [CrossRef]
  26. Wu, S.; Yang, D.; Xia, F.; Zhang, X.; Huo, J.; Cai, T.; Sun, J. The Effect of Labor Reallocation and Economic Growth in China. Sustainability 2022, 14, 4312. [Google Scholar] [CrossRef]
  27. Li, B.; Nian, V.; Shi, X.; Li, H.; Boey, A. Perspectives of energy transitions in East and Southeast Asia. WIREs Energy Environ. 2020, 9, e364. [Google Scholar] [CrossRef]
  28. Olabi, A.; Abdelkareem, M.A. Renewable energy and climate change. Renew. Sustain. Energy Rev. 2022, 158, 112111. [Google Scholar] [CrossRef]
  29. Guo, S.; Yan, X. Investigation of Industrial Structure Upgrading, Energy Consumption Transition, and Carbon Emissions: Evidence from the Yangtze River Economic Belt in China. Sustainability 2025, 17, 4383. [Google Scholar] [CrossRef]
  30. Derouez, F.; Ifa, A. Assessing the Sustainability of Southeast Asia’s Energy Transition: A Comparative Analysis. Energies 2025, 18, 287. [Google Scholar] [CrossRef]
  31. Qi, S.; Li, Y. Threshold Effects of Renewable Energy Consumption on Economic Growth under Energy Transformation. Chinese J. Popul. Resour. Environ. 2017, 15, 312–321. [Google Scholar] [CrossRef]
  32. Chen, C.; Pinar, M.; Stengos, T. Renewable Energy Consumption and Economic Growth Nexus: Evidence from a Threshold Model. Energy Policy 2020, 139, 111295. [Google Scholar] [CrossRef]
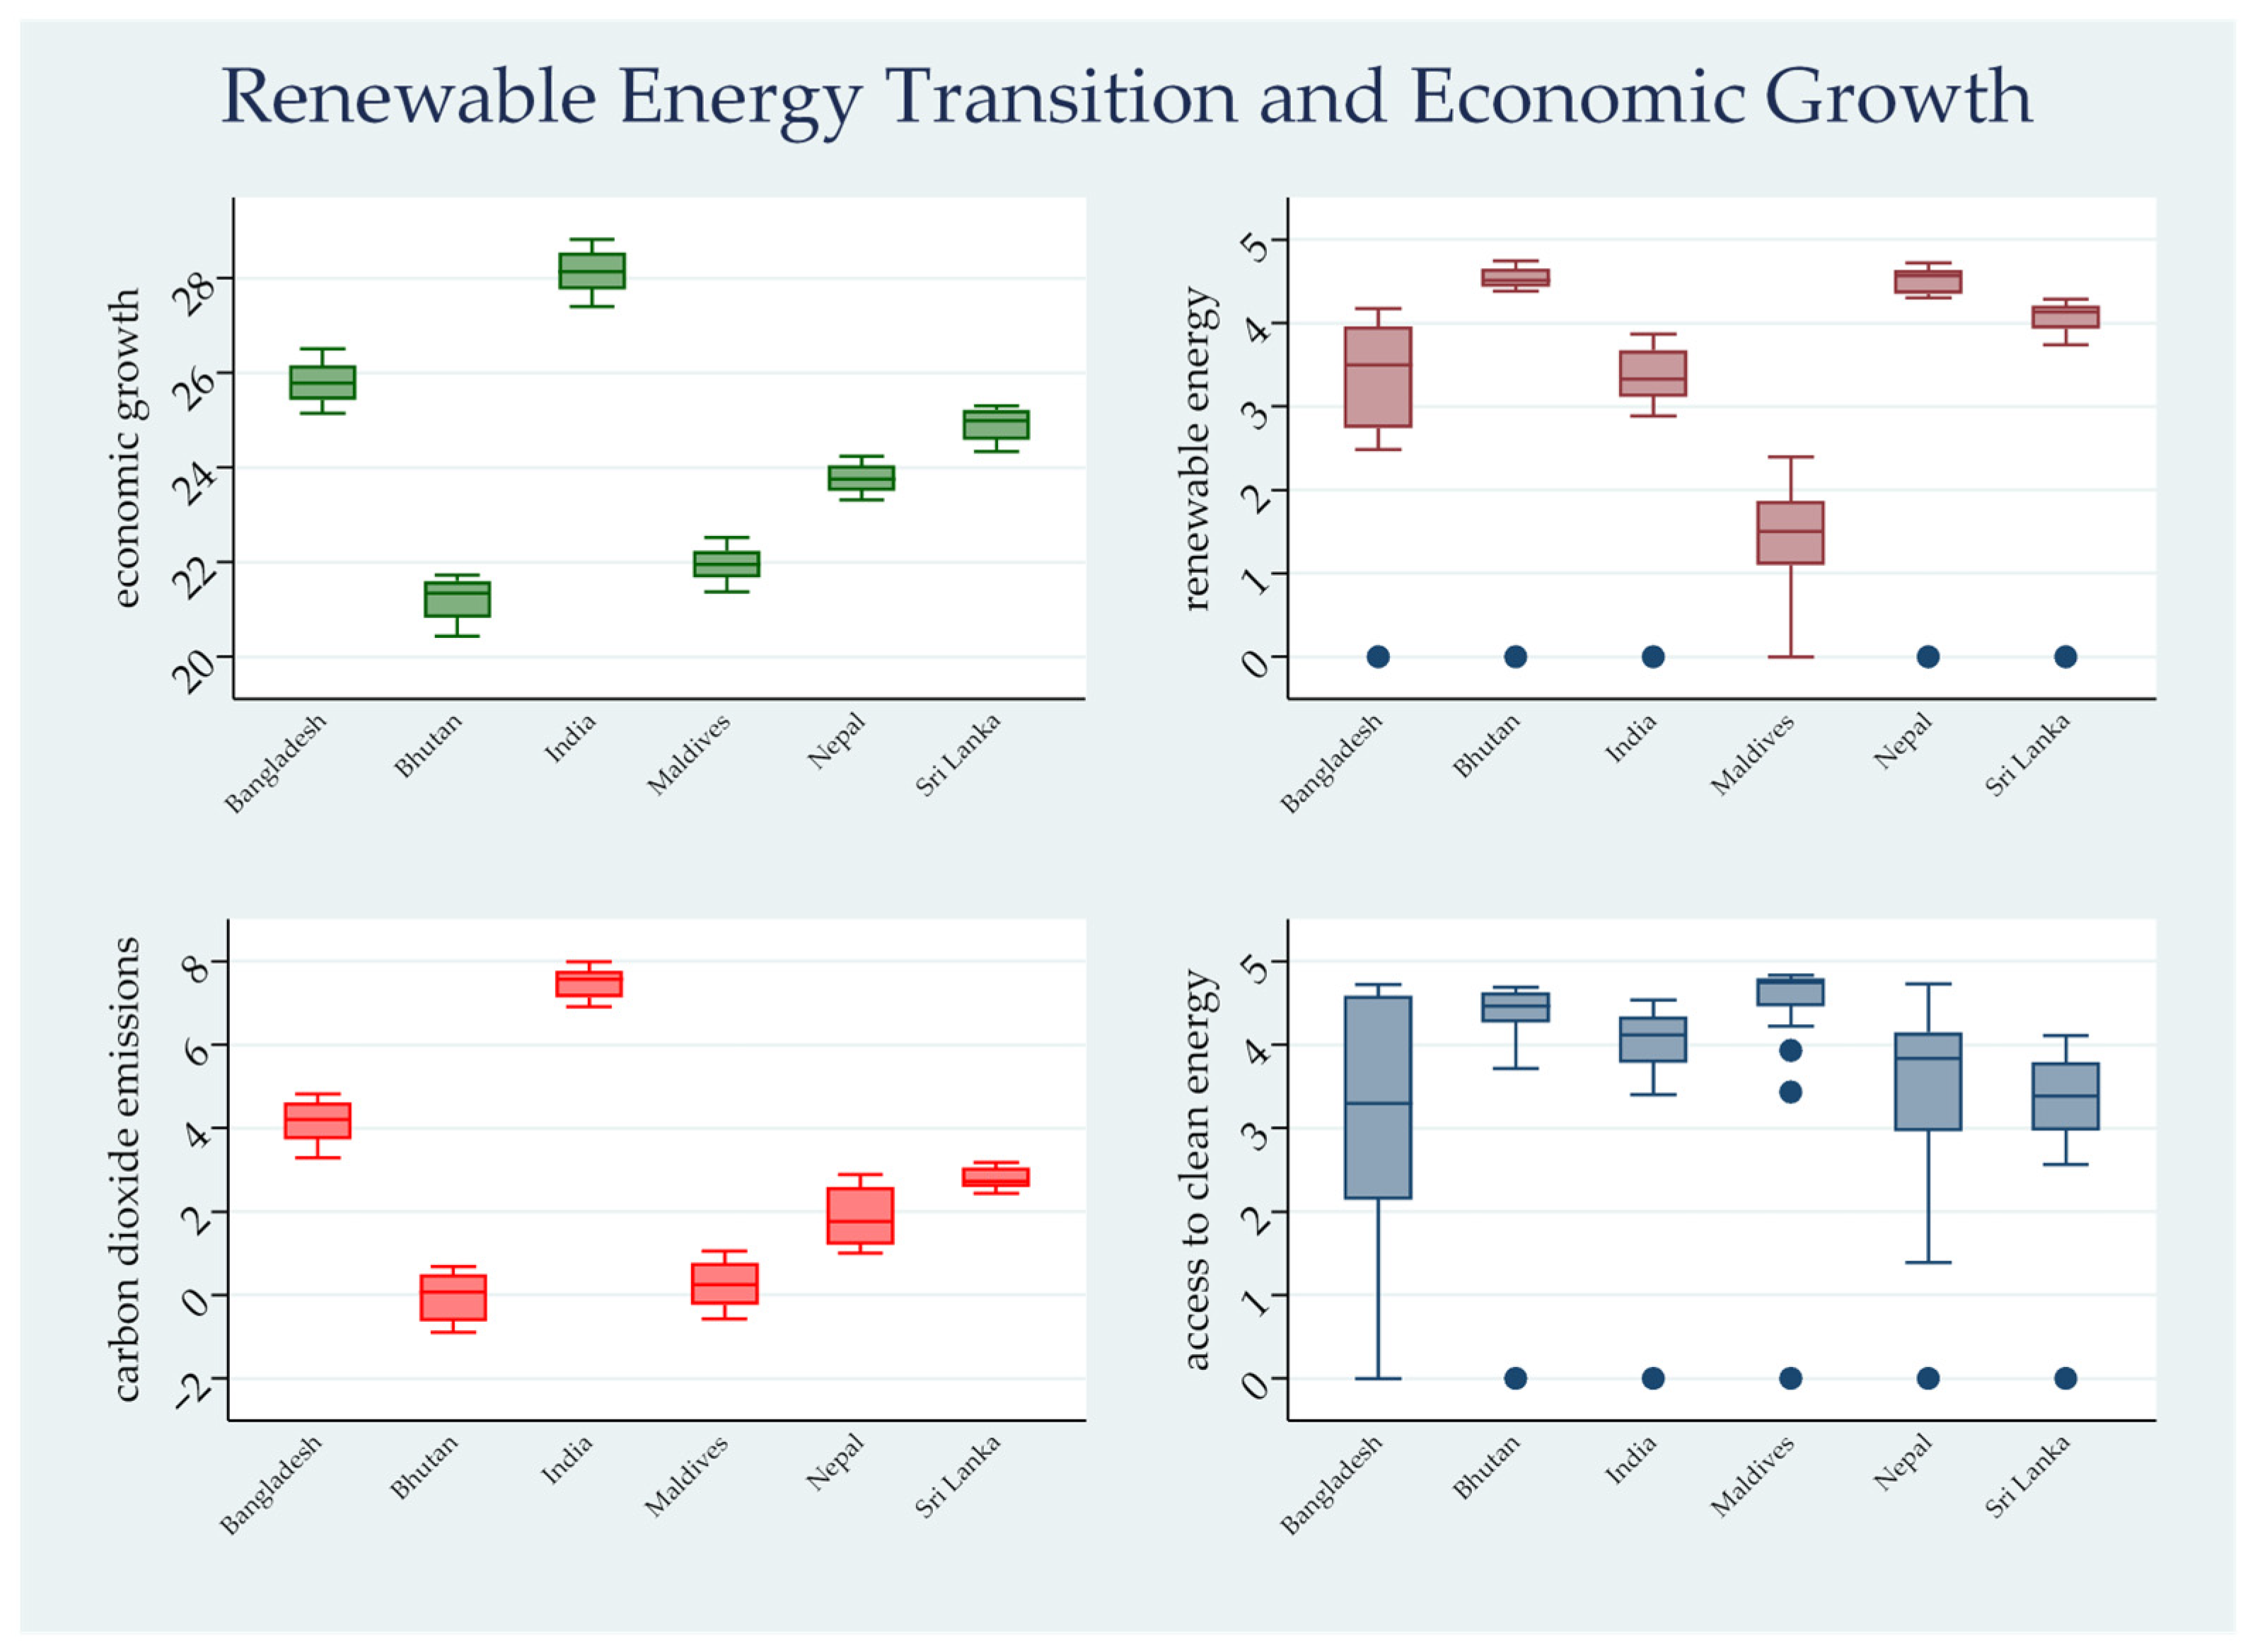
Figure 1. The box plot of the determinants across the sampled countries.
Sustainability 17 09289 g001
Figure 2. The graph depicts the likelihood ratio function for the level of CO2 emissions in the nexus between renewable energy consumption transition and economic growth. In (a), the graph shows the F-statistic test for threshold rejects linearity if the sequence exceeds the critical value. In (b), the graph shows the meticulous confidence interval construction for the estimated threshold and is presented in Panel A, Table 4, below.
Sustainability 17 09289 g002
Figure 3. The graph depicts the likelihood ratio function for the level of access to clean energy and innovation in the nexus between renewable energy consumption transition and economic growth. In (a), the graph shows the F-statistic test for threshold rejects linearity if the sequence exceeds the critical value. In (b), the graph shows the exact confidence interval construction for the estimated threshold and is presented in Panel B, Table 4, below.
Sustainability 17 09289 g003
Figure 4. The graph depicts the likelihood ratio function for the level of urbanization in the nexus between renewable energy consumption transition and economic growth. In (a), the graph shows the F-statistic test for threshold rejects linearity if the sequence exceeds the critical value. In (b), the graph shows the exact confidence interval construction for the estimated threshold and is presented in Panel C, Table 4, below.
Sustainability 17 09289 g004
Table 1. Preliminary data analysis.
VariablesObsMeanStd. Dev.MinMax
Summary descriptive statistics Panel A
Economic growth 14424.2932.36820.43828.815
Renewable energy1443.3341.41204.745
Carbon emissions1442.7452.617−0.8987.991
Access1443.7251.13904.836
Trade1443.3801.55304.836
FDI1443.9720.95504.963
GCF1443.3801.55304.836
Labor force1444.0000.1573.6744.246
Urbanization1443.3020.3282.5953.792
Pairwise correlations Panel B
(1)(2)(3)(4)(5)(6)(7)(8)(9)
(1) Economic growth 1.000−0.062 *0.983 *−0.227 *0.303 *0.177 *0.163 *−0.198 *−0.094 *
(2) Renewable energy 1.000−0.079 *0.150 *0.346 *−0.368 *0.176 *−0.087 *−0.472 *
(3) Carbon emissions 1.000−0.169 *0.320 *0.206 *0.242 *−0.101 *0.038
(4) Access 1.000−0.224 *0.153 *−0.0420.141 *0.215 *
(5) Trade 1.000−0.382 *0.705 *−0.103 *−0.220 *
(6) FDI 1.000−0.165 *0.311 *0.381 *
(7) GCF 1.0000.221 *0.202 *
(8) Labor force 1.0000.706 *
(9) Urbanization 1.000
Note: * p < 0.1.
Table 2. Panel unit root test.
Title 1Statisticsp-ValuesFixed-N Exact Critical ValuesSigns
Im, Pesaran & Shin (2003) [23] Test 1%            5%            10%
Economic growth 2.59090.9952−2.320    −2.080    −1.950level
−5.43300.0000−2.320    −2.080    −1.950
Renewable energy4.37421.0000−2.320    −2.080    −1.950level
−4.99340.0000−2.320    −2.080    −1.950
Carbon emissions2.04450.9795−2.320    −2.080    −1.950level
−6.45370.0000−2.320    −2.080    −1.950
Access−0.31730.3755−2.320    −2.080    −1.950level
−4.97510.0000−2.940    −2.700    −2.580
Trade−1.10880.1338−2.320    −2.080    −1.950level
−5.86330.0000−2.320    −2.080    −1.950
FDI−3.45500.0003−2.320    −2.080    −1.950level
−7.30490.0000−2.320    −2.080    −1.950
GCF−1.67510.0470−2.320    −2.080    −1.950level
−5.44390.0000−2.320    −2.080    −1.950
Labor force2.63630.9958−2.320    −2.080    −1.950level
−4.20170.0000−2.320    −2.080    −1.950
Urbanization1.21390.8876−2.320    −2.080    −1.950level
−4.35410.0000−2.320    −2.080    −1.950
Table 3. Results threshold effect test.
Threshold Effect TestCO2 EmissionsAccess to Clean Energy Urbanization
Number of Bootstrap Replications:500050005000
Trimming Percentage:0.150.150.15
Threshold Estimate:2.3763.3673.214
LM-test for no threshold:85.35528.08456.750
Bootstrap p-Value:0.0170.00040.037
Table 4. Result threshold estimations.
Threshold EstimationCO2 EmissionsAccess to Clean Energy Urbanization
Panel APanel BPanel C
DV: Sustainable GrowthRegime 1 ( e m i s s i o n s i t 2 . 376 ^ ) Regime 2
( e m i s s i o n s i t > 2 . 376 ^ )
Regime 1 ( a c c e s s i t 3.367 ^ ) Regime 2
( a c c e s s i t > 3.367 ^ )
Regime 1
( u r b a n i t 3 . 214 ^ )
Regime 2
( u r b a n i t > 3 . 214 ^ )
Threshold parameter2.38%2.38%3.37% 3.37%3.21%3.21%
Intercept45.485 ***
(0.845)
7.612 **
(3.000)
22.781 ***
(2.093)
24.949 ***
(0.738)
12.837 ***
(0.897)
26.816 ***
(3.178)
Renewable energy−0.164 ***
(0.045)
−0.217 ***
(0.091)
0.062
(0.046)
−0.112 ***
(0.029)
−0.096 ***
(0.035)
−0.0076
(0.0305)
CO2 emissions------0.963 ***
(0.035)
0.896 ***
(0.011)
0.295 ***
(0.050)
0.893 ***
(0.0209)
Access to clean energy0.0549
(0.056)
−0.286 ***
(0.091)
------0.0471
(0.032)
−0.100 **
(0.0329)
Urbanization0.372
(0.260)
2.922 ***
(0.403)
−0.947 ***
(0.278)
−1.283 ***
(0.129)
------
FDI−0.064 *
(0.036)
1.107 ***
(0.180)
−0.069 **
(0.047)
0.001
(0.045)
−0.002
(0.024)
−0.0189
(0.0443)
Trade−0.009
(0.031)
−0.241 **
(0.085)
−0.120 ***
(0.036)
−0.028
(0.025)
−0.179 ***
(0.021)
−0.038 *
(0.0297)
GCF0.252 ***
(0.029)
0.303 **
(0.102)
0.072 *
(0.040)
−0.036 *
(0.022)
0.159 ***
(0.026)
−0.039
(0.0448)
Labor force−6.190 ***
(0.391)
0.990
(0.937)
0.623
(0.665)
0.413 *
(0.237)
2.928 ***
(0.235)
−1.091 *
(0.7861)
Degrees of Freedom5771281004385
Observations:6579361085193
R20.94080.99300.98570.99120.95020.9923
Note: ***, **, * significance levels of 1%, 5%, and 10% respectively. Data in parentheses in the above table are standard error values.
Disclaimer/Publisher’s Note: The statements, opinions and data contained in all publications are solely those of the individual author(s) and contributor(s) and not of MDPI and/or the editor(s). MDPI and/or the editor(s) disclaim responsibility for any injury to people or property resulting from any ideas, methods, instructions or products referred to in the content.