Article

Spatio-Temporal Assessment of Land Surface Temperature, Vegetation Cover, and Built-Up Areas Using LST, NDVI, and NDBI in Balıkesir, Türkiye (1985–2025)

1
Faculty of Architecture, Department of Architecture, Balıkesir University, Balıkesir 10010, Türkiye
2
Institute of Social Science, Department of Geography, Harran University, Şanlıurfa 63000, Türkiye
*
Author to whom correspondence should be addressed.
Sustainability 2025, 17(20), 9245; https://doi.org/10.3390/su17209245
Submission received: 27 August 2025 / Revised: 9 October 2025 / Accepted: 10 October 2025 / Published: 17 October 2025

Abstract

This study offers a four-decade evaluation of land surface temperature (LST) dynamics in relation to urban growth in Balıkesir, Turkey, between 1985 and 2025. Using multi-temporal Landsat imagery (30 m), LST, NDVI, and NDBI maps were generated and assessed through Pearson and partial correlation analyses. MODIS and Sentinel-3 datasets (1 km) were additionally employed to enable comparative analysis. Results reveal robust and statistically significant correlations: urban expansion amplified LST, while vegetation provided consistent cooling effects. Unlike MODIS and Sentinel-3, Landsat data accurately captured localized hot and cool spots, highlighting the importance of spatial resolution in urban climate studies. Temporal patterns reveal a post-2005 decline in NDVI under increasing urban pressures and a subsequent deceleration of built-up expansion after 2015. Mean LST increased from 41 °C in 1985 to 52 °C in 2025, with the hottest temperature class covering over half of the study area. These findings not only confirm the intensification of urban-induced warming, but also contribute a novel methodological framework that integrates multi-sensor, multi-scale datasets into long-term analyses. The study extends the literature by linking remote sensing outcomes directly to urban resilience strategies, emphasizing the role of blue–green infrastructure and climate-sensitive planning in mitigating future thermal risks.

1. Introduction

The temperature increases caused by climate change, extreme weather events, and the urban heat island (UHI) effect are creating increasing pressures on the ecological balance and social living conditions of cities [1,2,3]. The Mediterranean Basin is one of the regions most intensely affected by climate change and stands out as a critical ‘hot spot’ due to the increase in extreme heat events [4]. The Intergovernmental Panel on Climate Change (IPCC) Sixth Assessment Report (AR6) reveals that temperature increases in the Mediterranean region are above the global average, with significant increases expected in the frequency, duration, and intensity of heatwaves during the summer months.
In addition, according to AR6, the UHI effect and increasing humidity deficit in Mediterranean cities are exacerbating thermal stress conditions in cities, thereby reducing quality of life. These trends reveal the increasing vulnerability of cities in southern Europe and western Turkey to climate-induced extreme temperatures and the UHI effect. In this context, the UHI, one of the most critical consequences of the climate crisis, seriously threatens the livability and sustainable development capacity of cities worldwide, particularly in the Mediterranean Basin [5] Addressing this challenge necessitates not only technological interventions, but also the implementation of heat-resilient urban planning and design strategies that holistically integrate mitigation, adaptation, and governance dimensions [6,7].
The global impacts of climate change and the environmental pressures arising from rapid urbanization processes are among the primary interlinked dynamics today [8]. In particular, increasing energy demand, intensive construction trends, and the covering of natural surfaces with impermeable materials are intensifying both the UHI effect and the frequency of extreme heat events [9]. Consequently, the global impacts of climate change and the local consequences of urban growth are intertwined, creating a critical area of vulnerability in terms of ecological sustainability [10].
Rapid population growth, industrialization, and technological developments are some of the many factors contributing to urban growth, leading to profound changes in land use and land cover (LULC) in urban areas [11,12]. Construction activities aimed at meeting basic urban needs such as housing, education, health, transport, and employment increase the spatial density of urbanization and fundamentally transform urban morphology. This process leads to the expansion of impervious surfaces, a reduction in natural vegetation cover, and a corresponding increase in LST, raising critical issues in terms of ecological sustainability [13,14,15]. LST is not only a direct indicator of these transformations, but also stands out as one of the fundamental components of the UHI phenomenon. Remote sensing-based LST data, by providing long-term and high spatial resolution information, enables detailed examination of the spatial patterns and determining factors of the UHI [16,17]. Therefore, LST not only reveals the spatial patterns of urban thermal environments, but also serves as a critical indicator, directly reflecting LULC changes associated with urbanization. LULC transformations, such as the increase in impervious surfaces and the loss of natural vegetation cover, disrupt the surface energy balance and increase LST values; this directly affects urban microclimates and threatens the ecological integrity of ecosystems [18,19]. Therefore, analyzing temporal and spatial changes in LULC alongside LST provides an indispensable approach for comprehensively understanding environmental processes, conserving ecosystem services, and developing climate-resilient planning policies [20,21]. It has been observed that LULC changes generally involve the replacement of agricultural land, forests, and natural green areas with built-up areas [22,23,24].
The role of remote sensing (RS) and geographic information systems (GISs) is significant in the examination and modeling of LST and LULC changes. In particular, the integration of LST and LULC data covering different periods from the 1980s to the present day allows for a detailed understanding of the ecological impacts of urbanization processes [25].When RS and GIS-based studies are integrated with spatial correlation, regression, and temporal change models, they provide a scientific basis for determining UHI dynamics and developing nature-based solutions to these effects [26]. Furthermore, the fact that these methods encompass not only current trends, but also future scenarios supports the development of resilient and sustainable planning strategies against thermal stresses arising from rapid urbanization and climate change [27].
RS technologies enable the long-term monitoring of LST and LULC classes by utilizing multi-temporal data obtained from various satellite sensors such as Landsat, Sentinel, and MODIS (Moderate Resolution Imaging Spectroradiometer). Geographic information systems (GISs) provide a complementary infrastructure for analyzing, classifying, and interpreting these data through spatial outputs [28]. Landsat has been providing long-term, reliable data archives since 1972, offering multi-spectral optical images with a spatial resolution of 30 m. Sentinel-2 provides high-resolution data for LULC classifications and vegetation indices, while Sentinel-3 has been used for large-scale LST studies since 2016 with its 1 km SLSTR thermal measurements. Furthermore, Sentinel-3 stands out as a more suitable data source for monitoring regional heat waves, assessing land–sea interactions, and examining large-scale climatic temperature trends such as those in the Mediterranean Basin [29,30].
MODIS sensors are located on the Terra (1999) and Aqua (2002) satellites and are used to monitor LST and LULC changes over large areas with a spatial resolution of 250 m−1 km and a daily revisit capability [31]. Thanks to their high temporal resolution, they offer significant advantages in revealing short-term dynamics such as heat waves and seasonal land cover changes. Therefore, when Landsat’s long-term high spatial resolution, Sentinel’s current and medium-high resolution data, and MODIS’s large-scale temporal observations are used together, it is possible to comprehensively analyze LST–LULC relationships both spatially and temporally and to more accurately predict pressures caused by climate change and urbanization [32,33].
Scientific studies reveal that different satellite systems are used both independently and in an integrated manner in the analysis of LST changes in urban areas. For example, Zhan et al. [34] examined the spatial differentiation of LST distribution by using MODIS and Landsat data together, demonstrating that MODIS’s high temporal resolution is effective in capturing short-term temperature changes, while Landsat’s high spatial resolution is effective in capturing micro-scale urban differences. Peng et al. [35] analyzed urban heat island (UHI) dynamics by integrating MODIS and Landsat data, noting that increasing urbanization significantly raised the LST values, particularly during summer months. Similarly, Odindi et al. [36] used Landsat and MODIS data in long-term (1984–2018) comparative analyses and showed that LST trends increased in parallel with the rate of urbanization, but that green infrastructure applications partially offset this increase. Sentinel-3 data have also been used in the literature in different contexts. Jiménez-Muñoz et al. [37] conducted a comparative analysis of Sentinel-3, MODIS, and Landsat data and emphasized that LST data at different resolutions are complementary.
In the analysis of changes in urban green areas and in line with advancements in remote sensing technologies spectral vegetation indices, such as normalized difference vegetation index (NDVI), normalized difference built-up index (NDBI), and LST data, which are used to assess surface temperatures, are widely and effectively employed [38,39,40]. NDVI provides quantitative information about the health and density of vegetation whereas NDBI plays a role in the identification and monitoring of urban areas (built-up areas). LST is used as an important indicator for analyzing the spatial distribution and temporal changes of the urban heat island effect. In order to accurately estimate LST in urban areas, it is important to consider not only NDVI analyses, but also NDBI analyses, which identify built-up areas with reflective surfaces and high surface radiant temperatures. Additionally, the inverse relationship between NDVI and LST scientifically supports the role of green infrastructure in reducing the urban heat island effect in urban areas [41,42,43]. Scientific studies investigating the impact of reducing green spaces in cities and replacing them with buildings on urban heat island (UHI) effects have concluded that there is a relatively strong correlation between UHI intensity and LST [44,45]. Satellite systems equipped with thermal bands measure LST values for working areas with high accuracy and sufficient spatial resolution. Integrated analysis of NDVI and LST data provides benefits in terms of identifying areas where individuals living in cities are exposed to excessive surface temperatures and access to healthy green spaces [46,47]. The density and geometric structure of urban green spaces directly influence LST values. For example, larger and more integrated green spaces typically exhibit more pronounced and effective cooling intensity and dispersion. Additionally, the geometric structure of green infrastructure plays a critical role in regulating surface temperatures. Wedge-shaped green areas have been found to improve the thermal comfort, particularly in urban fringe areas. The interconnectedness of green areas and the increase in the extent of water bodies create a more intense and sustainable cooling effect on the urban microclimate [48,49].
Currently, with the help of remote sensing and geographic information systems, vegetation indices such as NDVI and NDBI and LST measurements obtained from thermal bands have become important tools for monitoring changes that will occur over time in urban and rural areas. This study focused on determining the changes in surface temperatures that occurred over a 40-year period in the urban center of Balıkesir Province located in the western part of Turkey in conjunction with urban development. The primary objective of this study was to reveal the interactions and correlations between building density, NDVI, NDBI, and LST within the context of urban sprawl and ecological transformation as well as obtain spatially and statistically significant environmental outcomes.
This study details the micro-scale heterogeneities in urban surface temperatures through a 40-year continuous time series generated from Landsat (30 m) data covering the period 1985–2025. Additionally, MODIS (1 km) data for the post-2005 period and Sentinel-3 (1 km) data for 2025 alone provided opportunities for comparative analysis supporting macro-scale trends. In contrast to urban heat island studies in the literature, which are mostly based on a single satellite or short-term analyses, this study developed both a long-term and multi-scale perspective by performing a systematic comparison of micro (30 m) and macro (1 km) scales within the same warm period windows. Furthermore, the increasingly strong positive correlation between LST and urbanization (NDBI) and the increasing negative correlation with vegetation (NDVI) were statistically validated through Pearson and partial correlation analyses; therefore, the intensifying role of urbanization in the heat island effect and the cooling function of vegetation were statistically demonstrated as independent factors. Based on the obtained findings, a detailed planning map for the year 2025 was produced using high-resolution Landsat LST trends. This map served as the basis for developing concrete recommendations including the reinforcement of cooling corridors, prioritization of interventions in heat-intensive zones, and the formulation of green infrastructure strategies. Unlike previous studies that primarily focused on describing the spatial distribution of surface temperatures, this approach advanced beyond descriptive analysis by generating evidence-based strategies that can be directly integrated into urban planning processes. Furthermore, through comparative assessments, it was clearly demonstrated that MODIS and Sentinel-3 data are limited in their capacity to capture cooling islands and microclimatic variations at the urban fabric scale, whereas Landsat (30 m) data exhibited superior performance in accurately identifying urban hot spots and vegetated cooling areas. These results enabled the development of a methodological framework for testing product–scale compatibility and provided a novel perspective on the complementary roles of multi-scale satellite datasets in urban heat island analyses. Building upon these findings, a detailed planning output for 2025 was developed using high-resolution Landsat-derived LST trends, providing actionable strategies such as strengthening cooling corridors, prioritizing interventions in heat-intensive areas, and advancing green infrastructure. Unlike previous studies, this approach not only characterizes the spatial distribution of surface temperatures, but also generates directly applicable strategies for urban planning processes.

2. Materials and Methods

2.1. Study Area

The city of Balıkesir is located (Figure 1) in the western part of Turkey and in the southern part of the Marmara Region. The defined study area is bounded by the following coordinates: 39°36′36.17″ and 39°36′30.82″ north latitude, and 27°56′45.29″ and 27°56′37.45″ east longitude. In 2024, the total population of the city was 1,276,096, with a city center population of 338,936. The city center of Balıkesir is generally influenced by both Mediterranean and continental climates. The city has a hot and dry climate in summer and a cool and rainy climate in winter [50].
Within the boundaries of the study area, there are three main green areas that currently play an important role in the urban ecosystem and have high ecological functionality. In addition to these areas, there are landscaping applications throughout the city center that support landscape integrity but are distributed at low densities. The three principal green spaces that provide significant ecosystem services within the city center are Çamlık Hill, Başçeşme Cemetery, and Atatürk Park. Among these, Çamlık Hill, one of the symbolic natural landmarks of Balıkesir, is located to the northeast and south of the city center and encompasses approximately 124,000 m2 of green space. The hill, which has an elevation of 181–275 m above sea level, was included among the city’s important recreational areas through the Çamlık Tepesi Recreation Area Project implemented between 2015 and 2017 [51,52]. Atatürk Park, located within the boundaries of the study area, is an important green infrastructure element within the urban ecosystem. It is not only a green space, but also a cultural landscape element with an important place in the urban memory of Balıkesir. The park contributes to the preservation of biological diversity in the city, the maintenance of microclimatic balance, and the improvement of air quality through its extensive vegetation cover [53]. Başçeşme Cemetery is a semi-natural green area that has been preserved for many years and is an important landscape area with a variety of plant cover. With its natural plant cover, it plays an important role in maintaining microclimatic balance and preserving biodiversity [53,54].

2.2. Data Source

In this study, LST, NDVI, and NDBI analyses were conducted to elucidate the relationships between built-up density and land surface temperature. Multispectral images acquired from the Landsat 4, 5, 8, and 9 satellite missions were employed to calculate the temporal changes in LST, NDVI, and NDBI for the years 1985, 1995, 2005, 2015, and 2025 (Table 1).
In this study, NDVI analysis was performed using the red (Band 3; 0.63–0.69 µm) and near-infrared (NIR) (Band 4; 0.76–0.90 µm) bands from the Landsat 4 and 5 TM sensors, and red (Band 4; 0.64–0.67 µm) and NIR (Band 5; 0.85–0.88 µm) bands from the Landsat 8 and 9 OLI sensors were used.
In the NDBI analysis, the NIR (Band 4; 0.76–0.90 µm) and short-wave infrared (SWIR1) (Band 5; 1.55–1.75 µm) bands from the Landsat 4 and 5 TM sensors and the NIR (Band 5; 0.85–0.88 µm) and SWIR-1 (Band 6; 1.57–1.65 µm) bands from the Landsat 8 and 9 OLI sensors were used. All data were downloaded from the USGS EarthExplorer platform (https://earthexplorer.usgs.gov) at Collection 2, Level-2, as the surface reflectance (SR) and surface temperature (ST) products. In the study, Landsat scenes dated 2 August 1985, 29 July 1995, 24 July 2005, 20 July 2015, and 23 July 2025 were selected, as these months represent the period when surface temperatures reach their annual maximum while vegetation cover remains present.
In addition to high-resolution Landsat-based analyses, moderate-resolution thermal datasets were incorporated to ensure cross-sensor comparison and regional-scale assessment of LST dynamics. Specifically, MODIS LST products at 1 km spatial resolution were employed for the benchmark years 24 July 2005, 20 July 2015, and 23 July 2025. Due to their broad spatial coverage and high temporal resolution, MODIS datasets were used as reference sources for the comparative evaluation and validation of land surface temperature patterns. Furthermore, Sentinel-3 SLSTR Level-2 LST products (SL_2_LST___) with a 1 km resolution were integrated for the year 2025, providing complementary regional-scale thermal observations. The combined use of MODIS and Sentinel-3 datasets facilitated the detection of large-scale thermal gradients and strengthened the reliability of Landsat-derived LST estimates through cross-sensor validation. To ensure methodological consistency, all raster layers were restricted to the study area boundaries, cross-checked with ground-truth data, and processed using ArcGIS 10.8 and QGIS platforms.

2.3. Computation of LST

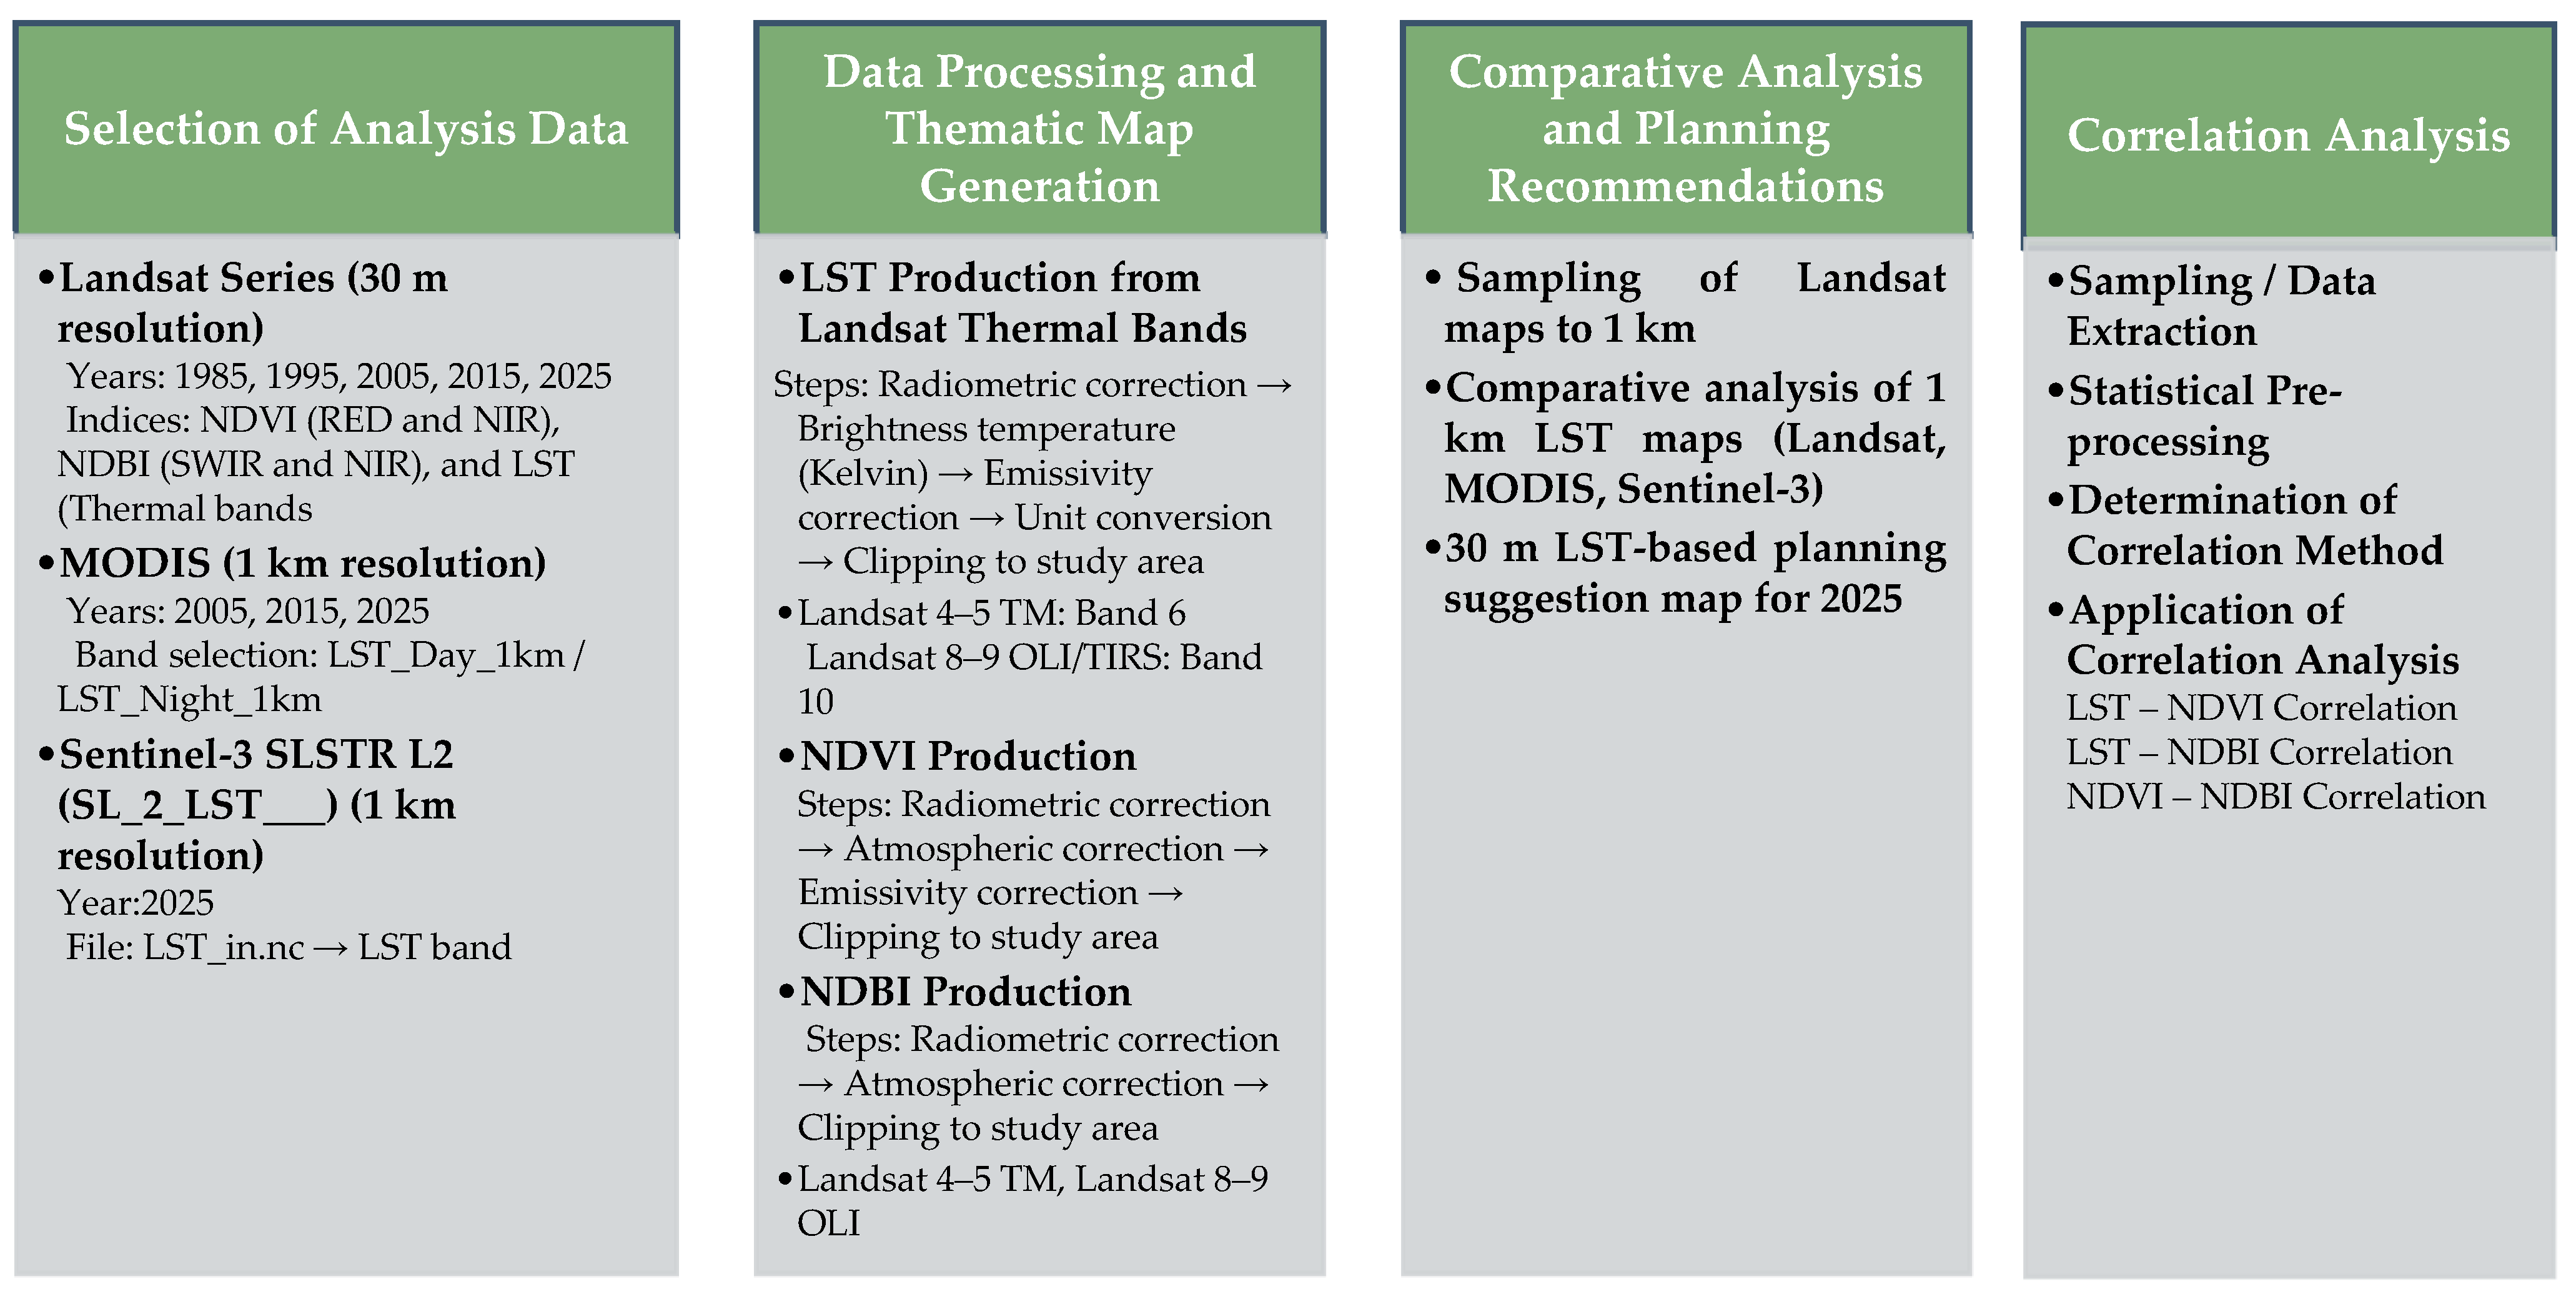
Surface temperature plays an important role in urban and rural areas on a global scale in terms of heat island formation, drought, transpiration and evaporation, and energy balance. The method flowchart of this study, which examined the changes in NDVI, NDBI, and LST in the city center of Balıkesir between 1985 and 2025, is shown in Figure 2.
LST is an indicator used to estimate surface temperature using thermal band data. The formulas used in LST analysis, which is calculated by considering the satellite-derived brightness temperature (TB) and the surface emissivity coefficient (ε), are as follows [55,56]:
Sustainability 17 09245 i001
The first step is to convert the numerical values in the satellite image into physical radiation values. The formula used for this conversion is [57,58]:
L λ = M L × Q c a l + A L Q i
Lλ: Spectral irradiance value;
ML: Multiplier value given for the band;
Qcal: Numerical pixel value;
AL: Offset value given for the band;
Qi: Atmospheric correction factor.
Sustainability 17 09245 i001
After converting the numerical values in the satellite image to physical radiation values, the brightness temperature must be calculated from the spectral radiation value. The formula used here is:
T = K 2 l n ( K 1 / L λ + 1 ) 273.15
T: Luminous temperature (°C);
K1, K2: Satellite sensor-specific calibration constants;
Lλ: Spectral irradiance (W/m2·sr·µm);
ln: Natural logarithm;
273.15: Conversion value from Kelvin to Celsius.
Sustainability 17 09245 i001
At this stage of the study, the vegetation cover ratio is determined from the NDVI values, and the formula used to determine this value is as follows [59]:
P v = N D V I N D V I m i n N D V I m a x N D V I m i n 2
Pv: Proportion of Vegetation;
NDVI: Normalized difference vegetation index value;
NDVImin: Minimum NDVI value in the study area;
NDVImax: Maximum NDVI value in the study area.
Sustainability 17 09245 i001
In order to obtain more accurate results in the surface temperature (LST) calculations, it is necessary to calculate the actual thermal radiation potential of the surface. The formula used in this calculation is [59]:
L S E = 0.004 × P v + 0.986
LSE: Surface spreading ratio (takes values between 0 and 1);
Pv: Plant cover ratio;
0.004 and 0.986: Fixed coefficients recommended in the literature.
Sustainability 17 09245 i001
Finally, the current surface temperature is calculated using the brightness temperature and surface emissivity. The formula used in this calculation is [60]:
L S T = T B 1 + ( λ × T B / ρ ) × l n ( ε )
LST: Land surface temperature (°C);
TB: Brightness temperature (Kelvin);
λ: Thermal band wavelength (meter);
ρ: Value derived from physical constants such as Planck’s constant and the speed of light;
ln(ε): Natural logarithm of the surface emissivity.

2.4. Computation of NDVI and NDBI

NDVI analysis was used in the study to examine the health and density of vegetation cover. Scientifically, NDVI is defined in the literature as the ratio of the sum of the differences between the near-infrared (NIR) and red (RED) band reflection values [61]. The formula used in NDVI analysis is as follows:
N D V I = N I R R E D N I R + R E D
A positive NDVI value indicates that plants are healthy and dense, while negative values indicate built-up and bare soil areas. Therefore, there is a negative correlation between LST and NDVI.
The NDBI, obtained by dividing the difference in reflectance between the short-wave infrared (SWIR) and near-infrared (NIR) bands by the total reflectance value in these two bands, is used to identify built-up areas. Built-up surfaces (concrete, asphalt, roof coverings, etc.) typically exhibit higher reflectance in the SWIR bands while having relatively lower reflectance values in the NIR bands. The formula used to calculate NDBI is [62,63]:
N D B I = S W I R N I R S W I R + N I R
Positive NDBI values generally represent urban and artificial surfaces, while negative values indicate vegetation cover or water surfaces. There is generally a positive correlation between NDBI and LST.

2.5. Determination of the Correlation Between LST, NDVI, and NDBI

In this study, the relationships between LST, NDVI, and NDBI were not only examined using Pearson correlation, but also analyzed using the partial correlation method. In practice, a regression was first established between the dependent variable (e.g., LST) and the control variable (e.g., NDBI), then a regression was performed between the independent variable (e.g., NDVI) and the control variable, and correlation coefficients were calculated from the residuals obtained from both models. Thus, the independent relationship between LST and NDVI was determined by fixing the effect of NDBI; similarly, the LST–NDBI relationship was determined by fixing the effect of NDVI, and the NDVI–NDBI relationship was determined by fixing the effect of LST. This method allows for a more accurate interpretation by eliminating the effect of the third variable on the direct relationship between the variables.
In this analysis, the coefficient value (r) of the variables ranged from −1 to +1. Positive r values indicate a direct relationship (increasing together) between variables, while negative r values indicate an inverse relationship (one increases while the other decreases) [64,65].
After all indices and LST values were calculated in raster format, pixel values were obtained from the same spatial locations using the sampling method, and statistical analyses were performed using Excel and ArcGIS software. The Pearson correlation coefficient was calculated using the following formula:
r = Σ ( X i X ¯ ) ( Y i Ȳ ) [ Σ ( X i X ¯ ) 2 × Σ ( Y i Ȳ ) 2 ]
In the formula:
  • X and Y are the variables being analyzed;
  • X ¯ and Ȳ are the average values of the relevant variables;
The classification used in evaluating the correlation coefficient is as follows [66]:
  • ≤ |r| < 0.30: Weak relationship
  • 0.30 ≤ |r| < 0.50: Moderate relationship
  • 0.50 ≤ |r| < 0.70: Strong relationship
  • 0.70 ≤ |r| ≤ 1.00: Very strong relationship

3. Results

3.1. Evaluation of LST NDVI and NDBI Analyses Created Using Landsat Data

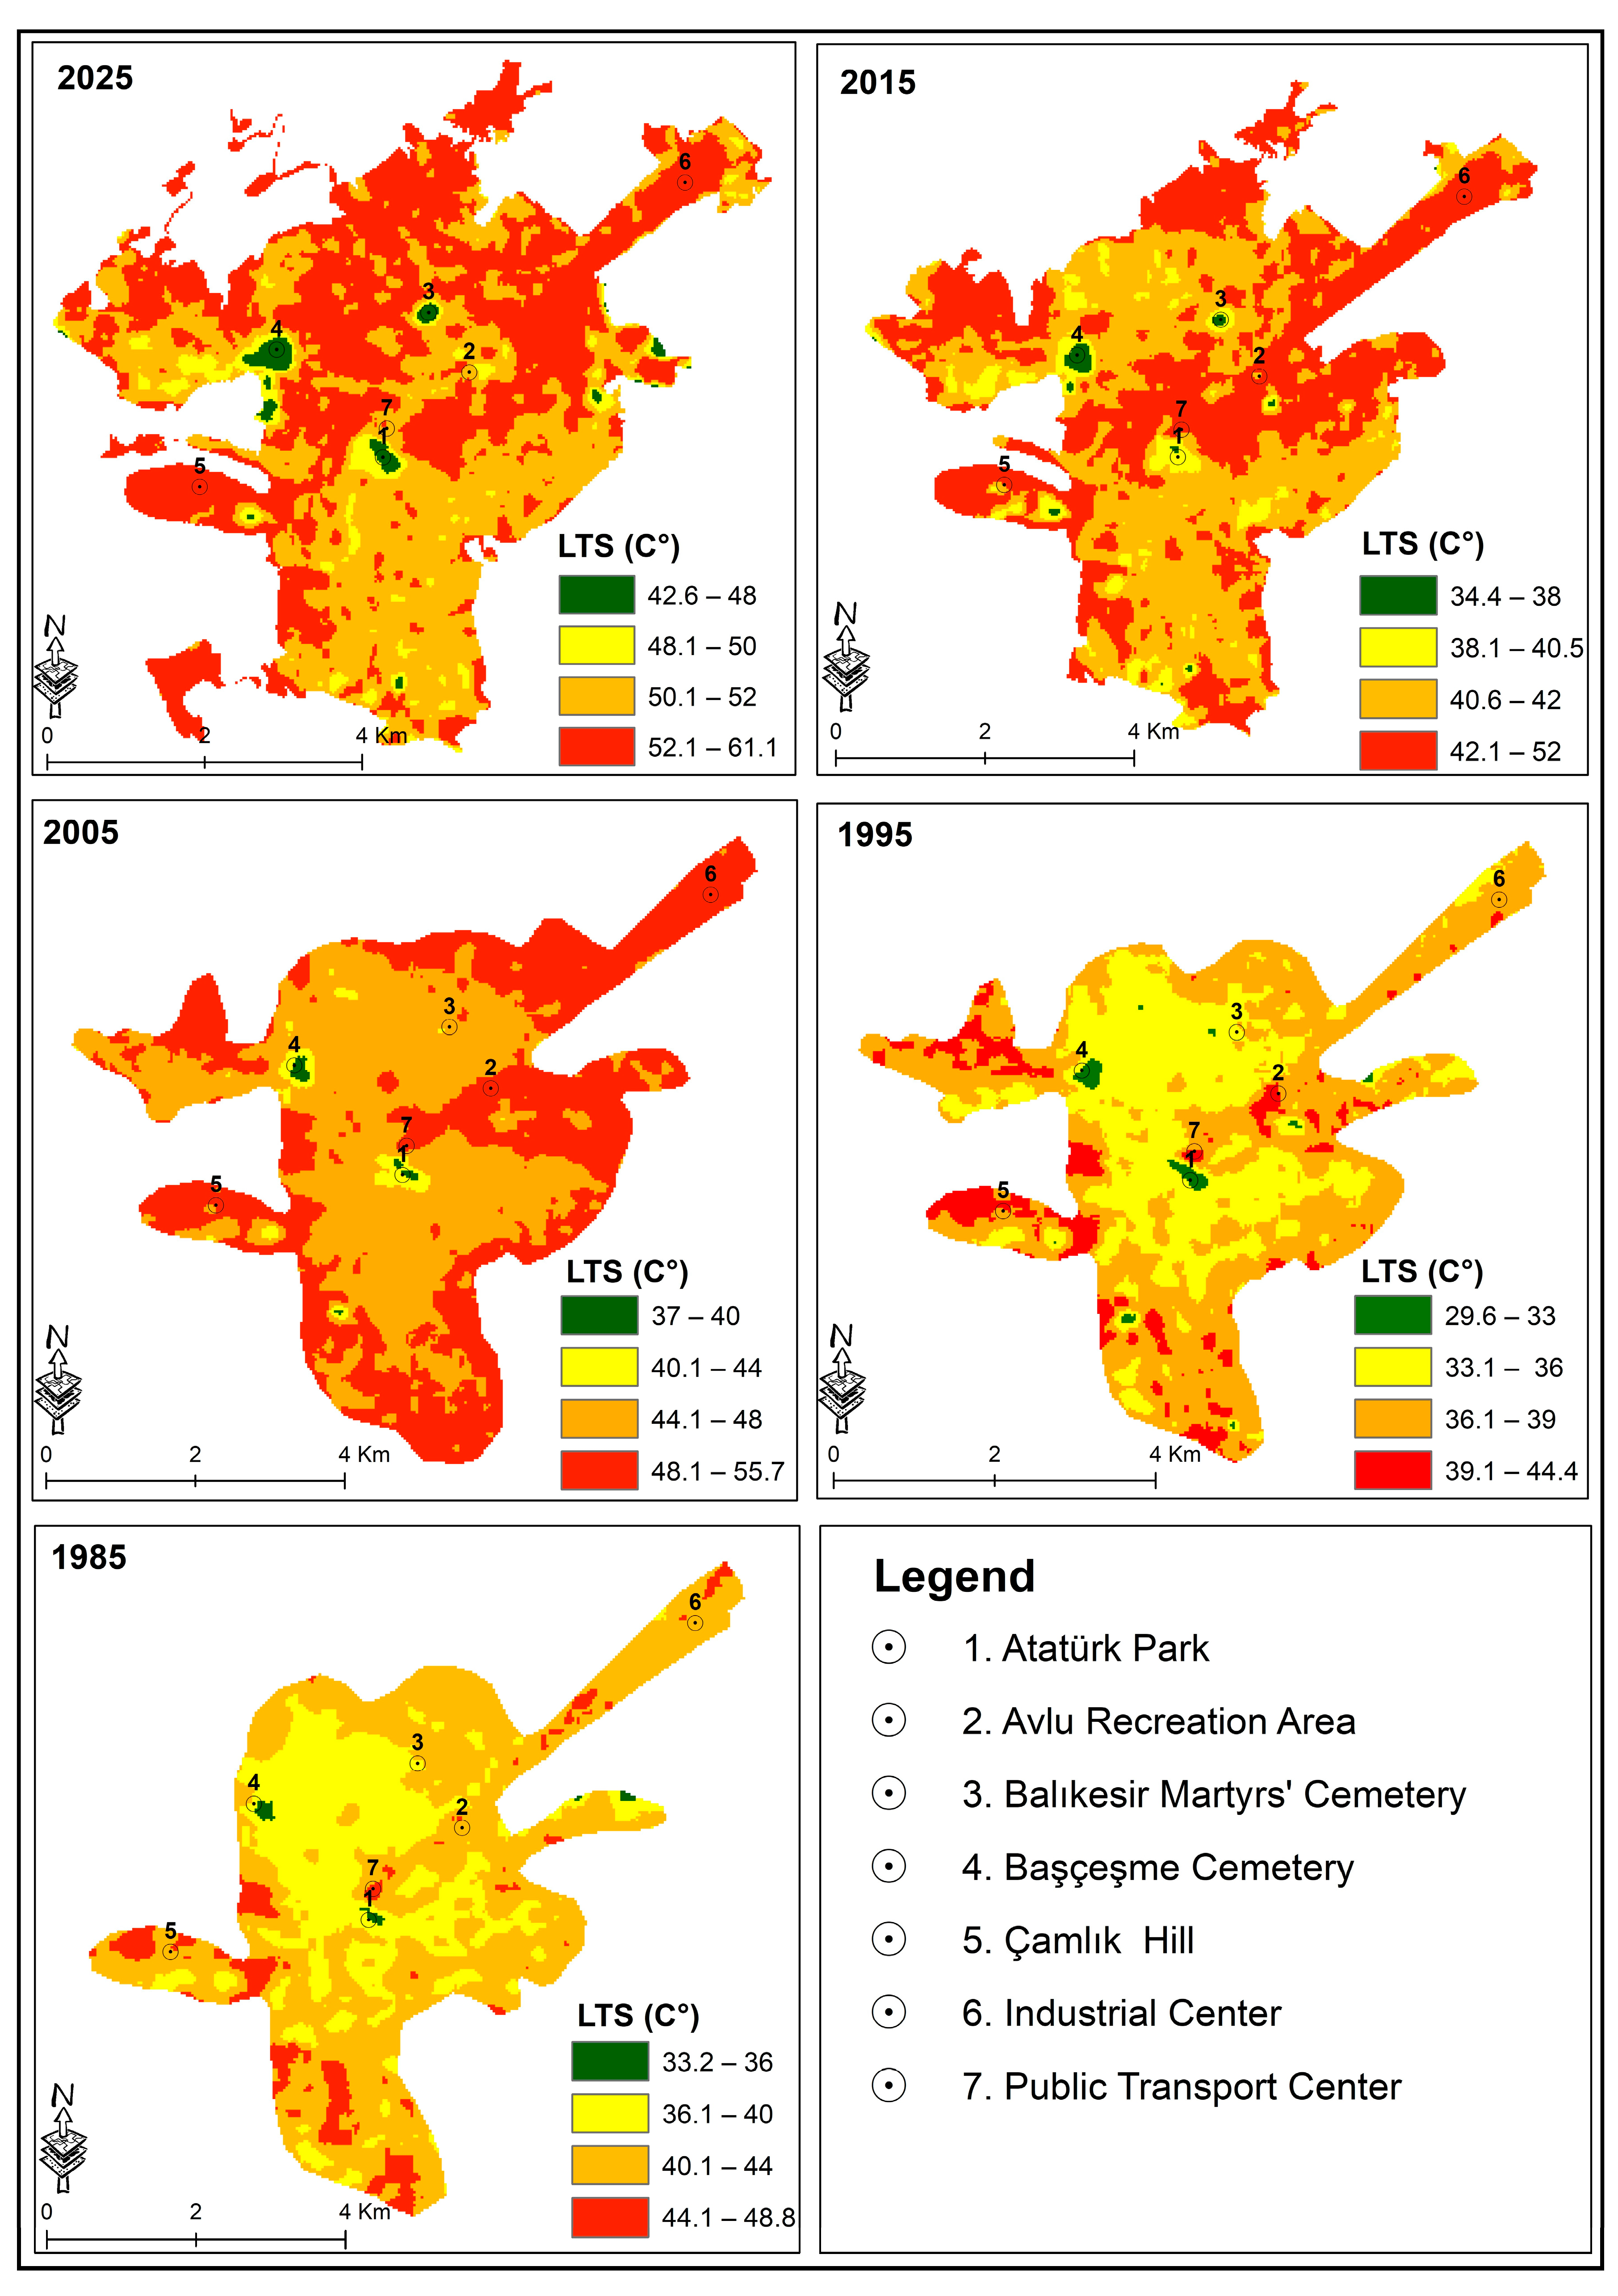
When the results of the analyses conducted within the scope of the study were examined, it was observed that between 1985 and 2025, the built-up rate increased in the city center of Balıkesir due to urban growth, and significant increases in the surface temperature index occurred (Figure 3). In particular, the establishment of the Balıkesir Industrial Center in 1994 increased the urbanization rate in the city, significantly contributing to the rise in surface temperature after 1995. When examining the thematic maps of surface temperature (Figure 3), it was observed that the area where the Public Transportation Center, established before 1985, is located has consistently high surface temperatures, and this area being at the very center of the city is among the city’s major issues.
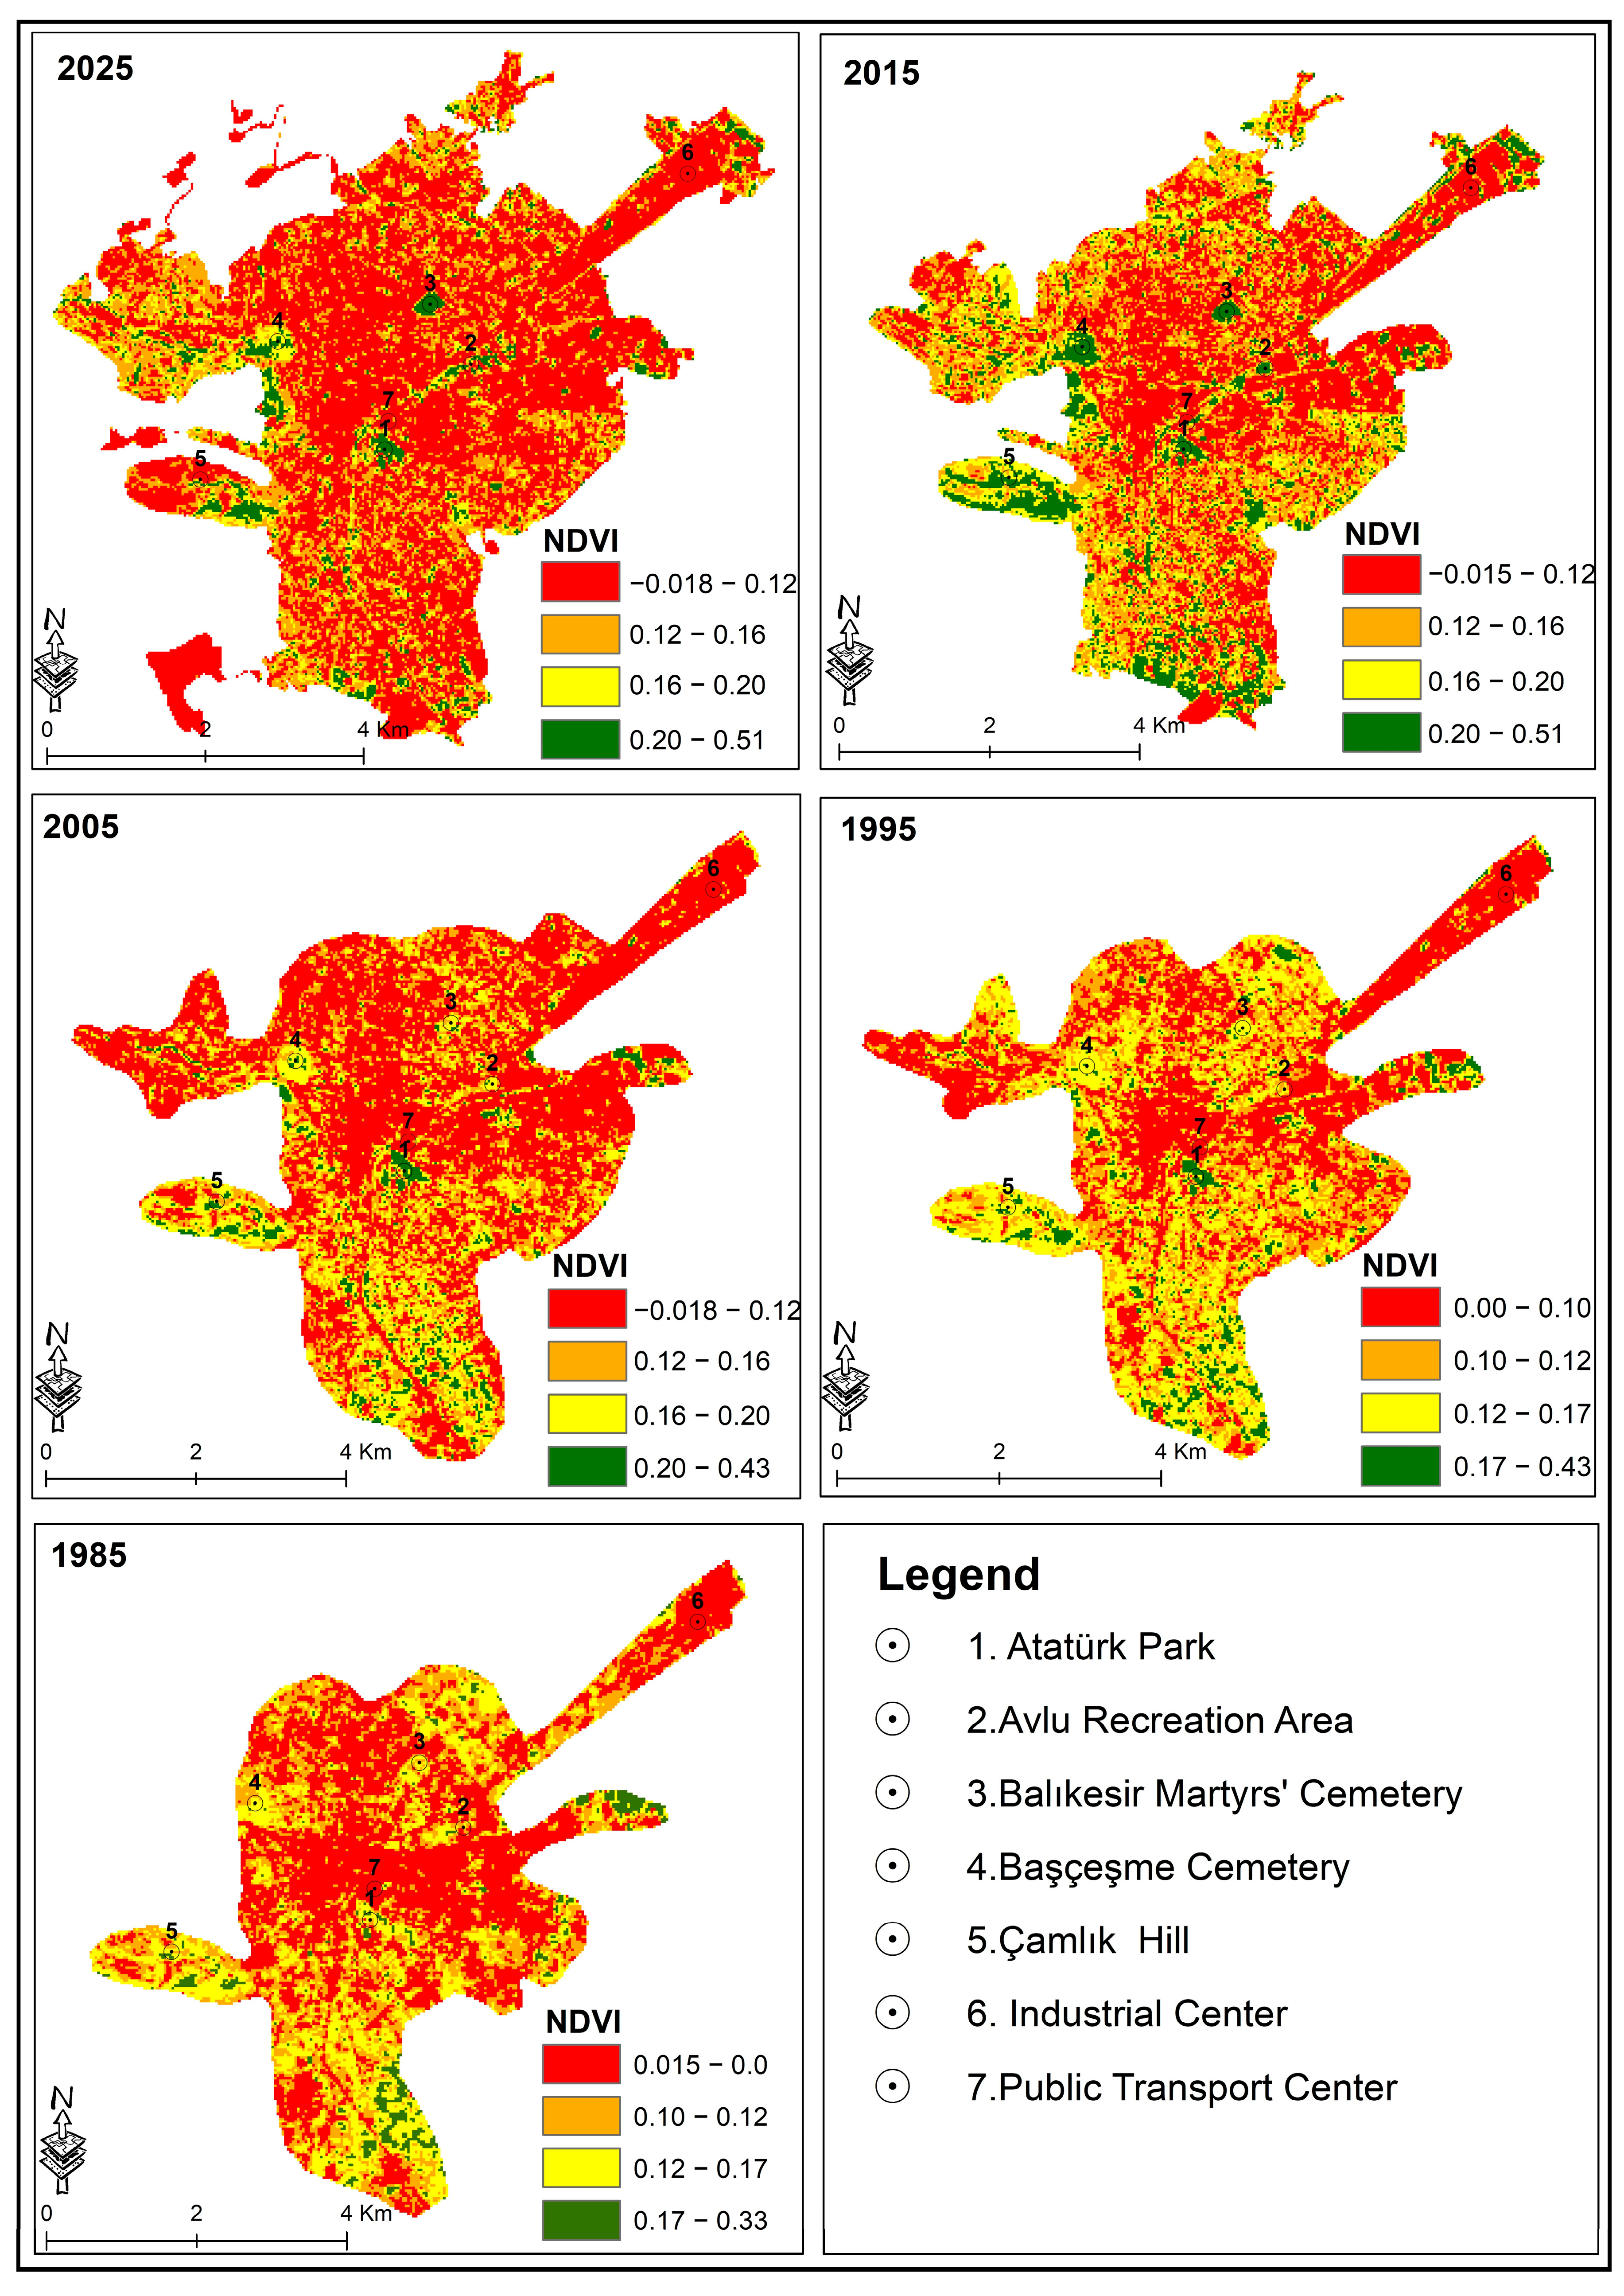
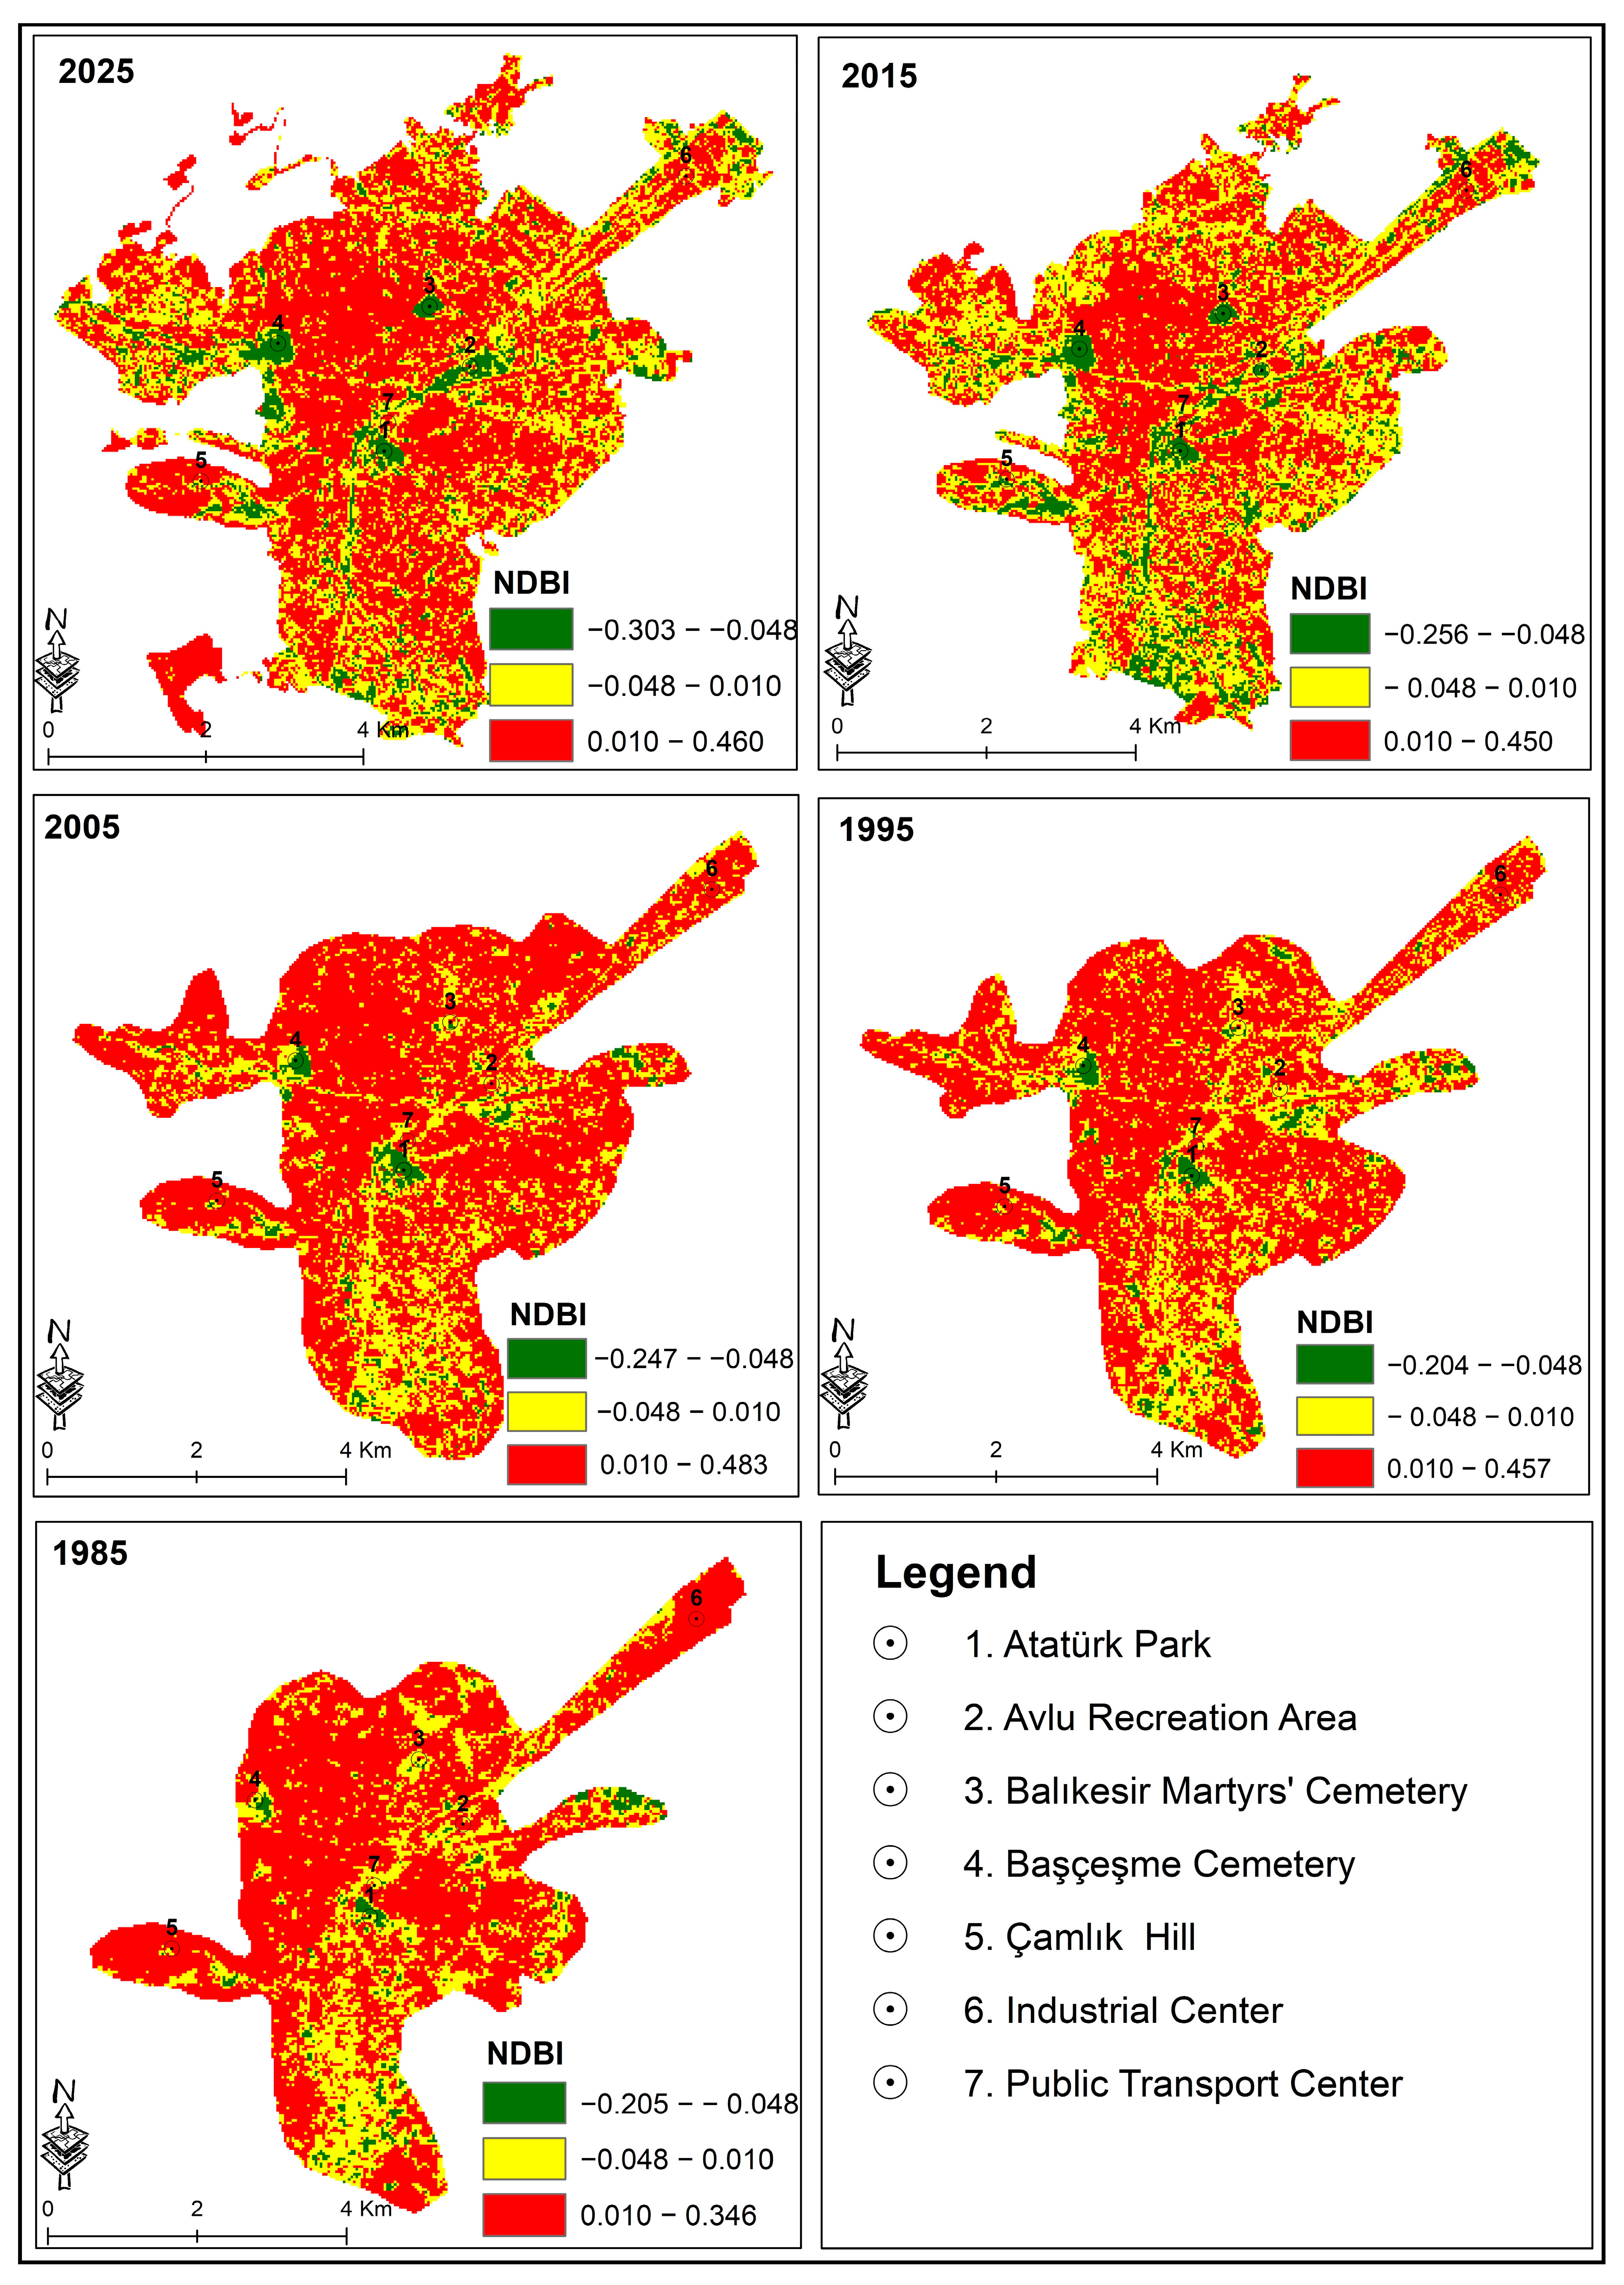
Çamlık Hill, one of the three main green spines playing an important role in the urban ecosystem within the study area, has seen a decrease in its green areas and an upward trend in surface temperature over the years since it began operating as a recreational area. Despite the negative effects of increased construction between 1985 and 2025, the preservation of green areas in certain areas and the creation of new green areas contributed to a decrease in LST values and an increase in NDVI values in these areas. Atatürk Park and Başçeşme Cemetery, which are important green areas for the city, have maintained their green area identity over the years. In addition to these areas, the LST and NDBI values decreased, while the NDVI value increased in the area where the Balıkesir Şehitlik Cemetery, established in 2012 and where intensive vegetation works were carried out, is located after 2015 (Figure 4 and Figure 5).
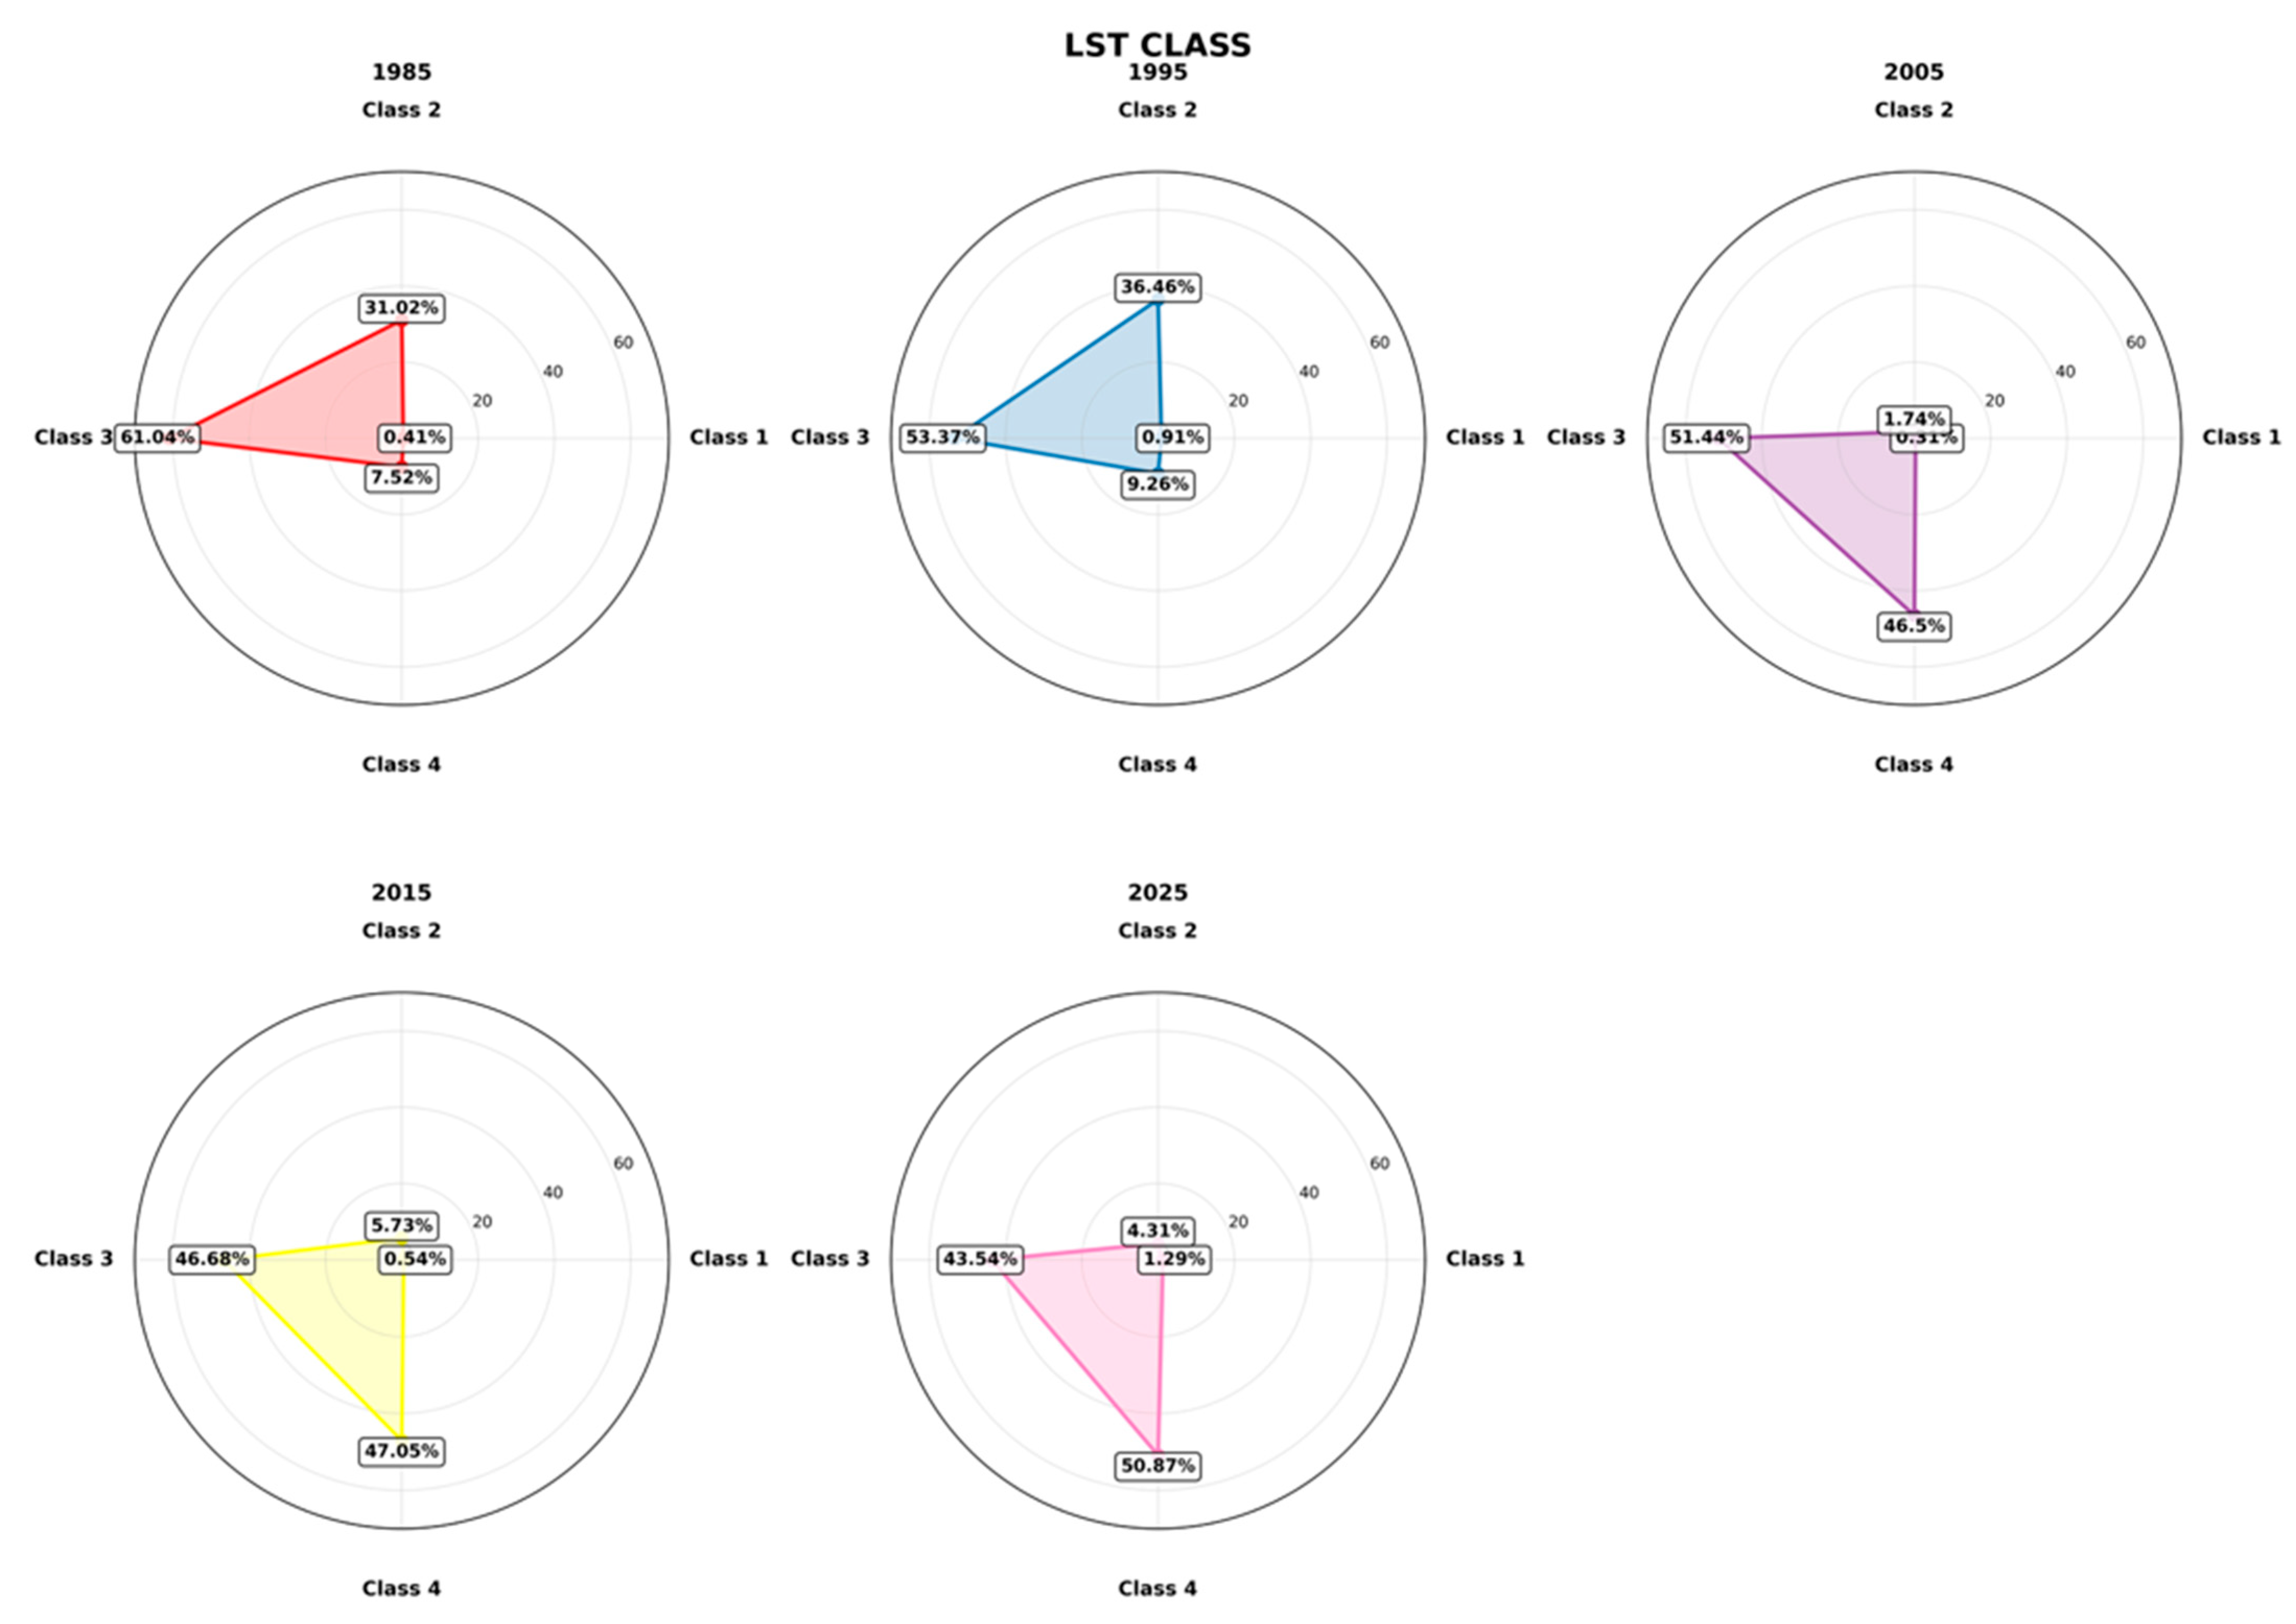
According to the LST analysis results (Figure 6 and Table 2), the average surface temperature was 41 °C in 1985, while in 2025, this rate reached an average of 52 °C. In particular, in 2025, the highest temperature constitutes 50.87% of the total area. This indicates a significant increase in surface warming over the 40-year period between 1985 and 2025. In 2025, Atatürk Park, Başçeşme Cemetery, and Balıkesir Martyrs’ Cemetery were found to be quite effective in reducing surface temperatures not only in their immediate vicinity, but also in the surrounding areas. The vegetation in these areas is generally dense and consists of widely spaced broad-leaved and coniferous trees. The residential and educational buildings around Başçeşme Cemetery and Balıkesir Martyrs’ Cemetery are among the few areas where city residents spend time throughout the year due to the green islands created between them.
In 1985, areas characterized by high NDVI values (above 0.165) accounted for only 3.64% of the study area; however, this proportion increased significantly to nearly 30% by 2015, then fell back to 13.78% in 2025. In areas with low NDVI values, the percentage of areas in the lowest class (–0.02 to 0.12) was 57.21% and 62.37% in 2005 and 2025, respectively, indicating a serious decline in vegetation cover density. The main reason for this situation is the Avlu Recreation Area, indicated by number 2 on the thematic maps, which became operational after 2005. This area was designed and constructed to meet the social and cultural needs of the city’s residents. However, before its construction, the area naturally supported plant life, fulfilling the city’s need for green spaces. After construction, the replacement of vegetation with structural elements became one of the key factors contributing to the decline in NDVI values.
Although the study found that the proportion of areas with high NDBI (>0.010) values was 71.26% in 1985 and 61.35% in 2025, a detailed analysis of the NDBI revealed that artificial surfaces increased between 1985 and 2005 but the rate of increase slowed down after 2015. The analysis also concluded that the decrease in low NDBI classes and negative value ranges indicates that natural surfaces have been replaced by urbanization.

3.2. Cross-Comparison of LST Retrievals Using Multi-Sensor Satellite Data: Landsat, MODIS, and Sentinel-3

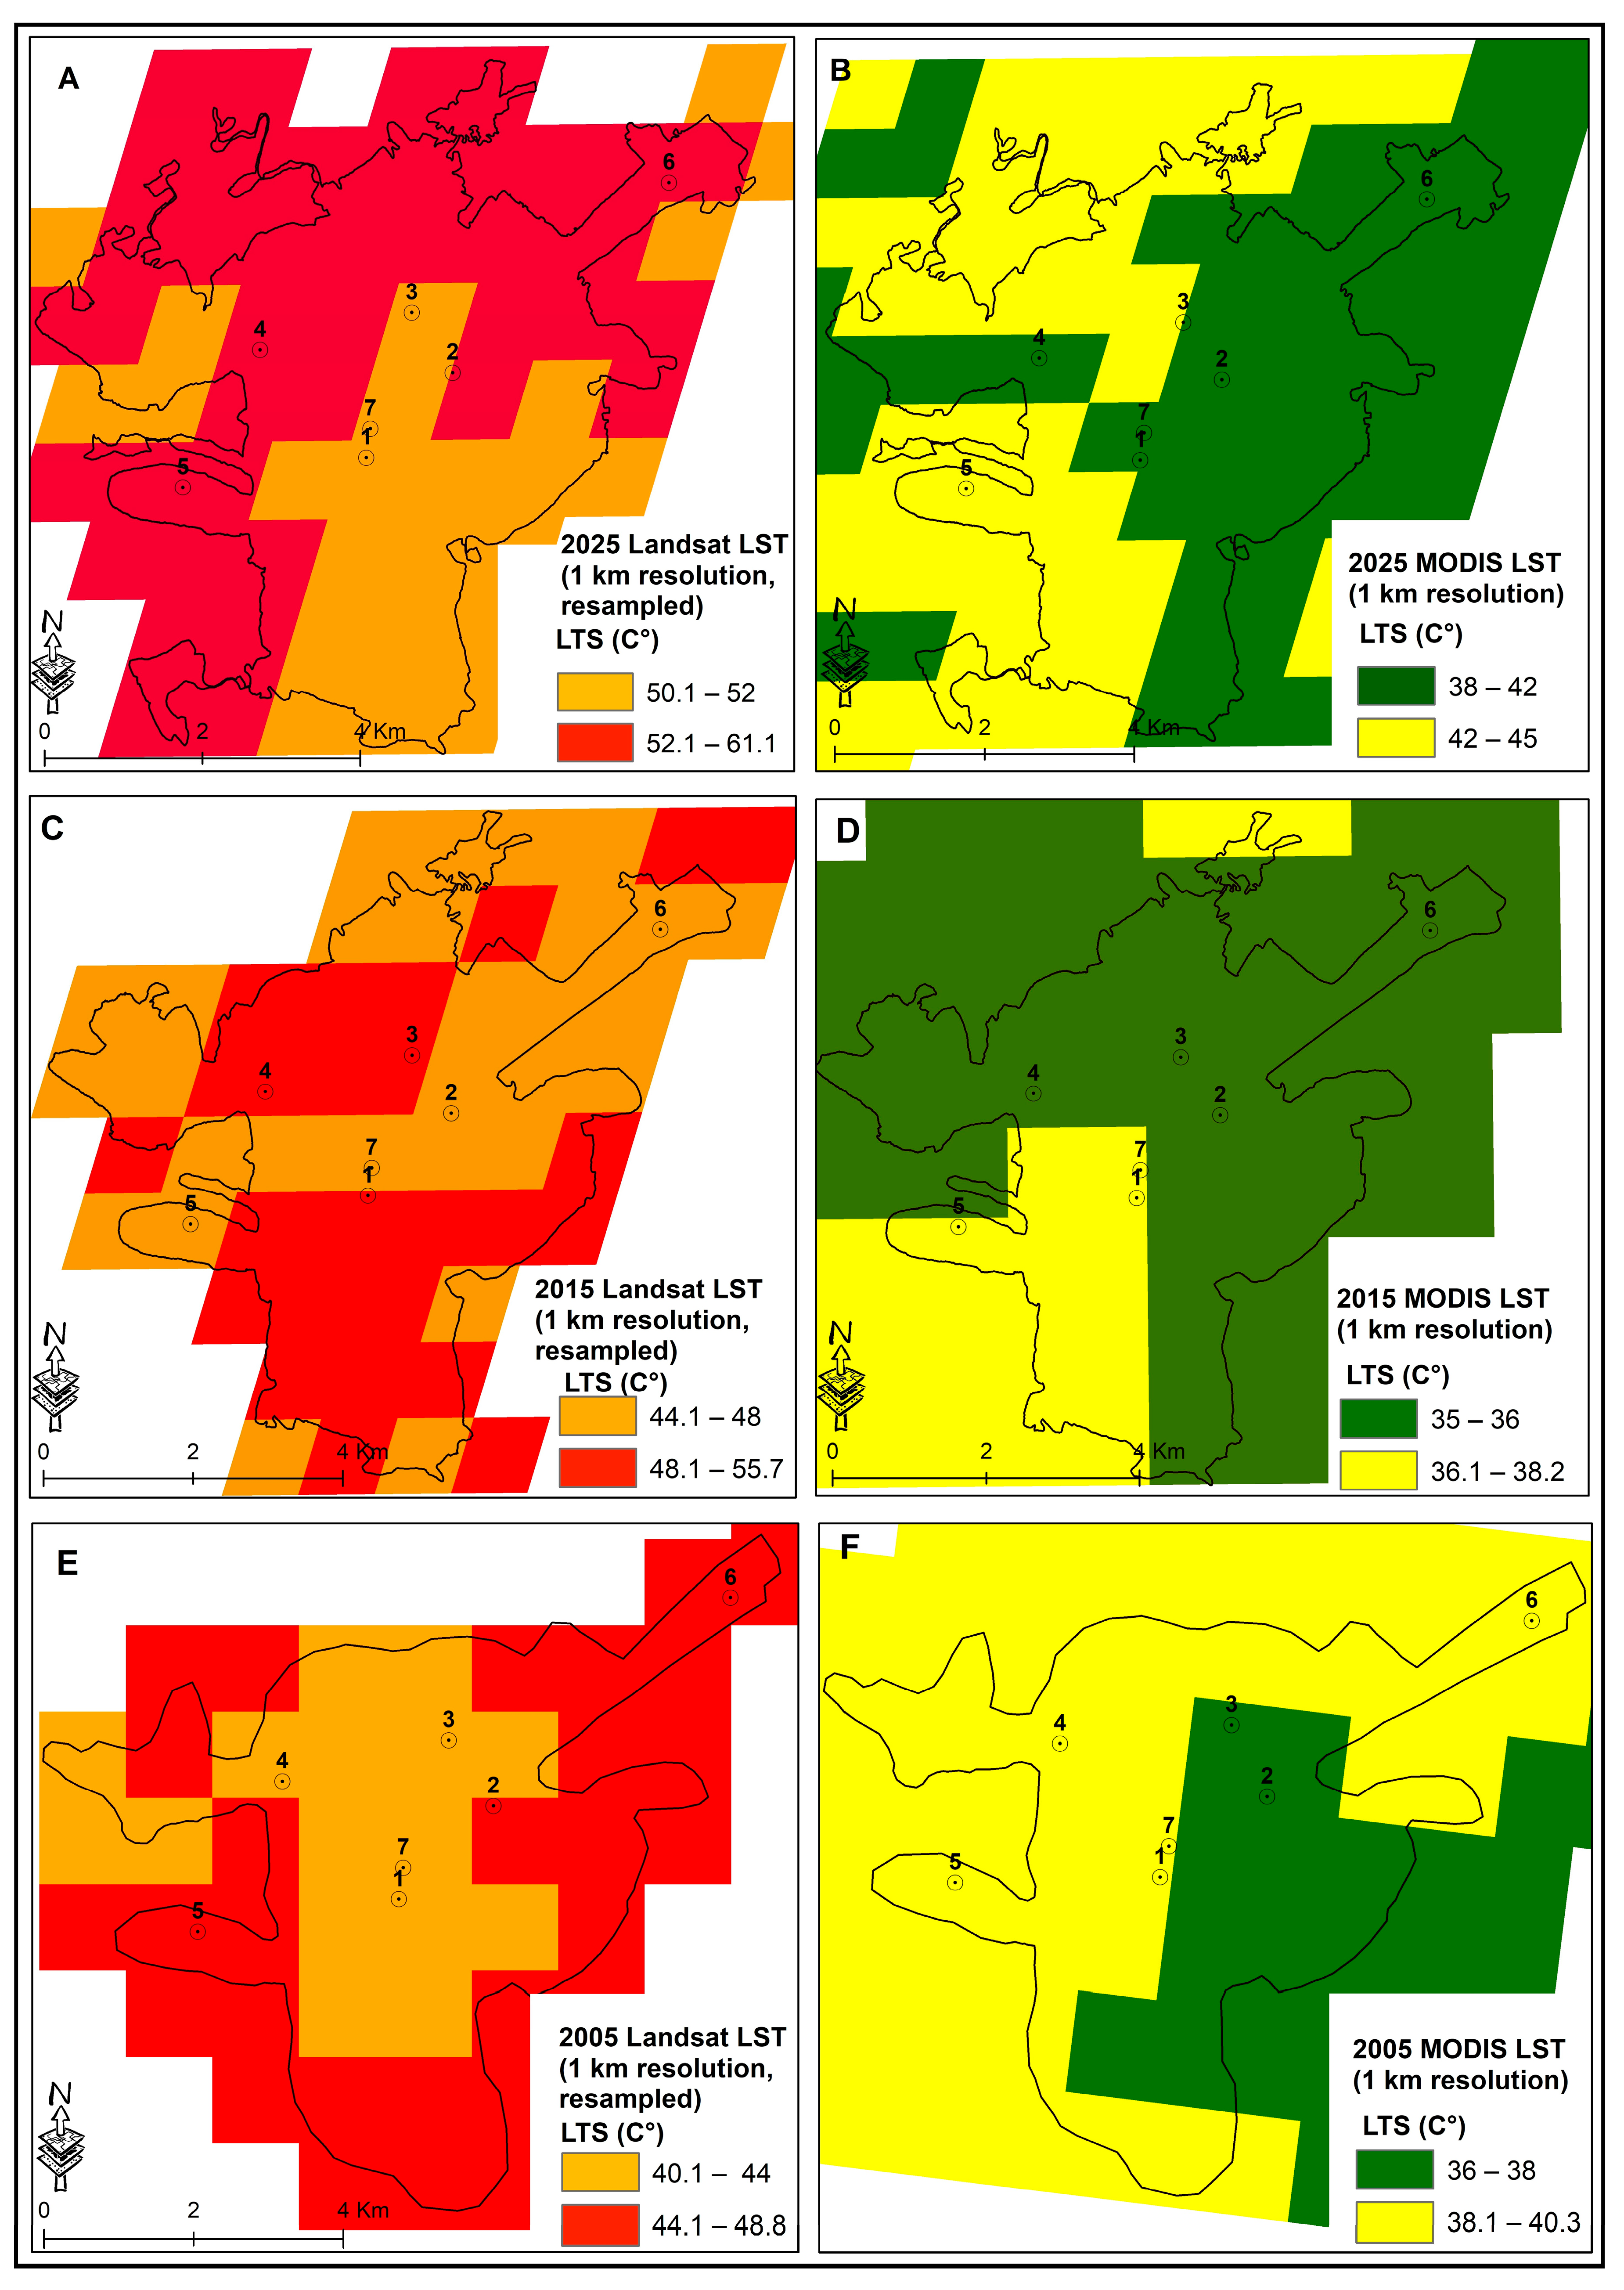
The comparative evaluation of Landsat and MODIS datasets for the years 2005, 2015, and 2025 (Figure 7) revealed a pronounced and persistent upward trajectory in LST values across the study area. Particularly in the analyses derived from Landsat imagery, the maximum LST values increased substantially from 48.8 °C in 2005 to 55.7 °C in 2015, and further escalated to 61.1 °C by 2025. This progressive intensification is strongly associated with the spatial expansion of impervious surfaces, the densification of built-up areas, and the widespread transformation of natural land cover into artificial structures. Such processes collectively reinforce the manifestation of the urban heat island (UHI) effect, illustrating its increasing severity over the past two decades and projecting an even more critical trajectory in the near future. The upward thermal pattern evident in Landsat data underscores the sensitivity of high-resolution imagery in capturing micro-scale variations within heterogeneous urban environments.
In contrast, the MODIS-derived results indicate lower temperature ranges, with values fluctuating between 38 and 40.3 °C in 2005, decreasing slightly to 35–38.2 °C in 2015, and subsequently rising again to 38–45 °C by 2025. These discrepancies relative to Landsat are largely attributable to the coarser spatial resolution of MODIS, which inherently constrains its ability to delineate fine-scale thermal anomalies and localized hot spots. While Landsat captures critical thermal heterogeneity within the urban fabric—particularly in densely built-up cores and fragmented green areas, MODIS tends to smooth localized extremes, thereby reflecting broader regional thermal dynamics rather than neighborhood-scale variations. Despite these differences, the convergence of both datasets in identifying an overall warming trajectory strengthens the reliability of the findings.
The temporal analyses indicate that Landsat imagery is particularly effective in detecting abrupt increases in thermal stress driven by rapid urban expansion, whereas MODIS data are better suited to capturing regional-scale thermal consistency over time due to their higher temporal resolution. Collectively, these complementary datasets underscore the advantages of a multi-sensor approach: Landsat provides the spatial granularity required for detailed urban climate diagnostics and targeted mitigation planning, while MODIS offers the synoptic perspective necessary to situate localized thermal variations within broader climatological contexts.
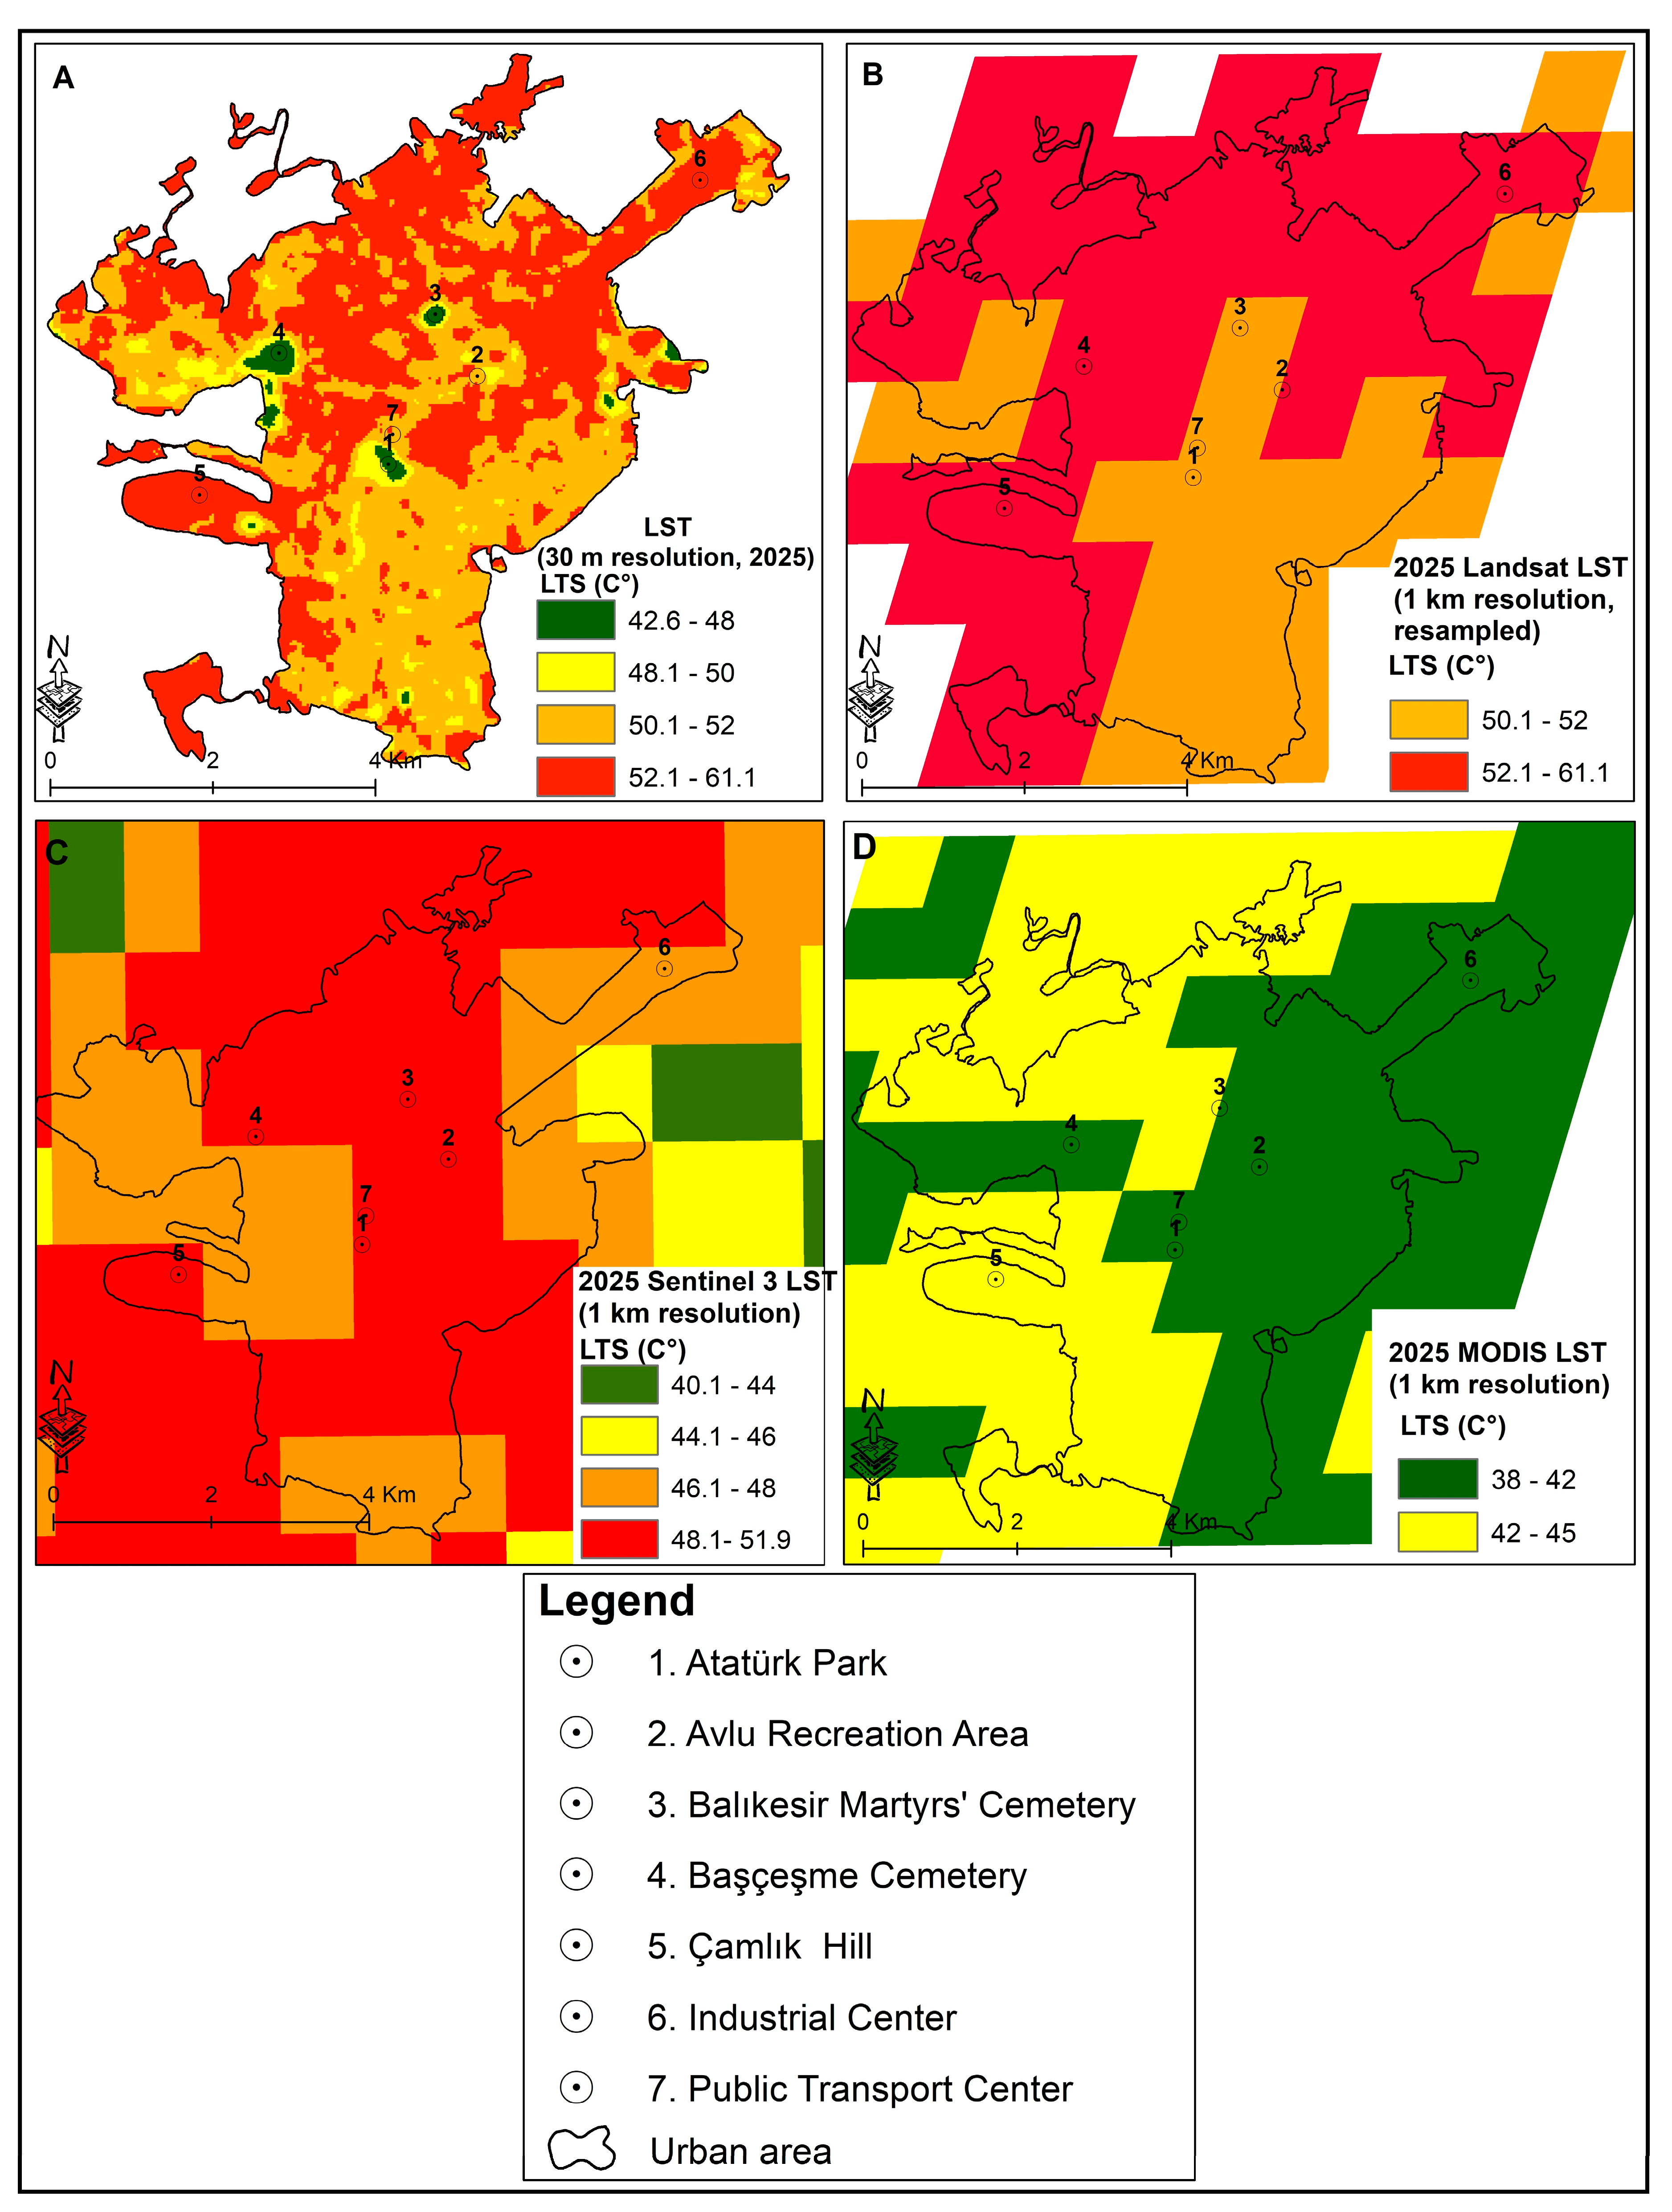
In Figure 8, the 1 km resolution LST maps generated from Landsat, MODIS, and Sentinel-3 products for the year 2025 are comparatively illustrated. The comparative assessment of 2025 LST distributions derived from Landsat, MODIS, and Sentinel-3 datasets revealed both methodological differences and consistent spatiotemporal patterns of urban thermal dynamics. Landsat data at 30 m resolution demonstrated the highest sensitivity in capturing localized thermal heterogeneity, with surface temperatures ranging from 42.6 °C to 61.1 °C and values exceeding 52 °C particularly concentrated in the city center and industrial zones. Green spaces such as Atatürk Park, Başçeşme Cemetery, and Çamlık Hill can be clearly distinguished as cool islands, with relatively lower LST values between 42 and 48 °C, underscoring the regulatory function of urban vegetation in mitigating the intensifying urban heat island (UHI) effect. When resampled to a 1 km resolution, Landsat maps preserved the overall warming trend but lost fine-scale details, leading to the homogenization of thermal patterns and the disappearance of small-scale cool patches. Sentinel-3 data, with values ranging between 40.1 and 51.9 °C, similarly highlighted elevated surface temperatures in built-up and industrial areas, though the coarser resolution limits the detection of micro-scale variations. MODIS products, in contrast, indicated lower overall values (38 –45 °C), reflecting the influence of spatial averaging that smooths localized hot spots but offers a reliable representation of regional-scale thermal dynamics. Despite these discrepancies in absolute values, all three datasets converged in evidencing a substantial intensification of urban heat stress by 2025, directly associated with the expansion of impervious surfaces, the densification of built-up areas, and the transformation of natural land cover.
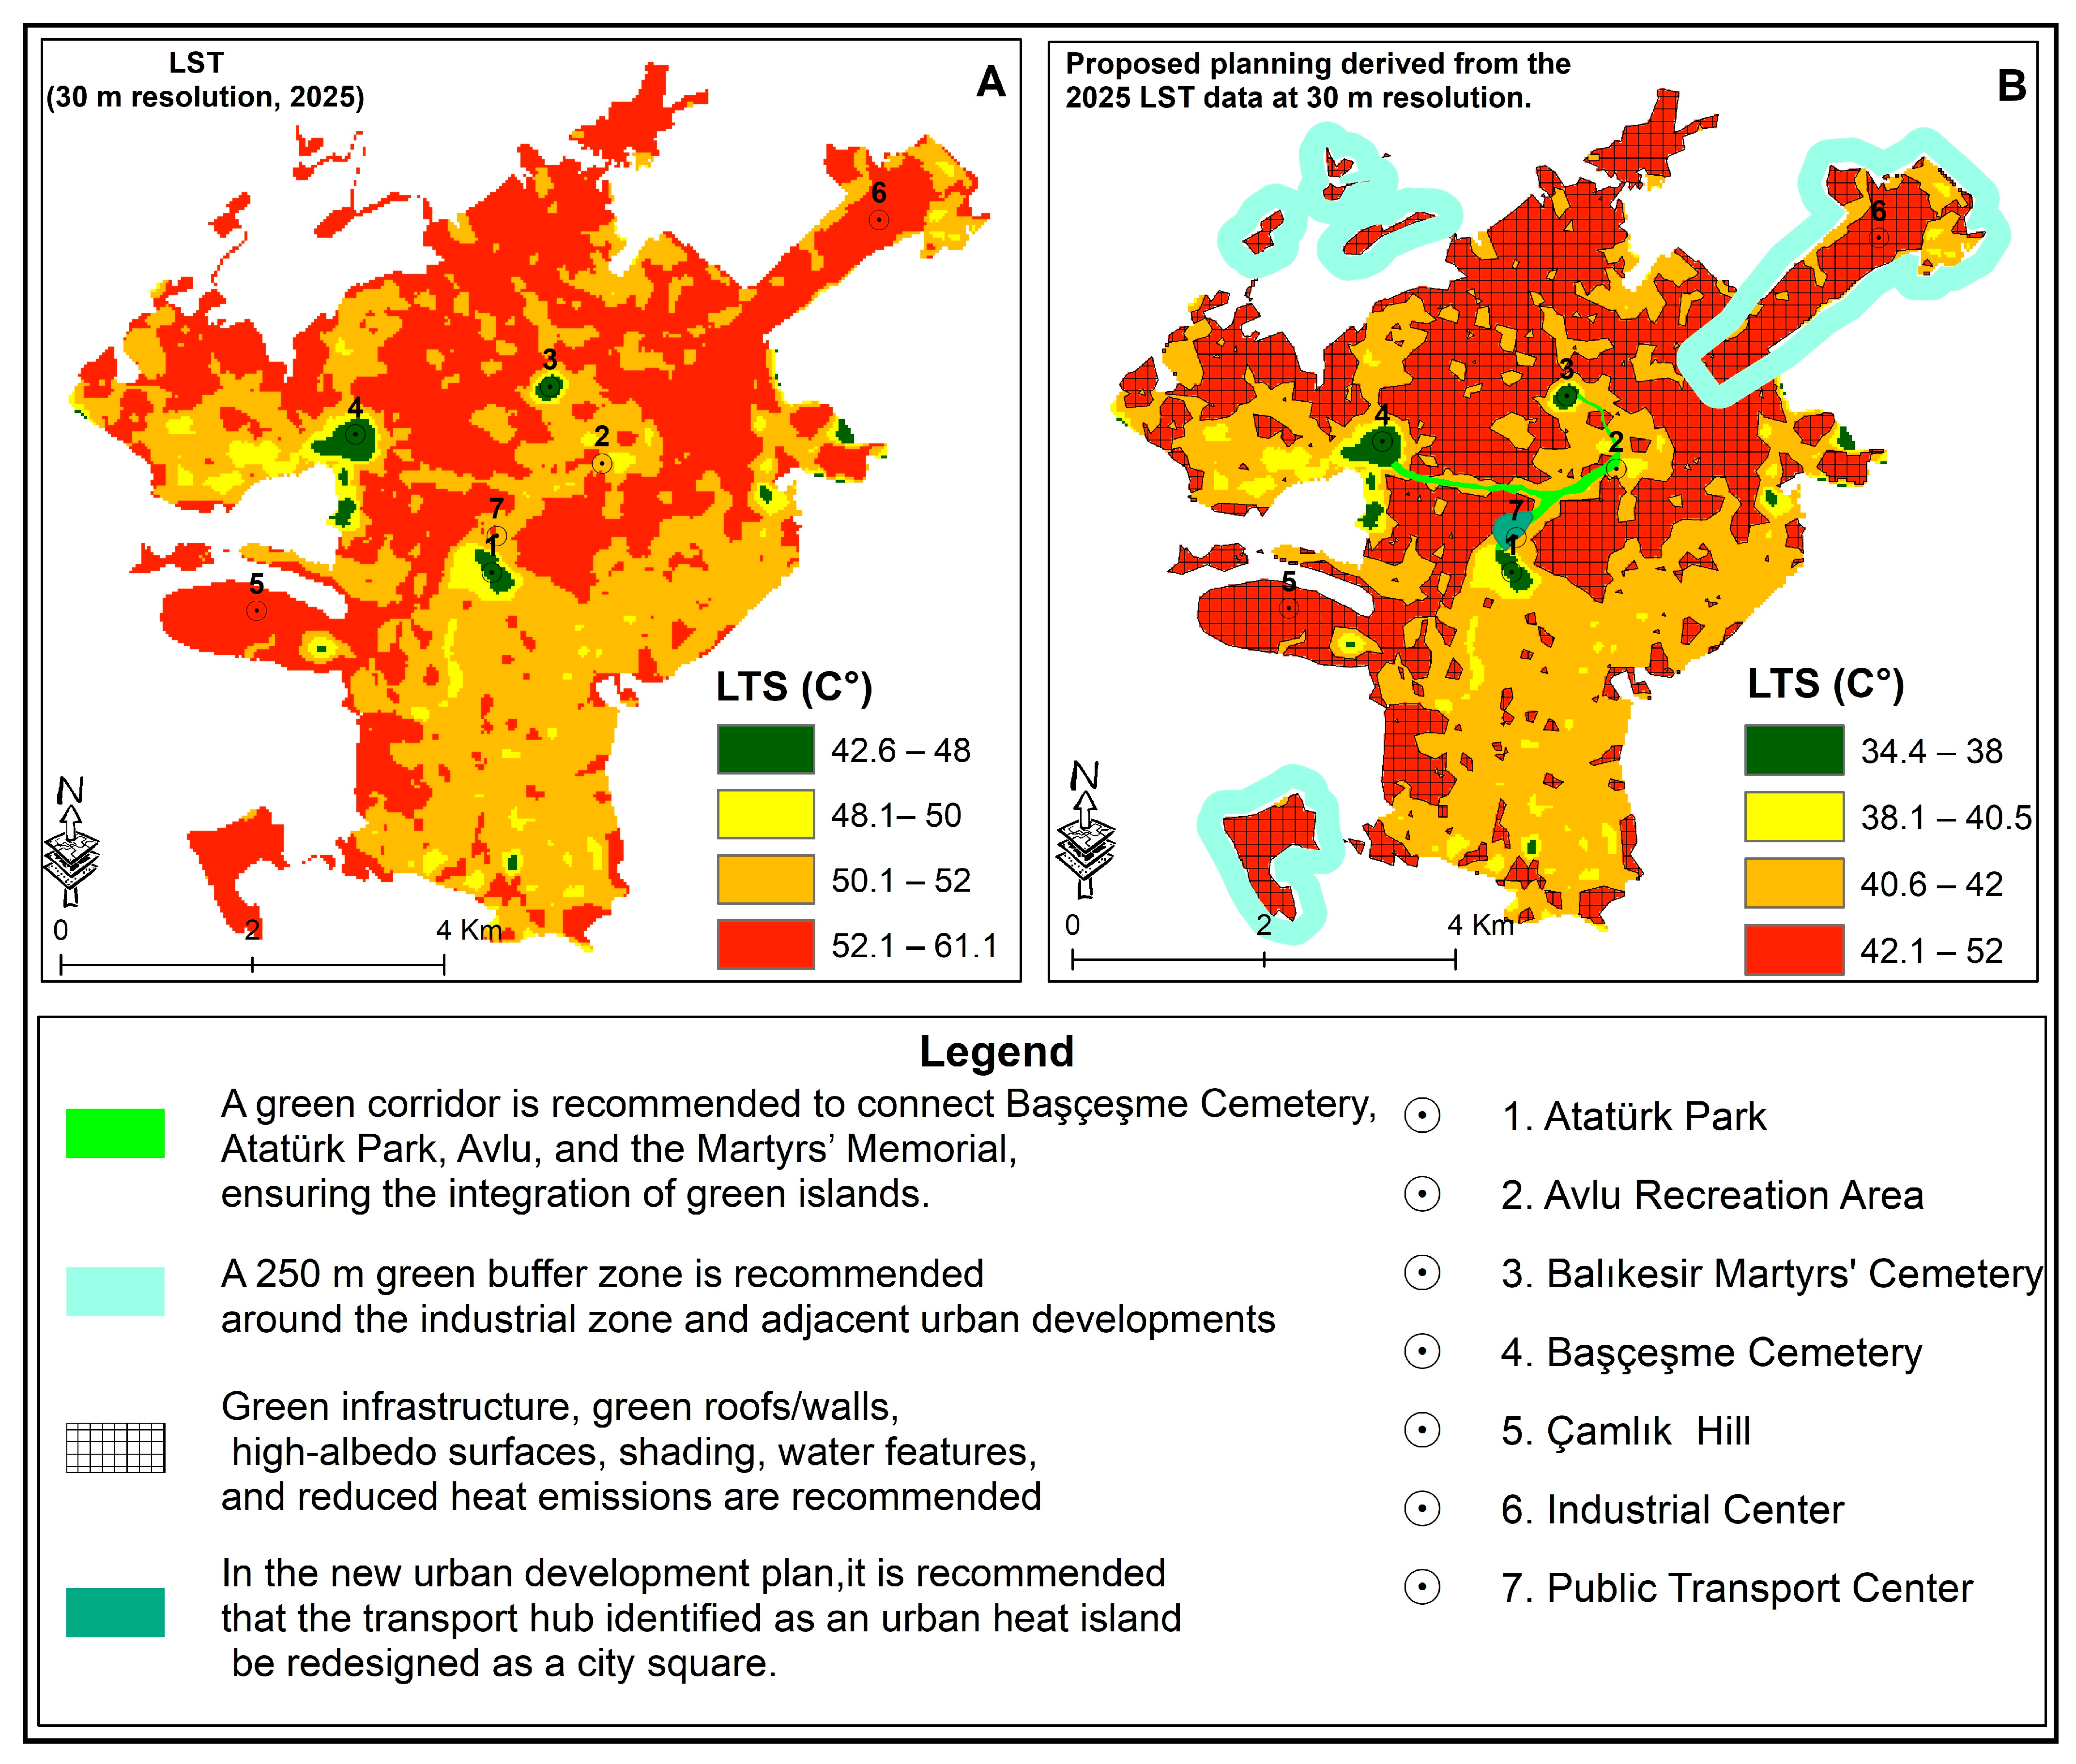
In this study, sustainable planning-based recommendations have been developed to address the increasingly evident urban heat island phenomenon in recent years (Figure 9). These recommendations are informed not only by the findings of the LST analyses, but also by insights derived from consultations with the Department of Urban Aesthetics of Balıkesir Metropolitan Municipality. Furthermore, the proposals have been shaped in line with the current and future objectives outlined in the municipality’s 1:100,000 scale environmental master plans, while field observations have provided additional contributions to the refinement of the proposed strategies. In this study, the primary solution proposed within the framework of sustainable planning is the development of an urban green corridor aimed at enhancing the resilience of the urban ecosystem. The urban green corridor approach is considered a strategic instrument not only for its ecological functions in mitigating the urban heat island effect, but also for strengthening climate resilience and expanding socio-cultural opportunities for recreation. The proposed corridor, connecting Başçeşme Cemetery, Atatürk Park, Avlu, and the Balıkesir Martyrs, is designed in accordance with the principle of ecological connectivity. It is expected to facilitate the integration of cooling green spaces while providing significant contributions to biodiversity conservation, carbon sequestration, and microclimatic regulation.
According to information obtained from municipal authorities, preparations are underway to relocate a substantial portion of the industrial zone outside the city boundaries. As this initiative is still at the conceptual stage of the planning process, green infrastructure strategies have been proposed for the area. In particular, the establishment of green spaces within a 250 m buffer zone has been recommended as a measure to mitigate the thermal intensity generated by industrial activities (Figure 9). The green buffer zones planned around industrial areas are conceived as a mechanism to restrict the spread of both thermal stress and atmospheric pollutants at the urban scale. In high-emission zones, these buffers function as natural barriers that limit thermal energy transfer while simultaneously mitigating air and noise pollution. This strategy aligns with the nature-based solutions advocated in the IPCC AR6 report and demonstrates strong parallels with the “sponge city” practices implemented across Europe.
The planning strategy proposed in this study encompasses not only macro-scale interventions such as green corridors and buffer zones, but also micro-scale green infrastructure measures. In this context, green roofs and walls, high-albedo surfaces, shading elements, and water features contribute to reducing urban surface temperatures by generating localized cooling effects (Figure 9). Consequently, these interventions are expected to deliver significant benefits in terms of improving urban microclimatic conditions, enhancing quality of life, promoting energy efficiency, and advancing public health outcomes.
In the final stage of the study, a transportation-oriented planning proposal was developed (Figure 9). The findings indicate that the centrally located Public Transport Center significantly contributed to the formation of the urban heat island effect between 1985 and 2025. Unlike many other cities, the Balıkesir city center lacks a central square, which typically serves as a defining element of urban identity. Urban squares play a pivotal role in reinforcing collective memory, facilitating social interaction, and functioning as spatial landmarks. For these reasons, the study proposes the relocation of the existing Public Transport Center and the transformation of its site into a square with strong ecological functions that simultaneously reinforces the proposed green corridor. The identification of the Public Transport Center as an urban heat island hot spot and its proposed redesign as a city square represent a noteworthy strategy from the perspective of urban morphology. The reconfiguration of squares through open, vegetated, and permeable surfaces contributes to the reduction in heat accumulation, while simultaneously enhancing socio-cultural interaction spaces and strengthening urban esthetic values. This approach is consistent with the paradigm of climate-resilient urbanism and is regarded as a comprehensive strategy that supports sustainable, transport-oriented development policies.

3.3. Evaluation of Correlation Analysis

The results of the Pearson correlation analysis used to determine the statistical relationship between LST, NDVI, and NDBI are presented in Table 3. When examining the LST–NDBI correlation, a positive relationship was found in all years. The correlation coefficient (r) was +0.30 (moderate) in 1985 and increased to +0.613 (strong) in 2025. The increase in urbanization in the city has caused surface temperatures to rise over time. When examining the NDBI–NDVI correlation, which showed a negative relationship in all years, the correlation coefficient was −0.65 (strong) in 1985 and −0.726 (strong) in 2025. This result reveals an inverse relationship between green areas and urbanization. In the LST–NDVI correlation, a negative relationship was observed every five years. The correlation coefficient was −0.50 (moderate) in 1985 and −0.609 (strong) in 2025. The positive correlation between LST and NDBI has strengthened over time, and the negative relationship with NDVI has also similarly increased. Additionally, the strong negative correlation between NDBI and NDVI indicates that changes in land use have a significant impact on these indices. Across all years, the correlations were statistically significant at the p < 0.001 level, with narrow confidence intervals confirming the robustness and reliability of the results. The partial correlation analyses further disentangled the interdependent effects among variables, isolating the independent contribution of built-up surfaces to the amplification of LST and the direct cooling influence of vegetation. These findings underscore the critical role of green infrastructure in maintaining thermal balance within urban ecosystems and highlight its strategic importance in the development of climate-resilient planning frameworks.

4. Discussion

Since the 2000s, with urbanization becoming a defining phenomenon on a global scale, the expansion of consumption-oriented social life, construction-oriented capital accumulation processes transforming urban spaces into large-scale construction sites, and urbanization reaching its limits in terms of physical and demographic differences have caused many problems in many cities in Turkey in terms of climate, ecology, economy, sociology, and administration [67]. In particular, urbanization and climate change have negatively impacted the climate comfort of urban areas, reducing the proportion of healthy and livable urban environments and spaces. With the urbanization process, the increase in the building stock and the replacement of natural surfaces with artificial materials, significant changes have been observed in the urban climate. The urban heat island phenomenon is among the most important results of these changes. Therefore, understanding and investigating the relationship between urban development and the heat island effect is important for sustainable urban planning [68]. Based on this importance, this study found that Balıkesir, like many other cities in Turkey, has undergone rapid urbanization over time, and that the city’s surface temperature has generally increased during this process. Among the parameters that have contributed to the increase in urbanization in the study area, industrial and residential buildings stand out. The construction of industrial areas near the city center not only negatively impacts climatic comfort, but can also be interpreted as an indicator of unplanned urbanization.
The observed increases in LST at the local scale are indicative not only of urbanization-driven anthropogenic pressures, but also of broader regional climate change. The expansion of residential and industrial areas, accompanied by the proliferation of impervious surfaces, has markedly intensified the UHI effect in metropolitan environments. This phenomenon represents not only a manifestation of localized thermal stress, but also aligns with the wider-scale warming trends reported for the Mediterranean Basin in the IPCC AR6. In Balıkesir, the increase in land surface temperatures from approximately 41 °C in 1985 to 52 °C in 2025 reflects not only a pronounced local warming trend, but also one that is consistent with the regional warming scenarios projected for southern Europe and the Mediterranean in the IPCC AR6. According to AR6, the Mediterranean Basin is expected to experience a warming trajectory above the global average, with an estimated increase of 2.2–3.8 °C relative to the pre-industrial period by the end of the 21st century [5].
This increase is approximately 1.5–2 times higher than global average warming projections, highlighting the region’s vulnerability to climate change. Regional modeling for southern Europe indicates that extreme heat events will become longer and more intense, particularly during the summer months, with a 30–50 percent increase in the frequency of heatwaves and local surface temperatures potentially exceeding 45–50 °C [69]. Therefore, the LST increase observed in Balıkesir shows a rate beyond the values predicted by regional climate projections and indicates that the warming processes reported for the Mediterranean as a whole have more pronounced local-scale reflections. The approximately 11 °C increase during the 1985–2025 period not only confirms atmospheric warming, but also the reinforcing role of anthropogenic pressures such as urbanization, the proliferation of impervious surfaces, and the loss of green spaces.
The AR6 Working Group II report emphasizes that these trends emerging at regional and local levels are critical for the development of effective adaptation policies (IPCC, 2022) [4]. In this context, strategies such as strengthening urban green infrastructure, reducing impervious surfaces, afforestation, and rainwater management, centered on nature-based solutions, are highlighted as key measures to mitigate the effects of expected temperature increases in southern Europe and the Mediterranean [70].
The study highlights the importance of protecting and strengthening urban green infrastructure in reducing surface temperatures. It has been determined that cemeteries, which are classified as passive green areas in parks and urban ecology within the scope of existing active green areas between 1985 and 2025, are effective in reducing surface temperatures. Additionally, cemeteries within the study area boundaries contribute to the urban ecosystem by providing carbon sink areas, microclimatic regulation, quietness, and spiritual value.
The dispersed green spaces across the city have been structured through appropriate planning and design approaches to facilitate the formation of urban green corridors. In densely built-up areas under significant construction pressure, the proposed green corridors play a crucial role in both microclimatic regulation and the maintenance of ecological balance. Furthermore, the transformation of impervious surfaces into permeable ones, the promotion of renewable energy utilization, and the strengthening of blue–green infrastructure systems are of strategic importance not only for the city’s ecological resilience, but also for its economic, social, and cultural sustainability. The planning strategies introduced in this study contribute to the development of sustainable and climate-sensitive cities and constitute one of the distinctive features that differentiate this research from other studies in the existing literature.
This study not only develops strategies for sustainable urban planning, but also ensures the accuracy of micro-scale LST analyses by integrating multi-scale satellite datasets (Landsat, MODIS, and Sentinel-3). In doing so, the study provides a detailed account of the spatial and temporal transformations occurring within urban ecosystems. The analytical results indicate that, particularly at the urban fabric scale, the limitations of MODIS and Sentinel-3 datasets become evident in their capacity to capture the fine-grained dynamics of both urban heat islands and urban green islands. Due to their coarse spatial resolution and reliance on averaged pixel values, these low-resolution products are capable of reflecting only macro-scale thermal trends and fail to represent localized hot spots (heat islands) and small-scale cooling zones (green islands), which are critical components of the urban microclimate. In contrast, the 30 m resolution of Landsat data enables the detailed detection of the heterogeneous urban fabric, explicitly mapping the spatial distribution of heat islands as well as the cooling effects of parks, cemeteries, and recreational areas. This comparison clearly demonstrates that high-resolution datasets are indispensable for urban planning and climate adaptation strategies, whereas low-resolution satellite products remain suitable only for assessing regional-scale thermal patterns.

5. Conclusions

This study investigated the effects of urban growth-related development on LST, NDVI, and NDBI in the city center of Balıkesir between 1985, 1995, 2005, 2015, and 2025. The areas identified as the city’s green focal points—Çamlık Hill, Başçeşme Cemetery, and Atatürk Park—played a significant role in the evaluation of the LST and NDVI analyses. Although urbanization pressure increased significantly in the city between 1985 and 2025, Başçeşme Cemetery and Atatürk Park maintained their urban green space identity, contributing to a decrease in LST values and an increase in NDVI values in their immediate surroundings. Çamlık Hill, on the other hand, has lost its green area identity, especially after 2015, and has transformed into a built recreational area to meet the diverse recreational needs of the city’s residents. This transformation has led to an increase in LST and NDBI values and a decrease in NDVI values in the area and its immediate surroundings.
This study shows that the preservation of urban green spaces and even the creation of new green spaces have a significant impact on LST values. Today, the increasing need for housing due to population growth in urban areas, the development of industry and manufacturing, the construction of new workplaces, the expansion of transportation systems, and the increase in construction for various recreational activities have become an inevitable situation for many countries. Similarly, the expansion and increased construction in the city center of Balıkesir stem from the same causes. This situation contributes to the increase in urban surface temperatures and is among the most important parameters in the formation of urban heat islands. Sustainable urban planning, design, and management play a critical role in preventing this situation. For example, in this study, the Balıkesir Martyrs’ Cemetery, built after 2012, and the Başçeşme Cemetery and Atatürk Park, preserved from the past to the present, are important examples of sustainable urban planning and management in reducing surface temperatures and even minimizing the effects of climate change. Therefore, the implementation of blue–green infrastructure systems in urban areas and the development of policies aimed at this end are necessary. Integrating blue–green infrastructure strategies into urban master plans, supported by adaptive design and nature-based solutions, would enhance the city’s climate resilience and ecological connectivity. In particular, establishing ecological corridors between existing green areas could strengthen the heat mitigation capacity and improve urban biodiversity. It is considered that collaboration between public institutions, civil society organizations, and universities in the city would be beneficial in developing restorative and sustainable environmental policies.

Author Contributions

Conceptualization, F.A. and F.B.; Methodology, F.A. and F.B.; Validation, F.A. and F.B.; Formal analysis, F.A. and F.B.; Investigation, F.B.; Resources, F.A.; Data curation, F.A.; Writing—original draft preparation, F.A.; Writing—review and editing, F.B.; Visualization, F.A. and F.B.; Supervision, F.A. All authors have read and agreed to the published version of the manuscript.

Funding

This research received no external funding.

Data Availability Statement

The raw data supporting the conclusions of this article will be made available by the authors on request.

Conflicts of Interest

The authors declare no conflicts of interest.

Abbreviations

The following abbreviations are used in this manuscript:
LSTLand surface temperature
NDVINormalized difference vegetation index
NDBINormalized difference built-up index
UHIUrban heat island
LULCLand use and land cover

References

  1. Seto, K.C.; Reenberg, A.; Boone, C.G.; Fragkias, M.; Haase, D.; Langanke, T.; Marcotullio, P.; Munroe, D.K.; Olah, B.; Simon, D. Urban land teleconnections and sustainability. Proc. Natl. Acad. Sci. USA 2012, 109, 7687–7692. [Google Scholar] [CrossRef]
  2. Shen, P.; Wang, M.; Liu, J.; Ji, Y. Hourly air temperature projection in future urban area by coupling climate change and urban heat island effect. Energy Build. 2023, 279, 112676. [Google Scholar] [CrossRef]
  3. Zhang, Y.; Teoh, B.K.; Zhang, L. Multi-objective optimization for energy-efficient building design considering urban heat island effects. Appl. Energy 2024, 376, 124117. [Google Scholar] [CrossRef]
  4. IPCC. Climate Change 2022: Impacts, Adaptation, and Vulnerability. In Contribution of Working Group II to the Sixth Assessment Report of the Intergovernmental Panel on Climate Change; Cambridge University Press: Cambridge, UK, 2022. [Google Scholar]
  5. IPCC. Climate Change 2021: The Physical Science Basis. In Contribution of Working Group I to the Sixth Assessment Report of the Intergovernmental Panel on Climate Change; Cambridge University Press: Cambridge, UK, 2021. [Google Scholar]
  6. He, B.J.; Fu, X.; Zhao, Z.; Chen, P.; Sharifi, A.; Li, H. Capability of LCZ scheme to differentiate urban thermal environments in five megacities of China: Implications for integrating LCZ system into heat–resilient planning and design. IEEE J. Sel. Top. Appl. Earth Obs. Remote Sens. 2024, 17, 18800. [Google Scholar] [CrossRef]
  7. Cui, Y.; Yin, M.; Cheng, X.; Tang, J.; He, B.J. Towards cool cities and communities: Preparing for an increasingly hot future by the development of heat-resilient infrastructure and urban heat management plan. Environ. Technol. Innov. 2024, 34, 103568. [Google Scholar] [CrossRef]
  8. Li, X.; Stringer, L.C.; Dallimer, M. The impacts of urbanisation and climate change on the urban thermal environment in Africa. Climate 2022, 10, 164. [Google Scholar] [CrossRef]
  9. Bilgiç, E.; Baba, A. Effect of urbanization on water resources: Challenges and prospects. In Groundwater in Arid and Semi-Arid Areas: Monitoring, Assessment, Modelling, and Management; Zektser, I.S., Ed.; Springer: Cham, Switzerland, 2023; pp. 81–108. [Google Scholar]
  10. Purvis, B.; Mao, Y.; Robinson, D. A multi-scale integrated assessment model to support urban sustainability. Sustain. Sci. 2022, 17, 151–169. [Google Scholar] [CrossRef]
  11. Azizi, P.; Soltani, A.; Bagheri, F.; Sharifi, S.; Mikaeili, M. An integrated modelling approach to urban growth and land use/cover change. Land 2022, 11, 1715. [Google Scholar] [CrossRef]
  12. Gaur, S.; Singh, R. A comprehensive review on land use/land cover (LULC) change modeling for urban development: Current status and future prospects. Sustainability 2023, 15, 903. [Google Scholar] [CrossRef]
  13. Kesikoglu, M.H.; Ozkan, C.; Kaynak, T. The impact of impervious surface, vegetation, and soil areas on land surface temperatures in a semi-arid region using Landsat satellite images enriched with Ndaisi method data. Environ. Monit. Assess. 2021, 193, 143. [Google Scholar] [CrossRef]
  14. Dutta, D.; Rahman, A.; Paul, S.K.; Kundu, A. Impervious surface growth and its inter-relationship with vegetation cover and land surface temperature in peri-urban areas of Delhi. Urban Clim. 2021, 37, 100799. [Google Scholar] [CrossRef]
  15. Kaiser, E.A.; Rolim, S.B.A.; Grondona, A.E.B.; Hackmann, C.L.; Linn, R.d.M.; Käfer, P.S.; da Rocha, N.S.; Diaz, L.R. Spatiotemporal influences of LULC changes on land surface temperature in rapid urbanization area by using Landsat-TM and TIRS images. Atmosphere 2022, 13, 460. [Google Scholar] [CrossRef]
  16. Deilami, K.; Kamruzzaman, M.; Liu, Y. Urban heat island effect: A systematic review of spatio-temporal factors, data, methods, and mitigation measures. Int. J. Appl. Earth Obs. Geoinf. 2018, 67, 30–42. [Google Scholar] [CrossRef]
  17. Wan, Y.; Yang, S.; Han, H.; Mao, Y.; Liu, X.; You, M.; Fu, X.; Tang, J.; Cheshmehzangi, A.; Zahed, L.M.; et al. Contributions of natural and anthropogenic factors to summertime thermal environments across different urban scales: An investigation in Chengdu-Chongqing agglomeration, China. Environ. Impact Assess. Rev. 2025, 115, 107981. [Google Scholar] [CrossRef]
  18. Pandey, B.; Ghosh, A. Urban ecosystem services and climate change: A dynamic interplay. Front. Sustain. Cities 2023, 5, 1281430. [Google Scholar] [CrossRef]
  19. Aghaloo, K.; Sharifi, A. Balancing priorities for a sustainable future in cities: Land use change and urban ecosystem service dynamics. J. Environ. Manag. 2025, 382, 125460. [Google Scholar] [CrossRef] [PubMed]
  20. McGarigal, K.; Compton, B.W.; Plunkett, E.B.; DeLuca, W.V.; Grand, J.; Ene, E.; Jackson, S.D. A landscape index of ecological integrity to inform landscape conservation. Landsc. Ecol. 2018, 33, 1029–1048. [Google Scholar] [CrossRef]
  21. Altıner, F.; Kelkit, A. Land use cover change analysis (1985–2020) of Ayvalık district Balıkesir Türkiye using geographic ınformation systems and remote sensing. Fresenius Environ. Bull. 2021, 30, 8275–8283. [Google Scholar]
  22. Cengiz, S.; Atmiş, E.; Görmüş, S. The impact of economic growth oriented development policies on landscape changes in Istanbul Province in Turkey. Land Use Policy 2019, 87, 104086. [Google Scholar] [CrossRef]
  23. Liu, J.; Xiong, J.; Chen, Y.; Sun, H.; Zhao, X.; Tu, F.; Gu, Y. An integrated model chain for future flood risk prediction under land-use changes. J. Environ. Manag. 2023, 342, 118125. [Google Scholar] [CrossRef]
  24. Şenik, B.; Uzun, O. Evaluating the impact of mega-projects-induced land-cover changes on habitat quality: A case study of Istanbul. Landsc. Res. 2025, 1–19. [Google Scholar] [CrossRef]
  25. Schott, J.R.; Hook, S.J.; Barsi, J.A.; Markham, B.L.; Miller, J.; Padula, F.P.; Raqueno, N.G. Thermal infrared radiometric calibration of the entire Landsat 4, 5, and 7 archive (1982–2010). Remote Sens. Environ. 2012, 122, 41–49. [Google Scholar] [CrossRef]
  26. Salan, M.S.A.; Bhuiyan, M.A.H. Estimating impacts of micro-scale land use/land cover change on urban thermal comfort zone in Rajshahi; Bangladesh: A GIS and remote sensing based approach. Urban Clim. 2024, 58, 102187. [Google Scholar] [CrossRef]
  27. Amani, S.; Shafizadeh-Moghadam, H.; Morid, S. Integrating sentinel-2 and sentinel-3 for actual evapotranspiration estimation across diverse climate zones using the sen-ET plugin and machine learning models. Earth Sci. Inform. 2025, 18, 338. [Google Scholar] [CrossRef]
  28. Xu, W.; Wooster, M.J. Sentinel-3 SLSTR active fire (AF) detection and FRP daytime product—Algorithm description and global intercomparison to MODIS, VIIRS and landsat AF data. Sci. Remote Sens. 2023, 7, 100087. [Google Scholar] [CrossRef]
  29. Li, K.; Guan, K.; Jiang, C.; Wang, S.; Peng, B.; Cai, Y. Evaluation of four new land surface temperature (LST) products in the US corn belt: ECOSTRESS, GOES-R, landsat, and sentinel-3. IEEE J. Sel. Top. Appl. Earth Obs. Remote Sens. 2021, 14, 9931–9945. [Google Scholar] [CrossRef]
  30. Zeynali, B.; Mollanouri, E.; Safari, S. Comparison of the accuracy of Landsat 9 and Sentinel 3 satellite data in estimating the Land surface temperature (case study: Ardabil city). J. Clim. Res. 2024, 1402, 137–147. [Google Scholar]
  31. Huete, A.; Didan, K.; Miura, T.; Rodriguez, E.P.; Gao, X.; Ferreira, L.G. Overview of the radiometric and biophysical performance of the MODIS vegetation indices. Remote Sens. Environ. 2002, 83, 195–213. [Google Scholar] [CrossRef]
  32. Ghaderpour, E.; Mazzanti, P.; Bozzano, F.; Scarascia Mugnozza, G. Trend analysis of MODIS land surface temperature and land cover in Central Italy. Land 2024, 13, 796. [Google Scholar] [CrossRef]
  33. He, X.; Wang, D.; Gao, S.; Li, X.; Chang, G.; Jia, X.; Chen, Q. The anisotropy of MODIS LST in urban areas: A perspective from different time scales using model simulations. ISPRS J. Photogramm. Remote Sens. 2024, 209, 448–460. [Google Scholar] [CrossRef]
  34. Zhan, W.; Chen, Y.; Zhou, J.; Wang, J.; Liu, W.; Voogt, J.; Zhu, X.; Quan, J.; Li, J. Disaggregation of remotely sensed land surface temperature: Literature survey, taxonomy, issues, and caveats. Remote Sens. Environ. 2013, 131, 119–139. [Google Scholar] [CrossRef]
  35. Peng, S.S.; Piao, S.; Zeng, Z.; Ciais, P.; Zhou, L.; Li, L.Z.; Myneni, R.B.; Yin, Y.; Zeng, H. Afforestation in China cools local land surface temperature. Proc. Natl. Acad. Sci. USA 2014, 111, 2915–2919. [Google Scholar] [CrossRef]
  36. Odindi, J.O.; Bangamwabo, V.; Mutanga, O. Assessing the value of urban green spaces in mitigating multi-seasonal urban heat using MODIS land surface temperature (LST) and Landsat 8 data. Int. J. Environ. Res. 2015, 9, 9–18. [Google Scholar]
  37. Jiménez-Muñoz, J.C.; Sobrino, J.A.; Skoković, D.; Mattar, C.; Cristóbal, J. Comparison of MODIS and Landsat-8 land surface temperature retrievals over a heterogeneous area in Spain. Remote Sens. Environ. 2014, 148, 28–41. [Google Scholar]
  38. Hasan, M.; Hassan, L.; Al, M.A.; Abualreesh, M.H.; Idris, M.H.; Kamal, A.H.M. Urban green space mediates spatiotemporal variation in land surface temperature: A case study of an urbanized city, Bangladesh. Environ. Sci. Pollut. Res. 2022, 29, 36376–36391. [Google Scholar] [CrossRef] [PubMed]
  39. Hazarika, A.; Saikia, J.; Saikia, S. Anatomizing the scenario of urban green space in Dibrugarh and Tinsukia towns of Assam, India. Adv. Space Res. 2025, 75, 4516–4535. [Google Scholar] [CrossRef]
  40. Ahmad, B.; Najar, M.B.; Ahmad, S. Analysis of LST, NDVI, and UHI patterns for urban climate using Landsat-9 satellite data in Delhi. J. Atmos. Sol. Terr. Phys. 2024, 265, 106359. [Google Scholar] [CrossRef]
  41. Rahimi, E.; Dong, P.; Jung, C. Global NDVI-LST correlation: Temporal and spatial patterns from 2000 to 2024. Environments 2025, 12, 67. [Google Scholar] [CrossRef]
  42. Dashti, A.; Khajah, M. Urban green areas and their impact on land surface temperature in semi-arid environments: A case study in Kuwait. GeoJournal 2024, 89, 86. [Google Scholar] [CrossRef]
  43. Keerthi Naidu, B.N.; Chundeli, F.A. Assessing LULC changes and LST through NDVI and NDBI spatial indicators: A case of Bengaluru, India. GeoJournal 2023, 88, 4335–4350. [Google Scholar] [CrossRef]
  44. Zhang, J.; Wang, Y. Study of the relationships between the spatial extent of surface urban heat islands and urban characteristic factors based on Landsat ETM+ data. Sensors 2008, 8, 7453–7468. [Google Scholar] [CrossRef]
  45. Sheng, L.; Tang, X.; You, H.; Gu, Q.; Hu, H. Comparison of the urban heat island intensity quantified by using air temperature and Landsat land surface temperature in Hangzhou, China. Ecol. Indic. 2017, 72, 738–746. [Google Scholar] [CrossRef]
  46. Bečić, D.; Gašparović, M. Urban Heat Islands and Land-Use Patterns in Zagreb: A Composite Analysis Using Remote Sensing and Spatial Statistics. Land 2025, 14, 1470. [Google Scholar] [CrossRef]
  47. Xiang, X.; Zhai, Z.; Fan, C.; Ding, Y.; Ye, L.; Li, J. Modelling future land use land cover changes and their impacts on urban heat island intensity in Guangzhou, China. J. Environ. Manag. 2024, 366, 121787. [Google Scholar] [CrossRef] [PubMed]
  48. Feng, Y.; Wu, G.; Ge, S.; Feng, F.; Li, P. Identification of Key Drivers of Land Surface Temperature Within the Local Climate Zone Framework. Land 2025, 14, 771. [Google Scholar] [CrossRef]
  49. Sodoudi, S.; Zhang, H.; Chi, X.; Müller, F.; Li, H. The influence of spatial configuration of green areas on microclimate and thermal comfort. Urban For. Urban Green. 2018, 34, 85–96. [Google Scholar] [CrossRef]
  50. Bingöl, F.; Altıner, F.; Kelkit, A. Analyzing the most eligible site selection for biomass energy facilities through weighted overlay analysis: Case of Balikesir (Turkey) province. J. Agric. Fac. Ege Univ. 2023, 60, 19–35. [Google Scholar] [CrossRef]
  51. Aliağaoğlu, A.; Mirioğlu, G. Balıkesir kent kimliği. Lnternational J. Geogr. Geogr. Educ. 2020, 42, 374–399. [Google Scholar] [CrossRef]
  52. Gülen, A.H.; Gür, B.; Zorbazer, E.; Kahraman, R. Yollarda ararım, karekodumla bulurum seni-gog10 uygulaması: Balıkesir örneği. Güncel Tur. Araştırmaları Derg. 2022, 6, 133–148. [Google Scholar] [CrossRef]
  53. Yüksekli, B.A.; Akalin, A. Space as a projection of spatial practices: An urban park in Western Anatolia in the early-republican period. Middle East. Stud. 2011, 47, 641–654. [Google Scholar] [CrossRef]
  54. Aydın, İ. Balıkesir şehrinde 2003–2008 döneminde yeşil alanda meydana gelen değişimler. Nat. Sci. 2009, 4, 83–96. [Google Scholar]
  55. Sobrino, J.A.; Jiménez-Muñoz, J.C.; Paolini, L. Land surface temperature retrieval from LANDSAT TM 5. Remote Sens. Environ. 2004, 90, 434–440. [Google Scholar] [CrossRef]
  56. Sobrino, J.A.; Raissouni, N. Toward remote sensing methods for land cover dynamic monitoring: Application to Morocco. Int. J. Remote Sens. 2000, 21, 353–366. [Google Scholar] [CrossRef]
  57. Jiménez-Muñoz, J.C.; Sobrino, J.A. A Generalized single-channel method for retrieving land surface temperature from remote sensing data. J. Geophys. Res. Atmos. 2003, 108, D22. [Google Scholar] [CrossRef]
  58. Sobrino, J.A.; Raissouni, N.; Li, Z.-L. A comparative study of land surface emissivity retrieval from NOAA data. Remote Sens. Environ. 2001, 75, 256–266. [Google Scholar] [CrossRef]
  59. Dissanayake, D.M.S.L.B.; Morimoto, T.; Ranagalage, M.; Murayama, Y. Land-use/land-cover changes and their impact on surface urban heat islands: Case study of Kandy City, Sri Lanka. Climate 2019, 7, 99. [Google Scholar] [CrossRef]
  60. Singh, P.; Verma, P.; Chaudhuri, A.S.; Singh, V.K.; Rai, P.K. Evaluating the relationship between Urban Heat Island and temporal change in land use, NDVI and NDBI: A case study of Bhopal city, India. Int. J. Environ. Sci. Technol. 2024, 21, 3061–3072. [Google Scholar] [CrossRef]
  61. Xi, Y.; Wang, S.; Zou, Y.; Zhou, X.; Zhang, Y. Seasonal surface urban heat island analysis based on local climate zones. Ecol. Indic. 2024, 159, 111669. [Google Scholar] [CrossRef]
  62. Zheng, Y.; Tang, L.; Wang, H. An improved approach for monitoring urban built-up areas by combining NPP-VIIRS nighttime light, NDVI, NDWI, and NDBI. J. Clean. Prod. 2021, 328, 129488. [Google Scholar] [CrossRef]
  63. Guha, S.; Govil, H.; Gill, N.; Dey, A. A long-term seasonal analysis on the relationship between LST and NDBI using Landsat data. Quat. Int. 2021, 575–576, 249–258. [Google Scholar] [CrossRef]
  64. Wang, X.; Yao, Y.; Li, Z.; Su, C.; Tian, Y. Protocol reverse analysis of ethernet for control automation technology based on sequence alignment and pearson correlation coefficient. Sensors 2024, 24, 7922. [Google Scholar] [CrossRef]
  65. Gong, H.; Li, Y.; Zhang, J.; Zhang, B.; Wang, X. A new filter feature selection algorithm for classification task by ensembling pearson correlation coefficient and mutual information. Eng. Appl. Artif. Intell. 2024, 131, 107865. [Google Scholar] [CrossRef]
  66. Mukaka, M.M. Statistics corner: A guide to appropriate use of correlation coefficient in medical research. Malawi Med. J. 2012, 24, 69–71. [Google Scholar] [PubMed]
  67. Bayırbağ, M.K.; Penpecioğlu, M. Urban crisis: Limits to governance of alienation. Urban Stud. 2017, 54, 2056–2071. [Google Scholar] [CrossRef]
  68. Arshad, S.; Ahmad, S.R.; Abbas, S.; Asharf, A.; Siddiqui, N.A.; Islam, Z.U. Quantifying the contribution of diminishing green spaces and urban sprawl to urban heat island effect in a rapidly urbanizing metropolitan city of Pakistan. Land Use Policy 2022, 113, 105874. [Google Scholar] [CrossRef]
  69. Zittis, G.; Hadjinicolaou, P.; Fnais, M.; Lelieveld, J. Projected Changes in Heat Wave Characteristics in the Eastern Mediterranean and the Middle East. Reg. Environ. Change 2016, 16, 1863–1876. [Google Scholar] [CrossRef]
  70. Russo, A.; Gouveia, C.M.; Dutra, E.; Soares, P.M.M.; Trigo, R.M. The synergy between drought and extremely hot summers in the Mediterranean. Environ. Res. Lett. 2019, 14, 014011. [Google Scholar] [CrossRef]
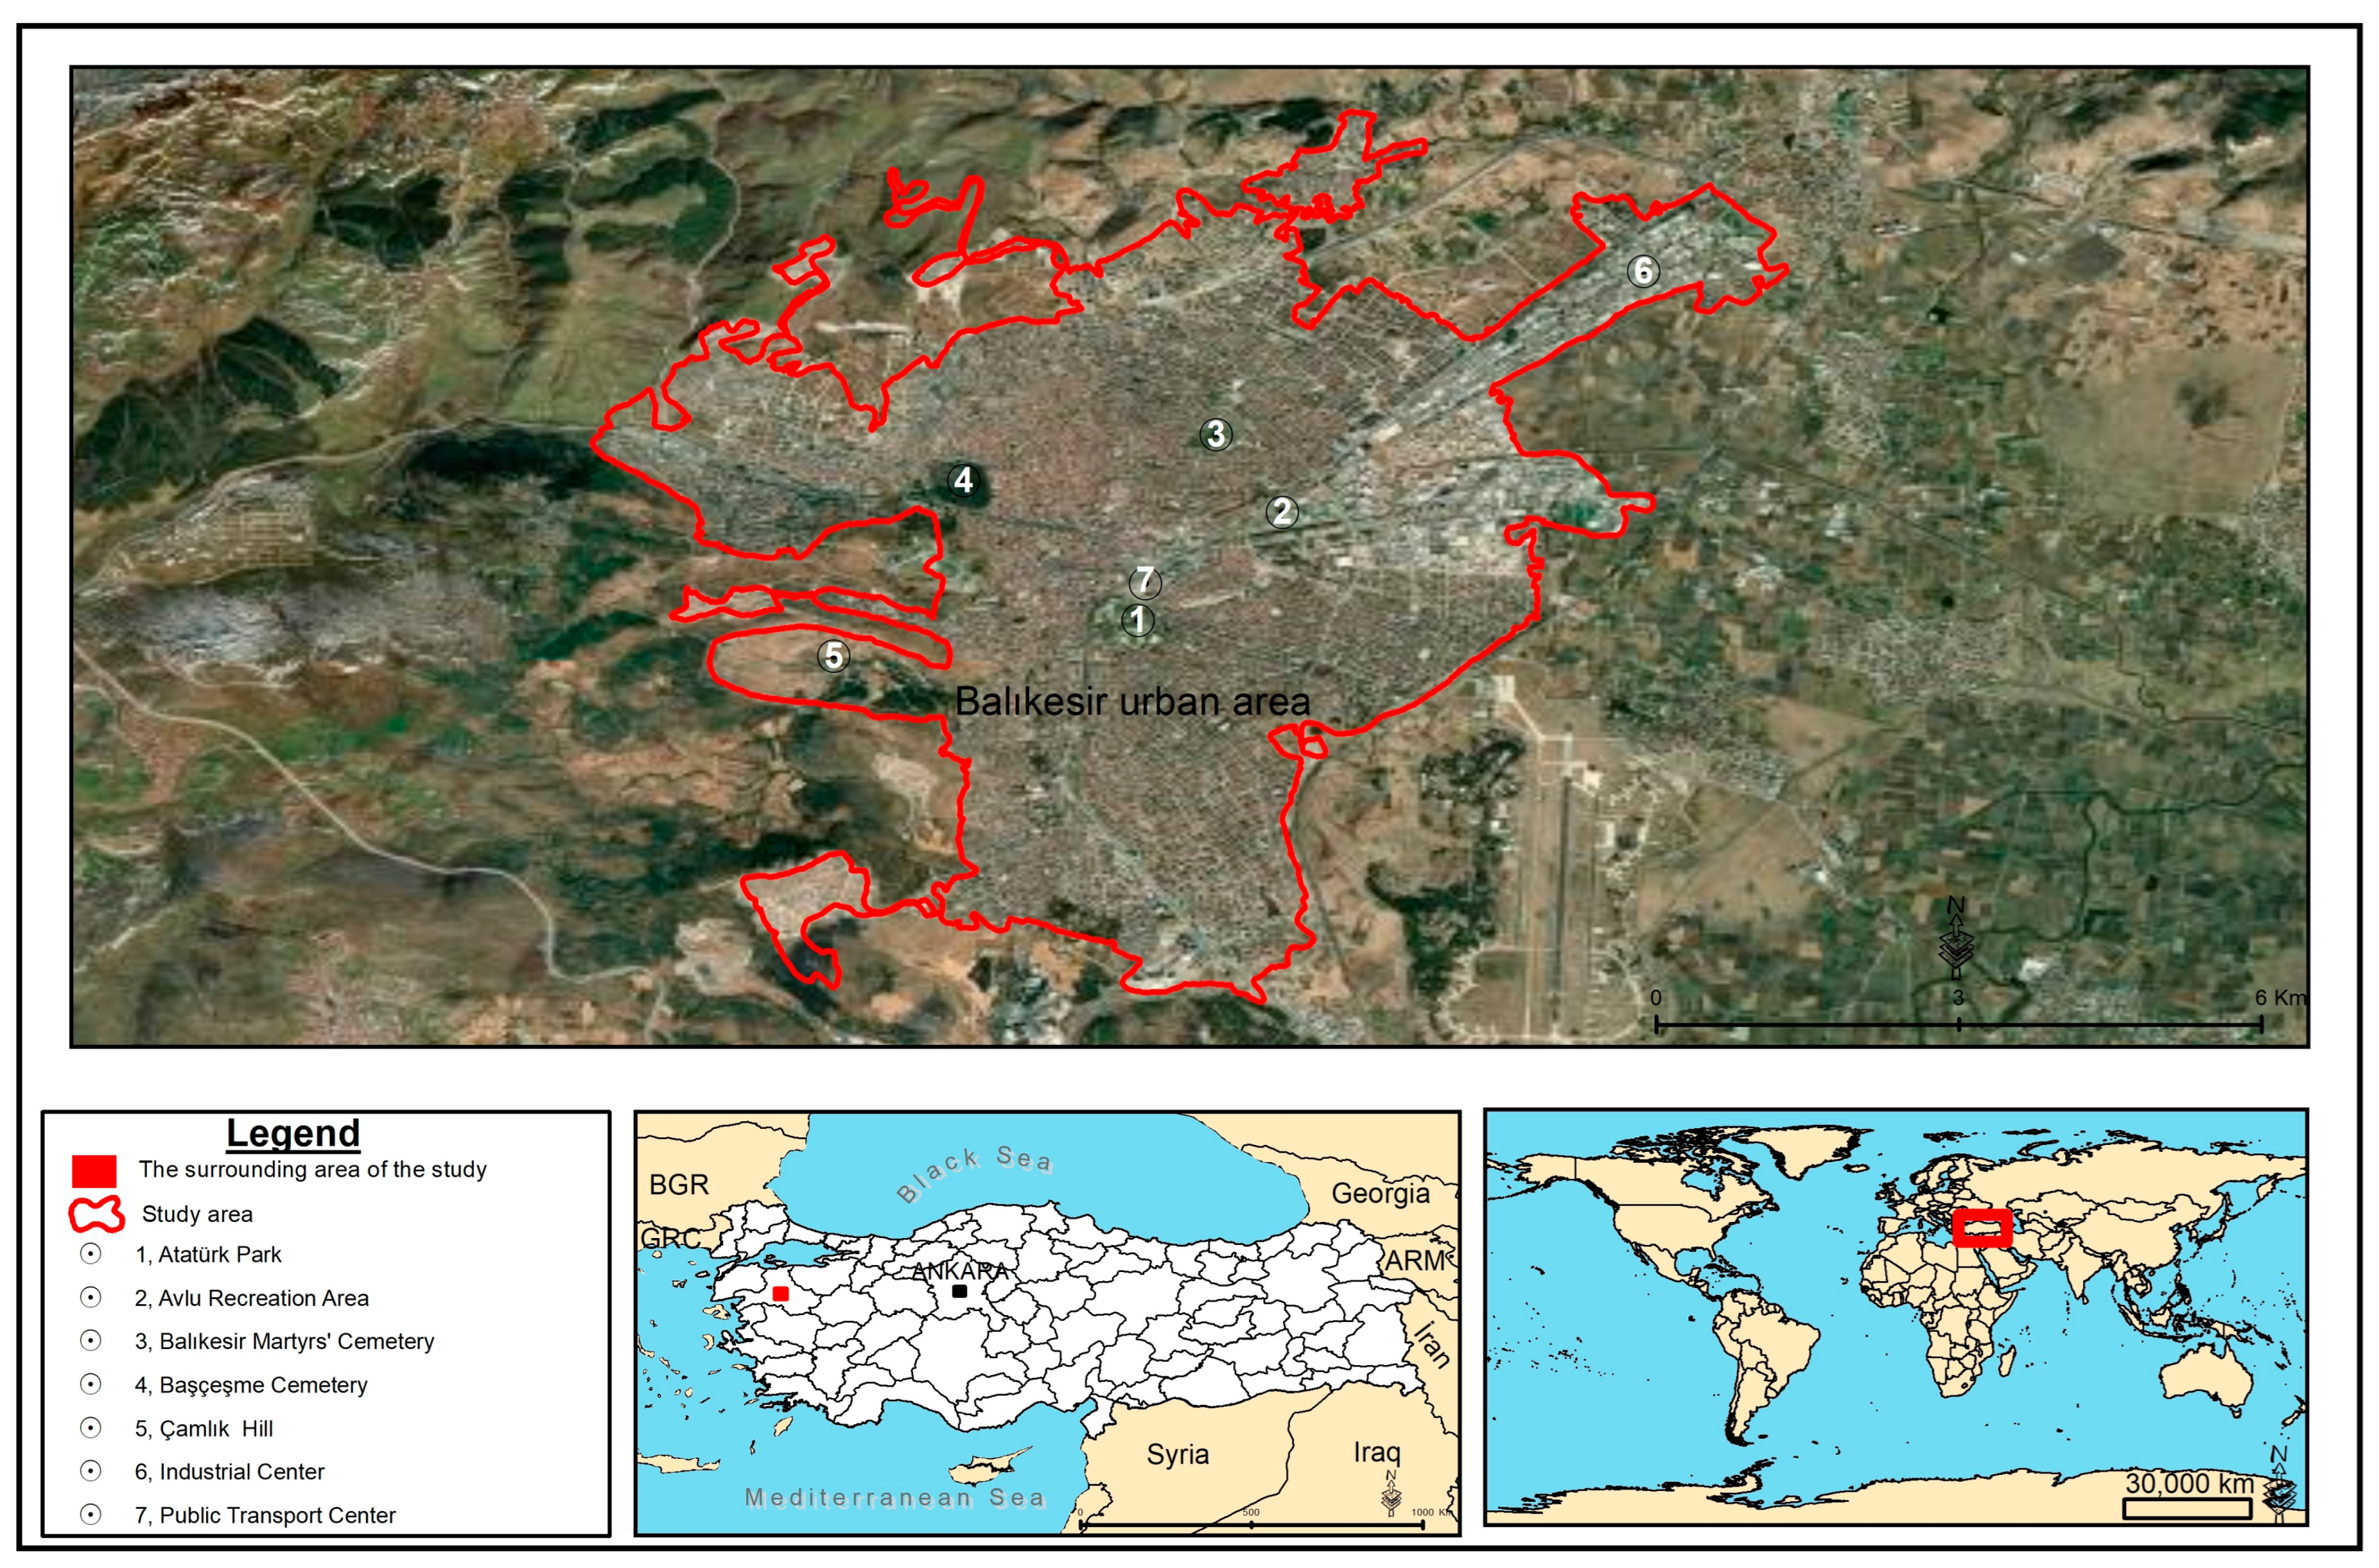
Figure 1. Location of the study area.
Sustainability 17 09245 g001
Figure 2. Method flowchart.
Sustainability 17 09245 g002
Figure 3. Thematic maps of LST analyses for the years 1985–1995–2005–2015–2025.
Sustainability 17 09245 g003
Figure 4. Thematic maps of NDVI analyses for the years 1985–1995–2005–2015–2025.
Sustainability 17 09245 g004
Figure 5. Thematic maps of NDBI analyses for the years 1985–1995–2005–2015–2025.
Sustainability 17 09245 g005
Figure 6. Long-term trends of LST: Temporal change graphs.
Sustainability 17 09245 g006
Figure 7. Thematic maps of LST analyses for the years 2005-2015-2025 obtained from the Landsat and MODIS data. (A) 2025 Landsat LST (1 km, resampled), showing high temperature zones (50.1–61.1 °C) in central and northern parts of the study area. (B) 2025 MODIS LST (1 km), indicating moderate surface temperatures (38–45 °C). (C) 2015 Landsat LST (1 km, resampled), displaying elevated thermal values (44.1–55.7 °C) concentrated in built-up regions. (D) 2015 MODIS LST (1 km), highlighting relatively lower temperatures (35–38.2 °C) across vegetated zones. (E) 2005 Landsat LST (1 km, resampled), showing lower surface temperatures (40.1–48.8 °C) compared to later years. (F) 2005 MODIS LST (1 km) showing temperature variations (36–40.3 °C) in areas with vegetation cover.
Sustainability 17 09245 g007
Figure 8. Thematic maps of LST analyses for the year 2025 obtained from the Landsat, MODIS, and Sentinel 3 data. (A) Landsat 8 (OLI/TIRS) LST map at 30 m resolution highlights detailed intra-urban thermal variability, revealing localized heat islands around densely built-up zones such as the Industrial Center and Public Transport Hub. (B) Resampled Landsat 8 LST map at 1 km resolution shows general temperature patterns consistent with macro-scale heat accumulation areas. (C) Sentinel-3 (SLSTR) LST product (1 km resolution) indicates similar spatial trends, although its coarser resolution results in less localized detection of micro-scale temperature differences. (D) MODIS LST data (1 km resolution) provide an additional validation perspective, capturing the broader regional thermal gradient.
Sustainability 17 09245 g008
Figure 9. LST-informed planning recommendation map for 2025. (A) The 30 m-resolution LST map indicates that most of the urban core experiences surface temperatures above 50 °C, particularly in densely built-up areas. (B) The proposed urban planning scenario, derived from 2025 LST data, integrates multiple climate-responsive strategies including the establishment of green corridors linking Başçeşme Cemetery, Atatürk Park, and the Avlu Recreation Area; a 250 m green buffer zone surrounding the industrial area; and the implementation of green infrastructure such as green roofs and walls, high-albedo surfaces, shading elements, and water features. These spatial strategies aim to reduce urban heat island intensity, enhance ecological connectivity, and improve overall thermal comfort across the urban landscape.
Sustainability 17 09245 g009
Table 1. Properties of thermal bands used for LTS, NDVI, and NDBI.
Satellite MissionIndicatorBand No.Band Name
Landsat 4 (TM)LST6TIR
NDVI3Red
NDVI4NIR
NDBI5SWIR1
NDBI4NIR
Landsat 5 (TM)LST6TIR
NDVI3Red
NDVI4NIR
NDBI5SWIR1
NDBI4NIR
Landsat 8 (OLI/TIRS)LST10ST_B10
NDVI4Red
NDVI5NIR
NDBI6SWIR1
NDBI5NIR
Landsat 9 (OLI-2/TIRS-2)LST10ST_B10
NDVI4Red
NDVI5NIR
NDBI6SWIR1
NDBI5NIR
Table 2. NDBI, NDVI, and LST analysis results.
NDVINDBILST
ClassPercent%ClassPercent%ClassPercent%
19850.014–0.10146.99−0.204–0.0482.7433.2–360.41
0.101–0.12026.21−0.048–0.01026.0036.1–4031.02
0.120–0.16523.170.010–0.18971,2640.1–4461.04
0.165–0.3333.64 44.1–48.87.52
19950.000–0.10139.17−0.204–0.0243.6429.6–330.91
0.101–0.12025.82−0.024–0.01027.3733.1–3636.46
0.120–0.16529.750.010–0.45768.9936.1–3953.37
0.165–0.4335.25 39.1–44.49.26
2005−0.027–0.10157.21−0.204–0.0482.8437–400.31
0.101–0.12020.09−0.048–0.01023.8740.1–441.74
0.120–0.16518.770.010–0.48373.2944.1–4851.44
0.165–0.4303.94 48.1–55.746.50
2015−0.014–0.12040.36−0.256–0.04810.4734.3–380.54
0.120–0.16029.35−0.048–0.01040.3338.01–405.73
0.160–0.20018.160.010–0.48349.2040.01–4246.68
0.200–0.51312.12 42.01–5247.05
2025−0.017–0.12062.37−0.303–0.0487.1542.6–481.29
0.120–0.16023.85−0.048–0.01031.5048.1–504.31
0.160–0.2008.770.010–0.40361.3550.1–5243.54
0.200–0.5055.01 52.1–61.150.87
Table 3. Correlations between NDBI, NDVI, and LST.
Variable PairMin.Max.MeanStandard DeviationCorrelation (r)Strength95% CIpn
1985LST–NDBI33.2448.7641.152.00+0.30Moderate[0.288–0.312]<0.00122,039
NDVI–LST0.010.330.110.03−0.50Moderate[−0.510–−0.490]<0.00122,039
NDBI–NDVI−0.20500.190.020.03−0.65Strong[–0.658–−0.642]<0.00122,039
1995NDVI-LST−0.20500.1890.0210.030−0.557Moderate[+0.502, +0.520]<0.00125,451
LST-NDBI33.24348.76141.1471.996+0.5112Moderate[−0.565, −0.548]<0.00125,451
NDBI-NDVI0.0150.3330.1070.030−0.5505Moderate[−0.559, −0.542]<0.00125,451
2005LST–NDBI369.994556.925480.22323.183+0.4349Moderate[+0.425, +0.445]<0.00128,638
NDVI–LST−0.02700.43060.09960.0353−0.4789Moderate[−0.488, −0.469]<0.00128,638
NDBI–NDVI−0.24690.48340.02310.0332−0.5884Moderate–Strong[−0.596, −0.581]<0.00128,638
2015LST–NDBI34.3652.5042.101.35+0.4822Moderate[0.474, 0.490]<0.00134,408
LST–NDVI−0.01490.51330.13810.0544−0.4421Moderate[−0.451, −0.434]<0.00134,408
NDBI–NDVI−0.25620.21170.00460.0432−0.7444Strong[–0.749, −0.740]<0.00134,408
2025LST–NDBI42.5961.0952.161.70+0.6130Strong[+0.606, +0.620]<0.00134,408
LST–NDVI−0.30320.20790.01450.0415−0.6087Strong[−0.615, −0.602]<0.00134,408
NDBI–NDVI−0.25620.21170.00460.0432−0.7261Strong[−0.731, −0.721]<0.00134,408
Disclaimer/Publisher’s Note: The statements, opinions and data contained in all publications are solely those of the individual author(s) and contributor(s) and not of MDPI and/or the editor(s). MDPI and/or the editor(s) disclaim responsibility for any injury to people or property resulting from any ideas, methods, instructions or products referred to in the content.