Article

Staying Competitive in Clean Manufacturing: Insights on Barriers from Industry Interviews

1
Oak Ridge National Laboratory, 1 Bethel Valley Road, Oak Ridge, TN 37831, USA
2
Golisano Institute for Sustainability, Rochester Institute of Technology, Rochester, NY 14623, USA
*
Author to whom correspondence should be addressed.
Sustainability 2025, 17(20), 9233; https://doi.org/10.3390/su17209233
Submission received: 12 June 2025 / Revised: 5 September 2025 / Accepted: 9 October 2025 / Published: 17 October 2025
(This article belongs to the Topic Energy Economics and Sustainable Development)

Abstract

While industrial emissions research has historically focused on energy-intensive sectors like steel, cement, and chemicals, this study addresses a critical gap by examining barriers across all the manufacturing industry in the U.S. Sectors like food processing, retail, plastics, and transportation face unique challenges distinct from heavy industry, operating on thin margins with limited bargaining power while experiencing heightened consumer and stakeholder pressure for improved environmental responsibility. Through structured interview data collection process and using quantitative ratings and qualitative analysis, this research identifies and categorizes emission reduction barriers across four key themes: financial, technical, organizational, and regulatory. Unlike energy-intensive industries that may pursue hydrogen or carbon capture technologies, discrete manufacturing industry like automotive, electrical and electronics, and machine manufacturers typically focus on energy efficiency, electrification of thermal processes, and alternate fuel switching, solutions better aligned with their lower-temperature processes and distributed facility profiles. The study’s primary contribution lies in documenting specific barrier manifestations within organizations and identifying proven mitigation strategies that companies have successfully implemented or observed among peers.

1. Introduction

During discussions related to industrial emissions reduction, the spotlight invariably falls on energy-intensive sectors, such as steel, cement, chemical, and petroleum products. Based on Manufacturing Energy Consumption Survey data, the three largest energy-consuming manufacturing subsectors are chemicals, petroleum and coal products, and paper, accounting for approximately 70% of the total manufacturing energy used in 2018 [1]. Considerable research has investigated emissions reduction pathways and technological solutions for these intensive sectors, along with analyses of their barriers [2,3,4,5,6,7,8,9]. However, the remaining 30% of discrete manufacturing sector emissions are spread across diverse industries, including rubber and plastics processing, the automotive industry, textiles, and electronics manufacturing, which face their own challenges and merit dedicated attention.
Discrete manufacturers often operate in highly competitive markets with thin profit margins and limited bargaining power. Companies with greater consumer visibility or closer proximity to end markets, such as those in apparel, food, retail, and transportation, experience stronger pressure from customers and investors to adopt emission reduction goals [10,11,12]. Research has shown consumer-facing sectors face mounting stakeholder pressure and younger consumers increasingly willing to pay premiums for environmentally responsible products [13,14]. Emission reduction in the food sector is driven partly by consumer demand for sustainably produced food, motivating stakeholders throughout the chain, from farming to retail, to adopt energy efficient technologies [15]. Retail companies, especially those with strong brands and large customer bases, have increasingly adopted strategies such as energy efficiency improvements, alternate energy procurement, and supply chain emissions reductions, driven by growing consumer and stakeholder pressure. Their high public visibility and vulnerability to reputational risk incentivize proactive actions to reduce emissions [16]. The plastics industry in consumer packaging faces strong market-driven pressure to emission reduction due to visible and emotional consumer concerns over plastic waste and emissions [17]. Conversely, upstream sectors like cement, steel, chemical/pharmaceutical, and primary metal manufacturing largely face challenges due to lack of affordable technology innovation. These upstream sectors experience fewer direct reputational pressures but confront more substantial technical barriers, contributing to lower adoption rates of voluntary environmental commitments [18].
The discrete manufacturing sector contributes a smaller share of the national industrial energy use; it relies on a distinct set of emission reduction pathways. These industries employ millions of workers across the country and form crucial links in supply chains for essential consumer goods [19]. Their distributed nature means their competitiveness could have broader geographical benefits, potentially creating more reliable and sustainable local economies. Unlike energy-intensive sectors that may explore hydrogen or carbon capture and storage (CCS), other sectors typically pursue emission reductions largely through energy efficiency, electrification of thermal processes, and alternate fuel switching [20,21,22]. Solutions must be aligned with their lower-temperature process needs and distributed facility profiles, offering more immediately deployable opportunities [10,23]. The diverse nature of discrete manufacturing sectors requires multiple specialized solutions based on process needs rather than one-size-fits-all approaches [24,25]. Recognizing this distinction is critical for aligning support mechanisms with sector-specific technology needs and avoiding misapplication of solutions designed for high-energy industries.
Understanding barriers to reducing emissions in manufacturing sectors is crucial for achieving comprehensive U.S. economic competitiveness [26]. While individual businesses in discrete manufacturing sectors may have relatively low energy consumption compared to heavy industry, their collective footprint cannot be completely overlooked [26]. Making large capital investments in cutting-edge technologies is particularly challenging for small industries [27]. Emission reduction strategies in the manufacturing industry are largely driven by cost reduction, whether through decreased energy consumption that lowers energy costs, or through process improvements that reduce maintenance, labor, and other operational expenses [28]. Any initiative that allows an organization to lower costs results in strengthening long-term competitiveness by enhancing operational and supply chain reliability and building brand equity in the marketplace [29]. Understanding specific financial, technical, and organizational constraints can help develop actionable emission reduction roadmaps that are economically viable rather than prohibitively expensive [27]. Identifying these barriers also helps identify technology gaps and research priorities that can benefit multiple sectors simultaneously [30]. The discrete manufacturing sector often requires different support than heavy industry—focusing more on information sharing, technical assistance, and peer-to-peer networking and learning about industry best practices [29]. By systematically identifying and addressing the specific barriers, these sectors, whether financial, technical, organizational, or regulatory, can help develop more effective strategies that accelerate emission reduction while maintaining economic viability across the broader economy [30].
The main contribution of the paper lies in the interview data on barriers for industrial emission reduction through quantitative ratings (1–10 scale) from manufacturing companies and qualitative analysis of barrier manifestation within organizations. Findings are categorized into four themes: financial, technical, organizational, and regulatory barriers. Beyond identifying barriers, companies that took part in the interview shared promising mitigation strategies they have either implemented themselves or observed among industry peers, highlighting practical approaches that have demonstrated measurable success. This study presents anecdotal evidence from manufacturing companies on key obstacles hindering progress towards emission reduction but does not offer policy recommendations. The documented barriers and mitigation strategies can guide similar industries in developing effective approaches to become more energy efficient in their operation.

2. Data Collection

To understand the barriers to manufacturing industrial transformation and enhance their competitiveness, comprehensive interviews were conducted with 29 industrial manufacturing companies encompassing over 650 facilities (as of 2025) across diverse sectors in the U.S. The data collection process spanned over two years, employing a structured approach to capture both quantitative and qualitative insights into the challenges. Each participating company underwent 2–3 virtual interview sessions, allowing for in-depth exploration of barriers. Interviews were conducted with key decision-makers and technical experts such as sustainability managers, environmental, health, and safety (EHS) professionals, energy managers, and process and energy engineers directly involved in sustainability and energy management within their organizations. Each interview had 1–4 employees from each individual company. This process enabled the collection of detailed responses regarding barriers and mitigation strategies that companies have explored, implemented, or observed successful practices among their industry peers.
Manufacturing facility representatives were asked to collectively evaluate and rate 11 identified barriers to emission reduction strategies. Using a 10-point scale, participants were asked to assign ratings where 1 indicated a barrier with minimal organizational impact that could be easily addressed through available resources and strategies, while 10 represented a significant obstacle requiring substantial investment, time, or systemic changes to overcome. A rating of 5 indicates that with sufficient organizational effort, these barriers could be mitigated or are expected to be mitigated in the near future. The rating system permitted tied scores across multiple barriers, with identical ratings signifying that those barriers posed equivalent challenges for successful mitigation given the organization’s specific operational constraints and capabilities.
The manufacturing sectors that were interviewed included both energy intensive and discrete manufacturing, including transportation equipment manufacturing, electrical equipment, and component production; food and beverage processing; chemical manufacturing; industrial machinery production; primary metal and fabricated metal manufacturing; computer and electronics components; and pharmaceutical manufacturing. The relative participation rates across these industries are visualized in Figure 1.

3. Analysis

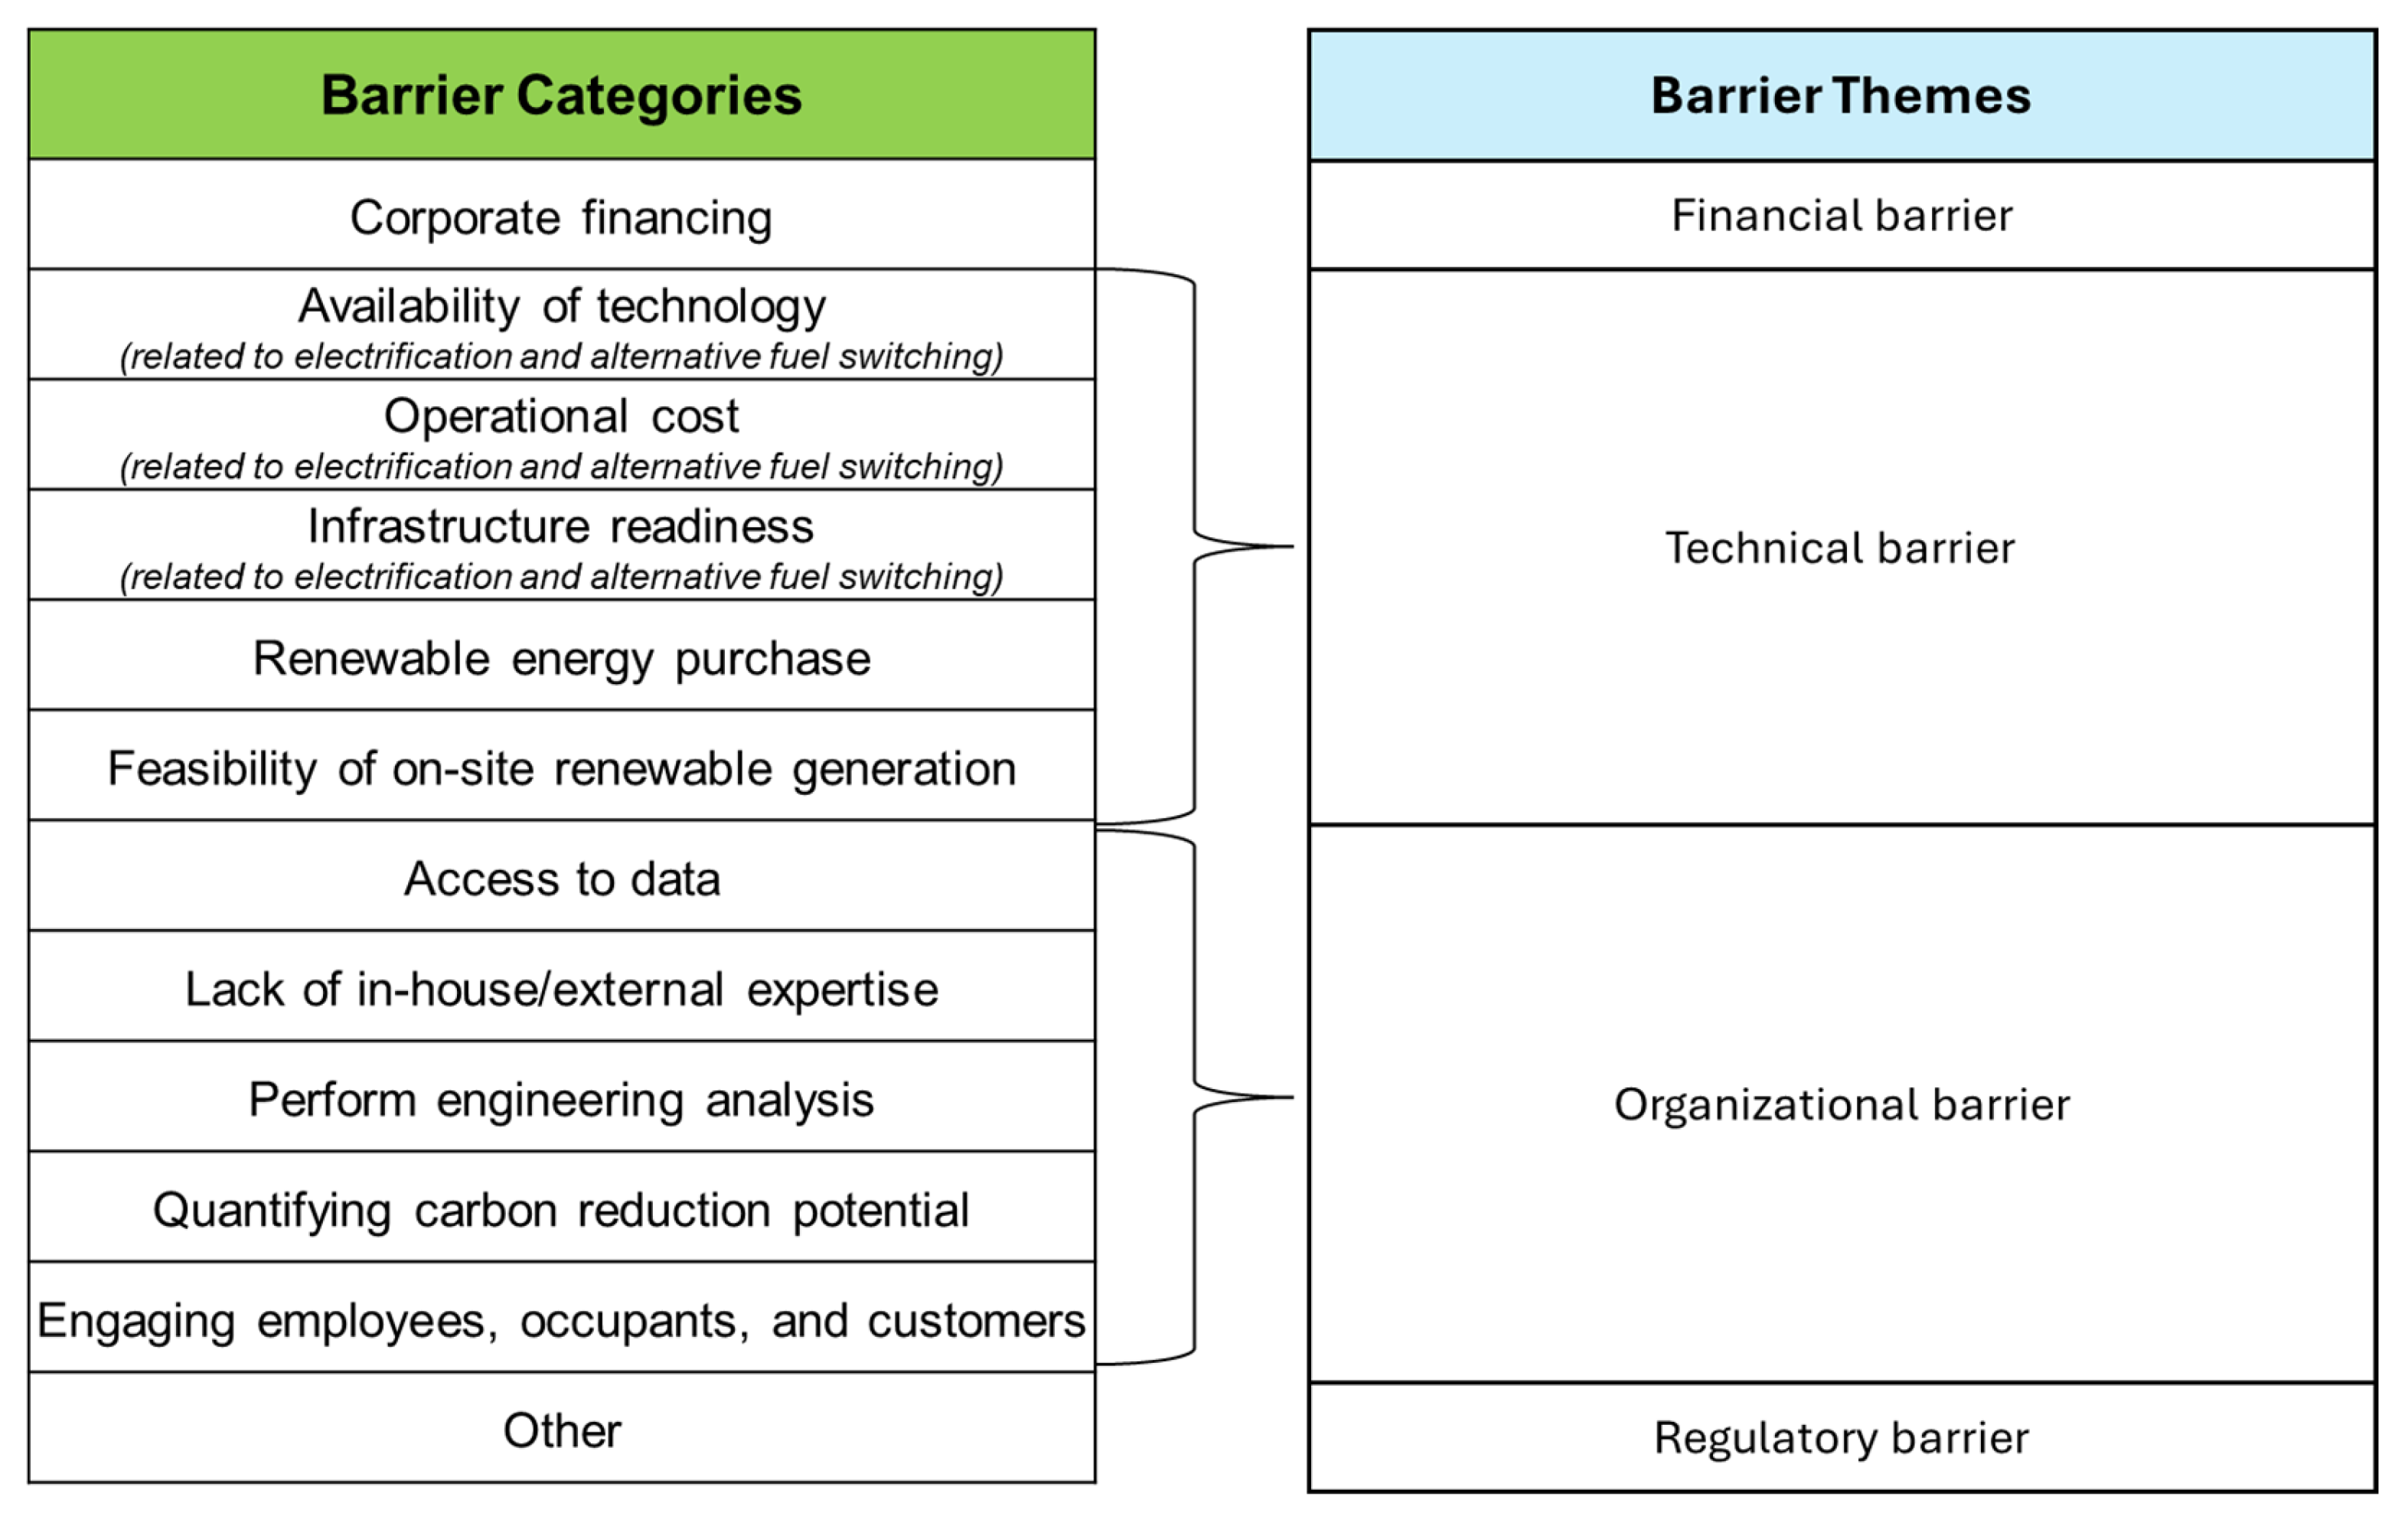
Understanding the relative impact of key barriers to emission reduction requires careful analysis of the manufacturing company’s ratings and experiences. Through extensive discussions with these organizations, a complex landscape of challenges emerged that is significantly impeding both technological development and deployment, ultimately slowing progress toward emission goals and improving manufacturing competitiveness. To provide a structured framework for understanding these challenges, the original eleven barriers are consolidated into four fundamental themes: financial, technical, organizational, and regulatory barriers shown in Figure 2.
Financial barriers were maintained as a separate category due to their fundamental importance and unique characteristics in the emissions reduction journey. Discussions revealed the complexity of investment decisions, encompassing various dimensions of financial planning and execution that span multiple organizational levels and posed a major barrier. The average rating for financial barrier was 6.4 out of 10 (Figure 3). Technical barriers emerged from consolidating five originally distinct but related challenges: technology availability, operational costs, infrastructure readiness for electrification and fuel-switching technologies, renewable energy integration, and on-site generation feasibility. This consolidation recognized that these barriers share common technology implementation themes. Technical barriers represent another significant obstacle, including the high costs of investment and operation, along with necessary upgrades to both facility infrastructure and grid connectivity for electrification and alternate fuel technologies. The average rating for all these barriers was above 6. Purchasing renewable electricity emerged as a relatively minor barrier, likely owing to the abundance of consultants and purchase options available in the market. Although on-site renewable solutions are often attractive in theory, they face practical challenges that include high costs, limited capacity, and insufficient space, frequently making them nonviable. The average rating for on-site renewable energy and off-site procurement received an average rating lower than 5.
Organizational barriers combined several organizational internal challenges: accessing and utilizing accurate operational data, conducting robust engineering analyses for project validation, implementing effective employee engagement initiatives, and developing workforce capabilities in advanced operational strategies. These barriers were grouped together as they all relate to internal organizational capacity and capability. Organizational factors were identified as a less significant barrier overall, though participants highlighted specific challenges such as insufficient dedicated staff and the specialized time and skills required to analyze project feasibility. All, except lack of in-house/external experts, received an average rating of less than 5 levels (Figure 3). Regulatory barriers, while not initially included among the 11 primary categories, emerged as a significant theme through the interview. Manufacturing companies expressed considerable concern about the rapidly evolving regulatory landscape, particularly the emerging environmental compliance frameworks and reporting requirements across federal, state, and local.
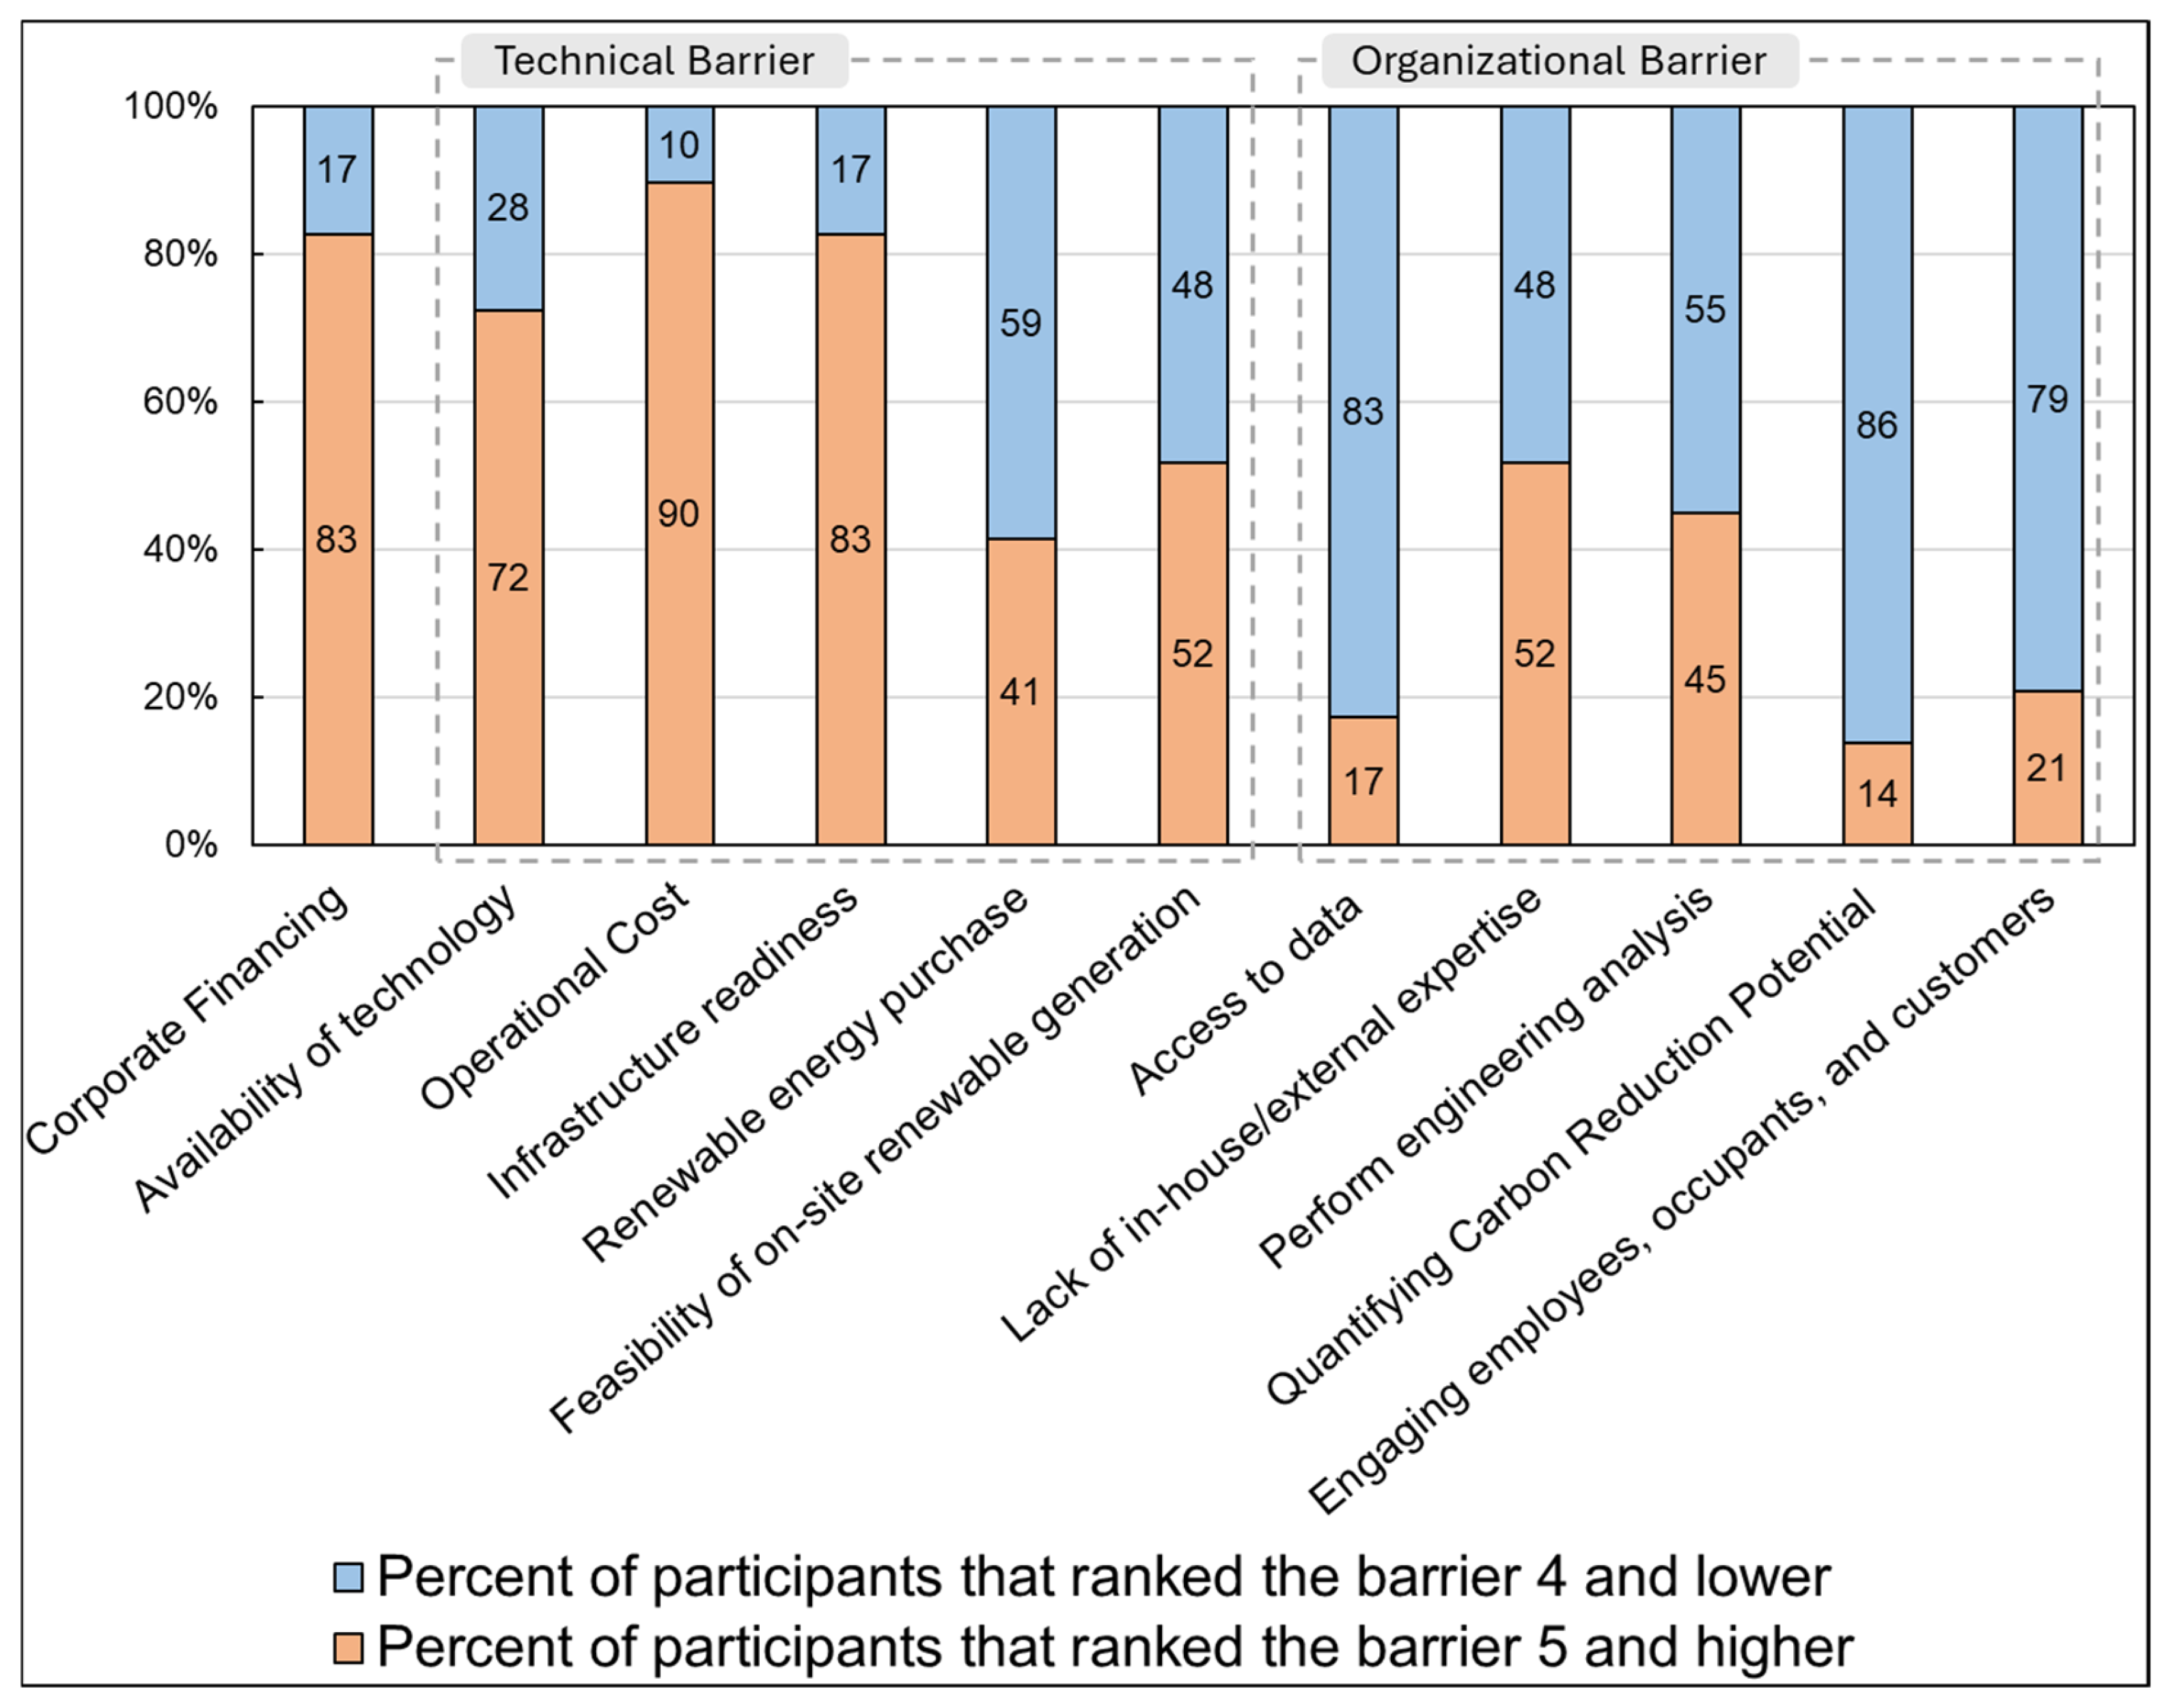
To better understand the average ratings, it is important to examine what percentage of participants rated each barrier as 5 or higher (moderate to difficult barrier to overcome) versus 4 or lower (low to easy barrier to overcome). Figure 4 breakdowns the results to show how many organizations consider each category to be a significant barrier. The most prevalent barriers were financial and infrastructure-related: over 80% of companies identified corporate financing, operational costs, and infrastructure readiness for electrification and alternate fuel switching as major challenges. Technology availability was also a significant barrier, with 72% and 90%, respectively, citing limited access and operating cost for electrification and alternate fuel technologies. Moderate barriers included on-site renewable generation feasibility and lack of in-house expertise (both 52%), followed by renewable energy purchasing (41%) and engineering analysis capabilities (45%). The least challenging barriers were employee engagement (21%) and information-related issues, with fewer than 20% of companies rating quantifying emission reduction and data access as least significant obstacles.
It is important to note that this study acknowledges an inherent selection bias in participant recruitment. Companies that participated in the interview process have already demonstrated commitment to emissions reduction through either established emission reduction targets or were in active development of emission reduction goals. Many participants had adopted mid- to long-term net-zero targets exceeding typical industry standards, making them well-positioned to provide insights into implementation challenges while maintaining competitiveness. However, even these committed organizations face significant barriers in deploying strategies to achieve their emission reduction goals, highlighting the universal nature of these challenges across the manufacturing sector.
Throughout the interview process, strict confidentiality protocols were maintained. All proprietary information shared during these discussions, as well as company names, was kept confidential and is not included in any published materials. The case studies of companies overcoming barriers presented in this research exclusively feature publicly available information that participating and nonparticipating companies had previously disclosed through their own channels, ensuring both transparency and respect for corporate confidentiality. The alignment of organizations’ commitments, strategic planning, and collaborative resource sharing created an optimal framework for understanding barriers to emissions reduction.

4. Results

This section provides in-depth results of each barrier identified during stakeholder engagement. For each barrier, the paper presents detailed insights from the interview, highlighting specific challenges they face. The section also incorporates relevant case studies and examples with promising mitigation strategies that companies have either implemented themselves or observed among industry peers, highlighting practical approaches that have demonstrated measurable success. This comprehensive examination aims to provide both a clear understanding of the obstacles and practical insights into potential solutions that organizations can consider in their emissions reduction journey.

4.1. Financial Barrier

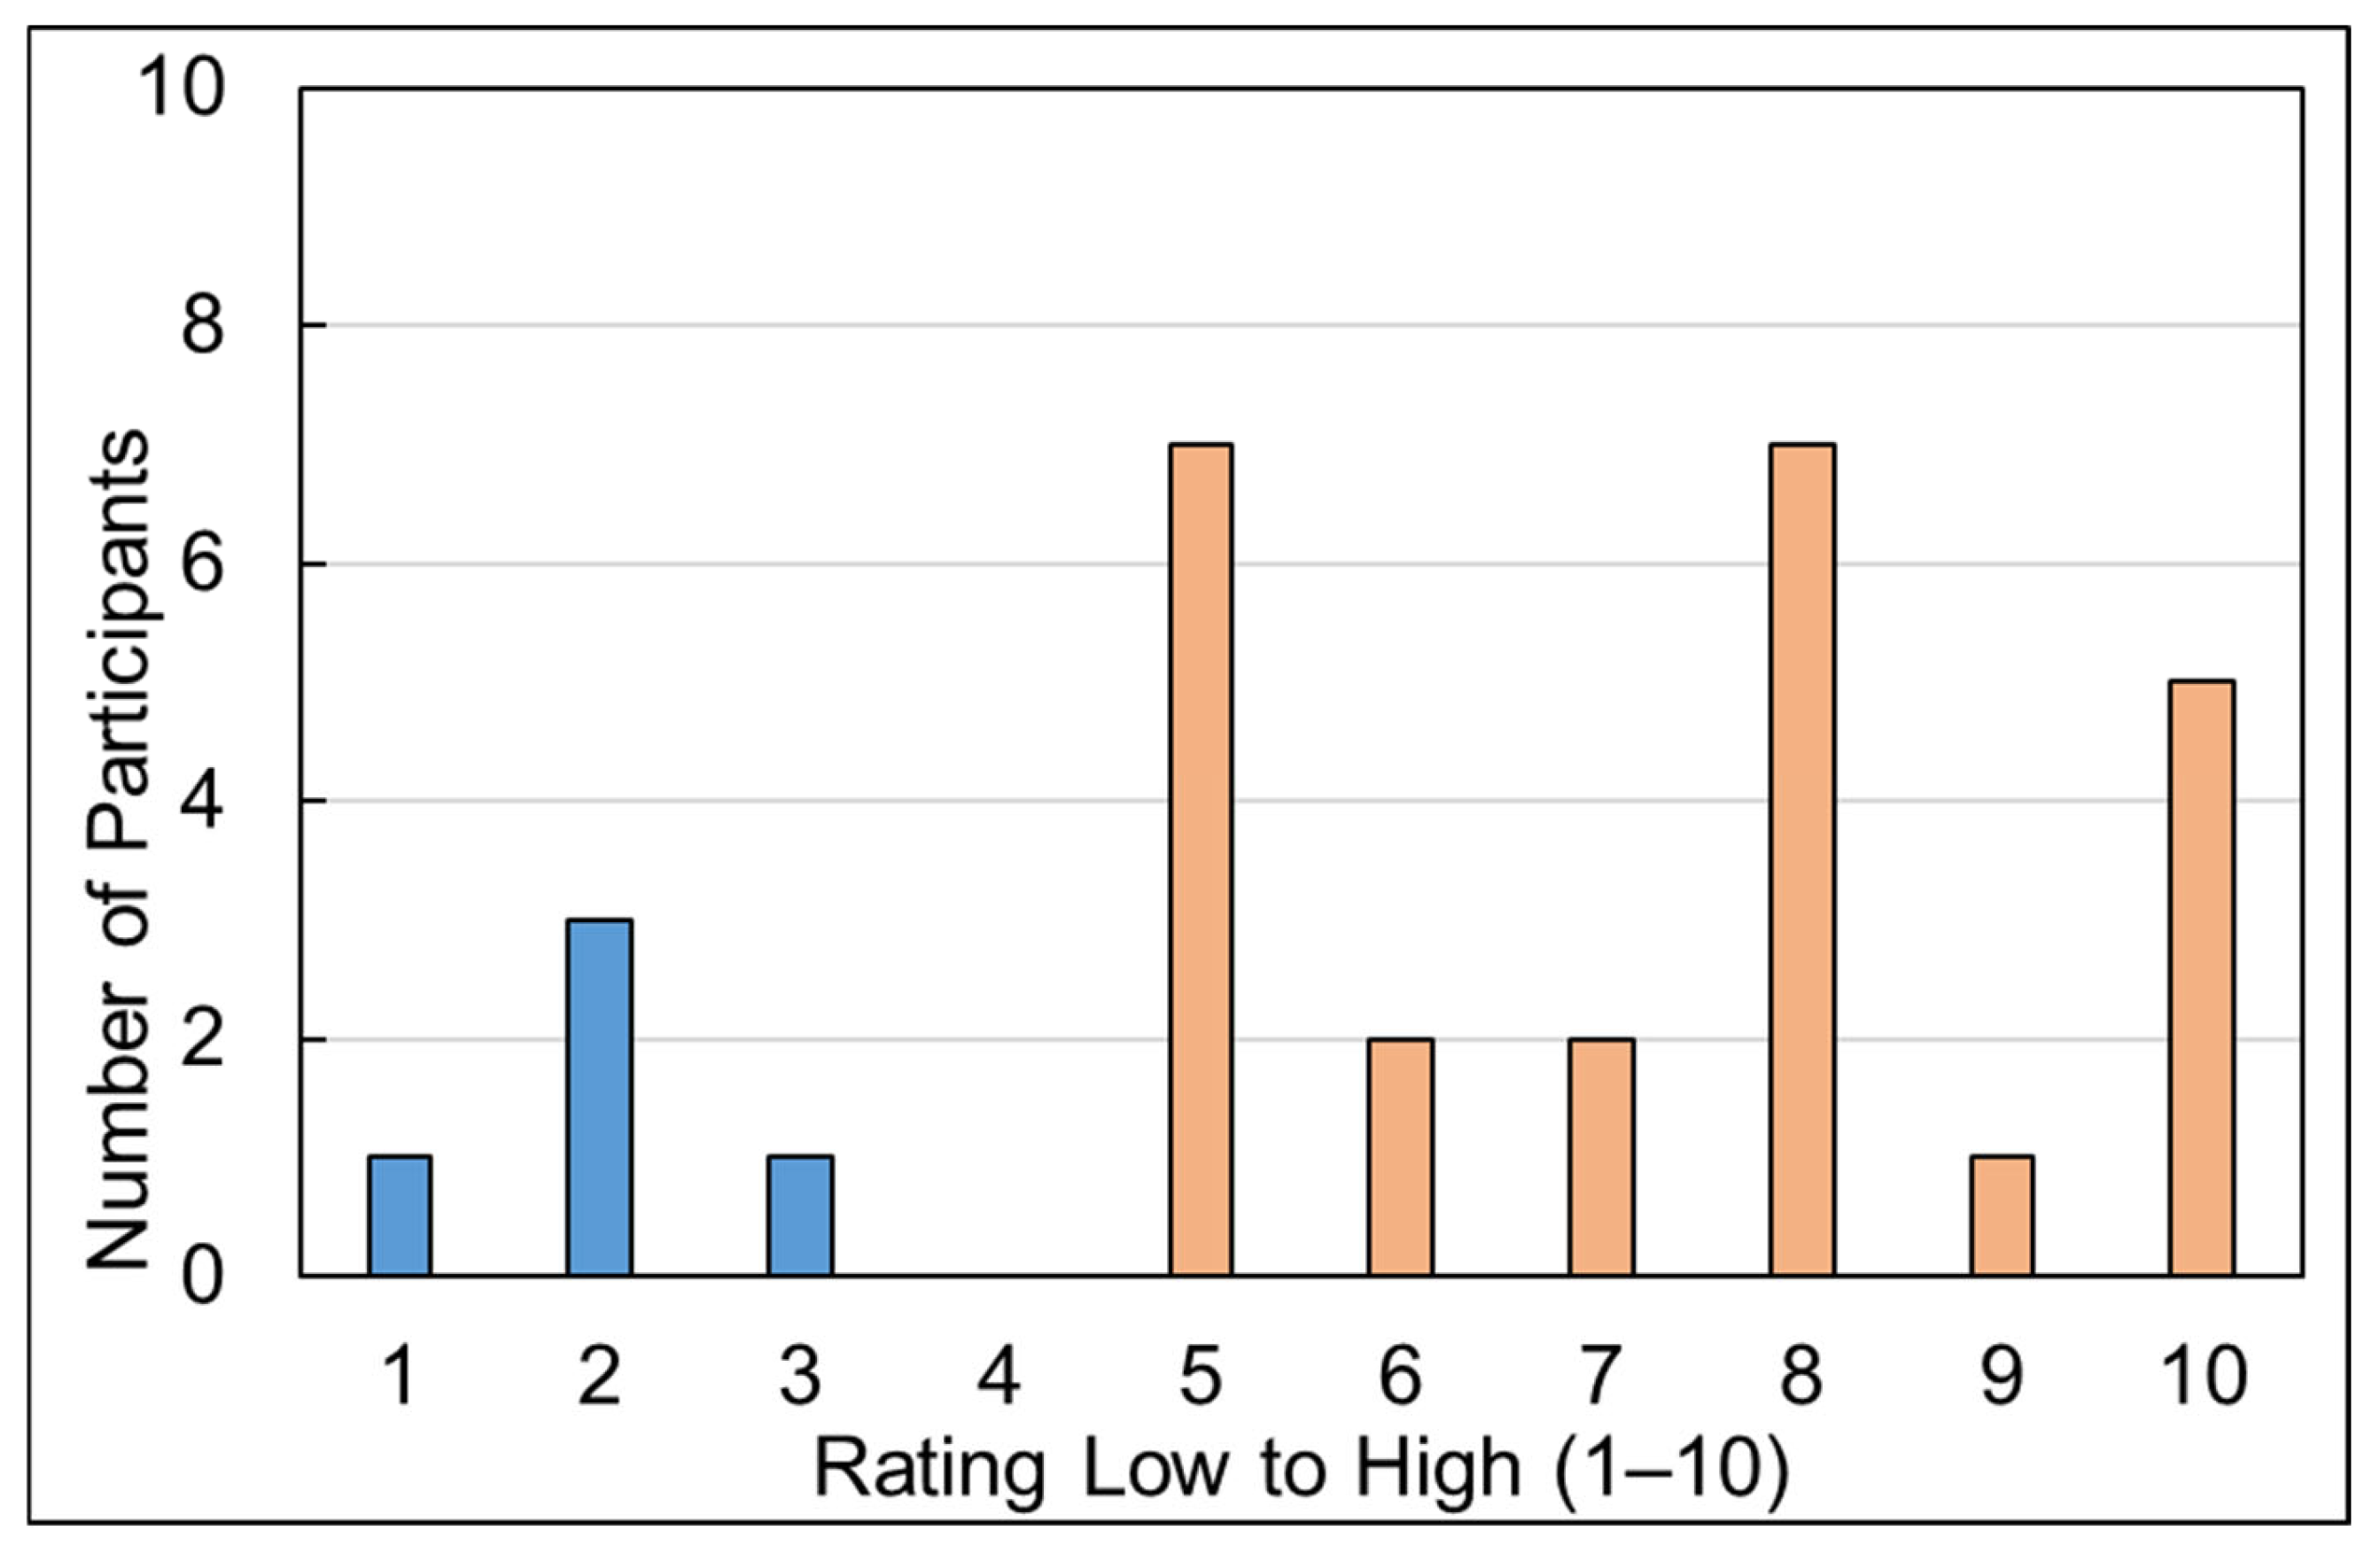
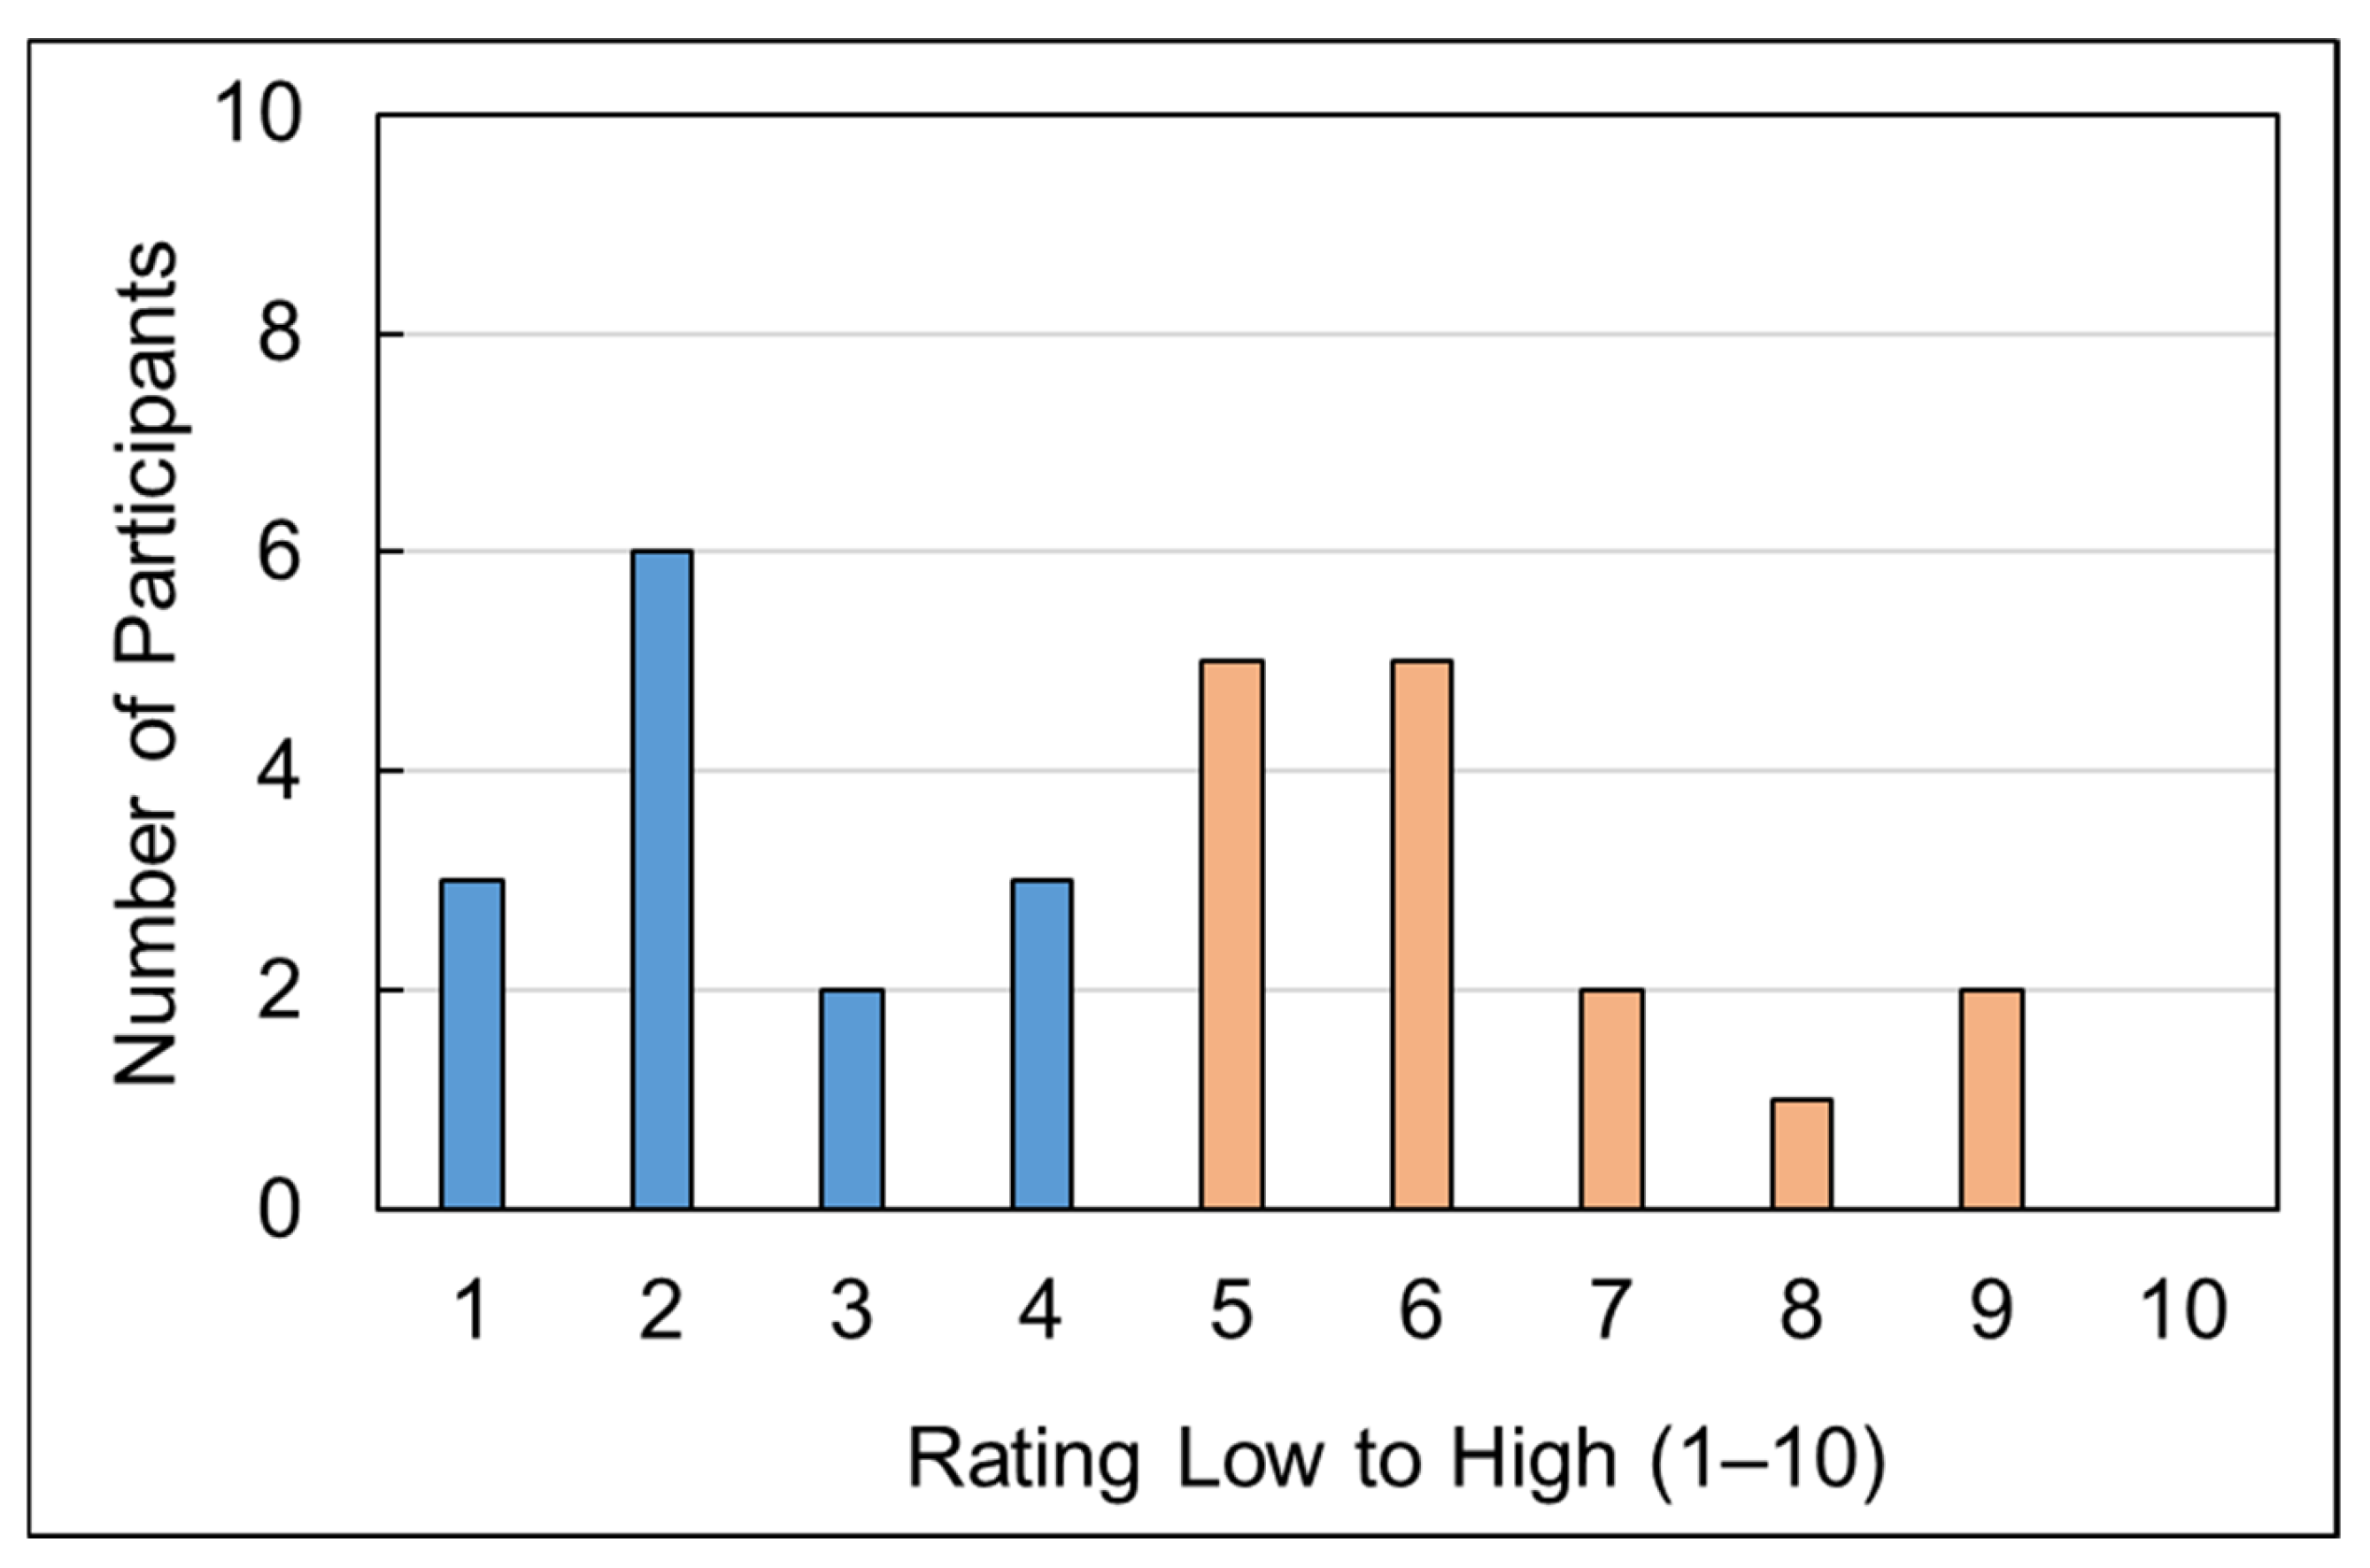
The high capital expenditure of technologies creates a complex challenge when companies struggle to justify these investments in sustainability if it does not reduce operational cost. Energy efficiency initiatives attract industry adoption with clear cost-saving benefits through overhead cost reduction. Limited access to dedicated funding mechanisms or capital reserves for these projects complicate the situation. Even when companies secure funding through contracts, loans, or bonds, they must carefully manage multiple risks like product quality, safety, and regulatory concerns. However, research has shown that such investments can also generate substantial non-energy benefits, including improved product quality, reduced waste, and enhanced workplace safety, which may strengthen the business case for adoption despite limited direct energy savings [31,32,33]. Figure 5 shows the rating of corporate financing for the financial barrier category, which is significantly higher than any other barrier discussed. Participants elaborated on the financial challenges constraining their emission reduction efforts, explaining why financing emerged as one of the most significant barriers in their organizational contexts.

4.1.1. Different Departments Competing for Capital

Organizations have a range of competing priorities that seek financing from operating and capital budgets. Although C-suite management and many executives might support emissions reduction goals, more funding is allocated to R&D, increasing production, and sales. Sustainability initiatives must compete directly with other organizational priorities such as product development, marketing campaigns, or equipment upgrades, often struggling to secure adequate funding despite their long-term benefits. Energy projects require substantial upfront investments while delivering returns over extended timeframes, making them less attractive than projects with immediate revenue generation potential.

4.1.2. Investments Are Only Available for Projects with Quick Returns

Investment decisions continue to favor quick-return projects over those with significant emission reduction potential but longer payback periods [34]. Companies explicitly confirm that projects with 2–3-year payback periods readily secure capital funding, a pattern widely acknowledged across the industry. Projects requiring more than five years to achieve return on investment face substantial hurdles, typically demanding extensive additional justification to receive funding approval. A gradual shift in this alternate investment approach is emerging, but the transformation remains slow. This creates a critical challenge: many high-impact initiatives, despite their substantial emissions reduction potential, risk being overlooked in favor of shorter-term investments that deliver faster financial returns.
As an example, to overcome this barrier, Celanese Corporation, a specialty materials and chemical manufacturing company, has created a sustainability checklist to provide a consistent approach for project engineers to evaluate the sustainability effects of capital projects and integrate sustainability measures into project designs [35]. Celanese updated its existing “Management Systems Review” process to require project engineers to consider sustainability metrics such as GHG along with waste- and water-related effects of the projects that require funding of more than $50,000. They also developed a new capital project sustainability checklist that is expected to help define better design decisions early in the project planning phase and influence equipment specifications for end-of-life replacements [35]. Instead of simply replacing equipment with the same products, the checklist is intended to drive plant engineers to evaluate cost-effective replacements that improve operational efficiency. The checklist promotes better decision-making at the project approval phase to include cost-effective sustainability opportunities and consider multiple factors, such as carbon capture, life cycle analysis impact on products, peak loads, and potential rebates and funding resources.

4.1.3. Corporate Funding Approval Cycle and Project Prioritization Need to Align

Most of the companies currently navigate a complex funding landscape for their sustainability initiatives because dedicated budgets for energy and emission reduction projects remain intermittent. Instead, these crucial initiatives must compete for funding through traditional operational or capital budget channels, each with its own approval process and timeline. The traditional funding approach, which typically requires fiscal year preapproval, creates significant operational bottlenecks. Facilities often lack strategically prioritized project pipelines, resulting in opportunistic rather than strategic implementation. Promising opportunities discovered mid-year frequently go unfunded regardless of their potential impact.
Organizations like Cummins and Colgate-Palmolive are responding to these challenges by developing comprehensive action plans that transform their sustainability initiatives from ad hoc projects into strategic programs [36]. These plans begin with a robust strategic framework that establishes emissions reduction targets and specific interim milestones. The implementation roadmap component outlines prioritized project pipelines aligned with organizational goals, technology adoption timelines, and comprehensive monitoring frameworks. Financial planning is more sophisticated, incorporating multiyear investment forecasts, funding source identification, and risk-adjusted financial modeling to better secure necessary resources. This comprehensive approach serves multiple critical functions: securing executive leadership buy-in, aligning organizational resources and priorities, and providing clear decision-making frameworks. This structured approach not only facilitates more reliable funding but also builds stakeholder confidence through transparent goal setting and progress tracking, enabling organizations to move from reactive to proactive sustainability management. Cummins exemplifies corporate transparency by publicly sharing their comprehensive emissions reduction strategies through their “Destination Zero”, demonstrating how transparency can reinforce organizational commitment to sustainability goals [37]. Colgate-Palmolive Company has published its Climate Transition & Net Zero Action Plan, “The Power of We,” to establish itself as a climate leader in the industry, outline a comprehensive climate strategy, and communicate specific targets to stakeholders [38].

4.1.4. Innovative Funding Mechanisms

Organizations that do not have dedicated funds are also starting to use innovative external financing mechanisms to fund emissions reduction projects. Energy service companies provide comprehensive solutions that evaluate, design, and implement facility-wide efficiency and emissions reduction initiatives. These specialized firms operate through business models based on energy savings performance contracts, which guarantee energy savings to finance improvements. These turnkey approaches enable organizations to achieve significant energy and emissions reductions while managing financial risk. General Motors and Bentley Mills have set long-term contracts not only for energy reduction but also water-saving projects in some cases [39,40]. These contracting models are often attractive, allowing the implementation of energy-saving projects at little or no up-front cost to the client, with the energy service company being repaid from the cost savings generated by the projects over time. The biggest hurdle identified by companies is that these often require complex contracts that define performance metrics and allocate risks and responsibilities among the parties. Establishing clear, measurable, and agreed-upon metrics for energy efficiency improvements is crucial but often difficult. Guaranteed savings claims are often met with a degree of skepticism.
A recent uptick has occurred in organizations opting for bonds to help fund their emissions reduction projects. Despite market uncertainty in some regions of the world, S&P Global Ratings projected green, social, sustainability, and sustainability-linked bonds to increase up to $1.05 trillion in 2024 [41]. Green bonds specifically are issued exclusively to finance projects that positively impact the environment. These bonds can be used to finance energy efficiency, renewables, pollution prevention and control, natural resources and land management, clean transportation, wastewater and water management, and green building projects. Electrolux and Kingspan are currently using green financing as a mechanism to fund their emissions reduction efforts. Electrolux has successfully issued six green bonds, with a total of ca. $691 million (6.6 billion SEK) to finance investments aligned with the Green Financing Framework [42]. Kingspan entered into an ca. $877 million (€750 million) sustainability-linked private placement in 2020 and an ca. $936 million (€800 million) sustainability-linked revolving credit facility in 2021 [43].

4.1.5. Using the Internal Cost of Carbon to Make a Business Case

Leading corporations are adopting internal carbon pricing as a strategic tool to drive emissions-reducing investments. In 2021, more than 5900 corporate organizations disclosed internal carbon pricing to the Carbon Disclosure Project (CDP) [44]. Many participants mentioned during the discussions that, rather than using formal carbon pricing, they prefer to use shadow carbon pricing, which aligns with CDP findings [45]. Although internal pricing of carbon can help generate internal finance, shadow pricing is a way to make decisions.
Saint-Gobain has emerged as a particularly ambitious example [46] by setting an internal cost of carbon. It is implementing a dual pricing structure that differentiates between investments and R&D projects to accelerate the adoption of alternate fuel technologies. The company demonstrated its heightened commitment by significantly increasing its internal carbon prices from a range of $30–$100/tCO2e in 2016 to $50–$200/tCO2e in 2023, with specific pricing tiers for acquisitions, capital expenditures, and R&D initiatives [46,47,48]. Other industry leaders have developed their own distinctive approaches to internal carbon pricing. Cummins, as part of its Destination Zero environmental strategy, has established a baseline price of $7/tCO2e for evaluating emissions reduction projects [49], whereas Chemours has implemented a rate of $41/tCO2e [50]. In 2023, Kingspan also introduced ca. $81/tCO2e (€70/tCO2e) across its global business [43]. These companies recognize that internal carbon pricing cannot remain static; they regularly review and adjust their carbon prices to reflect evolving regulatory landscapes, market conditions, and public-facing commitments. The implementation of internal carbon pricing allows companies to further incentivize deployment of emission reduction projects by reducing project costs to meet their goals.

4.2. Technical Barrier

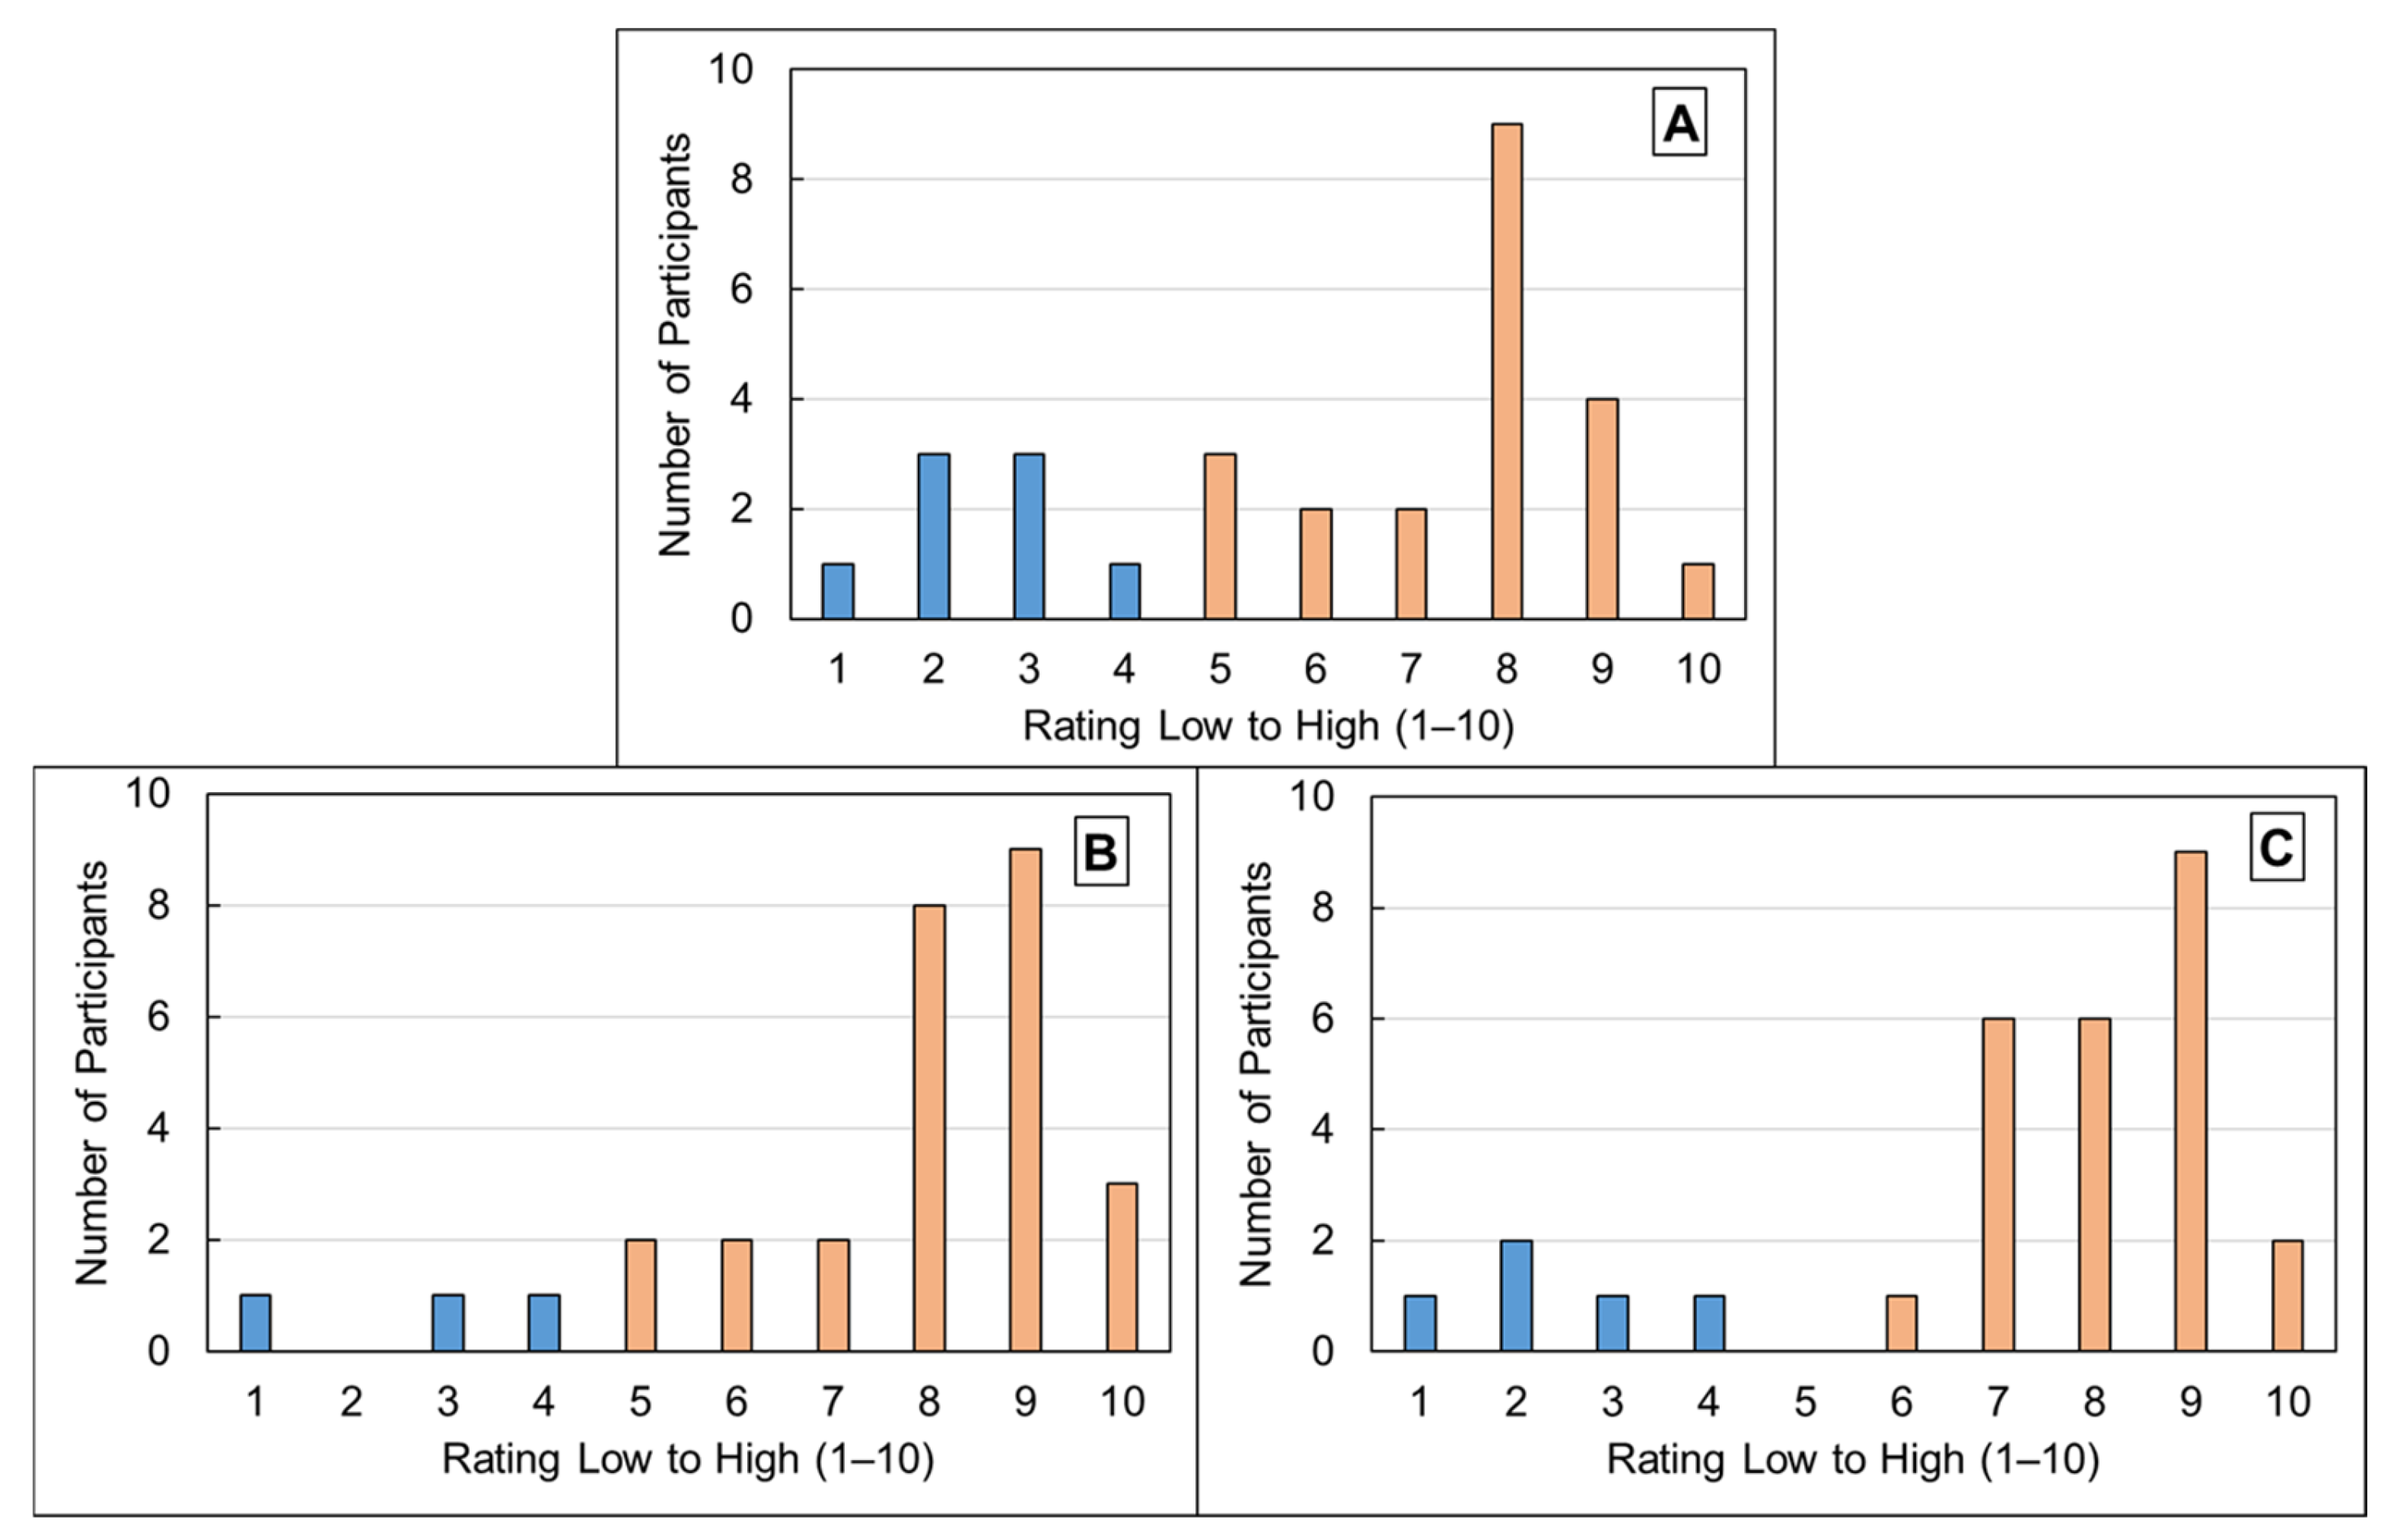
Technology limitations represent the second biggest challenge in industrial emissions reduction, with implementation complexity varying by approach. Many promising technologies remain in early development, making industrial-scale adoption expensive and risky for companies pursuing emissions reduction goals. Organizations implementing electrification face substantial infrastructure upgrade requirements to accommodate increased electricity consumption. These companies must navigate complex utility rate negotiations while carefully aligning their consumption patterns with renewable energy availability. Alternate fuel adoption depends heavily on a robust supply chain infrastructure to ensure consistent fuel availability and reliable transportation. Figure 6 shows the rating of availability of technology (A), operational cost (B), and infrastructure readiness (C) for deployment of electrification and alternate fuel switching technology. All these categories of barriers received high ratings, indicating a significant barrier. Participants elaborated on the technical challenges constraining their emission reduction efforts, explaining why even with technological development, deployment of these technologies poses a significant barrier.

4.2.1. Barriers for Electrification Technology

Electrification technological solutions exist, but the practical realities of implementation create substantial hurdles for companies attempting to transform their operations. Electrification, widely promoted as a cornerstone emissions reduction strategy, presents formidable infrastructure challenges that many companies are unprepared to address. The substantial increase in electricity consumption necessitates extensive infrastructure upgrades, often requiring complete redesigns of electrical systems at manufacturing facilities. These modifications frequently involve significant capital expenditures and lengthy permitting processes. The increase in energy consumption leads to an increase in GHG emissions unless the increase in electricity use is compensated by renewable energy purchases. Aligning industrial consumption patterns with renewable energy availability creates operational complexities. Heat pump technology, frequently cited as a key electrification solution by participants, raises particular concerns about performance reliability in cold weather conditions. Industrial companies have expressed deep skepticism about whether these systems can maintain consistent operation and efficiency during harsh winter months, especially for high-temperature processes.
Despite the barriers related to heat pumps, Chivas Brothers installed mechanical vapor recompression (MVR) technology at its Glentauchers distillery in Scotland [51]. The system recovers thermal energy from alcohol evaporation instead of losing it through cooling towers, reducing energy use by 48% and carbon emissions by 53% [51]. Following this success, Chivas Brothers invested more than ca. $81.4 million (£60 million) to deploy MVR heat pumps across all applicable distilleries, which is expected to cut total annual on-site emissions by 38%.

4.2.2. Barrier for Alternate Fuel-Switching Technology

Alternate fuel switching presents an entirely different set of challenges with equally significant implications. Although these technologies offer promising emissions reduction potential on paper, they require an entirely new supply chain infrastructure to ensure consistent fuel availability and reliable transportation from production sources to industrial facilities. Companies must be guaranteed that fuel supplies can scale production demands, a particular concern for growing businesses or those with seasonal production patterns. The physical properties of alternative fuels such as renewable natural gas (RNG) and biodiesel often differ substantially from conventional energy sources, requiring modifications to combustion equipment, storage facilities, and handling procedures. These differences can necessitate complete replacements of burners, boilers, and related systems, exponentially increasing transition costs beyond the fuel itself.
To mitigate some of the barriers related to procurement of alternate fuel, AstraZeneca partnered with Vanguard Renewables in a major 15-plus year agreement to supply RNG to AstraZeneca’s U.S. facilities [52]. Three new farm-based anaerobic digesters will provide 650,000 MMBtu/year of RNG, meeting nearly all of AstraZeneca’s U.S. gas needs by late 2026. The RNG contract resembles a renewable electricity power purchase agreement (PPA) in which Vanguard Renewables funds digester construction and AstraZeneca pays a fixed price per MMBtu over the 15-year term. The agreement includes volumetric guarantees and price stability provisions while providing Vanguard with the revenue certainly needed for new projects. AstraZeneca will purchase RNG injected into common carrier pipelines, matching its U.S. gas consumption on a one-to-one energy basis and retaining all environmental attributes to reduce Scope 1 emissions. Verification will occur through M-RETS renewable thermal certificates and independent third-party annual assurance of AstraZeneca’s energy usage data.

4.2.3. Lack of Volume of Equipment Availability

Manufacturing facilities typically require multiple system units to achieve meaningful emissions reduction, but suppliers frequently struggle to meet these quantity requirements within reasonable periods despite many technologies reaching high technology readiness levels (i.e., TRL 7–9) and approaching market deployment. The limited production capacity for advanced technologies creates extended lead times, sometimes exceeding 18–24 months for critical components. Implementing new technologies necessitates extensive product testing to ensure quality standards remain uncompromised, adding time and complexity to the transition process. Manufacturing processes often rely on precise thermal profiles or specific energy inputs that directly affect product characteristics, making energy system changes potentially disruptive to product quality.

4.2.4. Need for Facility Layout Change or Legacy Infrastructure Upgrade

Integration of novel technology into existing older industrial facilities presents complex challenges. Established industrial facilities operate within tightly optimized layouts, leaving little room for new equipment. Depending on the technology, many require additional space for primary and auxiliary equipment, control systems, and maintenance access. New technology also requires careful planning of piping, electrical connections, and material flow. Many companies with older facility infrastructure and equipment are looking at the natural replacement window to help make decisions on investments and timelines for emissions-reducing projects. They face the inevitable need for replacement when equipment approaches the end of its operational life, providing the ideal opportunity to consider alternate fuel rather than simply replacing old equipment with models with no consideration for operational or energy efficiency. The optimized timing aligns the inevitable capital expenditure with strategic goals, with upgrades occurring during preplanned downtimes to minimize disruptions.

4.2.5. Barriers for On-Site Renewable Energy

Renewable energy implementation presents distinct challenges for companies pursuing emissions reduction. Many organizations face fundamental barriers to onsite energy installation, including limited real estate, aging infrastructure, and competitive electricity rates from traditional sources that undermine project economics. Physical constraints often severely limit renewable potential, with many industrial facilities lacking sufficient unshaded roof space, adjacent land, or structural capacity to support significant solar installations. Wind energy faces even greater challenges because of setback requirements, noise concerns, and visual effect considerations. Figure 7 shows the barrier rating by the participants for onsite renewable energy generation. Despite these barriers, Lockheed Martin converted an unused parking lot at their Sand Lake Road Campus in Orlando into a 2 MW solar carport, demonstrating an innovative solution to common renewable energy implementation challenges [53]. The project, completed in late 2021, generates approximately 3.6 million kWh annually, saving $581,000 in utility costs and avoiding 1364 tCO2e each year. Since activation through May 2024, it has produced 7.6 million kWh and saved $800,000 in energy costs [53].

4.2.6. Barriers to Renewable Contracts

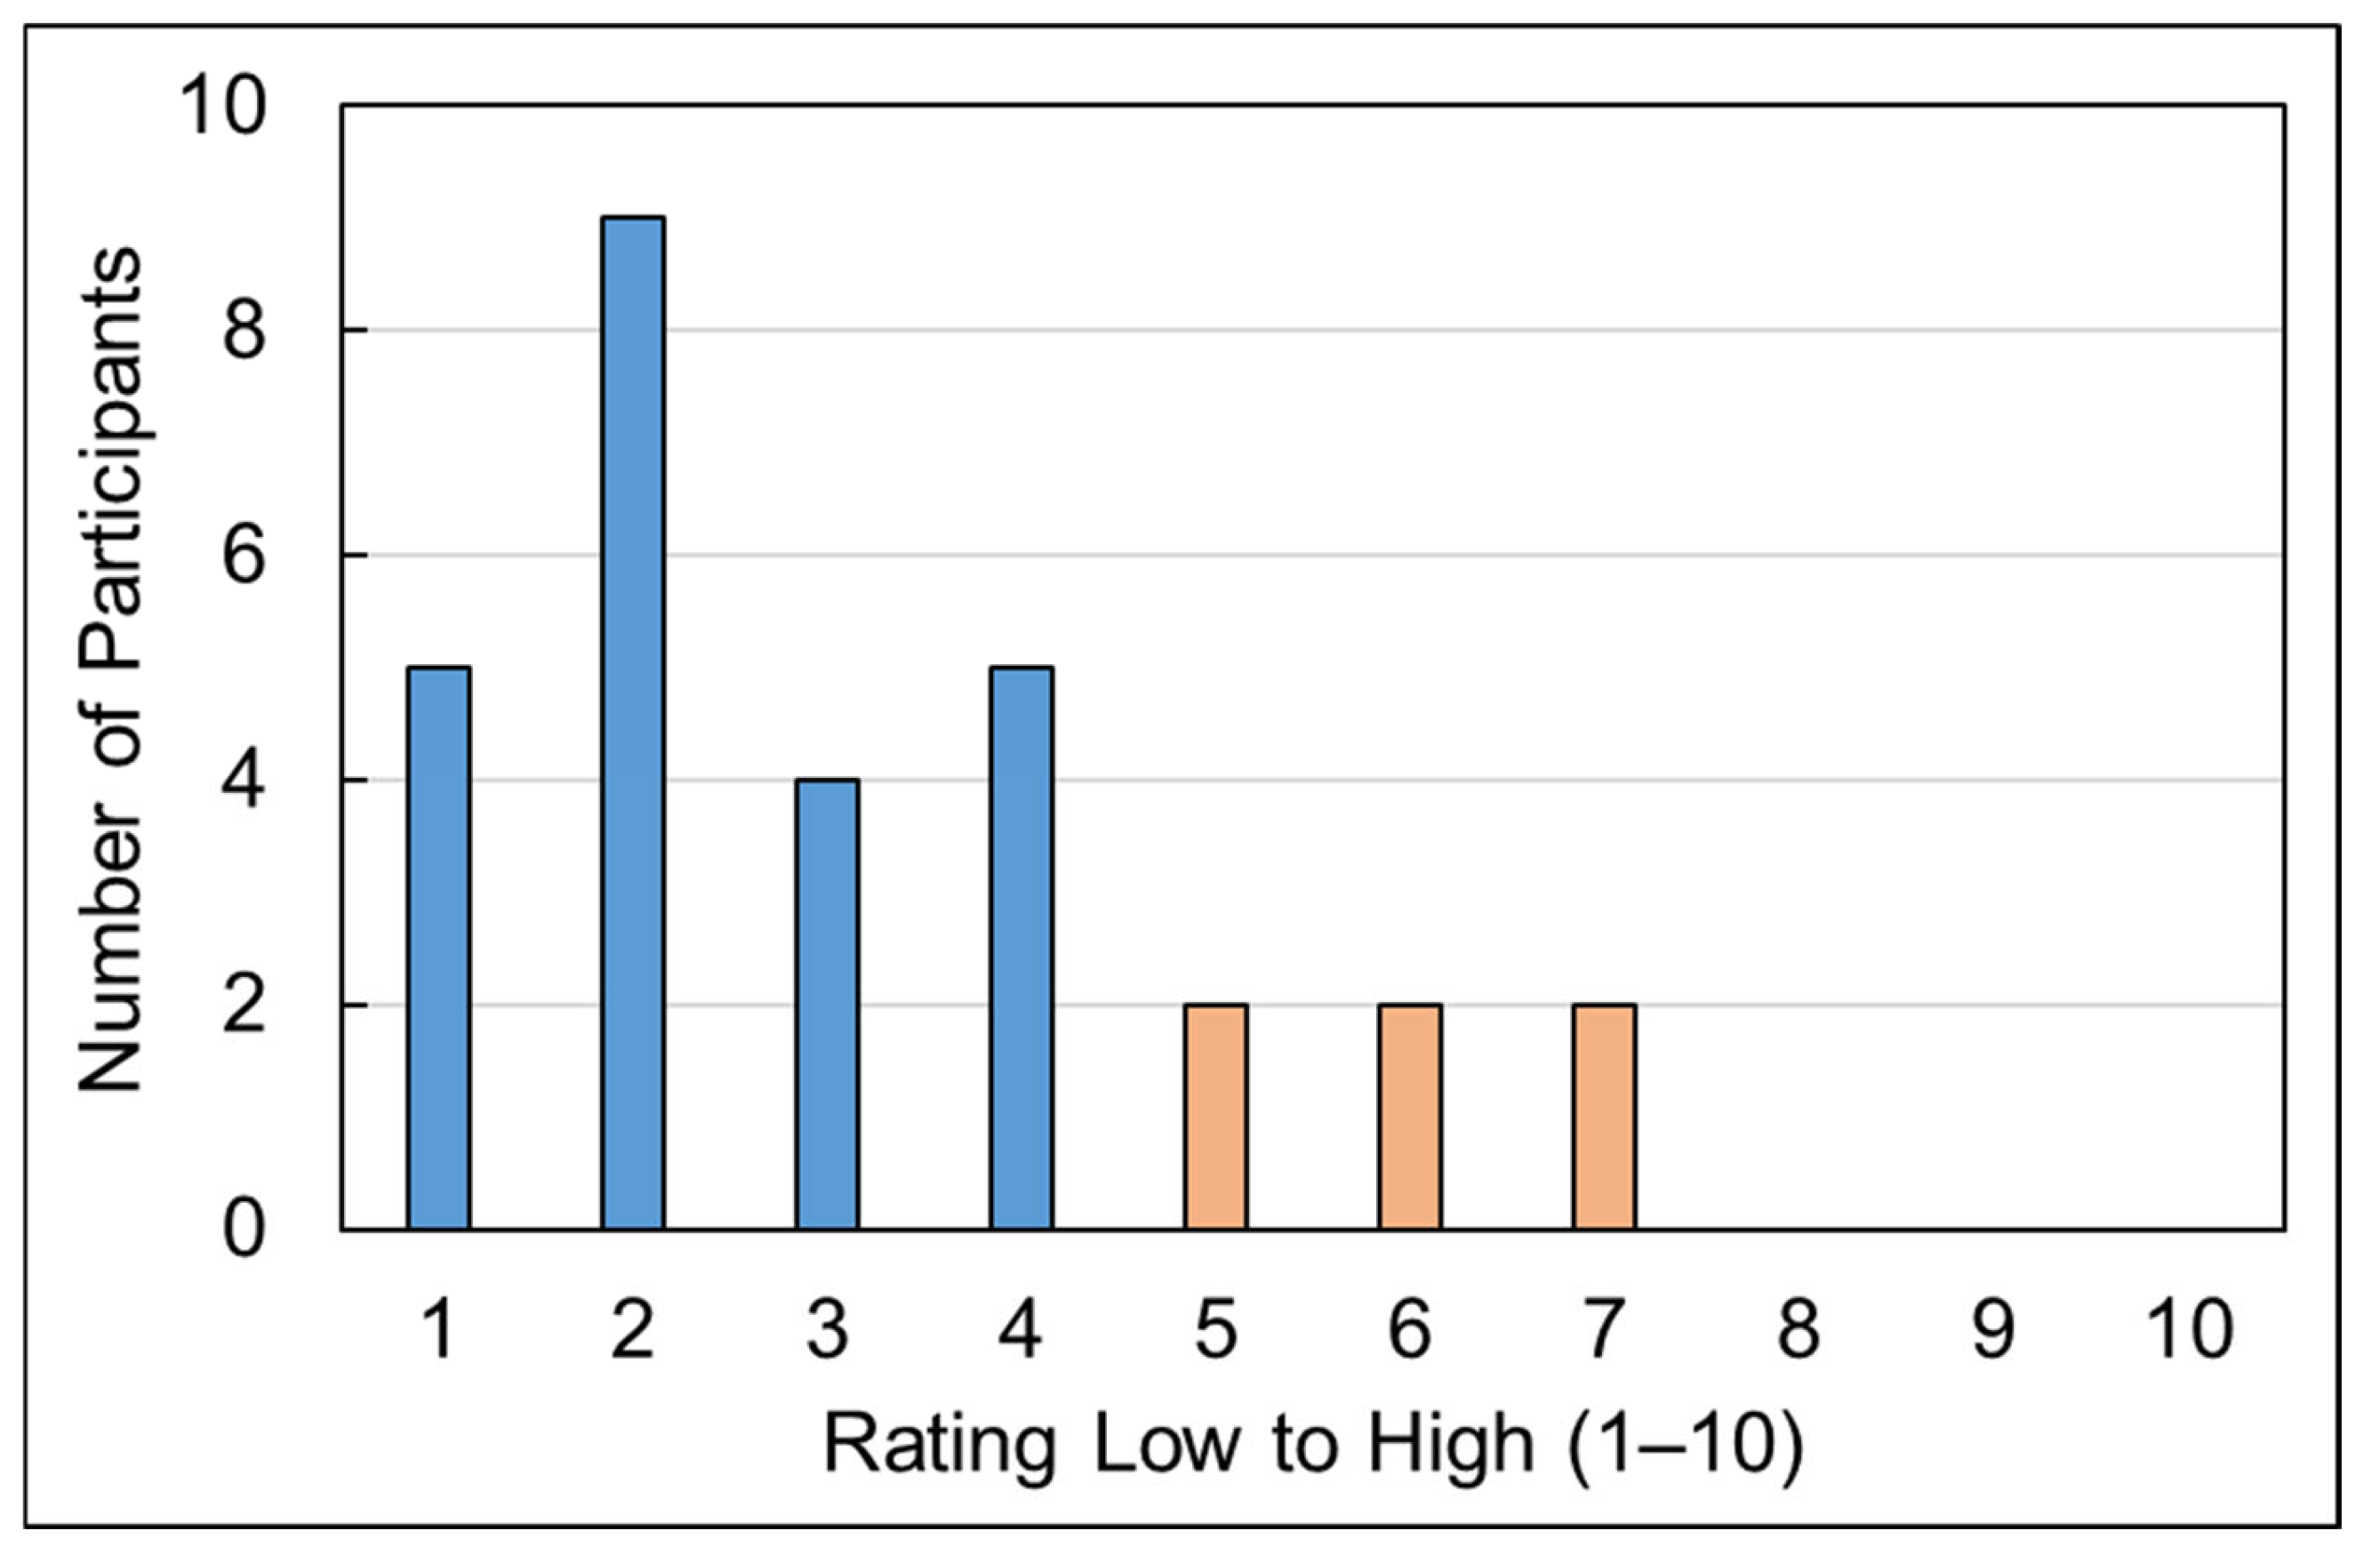
Companies new to renewable energy contracts frequently find themselves overwhelmed by technical complexities and unfamiliar contract terminology, including PPAs, virtual PPAs, renewable energy certificates, and complex scheduling provisions. Legal and financial due diligence for these agreements can consume significant organizational resources and extend project timelines by 12–24 months. A notable market challenge has emerged for small and medium-sized manufacturers that struggle to compete for large renewable energy contracts against major corporations. These large technology companies can commit to substantial offtake agreements that attract developer attention and preferential terms, leaving smaller industrial players with fewer options and less favorable economics. Figure 8 shows the barrier rating by the participants for renewable energy purchase.
Despite these common technical barriers, in 2018 Colgate-Palmolive installed a solar thermal system at its Athens, Greece, manufacturing facility [54]. This project, aligned with the company’s Climate Transition Plan, was selected over other renewable options because it integrated with existing systems, allowed uninterrupted production, provided stable energy, required minimal space, and offered a quick payback period. Following its success, a second system was installed at the same location three years later. The Athens solar thermal system generates 163 MWh annually, displacing natural gas combustion and avoiding 77,000 lbs of CO2 emissions annually. This initial installation covered 35% of the plant’s total thermal load, demonstrating that even partial renewable coverage can significantly affect emissions. Following its success, Colgate-Palmolive is now evaluating additional installations globally. The project highlights how industrial facilities with available roof space and hot water requirements are particularly well-suited for solar thermal implementations, especially when combined with efficiency measures like waste heat recovery.

4.3. Organizational Barrier

The organizational barriers received relatively low concern ratings from companies interviewed, suggesting these challenges are either manageable or already being addressed within their organizations. This finding is likely because these organizations have already demonstrated their commitment to environmental action and established dedicated teams to advance their sustainability initiatives. Participants elaborated on the organizational challenges constraining their emission reduction efforts, explaining why organizational barrier was one of the lowest barriers to overcome.

4.3.1. Inaccuracies in Data Collection from Traditional Spreadsheet Tools

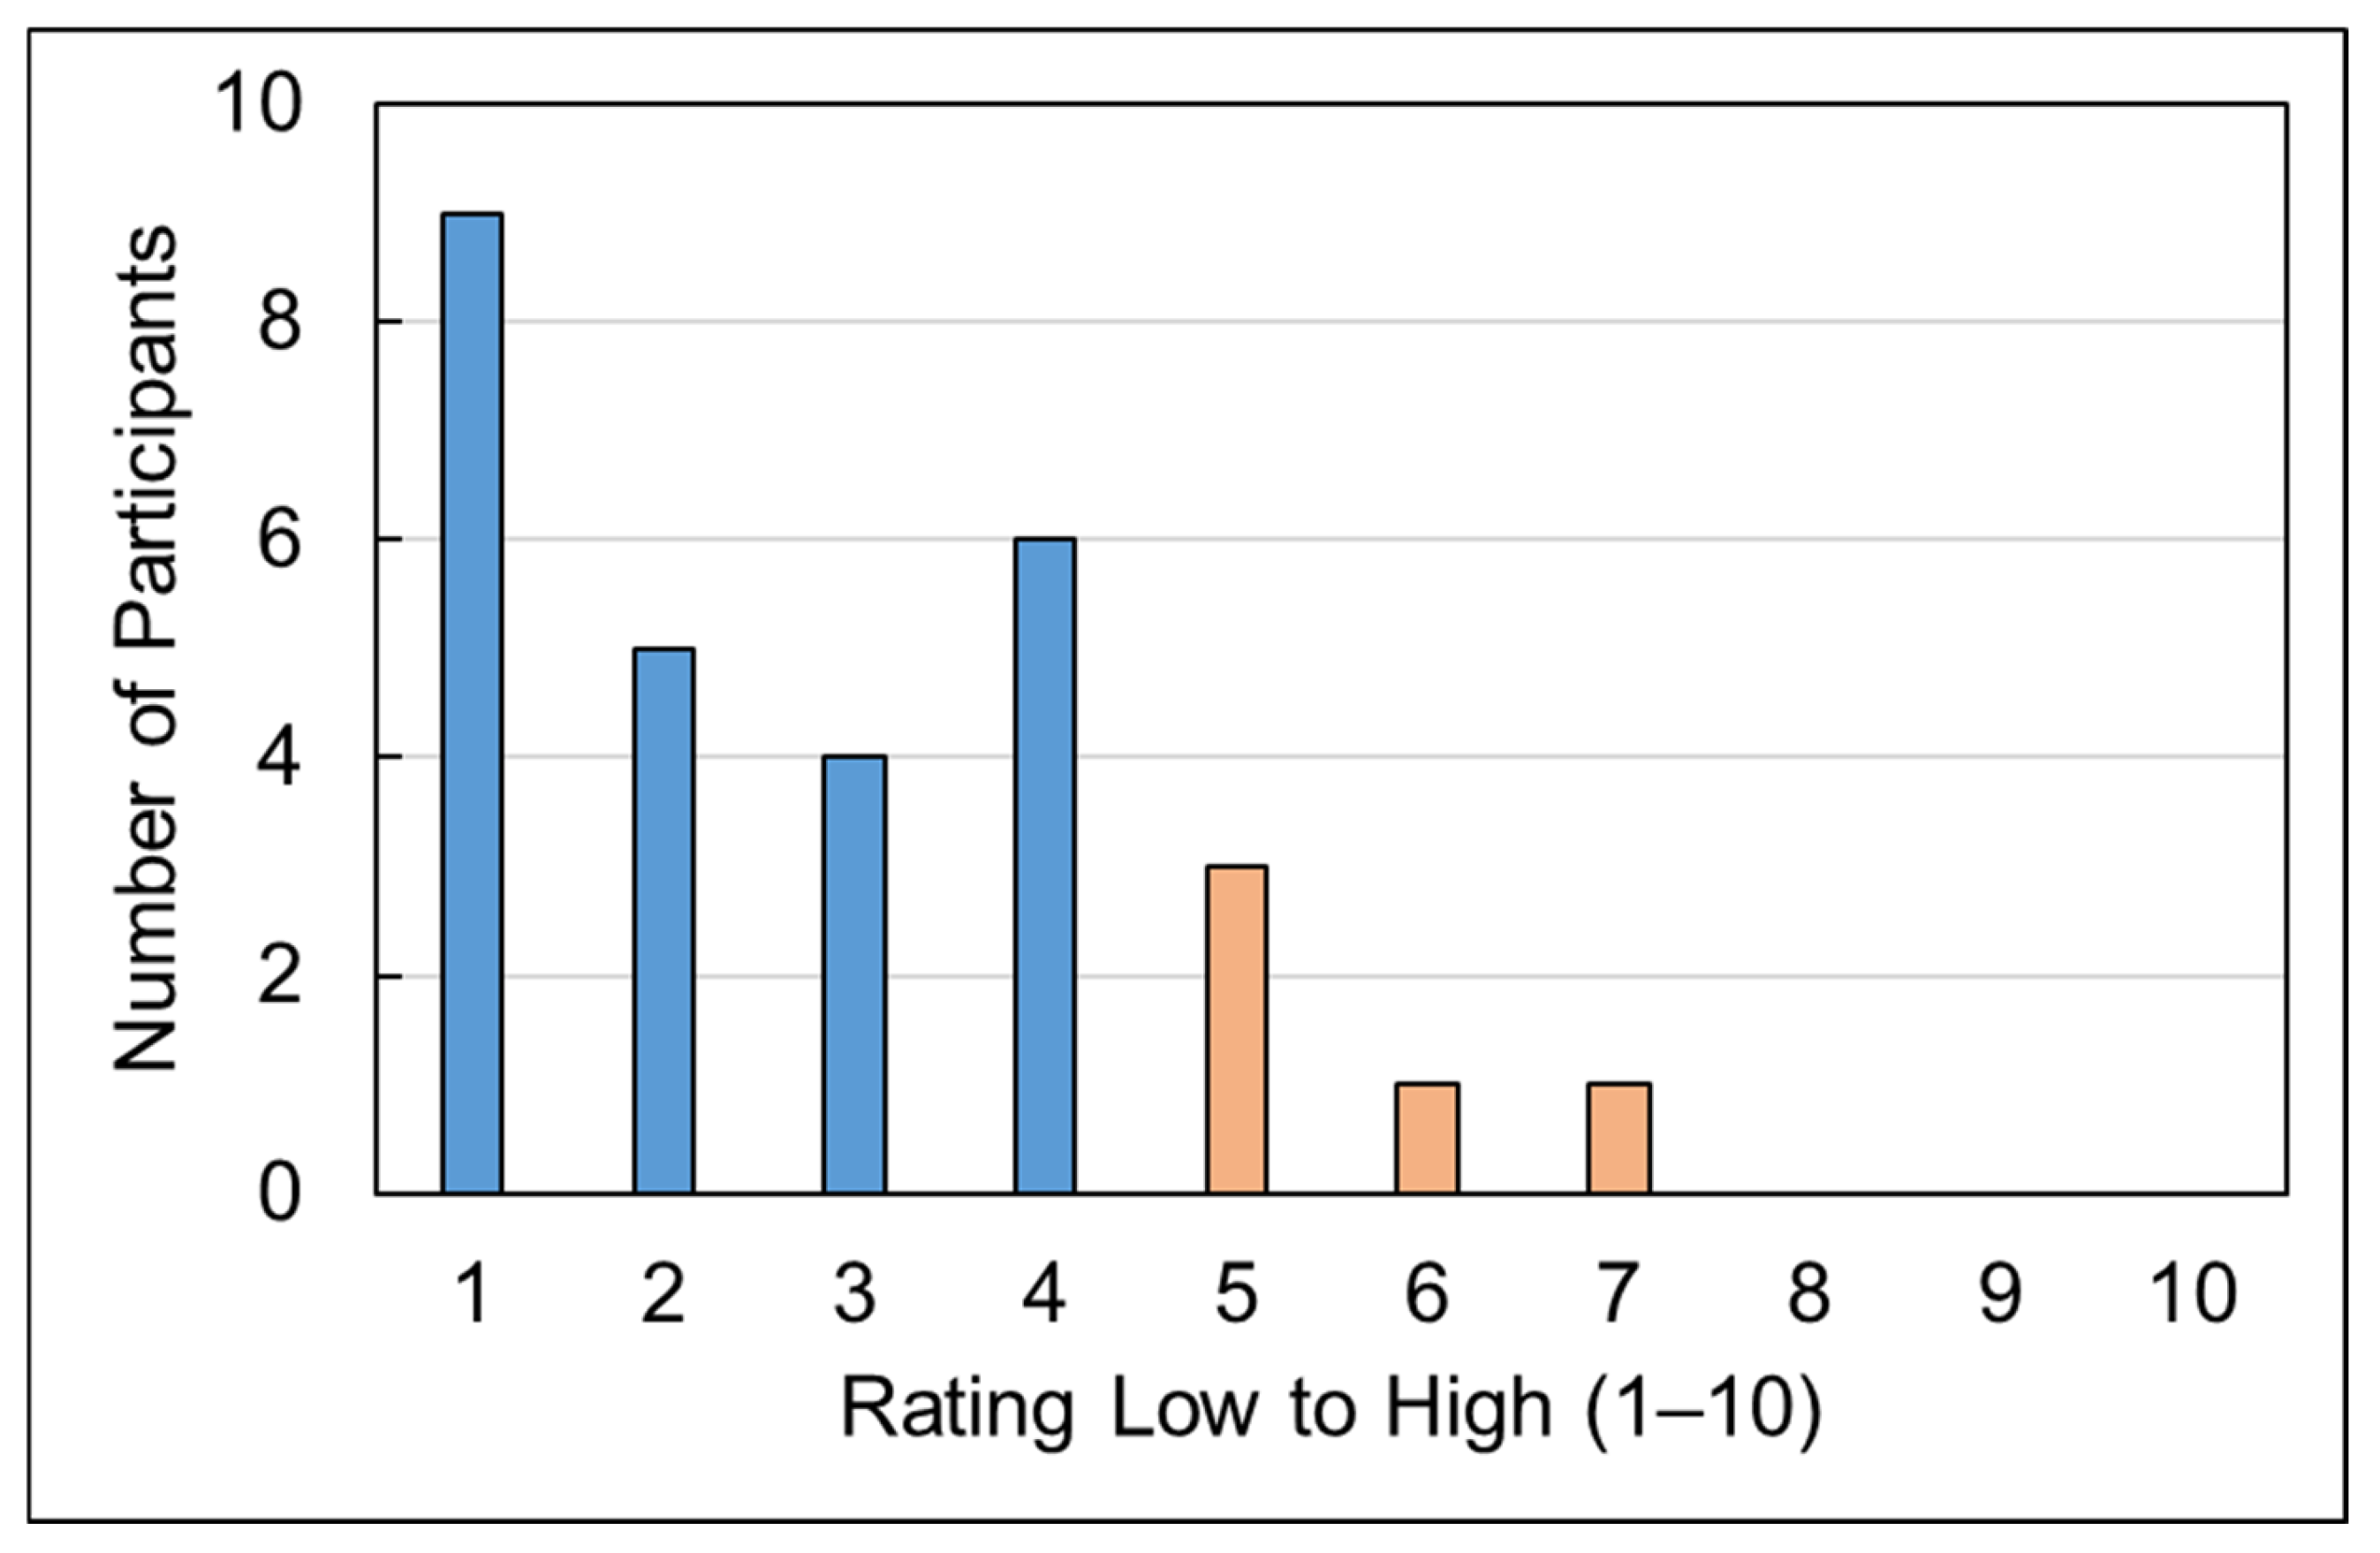
Some companies are still finding themselves relying on basic spreadsheets distributed across their organization to track both energy consumption data and key performance indicators related to energy use. This approach creates several notable drawbacks, including concerns about data accuracy caused by potentially conflicting information in multiple spreadsheet copies. The system heavily depends on employees manually entering data, which makes verifying accuracy challenging without direct access to utility data. Workflow bottlenecks emerge because typically only a few designated employees are responsible for providing and managing this data. With increasingly stringent data reporting requirements from organizations like CDP and other regulatory entities, many companies are gradually migrating to specialized software platforms. These platforms offer automated utility bill processing with direct integration to utility providers, anomaly detection to flag data points that significantly deviate from historical patterns, streamlined reporting through built-in templates, and enhanced auditability for third-party reviews. Though companies have generally mastered monthly data tracking, many now focus on obtaining more granular information at the equipment level, with high-frequency measurements collected hourly or even minute-by-minute. Real-time analytics capabilities allow for processing operational data as they are generated, enabling organizations to identify efficiency opportunities proactively. Although none of the participants have fully implemented these advanced monitoring systems, many were actively working toward deploying such capabilities for their large and mission-critical equipment as the next evolution in their energy and emissions data management strategies. Figure 9 shows the barrier rating by the participants for access to data which shows that the barrier is significantly low.

4.3.2. Lack of Dedicated Staff

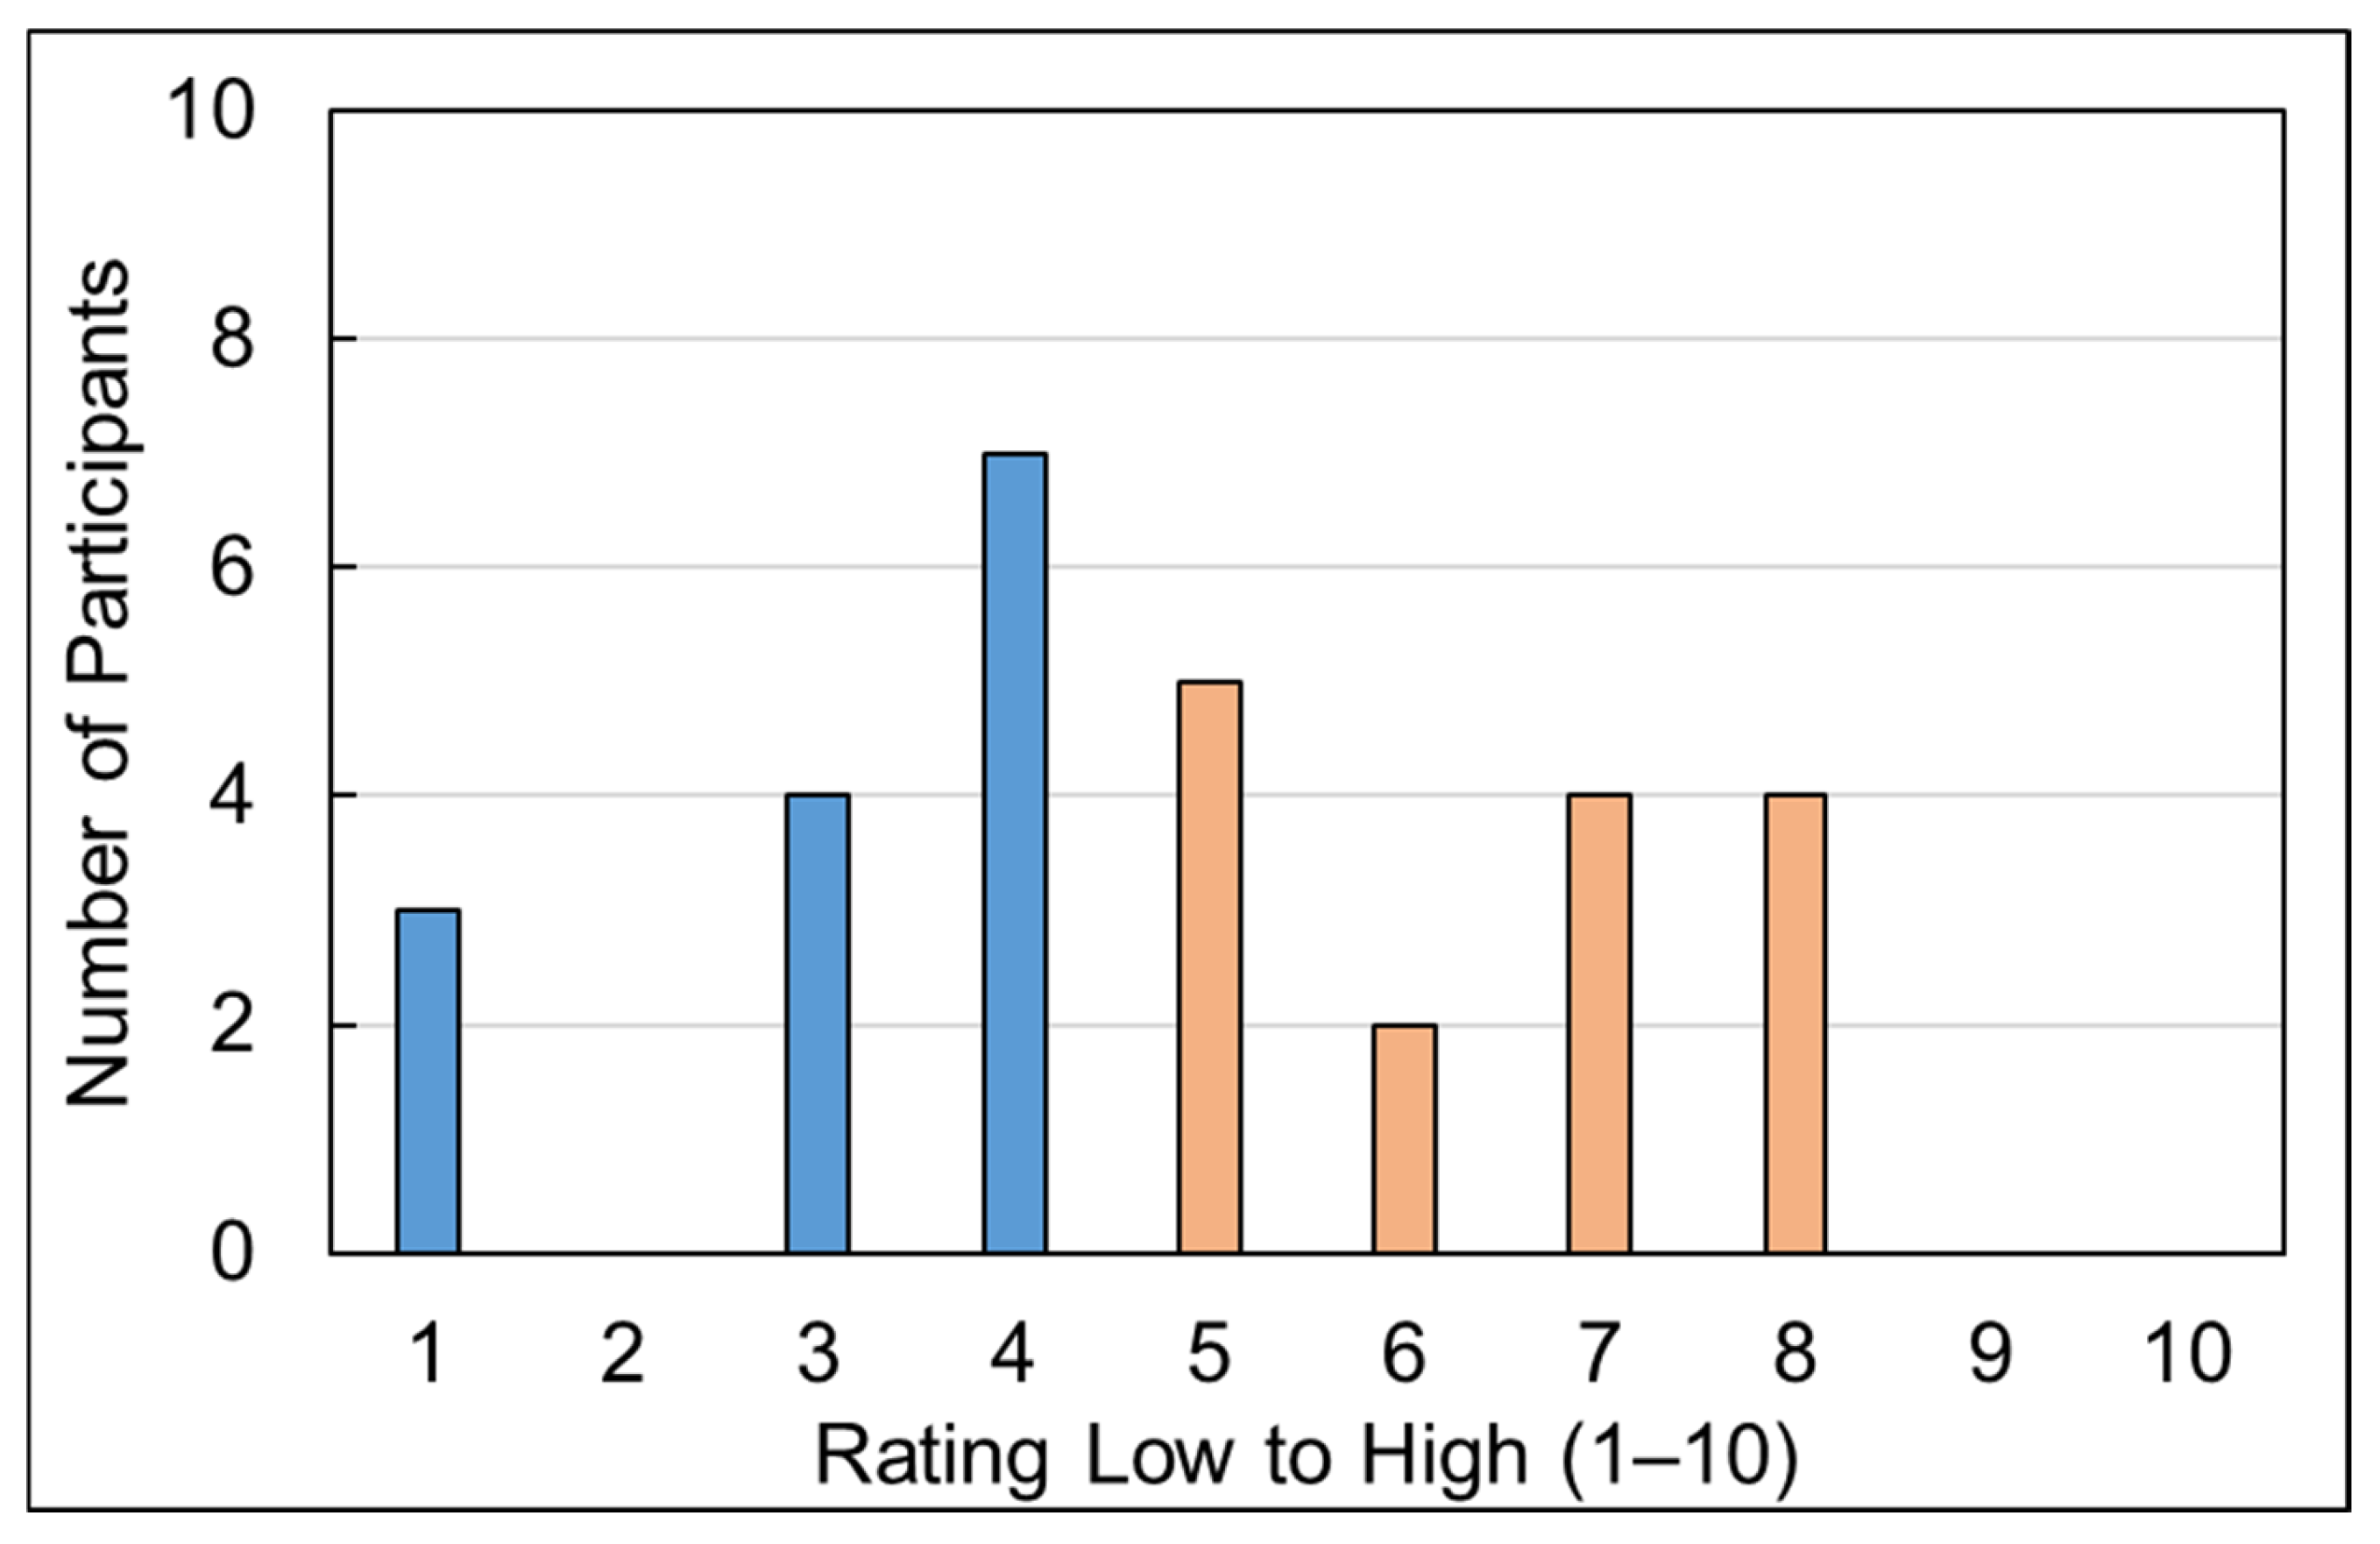
Organizations often employ teams of engineers who possess extensive knowledge about operational systems and maintenance protocols. These subject matter experts proved invaluable in identifying and quantifying energy reduction opportunities while also evaluating alternative energy sources and electrification possibilities within their facilities. However, despite even with wealth of in-house expertise, a significant implementation challenge emerged across multiple organizations. Commonly, employees find themselves stretched thin across competing priorities. These technical professionals frequently lacked dedicated time and incentives to analyze and document energy- and emissions-saving opportunities. Figure 10 shows the barrier rating by the participants for lack of in-house/external expertise. The high barrier rating is driven largely by the time constraints their subject matter experts had rather than the lack of these experts within the organization.

4.3.3. Recognition to Drive Sustainability Initiatives

The implementation of strategic incentive structures has emerged as a promising approach to address challenges associated with workforce availability. Incentives can range from internal recognition within the company to external recognition and can include industrial awards, monetary incentives, or companywide friendly competitions. Internal recognition and leadership acknowledgement, which highlights the contributions of employees who identify energy-saving opportunities, can significantly boost participation and increase motivation to allocate time to energy initiatives. External recognition, such as industry awards or features in sustainability publications, further enhances this effect by providing professional validation beyond organizational boundaries. C-suite organizations have also started exploring bonus structures tied to quantified energy and emissions savings. Companywide or interdepartmental friendly competitions with clear metrics have also proven valuable in mobilizing technical expertise toward energy optimization. Implementing incentive structures that work for the organization can help overcome significant time constraints that would otherwise prevent staff from applying their expertise to energy optimization initiatives. Based on discussions with companies, it became evident that engaging employees or occupants is a low barrier for companies as shown in Figure 11.
ArcelorMittal successfully addressed the challenge of limited employee bandwidth for energy initiatives through its innovative “Power of 1 Contest” [55]. This program effectively channels employee expertise toward identifying and implementing low- and no-cost energy efficiency improvements across its manufacturing facilities. The contest is strategically structured around ArcelorMittal’s annual energy fair held during October, which is energy awareness month. Employees, either individually or in teams, submit energy-saving project proposals that undergo rigorous evaluation. Each submission is assessed on a 0–4 rating scale across multiple categories, including cost-effectiveness, replicability, and creativity. This systematic evaluation process culminates with final judging by ArcelorMittal’s Global CTO, adding organizational significance to the initiative. Winners receive tangible prizes along with substantial recognition through both internal and external communications channels. The contest’s focus on low- and no-cost improvements enables quick implementation of winning ideas, providing employees with the satisfaction of seeing their innovations put into practice. This program yielded $500,000 in energy savings from 15 implemented projects over a three-year period. The “Power of 1 Contest” exemplifies how a well-designed employee engagement program can overcome time-constraint barriers by creating structured opportunities for technical staff to apply their expertise toward energy optimization despite demanding schedules.

4.3.4. Lack of Skilled Workforce

During the interview, companies mentioned the tight labor market. Finding specialists in emerging fields such as renewable energy systems, alternate fuel technology, or industrial-scale battery storage is becoming increasingly difficult. The existing workforce needs hands-on practice with new equipment as well as training to safely familiarize them with new processes. This training is time-consuming and costly, causing slowdowns during training periods and increased payroll expenses for new hires. Moreover, the rapid pace of technological advancement in all sectors means that workforce development must be viewed as a continuous process rather than a one-time transition. Figure 12 shows the rating of participants on performing engineering analysis (A), which is higher than quantifying emission reduction potential (B), which is low. Providing employees with targeted training and the right analytical resources enables them to effectively perform engineering assessments and quantify the emissions reduction potential of sustainability initiatives.

4.3.5. Lack of Understanding of the Emerging Technology and Energy Market and the Need for C-Suite Education

Beyond financial availability, a significant barrier to project funding is knowledge gaps surrounding advanced technologies that can help reduce emissions and increase productivity. Because of uncertainty about technical viability, performance metrics, and risk profiles, decision-makers often hesitate to invest in innovations like high-temperature heat pumps; thermal storage systems; and geothermal energy. This uncertainty is compounded when C-suite executives lack fluency in emissions-reduction technology trends and evolving market demands. Their hesitation is understandable—these technologies represent substantial investments with complex implementation pathways and return models that differ from traditional energy efficiency investments. Executive leadership may benefit from information on the regulatory landscape, innovative financing, technology assessment frameworks, and strategic integration.
Discussions related to carbon pricing, tax incentives, border carbon adjustment mechanisms, green bonds, carbon credit markets, technology readiness level evaluation, and reliability assessment can transform executive hesitation into informed leadership. By providing clear, evidence-based information on an ongoing basis, companies can secure crucial executive buy-in that positions advanced technology investments within the broader business strategy, highlighting competitive advantages beyond mere compliance.

4.4. Regulatory Barrier

Regulatory uncertainty emerged as a significant concern among participants, particularly regarding the evolving landscape of emissions reporting. A major source of apprehension centered on alternative fuels such as biofuel and hydrogen, with companies expressing uncertainty about methodologies for accurately measuring and reporting associated emissions.

Uncertainty Around Carbon Accounting

Since the 2004 publication of the Greenhouse Gas Protocol’s Corporate Accounting and Reporting Standard, GHG accounting has evolved significantly, including widespread adoption of net-zero targets, implementation of mandatory climate disclosure regulations, used by thousands of companies, and extensive academic research on the standards’ application and impact. During discussions with participants, regulatory uncertainty emerged as a concern, particularly regarding the evolving landscape of emissions reporting. A major source of apprehension centers on alternative fuels particularly hydrogen and carbon offset credits related to carbon capture, utilization, and storage (CCUS), with companies expressing uncertainty about methodologies for accurately measuring and reporting associated emissions. Organizations with near-term net-zero commitments voice specific concerns about carbon offset certificates and their future market acceptance. Additionally, expanding reporting requirements through the CDP and other mandatory regulations have created anxiety among companies, which are working to navigate and adapt to this changing regulatory environment.
Organizations with ambitious near-term net-zero targets are facing mounting scrutiny over their reliance on offsets. The lack of national standards on accounting methodology on these topics is a major concern for users. Between late 2022 and early 2023, GHG Protocol conducted a public consultation seeking feedback on its current corporate standards suite, including the Corporate Standard, Scope 2 Guidance, Actions and market instruments, and Scope 3 Standard. The primary goals of any updates will be to ensure that GHG Protocol standards align with best practices and provide a rigorous accounting foundation for businesses measuring progress toward emission-reduction goals. Once these updates are finalized, GHG Protocol will elevate some of the regulatory concerns related to company reporting.

5. Future Work

Although this study provided valuable insights into barriers to emissions reduction in the industrial sector, several limitations should be acknowledged when interpreting the results. The study’s scope was constrained by resources and time limitations on both the authors’ and participants’ sides, encompassing only 29 manufacturing organizations. Whereas these participants demonstrated strong commitments through their emission reduction targets, this sample size presents inherent limitations for broader industry generalization. The voluntary nature of participation, though essential for ensuring genuine engagement, may have introduced selection bias. Furthermore, the interviews were conducted with facility representatives in the U.S. the discussions may have overlooked barriers common to other regions, particularly in Asia and Europe.
Common barriers to participation in such studies within the manufacturing sector should also be noted. These include resource constraints, competing operational priorities, and data privacy concerns. Manufacturing facilities often face challenges in allocating time and personnel to noncore activities, even when potential benefits are recognized. Additionally, the sensitive nature of operational and performance data can discourage participation, potentially limiting the study’s representation of industry-wide challenges.
Given these constraints, the findings should be interpreted as preliminary insights rather than definitive conclusions. The sample size precludes robust statistical analysis that would be necessary for broader industry-wide generalizations. Instead, these results should be viewed as well-documented hypotheses that provide a foundation for future research. Larger-scale studies with more diverse participation will be necessary to validate and expand upon these initial findings.

6. Conclusions

To achieve comprehensive industrial emission reduction, strategies must evolve to address all sectors. This includes developing approaches for discrete manufacturing sectors, creating simplified tools and resources accessible to smaller facilities, and establishing support mechanisms that account for their unique challenges. Frameworks need to be redesigned to recognize and address the distinct barriers these sectors face and to foster collaboration networks to share knowledge and resources.
By acknowledging and addressing the challenges of all sectors, organizations can develop more effective and inclusive emission reduction strategies that truly encompass the entire industrial landscape. The path to high-impact emissions reduction and manufacturing competitiveness requires attention not only to the largest emitters but also to the full spectrum of manufacturing activities that make up the industrial economy.

Author Contributions

Conceptualization and methodology—P.N. and T.W.; Investigation—P.N., A.B. and H.J.K.; Writing—original draft preparation—P.N.; Editing and internal review—P.N., A.B., T.W. and H.J.K. All authors have read and agreed to the published version of the manuscript.

Funding

The submitted manuscript was prepared by Oak Ridge National Laboratory, which is managed by UT-Battelle, LLC for the U.S. Department of Energy under contract DE-AC05-00OR22725. The authors gratefully acknowledge the support of the U.S. Department of Energy.

Institutional Review Board Statement

The study has been reviewed by the Oak Ridge Sitewide Institutional Review Board (IRB#: IRB00000547, Correspondence number: HRP-519, Date: 10/18/23). Upon evaluating the information, the IRB has determined that this effort conducted for this research does not meet the definition of research under the Common Rule (10CFR745), as it is not generalizable.

Informed Consent Statement

Participants were informed that their involvement was voluntary, that all identifying information would be kept confidential, and that they could withdraw from the study at any time without penalty. Participants agreed that their anonymized data would be collected, analyzed, and used for research purposes.

Data Availability Statement

The datasets generated and analyzed during the current study are not publicly available due to the inclusion of sensitive organizational information disclosed by interview participants under confidentiality agreements. Requests for access to anonymized data may be directed to the corresponding author and are subject to approval by the relevant organizations.

Conflicts of Interest

The authors declare no conflicts of interest.

References

  1. U.S. Energy Information Administration. Use of Energy Explained: Energy Use in Industry. Available online: https://www.eia.gov/energyexplained/use-of-energy/industry.php (accessed on 15 April 2025).
  2. U.S. Department of Energy. Industrial Decarbonization Roadmap; U.S. Department of Energy: Washington, DC, USA, 2022. [Google Scholar]
  3. United States Department of State and Executive Office of the President. The Long-Term Strategy of the United States; United States Department of State and Executive Office of the President: Washington, DC, USA, 2021. [Google Scholar]
  4. Sandbag Climate Campaign. Barriers to Industrial Decarbonisation; Sandbag Climate Campaign: Brussels, Belgium, 2018. [Google Scholar]
  5. Gross, S. The Challenge of Decarbonizing Heavy Industry; Brookings Institute: Washington, DC, USA, 2021. [Google Scholar]
  6. U.S. Department of Energy. Barriers to Industrial Energy Efficiency: Report to Congress; U.S. Department of Energy: Washington, DC, USA, 2015.
  7. U.S. Department of Energy. Pathways Analysis Summary: Decarbonization Potential for Industrial Subsectors; U.S. Department of Energy: Washington, DC, USA, 2024.
  8. Kempken, T.; Hauck, T.; De Santis, M.; Queipo Rodriguez, P.; Miranda, M.; Gonzalez, D.; Simonelli, F.; Vu, H.; Szulc, W.; Croon, D.; et al. Collection of Possible Decarbonisation Barriers; Green Steel for Europe Consortium: Brussels, Belgium, 2021. [Google Scholar]
  9. Renewable Thermal Collaborative. Industrial Thermal Decarbonization Package; Renewable Thermal Collaborative: Washington, DC, USA, 2023. [Google Scholar]
  10. Erb, T.; Perciasepe, B.; Radulovic, V.; Niland, M. Corporate Climate Commitments: The Trend Towards Net Zero. In Handbook of Climate Change Mitigation and Adaptation; Lackner, M., Sajjadi, B., Chen, W.-Y., Eds.; Springer: New York, NY, USA, 2020; pp. 1–34. [Google Scholar]
  11. Christiansen, K.L.; Hajdu, F.; Planting Mollaoglu, E.; Andrews, A.; Carton, W.; Fischer, K. “Our burgers eat carbon”: Investigating the discourses of corporate net-zero commitments. Environ. Sci. Policy 2023, 142, 79–88. [Google Scholar] [CrossRef]
  12. Colesanti Senni, C.; Reidt, N. Transport policies in a two-sided market. Econ. Work. Pap. Ser. 2018, 18/306. [Google Scholar] [CrossRef]
  13. Caritte, V.; Acha, S.; Shah, N. Enhancing Corporate Environmental Performance Through Reporting and Roadmaps. Bus. Strategy Environ. 2015, 24, 289–308. [Google Scholar] [CrossRef]
  14. Gomes, S.; Lopes, J.M.; Nogueira, S. Willingness to pay more for green products: A critical challenge for Gen Z. J. Clean. Prod. 2023, 390, 136092. [Google Scholar] [CrossRef]
  15. Sharma, M.; Antony, R.; Vadalkar, S.; Ishizaka, A. Role of industry 4.0 technologies and human-machine interaction for de-carbonization of food supply chains. J. Clean. Prod. 2024, 468, 142922. [Google Scholar] [CrossRef]
  16. Ferreira, A.; Pinheiro, M.D.; de Brito, J.; Mateus, R. Decarbonizing strategies of the retail sector following the Paris Agreement. Energy Policy 2019, 135, 110999. [Google Scholar] [CrossRef]
  17. Ajayi, V.; Reiner, D. Are Consumers Willing to Pay for Industrial Decarbonisation? Evidence from a Discrete Choice Experiment on Green Plastics; Energy Policy Research Group, University of Cambridge: Cambridge, UK, 2020. [Google Scholar]
  18. Larrea, I.; Correa, J.M.; López, R.; Giménez, L.; Solaun, K. A Multicriteria Methodology to Evaluate Climate Neutrality Claims—A Case Study with Spanish Firms. Sustainability 2022, 14, 4310. [Google Scholar] [CrossRef]
  19. Hong, P.; Jeong, J. Supply chain management practices of SMEs: From a business growth perspective. J. Enterp. Inf. Manag. 2006, 19, 292. [Google Scholar] [CrossRef]
  20. Diezinger, S.; Dennhardt, B. Electrification in Industry: The Most Efficient Way Towards Decarbonization. In Proceedings of the ADIPEC, Abu Dhabi, United Arab Emirates, 31 October–3 November 2022. [Google Scholar]
  21. Gailani, A.; Cooper, S.; Allen, S.; Pimm, A.; Taylor, P.; Gross, R. Assessing the potential of decarbonization options for industrial sectors. Joule 2024, 8, 576–603. [Google Scholar] [CrossRef]
  22. Stephens, P.; Vairamohan, B. Low-carbon Fuel Pathway to Decarbonize Hard to Electrify Industries Case Study: Cement and Glass Industries. In Proceedings of the 2023 ACEEE Summer Study on Industry, Detroit, MI, USA, 11–13 July 2023; American Council for an Energy-Efficient Economy (ACEEE): Washington, DC, USA, 2023. [Google Scholar]
  23. Wesseling, J.H.; Van der Vooren, A. Lock-in of mature innovation systems: The transformation toward clean concrete in the Netherlands. J. Clean. Prod. 2017, 155, 114–124. [Google Scholar] [CrossRef]
  24. Svensson, O.; Khan, J.; Hildingsson, R. Studying Industrial Decarbonisation: Developing an Interdisciplinary Understanding of the Conditions for Transformation in Energy-Intensive Natural Resource-Based Industry. Sustainability 2020, 12, 2129. [Google Scholar] [CrossRef]
  25. Chidolue, O.; Ngozichukwu, B.; Ibekwe, K.I.; Illojianya, V.I.; Fafure, A.V.; Daudu, C.D. Decarbonization Strategies in Energy-Intensive Industries: Cases from Canada, USA, and Africa. Int. J. Sci. Res. Arch. 2024, 11, 361–370. [Google Scholar] [CrossRef]
  26. Wei, M.; McMillan, C.A.; De La Rue Du Can, S. Electrification of Industry: Potential, Challenges and Outlook. Curr. Sustain./Renew. Energy Rep. 2019, 6, 140–148. [Google Scholar] [CrossRef]
  27. Ha, N.M.; Nguyen, P.A.; Luan, N.V.; Tam, N.M. Impact of green innovation on environmental performance and financial performance. Environ. Dev. Sustain. 2023, 26, 17083–17104. [Google Scholar] [CrossRef]
  28. Alkadi, N.E. Energy and Productivity, Two Sides of a Coin in the U.S. Auto Industry; SAE International: Warrendale, PA, USA, 2006. [Google Scholar]
  29. Shah Mehmood, W.; Muhammad Usman, A.; Xinli, Z.; Sidra, S. Green innovation and firm performance: An empirical analysis of operational efficiency, environmental commitment and technological capability. World J. Adv. Res. Rev. 2025, 25, 1148–1160. [Google Scholar] [CrossRef]
  30. Hameed, T.; Alemayehu, F.K.; Kumbhakar, S.C. Green innovation in Norwegian firms: Navigating the complexity of productivity and performance. Technol. Forecast. Soc. Change 2024, 209, 123786. [Google Scholar] [CrossRef]
  31. National Renewable Energy Laboratory (NREL). Non-Energy Benefits: Reducing Payback and Improving Performance; National Renewable Energy Laboratory (NREL): Golden, CO, USA, 2025. [Google Scholar]
  32. Jalo, N.; Johansson, I.; Kanchiralla, F.M.; Thollander, P. Do energy efficiency networks help reduce barriers to energy efficiency? -A case study of a regional Swedish policy program for industrial SMEs. Renew. Sustain. Energy Rev. 2021, 151, 111579. [Google Scholar] [CrossRef]
  33. Nehler, T. Non-Energy Benefits of Industrial Energy Efficiency: Roles and Potentials. Ph.D. Thesis, Linköping University, Linköping, Sweden, 2019. [Google Scholar]
  34. Feng, S.; Wareewanich, T. The effects of corporate carbon performance on financing cost—Evidence from S&P 500. J. Infrastruct. Policy Dev. 2024, 8, 7997. [Google Scholar]
  35. Better Buildings Solution Center. Celanese Corporation: Sustainability Checklist for Capital Projects. Available online: https://betterbuildingssolutioncenter.energy.gov/implementation-models/celanese-corporation-sustainability-checklist-capital-projects (accessed on 16 April 2025).
  36. Better Buildings Solution Center. Coining a Cleaner Future: Slides. Available online: https://betterbuildingssolutioncenter.energy.gov/sites/default/files/2023-12/Coining%20a%20Cleaner%20Future%20-%20Slides.pdf (accessed on 22 May 2025).
  37. Cummins Inc. 2024-25: Cummins Sustainability Progress Report; Cummins Inc.: Columbus, IN, USA, 2025. [Google Scholar]
  38. Colgate-Palmolive Company. 2023 Climate Transition & Net Zero Action Plan. Available online: https://www.colgatepalmolive.com/content/dam/cp-sites/corporate/corporate/common/pdf/2023-climate-transition-net-zero-action-plan.pdf (accessed on 21 May 2025).
  39. Better Buildings Solution Center. General Motors Funds Energy Conservation Projects Through Energy Performance. Available online: https://betterbuildingssolutioncenter.energy.gov/implementation-models/general-motors-funds-energy-conservation-projects-through-energy-performance (accessed on 21 May 2025).
  40. Better Buildings Solution Center. Bentley Mills: Reducing Risk and Liability in Energy Upgrades Through Efficiency. Available online: https://betterbuildingssolutioncenter.energy.gov/implementation-models/bentley-mills-reducing-risk-and-liability-energy-upgrades-through-efficiency (accessed on 21 May 2025).
  41. Cochelin, P.; Popoola, B.; Ornelas, A.; Volland, E.F. Sustainable Bond Issuance To Approach $1 Trillion in 2024; U.S. Public Finance: New York, NY, USA, 2024. [Google Scholar]
  42. Electrolux Group. Green Financing Impact Report 2023; Electrolux Group: Stockholm, Sweden, 2023. [Google Scholar]
  43. Kingspan Group plc. Planet Passionate Report 2023; Kingspan Group plc: Kingscourt, Ireland, 2023. [Google Scholar]
  44. Barata, P.M.; Mukherjee, M.; Silitonga, A.; Jones, D.; Jaspal, M.; Hanafi, A.; Pearen, H. Navigating Carbon Pricing: The G20 Experience and Global South Prospects; Observer Research Foundation: New Delhi, India; New York, NY, USA, 2024. [Google Scholar]
  45. Bowler, L. A Beginner’s Guide to Internal Carbon Pricing. Available online: https://www.ramboll.com/en-us/insights/decarbonise-for-net-zero/a-beginner-s-guide-to-internal-carbon-pricing (accessed on 21 May 2025).
  46. Better Buildings Solution Center. Paying the Price: How Internal Carbon Pricing Supports Emissions Reduction. Available online: https://betterbuildingssolutioncenter.energy.gov/webinars/paying-price-how-internal-carbon-pricing-supports-emissions-reduction (accessed on 16 April 2025).
  47. Saint-Gobain Half-Year 2023 Financial Report. Available online: https://www.saint-gobain.com/sites/saint-gobain.com/files/media/document/Half%20Year%202023%20Financial%20Report.pdf (accessed on 21 May 2025).
  48. Saint-Gobain. CDP Climate Change 2022 Questionnaire Response; Saint-Gobain: Courbevoie, France, 2022. [Google Scholar]
  49. Cummins Inc. 2024 CDP Climate Change Questionnaire Response; Cummins Inc.: Columbus, IN, USA, 2024. [Google Scholar]
  50. Better Buildings Solution Center. Paying the Price: Internal Carbon Pricing Strategies. Available online: https://betterbuildingssolutioncenter.energy.gov/sites/default/files/slides/Paying%20the%20Price%20-%20Slides.pdf (accessed on 22 May 2025).
  51. Renewable Thermal Collaborative. MVR Heat Pumps & Thermal Efficiency at Chivas Brothers Distillery; Renewable Thermal Collaborative: Arlington, VA, USA, 2024. [Google Scholar]
  52. Renewable Thermal Collaborative. AstraZeneca and Vanguard Renewables U.S. RNG Agreement; Renewable Thermal Collaborative: Arlington, VA, USA, 2024. [Google Scholar]
  53. Better Building Solutions Center. Lockheed Martin: Transforming a Parking Lot into an Energy-Generating Solar Carport. Available online: https://betterbuildingssolutioncenter.energy.gov/showcase-projects/lockheed-martin-transforming-parking-lot-energy-generating-solar-carport (accessed on 21 May 2025).
  54. Renewable Thermal Collaborative. Solar Thermal at Colgate-Palmolive Factory; Renewable Thermal Collaborative: Arlington, VA, USA, 2023. [Google Scholar]
  55. Better Buildings Solution Center. ArcelorMittal USA: Power of 1 Contest Increases Employee Engagement and Generates Low- and No-Cost Project Ideas. Available online: https://betterbuildingssolutioncenter.energy.gov/implementation-models/arcelormittal-usa-power-1-contest-increases-employee-engagement-and-generates (accessed on 16 April 2025).
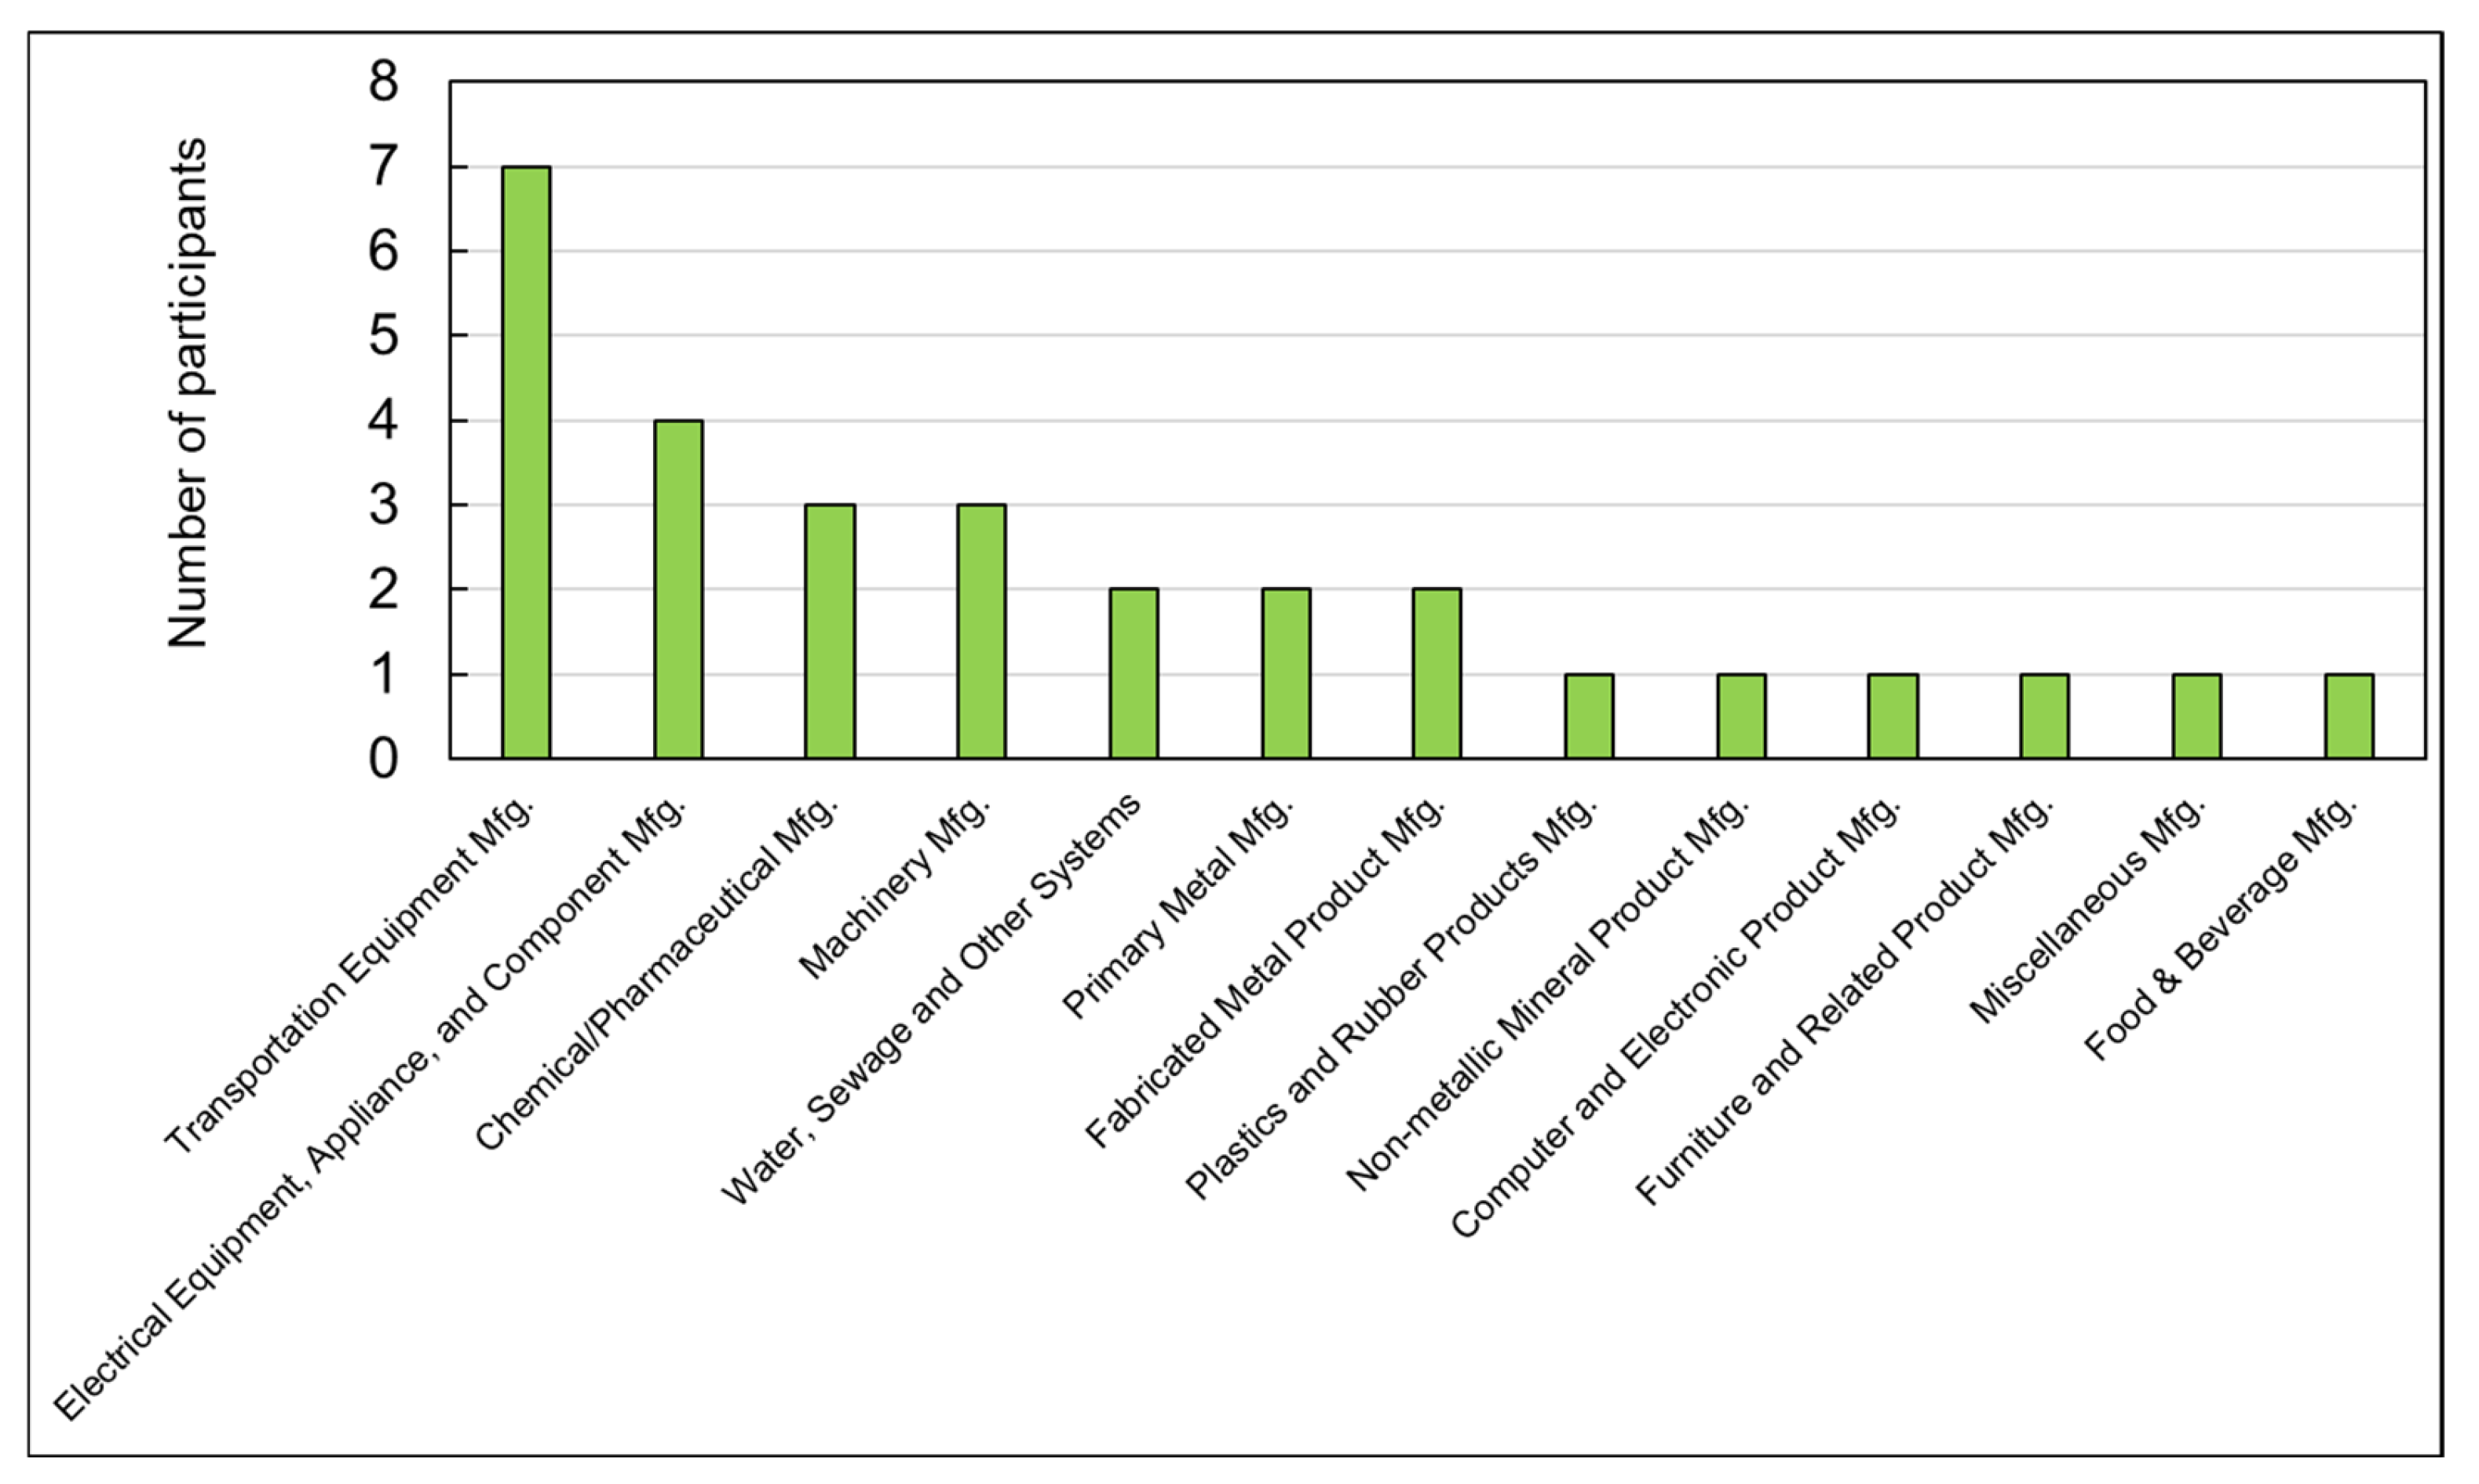
Figure 1. Distribution of interview participation across NAICS industrial sectors.
Sustainability 17 09233 g001
Figure 2. The paper’s categorization of the study’s original 11 barriers into 4 overarching themes.
Sustainability 17 09233 g002
Figure 3. Average barrier ratings from the study.
Sustainability 17 09233 g003
Figure 4. Percentage of participants rating each barrier as significant (5 and higher) vs. less significant (4 or lower).
Sustainability 17 09233 g004
Figure 5. Ratings for corporate financing in the financial barrier category.
Sustainability 17 09233 g005
Figure 6. Ratings for (A) availability of technology, (B) operational cost, and (C) infrastructure readiness for electrification and alternate fuel-switching technologies in the technical barrier category.
Sustainability 17 09233 g006
Figure 7. Ratings for feasibility of on-site renewable generation in the technical barrier category.
Sustainability 17 09233 g007
Figure 8. Ratings for renewable energy purchase in the technical barrier category.
Sustainability 17 09233 g008
Figure 9. Ratings for access to data in the organizational barrier category.
Sustainability 17 09233 g009
Figure 10. Ratings for lack of in-house/external expertise in the organizational barrier category.
Sustainability 17 09233 g010
Figure 11. Ratings for engaging employees, occupants, and customers in the organizational barrier category.
Sustainability 17 09233 g011
Figure 12. Ratings for (A) performing engineering analysis and (B) quantifying emission reduction potential in the organizational barrier category.
Sustainability 17 09233 g012
Disclaimer/Publisher’s Note: The statements, opinions and data contained in all publications are solely those of the individual author(s) and contributor(s) and not of MDPI and/or the editor(s). MDPI and/or the editor(s) disclaim responsibility for any injury to people or property resulting from any ideas, methods, instructions or products referred to in the content.