1. Introduction
Oak forests have a significant ecological and economic impacts at the global, European, and national (Romanian) levels. They provide essential ecosystem services, such as carbon sequestration, high-quality timber, and habitats for diverse species, while also supporting rural economies through products like cork, acorns, and tannins [
1,
2]. Their resilience to climatic extremes enhances their role in stabilizing ecosystems under changing environmental conditions [
3,
4,
5,
6,
7].
In Europe, oak forests are recognized as biodiversity hotspots and are included in the Natura 2000 network for the conservation of valuable habitats [
8]. Culturally, they reflect historical land-use traditions, such as coppicing and silvopastoral systems [
9,
10].
Quercus species, including both
Quercus robur L. and
Quercus petraea (Matt.) Liebl., constitute about 18% of Romania’s total forest area. Among these,
Quercus petraea alone covers approximately 10.5% of the forest area [
6,
11]. Conservation strategies have designated over 10,500 hectares as protected genetic resources [
12], underscoring the ecological and economic significance of these forests. However, increasing climate pressures, especially shifts in precipitation and temperature regimes [
13], require adaptive forest management to ensure their long-term viability [
14,
15].
The decline of oak forests is a complex and multifactorial phenomenon, resulting from the interaction between biotic and abiotic factors, physiological disturbances, and environmental pressures [
16]. Biotic factors include pathogenic fungi such as
Biscogniauxia mediterranea and
Phytophthora cinnamomi, as well as pests like
Agrilus biguttatus and
Thaumetopoea processionea, which contribute to crown dieback and reduced tree vitality [
17,
18,
19,
20,
21]. Abiotic factors, primarily climate-related, such as prolonged droughts, extreme temperatures, and poor soil conditions (e.g., salinity, waterlogging), disrupt physiological processes and increase susceptibility to secondary stressors [
22,
23,
24,
25].
Symptoms of decline at the tree level include reduced vigor, epicormic shoot development, and crown deterioration, while at the stand level, high competition and poor species composition amplify vulnerability [
17,
26]. Other visible signs include bark cracks, exudates, necrotic lesions, and insect galleries [
19,
27]. Anthropogenic pressures, especially inadequate silvicultural practices and pollution from nitrogen and heavy metals, can further accelerate the decline process [
28,
29]. Modern tools such as remote sensing and survival analysis enhance early detection and spatial risk assessment of decline [
18,
26,
30].
Monitoring the health status of oak forests is crucial for the early detection of stress and for guiding management decisions. Systematic observations allow for the prompt identification of drought effects, pest outbreaks, and disease progression [
31,
32,
33]. Longitudinal data reveal patterns of degradation, as observed in Italy and Portugal [
34,
35], while climate-related changes in temperature and precipitation in countries such as Romania and Spain directly impact oak vitality [
4,
36]. Monitoring also captures the cumulative effects of anthropogenic activities, including land-use change and pollution [
34,
37], and facilitates a deeper understanding of how biotic factors such as
Phytophthora spp. interact with abiotic stressors, including soil moisture and structure [
4,
32,
36]. Overall, continuous monitoring of forests is fundamental to ensuring the ecological functionality and long-term sustainability of oak ecosystems.
Assessing the health status of oak tree crowns provides essential insights into tree vitality and the broader integrity of forest ecosystems. A key indicator is the Live Crown Ratio (LCR), which measures the proportion of a tree’s total height occupied by live foliage and is strongly correlated with overall tree health [
38,
39]. Other structural indicators include foliage transparency and crown density, where increased transparency and reduced density signal physiological stress and potential decline [
40,
41]. Crown diameter reflects site conditions and growth potential, while the presence of dead or dying branches known as crown dieback is recognized as a direct and visible symptom of tree decline [
42,
43].
Among all parameters, primary crown dieback is considered one of the most effective early indicators of acute decline [
44]. Crown transparency and structural changes respond to both short-term biotic disturbances such as insect-induced defoliation and long-term abiotic stressors like drought [
45]. Phenotypic traits such as crown volume and tree stature also aid in distinguishing between chronic and acute decline syndromes [
46]. Environmental and ecological factors, including drought, nutrient limitations, competition for light, and stand density, significantly influence crown development and health [
47,
48,
49]. Additionally, tree age and vigor are important, as older or physiologically weakened trees are more susceptible to crown deformation and dieback [
50]. Integrating traditional field assessments with modern digital tools provides a robust and scalable framework for early detection, monitoring, and management of oak forest health.
Oak forest mortality and decline have severe implications for genetic diversity and the structure of tree populations [
51,
52], undermining their long-term adaptability and ecological resilience [
53]. Genetic diversity is particularly at risk in fragmented or low-density stands, where inbreeding and genetic drift become more pronounced. Isolated populations exhibit reduced variability compared to continuous forests, indicating an active process of genetic erosion [
54,
55]. These findings highlight the need for conservation strategies that prioritize genetic integrity. Key measures include facilitating gene flow between fragmented stands, supporting natural regeneration, and ensuring sufficient tree density through sustainable forest management [
56,
57]. Regular monitoring of genetic parameters is essential for the early detection of genetic erosion and the prompt implementation of conservation actions [
56,
58]. Failure to act may irreversibly compromise the evolutionary potential of oak populations.
Geographic Information Systems (GIS) have become essential tools for monitoring the decline of oak forests, particularly in the context of pressures driven by climate change. When integrated with remote sensing technologies, GIS enables the generation of multitemporal forest and biomass maps using optical data and Synthetic Aperture Radar (SAR), providing detailed spatial and temporal insights into ecosystem dynamics [
59]. These tools support ecological assessment through real-time analysis of vegetation status, soil conditions, moisture indices, and phytosanitary health via web-based platforms [
60,
61].
GIS also plays a vital role in detecting land-use and land cover (LULC) changes driven by climatic and anthropogenic pressures, as demonstrated by studies on forest degradation in Pakistan and Japan [
62,
63,
64]. In the context of climate stress, GIS technologies enable the monitoring of structural forest changes and vegetation biochemical responses to drought, thereby enhancing the early detection of decline signals [
65,
66]. Furthermore, GIS increases the efficiency of conservation strategies by mapping illegal logging activities and tracking reforestation progress [
67,
68]. Watershed analyses conducted using GIS support ecosystem resilience by assessing water availability in forested landscapes an essential factor for mitigating the effects of drought [
69]. Overall, GIS provide a robust, data-driven foundation for adaptive forest management and long-term sustainability.
We hypothesize that the decline of oak forests is primarily driven by the interaction between adverse climatic conditions and anthropogenic pressures, which together intensify physiological stress and structural degradation. In this context, this study aims to develop an integrative framework for diagnosing canopy degradation in temperate oak forests by correlating structural, physiological, and climatic indicators. Based on data collected from eight Forest Management Units (FMUs) in Romania between 2017 and 2021, this research seeks to identify early warning signals of canopy stress, analyze the spatial variability of crown responses, and assess the ecological risks associated with cumulative decline, thereby providing a robust foundation for predictive ecology and adaptive forest management under global climate change.
2. Materials and Methods
2.1. Environmental Setting and Spatial Characterization of the Study Area
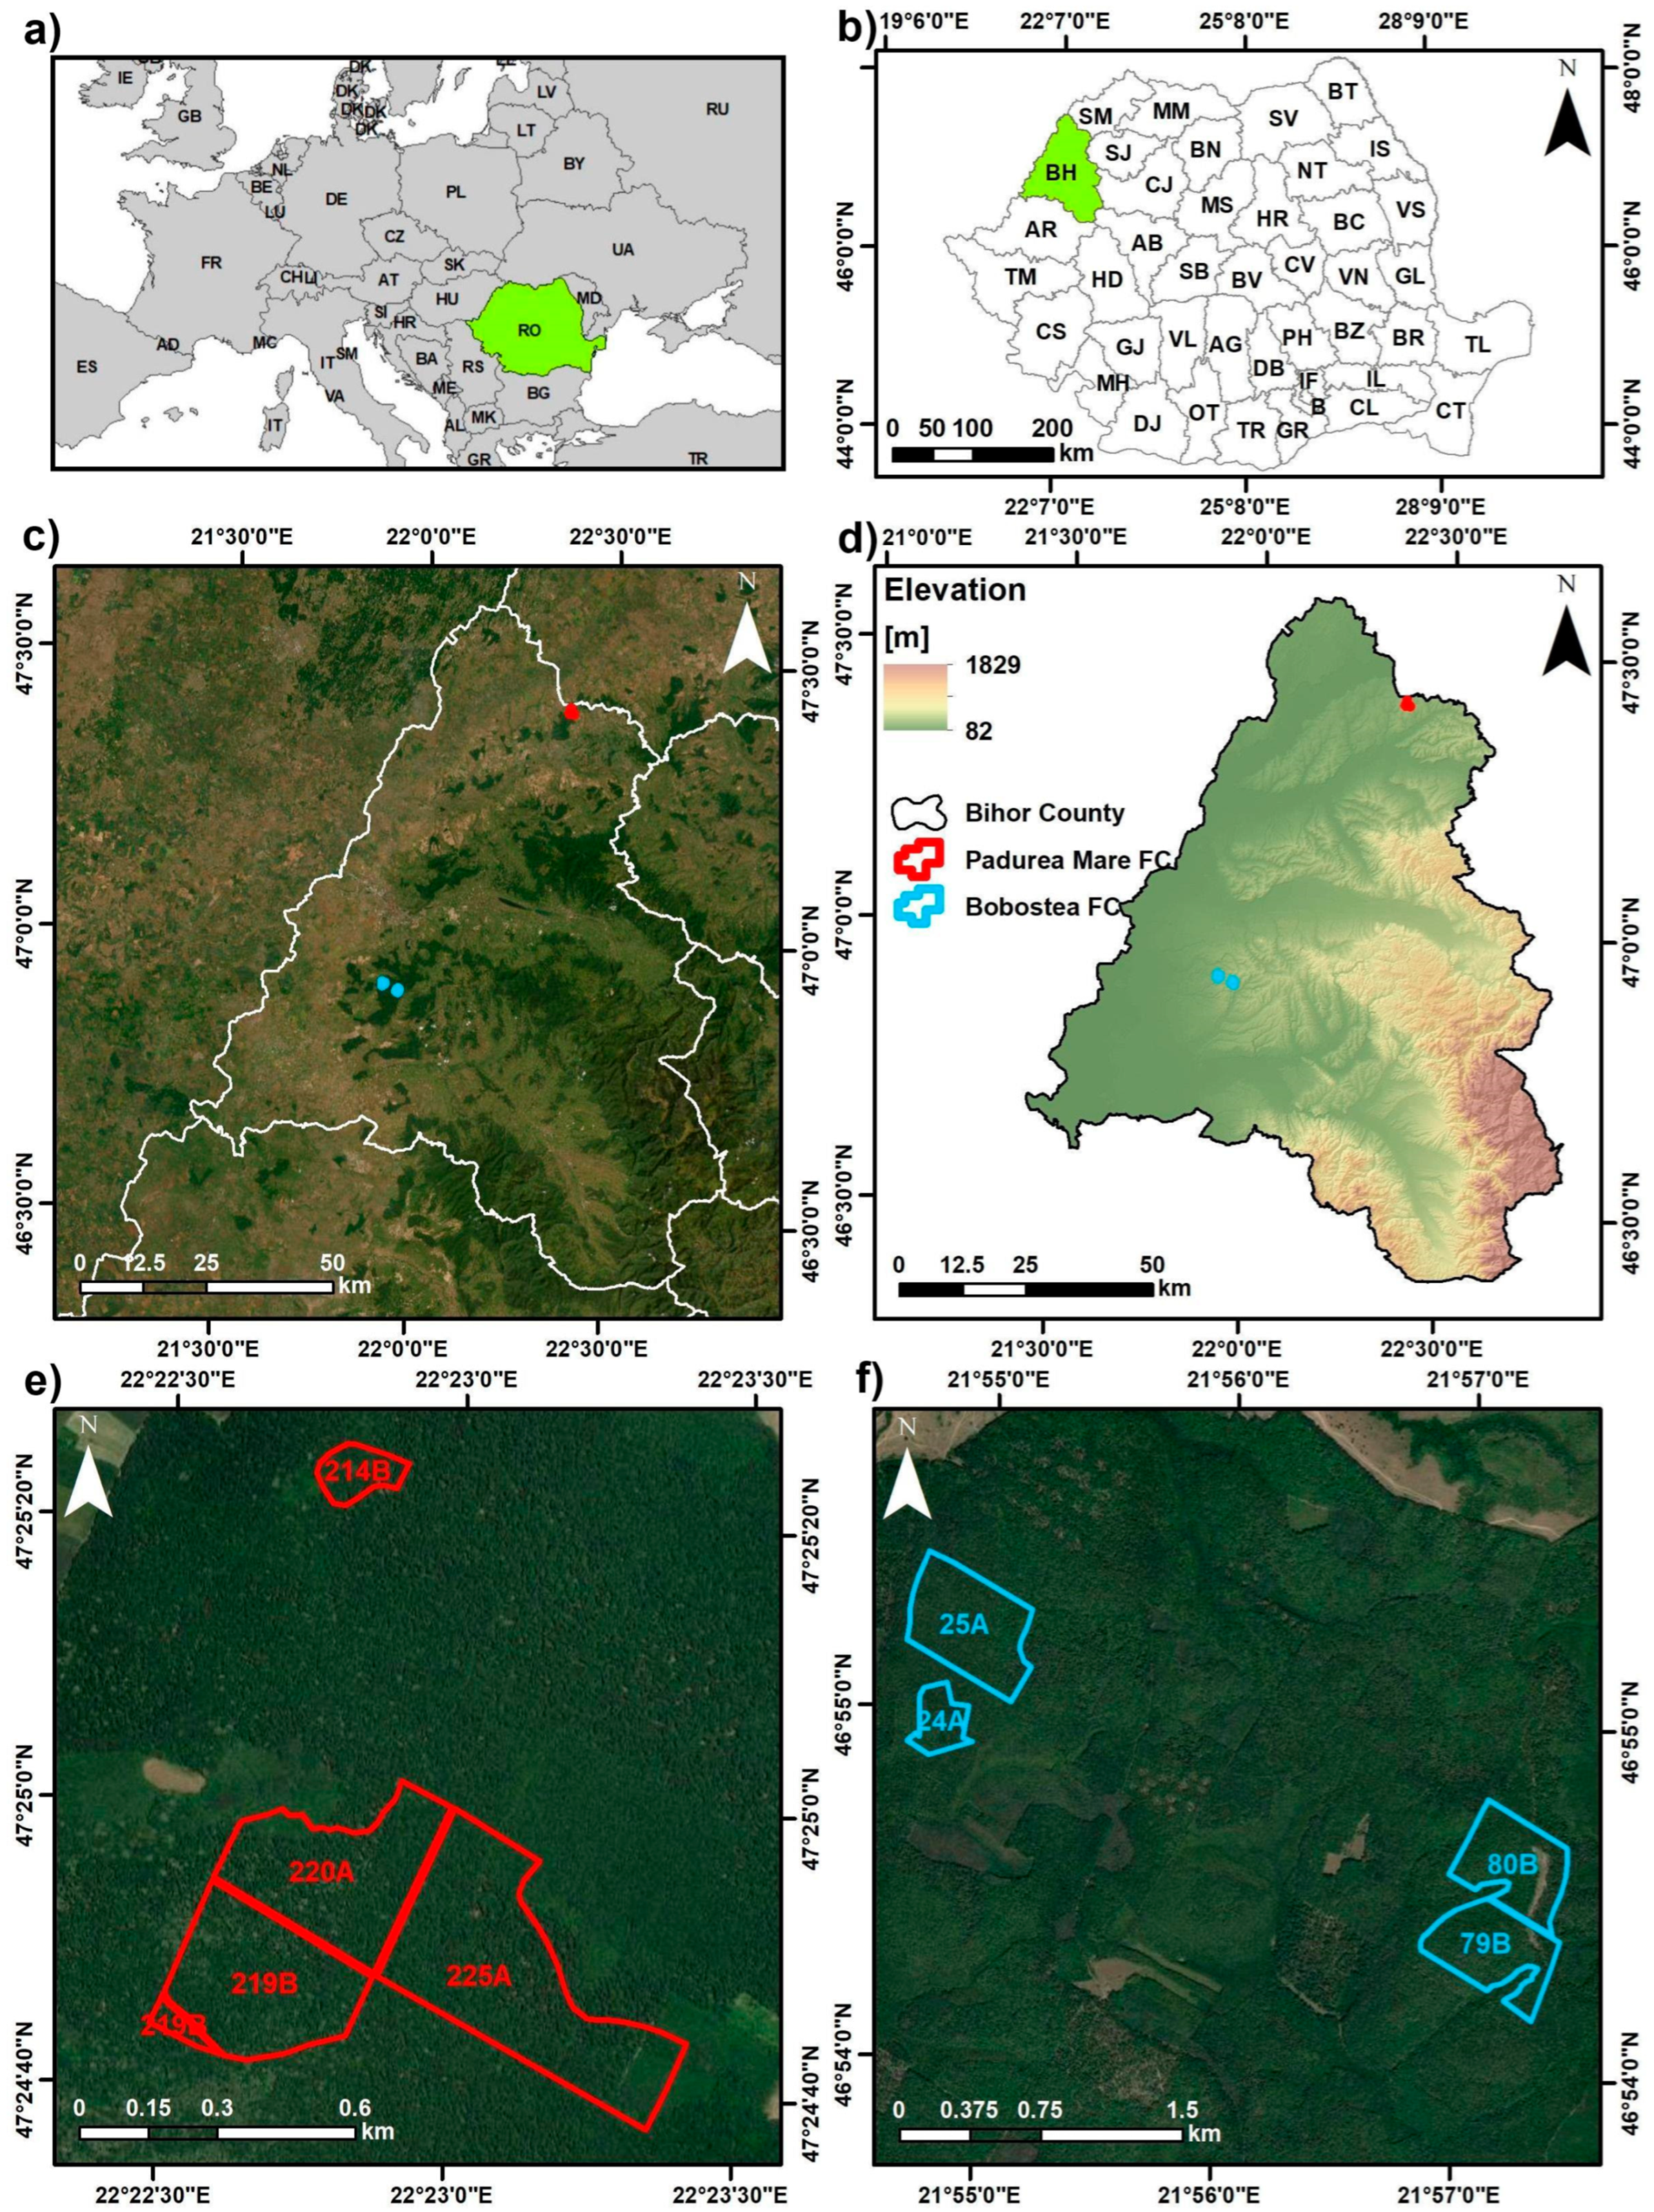
The study was conducted in Bihor County, western Romania, within two privately managed forest compartments (Pădurea Mare and Boboștea), administered by the Sfânta Maria Forest District. Eight Forest Management Units (FMUs) were monitored annually between 2017 and 2021 (
Figure 1).
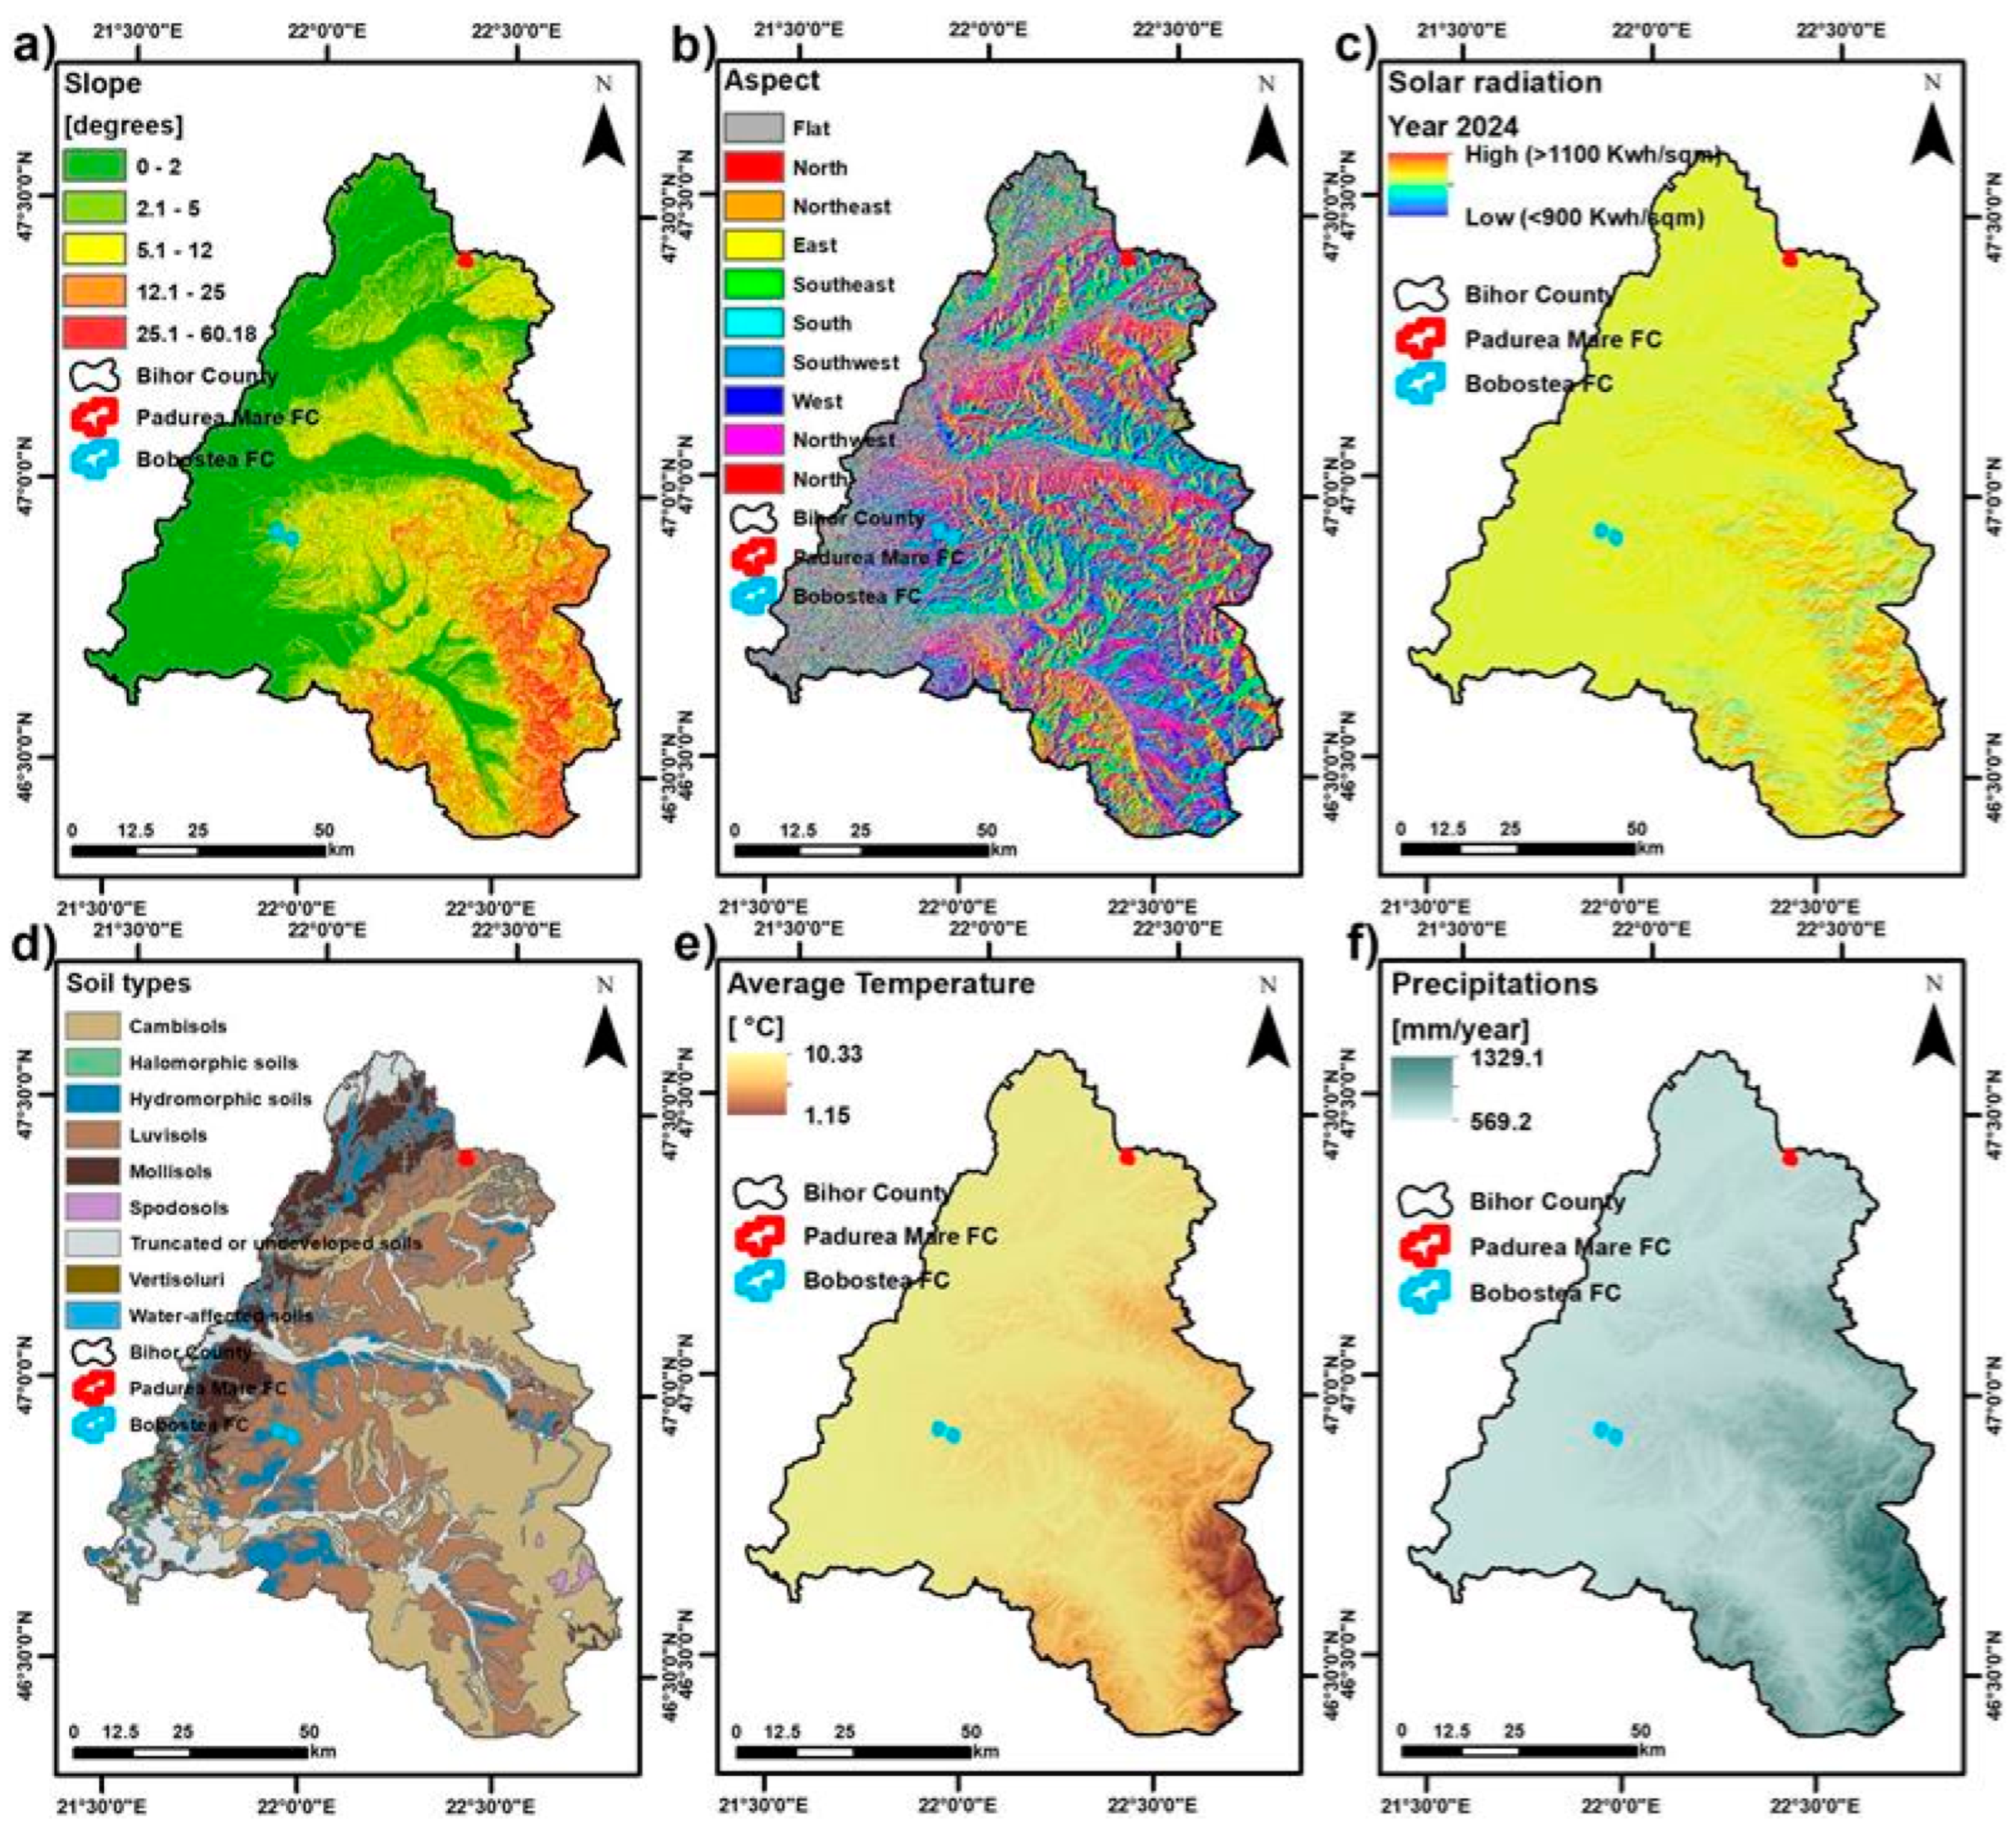
The study sites are situated in the Crișana region, at the western foothills of the Apuseni Mountains, gradually transitioning into the Romanian Western Plain. They occupy low-elevation hills (170–255 m a.s.l.) with gentle slopes (3–8°), predominantly facing south to southwest, conditions that favor high solar exposure and evapotranspiration (details in
Table 1 and
Figure 2). Beyond topography, soil conditions also play a critical role in shaping forest site quality.
Climatic data (2017–2021) obtained from the National Meteorological Service indicate that the study area belongs to the temperate-continental zone of the Criș River basin, with mean annual temperatures of 10.0–10.3 °C and annual precipitation of 600–700 mm, showing moderate interannual variability. These conditions, illustrated in
Figure 2e,f, provide the ecological background against which oak crown health was assessed. To integrate climate with physiographic and pedological variables, the data were processed in GIS to generate spatial layers of temperature and precipitation, alongside slope, aspect, solar radiation, and soil type (
Figure 2).
A GIS-based multi-parameter analysis was applied at the county level to characterize the study sites (
Figure 2). The topographic variables (elevation, slope, aspect) were derived from the Shuttle Radar Topography Mission Digital Elevation Model (SRTM DEM, 30 m resolution), which provides sufficient detail to detect fine-scale terrain variations relevant for microclimate and hydrological behavior [
70]. Geographic Information Systems support the integration of spatially explicit data and are widely used in forest health research [
71,
72]. The edaphic component was based on a digitized soil map at 1:200,000 scale, developed by the Research Institute for Soil Science and Agrochemistry (ICPA) under the Romanian Soil Classification System (SRCS–1980). Climatic and ecological datasets were further integrated to provide a spatially explicit framework for assessing forest crown condition. The spatial synthesis included six environmental layers (slope, aspect, solar radiation, soil type, temperature, and precipitation) (
Figure 2). Slope distribution was derived from the SRTM DEM (30 m resolution) and showed that the study plots are located within areas with slopes of 0–8°. This layer was used to characterize local terrain gradients and to assess potential influences on site hydrology and crown development.
Aspect orientation was derived from the Shuttle Radar Topography Mission (SRTM) Digital Elevation Model at 30 m spatial resolution using GIS terrain analysis (
Figure 2b). The study plots were predominantly located on south- and southwest-facing slopes, which were recorded as site exposure characteristics. Solar radiation was estimated as annual incoming solar energy (kWh/m
2) for the year 2024 using GIS-based modeling (
Figure 2c). The study plots are located within areas exceeding 1100 kWh/m
2, representing the higher radiation zones of western Bihor County. The soil layer was obtained from the digitized soil map of Romania at a scale of 1:200,000, developed by the Research Institute for Soil Science and Agrochemistry (ICPA) under the Romanian Soil Classification System (SRCS–1980) (
Figure 2d). Within the study plots, the dominant soil classes are Luvisols and Cambisols, with hydromorphic and vertic soils present in surrounding areas. In addition to geomorphological and edaphic factors, the climate of Bihor County further defines the ecological setting of the study area.
Climatic data were obtained from the national meteorological database and processed in GIS to generate average annual temperature and precipitation layers (
Figure 2e,f). Climatic data for the study area were obtained from the national meteorological database and processed in GIS to generate spatial layers of mean annual temperature and precipitation (
Figure 2e,f). These values are representative of the temperate-continental climate of Bihor County and provide the ecological background against which oak crown health was assessed. These physiographic, pedological, and climatic components were integrated into a single analytical framework using GIS. The study sites receive between 600 and 700 mm of precipitation annually, with a west-to-east gradient across Bihor County.
Table 1 summarizes the geographical and topographical characteristics of the eight Forest Management Units (FMUs) included in the study, distributed between the Boboștea and Pădurea Mare compartments under the administration of the Sfânta Maria Forest District. For each FMU, geographical coordinates, elevation range, surface area, slope, and dominant aspect were recorded to document site conditions. The Boboștea Forest Compartment (FC) includes four FMUs (24A, 25A, 79B, and 80B), located near the town of Marghita. These units are characterized by slopes of 4–8° and areas ranging from 7.8 to 31.7 ha. Elevations vary between 185 and 255 m, with dominant aspects oriented towards the south, southeast, and west. The Pădurea Mare Forest Compartment (FC) includes four FMUs (214B, 219B, 220A, and 225A), located west of Oradea. These units are situated on relatively flat terrain with slopes of about 3°. Their surface areas range from 1.7 ha (214B) to 17.8 ha (225A), with elevations between 170 and 210 m.
The dominant aspects are southwestern and western.
Table 2 presents the structural characteristics of the studied stands. Stand ages range from 55 to 80 years, with average tree heights between 20 and 32 m. All plots fall into high productivity classes. Species composition in the studied stands is dominated by oaks (
Quercus robur L.—pedunculated oak,
Quercus petraea (Matt.) Liebl.—sessile oak,
Quercus cerris L.—Turkey oak, and
Quercus frainetto Ten.—Hungarian oak), which represent 60–80% of the basal area in most FMUs. Secondary species include
Carpinus betulus and
Tilia cordata, together accounting for up to 30% of the mixtures. Stand density, expressed as the stocking index, ranged from 0.7 to 0.9 across all FMUs, indicating uniformly high values.
The GIS analysis integrated physiographic, pedological, and climatic data layers to characterize the environmental context of the study sites. These included slope, aspect, solar radiation, soil type, average annual temperature, and annual precipitation. This approach provided the spatial framework for linking environmental variables with field-based crown condition assessments.
In summary, the combined topographic, climatic, and edaphic framework highlights the ecological pressures that shape forest dynamics in the study area. This setting explains the high vulnerability of oak stands to hydric and thermal stress, providing the foundation for subsequent assessments of crown condition.
To ensure the reliability of climatic inputs, data recorded by the local PCE-FWS 20N weather station were systematically calibrated and validated against the Oradea Meteorological Station (WMO/Meteostat code: 15080; ICAO: LROD), located in Oradea, Bihor County, Romania (47.05° N, 21.9333° E; elevation 135 m), which is part of the national reference network. Comparative analysis of 2017–2021 records showed very strong correlations —most variables (Pearson r > 0.90), low RMSE values, and minimal systematic bias, with only minor corrections applied through linear or scaling adjustments where necessary. These results confirm the robustness and representativeness of local climatic measurements, which were subsequently integrated into the multi-annual means used in this study (see
Supplementary Table S1).
2.2. Methodology for Climate and Forest Health Assessment
A stepwise methodological framework was implemented to evaluate oak forest condition under climatic and biotic pressures. The approach combined the analysis of climatic parameters, the assessment of crown condition in sample plots, and the monitoring of key defoliating insects. Climatic data (2017–2021) were integrated with standardized field inventories to generate indicators of forest vitality. The following subsections detail the procedures applied in each stage.
2.2.1. Gathering and Analysis of Climatic Data
At the international level, increasing emphasis is placed on the use of climatic indices that better capture the bioclimatic conditions driving forest vulnerability. In this study, two indices were applied: the Forest Aridity Index (FAI), developed by Führer (2011) [
73], and the Ellenberg Quotient (EQ), originally proposed by Ellenberg (1988) and later cited by Nedealcov (2019) [
74].
Monthly precipitation and temperature data (2017–2021) were recorded using a PCE-FWS 20N weather station and validated against data from the Oradea Meteorological Station, ensuring the reliability of local measurements. From these records, FAI was computed following the formula of Führer et al. (2011) [
73], quantifying forest aridity as the balance between precipitation and temperature.
Forest Aridity Index (FAI) formula [
73]:
where TVII and TVIII are the average temperatures of July–August (°C) and PV, PVI, PVII, and PVIII (mm) are the monthly of May-August precipitation amounts.
Führer et al. [
73] established for Central Europe, favorable FAI values for different species: Beech < 4.75; oak with hornbeam 4.75–6.00; Gorun 6.00–7.25; Steppe forests > 7.25.
The Ellenberg Quotient (EQ) was also derived to characterize site suitability for different forest types. EQ values below 20 indicate conditions highly favorable for pure beech forests, values of 20–30 correspond to mixed oak–hornbeam forests, 30–40 to mesophilic oak forests, and values above 40 to dry or arid oak stands [
73,
74].
Ellenberg Quotient (EQ) formula [
73,
74]:
where Tw represents the temperature of the warmest month of the year and P represents annual precipitation.
2.2.2. Inventory and Evaluation of Tree Crowns
Field data collection involved standardized assessments of tree crown condition, focusing on six key morphological and vitality indicators: crown size, crown shape, presence of epicormic shoots, general vegetation status, defoliation percentage, and the number of dead thick and thin branches. To evaluate forest decline and crown dieback phenomena in
Quercus-dominated stands, circular sample plots (radius 12.62 m; area 500 m
2) were established within each of the eight subplots. All trees within these plots were numbered and inventoried, recording species identity and diameter at breast height (DBH). The evaluation followed the methodology of Șimonca et al. (2017) [
75].
The scoring system used in canopy assessment (
Table 3) was adapted from Șimonca et al. (2017) [
75] and designed to capture progressive states of crown condition. Lower scores correspond to structural imbalance, reduced crown size, or physiological stress, while higher scores reflect balanced architecture, wide crown expansion, and vigorous vegetation. Intermediate values were introduced to account for transitional conditions, thereby allowing a more nuanced quantification of crown vitality.
The scoring system (
Table 3), adapted from Șimonca et al. (2017) [
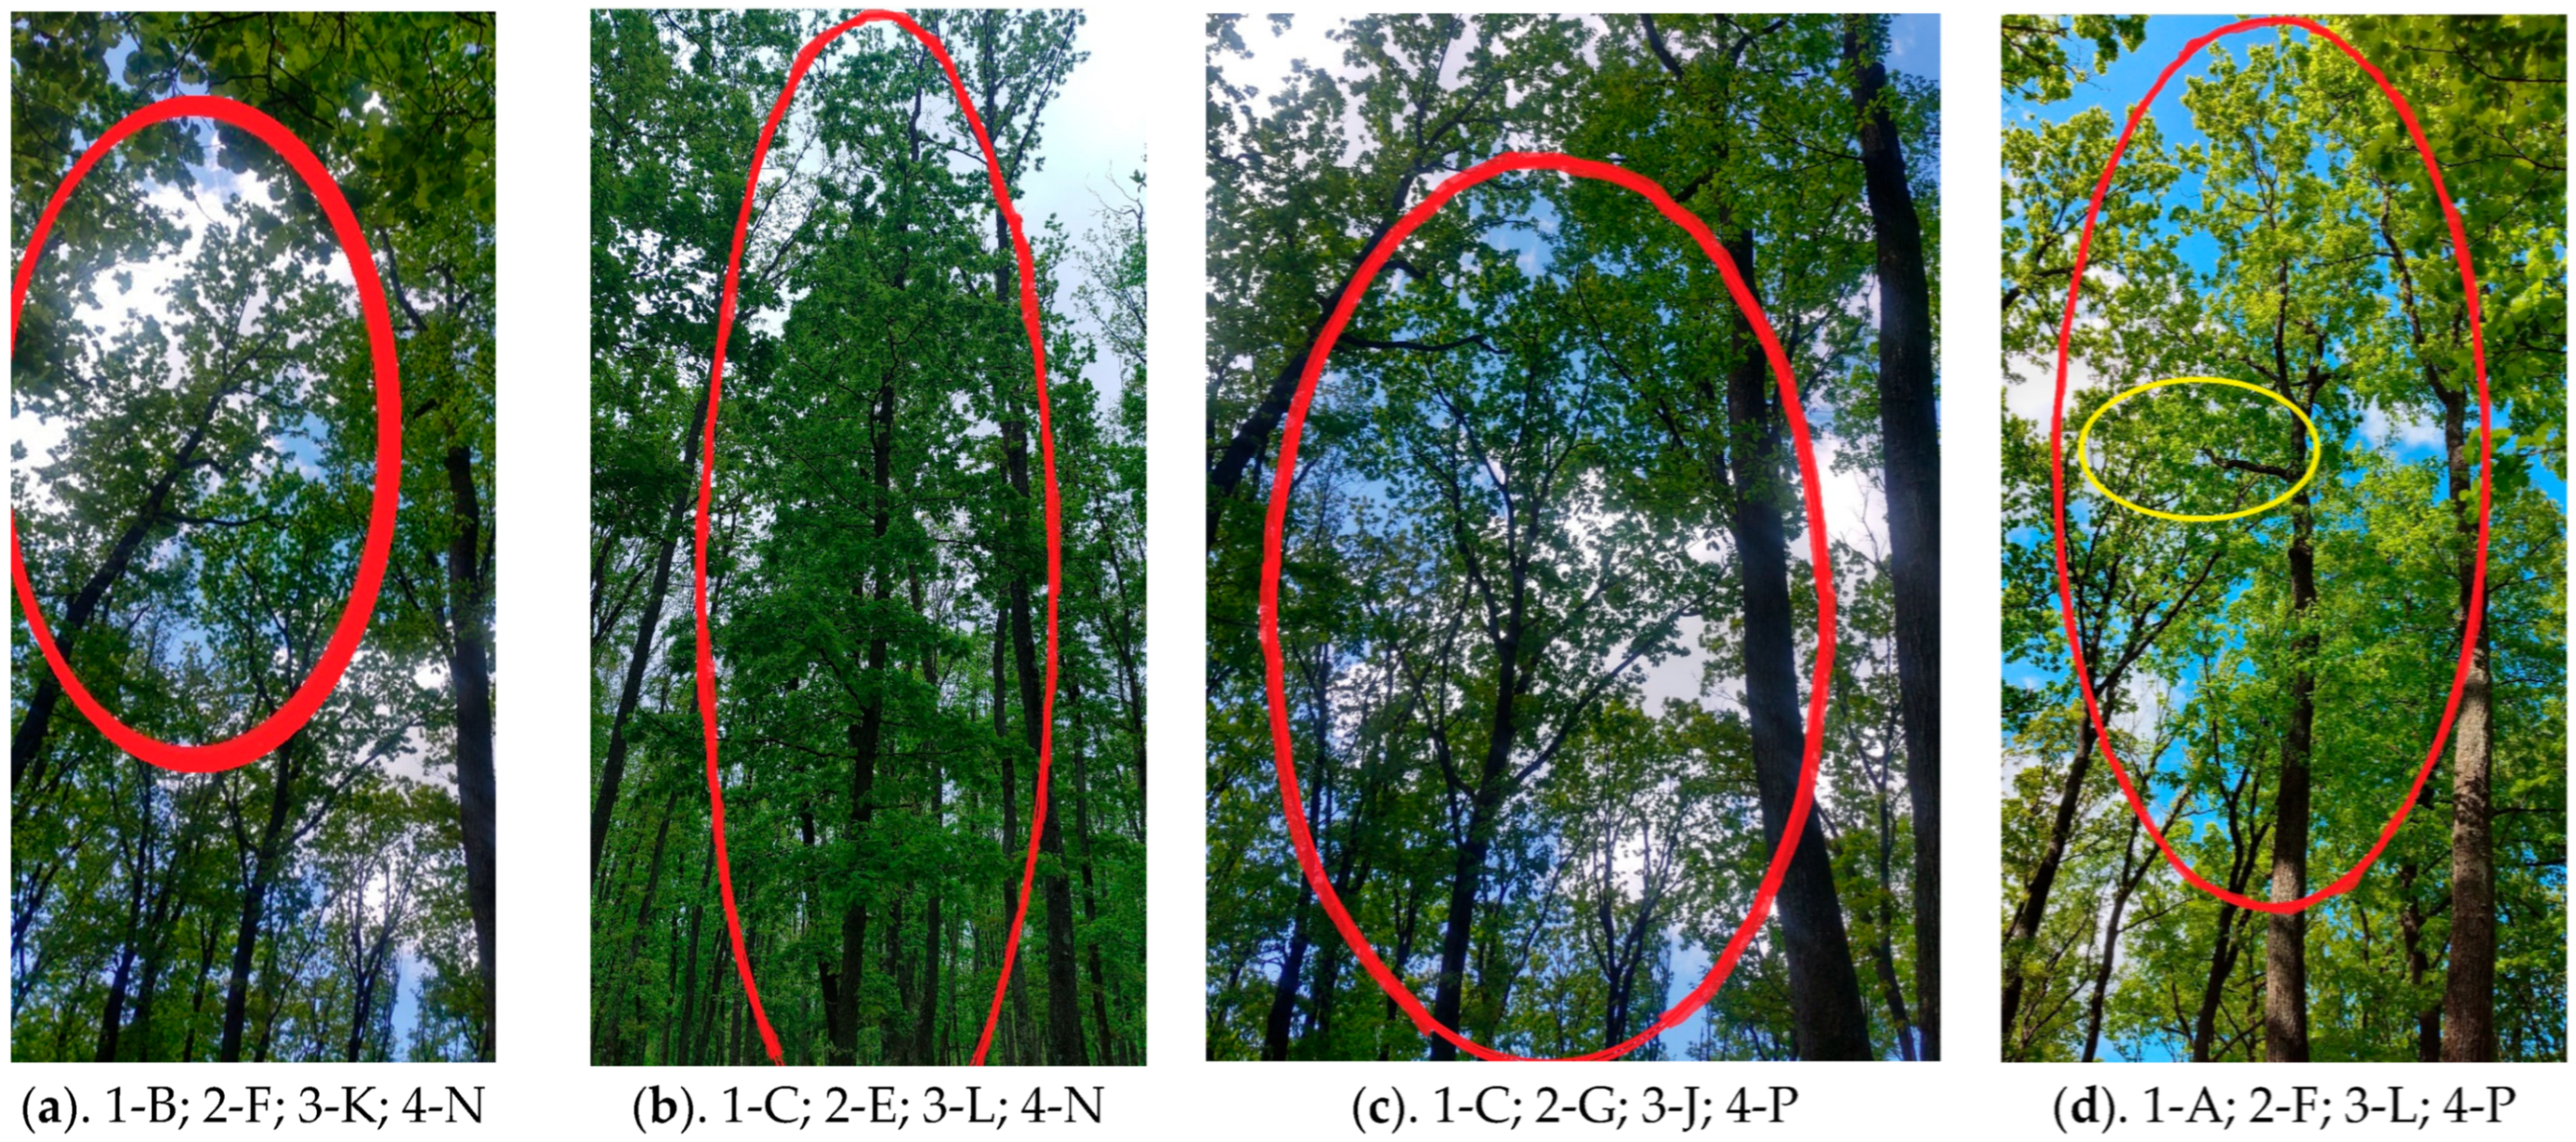
75], was designed to capture progressive states of crown condition, ranging from structural imbalance and physiological stress (low scores) to balanced architecture and vigorous vitality (high scores). Intermediate values were included to reflect transitional situations, allowing for a more nuanced assessment of crown status. To reduce subjectivity and ensure replicability, the criteria were explicitly defined and illustrated with representative examples (
Figure 3). This framework enables the conversion of qualitative field observations into semi-quantitative measures, ensuring consistency across plots and years and providing a robust basis for the subsequent calculation of crown vitality indices.
The scores assigned to each analyzed parameter (
Table 3) enabled the transformation of qualitative data observations into quantitative data, ensuring comparability between trees, FMUs, and years, and providing the basis for calculating the Gu, GV, and Gdev indices as well as the synthetic score (Syn), a process illustrated through the examples in
Figure 3:
- (a)
The first tree displays an asymmetrical crown (1 point) of moderate size (2 points), indicating a potential growth imbalance likely caused by competition or environmental stress. Its vegetative condition is moderate (2 points), suggesting stable but not vigorous physiological activity. Epicormic shoots are absent (0 points), reflecting the lack of visible regenerative stress responses (Total 5 points).
- (b)
The second tree is characterized by a symmetrical (2 points) yet narrow crown (1 point), which may result from competitive pressure or suboptimal site conditions. Despite the reduced crown expansion, the tree maintains an active vegetative state (3 points), indicative of adequate photosynthetic capacity. No epicormic shoots were observed (0 points), suggesting normal development without compensatory growth (Total 6 points).
- (c)
The third tree presents a symmetrical (2 points) and wide crown (3 points), commonly associated with healthy spatial development. Nevertheless, the vegetation appears wilted (1 point), signaling possible water stress or the onset of physiological decline. The presence of epicormic shoots (2 points) reflects a compensatory response to crown dieback or other long-term stress factors (Total 8 points).
- (d)
The fourth tree exhibits a strongly asymmetrical crown (0.5 points) of moderate size (2 points), reflecting structural imbalance likely caused by partial dieback, past disturbance, or phototropic growth. Despite this, the tree maintains an active vegetative state (3 points), demonstrating ongoing metabolic function. The occurrence of epicormic shoots (
Figure 3, the yellow line) (2 points) highlights the activation of stress-related regenerative mechanisms (Total 7.5 points).
The main indices used in the analysis include the following:
Crown Dieback Index (Gu):
This index reflects the proportion of trees exhibiting moderate to severe crown dieback symptoms, serving as an indicator of declining vitality at the upper crown level,
where
n3 = number of trees with 26–60% defoliation (moderately damaged);
n4 = number of trees with >60% defoliation (severely damaged);
N = total number of sampled trees.
This index quantifies the overall extent of crown damage within a stand, regardless of severity, where
n1 = trees with 0–10% defoliation (very lightly damaged);
n2 = 11–25% defoliation (lightly damaged);
n3 = 26–60% defoliation (moderately damaged);
n4 = >60% defoliation (severely damaged);
N = total number of sampled trees.
To further refine the evaluation of stand vitality, a composite indicator Devitalization Index (Gdev) was calculated. This index represents a weighted average of the Crown Dieback Index (Gu) and the Damage Index (Gv), offering a more integrated perspective on structural degradation and canopy stress. The formula used is
where
Gu = Crown Dieback Index;
Gv = Damage Index;
N = total number of assessed trees.
In addition to stand-level indicators, the vitality of individual trees was evaluated using the classification system proposed by Roloff (1990). This method integrates several factors, including crown architecture especially the condition of third-order branches in the upper crown current vegetative activity, and the degree of defoliation observed (see
Figure 3).
To quantify individual tree vitality, a synthetic score (Syn) was calculated using the following formula:
where
Def = observed defoliation percentage;
Wit = vitality score assigned based on Roloff’s classification (as illustrated in the corresponding table and figure);
N = number of trees evaluated.
2.2.3. Inventory and Assessment of Pests Associated with Oak Decline
Biotic stress was assessed by monitoring the main insect defoliators associated with oak decline, namely
Lymantria dispar (gypsy moth),
Tortrix viridana (green oak leaf roller), and several
Geometridae species (
Figure 4) (e.g.,
Erannis defoliaria,
Operophtera brumata). These taxa were selected based on their historical importance, frequency of occurrence in Romanian oak forests, and documented ability to trigger large-scale defoliation events. The objective was to provide early-warning indicators of pest outbreaks through stage-specific monitoring protocols, applied in accordance with national forest protection standards.
The survey was carried out in all eight Forest Management Units (FMUs), using the same circular plots (500 m2) established for crown assessments. The number of trees and samples was proportionally distributed across FMUs to ensure representativeness and replicability.
Lymantria dispar—populations were monitored in the egg stage, suitable for early detection of future larval densities. In each FMU, a diagonal transect was established and 15 trees were inspected (120 in total), focusing on the lower trunk and accessible branches. No egg masses or larvae were detected between 2017 and 2021, indicating temporary population collapse; thus, the species was excluded from subsequent analyses.
Tortrix viridana—in each FMU, three sample trees were selected (24 in total). From each tree, six branches (two from each crown layer: lower, middle, upper) were collected. Buds were counted, and egg masses identified using a binocular microscope, enabling an estimate of potential defoliation pressure for the following growing season.
Geometridae spp.—in each FMU, three soil samples of 1 m2 were collected under randomly chosen oaks at 10 cm depth (24 samples in total). Pupae were extracted, sorted, and identified to species level, with densities compared against threshold values used in national forecasting protocols.
Adult monitoring—in each FMU, five trees (40 in total; diameter 21–36 cm), including three oaks (
Quercus spp.) and two associated broadleaves (
Carpinus betulus,
Tilia cordata), were equipped with adhesive bands (
Figure 4a,b). Captured females were preserved in 70% ethanol and examined microscopically to assess reproductive maturity, while males were discarded.
By integrating multiple phenological stages (egg, pupa, adult), stratified sampling across crown layers, and replication at both tree and soil level, the monitoring design ensured comprehensive spatial coverage of all FMUs and high methodological replicability. This approach strengthened the robustness of defoliation risk assessment and provided a reliable framework for interpreting biotic stress within oak decline dynamics.
The detailed sampling framework for monitoring insect defoliators is presented in
Supplementary Table S2, which summarizes the spatial distribution of effort across the eight Forest Management Units (FMUs) and the methodological approach applied for each taxon. Monitoring targeted the main biotic stressors associated with oak decline (
Lymantria dispar,
Tortrix viridana, and
Geometridae spp.), using stage-specific protocols (egg, pupa, and adult) to ensure early detection and risk assessment. Surveys were performed within the same circular plots used for crown evaluation (500 m
2), thereby enabling direct comparability between biotic stress indicators and structural/vitality metrics. The combination of tree inspections, branch sampling, soil surveys, and sticky-band trapping ensured full spatial coverage of the study area and high methodological replicability, strengthening the robustness of the pest monitoring design.
2.3. Data Analysis
All climatic and forest structural data collected for the 2017–2021 period were processed in Microsoft Excel and analyzed using R (version 4.2.2) and SPSS (version 27). Climatic indicators (temperature, precipitation, wind speed, and frequency of weather phenomena) were examined through descriptive statistics, multiannual averages, and interannual anomaly detection, while crown morphology parameters (crown size, crown shape, epicormic shoots) and vitality indicators (vegetation state, dead thick and thin branches, defoliation percentage) were evaluated through comparative trend analysis across Forest Management Units (FMUs). Defoliation indices (Gu, Gv, Gdev) were calculated and used to assess canopy structure and vertical imbalance. Correlation analyses (Pearson’s r) were applied to identify relationships between climatic drivers (precipitation totals, temperature anomalies, Forest Aridity Index, Ecological Quality Index) and structural indicators (defoliation, epicormic activity, crown decline), while analysis of variance (ANOVA), with Tukey HSD post hoc tests, was employed to test significant differences among FMUs. Insect-induced defoliation (Geometridae and Tortrix viridana) was analyzed separately and integrated into the synthetic damage index, together with climatic and structural parameters, to classify ecological risk. Statistical significance was set at p < 0.05 for all tests, and results were synthesized to highlight interannual dynamics, spatial variability, and ecological degradation pathways.
2.4. Justification of Indices and Ethical Considerations
The indices applied in this study (FAI, EQ, Gu, Gv, Gdev, Syn, crown morphology metrics, epicormic shoots, and Roloff vitality classes) were chosen for their established role in Central and Eastern European Forest monitoring, capturing both structural (defoliation, crown architecture) and functional (vitality, stress response) aspects of forest health. Their use ensures methodological consistency, comparability with pan-European datasets, and integration into international frameworks such as Forest Europe (MCPFE). Fieldwork was conducted in compliance with the Romanian Forest Code (Law 46/2008, republished), regulations on mandatory forest management plans (OM 766/2018), and the criteria and indicators for Sustainable Forest Management (SFM) adopted nationally and aligned with PEFC/FSC certification standards. Data collection was strictly observational and non-invasive, respecting ecological integrity and sustainability principles. This framework guarantees both scientific rigor and adherence to ethical standards in applied forest research.
3. Results
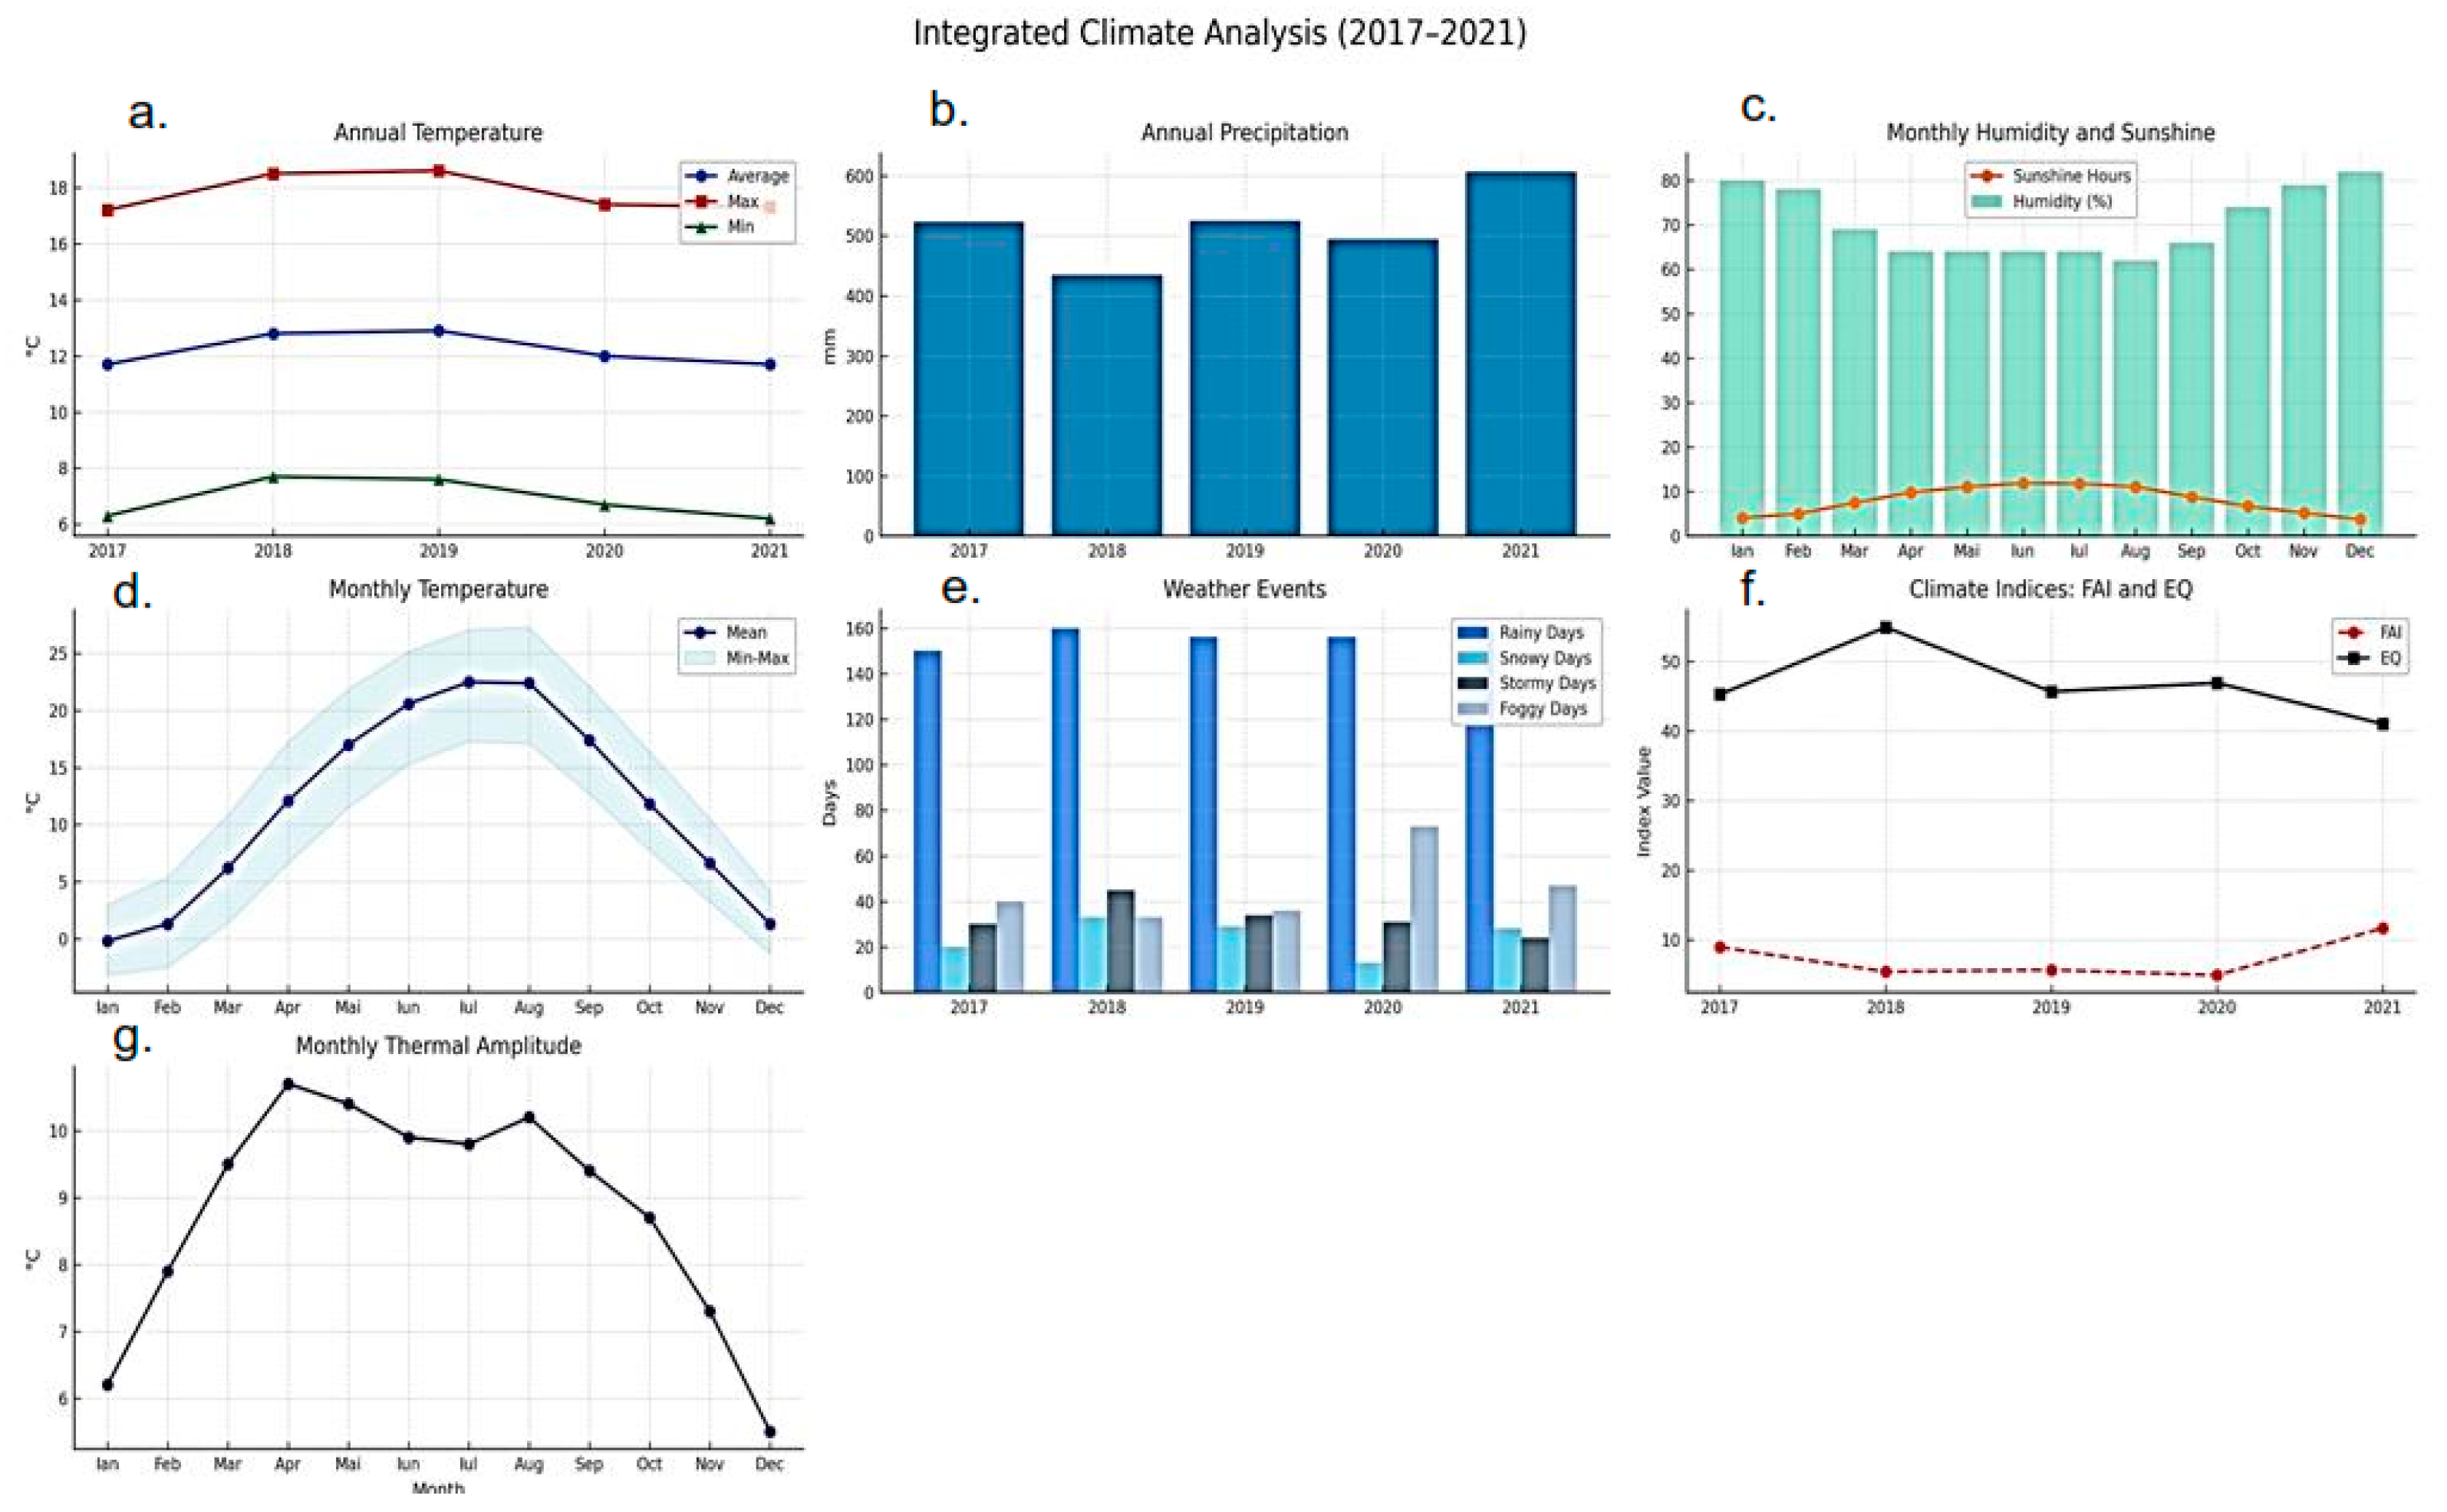
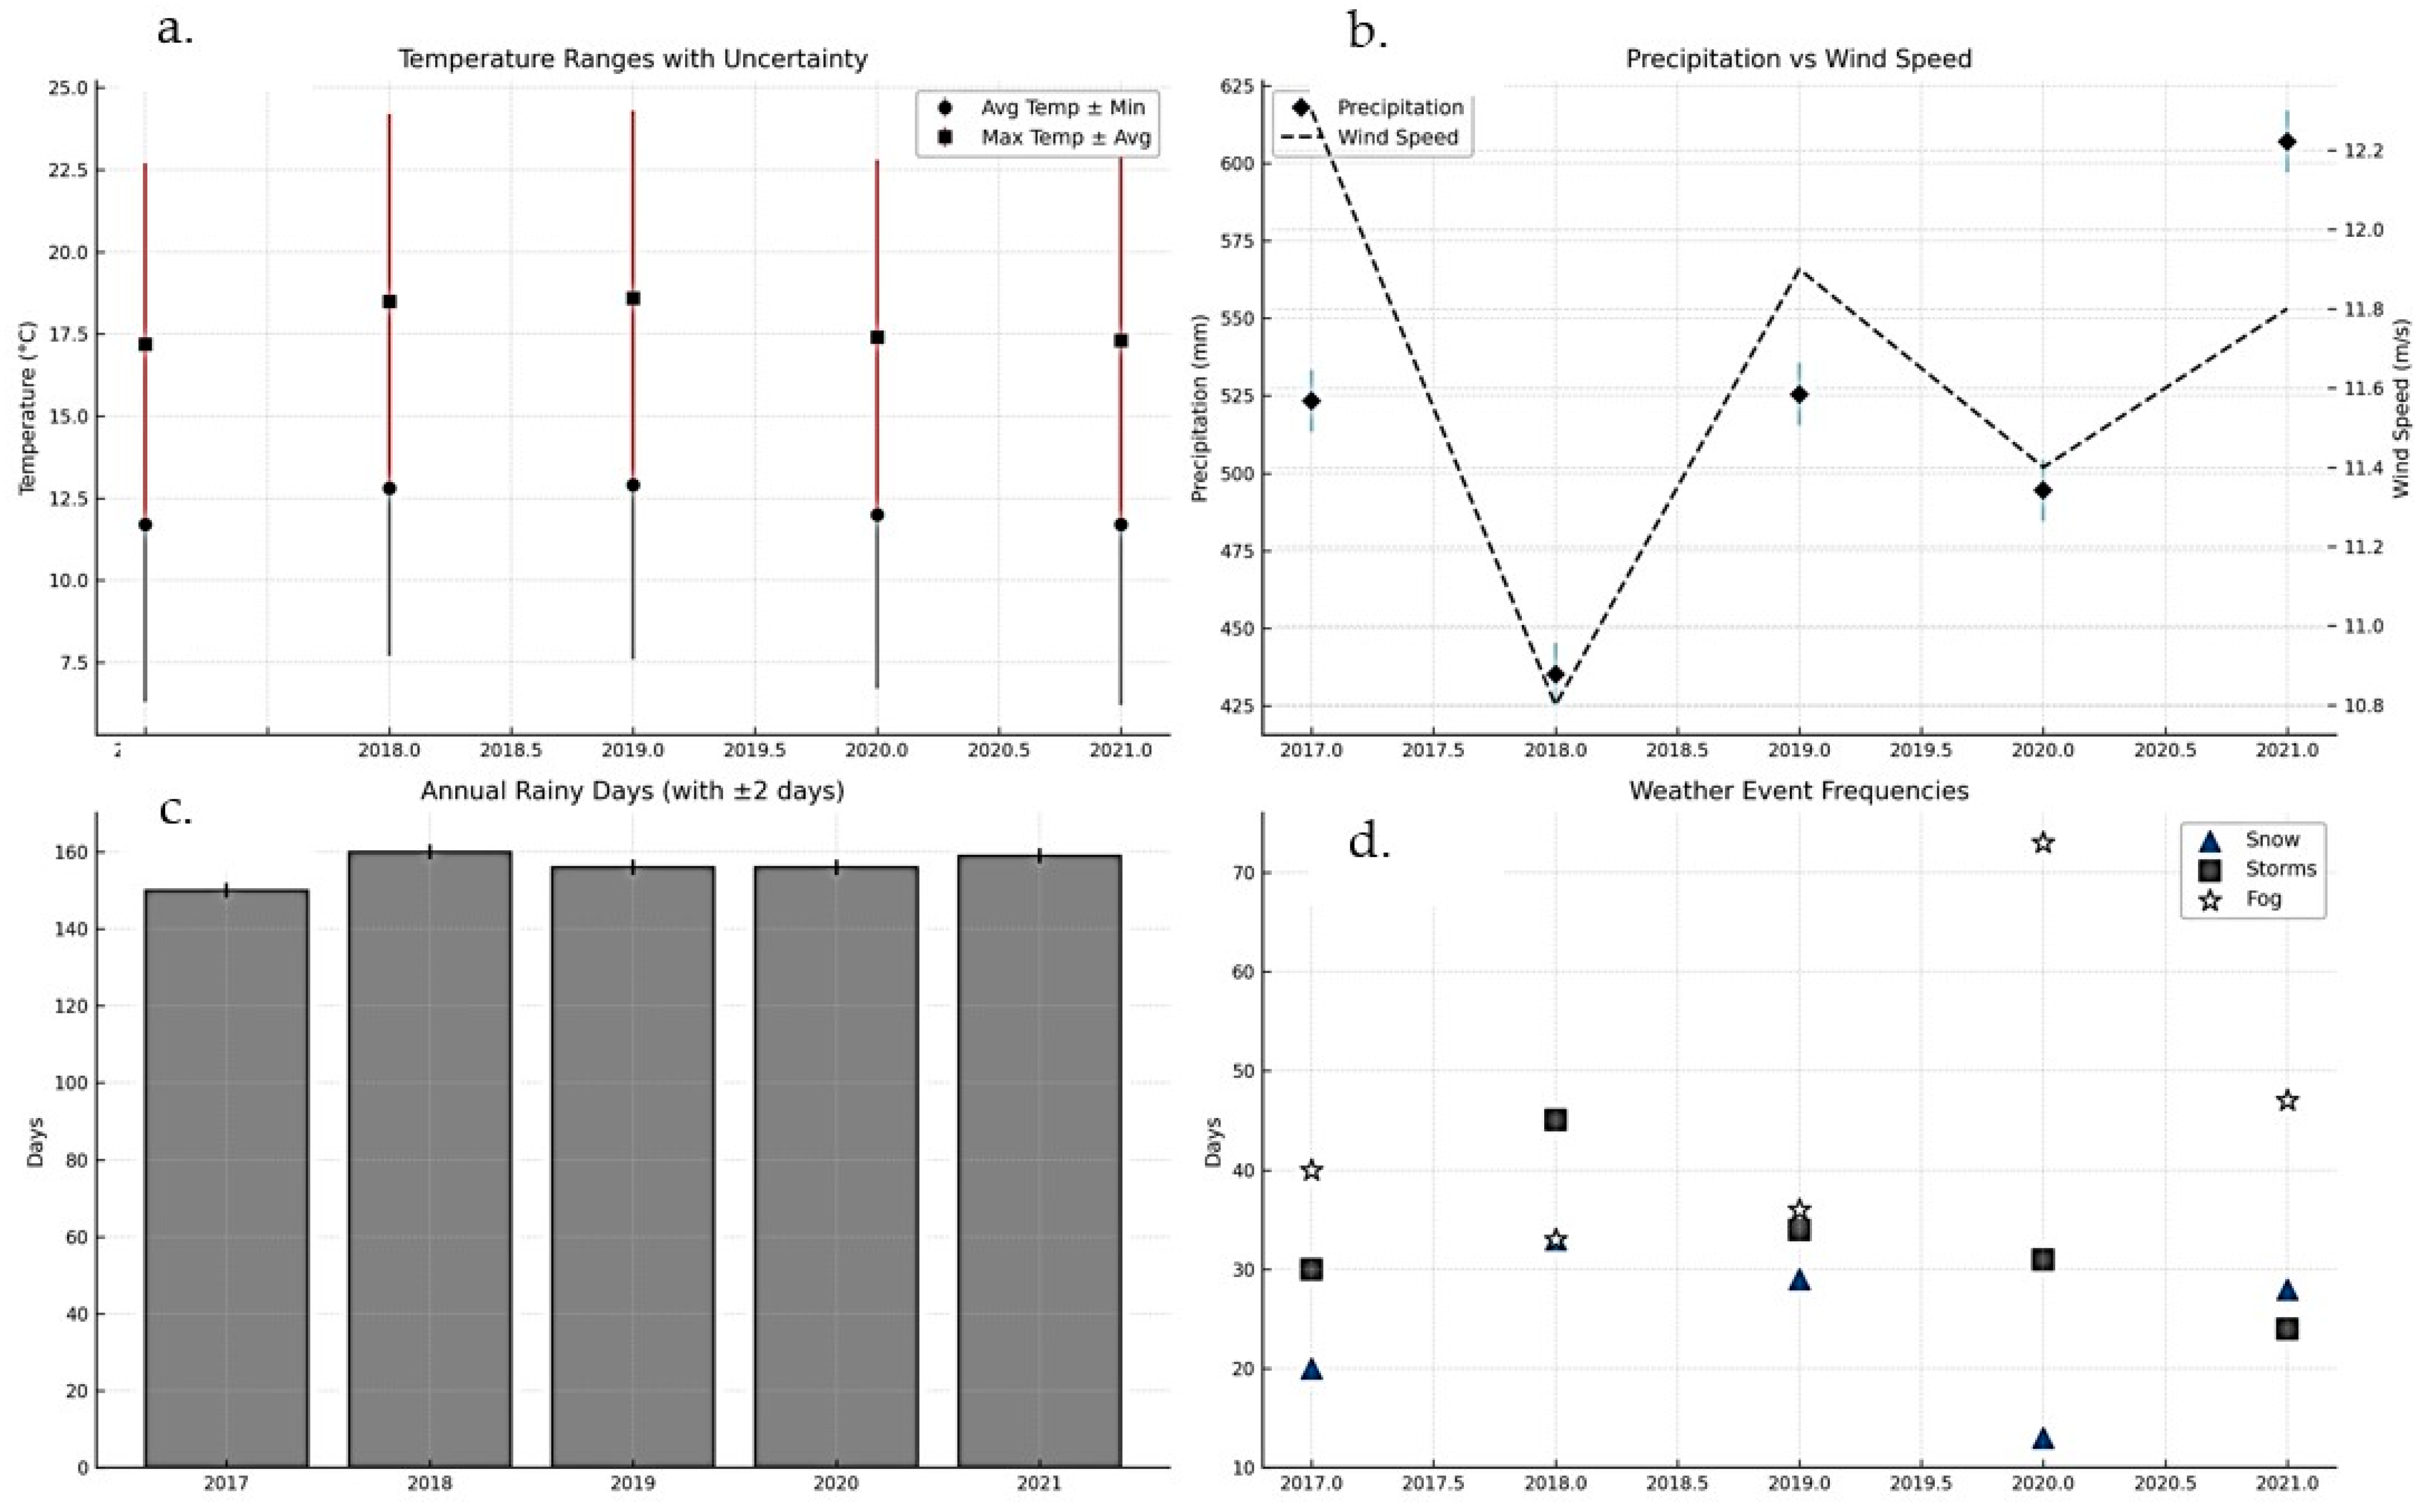
In terms of weather phenomena, rainy days remained stable (~156/year), while snow, thunderstorms, and fog showed marked variability. Snowfall ranged between 13 days (2020) and 33 days (2018), thunderstorms declined from 45 days (2018) to 24 (2021), and fog days increased sharply, peaking at 73 in 2020. These shifts underline the sensitivity of cold-season and convective processes to small climatic fluctuations, with direct implications for local hydrology, microclimate, and forest stress dynamics.
3.1. Multiannual Climatic Variability, Atmospheric Drivers, and Ecological Implications, Including Climatic Indices (FAI and EQ) (2017–2021)
Climatic conditions in the study area during 2017–2021 exhibited a complex interplay of thermal, pluviometric, and atmospheric processes, marked by both stability in certain background parameters and pronounced variability in others. Mean annual air temperatures ranged between 11.7 °C (2021) and 12.9 °C (2019), with a five-year average of 11.6 °C positioning the site within the temperate-continental climate zone (Köppen–Geiger: Dfb/Cfb), typified by warm summers and cold winters. The calculated thermal amplitude of ~22.7 °C, derived from long-term maxima and minima, confirms the strong continentality of the regime. Warm anomalies in 2018–2019, likely favored by blocking events and reduced nocturnal cooling, contrast with 2020–2021, which returned closer to climatological norms. Although interannual differences appear modest, even small shifts in thermal baselines can extend growing seasons, alter pest development cycles, and affect the vitality of forest stands.
Precipitation variability was more pronounced. Annual totals ranged from 435 mm in 2018 a drought year driven by persistent anticyclonic circulation that limited convection and moisture influx to 607 mm in 2021, when an exceptional January event alone delivered over 200 mm, more than one-third of the annual total. The multiannual average of 517 mm underscores the divergence between deficit and surplus years. The intermediate years (2017, 2019, 2020) clustered closer to the mean but displayed strong intra-seasonal contrasts, alternating between wet spells and prolonged dry periods. These fluctuations, often modulated by large-scale oscillations such as the NAO and AO, highlight the climatic sensitivity of the region and the increasing weight of extreme precipitation in shaping hydroclimatic regimes (
Figure 5).
Wind dynamics remained comparatively stable, with mean annual speeds ranging narrowly between 10.8 and 12.3 m/s. This stability suggests that the prevailing synoptic control, dominated by mid-latitude westerlies and local orographic influences, did not undergo substantial shifts during the observation period. The slightly higher values observed in 2018–2019 coincided with more frequent convective activity, suggesting a subtle but noteworthy link between circulation strength and storm initiation. Even within this narrow range, wind plays an important climatic role, regulating evapotranspiration, influencing microclimate balance, and acting as both a dispersal vector and a stressor for vegetation.
Weather phenomena revealed sharper contrasts than either temperature or wind. The number of rainy days remained stable (~156 annually), reflecting the persistence of precipitation frequency despite interannual variations in volume. In contrast, snowfall events fluctuated strongly from 33 days in 2018 to only 13 in 2020 highlighting the sensitivity of winter precipitation phase to small deviations around the freezing threshold. Thunderstorm frequency declined steadily, from 45 days in 2018 to 24 in 2021, suggesting reduced convective activity, possibly linked to lower humidity and altered vertical dynamics. Fog events, however, rose sharply, peaking at 73 days in 2020, nearly double the multiannual mean (~46), pointing to increasingly frequent inversion and stagnation conditions under high-pressure regimes. These multiannual dynamics are illustrated in
Figure 6, which integrates temperature ranges, precipitation wind interactions, rainy-day consistency, and variability in snow, storm, and fog events.
The monthly climatic profile further illustrated the strong seasonality of the region. Temperatures ranged from −0.2 °C in January to 22.5 °C in July, with maxima exceeding 27 °C in midsummer and minima down to −3.2 °C in winter, confirming a pronounced thermal amplitude. Relative humidity peaked in the cold months (up to 82% in December), while sunshine duration reached its maximum in June (11.9 h/day), coinciding with vegetative peak activity and highest evapotranspirative demand. Precipitation showed a bimodal seasonal pattern, with maxima in spring–early summer (April–July) and minima in late winter–early spring (February–March), reflecting the combined influence of frontal systems and convective rainfall.
In addition to the individual climatic parameters, integrative indices such as the Forest Aridity Index (FAI) and the Ecological Quality Index (EQ) provide a more comprehensive view of hydroclimatic variability and its ecological implications. The FAI showed strong interannual fluctuations, with minimum values between 2018 and 2020 indicating elevated atmospheric water demand, reduced soil moisture, and increased stress for shallow-rooted forest stands. In contrast, 2021 registered a peak FAI value of 11.68, reflecting exceptional precipitation anomalies and emphasizing the sensitivity of this index to both annual totals and rainfall distribution. Conversely, the EQ remained relatively stable around ~47 throughout 2017–2021, suggesting that ecosystem buffering mechanisms such as rooting depth, canopy regulation, and adaptive phenology helped mitigate short-term climatic stress. Taken together, these indices complement the climatic variables, with FAI acting as a sensitive early-warning indicator of hydroclimatic stress, and EQ serving as a more stable measure of cumulative ecosystem response (
Figure 5g).
Taken together, these results show that the study area is characterized by modest but ecologically significant warming, highly variable precipitation driven by extremes, stable but climatically relevant wind regimes, and evolving weather phenomena that highlight the sensitivity of the local hydroclimatic system. Such patterns reinforce the need for integrated monitoring and adaptive management, as even subtle shifts in baseline conditions can cascade into profound ecological and agricultural impacts.
The interplay between thermal, pluviometric, and atmospheric dynamics emphasizes not only the variability of the regional hydroclimate but also its ecological significance, underscoring the necessity of integrated climatic monitoring to inform adaptive strategies in forestry, agriculture, and ecosystem management.
3.2. Structural and Vitality Indicators of Forest Stands (2019–2021)
Crown size varied moderately among FMUs, with values ranging from 1.45 to 2.11 (
Figure 7). Stable and relatively high values (≥2.0) were recorded in FMUs 25A, 79B, and 220, indicating resilient canopy structures and favorable ecological conditions. Particularly, FMU 79B maintained a constant crown size of 2.10 across all three years, highlighting structural stability and site consistency. In contrast, FMU 80B registered the sharpest decline (1.68 → 1.45), followed by only partial recovery (1.51), a trajectory that may signal drought stress, disturbance, or density pressure. Conversely, FMU 225A exhibited a clear positive trend (1.61 → 1.79), suggesting enhanced canopy development, while 214B showed a moderate increase (1.95 → 2.09). FMU 219B remained perfectly stable (1.95), pointing to structural equilibrium, while FMU 24A recorded only a slight decrease (1.97 → 1.93). These patterns emphasize both localized stress events and areas of resilience across the units.
Crown shape was generally more stable than crown size, with most FMUs showing consistent values across years (
Figure 7). FMUs 24A, 214B, and 219B maintained almost unchanged trajectories, reflecting structural balance and stable site conditions. Minor oscillations were detected in 25A (1.33 → 1.28 → 1.33), possibly linked to canopy adjustment following regeneration or thinning. Incremental improvements were observed in 220 (1.21 → 1.22) and more prominently in 225A (1.47 → 1.56), pointing to favorable growth conditions or competitive release. FMU 79B maintained stable but relatively low values (1.25), consistent with narrower crown forms. By contrast, 80B showed consistently broader crowns (1.72 → 1.73), likely resulting from spacing conditions or lateral expansion capacity.
Epicormic shoots displayed the highest variability among all attributes (
Figure 7), serving as a sensitive vitality indicator. FMUs 25A and 220 sustained elevated values (≥2.0), likely linked to site conditions promoting epicormic activity. FMU 79B showed a sharp rise (0.90 → 2.00), while 80B nearly doubled its score (0.93 → 1.97), both reflecting strong regenerative responses to canopy stress or disturbance. Similarly, FMU 214B displayed the steepest relative increase (0.42 → 1.63), suggesting either mechanical damage or thinning-induced shoot production. FMU 225A also recorded a pronounced increase (0.80 → 1.89), consistent with compensatory growth. More moderate fluctuations were observed in 24A (1.03 → 1.19) and 219B, which peaked in 2020 (1.95) before a slight decline in 2021 (1.67). These results underline epicormic shoots as a responsive indicator of stress–recovery dynamics.
Vegetation state remained within a narrower interval (1.65–2.14) compared to the other metrics, but with notable differences among FMUs (
Figure 7). Units 24A, 214B, and 225A all declined substantially between 2019 and 2020 before stabilizing, with the sharpest reduction occurring in 214B (2.14 → 1.69). Conversely, FMUs 25A and 220 remained stable, with 25A fluctuating minimally (1.83–1.88) and 220 showing a slight positive trajectory (1.75 → 1.83). FMU 219B also maintained near stability (1.95 → 1.88 → 1.95), suggesting effective ecological balance or management consistency. More modest declines were observed in 79B (2.00 → 1.80) and 80B (1.92 → 1.80), possibly reflecting early stress onset or gradual canopy aging.
The integration of crown size, crown shape, epicormic shoots, and vegetation state (
Figure 7) highlights complementary insights into forest condition. Crown size and shape capture longer-term structural trajectories, while epicormic shoots and vegetation state provide more sensitive indicators of stress and recovery. Together, they reveal a pattern of general stability in most FMUs, punctuated by localized signals of stress (notably in 80B and 214B) and resilience (25A, 220, and 219B), underlining their importance in multi-metric forest health monitoring.
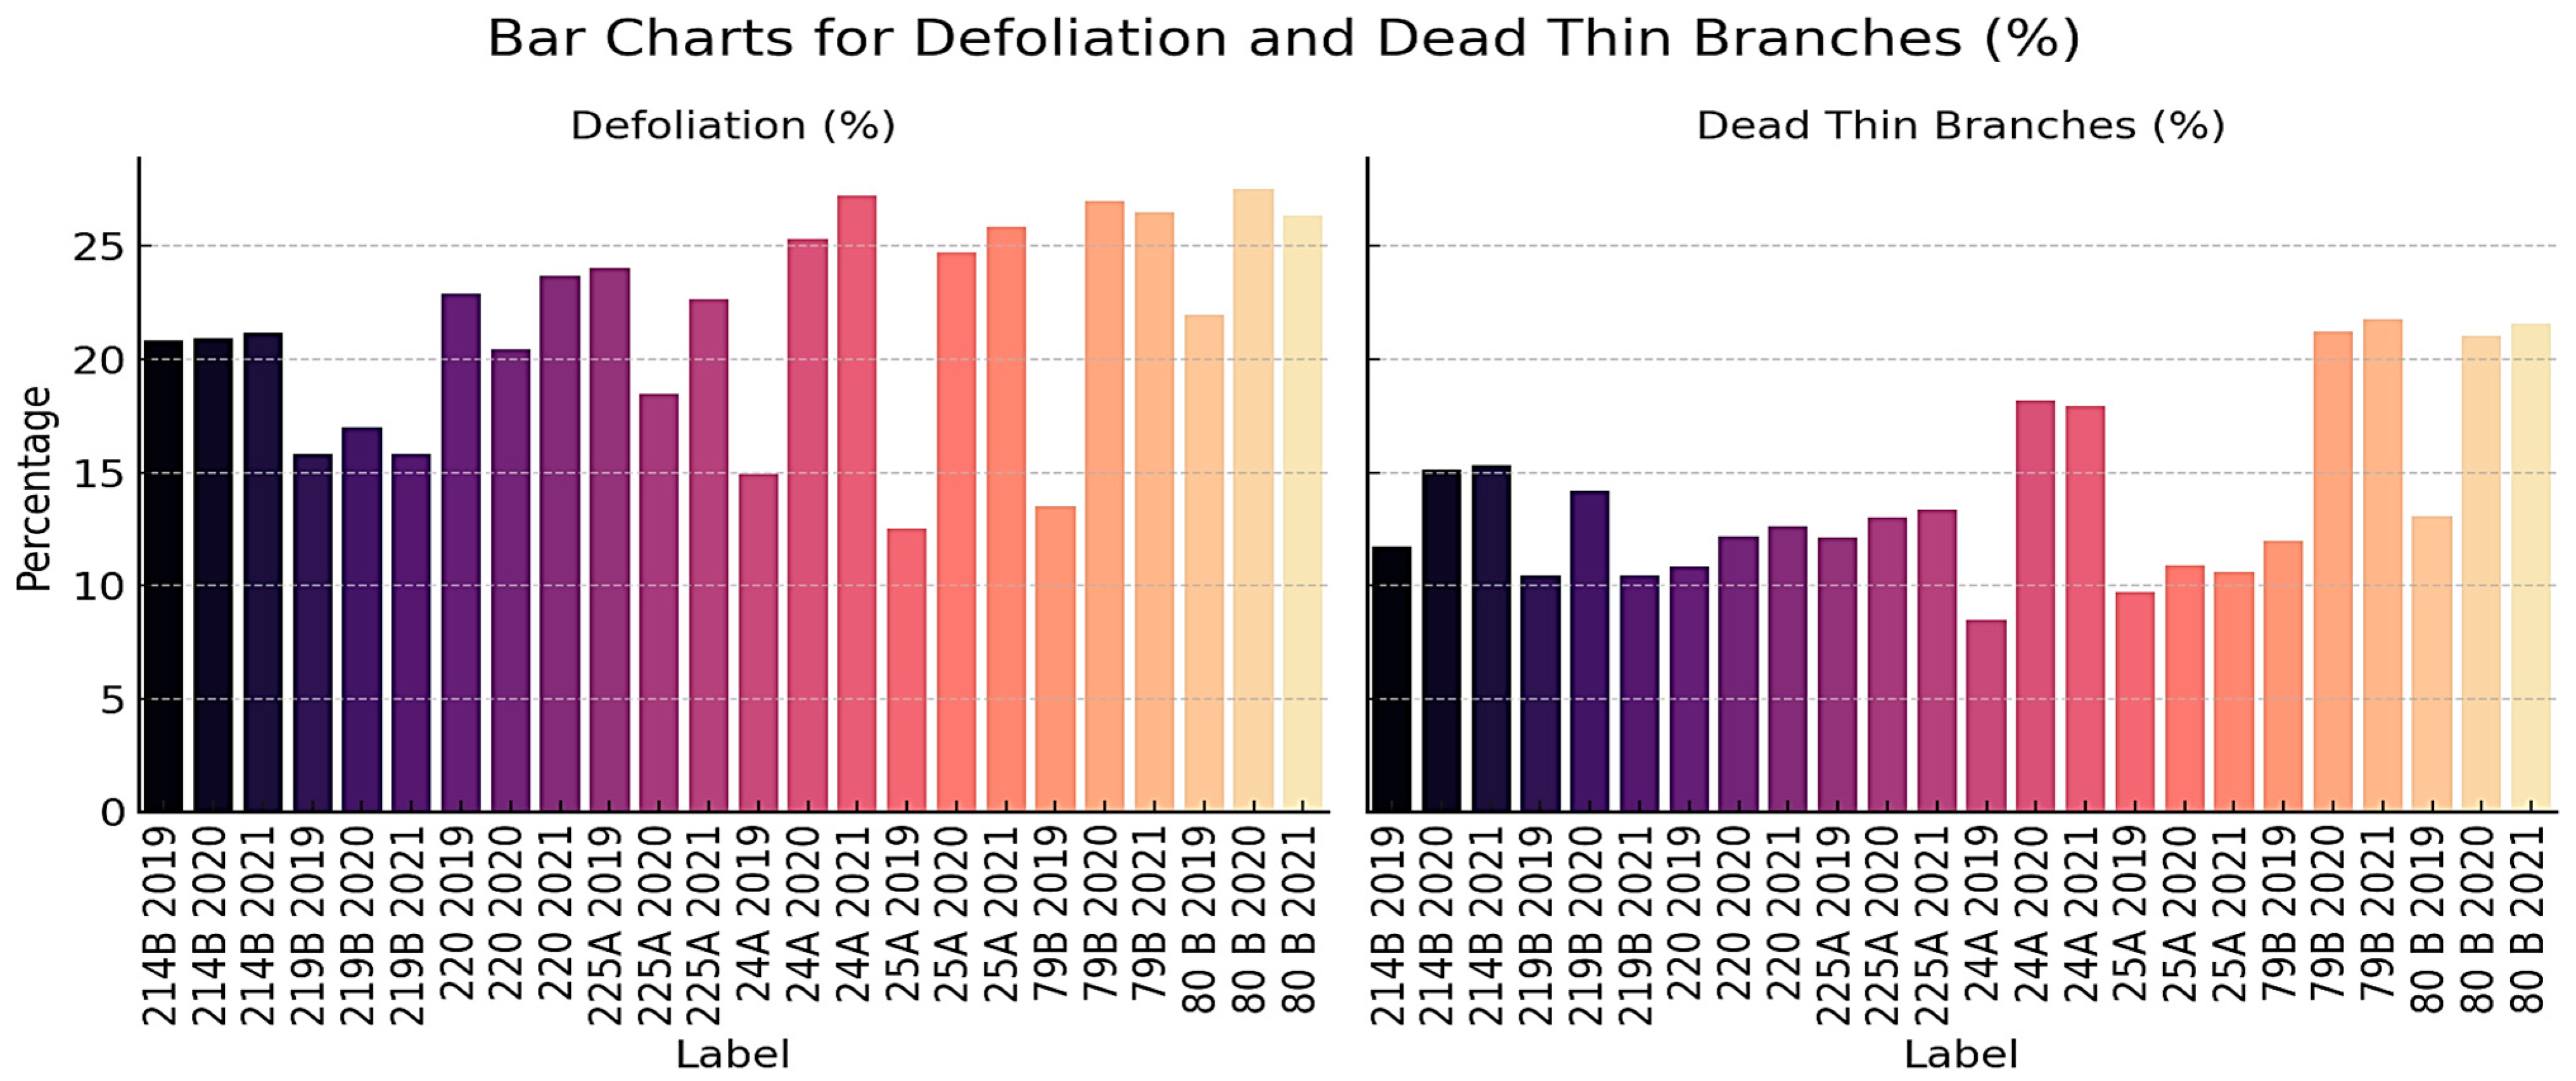
Defoliation and the proportion of dead thin branches are key vitality indicators reflecting canopy stress, foliage loss, and progressive crown deterioration. Both parameters exhibited heterogeneous patterns across FMUs during 2019–2021, with several units showing increasing stress signals (
Figure 8). Notably, FMUs 24A, 25A, 79B, and 80B recorded the highest defoliation values, exceeding 25% by 2021, accompanied by parallel increases in thin branch mortality. For example, 24A rose from ~15% in 2019 to over 27% in 2021, while dead thin branches nearly doubled from ~8% to ~18%. Similarly, 79B and 80B consistently exceeded 26% defoliation and surpassed 20% thin branch mortality, highlighting advanced crown decline and structural weakening.
By contrast, 214B, 219B, and 220 maintained moderate and stable levels, with defoliation generally between 15 and 21% and thin branch mortality around 10–15%, suggesting more resilient or balanced stand conditions. 225A showed a fluctuating trajectory, with defoliation decreasing in 2020 before rising again in 2021, indicating partial recovery followed by renewed stress.
The joint trends of defoliation and thin branch mortality reveal that some FMUs (e.g., 24A, 79B, 80B) are undergoing sustained canopy stress, while others remain relatively stable. When interpreted together, these parameters serve as early-warning indicators of forest vitality decline and provide valuable guidance for adaptive silvicultural management (
Figure 8).
The combined analysis of structural and vitality indicators (
Figure 7 and
Figure 8) shows clear contrasts among FMUs, with some units (219B, 220, 25A) remaining stable while others (80B, 79B, 24A, 214B) displayed persistent stress signals. These results emphasize the value of integrating structural and vitality metrics to detect early warning signs and support adaptive forest management.
3.3. Temporal Dynamics and Spatial Variation Across Forest Management Units (2019–2021)
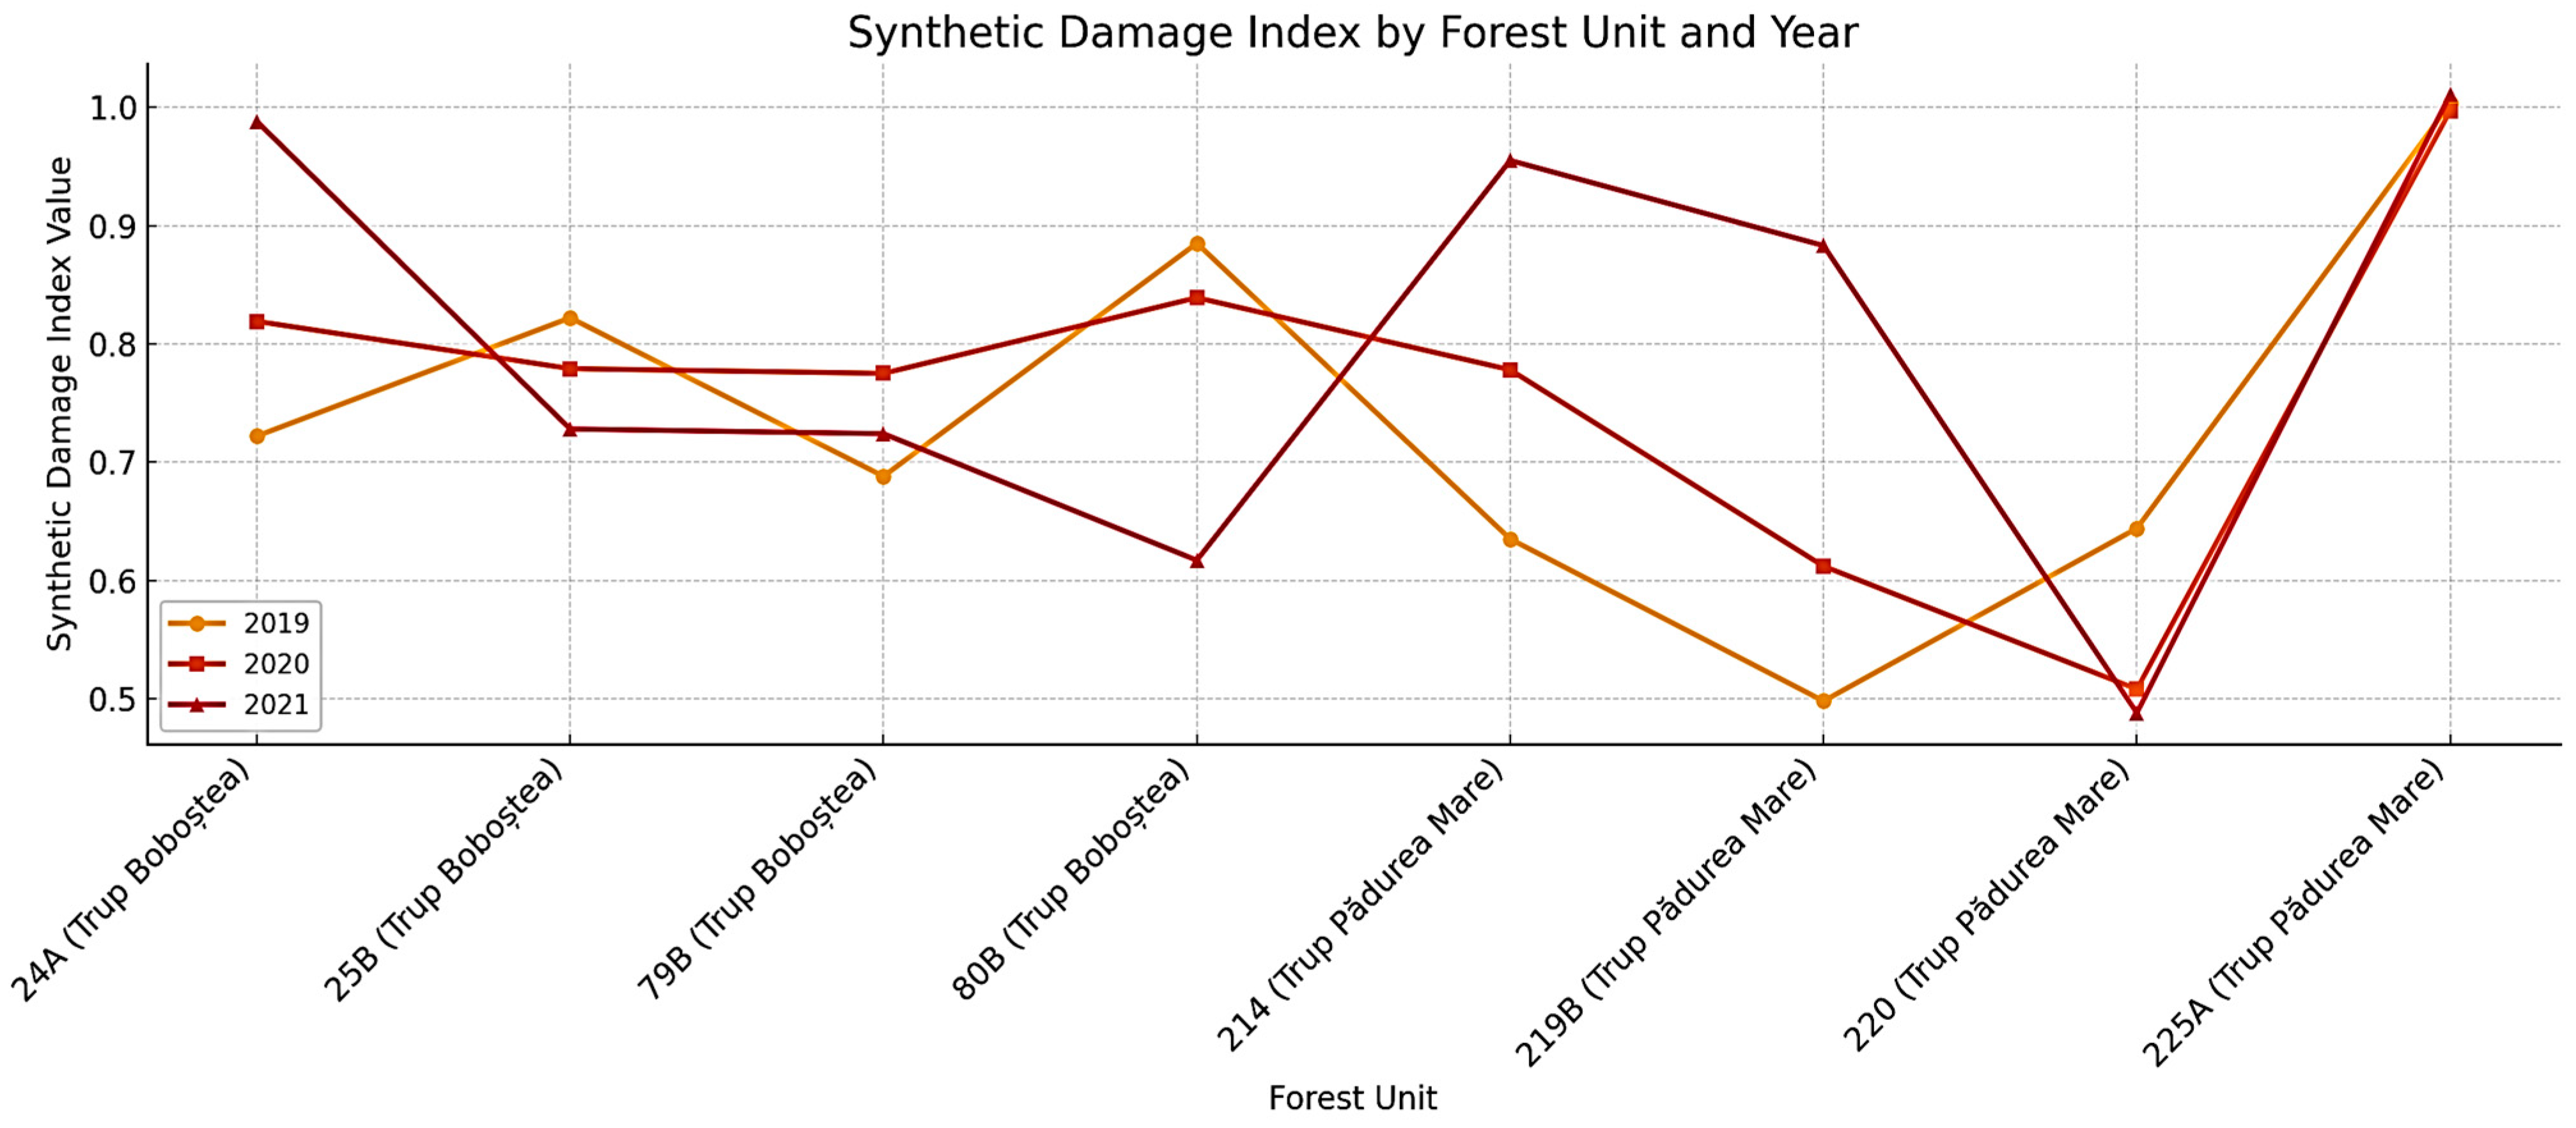
The analysis of defoliation parameters Gu (ground-level defoliation), Gv (canopy-level defoliation), and Gdev (deviation index) alongside the Synthetic Damage Index (SDI), reveals pronounced spatiotemporal variability in canopy condition across the studied FMUs (
Figure 9 and
Figure 10). FMU 80B exhibited a continuous deterioration trend, with Gu increasing from 17.21% (2019) to 26.23% (2021) and Gv from 70.49% to 81.97%. The corresponding rise in Gdev (12.13 → 17.21) highlights growing vertical imbalance and crown stratification, indicative of advanced canopy decline. A similar but more abrupt trajectory was observed in 24A, where Gv escalated from 32.43% (2018) to 85.51% (2021) and Gu from 12.84% to 27.54%, with Gdev more than doubling (8.04 → 18.04). These shifts signal severe and rapid canopy degradation, likely linked to strong disturbance events post-2018 (
Figure 9). FMU 25A followed a comparable path, with Gu doubling from 15.79% to 30.56% and Gv rising from 47.37% to 72.22% between 2019 and 2021.
The steep increase in Gdev (10.26 → 18.89) underscores substantial vertical crown disintegration, marking this unit among the most heavily stressed. In contrast, 79B remained remarkably stable, with minimal fluctuations in Gu and Gv and Gdev consistently around 16–17, suggesting structural resilience or effective silvicultural management. Intermediate responses were observed in 214B and 219B. In 214B, Gu and Gv rose sharply (18.31% → 27.61% and 52.11% → 76.12%), with Gdev increasing from 11.76 to 17.61, reflecting progressive canopy heterogeneity likely driven by biotic stress or management interventions. FMU 219B showed more moderate increases (Gu: 13.95% → 20.93; Gv: 53.49% → 65.12; Gdev: 9.65 → 13.72), suggesting gradual canopy thinning consistent with mild stress or natural aging. For 220, canopy condition remained relatively stable until 2020, followed by a sharp increase in Gu (12.50% → 21.74) and Gdev (8.33 → 13.26) in 2021, indicating a recent onset of disturbance or stress. In 225A, Gu rose gradually from 11.98% to 18.23%, while Gv remained almost unchanged and Gdev moderate (8.59–11.77), suggesting slow canopy thinning rather than abrupt decline.
The Synthetic Damage Index (
Figure 10) corroborates these trends, providing an integrated measure of cumulative stress across FMUs. Units 24A, 25A, and 80B consistently ranked among the most affected, with SDI values rising sharply between 2019 and 2021, reflecting both accelerated defoliation and structural imbalance. This persistent increase confirms their heightened vulnerability and positions them as priority areas for monitoring. In contrast, FMUs 79B and 225A maintained relatively low and stable SDI trajectories, suggesting stronger resistance or slower degradation processes despite minor year-to-year fluctuations. Intermediate patterns were observed in 214B and 220, which displayed moderate but significant upward shifts in SDI, pointing to emerging stress conditions that may intensify if current trends persist.
The integration of Gu, Gv, Gdev, and SDI demonstrates strong contrasts among FMUs. Units such as 24A, 25A, and 80B are undergoing rapid and severe canopy deterioration, while 79B and 225A exhibit resilience or slower degradation rates. Intermediate cases (214B, 219B, 220) point to evolving but less extreme stress. These findings confirm the value of combining multi-scale indicators to capture both the pace and intensity of forest decline, offering critical insights for adaptive management and early detection of vulnerability.
For 220, canopy condition remained relatively stable until 2020, followed by a sharp increase in Gu (12.50% → 21.74) and Gdev (8.33 → 13.26) in 2021, indicating a recent onset of disturbance or stress. In 225A, Gu rose gradually from 11.98% to 18.23%, while Gv remained almost unchanged and Gdev moderate (8.59–11.77), suggesting slow canopy thinning rather than abrupt decline.
The Synthetic Damage Index (
Figure 10) corroborates these trends, highlighting FMUs 24A, 25A, and 80B as the most impacted, with steadily increasing damage values. Conversely, 79B and 225A maintained comparatively stable or moderate levels, while 214B and 220 showed intermediate but notable upward shifts.
3.4. Impact of Geometridae and Tortrix Viridana on Foliage Integrity in Managed Forest Units
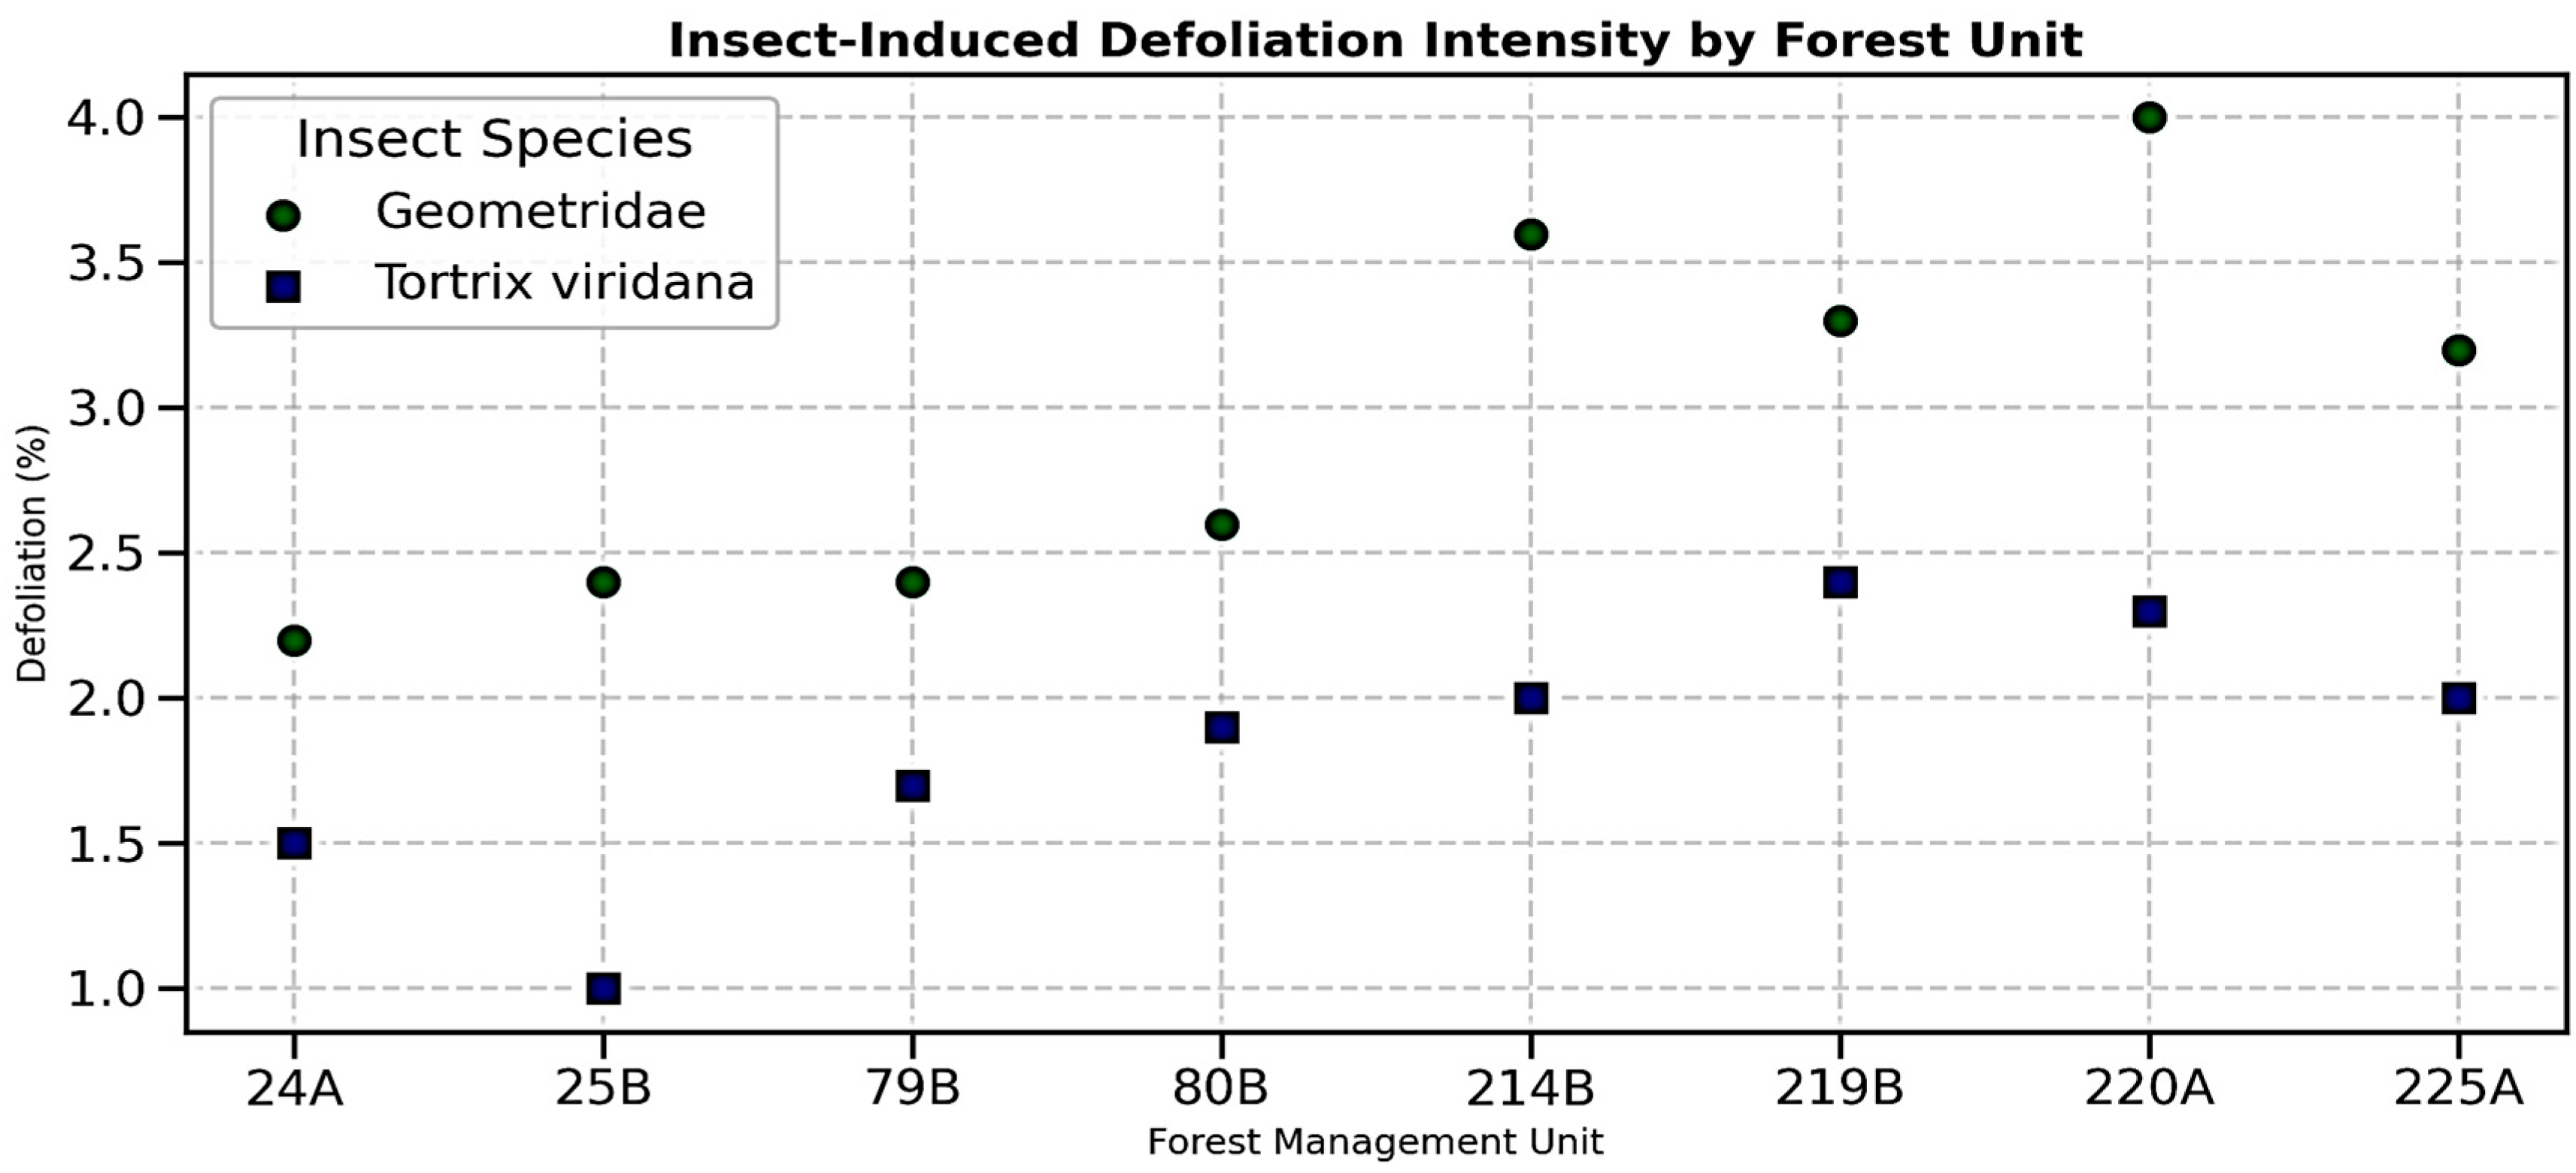
The assessment of insect-induced defoliation (
Figure 11) reveals consistent differences between the two taxonomic groups across the analyzed FMUs.
Geometridae exerted the strongest pressure on canopy integrity, with defoliation values ranging between 2.2% (24A) and 4.0% (220A). High values were also recorded in 214B (3.6%) and 219B (3.3%), indicating a recurrent and spatially concentrated stress pattern. In contrast,
Tortrix viridana contributed lower levels of defoliation, generally between 1.0% and 2.4%, the latter observed in 219B.
This consistent dominance of Geometridae suggests greater ecological adaptability, likely linked to phenological synchronization between larval emergence and leaf flush. Their higher impact in units such as 214B, 219B, and 220A points to the role of local factors—such as warmer exposures or denser stand conditions—in amplifying insect pressure. By comparison, the relatively uniform but moderate defoliation by Tortrix viridana indicates a widespread yet lower-intensity effect, which may nonetheless contribute to cumulative stress when combined with other pressures.
Although overall defoliation intensities remain below 5%, considered “very low” in absolute terms, their ecological significance should not be underestimated. Repeated annual foliage losses reduce photosynthetic surface area, forcing trees to compensate through epicormic shoots or internal resource reallocation. Such compensatory responses were already evident in units with structural decline (e.g., 214B, 80B), suggesting that insect-driven defoliation compounds existing vitality constraints.
Figure 11 highlights a clear asymmetry in insect impact:
Geometridae emerge as the dominant defoliators, producing the highest recorded values, while
Tortrix viridana maintains a consistent but secondary role. These results underline the importance of species-specific defoliation monitoring, as even low but recurrent levels may accelerate crown deterioration and influence long-term forest resilience.
Overall, the contrasting SDI dynamics and the risk scorecard classification highlight cumulative stress pathways, a perspective further elaborated in the Discussion section.
4. Discussion
4.1. Crown Structure and Vitality as Early-Warning Indicators
The multi-year assessment of crown morphological parameters—crown size and crown shape—revealed both stability and localized variation across Forest Management Units (FMUs). Units such as 79B, 25A, and 220 displayed consistently large crown sizes (≥2.0), indicating favorable ecological conditions and possibly effective silvicultural practices.
By contrast, FMU 80B showed a declining crown size, suggesting that drought, stand density, or past disturbance events may have impaired canopy development. Crown shape was generally stable across the study sites, but 225A exhibited a positive trajectory, likely driven by thinning, competitive release, or improved light availability. These contrasting patterns highlight differences in structural resilience and vulnerability among forest environments.
Epicormic shoot production, often interpreted as a response to physiological stress or altered light conditions, increased notably in 25A, 214B, and 220. This trend may indicate crown instability and loss of apical dominance. It can also reflect compensatory efforts to restore photosynthetic capacity. By contrast, FMUs with stable or moderate values (e.g., 24A, 219B) suggest more balanced conditions. Combining crown morphology and epicormic data thus provides insight into latent stress responses and recovery potential.
4.2. Climatic Drivers and Biotic Interactions
Defoliation and branch mortality further underline canopy vitality. FMUs 24A, 25A, and 80B showed severe deterioration, with defoliation exceeding 25% and parallel increases in thin branch mortality. These patterns suggest chronic stress, likely exacerbated by drought and insect activity.
In contrast, FMU 220 showed a decline in thick dead branches, possibly linked to silvicultural operations or natural crown cleaning. Meanwhile, 214B and 24A recorded more thick dead branches, pointing to progressive dieback.
Species-specific impacts also emerged: Geometridae caused higher defoliation across all FMUs, exceeding 3.5% in 220A, 214B, and 219B, whereas Tortrix viridana had lower but persistent effects. This indicates that Geometridae act as acute drivers of canopy stress, while T. viridana exerts chronic, cumulative pressure.
The Synthetic Damage Index provided an integrated view of cumulative stress. FMUs such as 225A and 24A recorded high and increasing values, confirming vulnerability and the need for targeted interventions, whereas 220 and 25B showed variable or even declining trends, suggesting recovery or fluctuating stress levels.
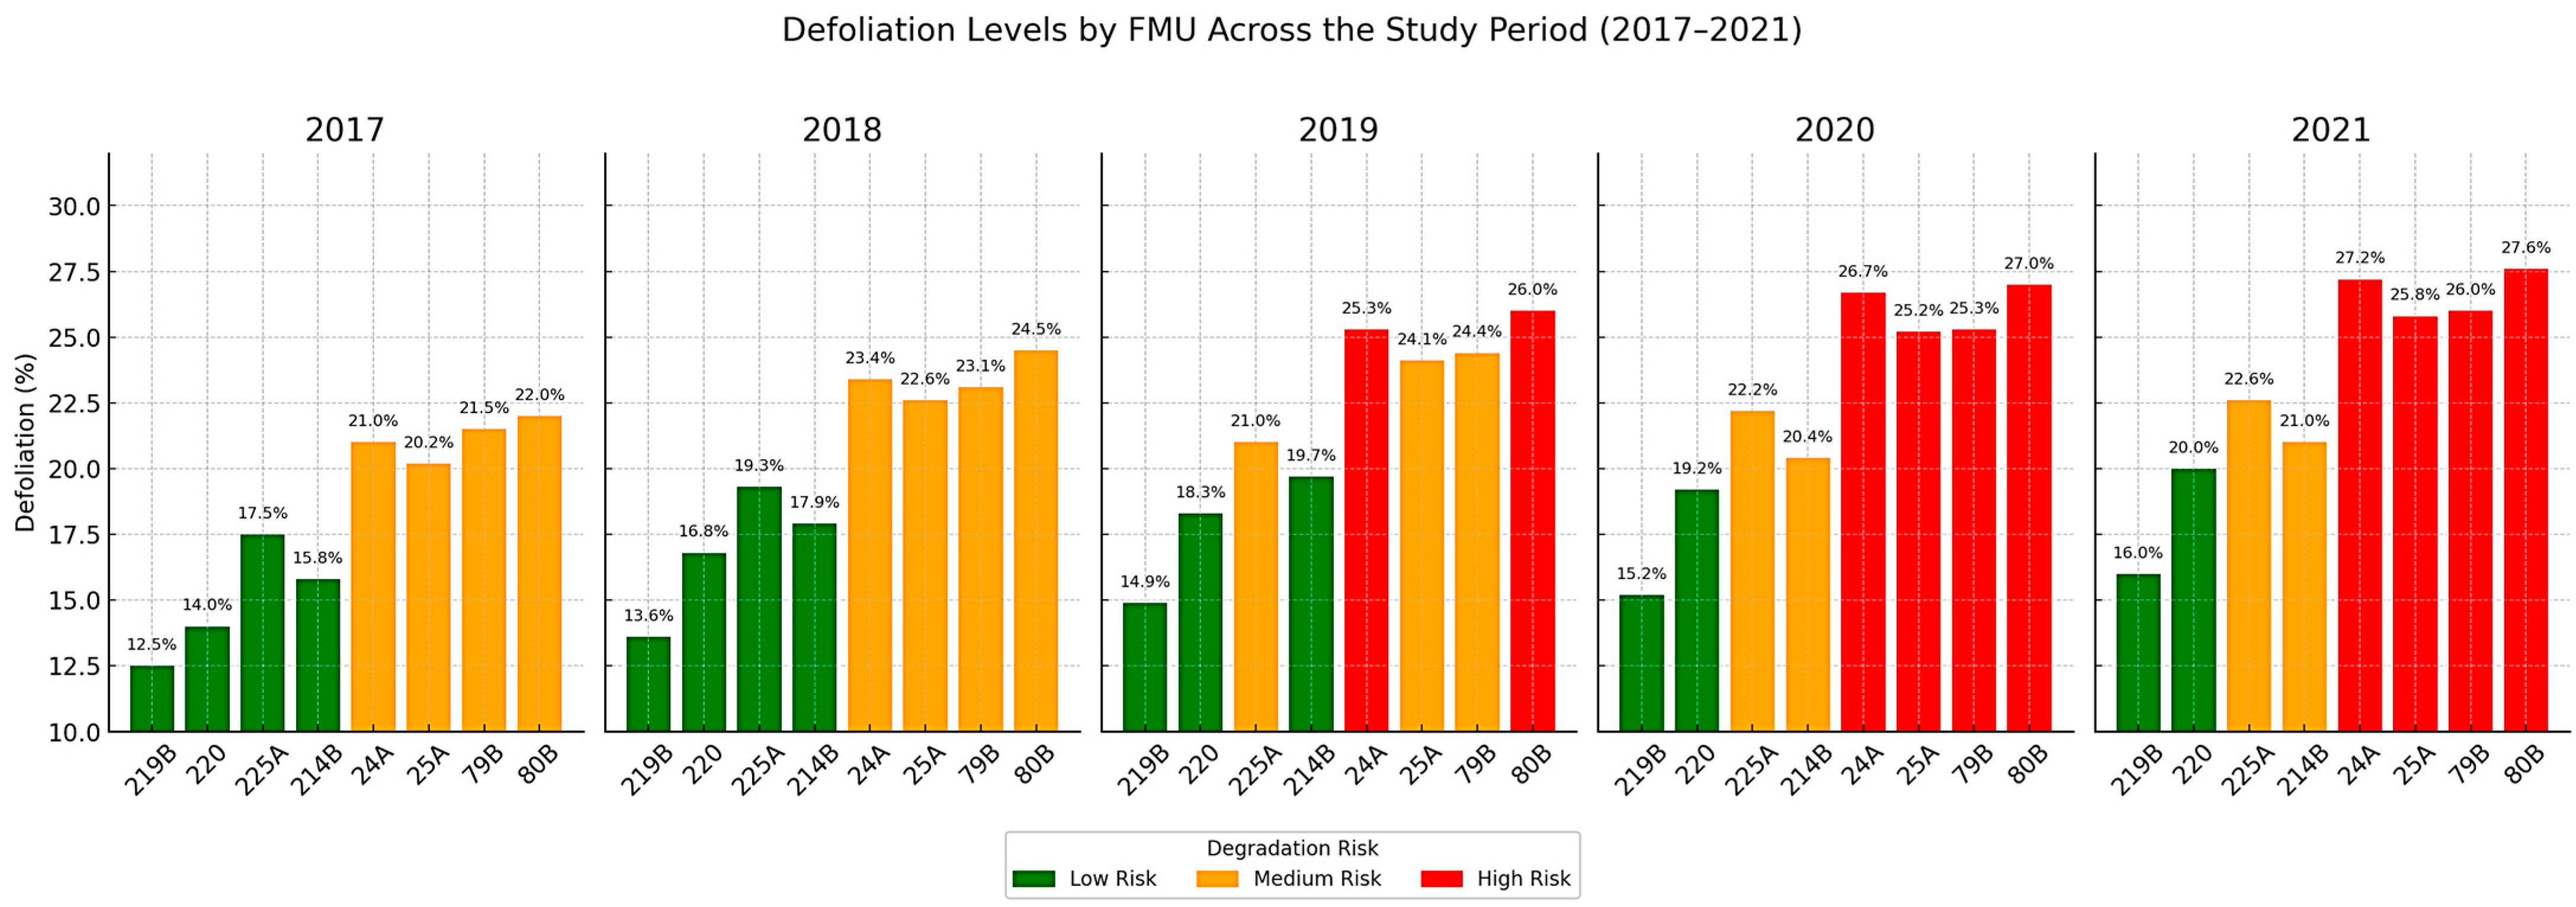
The annualized analysis of defoliation levels (2017–2021) highlights the progressive nature of canopy decline (
Figure 12). Units 24A, 25A, 79B, and 80B shifted rapidly from medium-risk zones (orange) in 2017–2018 to high-risk categories (red) after 2019, with defoliation rising from ~21–22% to over 27% by 2021. These patterns confirm persistent stress exposure and limited recovery capacity. By contrast, 219B and 220 remained in the low-risk zone (green) throughout the period, with only modest increases (12.5% → 16% and 14% → 20%), while 225A and 214B showed intermediate dynamics, crossing the 20% threshold and approaching critical levels.
The defoliation trajectories align with climatic stress episodes in 2018–2020, marked by heat and drought, which amplified canopy vulnerability. As
Figure 12 illustrates, these effects accumulated over time, with chronic stress symptoms (e.g., epicormic shoots, dead branches) reflected in the rising defoliation rates. The bar plots provide clear visual stratification of risk, with red zones marking urgent priorities for intervention.
4.3. Contrasting Resilience and Vulnerability Patterns
The integration of structural and vitality indicators with annual defoliation trajectories (
Figure 12) underscores the progressive weakening of forest canopies under combined climatic and biotic pressures. Defoliation, when tracked annually and contextualized, emerges as a robust structural indicator of ecosystem stress and a valuable tool for anticipating threshold breaches and guiding adaptive management.
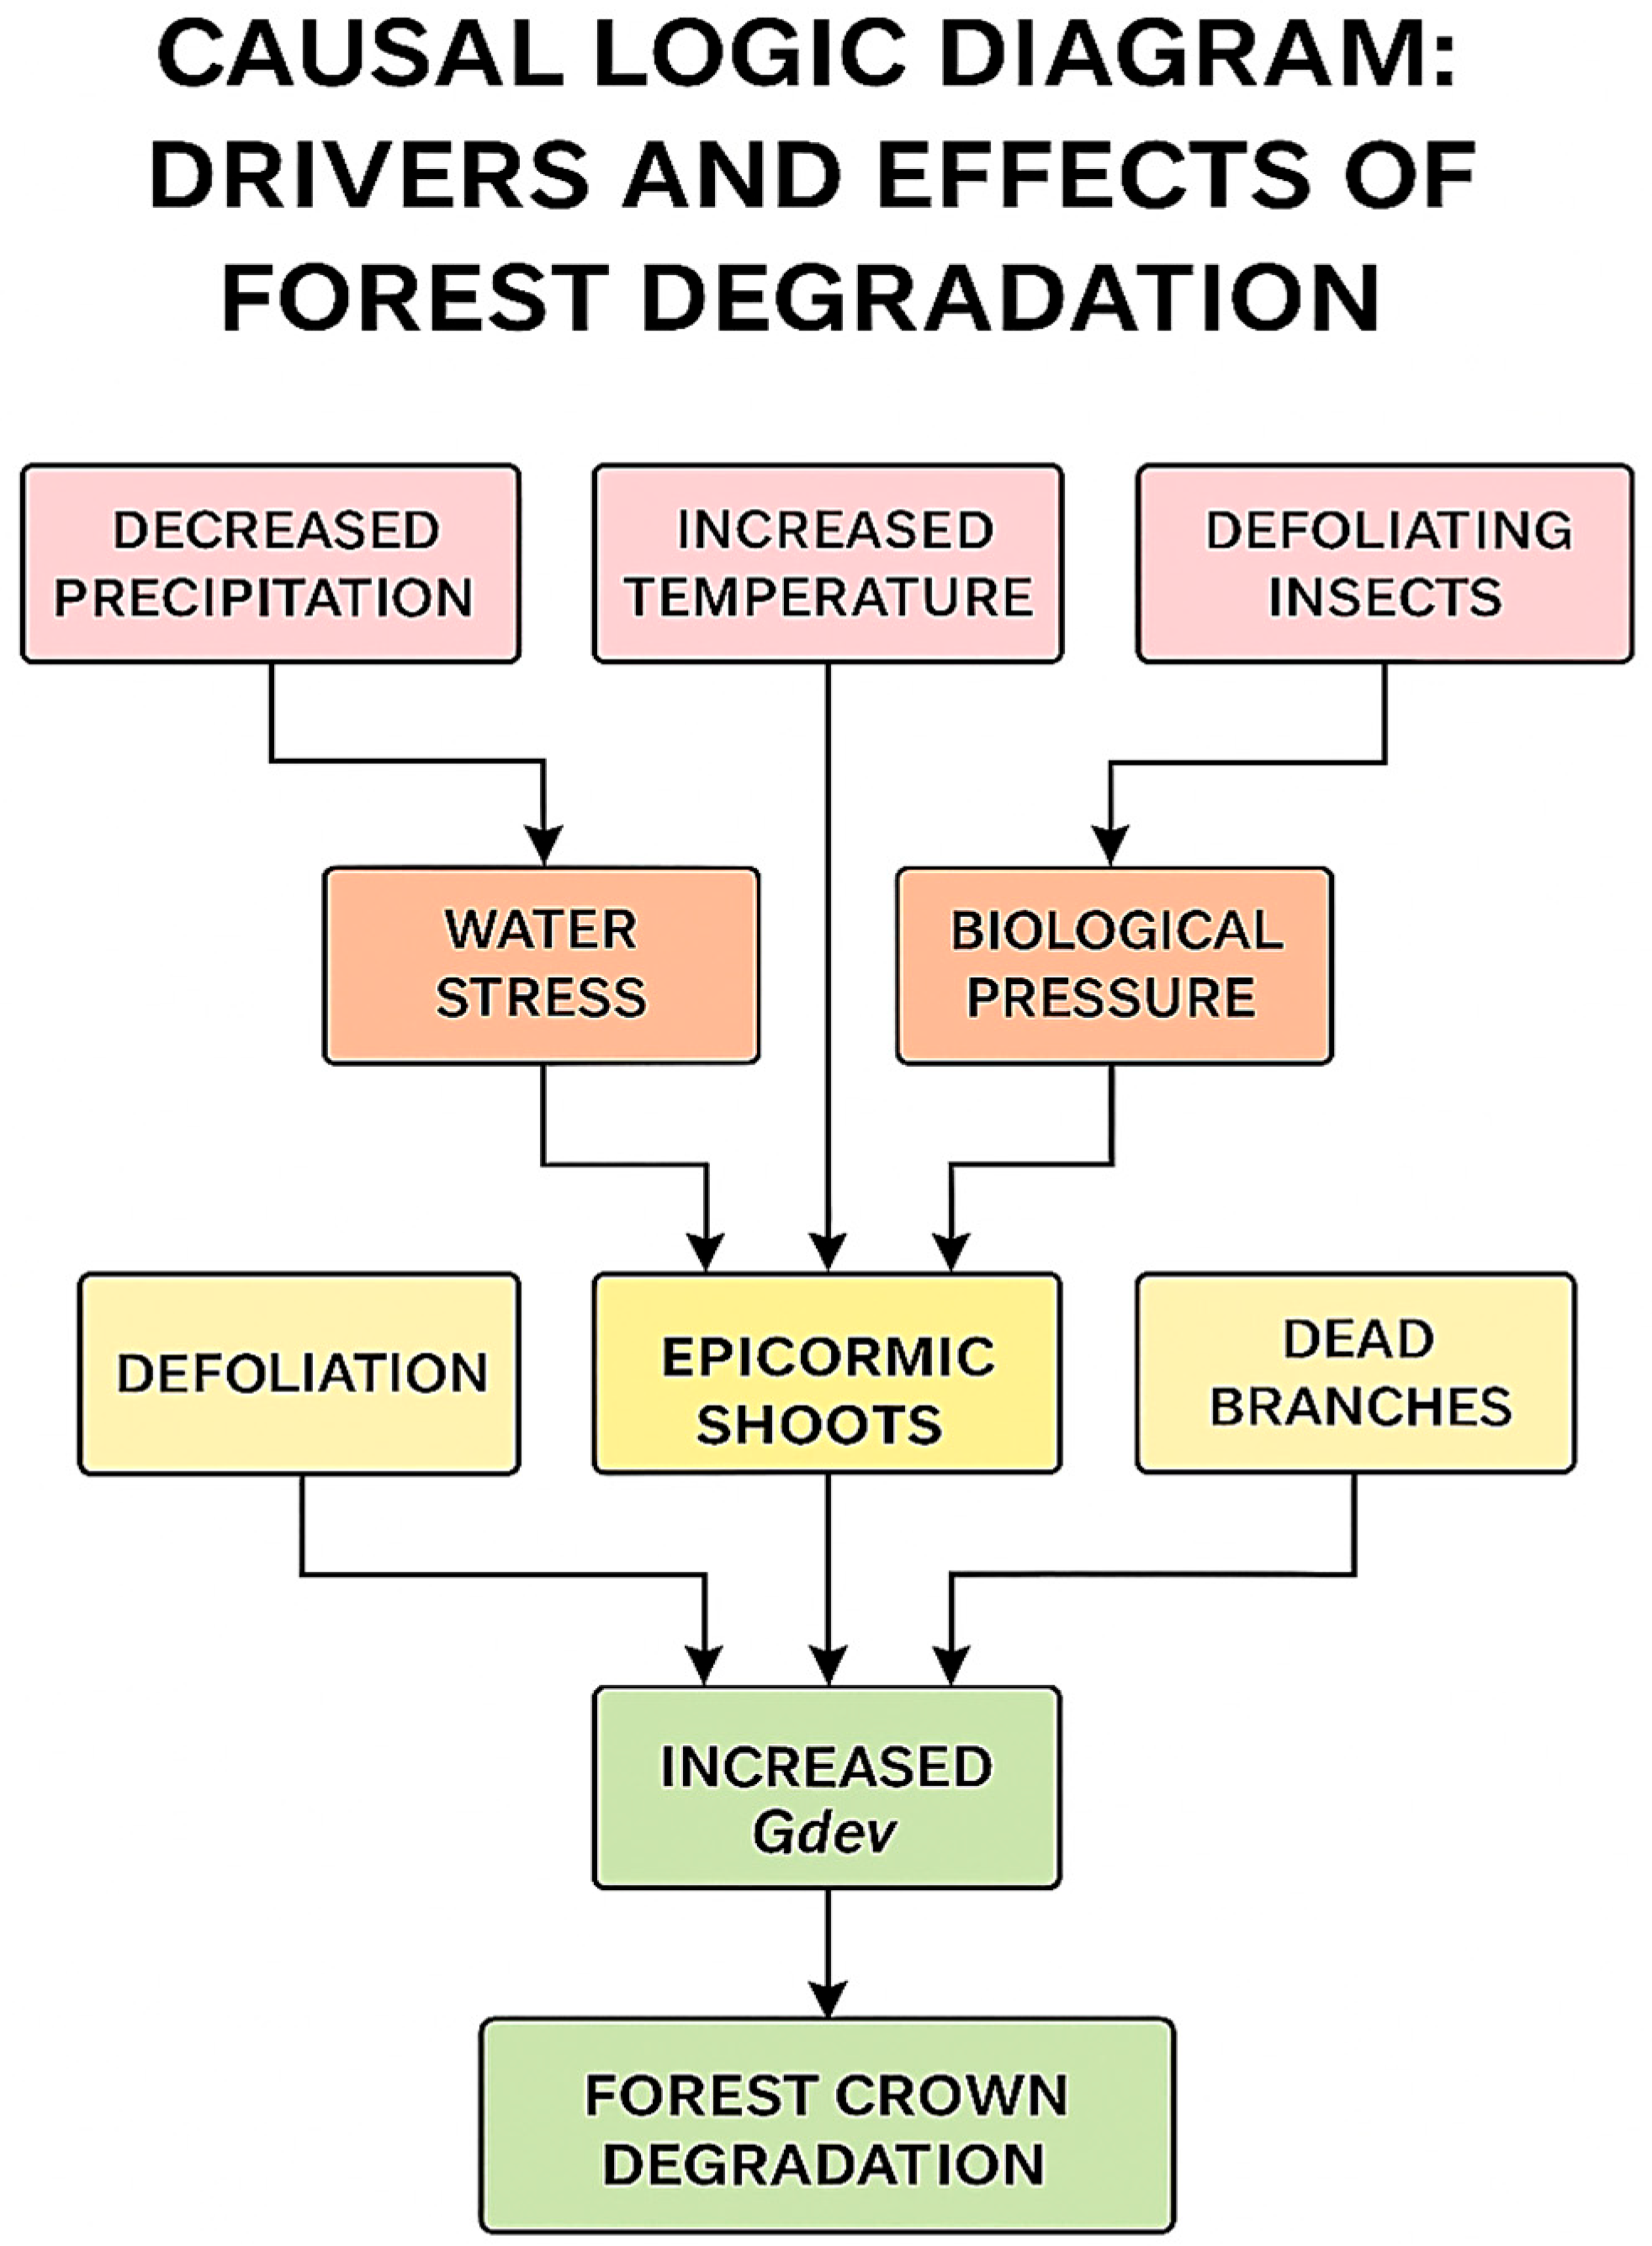
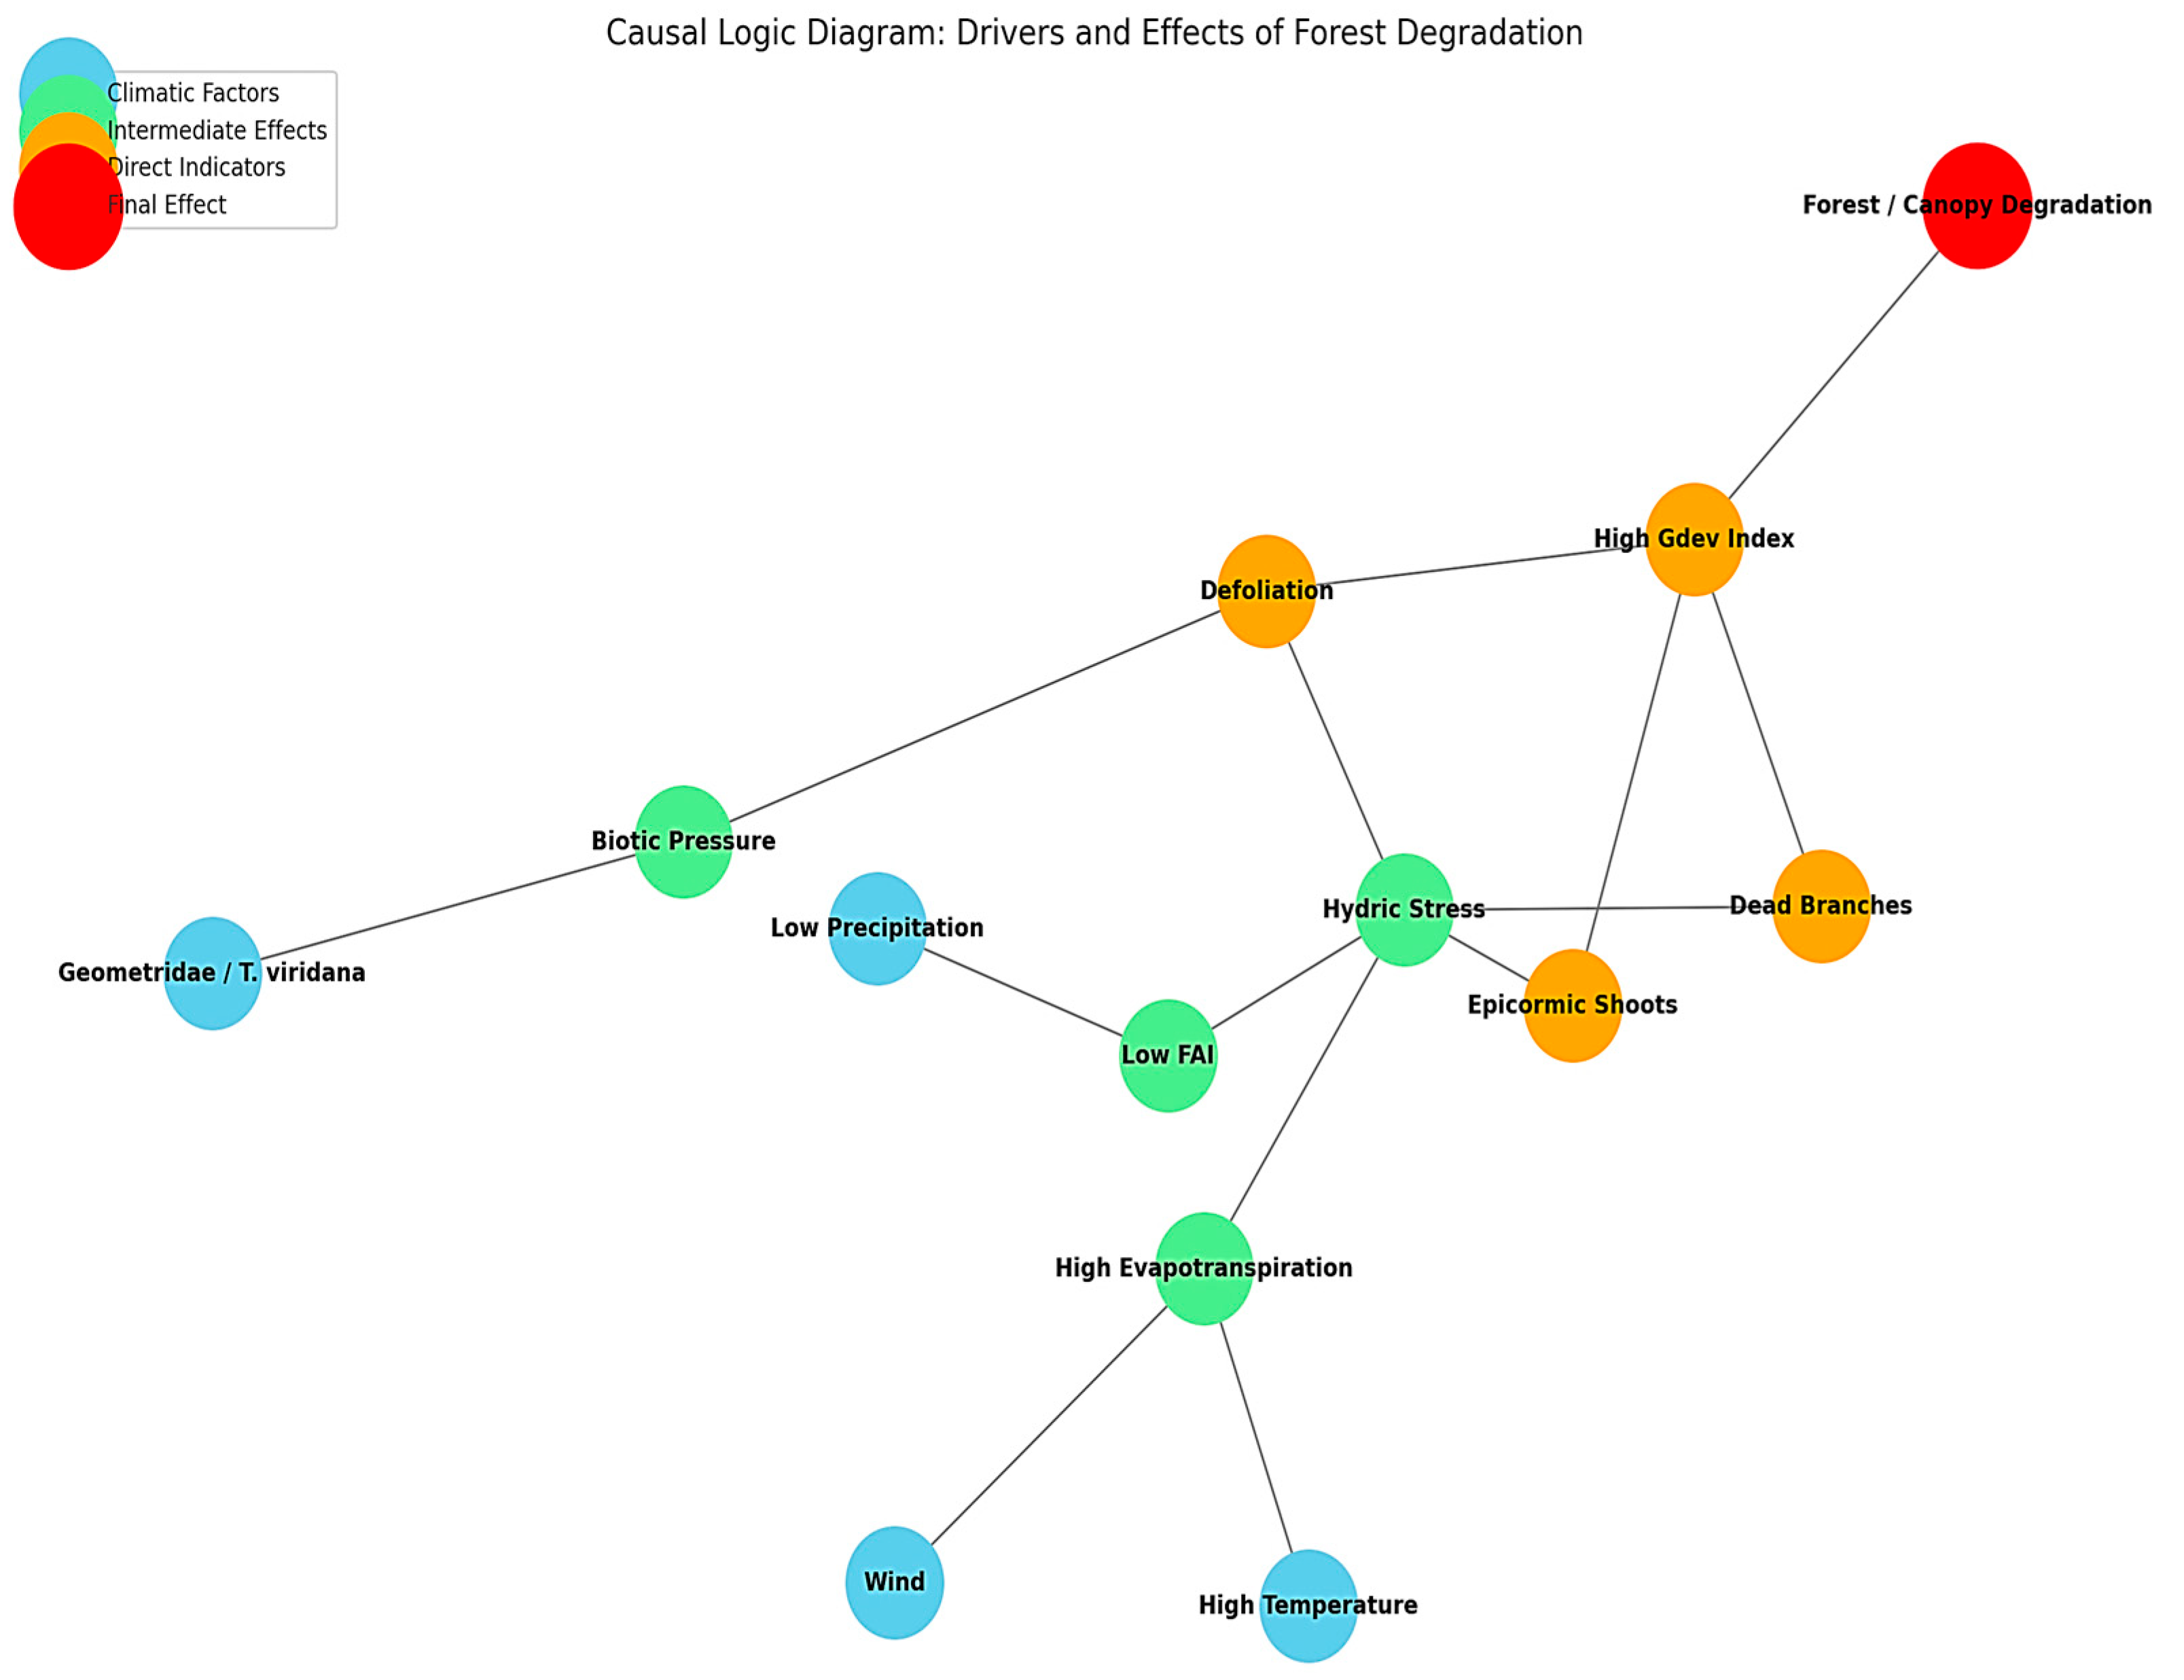
To complement the empirical findings, two conceptual diagrams were developed to illustrate the causal pathways driving canopy decline (
Figure 13 and
Figure 14). These models provide a systematic overview of how climatic anomalies and biotic pressures interact with structural indicators to produce long-term forest degradation.
Figure 13 presents a network-based causal diagram that organizes the relationships into four major categories: climatic factors (e.g., low precipitation, high temperature, wind), intermediate stress pathways (e.g., hydric stress, high evapotranspiration, biotic pressure), direct indicators (e.g., defoliation, epicormic shoots, dead branches), and the final effect forest canopy degradation.
Hydric stress emerges as the central convergence point, integrating signals from drought, elevated evapotranspiration, and weakened physiological stability. This, in turn, triggers visible responses such as defoliation and epicormic resprouting, which feed directly into the Gdev index, a key proxy of structural imbalance.
Figure 14 translates these relationships into a stepwise schematic that highlights directional flows from primary drivers to outcomes. Climatic stress (decreased precipitation, rising temperature) and biotic stress (defoliating insects such as
Geometridae and
Tortrix viridana) act in parallel, generating water stress and biological pressure, respectively. These stressors converge on structural indicators, including increased epicormic shoots and branch mortality, which signal early canopy destabilization. Ultimately, these cumulative effects drive forest crown degradation.
Taken together,
Figure 13 and
Figure 14 reinforce the empirical evidence by visualizing how multiple stressors interact in cascading sequences. They underscore the synergistic impact of climatic extremes and insect activity, clarifying how repeated moderate stress can accumulate into chronic canopy decline. Moreover, the diagrams highlight potential early-warning indicators such as epicormic shoots and rising Gdev values that can inform adaptive management strategies.
To transform structural indicators into practical forest management strategies, a risk scorecard was developed for the eight Forest Management Units (FMUs).
4.4. Implications for Sustainable Forest Management
Figure 15 integrates three critical metrics final defoliation percentage, Gdev index, and epicormic shoot presence into an ecological risk classification framework. FMUs 24A, 25A, 79B, and 80B fall within the high-risk category, characterized by severe defoliation (>26%), elevated Gdev values (>22), and strong epicormic responses. These conditions highlight the urgent need for adaptive silvicultural interventions and regeneration measures. In contrast, FMUs 214B and 225A occupy the medium-risk class, where early signs of structural decline warrant increased monitoring and selective thinning to prevent further deterioration. FMUs 219B and 220 are placed in the low-risk category, showing stable crown structure and limited stress indicators, where maintaining current management regimes alongside early-warning monitoring is sufficient.
4.5. General Discussion
The multi-annual assessment of
Quercus robur stands revealed significant heterogeneity in canopy condition across the studied management units. Severe decline, expressed through high defoliation, epicormic shoot proliferation, and increasing Gdev values, was observed in several stands (e.g., 24A, 25A, 80B), while others (219B, 220A) maintained structural stability and vitality. These results highlight that crown morphology and vitality traits are reliable early-warning indicators of oak decline, as also emphasized in previous Romanian studies [
26,
44,
50,
75].
Defoliation has long been recognized as a sensitive measure of vitality loss [
26,
44]. Our results show that thresholds above 25% were consistently associated with advanced crown deterioration, in line with regional monitoring data [
4,
34]. The increase in epicormic shoots in stressed units supports the view of Roloff [
50] and Șimonca et al. [
75] that this parameter reflects compensatory growth under chronic stress. Together, the indices Gu, Gv, and Gdev proved effective in quantifying structural imbalance, comparable with other Central and Eastern European studies [
73,
74].
The Forest Aridity Index (FAI) captured the impact of hydroclimatic anomalies, with the drought of 2018 coinciding with peak canopy stress. Similar associations between oak decline and drought have been documented in Central and Southern Europe [
52,
53,
54,
55]. In the Romanian context, Nedealcov [
74] reported that prolonged precipitation deficits exacerbate crown thinning and vitality loss. In our case, insect defoliators such as
Geometridae and
Tortrix viridana intensified stress, though generally below outbreak levels. These observations are consistent with other findings on the cumulative effect of biotic and abiotic stressors in oak forests [
4,
17,
18,
19,
25,
32].
The contrast between vulnerable stands (24A, 25A, 80B) and stable ones (219B, 220A) underlines the role of site conditions, stand density, and management history in shaping resilience. Similar observations were made for Romanian oak forests by Șimonca et al. [
16,
75], who noted that structural diversity enhances resistance to drought stress. At a broader scale, European studies confirm that site quality and stand composition strongly influence decline trajectories [
22,
23,
24].
By integrating structural and climatic indicators, our study provides a transferable framework for the early detection of canopy decline. This approach is consistent with European forest monitoring initiatives [
34,
37,
71,
72] and supports adaptive management strategies advocated in Romania and across Central Europe [
14,
15,
73]. Preventive measures such as selective thinning, maintaining species diversity, and monitoring early-warning indicators (defoliation, epicormic shoots, Gdev) are essential for reducing vulnerability. Stable units such as 219B and 220A may serve as reference sites for genetic conservation [
51,
52,
53,
54,
55,
56,
57]. Overall, these findings contribute to resilience-based forest management and align with sustainability objectives by safeguarding oak ecosystem services under climate change [
5,
6,
7,
13,
34].
5. Conclusions
This study delivers a multi-dimensional evaluation of canopy degradation in temperate oak forests by combining structural indicators—defoliation percentage, Gdev index, and epicormic shoot frequency—with climatic trends and conceptual modeling. The analysis of eight Forest Management Units (FMUs) between 2017 and 2021 revealed both spatial heterogeneity and temporal trajectories of stress accumulation. Climatic variability, characterized by persistent heat, erratic precipitation, and extreme events such as the 2018 drought, emerged as a key driver. The Forest Aridity Index (FAI) proved highly sensitive to hydroclimatic anomalies, while the more stable Ecological Quality Index (EQ) suggested short-term buffering capacity.
From a structural perspective, FMUs 24A, 25A, 79B, and 80B consistently ranked as the most vulnerable, exhibiting severe defoliation (>26%), high Gdev values, and abundant epicormic shoots, all indicative of chronic stress and reduced recovery potential. By contrast, FMUs 219B and 220 maintained stable conditions, representing resilient reference units for long-term monitoring. Intermediate trajectories in FMUs 214B and 225A highlighted early-warning signals of decline, warranting preventive measures such as selective thinning and intensified monitoring.
Crown morphology and vitality assessments deepened these findings, showing that variations in crown size, shape, and epicormic growth are tightly linked with tree vigor and regenerative potential. Stress–response feedback loops, expressed through defoliation, branch mortality, and epicormic resprouting, emphasized the diagnostic value of combining structural and physiological indicators. Biotic stress added another layer of vulnerability: Geometridae induced stronger defoliation than Tortrix viridana, underscoring the role of insect feeding strategies in compounding canopy decline.
Taken together, the results confirm that defoliation dynamics, Gdev fluctuations, and epicormic proliferation function as reliable early-warning signals of forest instability. Systematic use of these metrics can enhance predictive models, refine ecological risk stratification, and guide adaptive silvicultural strategies.
Beyond the Romanian context, these findings carry broader significance. The integrative framework proposed here offers a transferable model for temperate forests across Europe and comparable regions worldwide, where climate instability and biotic stressors increasingly converge. By linking empirical monitoring with conceptual interpretation, this study contributes to resilience-based forest management and provides actionable insights for both regional policy development and continental-scale monitoring programs.
