Article

Analyzing the Multifactor Driving Mechanism and Patterns of Economic Development in China from a Water Resource Perspective

1
China Institute of Water Resources and Hydropower Research, Beijing 100038, China
2
State Key Laboratory of Water Cycle and Water Security, Beijing 100038, China
3
Key Laboratory of Water Safety for Beijing-Tianjin-Hebei Region of Ministry of Water Resources, Beijing 100038, China
*
Author to whom correspondence should be addressed.
Sustainability 2025, 17(20), 9174; https://doi.org/10.3390/su17209174
Submission received: 8 September 2025 / Revised: 29 September 2025 / Accepted: 3 October 2025 / Published: 16 October 2025

Abstract

With rapid economic development and the growing global demand for water resources, the relationship between water demand and economic growth has become a critical international concern. This study investigates the role of water resources in China’s economic growth by extending the Cobb–Douglas production function to include investment, labor, energy, land, and water resources. Using national and regional data from 1949 to 2023, we quantify the spatiotemporal dynamics of factor contributions across primary, secondary, and tertiary industries. Results show that investment remains the dominant growth driver, with rising contributions from energy and land, while labor is increasingly substituted. Water resources exhibit marked industrial and regional heterogeneity: since 2013, water constraints have intensified in the primary sector of the Yellow River basin and Northeast China, and in the secondary sector of the inland northwest and Yellow River provinces. Considering national food security imperatives and given the complementary nature of water–land resources and the fixed nature of land, we propose strategic water network planning based on land productivity patterns to optimize resource coordination and drive high-quality economic development.

1. Introduction

Today, resource scarcity has emerged as a key challenge confronting global economic development. Among various resource issues, water scarcity is particularly critical. The combined effects of climate change, population expansion, and economic growth have led to a sustained increase in agricultural and non-agricultural water demand, exacerbating water shortages [1]. This intensification of water scarcity has triggered economic and agricultural crises, contributing to the growing frequency of international water conflicts [2,3]. Moreover, the uneven spatial distribution of water resources has complicated the relationship between water availability and economic growth. As global climate and environmental challenges worsen, the finite nature of water resources makes sustainable economic growth under conditions of water scarcity an urgent issue.
The theory of production factors is a fundamental concept in economics. In classical economics, labor and capital are regarded as the two primary drivers of economic growth. Neoclassical economics introduced the law of diminishing returns to production factors and examined the interactions among them. Modern economics further expanded the scope of production factors by incorporating knowledge and technology [4,5]. With globalization, informatization, and increasing emphasis on resources and the environment, emerging factors such as data, information, and natural resources have also been recognized as production factors [6,7,8,9]. The Cobb–Douglas production function (C-D function) has been widely applied in studies of economic growth to comprehensively evaluate the contribution of production factors. Early research mainly focused on the roles of capital accumulation, labor, and technological progress in driving economic growth [10,11]. With the intensification of global climate change and environmental issues, natural factors such as land and energy have gradually been incorporated into the model, and studies have examined the interactions between energy and other production factors in economic development [12,13,14]. Yansui Liu and colleagues empirically verified the contribution of land to GDP using production function models [15]. Su et al. employed the Cobb–Douglas production function to assess the economic impacts of water and land resources on rural-urban development. They found that water resources contributed more to GDP growth than land resources [16]. Regarding the relationship between water resources and the national economy, many studies in the early 21st century explored both the direct and indirect impacts of water resources on economic growth, showing that water scarcity constrained agricultural and industrial development [17,18]. Since the United Nations established the 2030 Sustainable Development Goals, the “decoupling theory” proposed by the OECD, which describes the weakening relationship between economic growth and resource consumption, has been widely applied in studies of the water–economy nexus [19,20]. Related research indicates that China’s economic growth generally exhibits a weak decoupling trend from water use [21,22,23,24,25]. In addition, when analyzing the impacts of natural resources, energy, and renewable energy on economic growth, scholars have also included discussions of water resources [26]. Overall, however, studies that comprehensively assess the contribution of all production factors, including water resources, to economic growth remain relatively limited.
In this study, China is divided into 11 research regions based on geographical divisions, socioeconomic development characteristics, and resource allocation features. Building on the traditional Cobb–Douglas production function, water resources, land, and energy are simultaneously incorporated as production factors for the first time. At the national level, data from 1949 to 2023 are used, while at the regional level, data from 1978 to 2023 are applied. The analysis examines the dynamic evolution of the contributions of multiple factors to the development of primary, secondary, and tertiary industries across a long time span. It further explores the changing relationship between resource factor contributions and economic growth, and evaluates regional differences in factor contributions from the perspective of water–land resource matching, thereby providing a reference for resource allocation under China’s high-quality development goals.

2. Materials and Methods

2.1. Multifactor Production Model

The C-D production function is widely used to represent the relationship between the output and input factors. In this study, the specific functional form is as follows:
Y = A L α K β W δ E χ L a ε
where Y represents economic output, is indicated by the output of primary, secondary, and tertiary industry. L represents labor input. K represents capital input. W represents the amount of water resources invested in production. E represents energy input. La represents the amount of land resources invested in production. α represents labor elasticity, β represents capital elasticity, δ represents water resources elasticity, χ represents energy elasticity, and ε represents land elasticity, with respect to the output of primary, secondary, and tertiary industry.
We take the logarithm and normalize the variables to transform the function:
l n Y = α l n L + β l n K + δ l n W + χ l n E + ε l n L a + μ
Here, μ = lnA represents the stochastic error term, accounting for unobservable or difficult-to-quantify influences.
The regression coefficients are then standardized:
b = b × S / S Y
Here, b denotes the unstandardized coefficient, and b′ is the standardized coefficient. S is the standard deviation of the independent variable, and SY is the standard deviation of the dependent variable Y.
This study employs ridge regression, a modified form of ordinary least squares estimation, to address multicollinearity and coefficient instability commonly encountered in linear regression. By sacrificing unbiasedness and tolerating a controlled loss of information and precision, this regression type produces more stable and practically meaningful coefficient estimates [27].
Equation (2) is generalized as follows:
Z = X λ + μ
Here, X = [lnL, lnK, lnW, lnE, lnLa] is the row matrix of the independent variables, Z is the dependent variable matrix, and λ is the column matrix of the elasticity coefficients to be estimated.
λ ^ ( k ) = ( X T X + k I ) 1 X T Z
Here, λ ^ ( k ) denotes the ridge regression estimate of the coefficient matrix; I is an identity matrix of the same dimension as XTX; and k is the ridge parameter, ranging between 0 and 1. A larger k value more effectively mitigates multicollinearity but may reduce the model’s goodness of fit. Typically, k is set to the smallest value when the regression coefficients stabilize sufficiently.

2.2. Regional Division

We analyze data from 31 provincial-level administrative regions in China (excluding the Hong Kong and Macao special administrative regions and Taiwan). The country is divided into 11 research regions (Figure 1), considering watershed divisions, geographical location, climatic differences between the north and south, and existing industrial structures. Research zone 11 is located on the first step of China’s topography, including the source areas of the Yangtze River, the Yellow River, and the Lancang River. It is focused on ecological conservation and exhibits relatively lagging economic development. Research zones 4 and 10 are situated in Northwest China, covering the upper and middle reaches of the Yellow River and inland river basins. These vast regions serve as major reserve areas for developing arable land but experience relative water scarcity. They are also designated as major receiving areas for the proposed Western Route of the South-to-North Water Diversion Project. Research zones 2 and 3 are primarily located in the North China Plain, encompassing the Hai River Basin and the middle and lower reaches of the Yellow River. These areas are economically developed, topographically flat, and water-deficient. They serve as key receiving areas for the Eastern and Central Routes of the South-to-North Water Diversion Project. Research zones 5, 7, and 8 fall within the Yangtze River Basin. These regions are rich in water resources and economically prosperous, forming vital growth poles in China’s national economy. Research zone 6 lies in southwest China and includes parts of the Southwest River System, the Pearl River Basin, and the Wujiang River, a tributary of the Yangtze River. This region functions as a strategic gateway for exchanges with South Asian countries. Research zone 9 is located along the southeast coast and covers parts of the Pearl River Basin and the Southeastern River Basins. This region has significant locational advantages and is economically advanced. Research zone 1 is situated in the Songliao Plain, within the Songhua and Liao River Basins, and is focused on primary and secondary industry development.

2.3. Data Sources

Data are sourced from the China Statistical Yearbook, China Water Resources Bulletin, China Urban and Rural Construction Statistical Yearbook, China Labor Statistical Yearbook, provincial and municipal statistical yearbooks, and the National Bureau of Statistics website. Based on data availability, the national-level analysis covers the 1949–2023 period, and the regional analysis for the 11 research zones covers the 1978–2023 period. The national-level study includes all 31 provincial-level administrative regions of mainland China, excluding Taiwan Province, the Hong Kong Special Administrative Region, and the Macao Special Administrative Region. To address data gaps in specific years, interpolation methods were employed.
According to the Cobb–Douglas production function, this study considers the labor inputs, capital inputs, energy inputs, water resource inputs, and land inputs of primary, secondary, and tertiary industry as the basic input indicators, while the economic outputs of the three industries serve as the output indicators. Specifically, the added values of primary, secondary, and tertiary industry are selected as the respective output indicators. All values are converted into comparable prices for the year 2023 to eliminate the effects of inflation. The labor inputs of each industry are adjusted using the average years of education of the employed population, thereby obtaining more accurate measures of labor quality. The capital inputs of the three industries are measured by their respective fixed asset investments, which are converted to constant 2023 prices to account for inflation. For water resources, the water resources inputs of the three industries are estimated by considering losses during transfer, distribution, and utilization; specifically, the effective irrigation coefficient of farmland, the industrial water reuse rate [28], and the leakage rate of public water supply networks are used to calculate water use in primary, secondary, and tertiary industry, respectively. The energy inputs, reflecting the level of mechanization and automation, are measured by the total energy consumption of each industry [12]. The land inputs are measured by cultivated land area for primary industry, industrial land area for secondary industry, and the combined area of land used for public administration and services, commercial services, logistics and warehousing, transportation, and public facilities for tertiary industry. All data are obtained from the above-mentioned statistical yearbooks and the official website of the National Bureau of Statistics. In particular, water use data for 1949 and 1965 represent estimated values, while the 1993 figures are obtained from Water Supply and Demand in China in the 21st Century. Data for 1980, 1990, and 1995 are sourced from the first-stage survey and assessment outcomes of the National Comprehensive Water Resources Plan. From 1997 onward, data are drawn from the China Water Resources Bulletin, with values for the intervening years derived through interpolation.

3. Results

3.1. Temporal Dynamics of Fundamental Variables

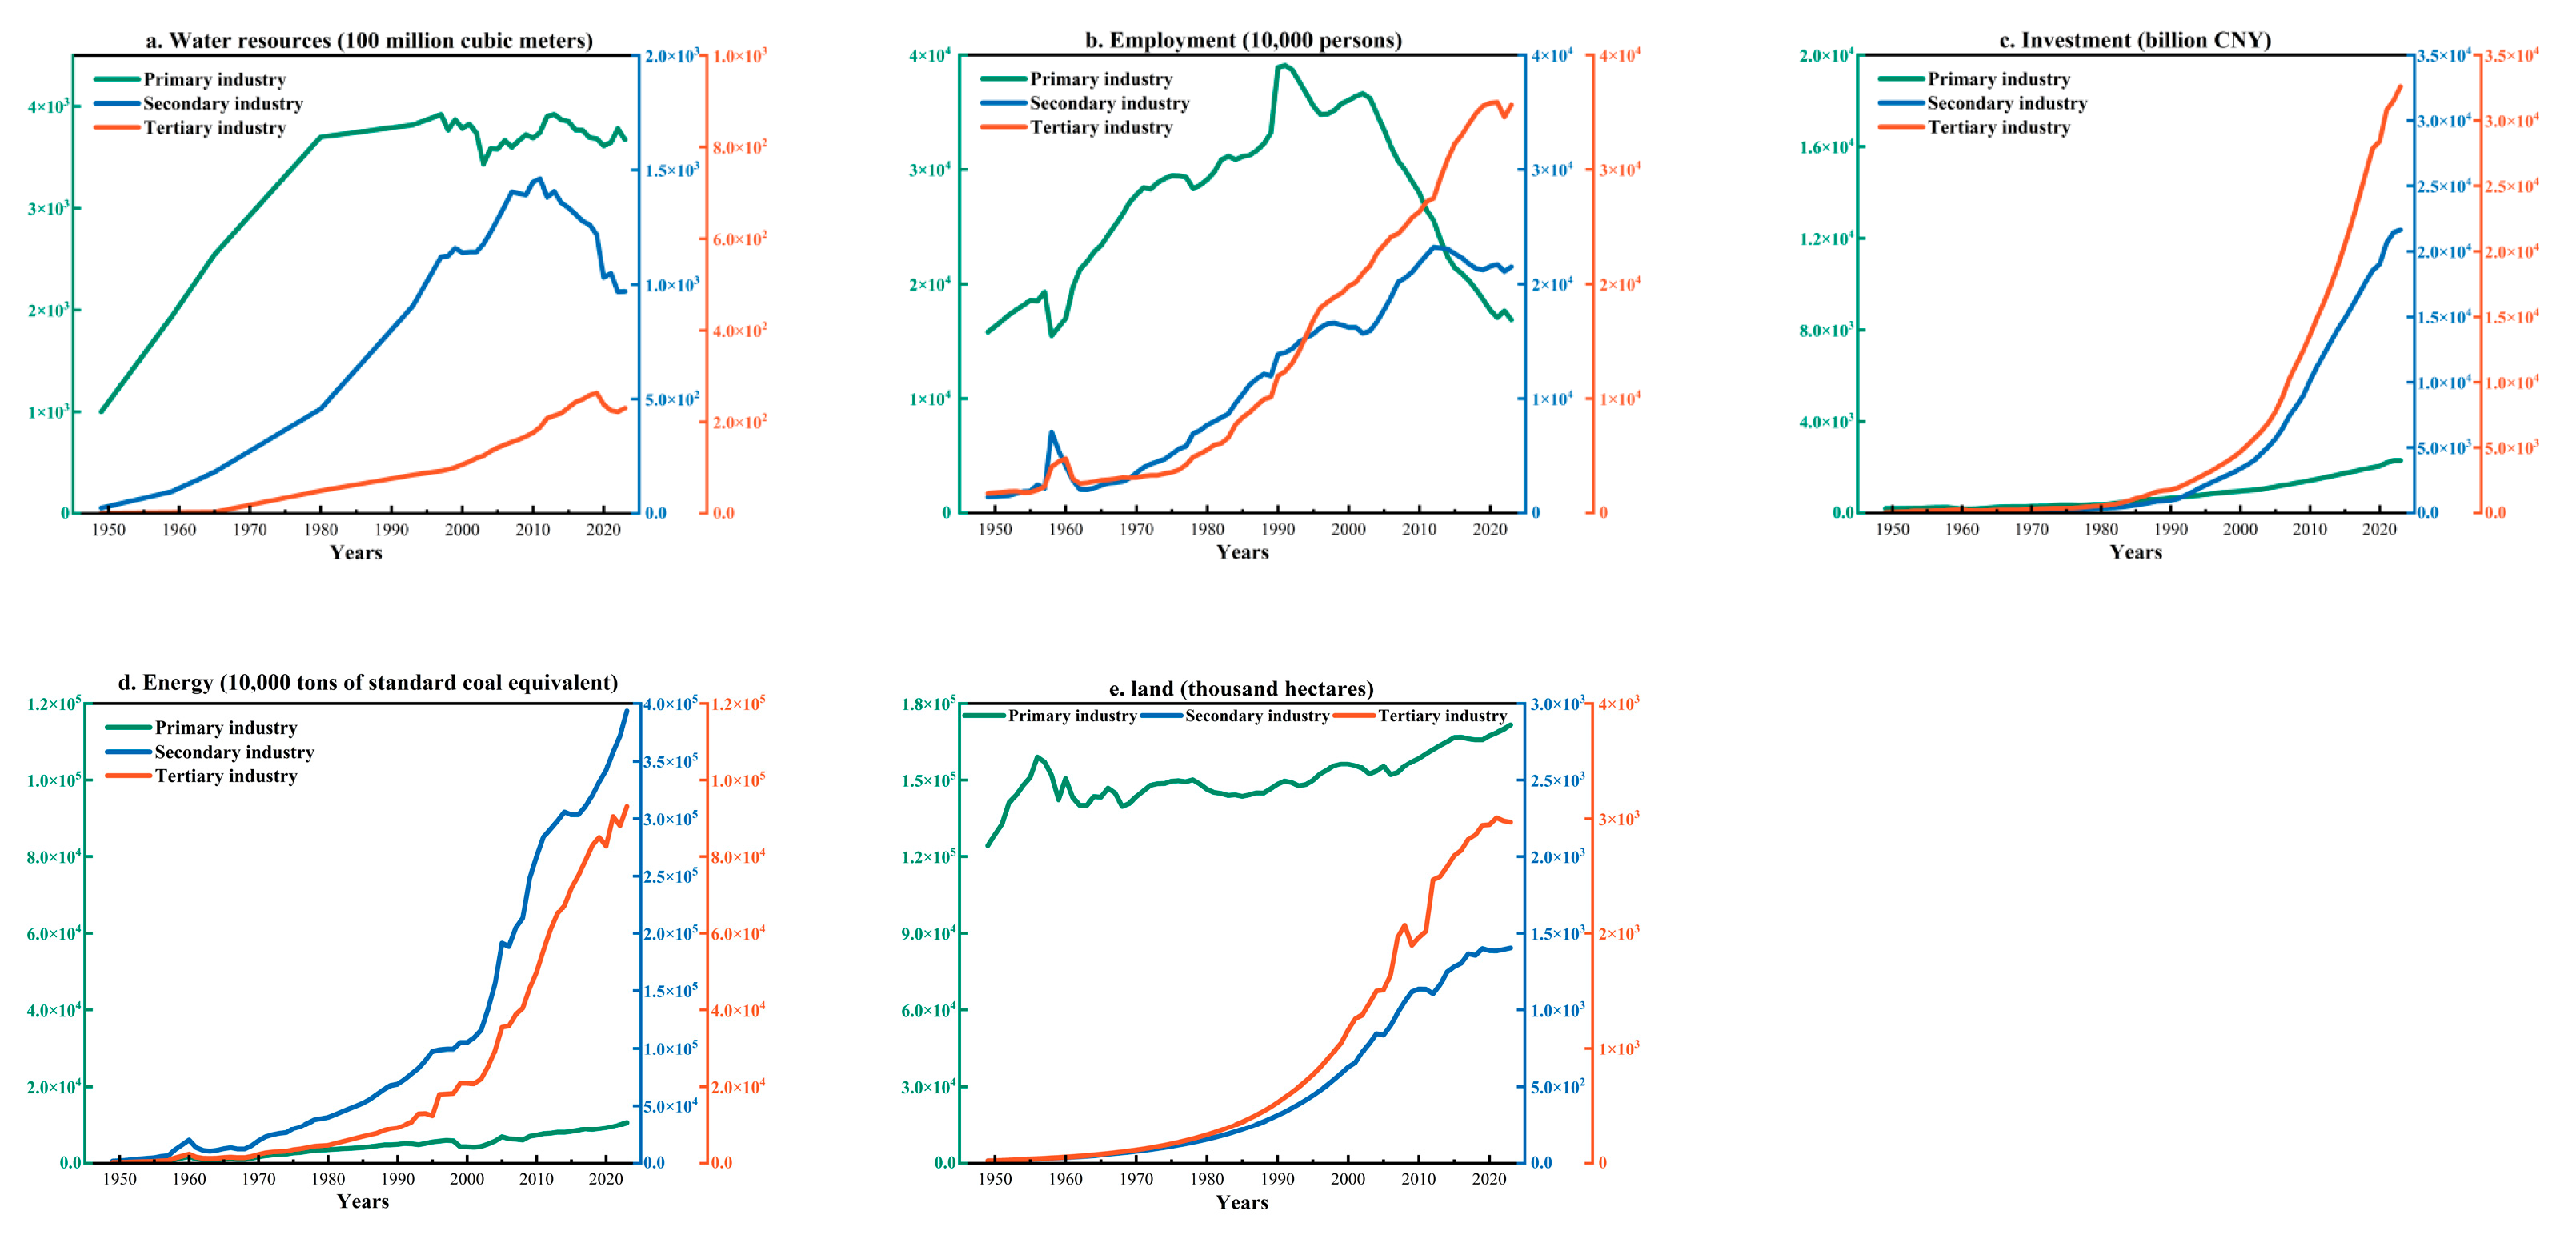
Over the past several decades, China’s input of production factors has exhibited distinct industrial and temporal characteristics. Before 2000, most of the labor force is concentrated in primary industry, accounting for over 50% of the total employment; however, labor demand in agriculture declines rapidly with the advancement of agricultural modernization. Secondary and tertiary industry surpassed primary industry in 2011 and 2014, respectively, in terms of labor absorption. Secondary industry has consistently exhibited the highest energy demand, driven by ongoing industrialization. Conversely, as of 2023, primary industry demand is approximately 1/37 that of secondary industry and 1/9 that of tertiary industry.
Regarding water resources, primary industry has the highest and continuously increasing demand. This demand stabilizes after 2010, accounting for approximately 70% of the total water use in the economy and society. Secondary industry experienced a growth-then-decline pattern, peaking in 2011 before rapidly decreasing. With the acceleration of urbanization, water demand in tertiary industry has continuously trended upward. Regarding investment, tertiary industry commands the largest share, particularly in the real estate, finance, and high-tech industries. Investment growth in secondary industry has been relatively moderate, while primary industry receives the least investment and has the slowest growth. Regarding land use, primary industry has the largest scale of land input, primarily to ensure food security; however, its growth rate is modest. Since the 1990s, land input in secondary and tertiary industry has proliferated with urbanization and economic restructuring, contributing to sustained land use expansion. Figure 2 presents the details.

3.2. Estimation Results of the Multifactor Production Model

Taking the three major industries at both the national level and across 11 research regions as the units of analysis, this study evaluates the contributions of key production factors to industrial economic growth. The constructed model incorporates five key factors, explains more than 90% of the variation in industrial outputs across regions, and passes statistical significance tests, demonstrating a satisfactory model fit. Appendix A (Table A1) presents detailed parameter estimation results at the national level.

3.3. Evolution of Factor Contributions at the National Level

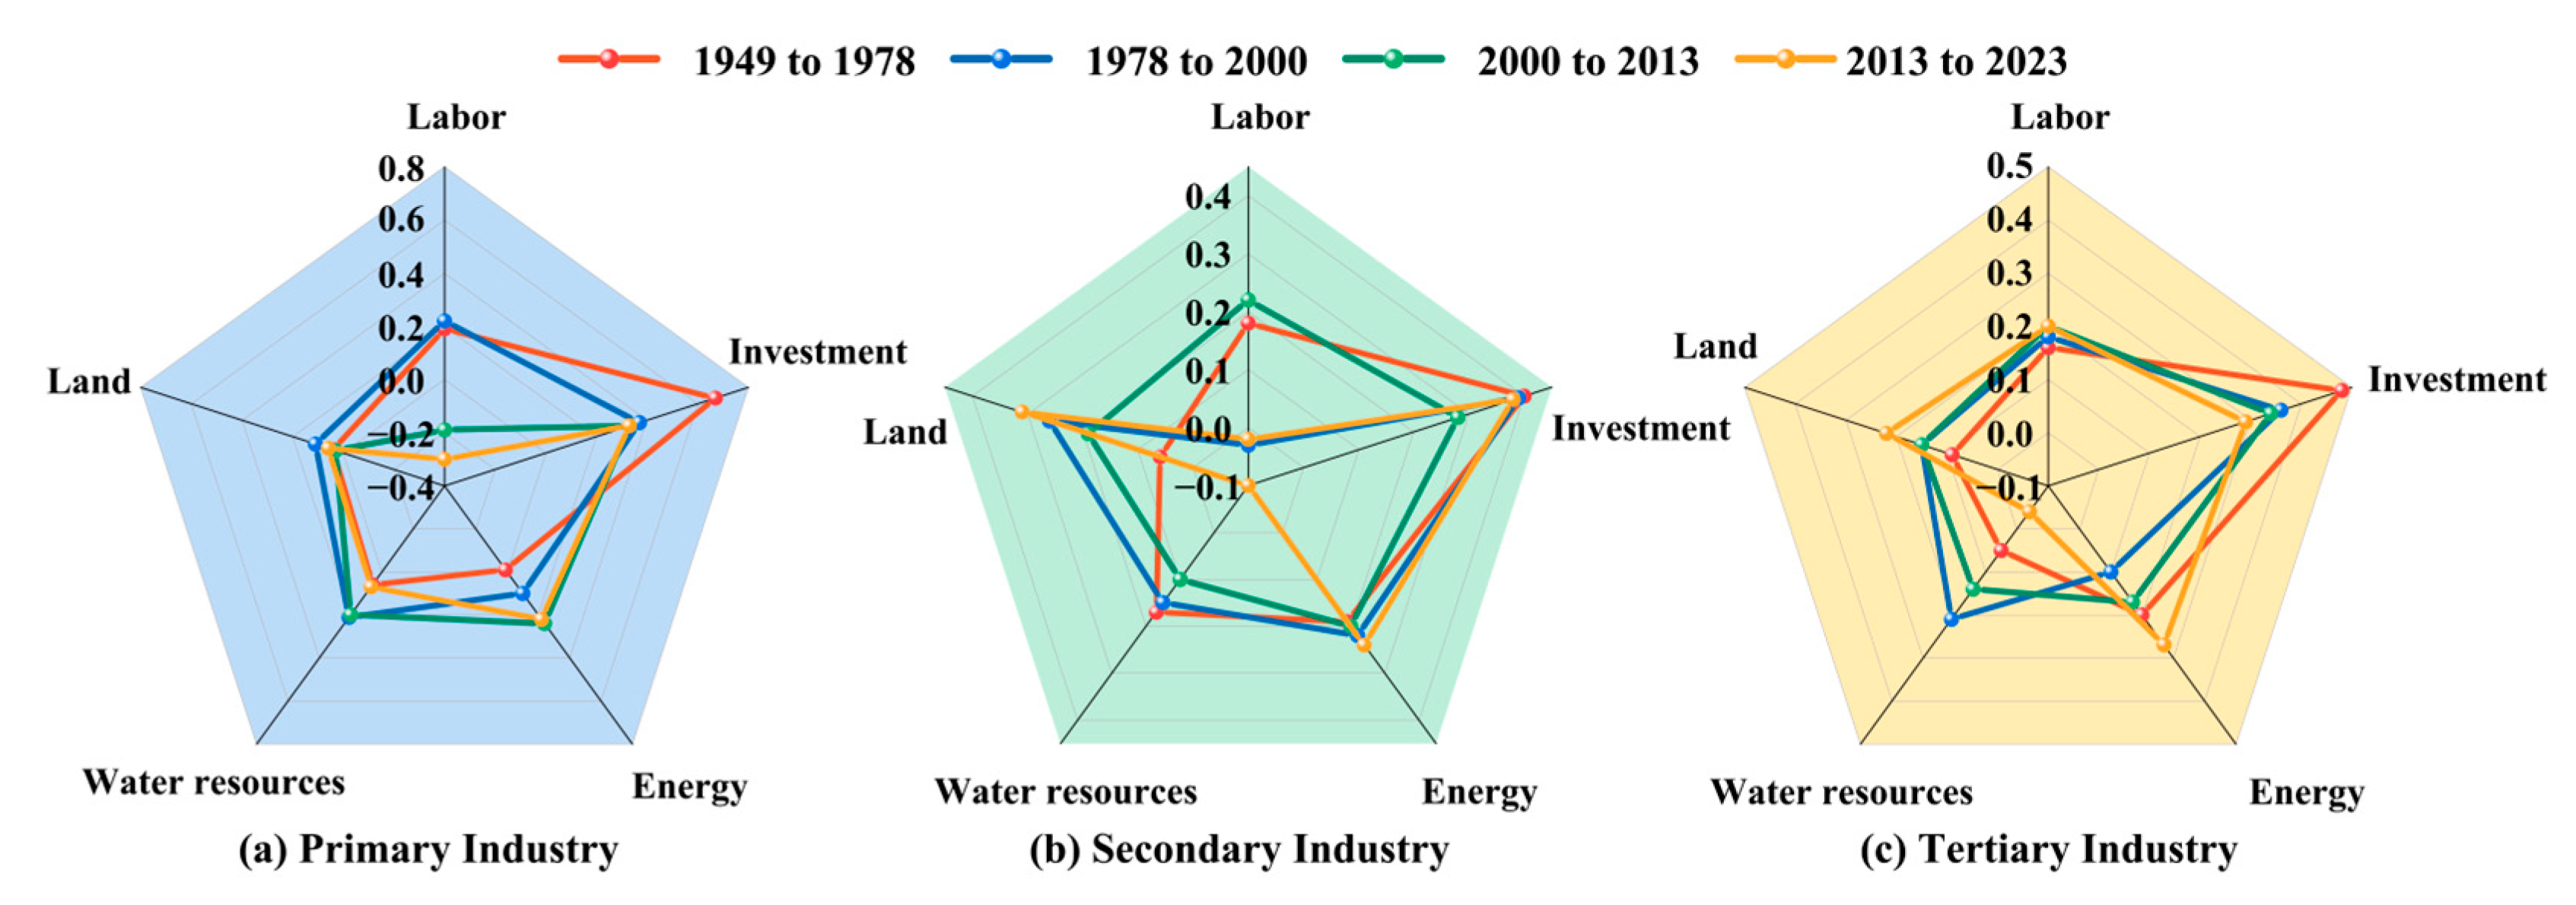
At different stages of China’s economic development, the driving contributions of production factors to economic growth have undergone significant shifts. From 1949 to 2023, the roles of labor, land, investment, energy, and water resources in primary, secondary, and tertiary industry have gradually diverged (Figure 3).

3.3.1. Evolution of Factor Contributions

  • Evolution of Factor Contributions in the Primary Industry
Primary industry development has shifted from dual reliance on investment and labor to dual reliance on investment and energy. Water resources and arable land have consistently served as important drivers of agricultural development, while the labor contribution has gradually diminished due to mechanization [29]. However, between 1949 and 1978, water conservancy infrastructure was relatively underdeveloped, and primary industry growth relied heavily on investment and labor. After 1978, farmland irrigation and water conservancy infrastructure expanded substantially, making water resources the third most important contributing factor after investment and labor. During the same period, with the implementation of the household contract responsibility system, the output elasticity coefficient of land reached its peak, ranking below the contribution of water resources but above that of energy. Since the beginning of the 21st century, the advancement of modern agriculture has facilitated the large-scale application of mechanization, and the role of energy has gradually increased, becoming the second most important driver after investment. Irrigation infrastructure also expanded, further increasing the contribution of water resources, while the elasticity coefficient of labor turned negative. Since 2013, stringent water resource utilization caps have been implemented in northern China [30]. Thus, the contribution of water resources to primary industry has declined to levels similar to those seen in 1949–1978, with an elasticity coefficient of 0.07. Investment and energy have since become the dominant drivers of primary industry development.
2.
Evolution of Factor Contributions in the Secondary Industry
The contribution of various factors to secondary industry has shifted from multifactor synergy to a triadic model driven by investment, energy, and land. Investment remains the primary driver of growth, while the output elasticity of energy has steadily increased with industrial automation and intelligentization. Land elasticity has also risen, supported by new land use policies that promote more intensive utilization [15]. Between 1949 and 1978, the contribution of water resources was comparable to that of labor, ranking just below investment and energy; however, its contribution has since steadily declined. Particularly after 2013, with stricter water resource assessments and negative list-based management mechanisms being implemented, its contribution turned negative, becoming a limiting factor for industrial growth. The output elasticity of labor has fluctuated significantly, with two notable periods of decline. The first period (1978–2000) was marked by the rapid expansion of investment in China’s secondary industry. At this time, the trend of capital substituting for labor became pronounced, adversely affecting employment [31]. The second occurred after 2013, as automation and intelligent manufacturing replaced traditional labor, causing labor’s contribution to turn negative.
3.
Evolution of Factor Contributions in the Tertiary Industry
The development of tertiary industry has shifted from being investment-driven to being driven by a balanced mix of factors, while investment has remained a critical driver of its growth. energy, land, and labor contributions have all shown upward trends. As the service industry evolves toward higher value-added and technology-intensive activities, the importance of energy in modern services has become increasingly prominent. Furthermore, the continued improvement in land use efficiency has facilitated tertiary industry development. Labor has consistently been a major contributing factor; with the rise of information technology and the digital economy, tertiary industry has demonstrated clear advantages in lowering entry barriers and stabilizing employment [32,33]. Additionally, improved educational attainment and scientific and technological advances have continuously enhanced labor productivity [34,35]. The contribution of water resources has exhibited an inverted U-shape. In 1978–2000, it ranked second among all input factors; however, it then declined rapidly to near-zero levels, reflecting the subordinate role of water resources in the development of tertiary industry.

3.3.2. Analysis of the Underlying Causes of Factor Contributions

Among the five production factor categories examined in this study, only water resources and labor exhibited negative elasticity coefficients; however, the reasons underlying their negative values differ. The negative contribution of labor stems primarily from factor substitution, which has diminished labor demand. The negative contribution of water resources is mainly attributed to supply constraints, which have increasingly hindered economic development.
Labor’s decreasing contribution to national economic growth is largely attributable to its substitutability with energy. In the agricultural sector, the widespread adoption of agricultural machinery, such as tractors, seeders, and harvesters, has gradually shifted labor to secondary and tertiary industry. Informatization, automation, and intelligent manufacturing advancements have further reduced labor requirements in the industrial sector. Consequently, the contribution of labor to the development of primary and secondary industry has steadily declined, turning negative during 2013–2023. This essentially reflects the weakening role of labor due to insufficient demand. Tertiary industry is generally labor-intensive. The recent proliferation of the logistics sector has driven the increasing contribution of labor within tertiary industry.
Unlike labor, water resources complement other production factors and their contributions theoretically vary in tandem. Data analysis reveals a turning point in 2013. Before 2013, water resources played a significant role in driving economic growth; however, after 2013, the elasticity coefficients of water resources for all industries declined, reflecting an emerging inhibitory effect on economic development. The reasons are twofold. First, after a period of rapid economic growth, water resource exploitation in some regions has reached its limit. Insufficient supply has constrained production. Second, since 2013, China has implemented its strictest water resource management. More rigorous assessment requirements have been enforced. Some existing enterprises were placed on negative lists or elimination rosters, and some new industrial projects could not proceed due to water shortages. As a result, the restrictive effect of water resources on industrial development has intensified.

3.4. Regional Differences in the Contribution of Factors to Economic Growth

Capital, labor, and energy have relatively high mobility among the five production factor categories and can be redistributed across regions based on policy directives and economic demand. As the mobility of land and water resources is limited, macro-level policy interventions and major infrastructure projects are required to achieve resource balance. This section analyzes how water and land resources drive national economic development. We assess the degree of coordination between water and land resources and evaluate development trends for formulating national policies on resource allocation and management.

3.4.1. Changes in the Contribution of Water and Land Resources to the Primary Industry

1.
Trends in the Contribution of Water Resources.
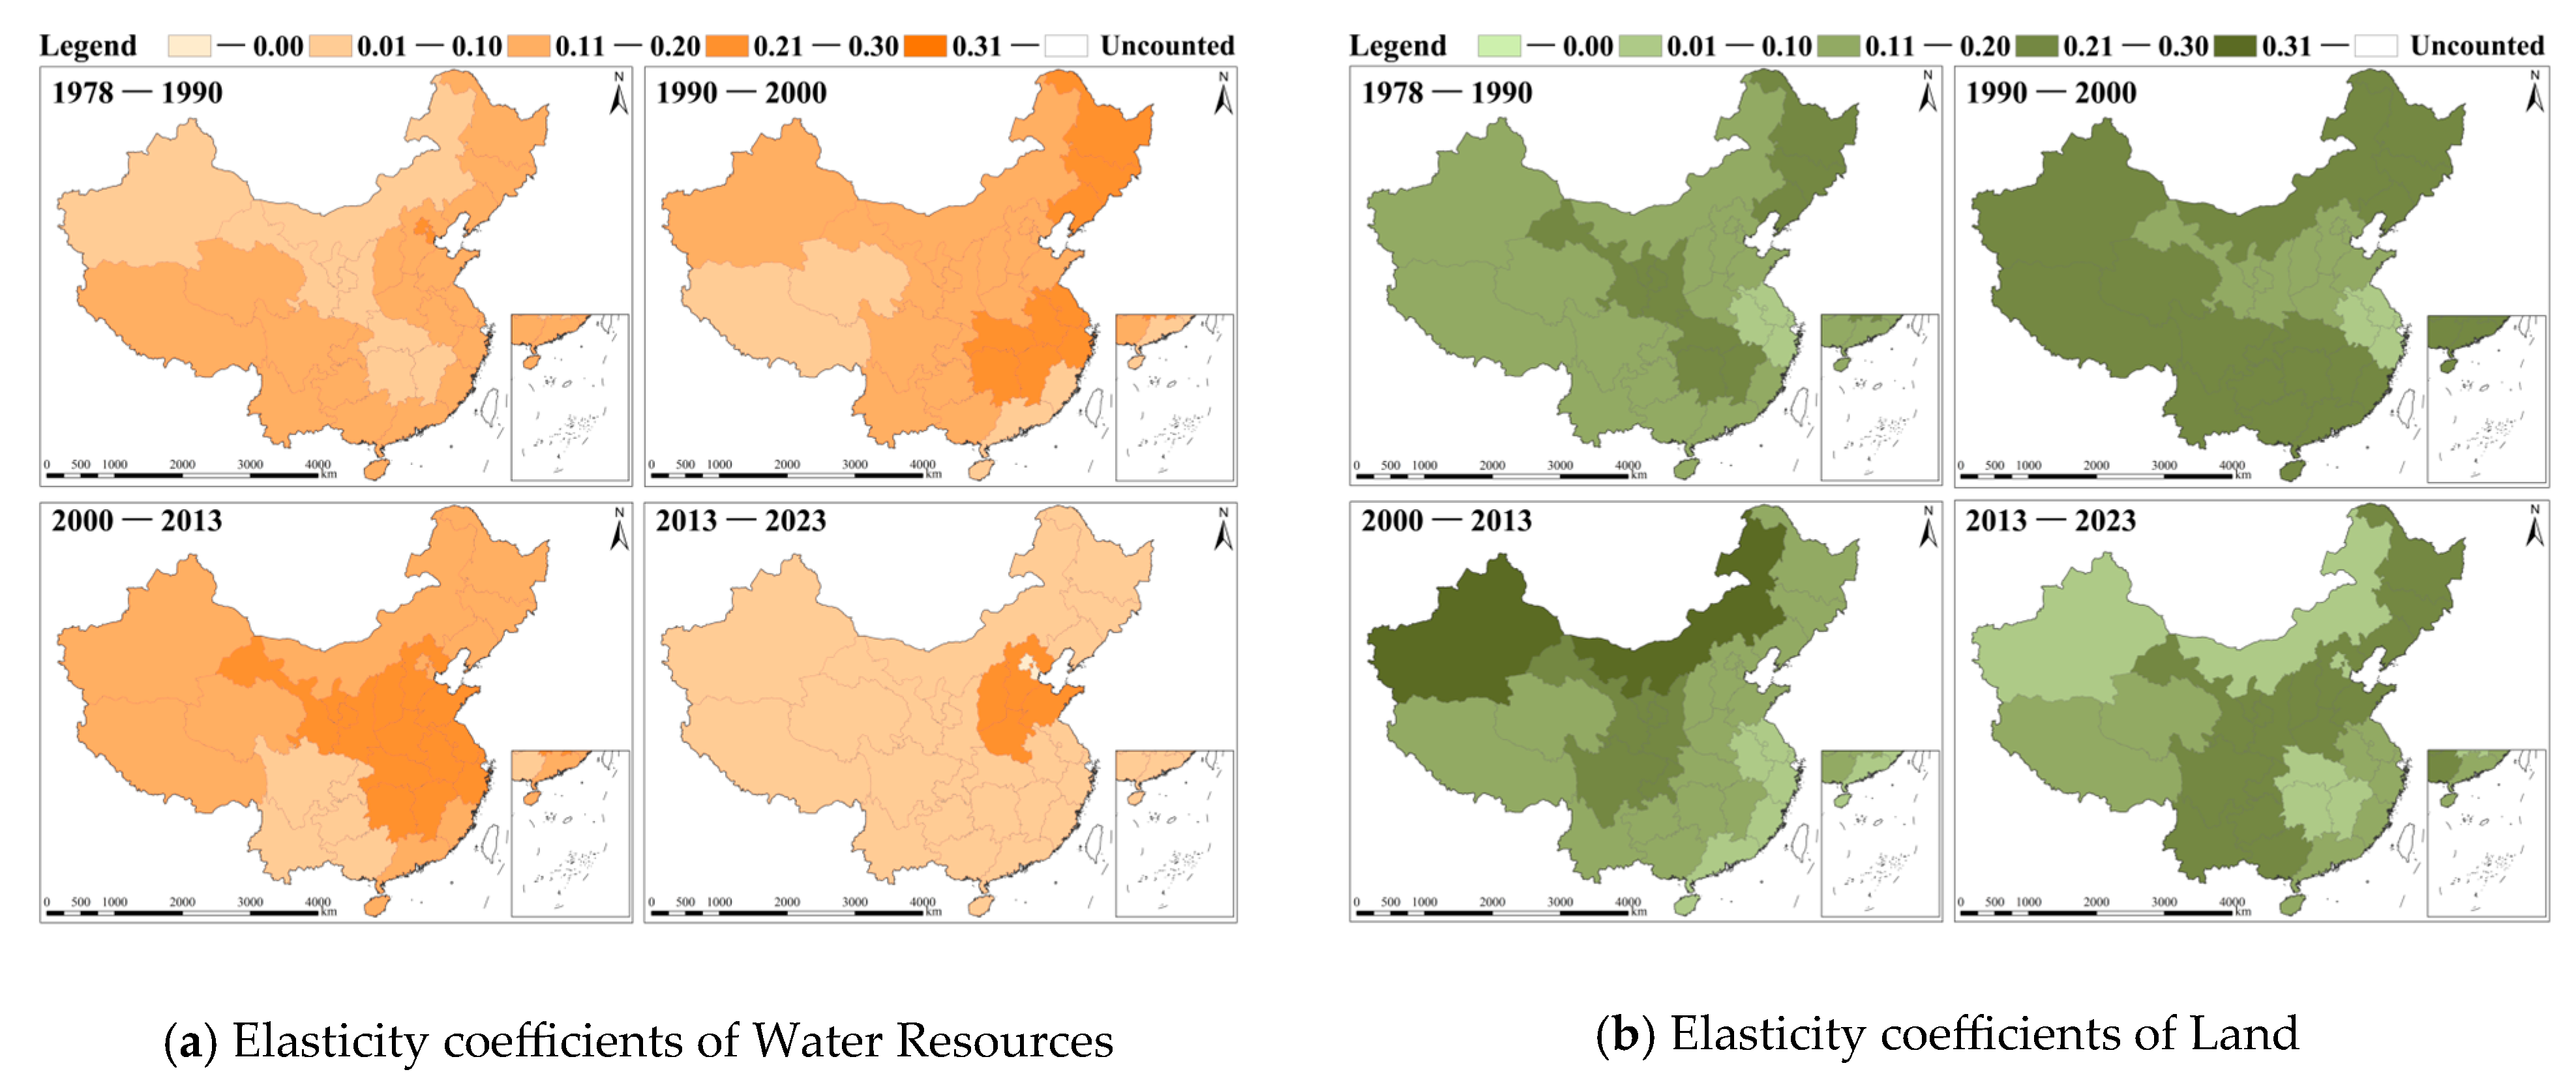
The contribution of water resources to primary industry has become increasingly differentiated across regions, remaining generally stable in the south but showing a widespread decline and significant constraining effect in the north (Figure 4a). Before 2000, the contribution of water resources to primary industry showed little regional variation, with all regions demonstrating positive driving effects. After 2000, the divergence between the northern and southern regions became increasingly apparent. In the southern provinces, the contribution of water resources fluctuated slightly but remained generally stable; however, northern provinces experienced a widespread decline, with the sharpest decreases observed in the Yellow River Basin and the Northeast, where water resources became a limiting factor for primary industry development. From 1978 to 1990, water resources made significant contributions in Research zones 11, 8, and 9, with elasticity coefficients exceeding 0.2. In 1990–2000, the highest contributions were observed in Research zones 10, 5, 9, 8, and 7, with the elasticity coefficients in Research zones 8 and 7 surpassing 0.3. Between 2000 and 2013, the contribution in Research zones 2 and 3 turned negative, indicating that water had become a limiting factor for primary industry development. From 2013 to 2023, this constraining effect expanded to the upper and middle reaches of the Yellow River and to Research zone 1; however, in Research zones 2, the South-to-North Water Diversion Project significantly improved water substitution and supply security. This project led to a recovery in the contribution of water resources to primary industry, which returned to positive values.
2.
Trends in the Contribution of Arable Land
Land’s contribution to primary industry has exhibited increasingly pronounced spatial and temporal differentiation, and in 2013–2023 its spatial distribution closely aligned with the national pattern of reserve arable land (Figure 4b). While contribution has gradually increased in the northeastern and northwestern regions, most other regions have shown initial increase followed by decline. By 2013–2023, a spatial pattern had emerged in which the contribution of land to agriculture was stronger in the north and south but weaker in the central region. In the early years of China’s reform and opening-up, primary industry growth relied primarily on productivity improvements; land contributed little to overall industrial growth. Subsequently, as the advantages of water–land resource matching became prominent, the contributions of land and water resources increased simultaneously. In 1990–2000, Research zones 3 and 6 experienced the most significant increases in land contribution. Later, with the utilization of reserve arable land, the constraining effect of land on primary industry development began to emerge. By 2013–2023, land had become a limiting factor in several regions, including Research zones 3, 5, 7, and 8. The spatial distribution of land contribution during this period largely corresponded to the national distribution of reserve arable land [36].
3.
Assessment of Key Agricultural Development Zones Based on Water-Land Resource Matching
Based on the abovementioned analysis results and the distribution of China’s reserve arable land, agricultural areas were classified into suitable development zones, potential development zones, and unsuitable development zones (Table 1). Suitable development zones include Regions 6 and 9, where the contributions of water and land resources to industrial development are relatively high and the matching between water and land resources is favorable; however, these areas possess only a limited reserve of arable land (only 2.8% of the national total) [36]. Consequently, the potential for future agricultural development in these regions is low.
Potential development zones include Research zones 1, 10, and 4. These areas possess abundant land resources and represent the primary distribution zones of China’s reserve arable land [36], accounting for approximately 63% of the national total. Moreover, Research zones 1 and 10 recorded the highest land contribution to agricultural development during the study period, and Research zone 4 also exhibited a positive land contribution; however, limited water resources continue to hinder agricultural development in these regions. Enhancing primary industry’s water supply capacity, particularly by expanding the national water network, is essential to unlock the production potential of land resources and promote agricultural development.
Unsuitable development zones include Research zones 11, 5, 7, 8, 2, and 3. Research zone 11 possesses favorable water and land resource conditions, which can contribute substantially to agricultural development. However, Research zone 11 is the source area of the Yangtze River, the Yellow River, and the Lancang River-one of China’s most important ecological conservation zones. Its high altitude and cold environment are unsuitable for large-scale grain crop cultivation. Research zones 5, 7, 8, and 2 have relatively abundant water resources, with water contributing significantly to agricultural development. However, the contribution of land resources in these regions is relatively low, and reserve arable land is limited (only 3.2% of the national total). The immobility of land resources considerably constrains primary industry development in these areas. In Research zone 3, water and land resources are significant bottlenecks for primary industry development. Water resource exploitation has sometimes exceeded the region’s ecological carrying capacity, and reserve arable land is similarly scarce (only 3.3% of the national total) [36].

3.4.2. Changes in the Contribution of Water and Land Resources to the Secondary Industry

1.
Trends in the Contribution of Water Resources
In secondary industry, water resources have shifted from serving as a supportive factor to becoming a constraint (Figure 5a). After implementing the most stringent water management regime in 2013, China strictly regulated industrial water use. In some regions, the contribution of water resources turned negative, becoming a limiting factor for industrial development. From 1978 to 1990, water resources provided critical support for industrial growth nationwide, with elasticity coefficients generally exceeding 0.1. In 1990–2000, the contribution of water resources further increased across regions, remaining a core driving factor. Between 2000 and 2013, the contribution of water resources declined across most parts of the country (except for slight increases in Research zones 3 and 4), and water scarcity emerged as a bottleneck for industrial development. In 2013–2023, the constraining effect of water resources on industrial growth expanded with the further strengthening of water management policies. Northern provinces experienced significant declines in contribution, with regions along the Yellow River Basin and Research zone 10 being particularly affected. Water scarcity has become a major limiting factor for industrial production. Nevertheless, in Beijing and Tianjin, the South-to-North Water Diversion Project has significantly enhanced water security, leading to a partial recovery in the contribution of water resources.
2.
Trends in the Contribution of Land
The contribution of land to secondary industry exhibits marked spatial heterogeneity, with a current pattern of being stronger in the south and weaker in the north (Figure 5b). In the central-western regions (Research zones 4, 5, 6, 9, and 11), the contribution fluctuates, initially increasing, then decreasing, and subsequently rebounding. Conversely, the contribution initially increases before continuously declining in the northern and central-eastern regions (Research zones 1, 2, 3, 7, 8, and 10). In 1978–2000, in the early stages of China’s industrialization, low-cost industrial land and extensive land use practices significantly promoted the rapid growth of secondary industry, resulting in the substantial contribution of land to industrial development. In 2000–2013, contributions declined across most regions, with greater contributions in the eastern region and weaker contributions in the western region. In 2013–2023, land contributions in the northern and eastern regions continued to decline, whereas contributions in the southwestern regions increased markedly, forming a pattern of stronger contributions in the South and weaker contributions in the North.

3.4.3. Changes in the Contribution of Water and Land Resources to the Tertiary Industry

1.
Trends in the Contribution of Water Resources
The contribution of water resources to tertiary industry has followed a trajectory from nationwide support to regional differentiation before eventually declining overall (Figure 6a). In 1978–2000, water resources significantly contributed to tertiary industry development. Water resources played an important supporting role in transportation, tourism, and commerce. Regional differences were minimal, and all research zones showed positive driving effects. In 2000–2013, the spatial distribution of water resources contribution began to diverge. Contributions increased in the central-eastern and coastal regions. From 2013 to 2023, the overall contribution of water resources to tertiary industry declined and their supporting effect weakened, with tertiary industry growth becoming more dependent on capital and other inputs.
2.
Trends in the Contribution of Land
Land’s contribution has shown an overall upward trend, reflecting its growing importance as a supporting factor for tertiary industry development (Figure 6b). In 1978–1990, the contribution of land to tertiary industry was relatively low. Land was primarily concentrated in industrial and agricultural development, while the commercial and service sectors remained underdeveloped. From 1990 to 2000, with the acceleration of urbanization, the significance of land increased in sectors such as commerce, logistics, and real estate. Between 2000 and 2013, the contribution of land declined in the southern regions while rising in the northern regions, forming a pattern of strong contributions in the North and weak contributions in the South. In 2013–2023, land contributions increased significantly in the central regions, including Research zones 1, 3, 4, 5, and 6, forming a pattern of strong contributions in the Center and weak contributions in both the North and South.

4. Discussion

This study incorporates water resources, energy, and land into the classical C-D production function, constructing a production model that integrates material, human, and natural capital. The study analyzes the role of water resources in economic growth and the issue of water–land resource matching, with extensions made across temporal and regional scales. Building on this foundation, this section explores the reasons underlying changes in factor contributions and examines their relevance to policy.

4.1. Drivers Behind the Shifting Role of Water Resources in Socioeconomic Development

The findings indicate that the contributions of production factors to socio-economic development exhibit clear stage-specific characteristics and vary dynamically with resource supply conditions. Before 2000, water resources consistently played a positive role in economic growth at both the national and regional levels, with the strongest effect observed in agriculture. Since the beginning of the 21st century, the contribution of water resources has become differentiated and has shown an overall decline. For the primary sector, contributions in southern provinces fluctuated but remained relatively stable, while those in northern provinces generally decreased, with the most significant declines observed in the Yellow River basin and Northeast China. For the secondary sector, water contributions decreased in most regions, and water scarcity emerged as a major constraint on industrial development. At the same time, the economic structure gradually shifted toward the tertiary sector, which surpassed the primary and secondary sectors in 2012 to become the dominant driver of growth. Because the water use intensity per unit of output in the tertiary sector is much lower than in the other two sectors, overall water pressure was alleviated. However, in northern regions, water use had already reached or exceeded the exploitable limit, meaning that structural optimization did not remove supply constraints.
Between 2013 and 2023, water contributions in the primary and secondary sectors turned negative in several regions. This outcome may suggest that China has entered a stage of decoupling between socio-economic development and water use. Nevertheless, the timing of this decline coincides with the implementation of the most stringent water management policies, reinforced conservation measures, and enhanced protection programs. Since 2013, China has enforced the “Three Red Lines” policy, strictly controlling both total water use and water use intensity [30,37]. Under this policy framework, the proportion of industrial water use in Ningxia and Inner Mongolia accounted for only 7.6% and 7.3% of total regional water use [37], respectively, constraining the development of energy and chemical bases. In Hebei Province, dual pressures from water constraints and environmental regulations led to a major campaign against the dyeing industry in 2017, which directly disrupted the supply chain and reduced the total output value of the textile and apparel industries by 69.9% and 63.4%, respectively. Thus, the negative contribution of water resources reflects limited supply capacity and policy restrictions, rather than a natural trend resulting from structural optimization [38].

4.2. Types of Water Resource Constraints

Since 2013, the contribution of water resources has shifted from positive to negative. Water constraints can be divided into two dimensions: natural scarcity and policy regulation. Their combined effects lead to significant differences in the pathways and intensities by which water limits industrial development. Industries with negative water contributions are mainly the primary and secondary sectors, especially in northern China. In the primary sector, research regions 1, 3, and 4 (all located in the north) show negative contributions, indicating that water has become a key bottleneck for agricultural growth. Northern river basins have reached or exceeded critical thresholds of water exploitation. The development rates are 53.4% in the Yellow River Basin, 51.5% in northwestern rivers, and 45.2% for northern basins as a whole, far above the internationally recognized 40% limit. This means that most of the potential for water development has been exhausted, and the natural supply capacity for agricultural water is severely insufficient [39,40]. At the same time, weak monitoring and outdated control technologies reduce the effectiveness of policy regulation on agricultural water use. As a result, water constraints in the primary sector are dominated by natural scarcity. In the secondary sector, water constraints are mainly driven by policy regulation. The effect is particularly evident in the Yellow River Basin and the Inner Mongolia-Xinjiang region. Industrial water use accounts for 16.7% of total national water consumption but only 7.2% in northern China, well below the national average. This difference results from strict policy interventions under conditions of scarcity. High-water-consuming projects face stringent approval restrictions, while industries are required to adopt water-saving technologies and recycling systems [30]. With full-process monitoring and metering in place, industrial water use is subject to stronger enforcement and broader coverage compared with agriculture. Thus, the negative contribution of water resources in the secondary sector is mainly policy-driven. The tertiary sector shows a different pattern. Services dominate this sector, and water consumption per unit of output is far lower than in the other two sectors. Its water supply is also integrated with domestic water supply, making it the most secure sector in terms of provision. Although water contributions to the tertiary sector show a declining trend across all regions, it remains uncertain whether this indicates a decoupling of water input and output growth. Further observation of future water-use data is required.

4.3. Policy Recommendations for Regional Development Based on Water-Land Resource Coordination

Under the goal of ensuring national food security, water and land resources are recognized as core factors of socio-economic development. Land is immobile, whereas water resources can be regulated. Therefore, balanced allocation should be achieved by planning the national water network according to land conditions and adopting the principle of “allocating water based on land and tailoring policies to industries” to address water shortages [41].
For primary industry, food security remains the central objective. According to the results in Section 3.4.1, potential development areas are mainly concentrated in Regions 1, 4, and 10 [42]. These areas are rich in land resources and account for about 63% of China’s reserve arable land [36]. Land contributes strongly to primary industry growth in Regions 1 and 4, and the contribution is also positive in Region 10. However, insufficient water supply is a major constraint on agricultural development in these regions. Thus, national water network projects should be utilized to enhance inter-basin transfers and improve regional water allocation, with priority given to securing agricultural water use in these areas [43]. At the same time, high-efficiency irrigation technologies should be promoted, the effective utilization coefficient of irrigation water should be increased, and drought-resistant crop varieties should be developed to unlock land potential and strengthen grain production capacity.
For secondary industry, water constraints arise mainly from policy regulation rather than physical scarcity. Since industrial water use is far lower than agricultural water use, constraints can be alleviated by optimizing the industrial structure and improving water-use efficiency. Recycling, the use of unconventional water sources, and technological retrofitting for water saving should be actively promoted. In regions with adequate water conditions, moderate relaxation of restrictions on industrial water use can help achieve balanced regional development. As secondary industry plays a fundamental role in regional economic stability, policies should be differentiated according to location and resource endowments to promote coordinated allocation of water and land resources, thereby supporting sustainable industrial growth.
For tertiary industry, water and land resources are the basic inputs, while capital, energy, and labor are the key drivers of rapid expansion, with capital playing the leading role. Each region should develop its service sector according to local conditions. In areas where the primary and secondary sectors are constrained by water shortages, the tertiary sector should act as the dominant driver of growth, helping to reduce the adverse impacts of water scarcity on overall economic development.

4.4. Limitations and Future Directions

This study applies the Cobb–Douglas production function to analyze the contributions of capital, labor, energy, water resources, and land to China’s industrial development. However, several limitations remain. Some historical data are missing and therefore are interpolated, which may have introduced uncertainty. Ridge regression is applied to address multicollinearity, but it may yield biased estimates. In addition, the study was unable to fully capture the causal relationship between water resources and economic growth. Future research could adopt causal inference methods to better identify this mechanism. Considering that water resources allocation and utilization in China are increasingly shaped by policy interventions [44], subsequent studies could incorporate policy variables into the analytical framework and shift from the macro industry level toward micro-sector analysis, thereby enhancing explanatory power and practical relevance.

5. Conclusions

This study focuses on water resources as a key production factor, analyzing their long-term trends since the founding of the People’s Republic of China and their impacts on economic growth in different industries. Using the C-D production function, regional economic growth models are constructed to quantitatively examine the contributions of five production factors (investment, labor, energy, water resources, and land) to industrial growth over different historical periods. The main conclusions and policy recommendations are as follows.
First, the contributions of production factors to different industries vary at different stages of development; however, investment has consistently remained the primary driving force across all industries. In primary industry, the development model has shifted from dual dependence on investment and labor to one based on investment and energy, with water resources and land providing fundamental support. Secondary industry has evolved from a multifactor-driven model to a structure primarily supported by investment, energy, and land, while water resources have increasingly constrained industrial development. Tertiary industry has transitioned from an investment-led model to one characterized by a more balanced contribution of multiple factors; investment has remained the dominant driver, whereas the role of water resources has declined.
Second, under the dual constraints of limited natural endowments and strict regulatory controls, water scarcity has become a major limiting factor for economic growth in northern China. After 2013 in particular, the contribution of water resources to industry and agriculture turned negative in most northern regions studied, indicating a constraining effect of water resources on economic growth.
Third, northern China will be a critical region for ensuring national food security, and its development will require strong support from the national water network infrastructure. Regions 1, 10, and 4, where land currently makes significant contributions to primary industry development, have abundant land resources and contain major concentrations of reserve arable land. However, water resource availability remains the primary constraint on agricultural production. Water resources and land are the fundamental production factors for primary industry. Since land resources are immobile, water resources transfer via the national water network is the only viable means to balance regional water and land resources, thereby ensuring stable agricultural production and supply.

Author Contributions

Conceptualization, W.C. and C.Q.; methodology, W.C. and J.Q.; validation, Y.Z., F.H. and C.Q.; formal analysis, W.C.; investigation, J.Q.; data curation, Z.G.; writing—original draft preparation, W.C.; writing—review and editing, C.Q.; supervision, C.Q., Y.Z. and F.H. All authors have read and agreed to the published version of the manuscript.

Funding

This research was supported by the State Key Program of National Natural Science of China (Grant No. 52239004), the National Science Foundation for Distinguished Young Scholars of China (Grant No. 52025093), and by the Funds for International Cooperation and Exchange of the National Natural Science Foundation of China (Grant No. 52061125101).

Institutional Review Board Statement

Not applicable.

Informed Consent Statement

Not applicable.

Data Availability Statement

Data will be made available on request.

Conflicts of Interest

The authors declare no conflicts of interest.

Appendix A

Table A1. Parameters of the National-Level Multi-Factor Production Model.
IndustryStudy PeriodElasticity Coefficient and Significance of XGoodness of Fit
(R2)
Significance Test
(F-Test)
Ridge Parameter
(k)
LaborInvestmentEnergyWater ResourcesLand
Primary industryFrom 1949 to 19780.19 ***0.671 ***−0.0110.055 **0.0410.97154.032 ***0.168
From 1978 to 20000.223 ***0.366 ***0.101 **0.206 ***0.105 ***0.978150.682 ***0.186
From 2000 to 2013−0.186 ***0.33 ***0.236 ***0.201 ***0.0330.985105.515 ***0.167
From 2013 to 2023−0.303 ***0.33 ***0.219 ***0.0730.0630.98775.9 ***0.18
Secondary industryFrom 1949 to 19780.179 ***0.396 ***0.191 ***0.174 ***0.055 *0.992568.32 ***0.061
From 1978 to 2000−0.0310.392 ***0.217 ***0.148 ***0.263 ***0.996950.382 ***0.036
From 2000 to 20130.223 ***0.284 ***0.197 ***0.102 **0.193 ***0.996375.374 ***0.063
From 2013 to 2023−0.020.375 ***0.244 ***−0.096 *0.312 ***0.99101.36 ***0.144
Tertiary industryFrom 1949 to 19780.156 ***0.477 ***0.202 ***0.050.09 ***0.981253.667 ***0.107
From 1978 to 20000.178 ***0.361 ***0.104 **0.208 ***0.147 ***0.9981526.121 ***0.018
From 2000 to 20130.197 ***0.339 ***0.171 ***0.138 ***0.149 **0.995347.974 ***0.04
From 2013 to 20230.199 ***0.293 ***0.267 ***−0.0360.215 ***0.99103.723 ***0.197
Note: ***, **, and * denote significance levels of 1%, 5%, and 10%, respectively. A significant F-value indicates the presence of a regression relationship. k represents the ridge parameter, defined as the minimum value at which the standardized regression coefficients of the independent variables converge to stability.

References

  1. Vorosmarty, C.J.; McIntyre, P.B.; Gessner, M.O.; Dudgeon, D.; Prusevich, A.; Green, P.; Glidden, S.; Bunn, S.E.; Sullivan, C.A.; Liermann, C.R.; et al. Global threats to human water security and river biodiversity. Nature 2010, 467, 555–561. [Google Scholar] [CrossRef] [PubMed]
  2. Imran, K. Water Sharing Issues in Pakistan: Impacts on Inter-Provincial Relations. J. Dev. Soc. Sci. 2021, 2, 74. [Google Scholar] [CrossRef]
  3. Zhang, Y.; Jin, Z.; Shan, B.; Wang, Y.; Ma, J. Review of research on international water resources conflict and resolution. World Reg. Stud. 2024, 33, 27–39. [Google Scholar] [CrossRef]
  4. Karaki, F.J. The Impact of Manufacturing, Investment, Labor Force and Technology on Economic Growth in Palestine. J. Econ. Financ. Account. Stud. 2023, 5, 164–173. [Google Scholar] [CrossRef]
  5. Arcos-Guanga, A.; Flor-Unda, O.; Novillo-Villegas, S.; Acosta-Vargas, P. The Impact of Knowledge Spillovers on Economic Growth from a National Perspective: A Comprehensive Analysis. Sustainability 2024, 16, 6537. [Google Scholar] [CrossRef]
  6. Daud, S.N.M.; Ahmad, A.H. Financial inclusion, economic growth and the role of digital technology. Financ. Res. Lett. 2023, 53, 103602. [Google Scholar] [CrossRef]
  7. Teng, Y.P. Green Energy and Land Resources: COP27 Perspective of BRICS Economic Growth and Land Production. Land Degrad. Dev. 2024, 35, 5267–5280. [Google Scholar] [CrossRef]
  8. Usman, M.; Jahanger, A.; Makhdum, M.S.A.; Balsalobre-Lorente, D.; Bashir, A. How do financial development, energy consumption, natural resources, and globalization affect Arctic countries’ economic growth and environmental quality? An advanced panel data simulation. Energy 2022, 241, 122515. [Google Scholar] [CrossRef]
  9. Zhang, C.; Waris, U.; Qian, L.; Irfan, M.; Rehman, M.A. Unleashing the dynamic linkages among natural resources, economic complexity, and sustainable economic growth: Evidence from G-20 countries. Sustain. Dev. 2024, 32, 3736–3752. [Google Scholar] [CrossRef]
  10. Balistreri, E.J.; McDaniel, C.A.; Wong, E.V. An estimation of US industry-level capital–labor substitution elasticities: Support for Cobb–Douglas. N. Am. J. Econ. Financ. 2003, 14, 343–356. [Google Scholar] [CrossRef]
  11. Muro, K. A note on the three-sector Cobb–Douglas GDP function. Econ. Model. 2013, 31, 18–21. [Google Scholar] [CrossRef]
  12. Skare, M.; Ozturk, I.; Porada-Rochoń, M.; Stjepanovic, S. Energy as the new frontier: Dynamic panel data analysis revealing energy’s transformative role in economic growth and technological progress. Technol. Forecast. Soc. Change 2024, 200, 123175. [Google Scholar] [CrossRef]
  13. Keen, S.; Ayres, R.U.; Standish, R. A Note on the Role of Energy in Production. Ecol. Econ. 2019, 157, 40–46. [Google Scholar] [CrossRef]
  14. Santos, J.; Domingos, T.; Sousa, T.; Aubyn, M.S. Useful Exergy Is Key in Obtaining Plausible Aggregate Production Functions and Recognizing the Role of Energy in Economic Growth: Portugal 1960–2009. Ecol. Econ. 2018, 148, 103–120. [Google Scholar] [CrossRef]
  15. Liu, Y.; Zhang, Z.; Zhou, Y. Efficiency of construction land allocation in China: An econometric analysis of panel data. Land Use Policy 2018, 74, 261–272. [Google Scholar] [CrossRef]
  16. Su, K.; He, D.; Wang, R.; Han, Z.; Deng, X. Assessment of natural resource endowment and urban-rural integration for sustainable development in Xinjiang, China. J. Clean. Prod. 2024, 450, 142046. [Google Scholar] [CrossRef]
  17. Lu, Z.; Li, Y.; Li, W. To uncover economic losses and mitigation benefits of agricultural water scarcity by considering water availability, quality, and efficiency in China’s largest dryland River Basin. Environ. Impact Assess. Rev. 2025, 114, 107924. [Google Scholar] [CrossRef]
  18. Wang, C.; Shuai, C.; Chen, X.; Huang, W.; Hou, W.; Zhao, B.; Sun, J. Analyzing the potential local and distant economic loss of global construction sector due to water scarcity. Environ. Impact Assess. Rev. 2025, 110, 107667. [Google Scholar] [CrossRef]
  19. Montoya, M.A.; Allegretti, G.; Bertussi, L.A.S.; Talamini, E. Domestic and foreign decoupling of economic growth and water consumption and its driving factors in the Brazilian economy. Ecol. Econ. 2023, 206, 107737. [Google Scholar] [CrossRef]
  20. Wang, Q.; Wang, X.; Li, R. The impact of globalization on the decoupling of water consumption and economic growth in BRICS and N11 countries—Linear and nonlinear approaches. Sustain. Dev. 2023, 32, 755–776. [Google Scholar] [CrossRef]
  21. Jian, S.; Cheng, X.; Wang, T.; Dou, S. The driving factors of water use and its decoupling relationship with economic development—A multi-sectoral perspective in the nine provinces of the Yellow River Basin. J. Hydrol. Reg. Stud. 2025, 59, 102338. [Google Scholar] [CrossRef]
  22. Wang, Q.; Wang, X. Moving to economic growth without water demand growth—A decomposition analysis of decoupling from economic growth and water use in 31 provinces of China. Sci. Total Environ. 2020, 726, 138362. [Google Scholar] [CrossRef]
  23. Tao, M.; Zhao, Y.; Jiang, Q.; Wang, Z.; Li, B. Study on the coupled coordination of water resources consumption and economic development in Heilongjiang province under different scenarios based on SD model. Agric. Water Manag. 2025, 315, 109560. [Google Scholar] [CrossRef]
  24. Wu, Q.; Zuo, Q.; Ma, J.; Zhang, Z.; Jiang, L. Evolution analysis of water consumption and economic growth based on Decomposition-Decoupling Two-stage Method: A case study of Xinjiang Uygur Autonomous Region, China. Sustain. Cities Soc. 2021, 75, 103337. [Google Scholar] [CrossRef]
  25. Gong, Q.; Guo, G.; Li, S.; Liang, X. Decoupling of urban economic growth and water consumption in Chongqing and Chengdu from the “production-living-ecological” perspective. Sustain. Cities Soc. 2021, 75, 103395. [Google Scholar] [CrossRef]
  26. Rusiadi, R.; Hidayat, M.; Rangkuty, D.M.; Ferine, K.F.; Saputra, J. The Influence of Natural Resources, Energy Consumption, and Renewable Energy on Economic Growth in ASEAN Region Countries. Int. J. Energy Econ. Policy 2024, 14, 332–338. [Google Scholar] [CrossRef]
  27. Ali, A.; Li, J.; Zhang, J.; Chishti, M.Z. Exploring the impact of green finance and technological innovation on green economic growth: Evidence from emerging market economies. Sustain. Dev. 2024, 32, 6392–6407. [Google Scholar] [CrossRef]
  28. Sun, D.; Shi, M.; Wei, J.; Chen, Z. Economic contribution and rebound effect of industrial water: The case of the Yangtze River Delta. Water Resour. Econ. 2023, 42, 100222. [Google Scholar] [CrossRef]
  29. Zhang, F.; Wang, H.; Qin, T.; Rojas, R.; Qiu, L.; Yang, S.; Fang, Z.; Xue, S. Towards sustainable management of agricultural resources: A framework to assess the relationship between water, soil, economic factors, and grain production. J. Environ. Manag. 2023, 344, 118401. [Google Scholar] [CrossRef] [PubMed]
  30. Zhang, L.; Ma, Q.; Zhao, Y.; Chen, H.; Hu, Y.; Ma, H. China’s strictest water policy: Reversing water use trends and alleviating water stress. J. Environ. Manag. 2023, 345, 118867. [Google Scholar] [CrossRef]
  31. Su, X.; Zhou, W.; Nakagami, K.I.; Ren, H.; Mu, H. Capital stock-labor-energy substitution and production efficiency study for China. Energy Econ. 2012, 34, 1208–1213. [Google Scholar] [CrossRef]
  32. Mann, K.; Püttmann, L. Benign Effects of Automation: New Evidence from Patent Texts. Rev. Econ. Stat. 2023, 105, 562–579. [Google Scholar] [CrossRef]
  33. Qiao, X.; He, Y.; Du, Q. How does the urban digital economy drive labor allocation in China?—A perspective of factor mobility between digital and non-digital enterprises. Econ. Anal. Policy 2025, 85, 1159–1175. [Google Scholar] [CrossRef]
  34. Zhang, Z. The impact of the artificial intelligence industry on the number and structure of employments in the digital economy environment. Technol. Forecast. Soc. Change 2023, 197, 122881. [Google Scholar] [CrossRef]
  35. Chansarn, S. Labor Productivity Growth, Education, Health and Technological Progress: A Cross-Country Analysis. Econ. Anal. Policy 2010, 40, 249–261. [Google Scholar] [CrossRef]
  36. Liu, C.; Song, C.; Ye, S.; Cheng, F.; Zhang, L.; Li, C. Estimate provincial-level effectiveness of the arable land requisition-compensation balance policy in mainland China in the last 20 years. Land Use Policy 2023, 131, 106733. [Google Scholar] [CrossRef]
  37. Zheng, X.; Ma, C.; Lv, H.; Wan, F.; Wang, H. Evolution and drivers of water use in Northern China. J. Hydrol. Reg. Stud. 2025, 59, 102419. [Google Scholar] [CrossRef]
  38. Wang, X.; Zhang, W.; Li, Y.; Tong, J.; Yu, F.; Ye, Q. Impacts of water constraints on economic outputs and trade: A multi-regional input-output analysis in China. J. Clean. Prod. 2024, 434, 140345. [Google Scholar] [CrossRef]
  39. Huang, G.; Liu, C.; Xi, T.; Xu, H.; You, W. The agricultural and economic impacts of massive water diversion. J. Dev. Econ. 2025, 176, 103517. [Google Scholar] [CrossRef]
  40. Wang, Z.; Xie, J. Water constraint mitigation and agricultural productivity: Evidence from the China’s South-to-North Water Diversion Project. Agric. Water Manag. 2025, 314, 109511. [Google Scholar] [CrossRef]
  41. Diao, Y.; Xia, J.; Dong, Q.; Zuo, Q.; Xie, M. From resource matching to economic sustainability: A multi-stage analysis of water-land-economy interactions in the lower Yellow River Basin. J. Environ. Manag. 2025, 380, 125078. [Google Scholar] [CrossRef] [PubMed]
  42. Meng, X.; Liu, L. Spatial-temporal evolution and influencing factors of food production security in China’s main food-producing areas − based on resource constraint perspective. Ecol. Indic. 2025, 171, 113224. [Google Scholar] [CrossRef]
  43. Ban, Y.; Tang, Q.; Liu, X.; Li, X.; Ren, Y.; Deng, H.; Zhao, G.; Zhang, Y.; Zhang, Y.; Leng, G. Intensification of water scarcity threatens future food security in northwestern China. J. Hydrol. Reg. Stud. 2025, 58, 102177. [Google Scholar] [CrossRef]
  44. Wang, Y.; Zhou, Y.; Zhang, X.; Franz, K.J.; Jia, G. Water regulation mitigates but does not eliminate water scarcity under rapid economic growth in the Haihe River basin. Resour. Conserv. Recycl. 2025, 215, 108098. [Google Scholar] [CrossRef]
Figure 1. Division of the Study Area.
Sustainability 17 09174 g001
Figure 2. Trends in the Input of Five Key Factors at the National Level.
Sustainability 17 09174 g002
Figure 3. Contributions of Factors to the Development of the Three Industries.
Sustainability 17 09174 g003
Figure 4. Changes in the Elastic Coefficients of Water Resources and Land Factors in the Primary Industry by Study Region.
Sustainability 17 09174 g004
Figure 5. Changes in the Elastic Coefficients of Water Resources and Land Factors in the Secondary Industry by Study Region.
Sustainability 17 09174 g005
Figure 6. Changes in the Elastic Coefficients of Water Resources and Land Factors in the Tertiary Industry by Study Region.
Sustainability 17 09174 g006
Table 1. Analysis of Primary Industry Development Zoning Based on Water Resources and Land Contributions.
Development TypeMain Research ZonesDriving/Constraining Factors
Suitable Development ZoneResearch zone 6, Research zone 9Favorable light and thermal conditions; good water–land resource matching; limited reserve arable land; and relatively weak development potential
Potential Development ZoneResearch zone 1, Research zone 10, Research zone 4Major reserve arable land areas in China; limited water resources, which constrain agricultural development
Unsuitable Development ZoneResearch zone 11, Research zone 5, Research zone 7, Research zone 8, Research zone 2, Research zone 3Ecological conservation; insufficient reserve arable land; constraints from limited water resource carrying capacity
Disclaimer/Publisher’s Note: The statements, opinions and data contained in all publications are solely those of the individual author(s) and contributor(s) and not of MDPI and/or the editor(s). MDPI and/or the editor(s) disclaim responsibility for any injury to people or property resulting from any ideas, methods, instructions or products referred to in the content.