Article

Improvement of Construction Workers’ Drowsiness Detection and Classification via Text-to-Image Augmentation and Computer Vision

1
Department of Architectural Engineering, Pusan National University, Busandaehak-ro 63beon-gil, Geumjeong-gu, Busan 46241, Republic of Korea
2
School of Architecture and Building Science, Chung-Ang University, 84, Heukseok-ro, Dongjak-gu, Seoul 06974, Republic of Korea
3
Department of Architectural Engineering, Kumoh National Institute of Technology, Daehak-ro, Gumi-si 39177, Republic of Korea
4
Department of Architecture, Silla University, Baekyang-daero 700beon-gil, Sasang-gu, Busan 46958, Republic of Korea
*
Author to whom correspondence should be addressed.
Sustainability 2025, 17(20), 9158; https://doi.org/10.3390/su17209158
Submission received: 16 September 2025 / Revised: 11 October 2025 / Accepted: 13 October 2025 / Published: 16 October 2025
(This article belongs to the Special Issue Advances in Sustainable Construction Engineering and Management)

Abstract

Detecting and classifying construction workers’ drowsiness is critical in the construction safety management domain. Research efforts to increase the reliability of drowsiness detection through image augmentation and computer vision approaches face two key challenges: the related size constraints and the number of manual tasks associated with creating input images necessary for training vision algorithms. Although text-to-image (T2I) has emerged as a promising alternative, the dynamic relationship between T2I-driven image characteristics (e.g., contextual relevance), different computer vision algorithms, and the resulting performance remains lacking. To address the gap, this study proposes T2I-centered computer vision approaches for enhanced drowsiness detection by creating four separate image sets (e.g., construction vs. non-construction) labeled using the polygon method, developing two detection models (YOLOv8 and YOLO11), and comparing the performance. The results showed that the use of construction domain-specific images for training both YOLOv8 and YOLO11 led to higher mAP@50 of 68.2% and 56.6%, respectively, compared to those trained using non-construction images (53.4% and 53.5%). Also, increasing the number of T2I-generated training images improved mAP@50 from 68.2% (baseline) to 95.3% for YOLOv8 and 56.6% to 93.3% for YOLO11. The findings demonstrate the effectiveness of leveraging the T2I augmentation approach for improved construction workers’ drowsiness detection.

1. Introduction

Every year, a large number of injuries and fatalities occur at construction sites where varying construction hazards (e.g., fall, struck-by, and caught-in/-between) exist [1]. One of the leading causes of such construction accidents is construction workers’ drowsiness, which negatively impacts their cognitive abilities, sustained attention, and effective response to the risks, all of which were identified to significantly increase workers’ vulnerability toward hazards [2,3]. Also, 65% of construction workers were found to exhibit signs of occupational fatigue every day, and 61% of supervisors often observed a high prevalence of work-related drowsiness among construction labor [4].
In order to prevent and minimize the negative impacts resulting from drowsiness, extensive efforts have been made to accurately detect construction workers’ drowsiness on the jobsite because it allows for developing proactive safety plans (e.g., workload management and design of rest periods) and timely intervention before the accident occurs [5,6,7]. In the current practice, it has heavily relied on traditional methods, such as surveys (e.g., Epworth sleepiness scale and self-rating scales), interviews, and safety managers’ observations, all of which are found to be subjective, inaccurate, and ineffective [8,9]. To address the limitations, a growing body of literature has started to adopt advanced technologies, such as wearable sensing and computer vision. Wearable sensing technology allows for quantitative assessment of workers’ drowsiness level, by analyzing physical or physiological signals (e.g., heart rate and EEG), collected from sensors attached to their bodies [10,11,12]. However, they tend to inaccurately detect workers’ drowsiness level due to a significant amount of artifacts in the raw biosignals, result in physical and psychological discomfort caused by wearing devices, and are difficult to be actively adopted by construction workers due to privacy risks [13,14,15,16]. On the other hand, computer vision approaches offer more reliable drowsiness detection performance in a non-invasive and real-time manner based on continuously developed algorithms (e.g., YOLO) and computing power [17,18,19,20]. For example, Onososen et al. (2025) demonstrated the effectiveness of a computer vision-centered approach, using YOLOv8, for capturing construction workers’ drowsiness states, where a mean average precision (mAP) of 92% was achieved [2]. Despite the advantages of leveraging a computer vision approach for drowsiness detection, the detection models—generally trained to determine the individual’s drowsiness by classifying Region of Interest (ROI) in the given image into binary (e.g., “awake” vs. “drowsy”) or multi-class—struggle to perform well when utilized in real-world settings. This is primarily because computer vision algorithms trained on a limited number of imagery data fail to recognize real-world variations (e.g., different contexts, objects, and occlusion) as they were not presented in the training data [21]. Although data augmentation methods have been introduced to increase the amount of imagery data based on image creation tools and augmentation algorithms, their application has often been challenged due to their dependency upon domain expertise and labor-intensive tasks [22,23,24].
A promising alternative is the adoption of text-to-image (T2I) approaches that can generate a large number of quality imagery outputs based on prompts crafted by users [25]. Compared to generative adversarial networks (GANs), T2I allows for a more detailed control over the augmented data, creating a wider variety of outputs attributed to large-scale datasets, and offering better accessibility for users. As such, a large number of synthetic images reflecting varying real-world scenarios could be efficiently generated by T2I, and they could be used as an input to the existing computer vision algorithms for additional training, leading to enhanced drowsiness detection performance. Despite such potential, however, there remain three critical gaps that have yet to be addressed in attaining the ultimate goal of accurate and efficient construction workers’ drowsiness detection based on computer vision. First, the relationship between the number of augmented images and the resulting detection performance has not been established. For instance, it remains vague how many augmented images could lead to significant performance improvement. Second, it is unclear whether construction domain-specific datasets that are contextually relevant can actually contribute to performance enhancement compared to contextually irrelevant general datasets. This is important because, for example, the synthesized images (e.g., drowsy workers) could be illustrated in the context of construction sites vs. non-construction settings (e.g., home). Lastly, a few studies attempted to compare the performance resulting from the use of different computer vision algorithms (e.g., YOLOv8 vs. YOLO11).
To this end, the paper aims to investigate the feasibility of enhancing the performance of construction workers’ drowsiness detection and classification by employing T2I-based image augmentation approaches and computer vision algorithms. To achieve the research objective, the following research questions were formulated to be addressed: (1) How does the quantity of augmented images generated by T2I affect the drowsiness detection performance? (2) Compared to a contextually irrelevant and general dataset, can a domain-specific and relevant imagery dataset enhance the performance of drowsiness detection models? (3) To what extent does the choice of computer vision algorithms impact the resulting performance?
The remaining part of the paper is organized as follows: Section 2 summarizes prior research that focused on detecting workers’ drowsiness using computer vision approaches and applying T2I for image augmentation. In Section 3, four methodological steps constituting an overall research framework are detailed. Section 4 discusses the findings of this study, revealing the impacts of augmented images on performance in terms of contextual relevance and size.

2. Background and Review of Prior Studies

2.1. Drowsiness Detection Using Computer Vision

Drowsiness is represented as a transitional state between wakefulness and sleep, often accompanied by physical manifestations (e.g., difficulty keeping eyes open, head nodding, and yawning) [26]. Such a state leads to impaired cognitive functioning, decreased task performance, and reduced productivity, making drowsiness a critical component of safety management that must be detected and prevented [27]. For example, in the transportation domain, it was found that drowsiness increases vehicle speed variability and the likelihood of lane departures [28]. In the construction sector, drowsiness has been reported to contribute to cognitive impairment and diminished work performance among workers, ultimately leading to an elevated risk of safety incidents [29].
To better determine an individual’s drowsiness, studies have proposed the use of subjective, physiological, and behavioral indicators, among which behavioral cues (e.g., eye closure, yawning, and head nodding) were found to be the most easily observable measures [30,31]. In particular, eye closure has been extensively utilized to distinguish between “awake” and “drowsy” states and validated as a reliable indicator due to minimal intra-individual variability, making it a strong predictor of drowsiness [32].
With computer vision technology’s proven object detection performance, non-invasive characteristics, and cost-efficiency, it has been widely leveraged to detect workers’ drowsiness based on binary (“open” and “closed”) or multi-class classification of their eye states [2,33,34]. Hassan et al. (2025) developed a deep learning framework for driver drowsiness detection using transformer architectures, achieving accuracies over 99.0% [35]. Essahraui et al. (2025) compared various machine learning classifiers and computer vision algorithms to design a real-time driver drowsiness detection system, where the k-nearest neighbors (KNN) classifier achieved an accuracy of 98.89% and YOLOv5 and YOLOv8 exhibited an average mAP of 99.5% [36]. In the construction domain, Francois et al. (2024) integrated YOLOv3 with convolutional neural networks (CNNs) to detect drowsiness among heavy equipment operators at construction sites, reporting an accuracy of 96% for awake states and 90% for drowsy states [34]. Also, Onososen et al. (2025) extracted visual indicators of drowsiness in construction workers and applied YOLOv8 for detection, achieving an mAP of 92% [2].
These studies have demonstrated the effectiveness of using a computer vision approach for drowsiness detection in terms of performance, remote monitoring, and applicability in dynamic construction sites. Unfortunately, however, despite its advantages and potential, in many cases, the detection models do not perform well in real-world settings, primarily due to the limited volume and diversity of imagery data used to train the computer vision algorithms [21]. A wide range of real-world variations (e.g., dynamic environments in construction sites) that were not reflected in the existing training set often leads to misclassification of workers’ eye states, resulting in a high error rate of drowsiness detection. In order to address such critical limitations associated with the size of data used for training computer vision algorithms, studies have attempted to investigate the feasibility of data augmentation methods, which are detailed in the following subsection.

2.2. Applications of Text-to-Image (T2I) for Image Augmentation

Data augmentation is defined as the process of artificially expanding the quantity and diversity of existing data points with the goal of improving subsequent model performance (e.g., detection and classification) [37,38]. In order to create synthesized imagery data, prior studies have primarily applied two techniques—geometric transformations (e.g., rotation, flipping, cropping, and scaling) and photometric transformations (e.g., brightness, contrast, and color modifications)—to reference images to increase the number of data points [39,40]. By creating diverse variants of the same image, these methods have been widely adopted in applications where collecting large-scale annotated datasets is challenging, such as safety-related object detection tasks in the construction field [41,42].
For example, Suto (2024) applied a set of geometric and photometric transformations to a YOLOv5 framework for pest detection in remotely sensed trap images [43]. Their results showed an improvement in detection accuracy, where mAP@50 increased from 0.421 with the baseline dataset to 0.727 after augmentation [43]. Sangha and Darr (2025) evaluated augmentation strategies under low-contrast and complex background conditions and found that random contrast adjustments reduced training stability and even lowered detection performance compared to the baseline model [44]. However, it was found that geometric and photometric transformations can easily distort object boundaries and undermine semantic consistency, causing the loss of critical information [45]. Moreover, identifying effective augmentation strategies is a labor-intensive task that requires domain-specific expertise [46]. Even when carefully applied, performance improvements are not consistently guaranteed, because some transformations may improve the resulting performance while others result in negligible or even adverse effects. Given the limitations of conventional image augmentation methods, recent studies have started to increasingly adopt T2I-based image augmentation approaches.
T2I can be defined as a generative task that converts natural language descriptions (prompts) into various visual outputs based on critical information (e.g., object attributes, spatial arrangements, and contextual details) presented in the prompts [25]. Unlike traditional augmentation, which focuses on modifying existing samples, T2I assists in synthesizing entirely new images tailored to even rare, hazardous, or domain-specific conditions that are difficult to collect in the real world [47]. This capability allows researchers to enrich datasets with diverse and contextually relevant samples, ultimately strengthening the robustness of computer vision-based detection models. Aqeel et al. (2025) proposed RoadFusion, a latent diffusion-based framework for pavement defect detection and domain adaptation [48]. By incorporating dual feature adaptors and patch-level discriminators, the model generated diverse defect patterns (e.g., cracks and potholes), achieving 5–8% higher mAP@50 compared to conventional CNN baselines [48]. Li et al. (2024) developed a background augmentation strategy using Stable Diffusion, where object masks were preserved while new contextual backgrounds were synthesized, and an improvement of mAP@50 of 5.3% was observed [49]. Hsu and Lin (2025) introduced the High-Detail Feature-Preserving Network (HDFpNet) for producing high-fidelity images, and the reliability of T2I was demonstrated in terms of semantic accuracy and recognition rate [50].
Despite the aforementioned benefits and promise of using T2I-centered augmentation for enhanced construction workers’ drowsiness detection, what is missing in the current knowledge base is the relationship between characteristics of augmented datasets—size and contextual relevance in particular—and the resulting performance. In other words, it remains vague how much contextually relevant (e.g., workers in construction sites) or irrelevant images (e.g., workers in restaurants) could contribute to the significant drowsiness detection performance improvement in the jobsite. Also, it is important to compare the detection performance resulting from the use of different types of computer vision algorithms (e.g., YOLOv8 and YOLO11) to provide guidance for construction safety professionals.

3. Methodology

The research objective is achieved through the methodology, consisting of the following four steps. First, four separate imagery datasets (e.g., non-construction domain and construction domain datasets) are constructed. Second, imagery data are labeled using the polygon method. Third, two types of drowsiness detection and classification models are developed based on YOLOv8 and YOLO11, respectively. Lastly, the resulting performance is compared, utilizing four well-established metrics (precision, recall, mAP@50, and mAP@50-95). Figure 1 illustrates the research framework.

3.1. Imagery Dataset Construction

In prior studies where experiment subjects’ drowsiness was measured using computer vision techniques, most research focused on classifying the participants’ eye states into two classes of “awake” and “drowsy” to determine their drowsiness. Although such experimental settings have often been represented as assumptions or limitations, the underlying rationale for conducting a binary classification task can be explained in two aspects. First, classifying a subject as “awake” or “drowsy” serves as the very first step that can be further used to confirm an individual’s physiological transition from wakefulness to drowsiness. Therefore, there is a need to maximize this binary classification performance before determining prolonged eye closure that occurs in consecutive time frames. Second, compared to adopting multiple drowsiness levels (e.g., “slightly tired”, “very drowsy”, and “asleep”), this binary approach is more computationally efficient due to reduced algorithm training complexity and more effective in terms of safety. Considering that “drowsiness detection and classification” is a component of an overall safety management system, its fast and accurate binary classification is pivotal for immediate safety intervention, for people (e.g., drivers and workers) working in high-risk industries (e.g., transportation and construction).
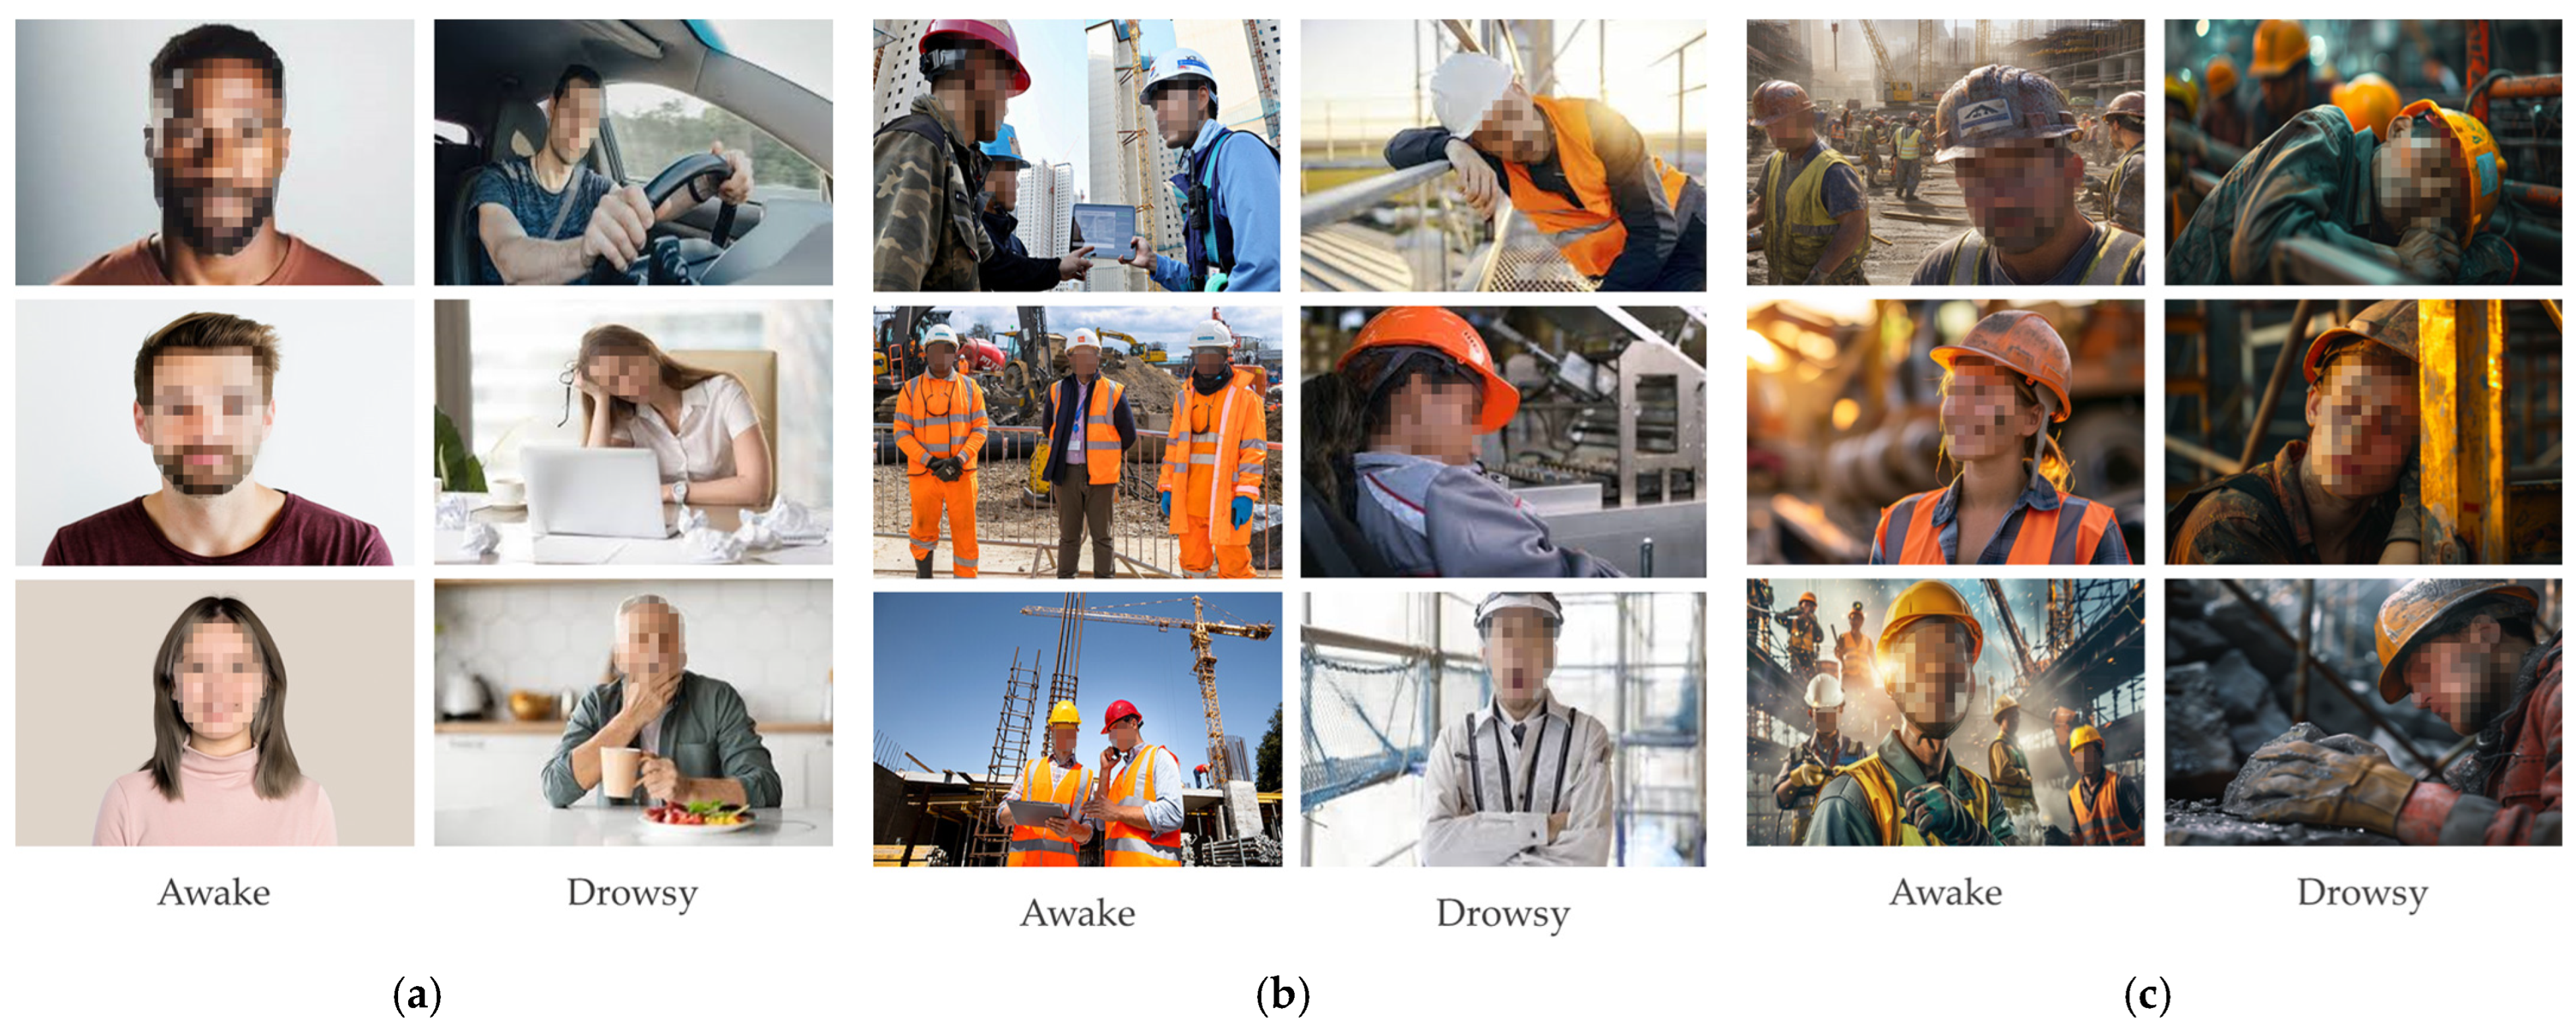
Based on the above rationale, four separate datasets, all of which contain images illustrating people (e.g., construction workers) with their eyes either open or closed, were created. The first dataset consisted of 200 non-construction domain images (e.g., a person not wearing a safety helmet and vest) collected in the real world, and the second comprised the same number of 200 construction domain real images where workers wore personal protective equipment (PPE), being placed in various construction contexts. To ensure the collection of relevant real images, the authors manually collected imagery data through web searches (e.g., Google) and photos directly taken from construction sites near Pusan National University, Busan, South Korea. Then, for the third dataset, a total of 400 images were augmented using a widely adopted T2I platform, Midjourney (version 7), due to its proven performance in terms of visual quality, consistent generation, and customization capabilities [51,52]. Varying prompts (e.g., “close-up realistic photo of a male construction worker sitting on a beam, appearing tired and drowsy, eyes half-closed, wearing a safety helmet and vest, urban construction background with cranes and steel framework, natural lighting, shallow depth of field, 8k realism”) were designed and utilized for image generation in an exploratory and iterative manner. Lastly, the fourth dataset, serving as the test set, was developed based on 200 real construction worker images. Images lacking clarity, duplicates, and irrelevant data were manually filtered out by the authors. Figure 2 illustrates the examples of the datasets by using sample images randomly selected from the first, second, and third datasets.
Note that the first (non-construction domain) and second (construction domain) datasets were used to train computer vision algorithms (i.e., YOLOv8 and YOLO11), and their performance was tested using the fourth dataset, as detailed in Section 4.1. In addition, the synthetic images in the third dataset were gradually fused with the second dataset to train vision algorithms, which were then tested based on the identical fourth dataset to analyze the impact of the number of augmented data on the resulting performance, as illustrated in Section 4.2. Table 1 presents the details of the datasets.

3.2. Data Labeling

Data labeling, often referred to as data annotation, is the process of tagging raw visual data (e.g., images) with corresponding descriptive labels [53]. This is a critical step in computer vision applications because the labels serve as ground truth for vision algorithms to learn the underlying relationship between labels and target objects. Given the goal of this study, which was to classify the eye states of construction workers as either “awake” or “drowsy,” data labeling focused on ROI containing the individuals’ faces and safety helmets.
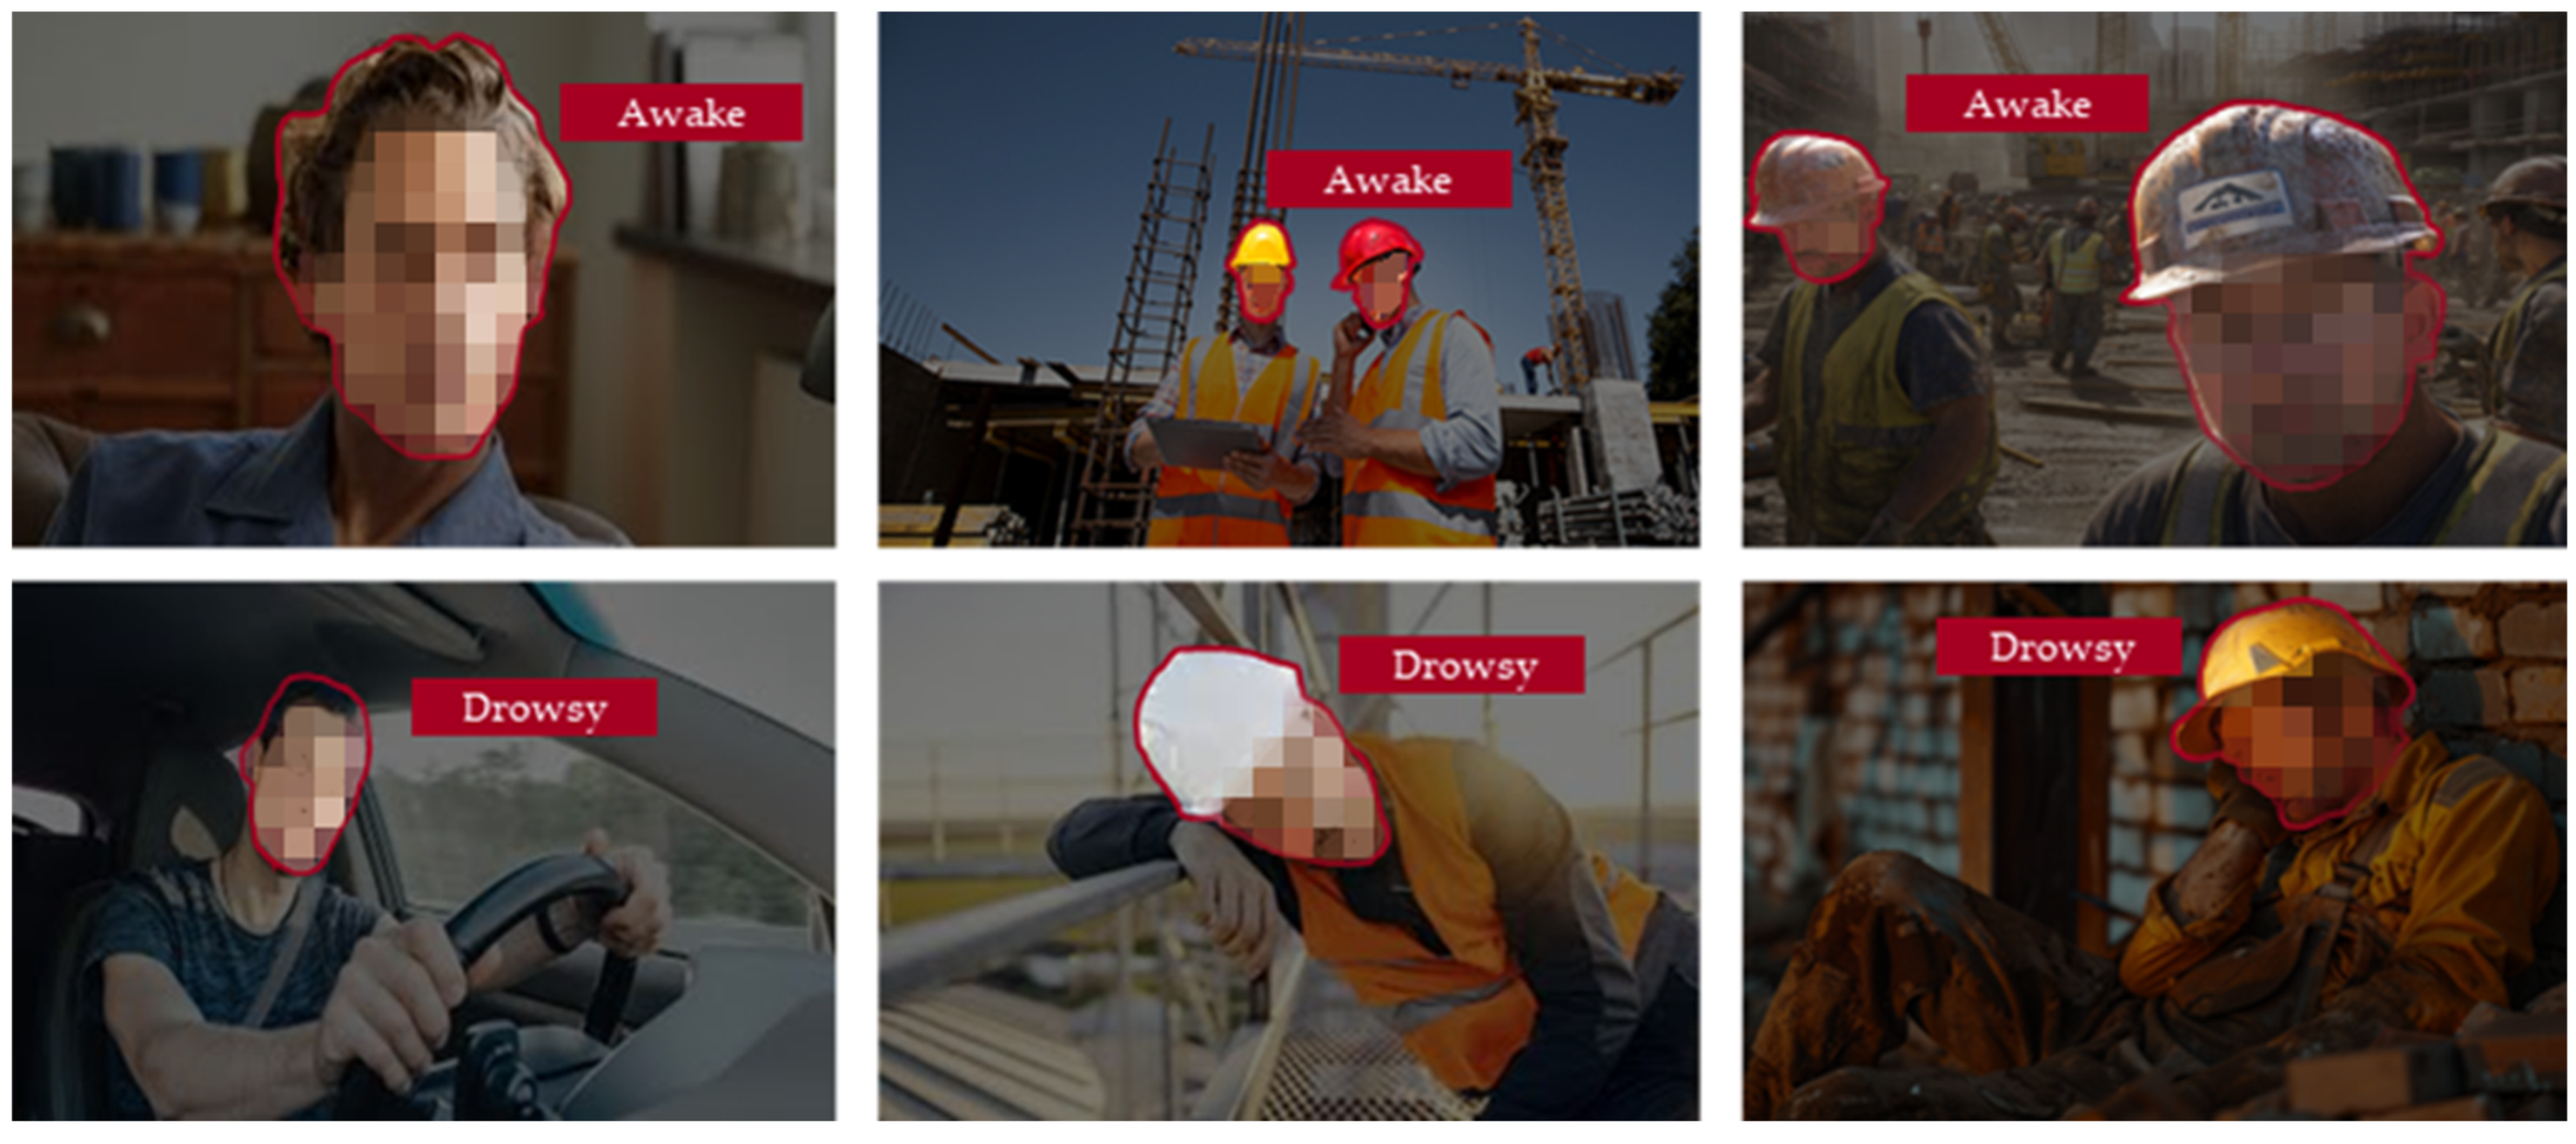
Bounding box and polygon annotation are two well-established techniques for image labeling [54]. While the 2D bounding box approach defines the spatial extent of a target object with a rectangular frame, which is straightforward, it often includes extraneous background pixels that can potentially degrade the resulting performance. In contrast, the polygon method offers a more precise alternative by delineating an object’s exact shape through a series of connected points that can efficiently minimize the inclusion of irrelevant space. Therefore, polygon labeling was conducted for all the datasets in Table 1 using Roboflow (version 0.22.0), one of the most widely used publicly available computer vision platforms. Figure 3 illustrates examples of labeled images.

3.3. Drowsiness Detection and Classification Model Development

To determine the drowsiness of construction workers in the given images, two separate classifiers were built upon YOLOv8 and YOLO11, respectively. The rationale for using YOLO was due to its unique advantages (e.g., “one-stage” processing, global contextual understanding, and efficient optimization) that allow for shaping object detection and classification tasks as a single regression task [55]. Among different versions of YOLO (e.g., YOLOv3, v5, v8, v10, and 11), YOLOv8, represented as the most widely used one in existing literature to the authors’ knowledge, and YOLO11, the latest one at the time of experiments, were adopted to compare the resulting performance. Specifically, YOLOv8 introduces an anchor-free detection head and a streamlined backbone–neck architecture, making it a balanced choice between speed and robustness. YOLO11 further advanced the existing framework with improved feature extraction and parameter efficiency, aiming to achieve higher accuracy under complex imagery conditions.
Two scenarios were designed to train and test the above two algorithms. First, 200 non-construction real images (No. 1 in Table 1) and 200 construction domain real images (No. 2 in Table 1) were separately used to train YOLOv8 and YOLO11, and their performance was compared using the identical test set (No. 4 in Table 1), consisting of 200 real images captured from construction sites. Second, 400 augmented images (No. 3 in Table 1) were used as extra training data points by gradually adding them to the real image set (No. 2 in Table 1) in steps of 50, and the performance was assessed by testing on the same test set (No. 4 in Table 1).
When training YOLOv8 and YOLO11, an optimal value for the hyperparameter of “epoch” was attempted to be identified based on preliminary experiments. The first scenario mentioned above was used, and all the other hyperparameters (e.g., learning rate, epoch, and batch size) were set to default values, while solely adjusting the number of epochs from 25 to 250. As illustrated in Table 2, the optimal number of epochs was identified to be 100, where the highest mAP@50 of 0.905 was observed. Therefore, the epoch of 100 and the default values of all the remaining hyperparameters were consistently used for the following experiments to minimize the impacts of hyperparameter settings on the performance, which allowed for focusing on the effects of data volume and domain-specific image characteristics on classification performance.

3.4. Performance Comparison Using Evaluation Metrics

To systematically evaluate and compare the performance of drowsiness detection, four widely used metrics were adopted: precision, recall, mAP@50, and mAP@50-95. Precision measures the proportion of correctly detected drowsiness cases among all positive predictions, recall reflects the ability of the model to identify actual drowsiness cases, and Average Precision (AP) is computed as the area under the precision–recall curve for a given class. Extending this, the mean Average Precision (mAP) averages AP scores. The following equations were used to compute each metric:
P r e c i s i o n = T P T P + F P
R e c a l l = T P T P + F N
m A P = 1 N i = 1 N A P i
where T P denotes the number of true positives, F P represents false positives, F N refers to false negatives, and A P i is the average precision for class i , and N denotes the number of classes.
In particular, mAP@50 evaluates detection performance at a fixed Intersection over Union (IoU) threshold of 0.5, which has been widely adopted in safety-critical object detection research due to its interpretability and reliability. This metric is particularly suitable for construction safety applications, as it prioritizes identifying potentially hazardous states even if bounding box localization is not perfectly accurate. On the other hand, mAP@50-95 averages mAP across IoU thresholds from 0.5 to 0.95 in increments of 0.05 [56]. Among these four metrics, mAP@50 was used as a primary measure of detection and classification performance because an IoU threshold of 0.5 provides a balance between accurate localization and reliable detection of hazardous states. Also, in construction drowsiness detection, the practical priority lies in recognizing unsafe conditions (e.g., eye closure) rather than achieving pixel-level bounding box precision.

4. Results and Discussion

4.1. Impacts of Domain-Specific Datasets on Performance

To analyze how contextually relevant or irrelevant images could contribute to the drowsiness detection and classification performance, 200 construction domain images (No. 2 in Table 1) and 200 non-construction domain images (No. 1 in Table 1) were separately used to train YOLO algorithms (v8 and 11), which were then evaluated on 200 testing images (No. 4 in Table 1). Note that imagery data in each of the three datasets represent real construction site images. Table 3 illustrates the results.
It was observed that when construction domain images were used for training, both YOLOv8 and YOLO11 algorithms achieved higher mAP@50 scores of 0.682 and 0.566, respectively—compared to those (0.534 and 0.535) observed from the algorithms trained on non-construction images—indicating that training images that are contextually similar to those in the testing set are more effective in producing higher performance. It can be explained based on the principle of in-domain transfer learning, which emphasizes that features learned by the algorithms on the source data are useful for predicting the target data [57]. Since the training and testing sets are collected within the same construction context, the algorithms (YOLOv8 and YOLO11) were able to effectively capture domain-specific visual cues (e.g., workers, work environments, and safety equipment), assisting in learning more contextually meaningful representations and ultimately improving detection accuracy.

4.2. Impacts of Augmented Dataset Size on Performance

Further experiments were performed by augmenting construction site-specific images and using them for additional training and testing, rather than generating images illustrating construction workers in random contexts (e.g., non-construction settings), based on findings in the previous subsection. A total of 400 synthetic images were gradually added to the existing training set (No. 2 in Table 1), with an interval of 50, to investigate the gradual impact of the number of augmented images on the resulting performance, as shown in Table 4. Throughout the training and testing process, all the hyperparameters remained the same, YOLOv8 was used for implementation, and an identical testing set (in Table 3) was used to ensure consistency. All experiments were performed using a computing environment equipped with an NVIDIA RTX 4090 GPU, an Intel Core i7-13700K CPU, and 64 GB RAM.
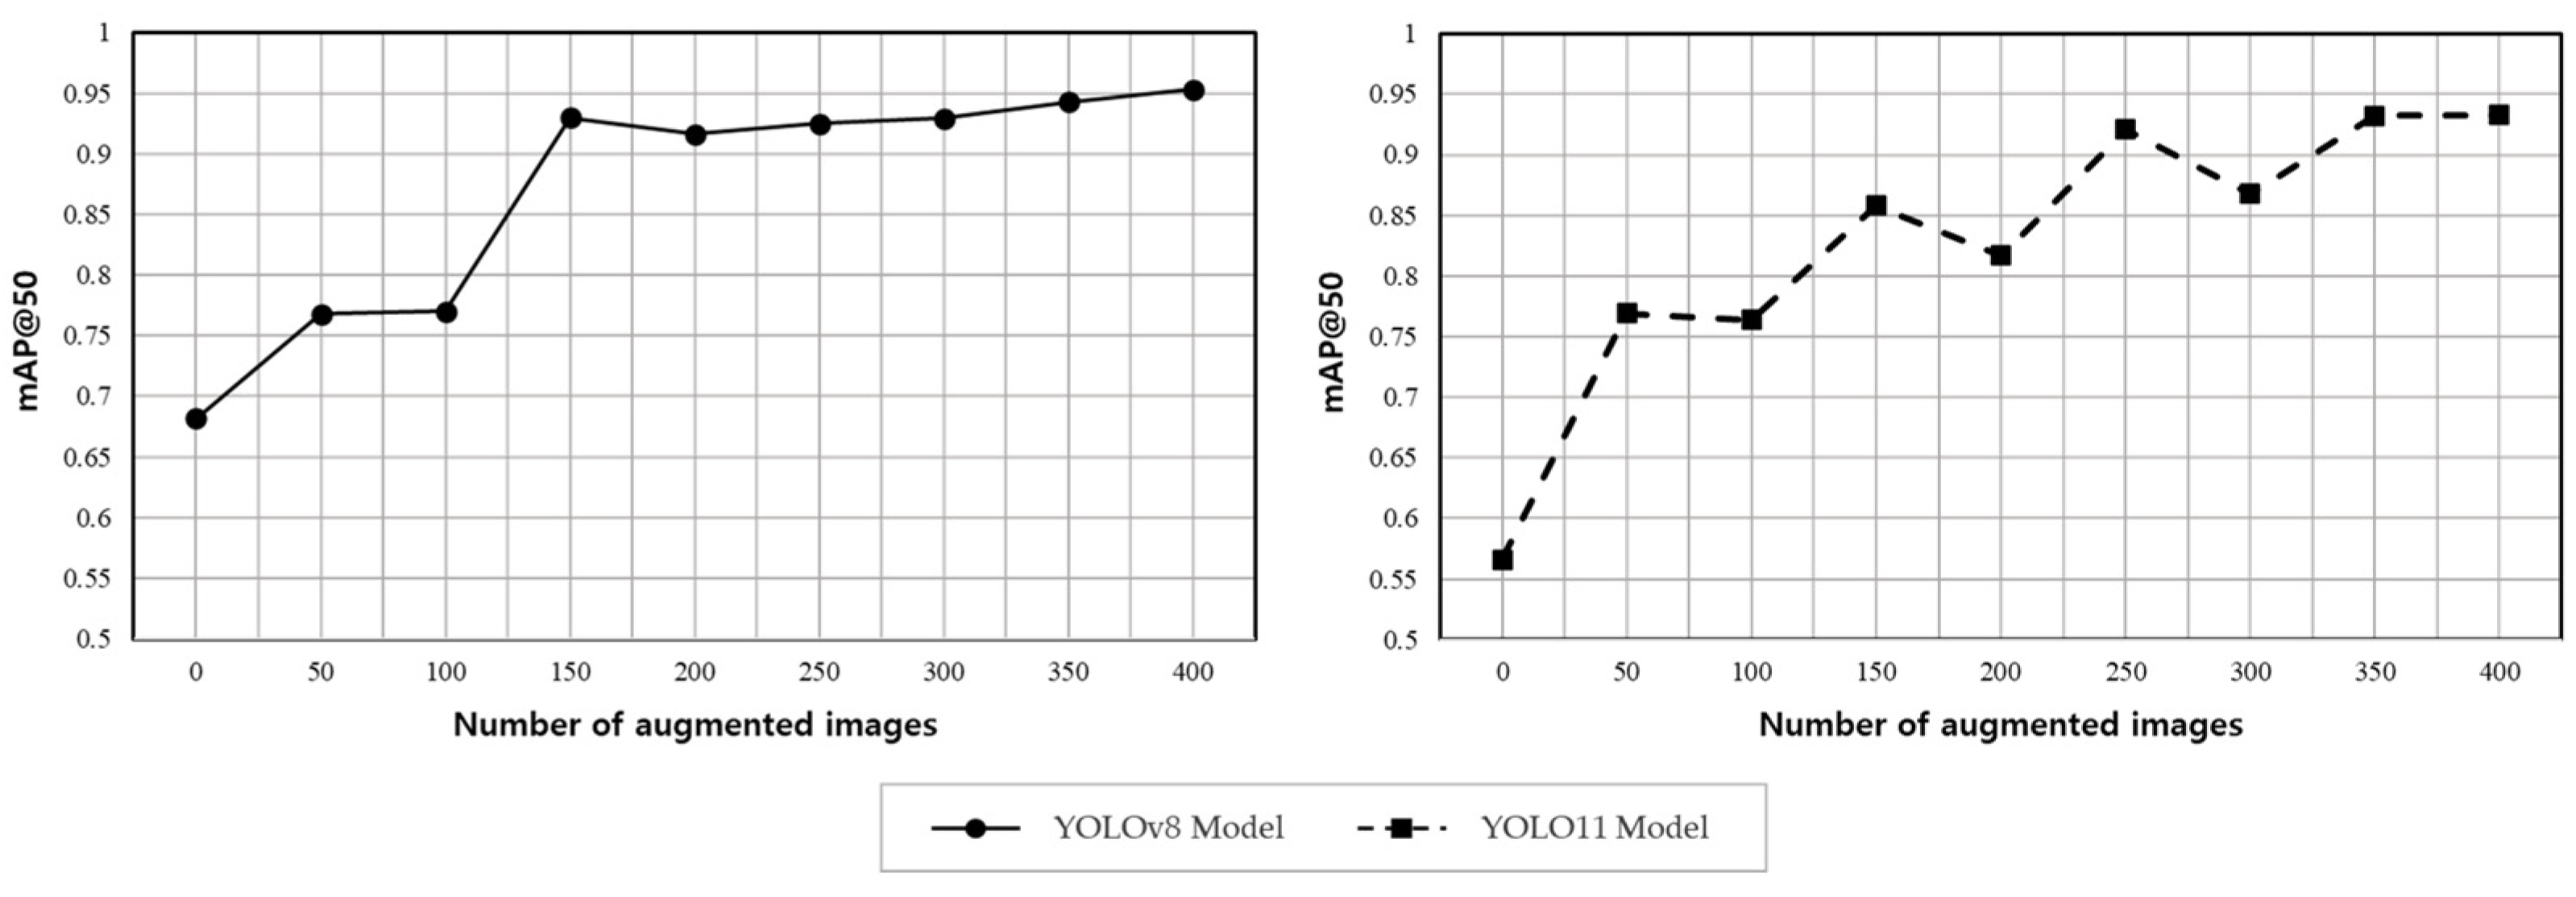
Compared to the baseline performance (mAP@50 of 68.2%), achieved when only 200 real images were used for training, the use of augmented images continuously led to performance improvements, reaching the maximum mAP@50 of 95.3% when all the 400 synthetic images were used (No. 8), although some fluctuations were observed. An additional experiment was conducted using YOLO11 based on the same experimental settings, and the results are presented in Table 5. Figure 4 illustrates the comparison of the detection performance when different YOLO algorithms were used.
A similar trend of performance enhancement was also observed in Table 5, where peak mAP@50 of 93.3% was recorded with 400 augmented images (No. 8), compared to the baseline mAP@50 of 56.6%. At this stage, a paired t-test was conducted, and the performance difference between the two models was found to be statistically significant (p = 1.37 × 10⁻¹¹ < 0.001). Comparing the results in Table 4 and Table 5 led to the following observations. First, for both YOLOv8 and YOLO11, the highest drowsiness detection performance was found when the maximum number of augmented images (400) was fused with the existing 200 images. It is likely that the enlarged training set improved model generalization by exposing the detector to a broader range of drowsiness-related visual cues, including variations in eye closure, suggesting that increasing both the quantity and diversity of training data played a critical role in enhancing detection performance under real-world construction scenarios. However, it is important that future research expand the range of input data size for further validation of this trend. Second, the use of the YOLOv8 algorithm continuously led to higher performance than YOLO11, as supported by a higher average mAP@50 of 89.2% (vs. 85.8%) and peak mAP@50 of 95.3% (vs. 93.3%), as well as the results presented in Table 3 (mAP@50 of 68.2% vs. 56.6%). Since YOLO11 represented the latest and advanced version (released in September 2024) of YOLO at the time of experiments, such results were the exact opposite of what the authors initially expected. It is likely that performance differences between YOLO versions resulted from their high dependency on dataset characteristics and evaluation metrics. Improvements on YOLO11 were made by particularly focusing on large-scale benchmarks (e.g., COCO) using mAP@50-95, which attempted to increase both detection and localization accuracy, whereas this study adopted mAP@50 as the primary measure on a relatively small, domain-specific dataset. This difference in evaluation settings and data compositions could have affected the unexpected superiority of YOLOv8.

5. Conclusions

This study employed a combined T2I and computer vision approach to detect and classify construction workers’ drowsiness and to evaluate and compare the resulting performance. The methodology consisted of four main steps: constructing four separate imagery datasets (including non-construction and construction domain datasets); conducting polygon-based labeling for precise annotation; developing two types of drowsiness detection and classification models based on YOLOv8 and YOLO11; and comparing the results using four well-established metrics, with a particular focus on mAP@50.
Three key findings were observed from the experimental results. First, when construction domain images were used for training, both YOLOv8 (68.2%) and YOLO11 (56.6%) achieved higher mAP@50 scores than when trained on non-construction domain images (53.4% and 53.5%). Second, detection performance consistently improved with the gradual addition of augmented images, and the highest performance was noted when all 400 synthetic images were combined with real images, achieving peak mAP@50 values of 95.3% (YOLOv8) and 93.3% (YOLO11). Third, YOLOv8 consistently outperformed YOLO11, as evidenced by higher average mAP@50 (89.2% vs. 85.8%), maximum mAP@50 (95.3% vs. 93.3%), and baseline performance (68.2% vs. 56.6%).
T2I-augmented computer vision approaches can be embedded into real-time construction site monitoring systems to enhance workers’ drowsiness detection accuracy and adaptability. After training with both real and T2I-generated imagery, the optimized model can be deployed on edge devices (e.g., workstations) or cloud-linked cameras to analyze live video streams. The augmented data improve robustness against lighting variation, occlusion, and worker diversity, enabling reliable drowsiness detection. Detected events are transmitted to centralized dashboards integrated with BIM or digital-twin environments for spatial visualization. Once the detected event is determined to be at risk, feedback can be provided to drowsy workers through alarms and haptic wearable devices.
Despite these promising outcomes, this study is limited by the relatively small dataset size and the use of only two computer vision algorithms. Future research is expected to incorporate larger and more diverse datasets, expand the range of synthetic images, and benchmark performance across additional state-of-the-art vision algorithms. Additionally, it is crucial to recognize the ethical and privacy concerns associated with the use of augmented images.
In conclusion, this study empirically demonstrated the advantages of construction domain-specific training datasets, revealed the relationship between augmented dataset size and detection performance, and provided comparative insights into YOLOv8 and YOLO11 for drowsiness detection. The findings contribute to both the existing body of knowledge and practice by offering practical strategies for proactive and data-driven safety management, ultimately helping to reduce risks associated with workers’ drowsiness in construction workplaces.

Author Contributions

Conceptualization, D.J. and J.J.; methodology, Y.L. and K.J.; software, D.J. and Y.L.; validation, J.K. and H.P.; formal analysis, D.J. and J.L.; investigation, D.J., Y.L. and J.J.; resources, H.P. and J.J.; data curation, D.J. and Y.L.; writing—original draft preparation, D.J., Y.L., K.J. and J.J.; writing—review and editing, J.L., J.K. and H.P.; visualization, Y.L. and K.J.; supervision, J.J.; project administration, H.P. and J.J.; funding acquisition, H.P. All authors have read and agreed to the published version of the manuscript.

Funding

This research was supported by the National Research Foundation of Korea (NRF) grant funded by the Korean government (MSIT), grant number RS-2025-00558613.

Institutional Review Board Statement

Not applicable.

Informed Consent Statement

Not applicable.

Data Availability Statement

The raw data supporting the conclusions of this article will be made available by the authors on request.

Conflicts of Interest

The authors declare no conflicts of interest.

References

  1. Kumi, L.; Jeong, J.; Jeong, J.; Son, J.; Mun, H. Network-Based Safety Risk Analysis and Interactive Dashboard for Root Cause Identification in Construction Accident Management. Reliab. Eng. Syst. Saf. 2025, 256, 110814. [Google Scholar] [CrossRef]
  2. Onososen, A.O.; Musonda, I.; Onatayo, D.; Saka, A.B.; Adekunle, S.A.; Onatayo, E. Drowsiness Detection of Construction Workers: Accident Prevention Leveraging Yolov8 Deep Learning and Computer Vision Techniques. Buildings 2025, 15, 500. [Google Scholar] [CrossRef]
  3. Namian, M.; Taherpour, F.; Ghiasvand, E.; Turkan, Y. Insidious Safety Threat of Fatigue: Investigating Construction Workers’ Risk of Accident Due to Fatigue. J. Constr. Eng. Manag. 2021, 147, 04021162. [Google Scholar] [CrossRef]
  4. National Safety Council. Fatigue in Safety Critical Industries—Impacts, Risks & Recommendations. 2018. Available online: https://www.nsc.org/getmedia/4b5503b3-5e0b-474d-af19-c419cedb4c17/fatigue-in-safety-critical-industries.pdf.aspx?srsltid=AfmBOoo87il8WHnx3GvbkWnefQ5uWmDO9QI5eeqpixxoOdENTjZgbPqm (accessed on 12 October 2025).
  5. Zhou, H.; Chan, A.P.-C.; Yang, Y.; Yi, W. A Systematic Review of Mental States and Safety Performance of Construction Workers. J. Constr. Eng. Manag. 2025, 151, 03125007. [Google Scholar] [CrossRef]
  6. Heng, P.P.; Mohd Yusoff, H.; Hod, R. Individual Evaluation of Fatigue at Work to Enhance the Safety Performance in the Construction Industry: A Systematic Review. PLoS ONE 2024, 19, e0287892. [Google Scholar] [CrossRef]
  7. Gharibi, V.; Mokarami, H.; Cousins, R.; Jahangiri, M.; Eskandari, D. Excessive Daytime Sleepiness and Safety Performance: Comparing Proactive and Reactive Approaches. Int. J. Occup. Environ. Med. 2020, 11, 95–107. [Google Scholar] [CrossRef]
  8. Zhang, M.; Murphy, L.A.; Fang, D.; Caban-Martinez, A.J. Influence of Fatigue on Construction Workers’ Physical and Cognitive Function. Occup. Med. 2015, 65, 245–250. [Google Scholar] [CrossRef]
  9. Chang, F.-L.; Sun, Y.-M.; Chuang, K.-H.; Hsu, D.-J. Work Fatigue and Physiological Symptoms in Different Occupations of High-Elevation Construction Workers. Appl. Ergon. 2009, 40, 591–596. [Google Scholar] [CrossRef]
  10. Kim, J.; Lee, K.; Jeon, J. Systematic Literature Review of Wearable Devices and Data Analytics for Construction Safety and Health. Expert Syst. Appl. 2024, 257, 125038. [Google Scholar] [CrossRef]
  11. Li, G.; Lee, B.-L.; Chung, W.-Y. Smartwatch-Based Wearable EEG System for Driver Drowsiness Detection. IEEE Sens. J. 2015, 15, 7169–7180. [Google Scholar] [CrossRef]
  12. Ahn, C.R.; Lee, S.; Sun, C.; Jebelli, H.; Yang, K.; Choi, B. Wearable Sensing Technology Applications in Construction Safety and Health. J. Constr. Eng. Manag. 2019, 145, 03119007. [Google Scholar] [CrossRef]
  13. Choi, B.; Hwang, S.; Lee, S. What Drives Construction Workers’ Acceptance of Wearable Technologies in the Workplace?: Indoor Localization and Wearable Health Devices for Occupational Safety and Health. Autom. Constr. 2017, 84, 31–41. [Google Scholar] [CrossRef]
  14. Moshawrab, M.; Adda, M.; Bouzouane, A.; Ibrahim, H.; Raad, A. Smart Wearables for the Detection of Occupational Physical Fatigue: A Literature Review. Sensors 2022, 22, 7472. [Google Scholar] [CrossRef] [PubMed]
  15. Boudlal, H.; Serrhini, M.; Tahiri, A. Towards a Low-Cost and Privacy-Preserving Indoor Activity Recognition System Using Wifi Channel State Information. Multimed. Tools Appl. 2025, 84, 35761–35792. [Google Scholar] [CrossRef]
  16. Boudlal, H.; Serrhini, M.; Tahiri, A. CSHA-CSI: Towards Contactless Sensing of Human Activities Utilizing WiFi Channel State Information. In Proceedings of the 2024 3rd International Conference on Embedded Systems and Artificial Intelligence (ESAI), Fez, Morocco, 19–20 December 2024; pp. 1–9. [Google Scholar]
  17. Kim, K.-H.; Kim, T.-J.; Park, Y.-H.; Yoon, S.-H.; Jeon, J.-H.; Kim, J.-W. Barriers to the Adoption of Computer Vision-Based Object Recognition in Construction Sites—Analyzing Barriers to Safety Technology Adoption Using the Technology Acceptance Model. Korean J. Constr. Eng. Manag. 2025, 26, 87–96. [Google Scholar] [CrossRef]
  18. Park, J.; Park, S.; Kim, J.; Kim, J. A Vision-Based Pipe Support Displacement Measurement Method Using Moire Patterns. Korean J. Constr. Eng. Manag. 2022, 23, 37–45. [Google Scholar] [CrossRef]
  19. Han, S.; Won, J.; Koo, C. A Strategic Approach to Enhancing the Practical Applicability of Vision-Based Detection and Classification Models for Construction Tools—Sensitivity Analysis of Model Performance Depending on Confidence Threshold. Korean J. Constr. Eng. Manag. 2025, 26, 102–109. [Google Scholar] [CrossRef]
  20. Dabash, M.S. Applications of Computer Vision to Improve Construction Site Safety and Monitoring; ProQuest Dissertations & Theses: Ann Arbor, MI, USA, 2023; ISBN 979-8-3744-0109-7. [Google Scholar]
  21. Liu, Y.; Sun, P.; Wergeles, N.; Shang, Y. A Survey and Performance Evaluation of Deep Learning Methods for Small Object Detection. Expert Syst. Appl. 2021, 172, 114602. [Google Scholar] [CrossRef]
  22. Xu, M.; Yoon, S.; Fuentes, A.; Park, D.S. A Comprehensive Survey of Image Augmentation Techniques for Deep Learning. Pattern Recognit. 2023, 137, 109347. [Google Scholar] [CrossRef]
  23. Khalifa, N.E.; Loey, M.; Mirjalili, S. A Comprehensive Survey of Recent Trends in Deep Learning for Digital Images Augmentation. Artif. Intell. Rev. 2022, 55, 2351–2377. [Google Scholar] [CrossRef]
  24. Shin, Y.; Seo, S.; Koo, C. Synthetic Video Generation Process Model for Enhancing the Activity Recognition Performance of Heavy Construction Equipment—Utilizing 3D Simulations in Unreal Engine Environment. Korean J. Constr. Eng. Manag. 2025, 26, 74–82. [Google Scholar] [CrossRef]
  25. Frolov, S.; Hinz, T.; Raue, F.; Hees, J.; Dengel, A. Adversarial Text-to-Image Synthesis: A Review. Neural Netw. 2021, 144, 187–209. [Google Scholar] [CrossRef] [PubMed]
  26. Arakawa, T. Trends and Future Prospects of the Drowsiness Detection and Estimation Technology. Sensors 2021, 21, 7921. [Google Scholar] [CrossRef] [PubMed]
  27. Kim, T.; Yang, K. Analysis of AI Model Performance for EMG-Based Human-Robot Handover State Recognition. Korean J. Constr. Eng. Manag. 2025, 26, 67–73. [Google Scholar] [CrossRef]
  28. Soares, S.; Monteiro, T.; Lobo, A.; Couto, A.; Cunha, L.; Ferreira, S. Analyzing Driver Drowsiness: From Causes to Effects. Sustainability 2020, 12, 1971. [Google Scholar] [CrossRef]
  29. Sathvik, S.; Alsharef, A.; Singh, A.K.; Shah, M.A.; ShivaKumar, G. Enhancing Construction Safety: Predicting Worker Sleep Deprivation Using Machine Learning Algorithms. Sci. Rep. 2024, 14, 15716. [Google Scholar] [CrossRef]
  30. Albadawi, Y.; Takruri, M.; Awad, M. A Review of Recent Developments in Driver Drowsiness Detection Systems. Sensors 2022, 22, 2069. [Google Scholar] [CrossRef]
  31. Sigari, M.-H.; Pourshahabi, M.-R.; Soryani, M.; Fathy, M. A Review on Driver Face Monitoring Systems for Fatigue and Distraction Detection. IJAST 2014, 64, 73–100. [Google Scholar] [CrossRef]
  32. Abe, T. PERCLOS-Based Technologies for Detecting Drowsiness: Current Evidence and Future Directions. SLEEP Adv. 2023, 4, zpad006. [Google Scholar] [CrossRef]
  33. Makhmudov, F.; Turimov, D.; Xamidov, M.; Nazarov, F.; Cho, Y.-I. Real-Time Fatigue Detection Algorithms Using Machine Learning for Yawning and Eye State. Sensors 2024, 24, 7810. [Google Scholar] [CrossRef]
  34. Francois, J.; Khalafalla, M.; Kobelo, D.; Williams, J. Preventing Drowsy Driving Accidents in the Construction Industry Using Computer Vision and Convolutional Neural Networks. In Proceedings of the Construction Research Congress 2024, Des Moines, IA, USA, 20–23 March 2024; American Society of Civil Engineers: Reston, VA, USA, 2024; pp. 435–444. [Google Scholar]
  35. Hassan, O.F.; Ibrahim, A.F.; Gomaa, A.; Makhlouf, M.A.; Hafiz, B. Real-Time Driver Drowsiness Detection Using Transformer Architectures: A Novel Deep Learning Approach. Sci. Rep. 2025, 15, 17493. [Google Scholar] [CrossRef] [PubMed]
  36. Essahraui, S.; Lamaakal, I.; El Hamly, I.; Maleh, Y.; Ouahbi, I.; El Makkaoui, K.; Filali Bouami, M.; Pławiak, P.; Alfarraj, O.; Abd El-Latif, A.A. Real-Time Driver Drowsiness Detection Using Facial Analysis and Machine Learning Techniques. Sensors 2025, 25, 812. [Google Scholar] [CrossRef] [PubMed]
  37. Wang, C.-Y.; Mark Liao, H.-Y.; Wu, Y.-H.; Chen, P.-Y.; Hsieh, J.-W.; Yeh, I.-H. CSPNet: A New Backbone That Can Enhance Learning Capability of CNN. In Proceedings of the 2020 IEEE/CVF Conference on Computer Vision and Pattern Recognition Workshops (CVPRW), Seattle, WA, USA, 14–19 June 2020; pp. 1571–1580. [Google Scholar]
  38. Yun, S.; Han, D.; Chun, S.; Oh, S.J.; Yoo, Y.; Choe, J. CutMix: Regularization Strategy to Train Strong Classifiers with Localizable Features. In Proceedings of the 2019 IEEE/CVF International Conference on Computer Vision (ICCV), Seoul, Republic of Korea, 27 October–2 November 2019; pp. 6022–6031. [Google Scholar]
  39. Shi, M.; Chen, C.; Xiao, B.; Seo, J. Vision-Based Detection Method for Construction Site Monitoring by Integrating Data Augmentation and Semisupervised Learning. J. Constr. Eng. Manag. 2024, 150, 04024027. [Google Scholar] [CrossRef]
  40. Xiao, B.; Zhang, Y.; Chen, Y.; Yin, X. A Semi-Supervised Learning Detection Method for Vision-Based Monitoring of Construction Sites by Integrating Teacher-Student Networks and Data Augmentation. Adv. Eng. Inform. 2021, 50, 101372. [Google Scholar] [CrossRef]
  41. Liu, Y.; Wang, J. Personal Protective Equipment Detection for Construction Workers: A Novel Dataset and Enhanced YOLOv5 Approach. IEEE Access 2024, 12, 47338–47358. [Google Scholar] [CrossRef]
  42. Bang, S.; Baek, F.; Park, S.; Kim, W.; Kim, H. Image Augmentation to Improve Construction Resource Detection Using Generative Adversarial Networks, Cut-and-Paste, and Image Transformation Techniques. Autom. Constr. 2020, 115, 103198. [Google Scholar] [CrossRef]
  43. Suto, J. Using Data Augmentation to Improve the Generalization Capability of an Object Detector on Remote-Sensed Insect Trap Images. Sensors 2024, 24, 4502. [Google Scholar] [CrossRef]
  44. Sangha, H.S.; Darr, M.J. Influence of Model Size and Image Augmentations on Object Detection in Low-Contrast Complex Background Scenes. AI 2025, 6, 52. [Google Scholar] [CrossRef]
  45. Xiao, A.; Shen, B.; Tian, J.; Hu, Z. Differentiable RandAugment: Learning Selecting Weights and Magnitude Distributions of Image Transformations. IEEE Trans. Image Process. 2023, 32, 2413–2427. [Google Scholar] [CrossRef]
  46. Lee, Y.; Kang, G.; Kim, J.; Yoon, S.; Jeon, J. Generative AI-Driven Data Augmentation for Enhanced Construction Hazard Detection. Autom. Constr. 2025, 177, 106317. [Google Scholar] [CrossRef]
  47. Yin, Y.; Kaddour, J.; Zhang, X.; Nie, Y.; Liu, Z.; Kong, L.; Liu, Q. TTIDA: Controllable Generative Data Augmentation via Text-to-Text and Text-to-Image Models. arXiv 2023, arXiv:2304.08821. [Google Scholar]
  48. Aqeel, M.; Bellete, K.D.; Setti, F. RoadFusion: Latent Diffusion Model for Pavement Defect Detection. arXiv 2025, arXiv:2507.15346. [Google Scholar] [CrossRef]
  49. Li, Y.; Dong, X.; Chen, C.; Zhuang, W.; Lyu, L. A Simple Background Augmentation Method for Object Detection with Diffusion Model. In Computer Vision—ECCV 2024; Leonardis, A., Ricci, E., Roth, S., Russakovsky, O., Sattler, T., Varol, G., Eds.; Lecture Notes in Computer Science; Springer Nature: Cham, Switzerland, 2025; Volume 15124, pp. 462–479. ISBN 978-3-031-72847-1. [Google Scholar]
  50. Hsu, W.-Y.; Lin, J.-W. High-Quality Text-to-Image Generation Using High-Detail Feature-Preserving Network. Appl. Sci. 2025, 15, 706. [Google Scholar] [CrossRef]
  51. Thampanichwat, C.; Wongvorachan, T.; Sirisakdi, L.; Chunhajinda, P.; Bunyarittikit, S.; Wongmahasiri, R. Mindful Architecture from Text-to-Image AI Perspectives: A Case Study of DALL-E, Midjourney, and Stable Diffusion. Buildings 2025, 15, 972. [Google Scholar] [CrossRef]
  52. Borji, A. Generated Faces in the Wild: Quantitative Comparison of Stable Diffusion, Midjourney and DALL-E 2. arXiv 2022, arXiv:2210.00586. [Google Scholar]
  53. Zhou, L.; Zhang, L.; Konz, N. Computer Vision Techniques in Manufacturing. IEEE Trans. Syst. Man. Cybern. Syst. 2023, 53, 105–117. [Google Scholar] [CrossRef]
  54. Zhao, W.; Persello, C.; Stein, A. Building Outline Delineation: From Aerial Images to Polygons with an Improved End-to-End Learning Framework. ISPRS J. Photogramm. Remote Sens. 2021, 175, 119–131. [Google Scholar] [CrossRef]
  55. Jiang, P.; Ergu, D.; Liu, F.; Cai, Y.; Ma, B. A Review of Yolo Algorithm Developments. Procedia Comput. Sci. 2022, 199, 1066–1073. [Google Scholar] [CrossRef]
  56. Lou, H.; Duan, X.; Guo, J.; Liu, H.; Gu, J.; Bi, L.; Chen, H. DC-YOLOv8: Small-Size Object Detection Algorithm Based on Camera Sensor. Electronics 2023, 12, 2323. [Google Scholar] [CrossRef]
  57. Bukhsh, Z.A.; Jansen, N.; Saeed, A. Damage Detection Using In-Domain and Cross-Domain Transfer Learning. Neural Comput. Appl. 2021, 33, 16921–16936. [Google Scholar] [CrossRef]
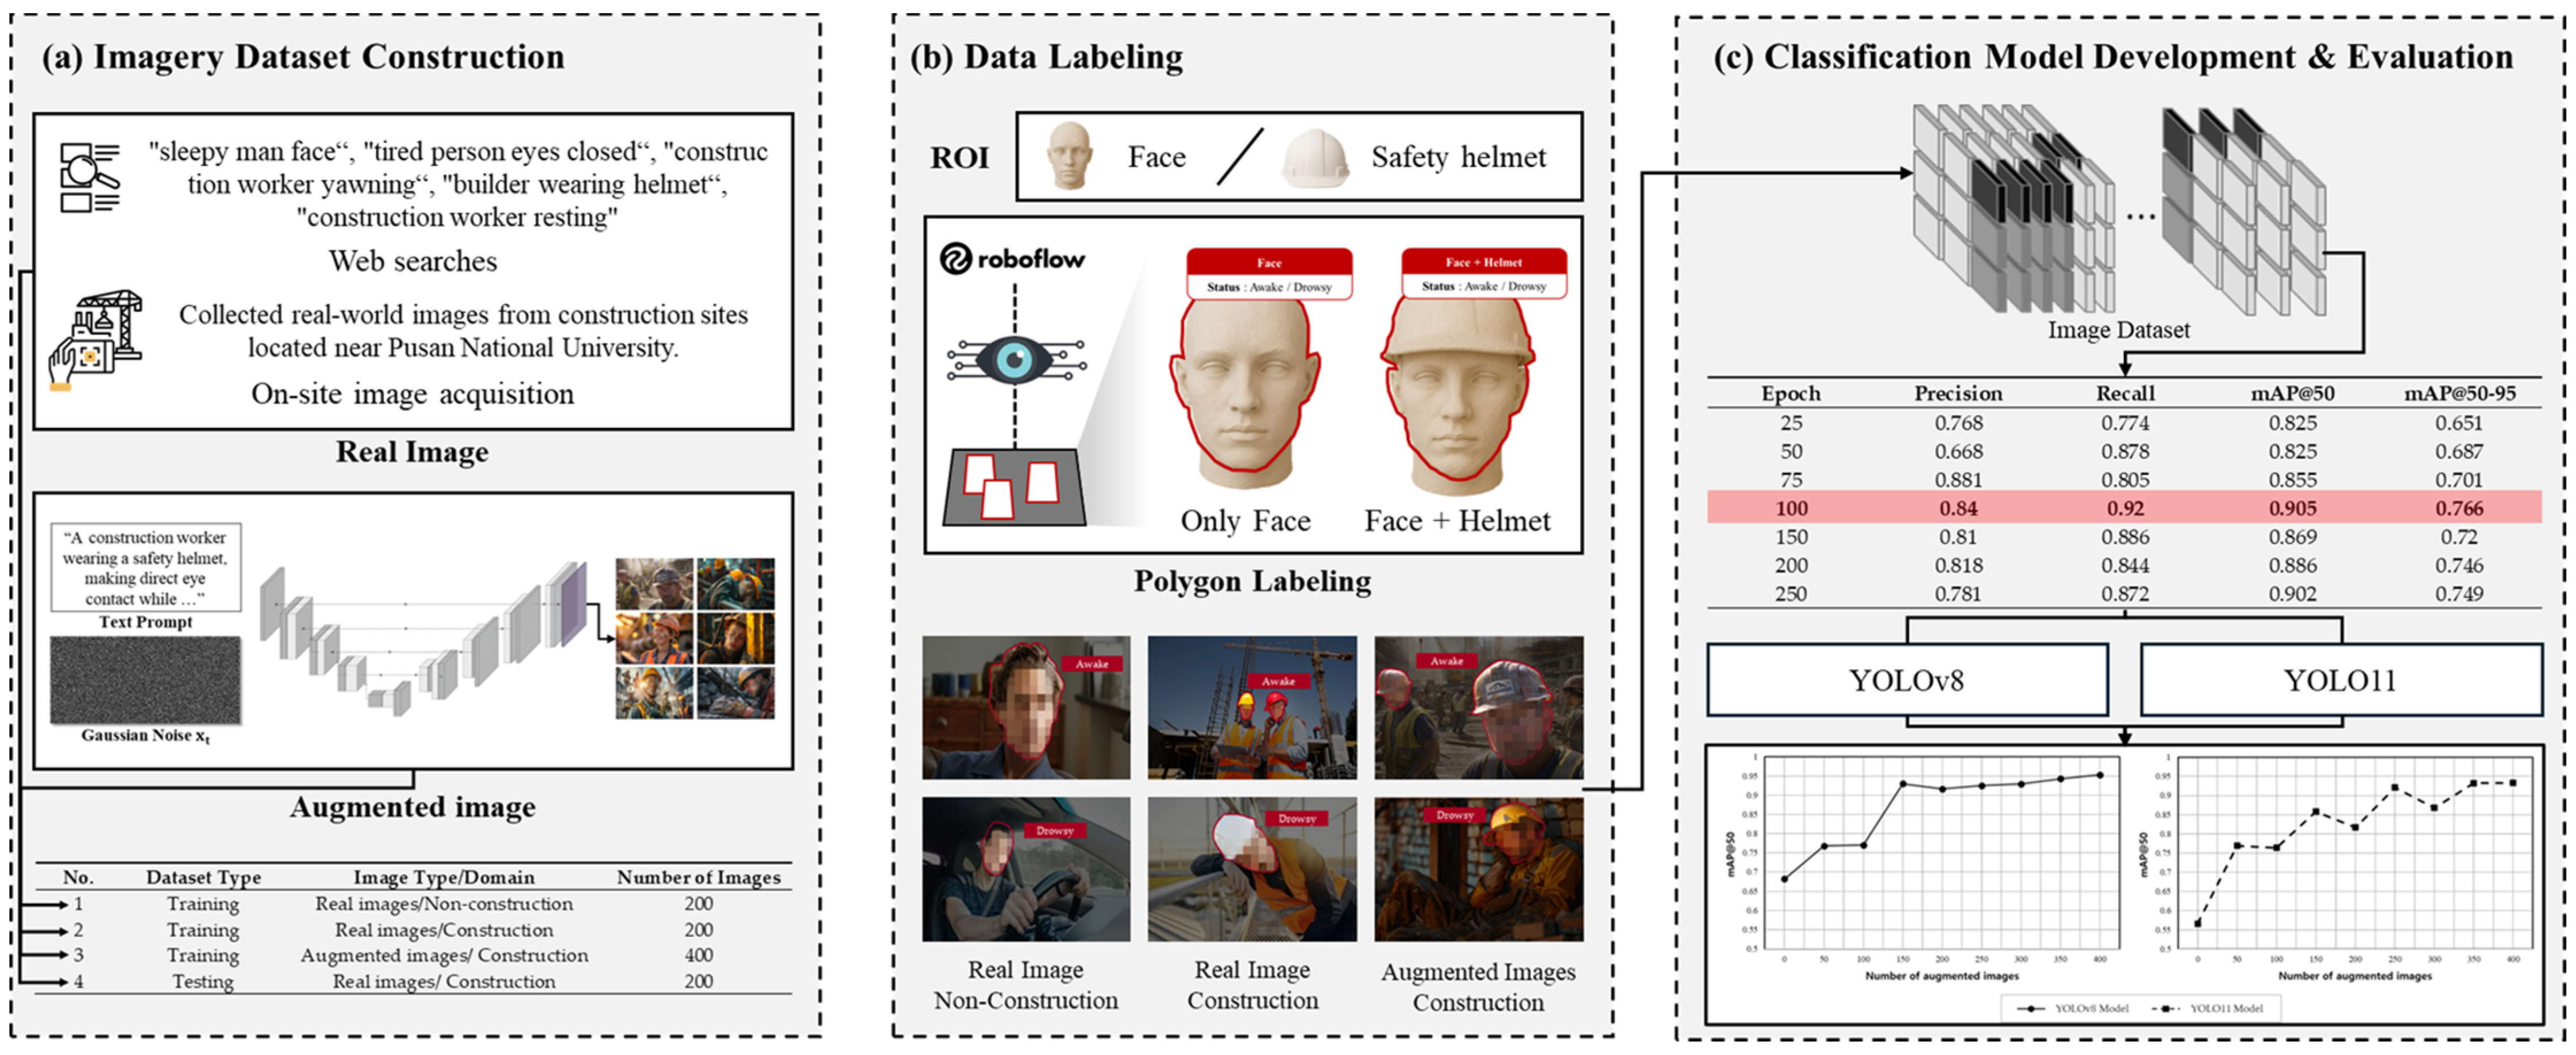
Figure 1. Research framework.
Sustainability 17 09158 g001
Figure 2. Illustrative examples of the datasets: (a) non-construction domain dataset; (b) construction domain dataset; (c) augmented dataset.
Sustainability 17 09158 g002
Figure 3. Examples of labeled images.
Sustainability 17 09158 g003
Figure 4. Comparison of drowsiness detection performance (YOLOv8 vs. YOLO11).
Sustainability 17 09158 g004
Table 1. Composition of developed datasets.
No.Dataset TypeImage Type/DomainNumber of Images
1TrainingReal images/Non-construction200
2TrainingReal images/Construction200
3TrainingAugmented images/Construction400
4TestingReal images/Construction200
Table 2. Performance while varying a single hyperparameter (epoch).
EpochPrecisionRecallmAP@50mAP@50-95
250.7680.7740.8250.651
500.6680.8780.8250.687
750.8810.8050.8550.701
1000.840.920.9050.766
1500.810.8860.8690.72
2000.8180.8440.8860.746
2500.7810.8720.9020.749
Table 3. Performance comparison based on the domain type of real images used for training.
ModelTraining Dataset
(Domain/Number)
Testing Dataset
(Domain/Number)
mAP@50mAP@50-95
YOLOv8Non-construction/200Construction/2000.5340.236
Construction/2000.6820.581
YOLO11Non-construction/2000.5350.241
Construction/2000.5660.493
Table 4. Drowsiness detection performance of YOLOv8 with augmented data.
No.Number of
Augmented Images
Total Number of
Training Data
mAP@50mAP@50-95
Baseline02000.6820.581
1502500.7680.693
21003000.770.668
31503500.930.836
42004000.9160.825
52504500.9250.821
63005000.9290.85
73505500.9430.87
84006000.9530.871
Table 5. Drowsiness detection performance of YOLO11 with augmented data.
No.Number of
Augmented Images
Total Number of
Training Data
mAP@50mAP@50-95
Baseline02000.5660.493
1502500.7690.682
21003000.7640.664
31503500.8580.773
42004000.8170.739
52504500.9210.827
63005000.8680.792
73505500.9320.837
84006000.9330.845
Disclaimer/Publisher’s Note: The statements, opinions and data contained in all publications are solely those of the individual author(s) and contributor(s) and not of MDPI and/or the editor(s). MDPI and/or the editor(s) disclaim responsibility for any injury to people or property resulting from any ideas, methods, instructions or products referred to in the content.