Article

A New Methodology for Optimising Railway Line Capacity: Improving Infrastructure for Sustainable Transport

1
Department of Railway Transport, University of Žilina, Univerzitná 8215/1010 26, 010 26 Žilina, Slovakia
2
Department of Transport Technology and Control, University of Pardubice, Studentská 95, 532 10 Pardubice, Czech Republic
*
Author to whom correspondence should be addressed.
Sustainability 2025, 17(20), 9101; https://doi.org/10.3390/su17209101
Submission received: 28 August 2025 / Revised: 7 October 2025 / Accepted: 11 October 2025 / Published: 14 October 2025

Abstract

The sufficient capacity of railway lines is a key prerequisite for stable and sustainable transport, not only on main or high-speed lines, but also on lines of regional importance that complement the network. Their indispensable role is manifested not only daily, but especially in the event of incidents on the backbone network. One of the main characteristics of these support lines is that they are largely single-track. Another important characteristic is that they alternate between sections with different traffic loads, which significantly changes the capacity requirements along the whole line. Existing modernisation approaches are frequently implemented in a non-differentiated manner, thereby lacking segment-specific prioritisation. The present paper introduces a novel methodology for systematic identification and the ranking of line sections for capacity upgrades. The approach is comprised of three distinct steps: first, the line is segmented using traffic homogeneity criteria; second, limiting journey times are determined through analytical capacity calculations based on the ninth decile of train volumes; and third, infrastructure measures are identified when the actual journey times exceed these thresholds. Potential interventions encompass the introduction of additional block sections, the implementation of passing loops, or the introduction of double-tracking. The methodology was applied to the Havlíčkův Brod–Jihlava–Znojmo line, thereby demonstrating its ability to detect bottlenecks and propose targeted measures. The findings indicate that there is considerable potential for enhancing capacity while concomitantly improving operational safety and cost efficiency. Consequently, this will serve to reinforce the role of diversionary lines within the broader context of the rail network. The proposed framework provides infrastructure managers with a generalisable tool with which to prioritise investments and support the long-term development of resilient and sustainable railway systems.

1. Introduction

A major issue today is the modal split change. Namely, due to the environmental impact, our society would like to shift more cargo from roads to rails. However, this effort is often in stark contrast to the available (free) capacity. This will require, among other things, modernisation of the rail infrastructure, particularly electrification and increasing capacity, not only on the main corridors, but also on other railway lines, which can act as diversionary routes by increasing their parameters [1,2,3,4]. In cooperation with the PSOs (public service obligations) and other RUs (railway undertakings), each infrastructure manager addresses this issue individually. Thus, there is no general approach to solving this question using an appropriate mathematical apparatus. This paper aims to provide such a systematic approach.
Although rail transport has a lower environmental impact than, for example, road transport, some aspects can still be improved. For example, the environmental cost of turnouts can be reduced by using under-sleeper pads [5]. A predictive maintenance system that uses big data and materials reuse can also help reduce negative environmental impacts [6,7]. Recycling old asphalt material from roads is also suitable for use as sub-ballast [8]. Train journeys also consume a lot of energy, but with electric traction, trains can reduce their energy consumption through regenerative braking [9]. All of these aspects increase the sustainability of the whole system and mean that rail is even more environmentally friendly than other modes of transport.
Although high-speed lines are regarded as a means of releasing capacity on conventional freight corridors, there may be insufficient released capacity once operational due to the development of regional passenger services during the daytime. One potential solution to this issue is the implementation of traffic optimisation strategies, which aim to maximise the utilisation of train capacity by passengers [10]. However, this may prove insufficient, considering the projected growth in rail traffic. It is therefore important to consider not only the construction of high-speed lines and the upgrading of existing corridors, but also the development of other lines that are tangential (and mostly single-track) and have the potential to relieve the main corridors and major railway nodes and serve as diversionary alternatives in the event of closures, emergencies, or even maintenance works on the main lines [11,12]. In such cases, re-routing can help reduce delays and improve passenger satisfaction.
At the same time, these lines can complement the high-speed network and thus increase its reach. Freight traffic will also benefit from the increased capacity of these lines, not only because of the possibility of diverting traffic and avoiding the main nodes, but also through the possibility of running more freight trains with higher parameters (train length 740 m, higher line load class). A modern infrastructure can help to ensure that rail becomes more integrated into Industry 4.0 [7]. With regard to the transport of goods, tangential rail lines can also be used to optimise the logistics chains [13].
This article aims to present a new methodology that will facilitate the selection of sections of routes that require modification to achieve the desired level of capacity utilisation. Route modifications and railway infrastructure expansions are primarily implemented when the existing capacity is inadequate to meet the demands of the transportation system [14,15]. Usually, the initial step towards route modernisation is undertaking a feasibility study. This study addresses the development of traffic, the economic potential of the line, and the possibilities for infrastructure development. However, the return on investment is difficult to compare as there is no consistency in determining future traffic or timetables [16].
In contradistinction to prevailing methodologies, which are frequently implemented in a homogeneous manner across entire networks, the proposed approach introduces a systematic, segment-specific framework for the identification and prioritisation of sections requiring modernisation.
The first step is to analyse the existing line and its current operational status including the timetable. This analysis is then used for the division of the line into segments with a consistent number of trains, ensuring logical continuity or prioritisation. This assessment, coupled with capacity calculations, enables the identification of critical points (segments). When lines are modernised, certain infrastructure measures must be implemented to increase the capacity. These include increasing the line speed or speed at switch point areas by upgrading switches to allow higher speeds in the direction of divergence. It is recommended that these speed-related measures be implemented in any line upgrade.
In addition to the measures affecting speed, one way to increase the railway’s capacity is to implement infrastructure measures. These may include, for example, the double-tracking of the line, the construction of a new passing bay, and the modernisation or installation of line signalling equipment (or the increase of the number of block sections on the line). This methodology addresses which sections are to be selected for implementing these measures.

2. State-of-the-Art

Many methods can be employed to ascertain the capacity of a railway line. Capacity can be determined on line sections or in a station, where the problem is more sophisticated due to the collisions of train paths in switch point areas, which are determined by the complexity of the given station [17,18]. Static models can be used to calculate station capacity. One of these is the “Kaban” tool used in Sweden [19].
The fundamental approach is the utilisation of analytical calculations, which are founded upon the compression method. Generally, the higher the capacity utilisation, the more susceptible the line is to transmission delays between trains and poorer timetable performance [20,21].
An alternative approach is using simulation software, specifically OpenTrack, which can incorporate stochastic phenomena [22]. With the help of simulation, infrastructure planning can be as efficient as possible within the framework of possible investments [23].
Another option is to use graph theory, linear programming, and polyhedral geometry [24]. However, an additional approach is using probability, for example, based on Markov chains and queueing theory [25,26]. A further option for rail capacity management is using multi-objective capacity models, which are a more comprehensive approach to the problem [27].
Alternatively, graphical methods may be designed to interact with the timetable and utilise the ratio of the timetable area to the area occupied by the train on the infrastructure element under consideration [28].
Consequently, the graphical method does not necessitate compression like the analytical method [29,30,31]. The compression can be carried out on the entire line or individual sections. This is conducted in different ways depending on the method used [32]. To transform heterogeneous traffic, where the train sequence is important and decisive, into homogeneous traffic, it is possible to use an equalised train, which is artificially created and whose parameters are determined by weighted parameters of different types of trains [33].
Each of these methods has its own set of advantages and disadvantages. They differ in terms of the number of input parameters, the level of knowledge required regarding the traffic on the line, and the complexity of the results. However, the analytical method has the advantage of not necessitating a detailed knowledge of numerous specifics while still enabling the attainment of a result.
There are several ways to increase the capacity of the line. One is to change the organisation, both on the part of the infrastructure manager (more staff, timetabling, rerouting in cooperation with railway undertakings) as well as on the part of the railway undertakings, especially if there are more RUs. Mutual coordination can reduce dwell times, especially for freight transport, and thus increase the whole system’s efficiency [3,10,34,35].
The other way to reach a higher capacity is to upgrade the infrastructure by increasing the speed and the number of compartments on the line or using ERTMS and its benefits (in particular, ETCS L2 and higher). The number of block sections (even moving ones at a higher implementation level) can be increased using this system [36,37,38].
Current practices are typically incapable of reflecting the heterogeneity of single-track lines, resulting in investment decisions that may not optimally address the capacity constraints. The methodology is tailored to individual segments, ensuring that infrastructure investments are directed towards the segments that deliver the greatest efficiency and sustainability benefits. This approach is comprehensive in nature, encompassing not only the determination of capacity calculations, but also the specification of the measures to be implemented in specific sections.

3. Materials and Methods

The question thus arises as to how one might determine the specific sections of the line in which infrastructure measures should be carried out in a manner that is both context-specific and coherent.
The methodology for determining journey time limits provides a framework for selecting the sections where capacity enhancement measures must be implemented.
The following inputs are employed in the calculation [30]:
  • A—The analysis period defines the duration of the assessment phase, which is used to ascertain the number of trains and capacity [h];
  • ND9—The ninth decile of the number of trains in the critical section. The ninth decile (D9) is defined as the value below which 90% of all data points in the set fall. In other words, 90% of the values observed are lower than or equal to this value, and only 10% of the values are higher. It represents the value of the ninth decile of the daily number of trains, ranked from highest to lowest [-];
    • d—The item corresponding to the ninth decile is ordered as follows [-]:
    d = a 10
    • a—The length of the observation period is defined as the number of days over which the observation is conducted [-];
  • NVYHL—The prospective number of trains for the period (the expected number of trains for the period) [-];
  • b—Unit occupation time [min];
  • bn—The most unfavourable journey time is the highest journey time observed in the critical section of the sub-track. If the highest journey time differs significantly from the others, the next journey time in order from the highest is used as the reference point [min];
  • n—Infrastructural capacity is defined as the number of feasible journeys that can be accommodated on a given infrastructure within a specified time period. The relation between capacity and unit occupancy time over the course of a one-hour monitoring period is pictured in Figure 1 [-];
n = A × 60 b
  • k—Step of unit occupation time by which the unit occupation time is gradually reduced. The value of this variable can be arbitrarily small (which makes it possible to obtain a value of utilisation closer to the desired utilisation), but in the reality of railways and timetabling, values of 0.5 or 1 min are appropriate [min];
  • Kp—Target capacity utilisation—targeted utilisation for a given line segment. The valuation is determined with the aim of ensuring compliance with the relevant regulatory framework. Furthermore, it is also intended to establish a certain reserve [-].

4. Calculation

When examining the relationship between unit occupancy time and capacity, it was found that the percentage change in unit occupancy time between a value of b and a value of b one step k higher was the same as the percentage change in capacity for values of b one step k higher and b two steps k higher:
b + k b b + k = n b + k n b + 2 k n b + 2 k
Which, according to the formulas and adjustments, is as follows:
b + k b b + k = A   × 60 b + k A   × 60 b + 2 k A   ×   60 b + 2 k
k b + k = b + 2 k b + k b + 2 k b + 2 k
k b + k = b + 2 k b + k 1
k = b + 2 k ( b + k )
k = b + 2 k b k
k = k
The result that k is equal to k proves that the two procedures reach the same values and are applicable.
Subsequently, the calculated values are as follows:
  • K—Capacity utilisation—the ratio of the number of journeys to the total capacity over a specified time period [-];
K = N n
  • KVYHL—Capacity utilisation of current infrastructure with the prospective number of trains—the utilisation of the capacity for the expected number of trains on the existing infrastructure. This formula is based on inserting the formula for capacity n into the formula for capacity utilisation K, where the reference number of trains is the prospective number of trains NVYHL [-];
K V Y H L = N V Y H L ·   b n A   ·   60
  • Kb—Capacity utilisation for the given occupation time, with the prospective number of trains—is used to calculate the capacity utilisation for different values of b, which are successive with a distance between them determined by the value of k [-];
K b = K V Y H L b n b k   ·   b + k   b 1 + 1
The element b n b k indicates the number of steps required to change from bn to b.
  • blim—Limiting journey time—a value of a journey time b in minutes, beyond which it is necessary to implement infrastructure measures. The value of this variable is defined by the relation of Kb ≤ Klim, which must be respected to ensure that the infrastructure meets the future demands placed on it and has sufficient capacity headroom to allow for traffic development [min].
The process of identifying infrastructure modifications must be divided into three steps:
  • division of the line into segments;
  • determination of the limiting journey time for each segment;
  • identification of an infrastructure measure to increase capacity.
The individual steps are introduced in the following section.

4.1. Division of the Line into Segments

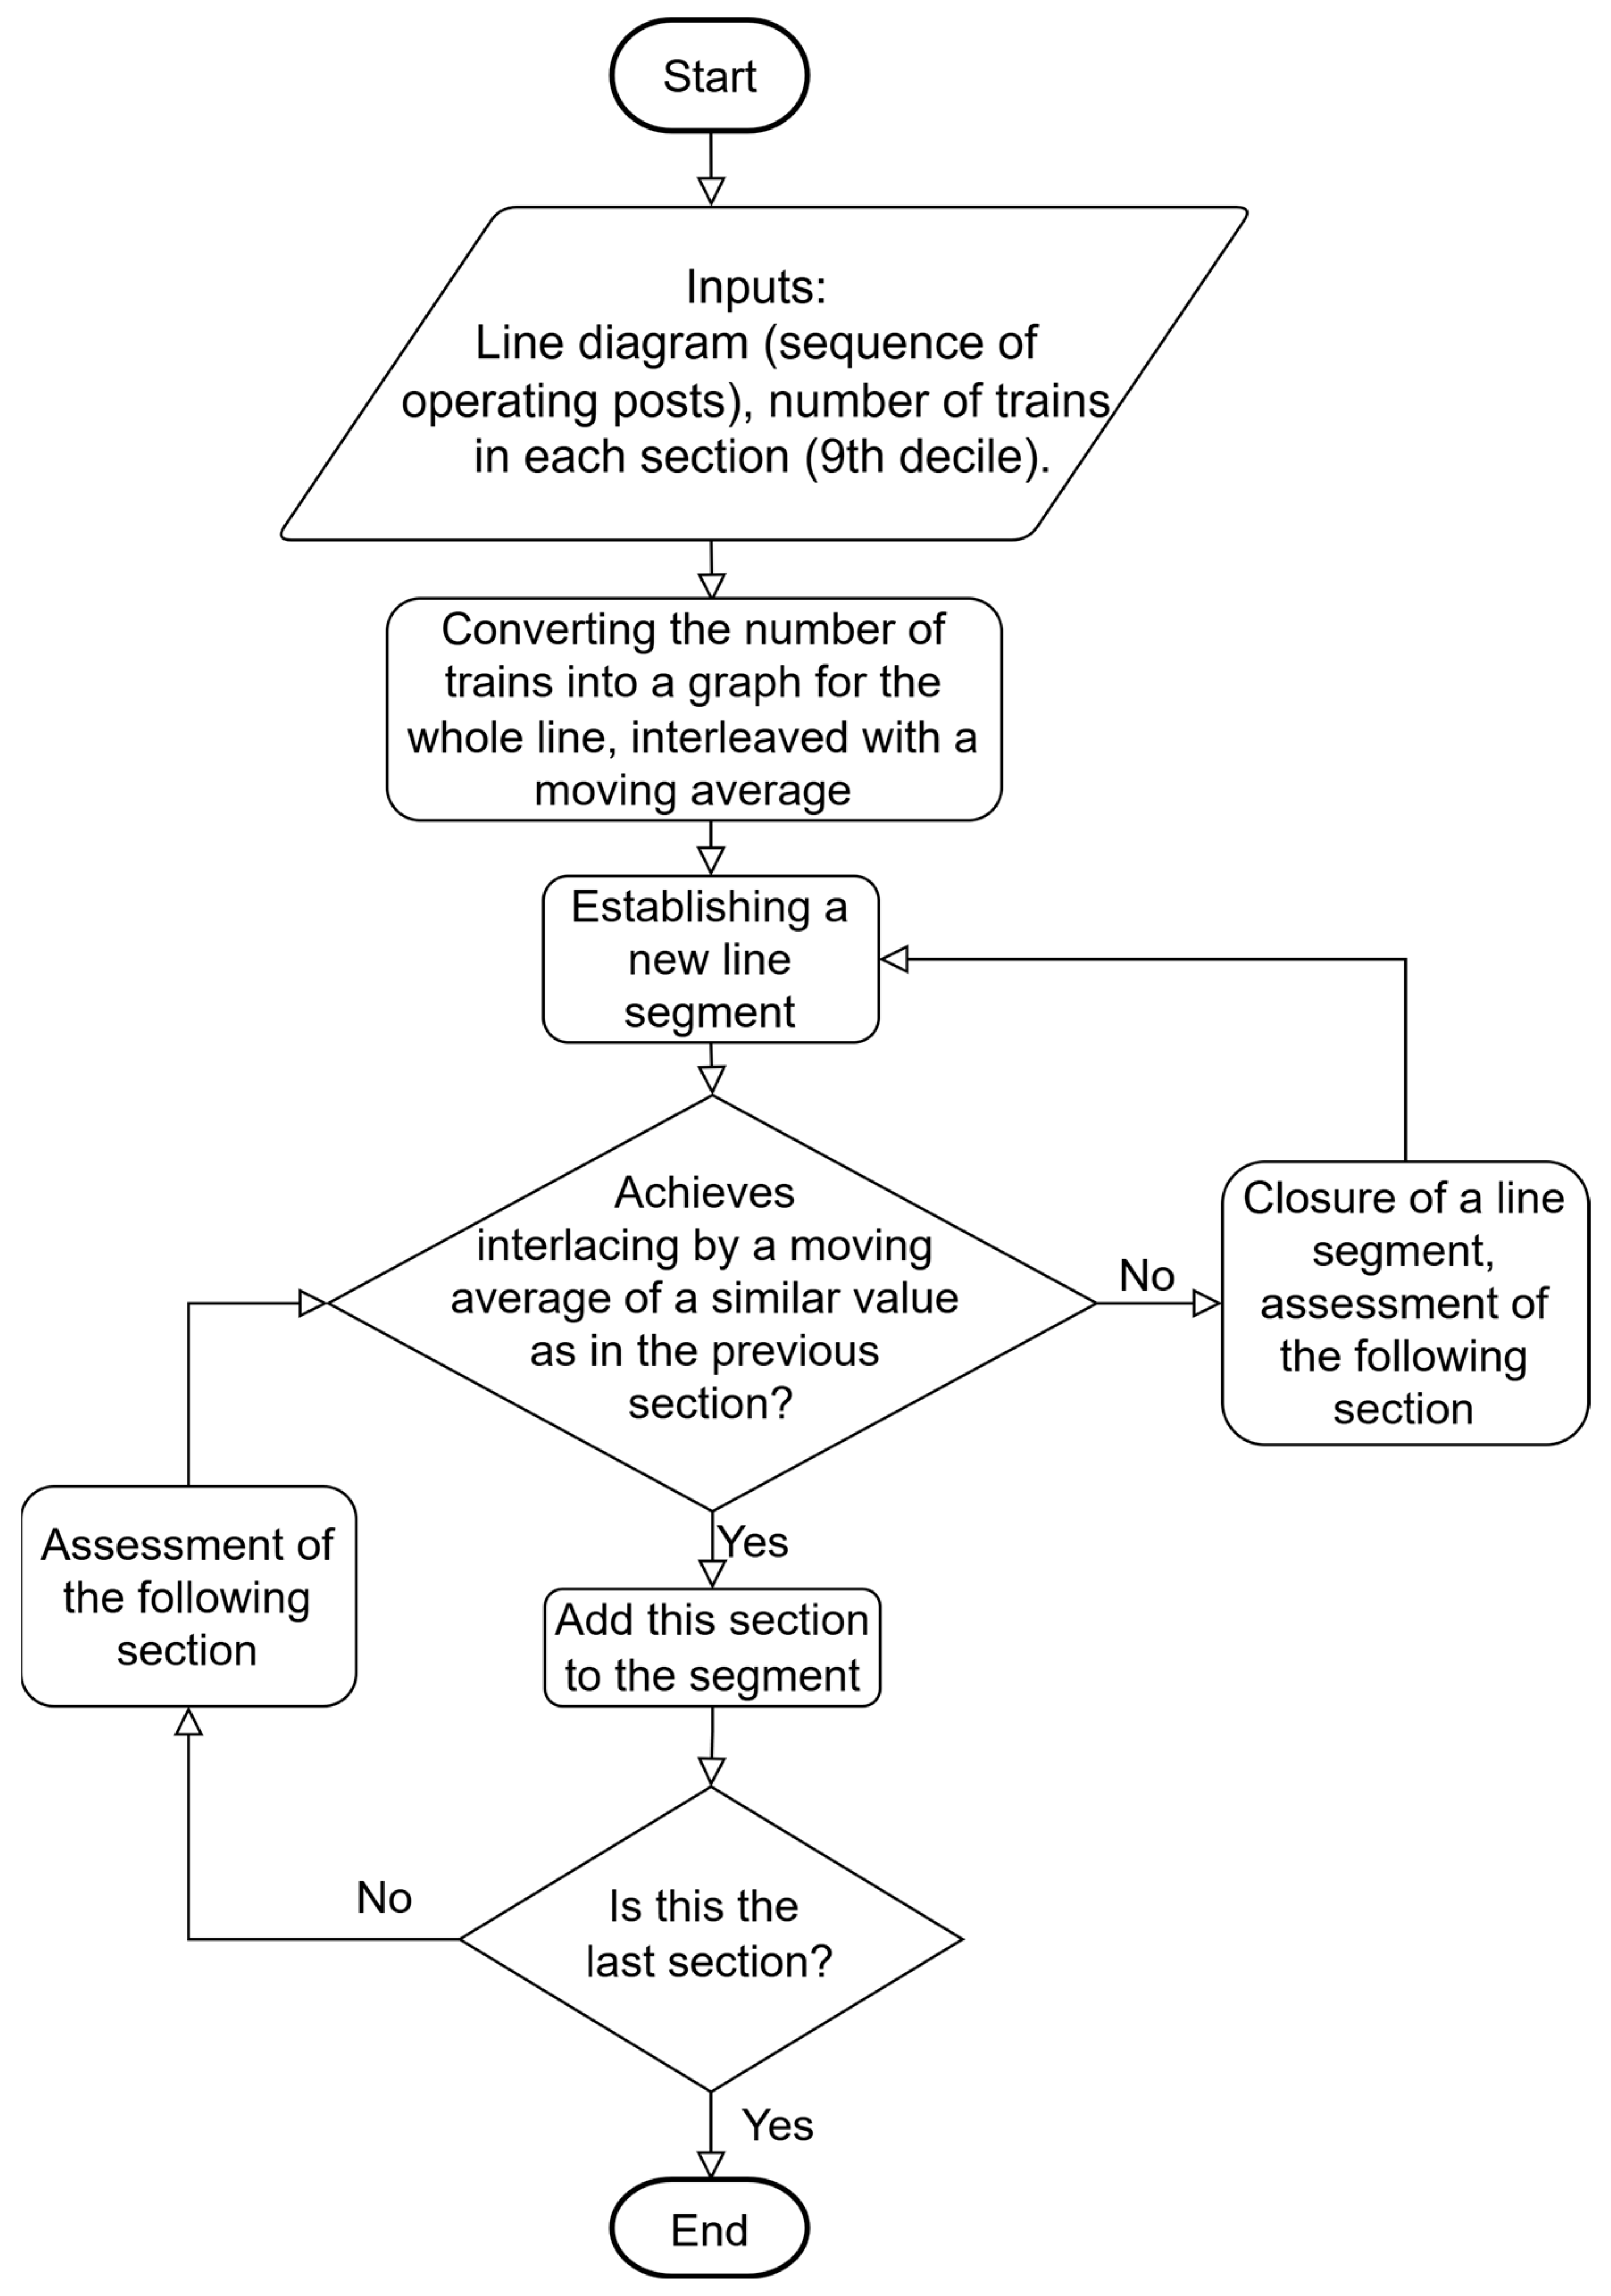
The first step of establishing an infrastructure measure is to divide the line into smaller segments, which contain several line sections connected to each other with a similar traffic volume.
The route is divided into segments using a moving average. Initially, a new segment must be created, and then the 9th decile moving average values must be compared in each section with the previous one in the segment. In addition, the routing of passenger lines should also be considered in the comparison. According to this criterion, the line is divided into several segments. The procedure is illustrated in Figure 2.

4.2. Determination of the Limiting Journey Time for a Segment

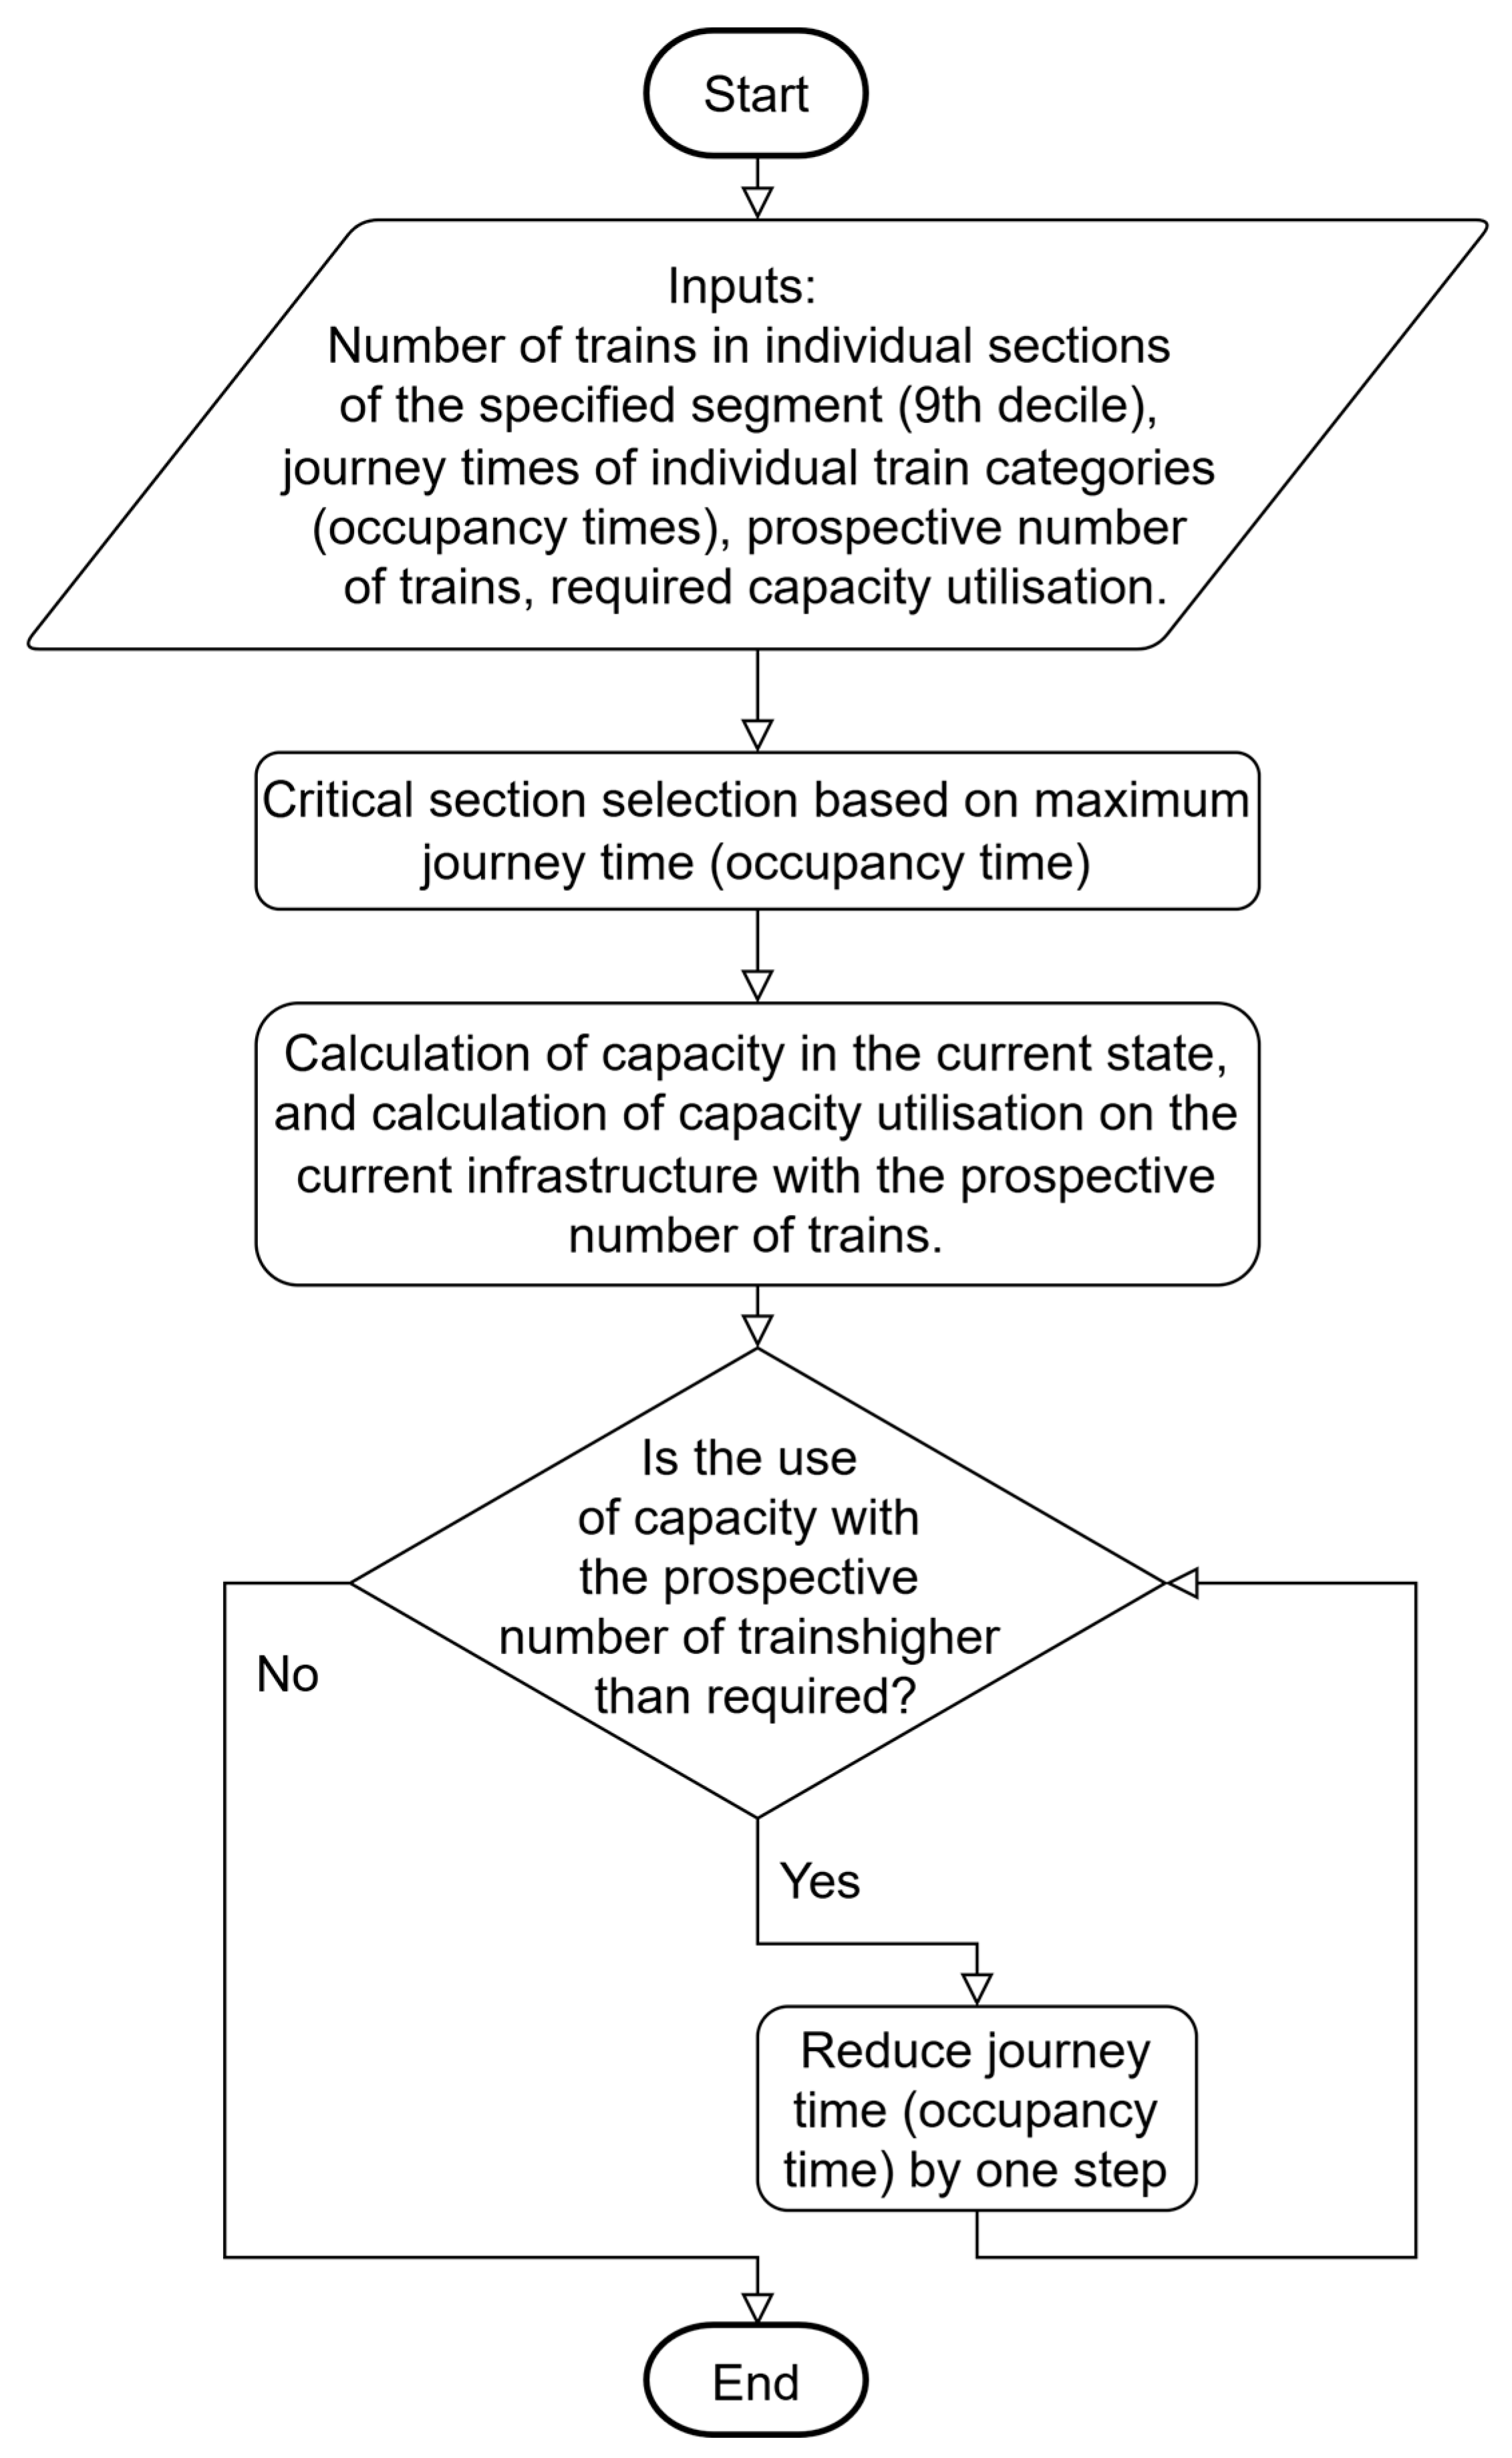
The second step is to ascertain the limiting journey time of the given segment. The initial step is to select the segment with the highest travel time (occupancy time). If this value differs significantly from the others, the next highest in the sequence is selected.
Subsequently, this occupancy time is reduced stepwise until the desired capacity utilisation with the prospective number of trains is reached. This reduction is achieved by a gradual decrease of one step at a time. The detailed sequence of actions is delineated in Figure 3.

4.3. Identification of an Infrastructure Measure to Increase Capacity

The final step is determining the appropriate course of action for each section.
Subsequently, the calculated limiting journey time can be compared with the current train journey times (or their average or weighted average, which may consider the diversity of traffic). If these current journey times exceed the limiting journey time, an infrastructure measure must be proposed.
For the sake of simplicity, the infrastructure measures were divided into three categories:
  • Division of the track section into discrete block sections;
  • Division of the line with a track branching (station, passing loop);
  • Increasing the number of tracks (double tracking).
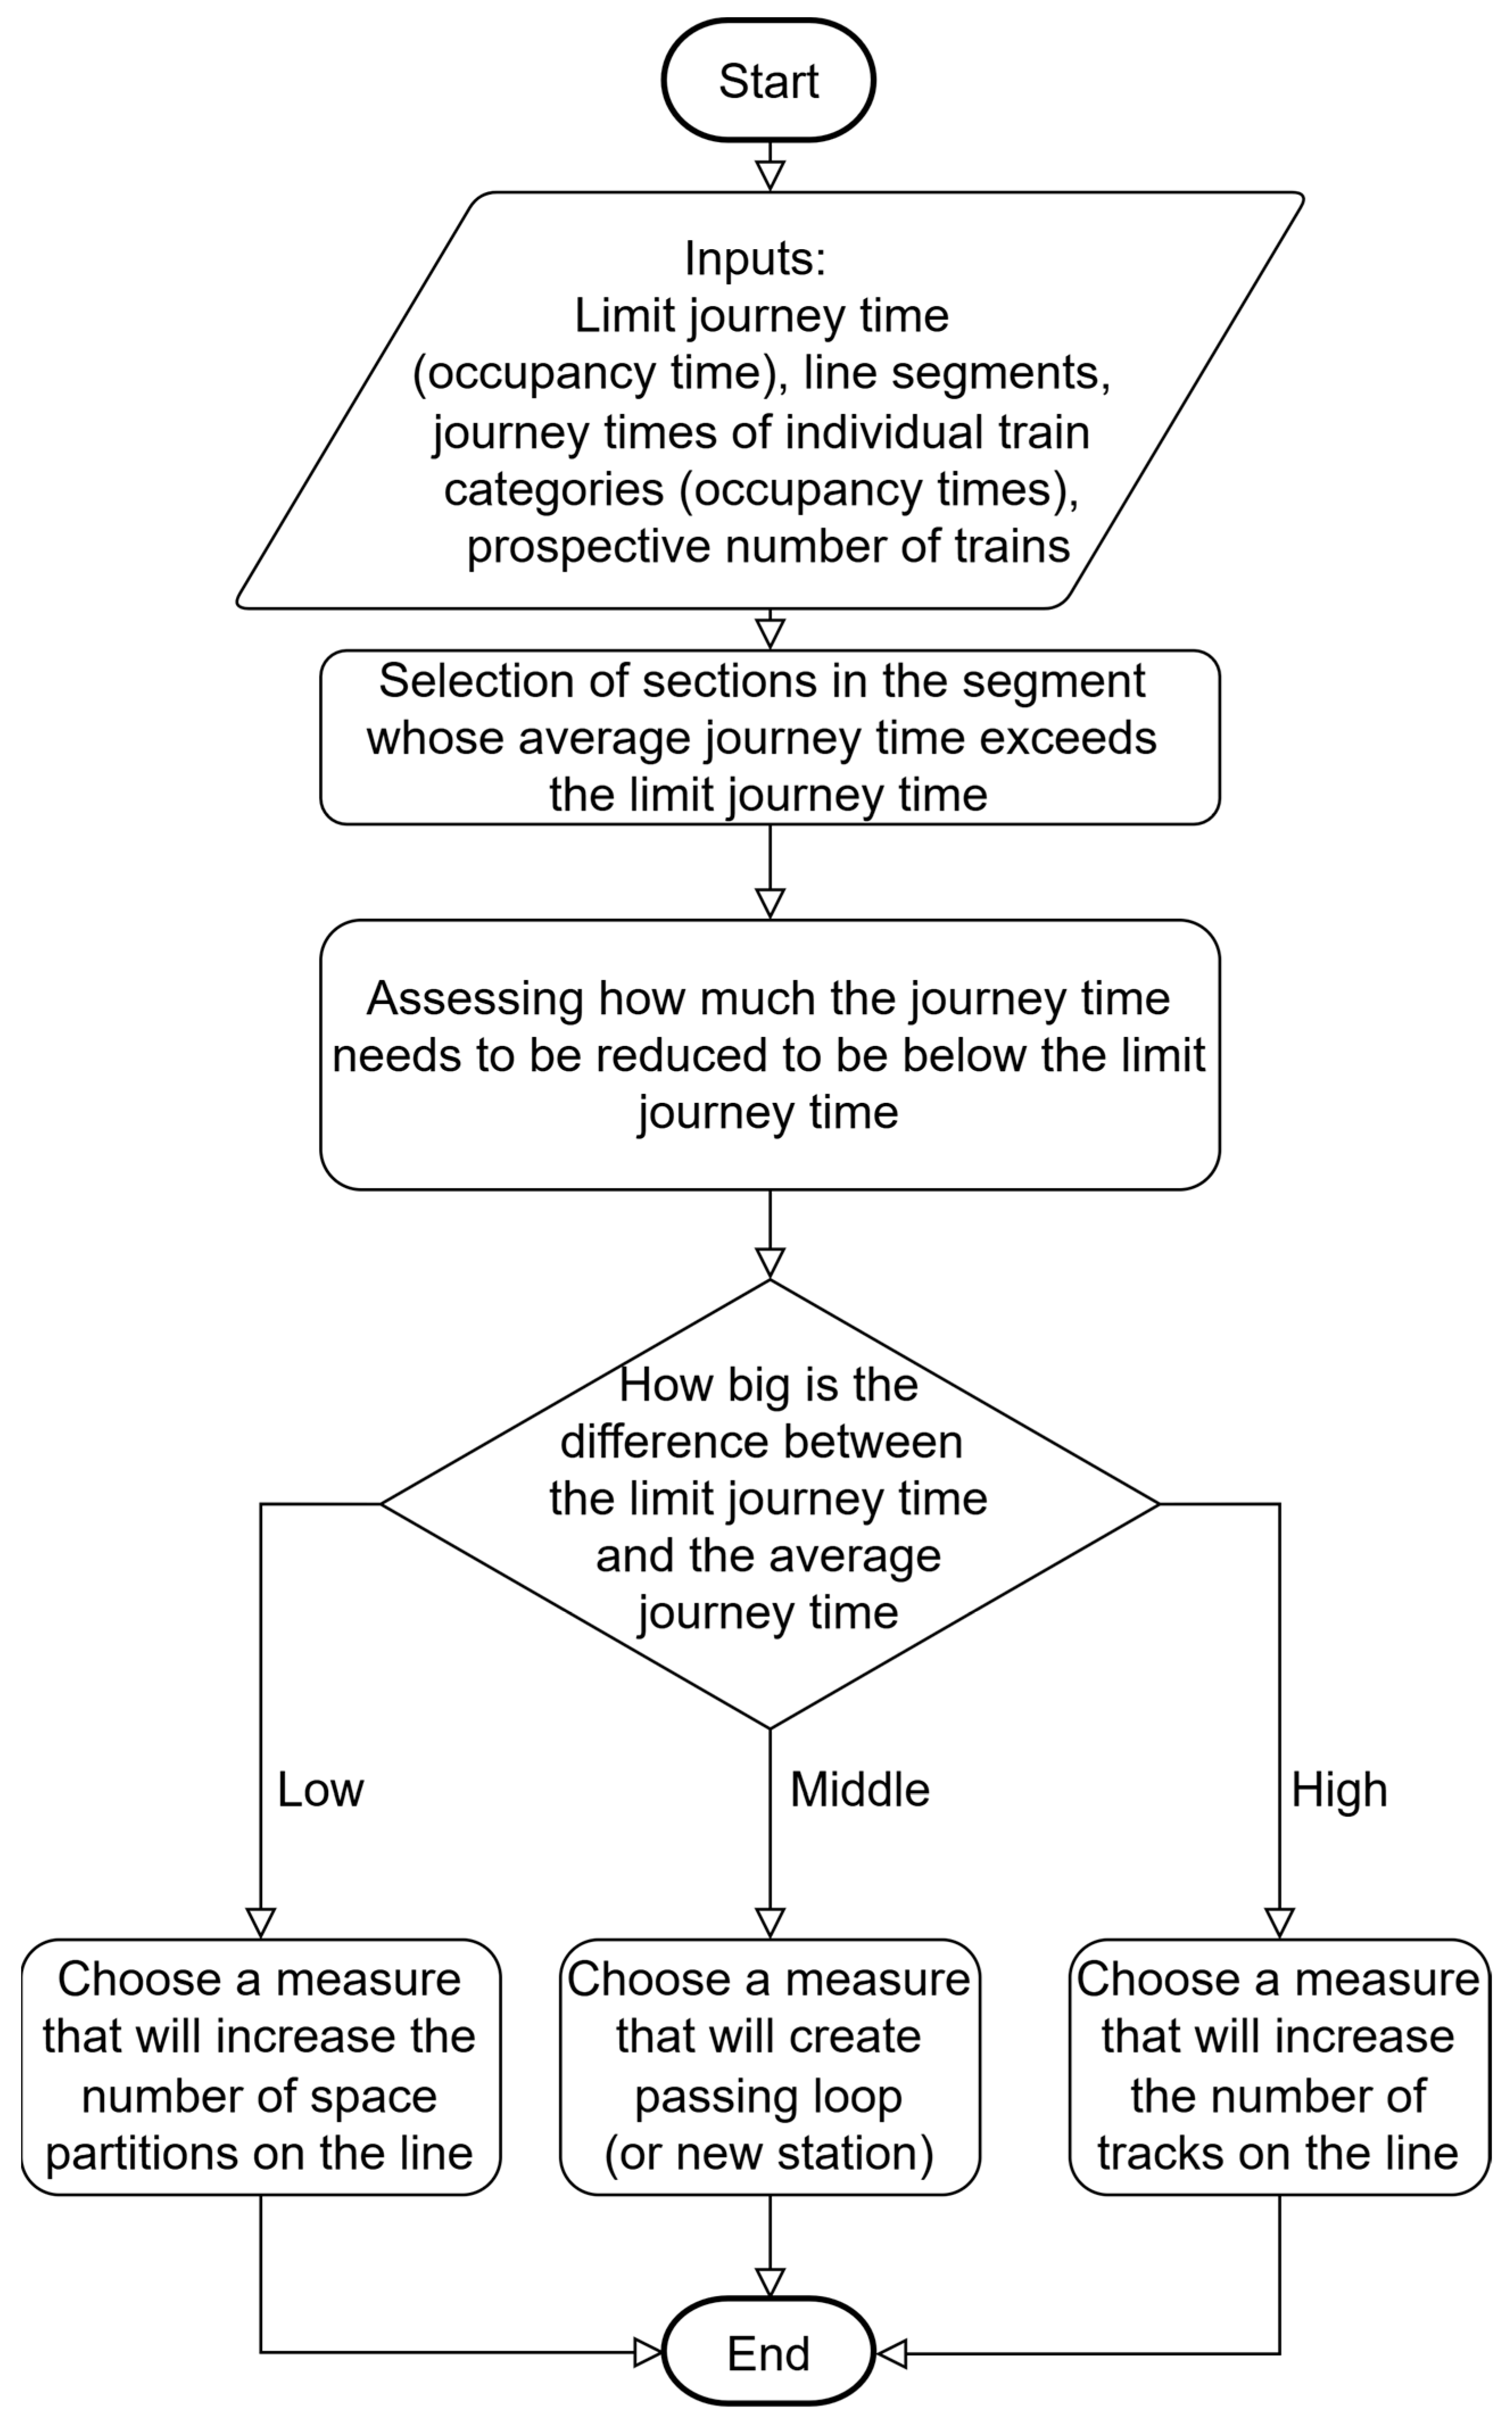
To ascertain the precise infrastructure measure, it is essential to consider, in addition to the magnitude of the deviation from the prescribed journey time, the potential operational concept under evaluation and the resulting tact nodes and transport facilities for tact crossing. Furthermore, the infrastructure arrangements must be modified to align with these constraints. Figure 4 illustrates the aforementioned sequence.
In instances where the permitted journey time is exceeded significantly, it is recommended that double-track or multiple-track alignment, or the line splitting by traffic with track branching, be considered. In such cases, it is essential to consider the spatial conditions to ensure the feasibility of constructing a station or a second track while also aligning with the investment capabilities of the infrastructure manager.
In the event of a lower exceedance of the limiting value or the inability to implement alternative infrastructure measures, it is recommended that the line section be divided into additional block compartments. This approach will be particularly beneficial when coupling trains of the same direction.
The differentiation between low, middle, and high deviations from the designated limiting journey time must be made within the context of the route, taking into account the planned transport technology and the feasibility of infrastructure modifications. In numerical terms, the differences are approximately 20% for low, 30–50% for middle, and greater for high percentage from limiting journey time. The values can be modified according to the importance of the given line segment.

5. Results

This procedure was applied to the Havlíčkův Brod–Jihlava–Znojmo line, potentially relieving the Brno node. However, it is necessary to modernise and electrify the line to increase its capacity, which will enable the transfer of part of the freight traffic not only from the Havlíčkův Brod–Brno–Břeclav branch, but also from other modes of transport to this line. Modernising the infrastructure can significantly increase the operational safety and significantly save traffic management staff.
Critical points were identified through an analysis of traffic and infrastructure. At these locations, measures were proposed to improve the existing condition, rendering the line suitable for future needs.
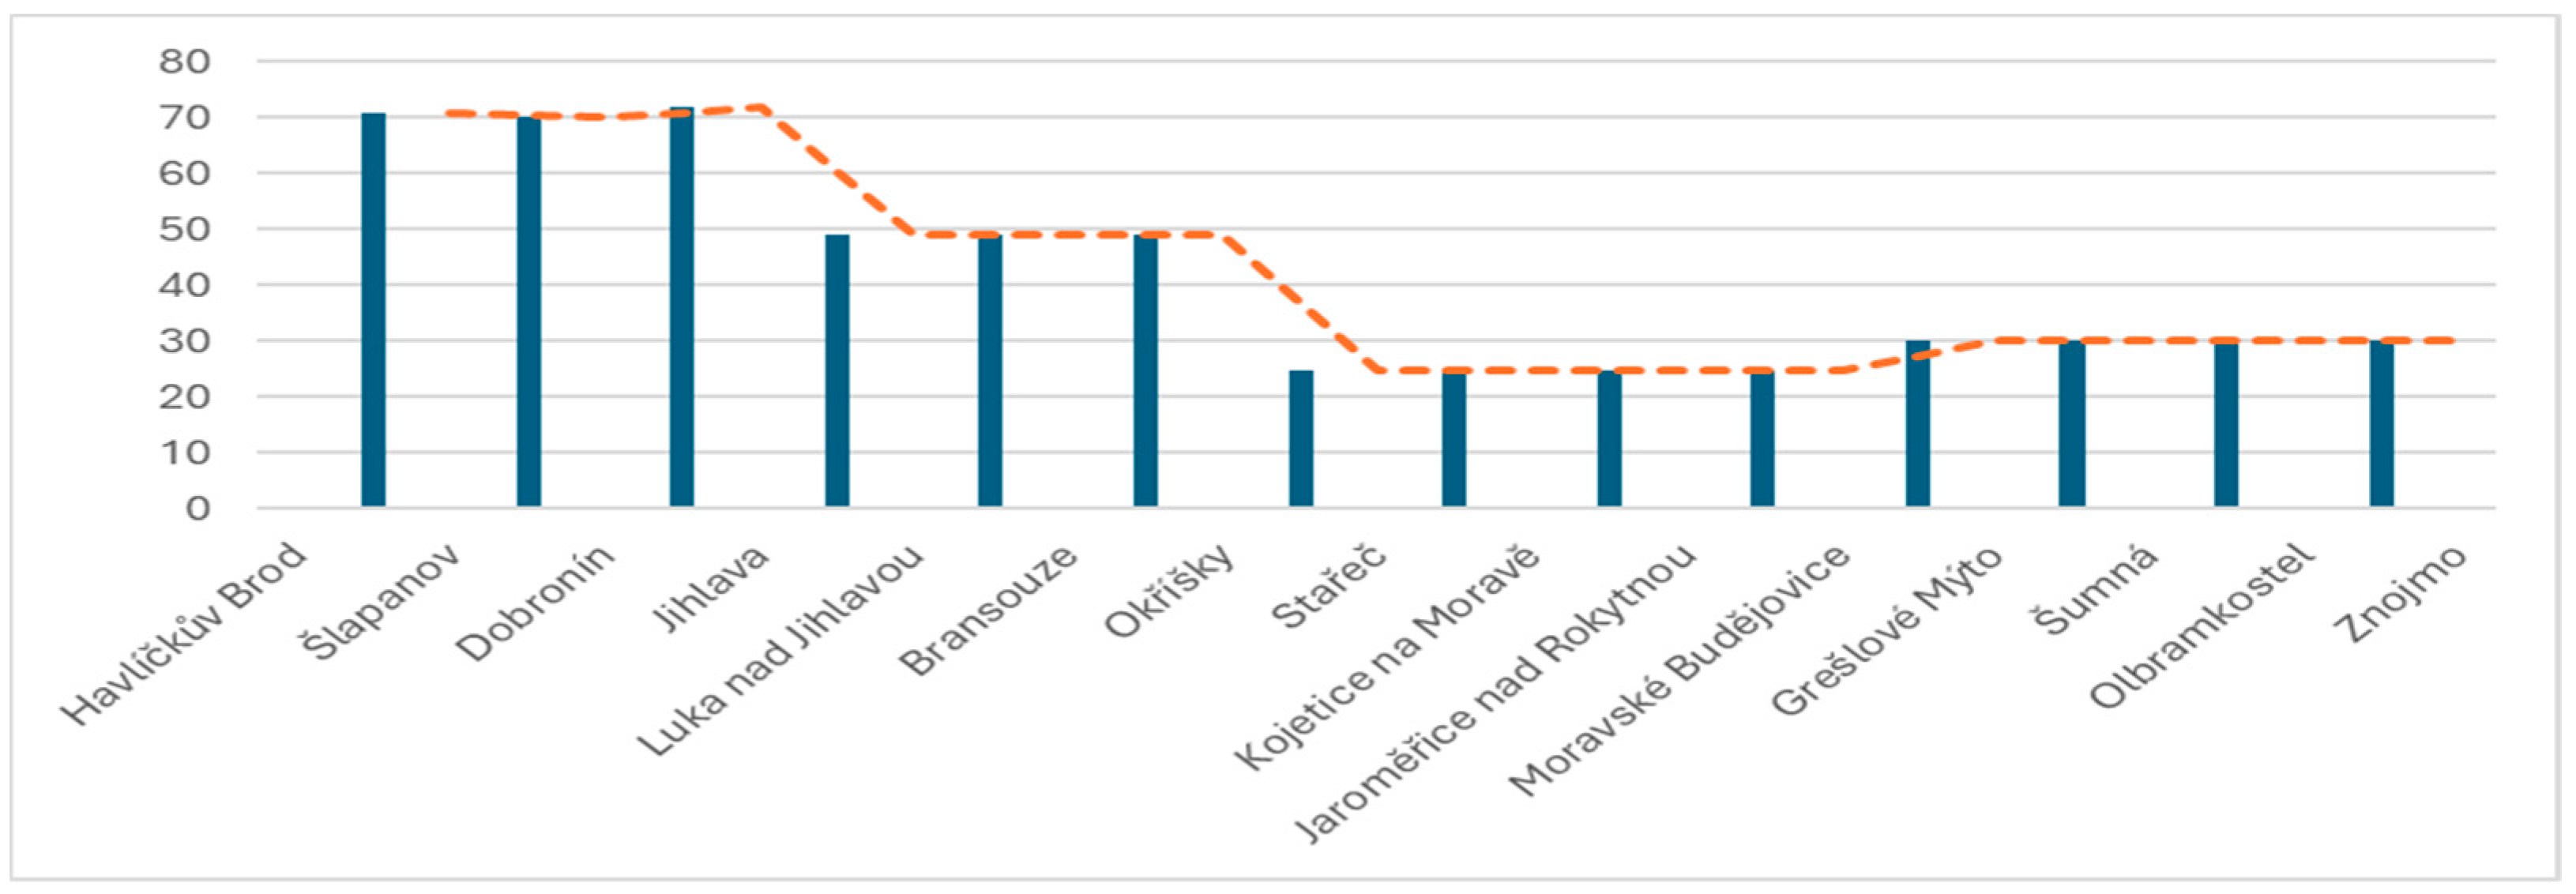
The average number of trains in each section was determined based on the ninth decile of train counts from 2019 to 2023 (each year between 1 January and 31 March). This is shown in Table 1 and Figure 5, where the graph is interlaced with the moving average.
Table 2 presents the journey times of trains between stations in both directions. The data were classified into three categories: passenger trains (Os), fast trains (R), and regular freight trains (Pn; journey times of Pn 62331/62330, running with the 742 series).
Cells highlighted in green indicate the most unfavourable journey time. In the case of the Olbramkostel—Znojmo section, the second highest value was chosen because the highest value (marked in red) was too different from the others.
Based on the algorithm described, Table 3 shows the inputs used to calculate the limiting journey time output values.
From these values, the mean and limiting journey times were calculated, resulting in 5 min in the Havlíčkův Brod–Jihlava section, 8 min in the Jihlava–Okříšky section, and 9 min in the Okříšky–Znojmo section.
The specified journey time limit was exceeded in the following sections: Havlíčkův Brod–Stařeč, Moravské Budějovice–Grešlové Mýto, and Olbramkostel–Znojmo.
From an analysis of the 9th decile values, it is evident that the most significant adjustments must be made in the Havlíčkův Brod–Jihlava section due to the flexibility of the Havlíčkův Brod and Jihlava interchanges. Therefore, it is proposed that this section should be fully double-tracked.
It is similarly important to consider the Jihlava–Okříšky section. In light of the proposed operational concept and the anticipated increase in freight transport, it is suggested that two passing loops (Kosov and Rokštejn) be established, along with a double-track extension of Okříšky Station. This latter point is also regarded as a tact node for crossing and connecting links.
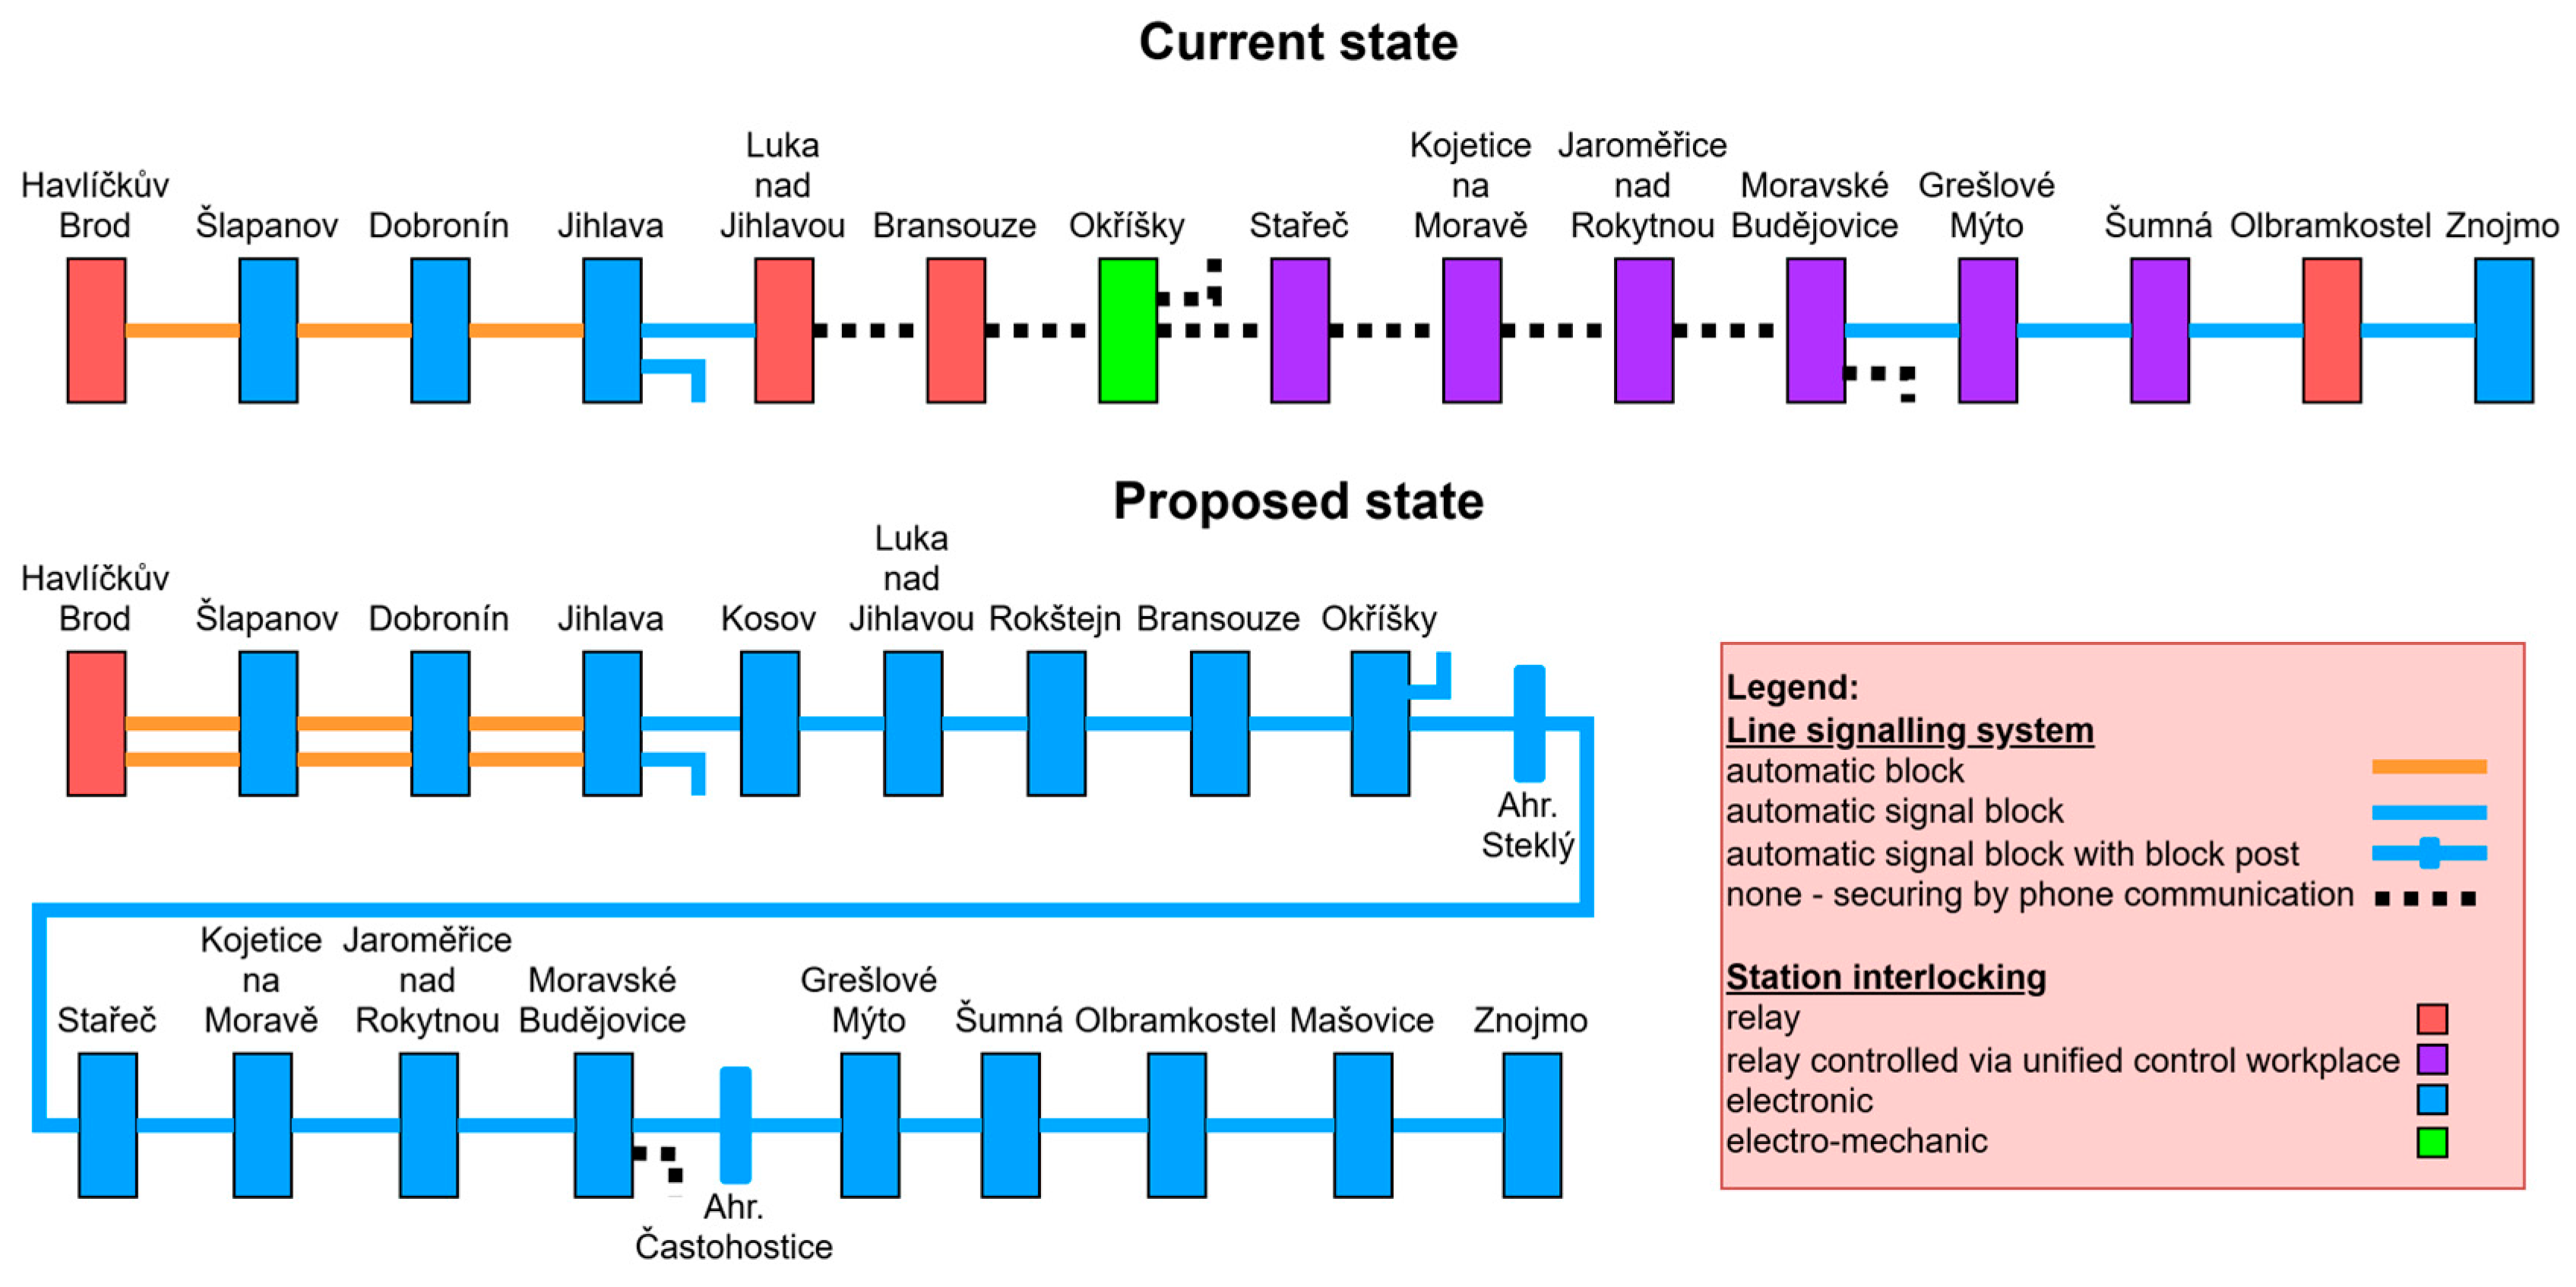
In the remaining section, Okříšky–Znojmo, the number of trains is not as high, and the modifications to the line may not be as significant as in the previous sections. It is therefore proposed that the line be divided into two spatial sections in these sections (Okříšky–Stařeč and Moravské Budějovice–Grešlové Mýto). In the section Olbramkostel–Znojmo, given the lengthy journey times, the Mašovice passing loop is proposed to be constructed. Figure 6 presents a current and proposed line diagram illustrating the type of station interlocking and track-side signalling equipment.
The local line Moravské Budějovice–Jemnice is currently operated under simplified control according to the SŽ D3 regulation, where safety is ensured by telephone communication between the driver and the dispatcher. As passenger traffic on the line is only operated on weekends and seasonally, and freight traffic is organised regularly (but with only one pair of trains), it is proposed that this type of control be maintained. In the long-term, however, it would also be advisable to modernise and secure this line, preferably by introducing remote control and transferring the operation to SŽ D1 regulation as well as on the rest of the line. This will also increase the safety and capacity on this branch line [39].
The journey time limit facilitated the identification of sections of the line where it is appropriate to implement infrastructure measures to enhance capacity. In the case of the Havlíčkův Brod–Znojmo line, the implemented modifications resulted in a notable increase in capacity, from the initial 14 journeys in the peak period to 22 journeys.
The aforementioned increase in capacity, in conjunction with other related infrastructure modifications (including alterations to station configurations, the extension of station tracks, an increase in line speed and electrification), have rendered this line a fully fledged diversionary alternative to the Brno node.
Modernising signalling equipment has also permitted the implementation of remote traffic control across the entire section, reducing CZK 17.488 million per annum in personnel costs. This equates to CZK 140,000 per kilometre of line [40].

6. Discussion

This methodology provides valuable insights into optimising railway network performance, focusing on the limitation of journey time and its utilisation and the factors that influence them. The methodology outlined within this study emphasises the significance of accurately determining limiting journey times as a critical component in evaluating railway operations.
The analysis emphasises that infrastructure enhancements, including track upgrades, improved signalling, and station layouts, can lead to substantial improvements in performance. Furthermore, incorporating advanced technologies, such as ERTMS and automated train operation systems, will likely offer significant gains in operational efficiency and reliability.
The applicability of this method is contingent upon the condition that the line under consideration is not divided into multiple block sections. If the line is segmented into several sections, the method is deemed incompatible due to the complexity inherent in integrating train bundling. Nevertheless, under circumstances where trains on such a line do not frequently undergo bundling and, for instance, trains intersect at each station, particularly during periods of peak traffic, the implementation of this method becomes feasible (a scenario that is analogous to the Havlíčkův Brod–Jihlava segment). The method’s merits lie in its simplicity and potential for universal application on single-track lines. In the future, examining the problem of existing tangent lines and attempting to upgrade them to release capacity around agglomerations would be advisable.
Notwithstanding the fact that the proposed methodology provides a transparent and systematic framework for the identification and prioritisation of critical sections of single-track lines, it is important to be aware of its limitations. This approach is predicated on static traffic patterns derived from long-term averages and the ninth decile of train volume. Consequently, it is not entirely representative of the dynamic variability inherent in real-world rail operations, where demand can fluctuate significantly due to peak hour concentrations, seasonal variations, or unplanned disruptions such as infrastructure failures or adverse weather conditions. In such circumstances, actual travel times and capacity utilisation may differ from the calculated thresholds. While this methodology provides a reliable guide for long-term planning and investment prioritisation, it is less suitable for short-term operational decision-making. In order to resolve this contradiction, it is essential that infrastructure be constructed with consideration for future traffic growth and mitigations. It is recommended that future research address the integration of timetable simulations and real-time traffic management systems. These could complement the static framework and increase its resilience to operational uncertainty.
Finally, while the present study focused chiefly on the technical aspects of railway system optimisation, it underscores the significance of collaboration among various stakeholders including railway operators, infrastructure managers and regulatory bodies. Effective coordination across these groups is imperative for implementing pragmatic solutions aligned with long-term transportation objectives. The synergistic effect among individual aspects is also very important. Especially in the future, it is necessary to address railway operations, especially in the context of intelligent transport systems, traffic management systems, the use of artificial intelligence as well as modern tools and methods of transport modelling, simulation, etc. It is also necessary to consider the practical application and implementation of modern innovative elements and modules in the context of the planning and implementation of railway transport operations. The above ideas need to be developed in the context of manuscripts [41,42,43,44] that have also dealt with similar issues. By connecting them with our research, a unique kind of research could be created, which will be the subject of the authors’ upcoming scientific research activities.
In conclusion, the study provides a solid foundation for improving railway network efficiency, focusing on the determination of limiting journey times and identifying key areas for enhancement. While further research is needed to refine these strategies, the study provides valuable insights that can guide the future optimisation of railway systems, balancing technical improvements with broader operational and policy objectives.

7. Conclusions

This article proposed a robust analytical framework for evaluating and enhancing railway line performance, with a particular emphasis on assessing journey times and identifying opportunities for efficiency improvements. Utilising a data-driven approach, the methodology facilitated a comprehensive understanding of the factors influencing overall operational performance. It underscores the significance of precise data collection and the employment of analytical techniques to identify areas necessitating attention, thereby contributing to the optimisation of service delivery. The methodology is comprised of three constituent elements:
  • Segmentation of the railway line—the initial step in this process is the division of the railway line into segments, with the basis of this division being the similarity of traffic volumes. This segmentation uses a moving average, with each segment comprising several connected line sections. This division is of crucial importance to identify areas in which infrastructure improvements are most required.
  • Determination of limiting journey times—the subsequent stage of the process is to calculate the limiting journey times for each segment. The segment with the longest journey time (occupancy time) is identified first. The second-longest value is chosen if there are significant differences in journey times. This limiting time is progressively reduced to achieve the desired capacity utilisation for the expected number of trains. Based on this, the maximum acceptable travel times are determined for each segment.
  • The identification of infrastructure improvements—the methodology was developed to facilitate the identification of critical sections of the railway line where infrastructure improvements are necessary. These improvements may include dividing the track into discrete block sections, adding track branches such as stations or passing loops, or increasing the number of tracks. These measures are proposed for sections where journey times exceed the limiting value, ensuring that the railway system can meet future demands effectively and efficiently.
The approach is of significant value to railway operators and planners, providing insights that can inform strategic decisions to enhance the railway network’s capacity, reliability, and sustainability. It underscores the necessity for continual assessment and adaptation to ensure that the system can meet growing demands and maintain efficiency in the long-term. In essence, this methodology promotes a more effective use of resources, ensures better management of railway operations, and contributes to developing a well-functioning transportation network that benefits operators and passengers alike.

Author Contributions

Conceptualisation, J.G. and M.D.; Methodology, M.V. (Marek Vyhnanovský); Software, M.V. (Marek Vyhnanovský); Validation, M.V. (Martin Vojtek), P.N., and M.D.; Formal analysis, M.D.; Investigation, M.V. (Martin Vojtek); Resources, M.V. (Marek Vyhnanovský); Data curation, M.V. (Marek Vyhnanovský); Writing—original draft preparation, M.V. (Marek Vyhnanovský); Writing—review and editing, M.V. (Martin Vojtek); Visualisation, J.G.; Supervision, P.N.; Project administration, M.D.; Funding acquisition, J.G. All authors have read and agreed to the published version of the manuscript.

Funding

The paper is supported by the VEGA Agency by the Project 1/0640/23 “Elements of quality in competitive public tendering in railway passenger transport”, that is solved at Faculty of Opera-tions and Economics of Transport and Communication, University of Žilina. The paper is supported by the KEGA Agency by Project 010ŽU-4/2023 “Innovative approaches in teaching in the field of transport focused on railway traffic management, with the support of risk and crisis management”, that is solved at the Faculty of Operations and Economics of Transport and Communication, University of Žilina.

Institutional Review Board Statement

Not applicable.

Informed Consent Statement

Not applicable.

Data Availability Statement

The original contributions presented in this study are included in the article. Further inquiries can be directed to the corresponding author.

Conflicts of Interest

The authors declare no conflicts of interest.

References

  1. Ljubaj, I.; Mikulčić, M.; Mlinarić, T.J. Possibility of Increasing the Railway Capacity of the R106 Regional Line by Using a Simulation Tool. Transp. Res. Procedia. 2020, 44, 137–144. [Google Scholar] [CrossRef]
  2. Abril, M.; Barber, F.; Ingolotti, L.; Salido, M.A.; Tormos, P.; Lova, A. An assessment of railway capacity. Transp. Res. Part E Logist. Transp. Rev. 2008, 44, 774–806. [Google Scholar] [CrossRef]
  3. Khadem Sameni, M.; Moradi, A. Railway capacity: A review of analysis methods. J. Rail Transp. Plan. Manag. 2022, 24, 100357. [Google Scholar] [CrossRef]
  4. Francesco, R.; Gabriele, M.; Stefano, R. Complex railway systems: Capacity and utilisation of interconnected networks. Eur. Transp. Res. Rev. 2016, 8, 29. [Google Scholar] [CrossRef]
  5. Landgraf, M.; Zeiner, M.; Knabl, D.; Corman, F. Environmental impacts and associated costs of railway turnouts based on Austrian data. Transp. Res. Part D Transp. Environ. 2022, 103, 103168. [Google Scholar] [CrossRef]
  6. Giunta, M. Trends and Challenges in Railway Sustainability: The State of the Art regarding Measures, Strategies, and Assessment Tools. Sustainability 2023, 15, 16632. [Google Scholar] [CrossRef]
  7. Kljaić, Z.; Pavković, D.; Cipek, M.; Trstenjak, M.; Mlinarić, T.J.; Nikšić, M. An Overview of Current Challenges and Emerging Technologies to Facilitate Increased Energy Efficiency, Safety, and Sustainability of Railway Transport. Future Internet 2023, 15, 347. [Google Scholar] [CrossRef]
  8. Guerrero-Bustamante, O.; Guillen, A.; Moreno-Navarro, F.; Rubio-Gámez, M.C.; Sol-Sánchez, M. Toward sustainable railway track foundation: Recycling RAP from road asphalt pavements: Recycling RAP from road asphalt pavements. Constr. Build. Mater. 2024, 439, 137436. [Google Scholar] [CrossRef]
  9. Zhou, F.; Tang, Z.; Tan, D.; Xie, Y. Capacity configuration optimization of regenerative braking energy utilization system for electrified railways based on power sharing and energy storage. Electr. Power Syst. Res. 2025, 239, 111275. [Google Scholar] [CrossRef]
  10. Ortega Riejos, F.A.; Barrena, E.; Canca Ortiz, J.D.; Laporte, G. Analyzing the theoretical capacity of railway networks with a radial-backbone topology. Transp. Res. Part A Policy Pract. 2016, 84, 83–92. [Google Scholar] [CrossRef]
  11. Burkhalter, M.; Adey, B.T. Assessing the Effects of Closure-Free Periods on Railway Intervention Costs and Service. J. Infrastruct. Syst. 2022, 28, 04022015. [Google Scholar] [CrossRef]
  12. de Weert, Y.R.; Gkiotsalitis, K.; van Berkum, E.C. Improving the scheduling of railway maintenance projects by minimizing passenger delays subject to event requests of railway operators. Comput. Oper. Res. 2024, 165, 106580. [Google Scholar] [CrossRef]
  13. Gan, M.; Li, D.; Yao, Z.; Yu, H.; Ou, Q. Intelligent decision modeling for optimizing railway cold chain service networks under uncertainty. Inf. Sci. 2024, 679, 121112. [Google Scholar] [CrossRef]
  14. Burdett, R.L. Optimisation models for expanding a railway’s theoretical capacity. Eur. J. Oper. Res. 2016, 251, 783–797. [Google Scholar] [CrossRef]
  15. Rais, N.M.; Jaafar, H.S.; Samsudin, M.R.H.; Rahman, H.A.; Towel, R.M.; Burhanuddin, S.N.Z.A. Measuring railway track capacity and utilization for KERETAPI tanah melayu berhad (ktmb). Adv. Transp. Logist. Res. 2020, 3, 908–916. [Google Scholar]
  16. Eliasson, J.; Börjesson, M. On timetable assumptions in railway investment appraisal. Transp. Policy 2014, 36, 118–126. [Google Scholar] [CrossRef]
  17. Jovanović, P.; Pavlović, N.; Belošević, I.; Milinković, S. Graph coloring-based approach for railway station design analysis and capacity determination. Eur. J. Oper. Res. 2020, 287, 348–360. [Google Scholar] [CrossRef]
  18. Mussone, L.; Wolfler Calvo, R. An analytical approach to calculate the capacity of a railway system. Eur. J. Oper. Res. 2013, 228, 11–23. [Google Scholar] [CrossRef]
  19. Ekman, J.K. A tool for analysis of railway capacity. In WIT Transactions on Modelling and Simulation; WIT Press: Southampton, UK, 2011; pp. 693–702. Available online: http://urn.kb.se/resolve?urn=urn:nbn:se:ri:diva-23904 (accessed on 26 May 2011).
  20. Rotoli, F.; Ricci, S. Methodological Review for Capacity and Punctuality Assessment Procedures. Int. J. Railw. Res. 2014, 1, 31–47. Available online: http://ijrare.iust.ac.ir/article-1-55-en.html (accessed on 19 October 2024).
  21. Zhang, C.; Gao, Y.; Cacchiani, V.; Yang, L.; Gao, Z. Train rescheduling for large-scale disruptions in a large-scale railway network. Transp. Res. Part B Methodol. 2023, 174, 102786. [Google Scholar] [CrossRef]
  22. Bulíček, J.; Nachtigall, P.; Široký, J.; Tischer, E. Improving single-track railway line capacity using extended station switch point area. J. Rail Transp. Plan. Manag. 2022, 24, 100354. [Google Scholar] [CrossRef]
  23. Quaglietta, E. A simulation-based approach for the optimal design of signalling block layout in railway networks. Simul. Model. Pract. Theory. 2014, 46, 4–24. [Google Scholar] [CrossRef]
  24. Zhong, Q.; Xu, R. Analytical railway line capacity methods from graph-theoretical and polyhedral perspectives. Transp. A Transp. Sci. 2024, 2414224. [Google Scholar] [CrossRef]
  25. Emunds, T.; Nießen, N. Evaluating railway junction infrastructure: A queueing-based, timetable-independent analysis: A queueing-based, timetable-independent analysis. Transp. Res. Part C Emerg. Technol. 2024, 165, 104704. [Google Scholar] [CrossRef]
  26. Weik, N.; Niebel, N.; Nießen, N. Capacity analysis of railway lines in Germany–A rigorous discussion of the queueing-based approach. J. Rail Transp. Plan. Manag. 2016, 6, 99–115. [Google Scholar] [CrossRef]
  27. Burdett, R.L. Multi-objective models and techniques for analysing the absolute capacity of railway networks. Eur. J. Oper. Res. 2015, 245, 489–505. [Google Scholar] [CrossRef]
  28. Gašparík, J.; Abramović, B.; Halás, M. New Graphical Approach to Railway Infrastructure Capacity Analysis. Promet-Traffic Transp. 2015, 27, 283–290. [Google Scholar] [CrossRef]
  29. Správa Železnic, Státní Organizace. Portál Provozování Dráhy. Available online: https://provoz.spravazeleznic.cz/Portal/ (accessed on 10 November 2024).
  30. SŽDC SM124 Zjišťování kapacity dráhy (SŽDC directive SM124 Track Capacity Assessment). 2019. Available online: https://www.spravazeleznic.cz/documents/50004227/139626480/SZDC_SM124_20190611.pdf/25a3553c-429d-4cc8-b17a-f27c501953f7?version=24.0. (accessed on 10 November 2024).
  31. Huber, H.P.; Herbacek, R. UIC Leaflet 406–Capacity, New Release. 2012. Available online: https://www.witpress.com/Secure/elibrary/papers/CR08/CR08006FU1.pdf (accessed on 20 October 2024).
  32. Zhong, Q.; Xu, C.; Yang, R.; Zhong, Q. Equivalences between analytical railway capacity methods. J. Rail Transp. Plan. Manag. 2023, 25, 100367. [Google Scholar] [CrossRef]
  33. Min, K.K.; Suk-Mun, O.; Suk-Joon, K.; Hwan, P.B. New Headway-Based Analytical Capacity Model Considering Heterogeneous Train Traffic. J. Transp. Eng. Part A Syst. 2020, 146, 04020135. [Google Scholar] [CrossRef]
  34. Haalboom, D.; Bešinović, N. Freight train scheduling for industrial lines with multiple railway undertakings. J. Rail Transp. Plan. Manag. 2024, 31, 100466. [Google Scholar] [CrossRef]
  35. Szymula, C.; Bešinović, N.; Nachtigall, K. Quantifying periodic railway network capacity using petri nets and macroscopic fundamental diagram. Transp. Res. Part C Emerg. Technol. 2024, 158, 104436. [Google Scholar] [CrossRef]
  36. Jansen, D.N.; Klabes, S.G.; Wendler, E. The impact of GSM-R on railway capacity. WIT Trans. State Art Sci. Eng. 2008, 46, 143–151. [Google Scholar] [CrossRef]
  37. Ranjbar, V.; Olsson, N.O.E.; Sipilä, H. Impact of signalling system on capacity–Comparing legacy ATC, ETCS level 2 and ETCS hybrid level 3 systems. J. Rail Transp. Plan. Manag. 2022, 23, 100322. [Google Scholar] [CrossRef]
  38. Cuppi, F.; Vignali, V.; Lantieri, C.; Rapagnà, L.; Dimola, N.; Galasso, T. High density European Rail Traffic Management System (HD-ERTMS) for urban railway nodes: The case study of Rome: The case study of Rome. J. Rail Transp. Plan. Manag. 2021, 17, 100232. [Google Scholar] [CrossRef]
  39. Široký, J.; Nachtigall, P.; Tischer, E.; Gašparík, J. Simulation of Railway Lines with a Simplified Interlocking System. Sustainability 2021, 13, 1394. [Google Scholar] [CrossRef]
  40. Vyhnanovský, M. Návrh Dopravní Technologie na Trati Havlíčkův Brod—Znojmo. Ph.D. Thesis, Faculty of Transport Engineering, University of Pardubice, Pardubice, Czech Republic, 2024. Available online: https://theses.cz/id/fnsrpo/ (accessed on 1 July 2024).
  41. Liu, J.; Chen, L.; Roberts, C.; Nicholson, G.; Ai, B. Algorithm and peer-to-peer negotiation strategies for train dispatching problems in railway bottleneck sections. IET Intell. Transp. Systems. 2019, 13, 1717–1725. [Google Scholar] [CrossRef]
  42. Cecchetti, G.; Ruscelli, A.L.; Ulianov, C.; Hyde, P.; Liu, J.; Magnien, A.; Tavač, M.; Ďuračík, M.; Oneto, L.; Bertolin, J. Toward new generation railway Traffic Management Systems: The contribution of the OPTIMA project. Transp. Res. Procedia 2023, 72, 3166–3173. [Google Scholar] [CrossRef]
  43. Liu, J.; Ulianov, C.; Hyde, P.; Ruscelli, A.L.; Cecchetti, G. Novel approach for validation of innovative modules for railway traffic management systems in a virtual environment. Proc. Inst. Mech. Eng. Part F J. Rail Rapid Transit. 2022, 236, 139–148. [Google Scholar] [CrossRef]
  44. Liu, J.; Lin, Z.; Liu, R. A reinforcement learning approach to solving very-short term train rescheduling problem for a single-track rail corridor. J. Rail Transp. Plan. Manag. 2024, 32, 100483. [Google Scholar] [CrossRef]
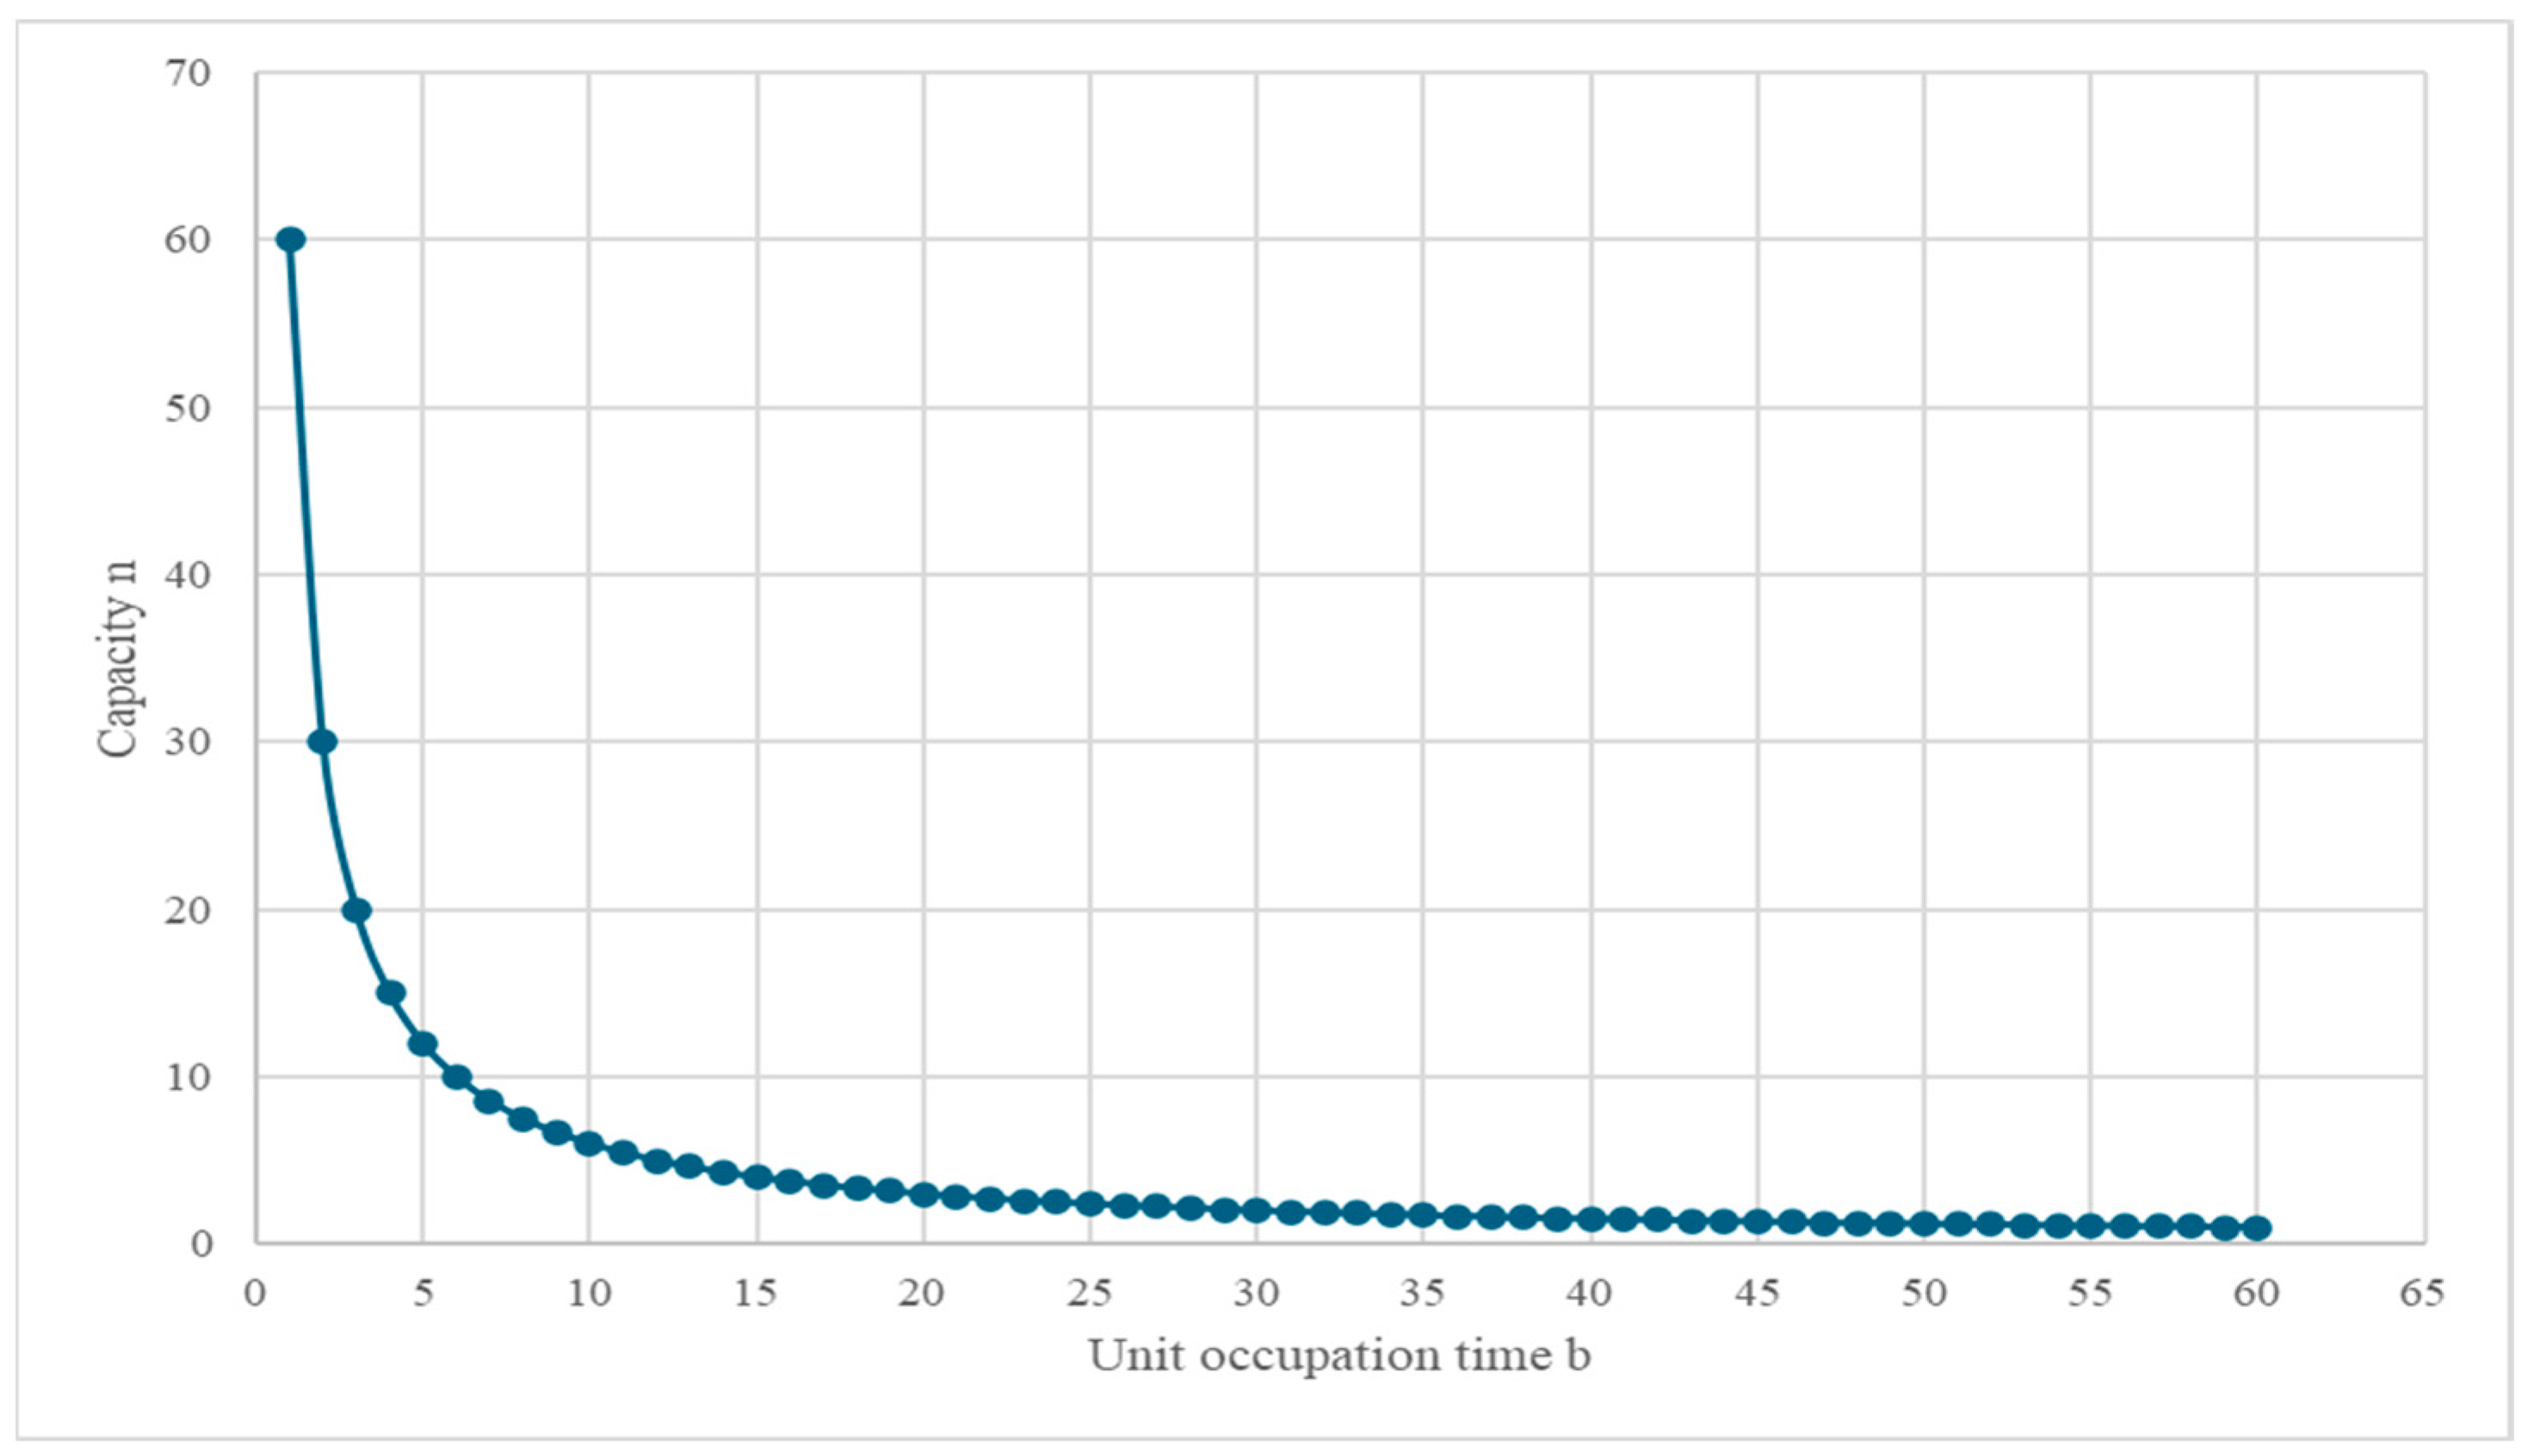
Figure 1. Dependence of capacity and unit occupancy time for a monitoring period of one hour.
Sustainability 17 09101 g001
Figure 2. Diagram of segmentation. Source: Authors.
Sustainability 17 09101 g002
Figure 3. Diagram of determination of the limiting journey time for a segment. Source: Authors.
Sustainability 17 09101 g003
Figure 4. Diagram of the identification of an infrastructure measure to increase capacity. Source: Authors.
Sustainability 17 09101 g004
Figure 5. Average ninth decile interlaced with moving average (2019–2023). Source: Authors based on data [29].
Sustainability 17 09101 g005
Figure 6. Line scheme. Source: Authors.
Sustainability 17 09101 g006
Table 1. Ninth decile of the number of all trains in each section.
Section/Year20232022202120202019Average
Havlíčkův Brod707575805571
Šlapanov707075805570
Dobronín707580805572
Jihlava505045554549
Louka nad Jihlavou505045554549
Bransouze505045554549
Okříšky242525252524.8
Stařec242525252524.8
Kojetice na Moravě242525252524.8
Jaroměřice nad Rokytnou242525252524.8
Moravské Budějovice303030352530
Grešlové Mýto303030352530
Šumná303030352530
Olbramkostel303030352530
Znojmo
Source: Authors based on data [29].
Table 2. Journey times [min] on the original infrastructure.
Direction/CategoryZnojmoHavl. BrodAverageLimiting Journey Time
OsRPnOsRPn
Havlíčkův Brod9712.59.57.5109.35
Šlapanov8612.58688.1
Dobronín96138.56.5108.8
Jihlava11.511.51312.51016.512.58
Louka nad Jihlavou10.57.58.511.57.510.59.3
Bransouze97.513988.59.2
Okříšky107.5149.58109.89
Stařec6.55.59.56.55.513.57.8
Kojetice na Moravě879.59713.59.0
Jaroměřice nad Rokytnou97.58.58.5777.9
Moravské Budějovice12.59.511.512.591912.3
Grešlové Mýto761276.597.9
Šumná6.567.57614.57.9
Olbramkostel13.5121214122915.4
Znojmo
Source: Authors based on data [29].
Table 3. Inputs and outputs of the calculation.
SegmentProspective Number of Trains for a Given PeriodCapacity in Current State (with Most Unfavourable Journey Time)Capacity UtilisationThe Most Unfavourable Journey TimeTarget Capacity UtilisationFuture Capacity UtilisationLimiting Journey Time
NVYHLnKVYHLbnKpKbblim
Havl. Brod–Jihlava2719.2140%12,560%56%5
Jihava–Okříšky1614.55110%16,555%53%8
Okříšky–Znojmo1317.1475%1450%49%9
Source: Authors based on data [29].
Disclaimer/Publisher’s Note: The statements, opinions and data contained in all publications are solely those of the individual author(s) and contributor(s) and not of MDPI and/or the editor(s). MDPI and/or the editor(s) disclaim responsibility for any injury to people or property resulting from any ideas, methods, instructions or products referred to in the content.