Article

Spatial–Temporal Patterns of Methane Emissions from Livestock in Xinjiang During 2000–2020

1
Key Laboratory of Geographic Information Science, Ministry of Education, East China Normal University, Shanghai 200241, China
2
School of Geographic Sciences, East China Normal University, Shanghai 200241, China
3
School of Plant and Environmental Sciences, Virginia Tech, Blacksburg, VA 24061, USA
4
Key Laboratory of Ecological Safety and Sustainable Development in Arid Lands, Xinjiang Institute of Ecology and Geography, Chinese Academy of Sciences, Urumqi 830000, China
5
College of Life Sciences, Shihezi University, Shihezi 823003, China
*
Author to whom correspondence should be addressed.
Sustainability 2025, 17(20), 9021; https://doi.org/10.3390/su17209021
Submission received: 3 September 2025 / Revised: 30 September 2025 / Accepted: 8 October 2025 / Published: 11 October 2025
(This article belongs to the Special Issue Geographical Information System for Sustainable Ecology)

Abstract

Livestock represent a significant source of methane (CH4) emissions, particularly in pastoral regions. However, in Xinjiang—a pivotal pastoral region of China—the spatiotemporal patterns of livestock CH4 emissions remain poorly characterized, constraining regional mitigation actions. Here, a detailed CH4 emissions inventory for livestock in Xinjiang spanning the period 2000–2020 is compiled. Eight livestock categories were covered, gridded livestock maps were developed, and the dynamic emission factors were built by using the IPCC 2019 Tier 2 approaches. Results indicate that the CH4 emissions increased from ~0.7 Tg in 2000 to ~0.9 Tg in 2020, a 28.5% increase over the past twenty years. Beef cattle contributed the most to the emission increase (59.6% of total increase), followed by dairy cattle (35.7%), sheep (13.9%), and pigs (4.3%). High-emission hotspots were consistently located in the Ili River Valley, Bortala, and the northwestern margins of the Tarim Basin. Temporal trend analysis revealed increasing emission intensities in these regions, reflecting the influence of policy shifts, rangeland dynamics, and evolving livestock production systems. The high-resolution map of CH4 emissions from livestock and their temporal trends provides key insights into CH4 mitigation, with enteric fermentation showing greater potential for emission reduction. This study offers the first long-term, high-resolution CH4 emission inventory for Xinjiang, providing essential spatial insights to inform targeted mitigation strategies and enhance sustainable livestock management in arid and semi-arid ecosystems.

1. Introduction

Methane (CH4) is a major greenhouse gas with a global warming potential over 25 times that of carbon dioxide over a 100-year time scale [1,2]. This high potential stems from its strong infrared absorption capacity in critical atmospheric windows and its role in generating additional radiative forcing through chemical interactions. Although its atmospheric lifetime (~12 years) is much shorter than that of CO2, the combination of its radiative efficiency and indirect effects amplifies its overall warming impact. Since the pre-industrial era, atmospheric CH4 concentrations have increased by approximately 2.6 times, reaching 1934 ppb in 2025 [3]. This substantial increase is largely driven by anthropogenic emissions, primarily from agriculture, fossil fuel production and use, waste management, industrial processes, and biomass burning [4,5]. CH4 emissions are responsible for approximately 31% (1.19 W m−2) of the total effective radiative forcing from long-lived greenhouse gases since 1750 [4,6]. Therefore, controlling CH4 emissions is crucial for mitigating climate change. Livestock represents one of the critical CH4 emission sources, accounting for approximately one-third of global anthropogenic emissions [4], with its management being pivotal for climate mitigation. Given the pronounced heterogeneity in livestock distribution, elucidating the spatiotemporal characteristics of these emissions has become an essential prerequisite for developing rational mitigation strategies.
Xinjiang, as one of China’s most critical pastoral regions, hosts substantial livestock herds. Over the past few decades, the region has witnessed rapid growth in livestock numbers—for instance, the sheep stocking increased from 30.16 million in 2011 to 45.24 million in 2023 [7]. However, this expansion has also contributed to a notable increase in livestock methane emissions. As one of China’s major pastoral regions, Xinjiang is characterized by extensive grazing areas, diverse livestock production systems, and a predominance of ruminant animals such as sheep, goats, and cattle [8]. These features make the region a significant contributor to national livestock-related CH4 emissions. According to the estimates by Duan et al. [9], methane emissions from Xinjiang’s livestock sector increased from approximately 0.61 Tg CH4 yr−1 in 2010 to 0.86 Tg CH4 yr−1 in 2020, with its provincial ranking rising from eighth to fourth nationwide. This indicates that Xinjiang’s relative contribution to livestock-related methane emissions has grown substantially. Combined with the overall upward trend of national livestock emissions, this underscores the importance of developing high-resolution datasets to characterize livestock distribution and emission patterns in Xinjiang. Additionally, Xinjiang’s complex topography and climatic variability result in substantial spatial heterogeneity, leading to significant differences in livestock distribution even within county-level administrative units, which are considerably larger than those in eastern provinces. This heterogeneity is primarily shaped by the interaction of geographical environment, climatic conditions and socioeconomic or policy factors. For example, the sharp oasis–desert transitions in the northern and southern rims of the Tarim Basin create distinct gradients in grazing intensity, while the mountainous–plain contrasts between the Tianshan, Altay, and Kunlun ranges and their adjacent basins lead to markedly different livestock carrying capacities. Climatic conditions such as aridity in the Tarim Basin, strong seasonality in the Junggar Basin, and pronounced interannual variability on the Qinghai–Tibet Plateau margin further influence forage availability and herding patterns. In addition, policy-driven interventions such as grazing bans and grassland restoration projects in the northern Xinjiang grasslands have significantly reshaped local livestock structures and densities. Consequently, developing high-resolution gridded livestock datasets is essential for revealing the spatial distribution and temporal trends of CH4 emissions in Xinjiang.
Conventional methods often encounter challenges in reliably mapping livestock densities in Xinjiang, largely due to the region’s complex livestock production systems and distinctive ecological settings. Previous studies have primarily employed methods such as dasymetric modeling, machine learning algorithms (e.g., random forest), and spatial downscaling to generate high-resolution livestock density datasets [10,11,12]. The random forest model is particularly appropriate for mapping livestock distribution in areas with heterogeneous production systems, due to its ability to model nonlinear interactions and handle a wide range of environmental predictors [13]. In recent studies, the resulting datasets have generally focused on a limited number of livestock species, such as cattle and sheep, employed relatively coarse spatial resolutions, and relied on statistical data aggregated at the provincial or prefecture level [14,15]. However, high-resolution, long-term gridded datasets based on county-level statistical data that capture multiple livestock species are still lacking.
Accurately estimating methane (CH4) emissions from livestock is essential for understanding its role in climate change and formulating effective mitigation strategies. Bottom-up approaches, widely used in emission accounting, typically rely on livestock activity data and corresponding emission factors [16,17]. The Intergovernmental Panel on Climate Change (IPCC) provides a tiered system for such estimations: Tier 1 uses generalized default emission factors that remain fixed over time, requiring minimal data, while Tier 2 incorporates more detailed and region-specific information, offering greater accuracy [18]. Previous studies have compared Tier 1 and Tier 2 approaches and revealed that Tier 1 methods may underestimate regional variation and temporal dynamics in livestock production characteristics that have evolved significantly in recent decades [19,20,21]. For instance, rising animal body weights, evolving feeding regimes, and improved manure management practices have likely led to shifts in actual CH4 emission rates [14,22,23]. Several recent studies have demonstrated substantial differences between CH4 emission estimates derived from Tier 2 methods and those based on fixed default emission factors, indicating that the Tier 2 approach may provide more accurate predictions of long-term CH4 emissions from livestock [19,20,24]. Tier 2 methods, with time-varying parameters, offer a more realistic approach for tracking long-term CH4 emission trends from livestock. However, the influence of evolving emission factors on historical estimates remains underexplored, underscoring the need for updated, time-sensitive inventories.
To fill these significant knowledge gaps, this study aims to (1) develop a high-resolution, long-term livestock density dataset using the random forest algorithm; (2) estimate CH4 emissions from livestock primarily based on the IPCC (2019) Tier 2 approaches; (3) reveal the spatiotemporal variation of CH4 emissions from livestock in Xinjiang.

2. Materials and Methods

In this study, county-level data series for each type of livestock were first established. Then, the Random Forest (RF) model was used to integrate livestock statistics and environmental covariates, developing spatial grid data for livestock. To assess livestock CH4 emissions, the Tier 2 approaches of the IPCC 2019 guidelines were primarily adopted, considering changes in livestock productivity and incorporating more local information of livestock sector in Xinjiang. At last, a combination of Sen’s slope and the Mann–Kendall test was used to identify the trends in emissions (Figure 1).

2.1. Livestock Dataset

A total of eight types of livestock were covered in this study, including dairy cattle, beef cattle, sheep, goat, pig, horse, ass, and camel. The county-level livestock population data from 2000 to 2020 were obtained from the Xinjiang Statistical Yearbooks [25]. For missing values in the time series, linear interpolation was applied to construct a complete and continuous dataset. Since official statistical yearbooks only present the aggregate count of cattle, the total cattle population was further segmented into distinct categories—dairy cattle, and beef cattle—by drawing on data from the China Agricultural Statistical Yearbook (2001–2021) and the China Animal Husbandry and Veterinary Yearbook (2001–2021).
The development of animal grid data is based on the Random Forest (RF) model, which exhibits strong capabilities in modeling nonlinear relationships, resisting overfitting [26], and handling high-dimensional data efficiently [27]. Here, ten environmental variables associated with livestock distribution patterns were selected, including mean air temperature, total precipitation, elevation (DEM), growing-season mean NDVI (Normalized Difference Vegetation Index), grassland ratio, cropland ratio, soil moisture, rural population density, night-time light intensity, and distance to the nearest river (Table 1). Grid cells with impervious surface coverage exceeding 60% were removed from the study area to exclude urbanized regions. To ensure the robustness of the model, multicollinearity among variables was assessed using the Variance Inflation Factor (VIF), with all VIF values found to be below 10 (Table S3), indicating acceptable levels of collinearity.
After that, livestock grid data were developed according to the following steps. (1) Data Preprocessing: Livestock census records and matching environmental factors data were aggregated to county-level means. Variables were normalized to standardize scales, and livestock density data log-transformed to improve normality. (2) Model Training & Prediction: Independent RF models were built per livestock type (2000–2020), with county-level indicator means as inputs and livestock density as targets. Data were split 70:30 (train/test), with hyperparameters tuned via GridSearchCV in a defined space. (3) Dasymetric Mapping: Since models output county-level results, dasymetric mapping downscaled predictions to pixels, using grid values as weights to redistribute county totals across pixels. (4) Accuracy Assessment: Final gridded livestock density maps were validated against census data to assess modeling accuracy and robustness.

2.2. Methane Emissions from Livestock

In this study, the new revised IPCC guidelines (IPCC 2019) were used to estimate CH4 emissions from livestock. The total annual CH4 emissions from livestock are composed of two primary sources: enteric fermentation and manure management, and can be estimated as follow (1)–(3),
E total = i N i · EF e , i + i N i · EF m , i
where E total is the total annual CH4 emissions from livestock; i denotes the livestock category; N i is the population of livestock i, which can be derived from the previously developed spatial grid dataset; EF e , i and EF m , i are the emission factors for enteric fermentation and manure management, respectively. For the major emitters including dairy cattle, beef cattle, sheep, and goats, the Tier 2 approach was used to derive emission factors. The key methodological procedures are outlined as follows, with more information provided in Text S1. For other animals which lack detailed information, namely pigs, horses, camels, mules, and donkeys, the Tier 1 approach was used; detailed information was listed in the Text S2.
According to the Tier 2 approach, the emission factor for enteric fermentation is estimated as Equation (2):
EF e = GE · Y m 100 · 365 55.65
where EF e is the emission factors of enteric fermentation (kg CH4/head/year); GE is the gross energy intake (MJ/head/day), which can be derived from livestock weight, working hours, feed quality, and productivity; Y m is the CH4 convention factor (%), representing the proportion of feed energy converted to CH4; 55.65 is the energy content of CH4 (MJ/kg). Y m were adopted by adjusting the IPCC default based on national characteristics. The emission factor for manure management is calculated as Equation (3):
EF m = VS · 365 B 0 · 0.67 · S , k MCF S , k 100 · AWMS S , k
where VS is the daily volatile solids excreted by livestock (kg/day); 365 represents 365 days in a year; B 0 is the maximum methane-producing capacity of manure (m3 CH4/kg VS); 0.67 is the density conversion coefficient of CH4 (kg/m3); MCF S , k is the methane conversion factor for management system S under climate zone k ; Given that the MCF provided by the IPCC (2019) are specific to climate zones, we classified climate zones for each year from 2000 to 2020 according to IPCC (2019) and Chang et al. [18,36]. AWMS S , k is the proportion of manure managed by system S in climate zone k (MJ/head/day). VS is further calculated as Equation (4):
VS = GE · 1 DE % 100 + UE · GE 1 ASH 18.45
where DE is the digestibility of feed (%); UE is urinary energy, expressed as a proportion of GE; ASH is the ash content of manure as a proportion of dry matter intake; and 18.45 is the conversion factor for dietary GE (MJ/kg dry matter).

2.3. Trend Analysis Methods

To identify the temporal trends in livestock CH4 emission density from 2000 to 2020, a combined approach was employed, integrating the Mann–Kendall trend test and Sen’s slope estimator. Specifically, a time series based on emission data was constructed for each pixel. The Mann–Kendall test was first conducted to assess whether a significant monotonic trend existed (p < 0.05), followed by Sen’s slope estimation to quantify the rate of change. The resulting trend maps illustrate the spatial distribution of emission changes, facilitating precise identification of regions experiencing significant increases or decreases.

3. Results

3.1. Gridded Livestock Maps

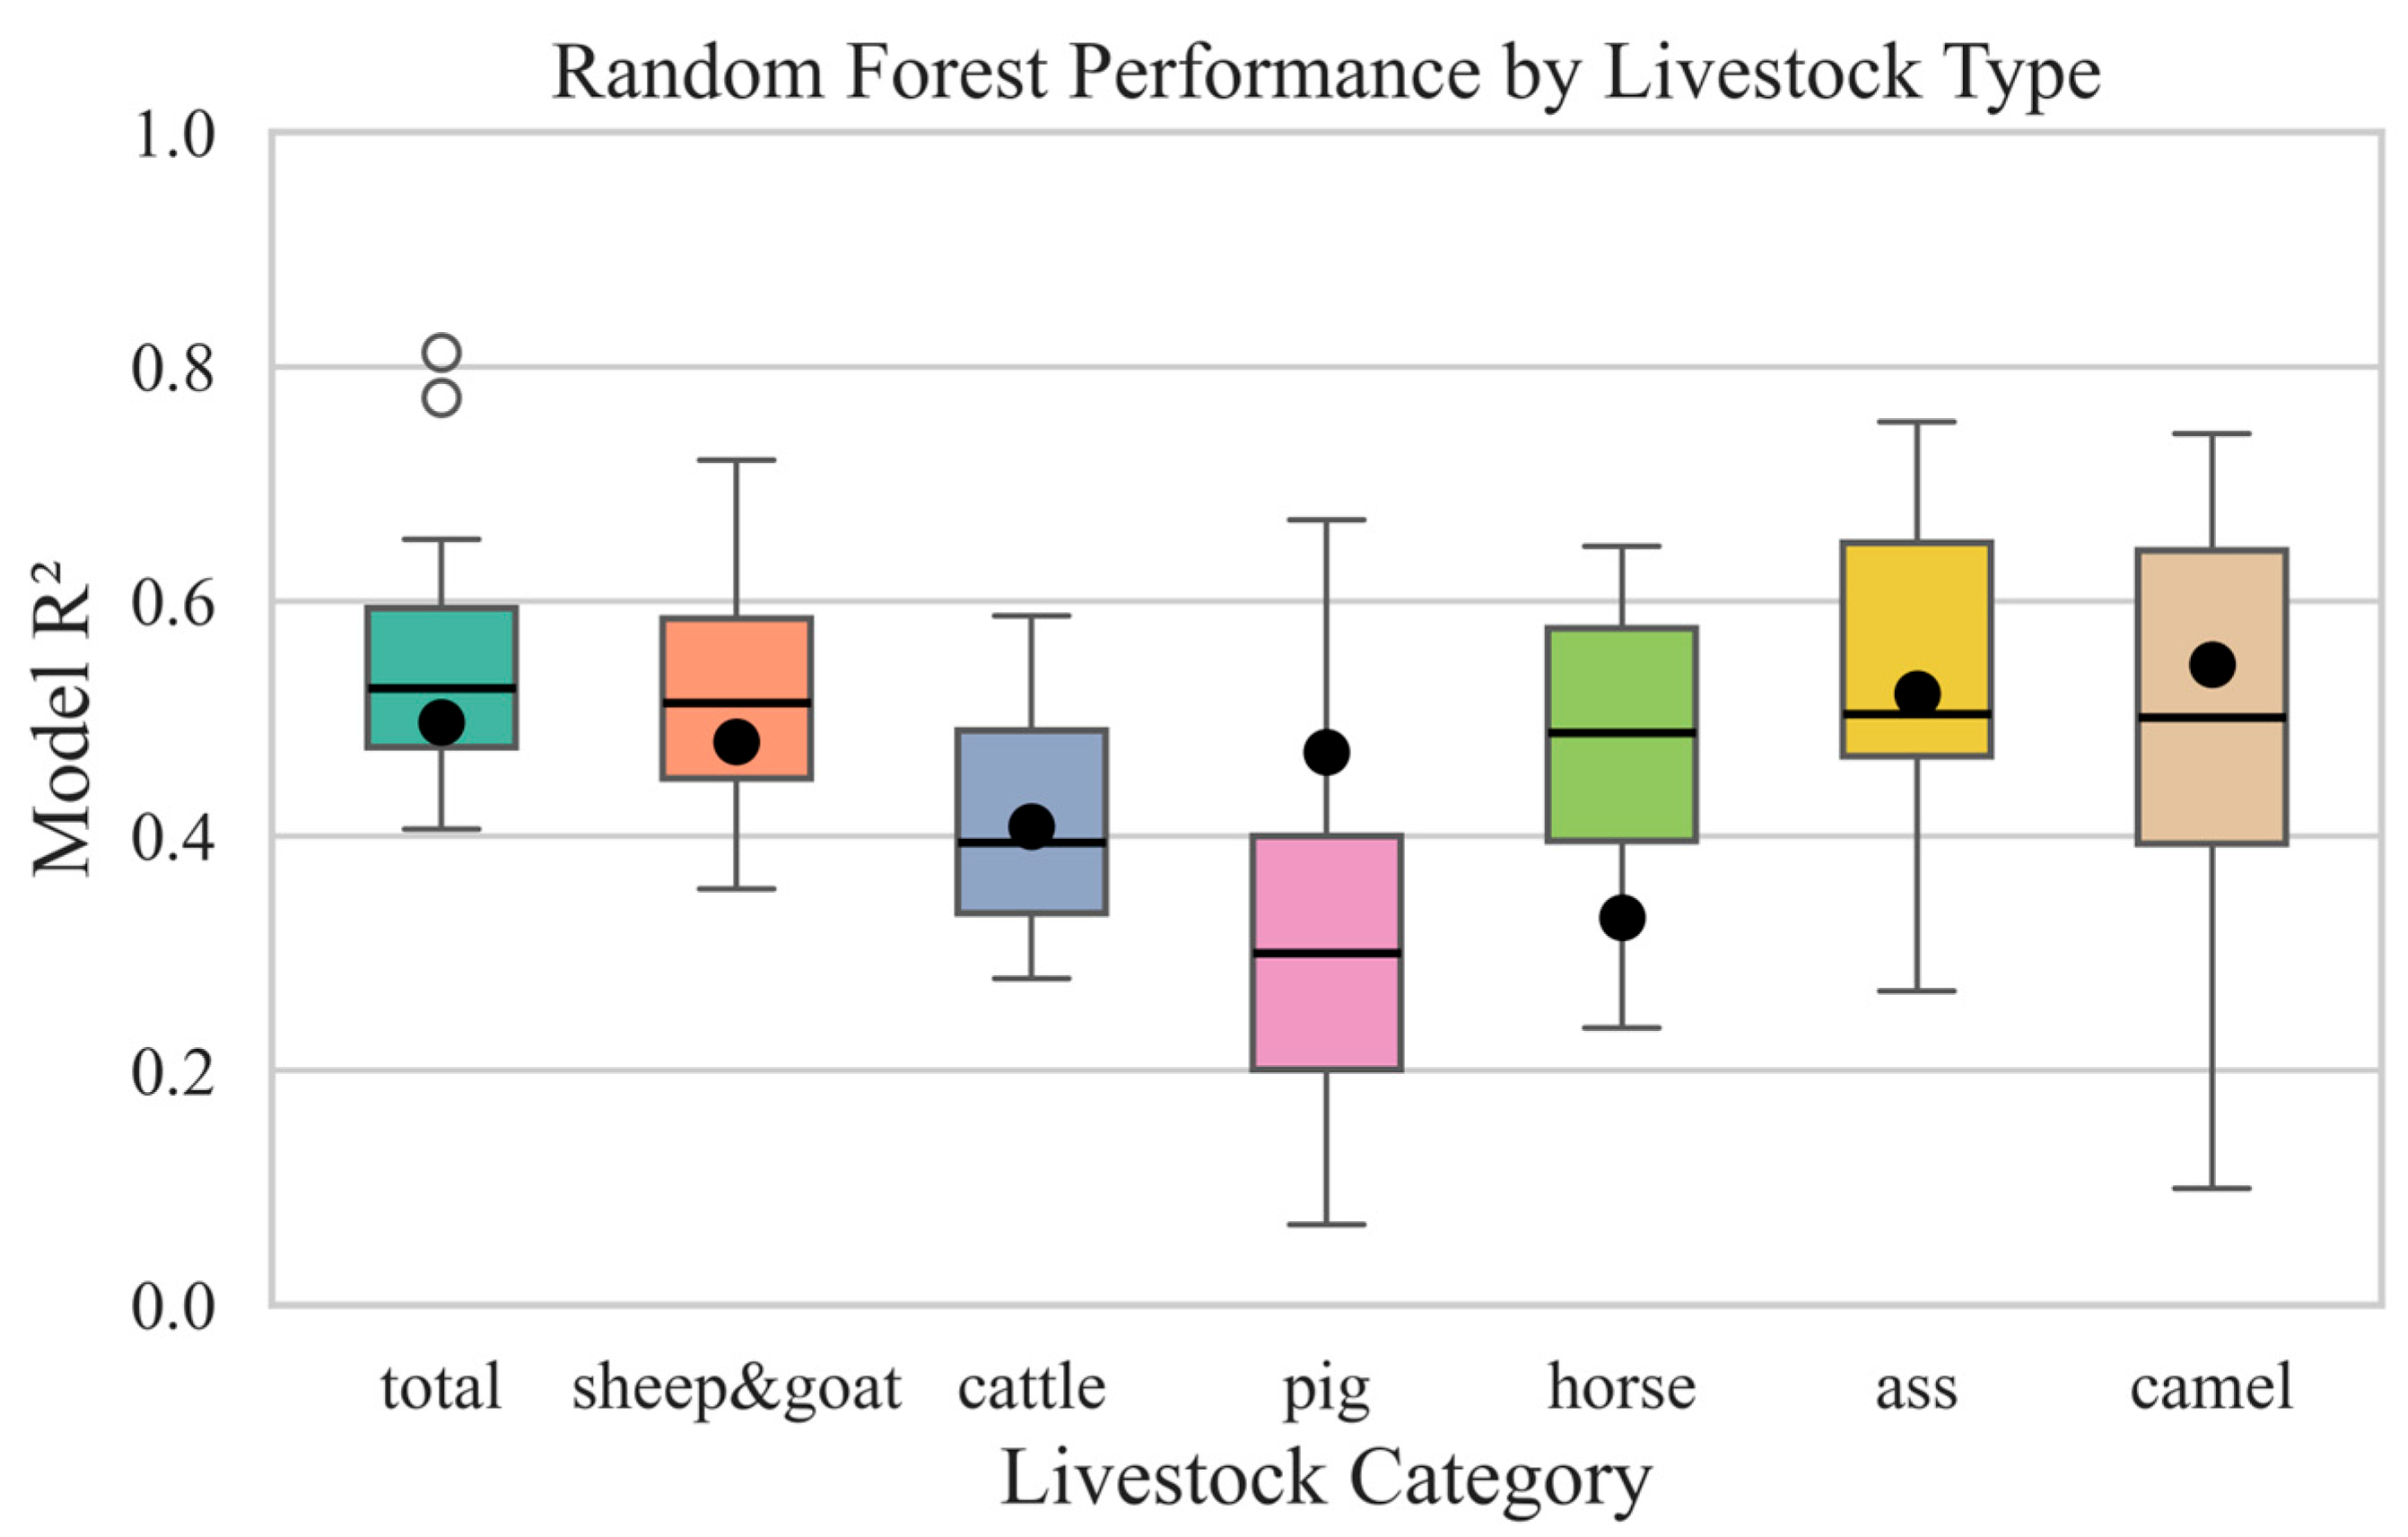
Figure 2 demonstrates the robust predictive performance of the RF model for different livestock categories, with coefficient of determination (R2) values spanning 0.4–0.6 for most animals (Figure 2). Livestock density across Xinjiang displays marked spatial heterogeneity, characterized by distinct clustering in the northwestern regions and an increasing trend over the two-decade study period (Figure 3). High-density zones (>100 heads/km2) are primarily located in the Ili River Valley (north of the Tianshan Mountains), parts of the Bortala Mongol Autonomous Prefecture and the Altay region, with secondary clusters in the northwestern Tarim Basin fringe (notably Kashgar and Aksu). Medium to high-density areas (25–50 and 50–100 heads/km2) surround the high-density zones, forming continuous transition corridors between core areas. In contrast, southeastern Xinjiang has generally low livestock densities, with most areas below 10 heads/km2. Regions such as the Taklamakan Desert and the Gurbantünggüt Desert, due to their harsh climatic conditions, are unsuitable for grazing activities and are marked as “excluded” areas. A comparison between 2000 and 2020 reveals a noticeable increase in overall livestock density, with expanded spatial extents of medium-to-high-density areas (25–50 and 50–100 heads/km2) and enhanced connectivity between high-density zones, indicating intensified and spatially concentrated production trends. Conversely, slight declines in livestock density are observed in localized areas such as southern Hotan, the southern margin of the Junggar Basin, the Bogda Mountains, and the vicinity of Urumqi.
Different livestock distinct spatial distribution patterns. Sheep dominate the livestock population in Xinjiang, and their distribution determines the overall pattern of livestock density (Figure S1). Goats, less abundant, are primarily distributed in oasis regions near the Tianshan Mountains, with localized clusters exceeding 50 heads/km2. Beef and dairy cattle are mainly found in the Ili River Valley and Kashgar oasis regions. Pigs are clustered in the northern Tianshan foothills and parts of Aksu. Horses are predominantly located in the Ili River Valley, and asses are mainly distributed in oasis areas of Kashgar. Camels, the least abundant, exhibited the most restricted distribution. From 2000 to 2020, the populations of sheep, beef and dairy cattle have increased. In contrast, asses and camels, exhibited stable abundances or even shrank in their high-density areas.

3.2. Temporal Changes in CH4 Emissions

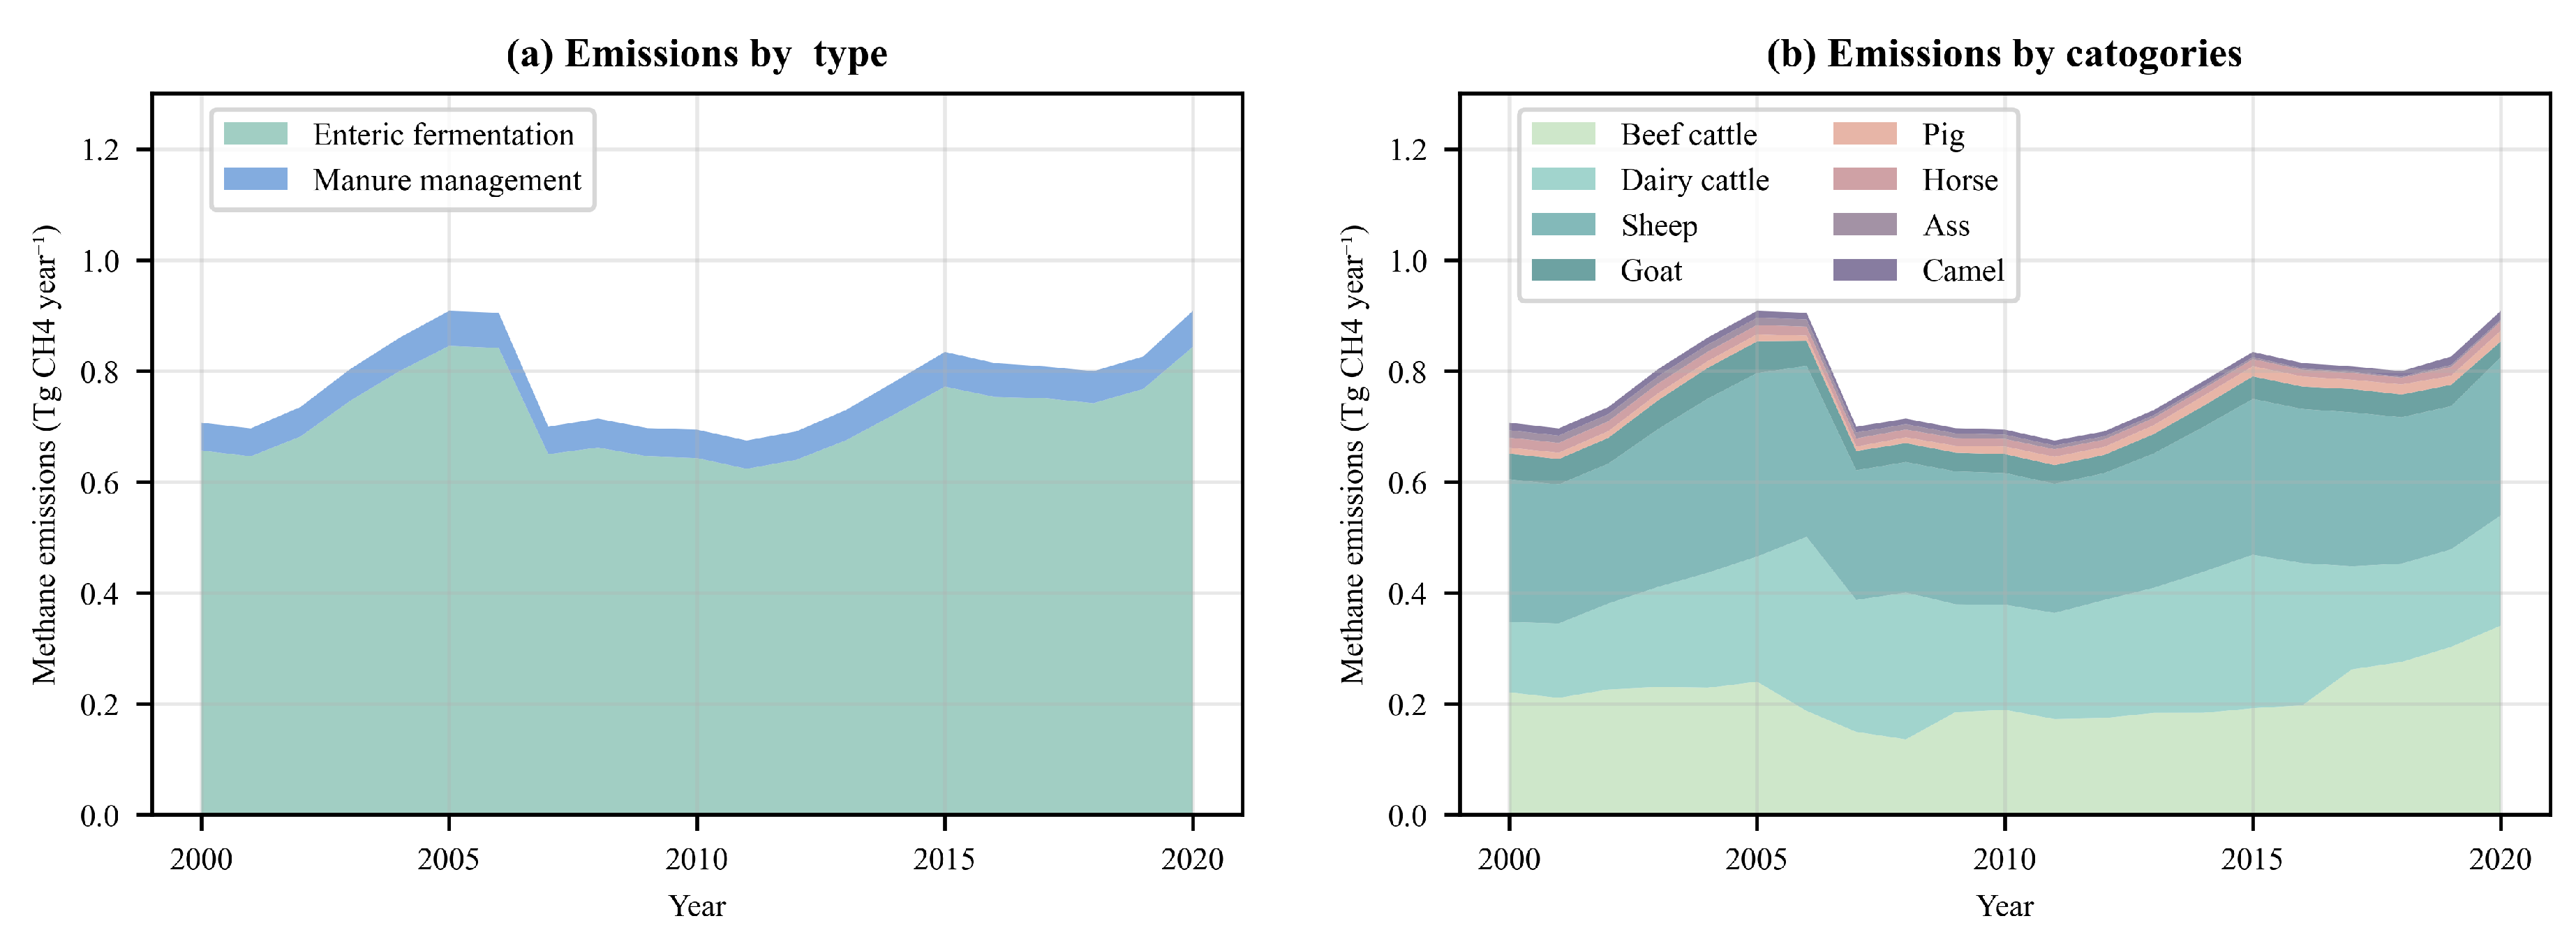
Figure 4 illustrates the annual CH4 emissions from livestock in Xinjiang over the study period. The total CH4 emissions arrived at 0.9 Tg CH4·year−1 in 2020, an increase of ~30% compared with 2000 (0.7 Tg CH4·year−1). For different emission types, emissions from enteric fermentation accounted for the vast majority of total CH4 emissions between 2000 and 2020, with an average contribution of 92.74%. Over the two decades, the proportion of enteric fermentation in total emissions fluctuated slightly but consistently remained above 92.4%. The highest proportions occurred between 2004 and 2007 (ranging from 92.9% to 93.0%), while the lowest values were observed during 2008 to 2016 (ranging from 92.4% to 92.7%).
Table 2 shows the specific methane emissions of each livestock species in different years. For different animals, sheep emerged as the primary contributor to emissions from 2000 to 2020, averaging 34.09% of the total, followed by beef cattle (27.47%) and dairy cattle (26.94%). Beef cattle drove the largest share of the total emission increase during the study period (59.6% of total increase), followed by dairy cattle (35.7%), sheep (13.9%), and pigs (4.3%). Among these, beef cattle’s emission contribution declined sharply between 2005 and 2007 (from 18.7% to 13.6%), then transitioned into a phase of stable but slow growth, until a significant surge from 2016 to 2020 (from 19.7% to 34.1%). Dairy cattle’s share rose rapidly from 2000 (12.7%) to 2006 (31.4%) before fluctuating within a narrow range. Sheep emissions dipped between 2007 and 2014 but remained generally stable outside of that period. Pig emissions displayed a consistent upward trajectory, whereas horse emissions declined persistently except for a sharp rebound observed in 2019–2020. Ass emissions decreased steadily, while camel emissions declined until 2011 before increasing continuously thereafter.

3.3. Spatial Variations in CH4 Emissions

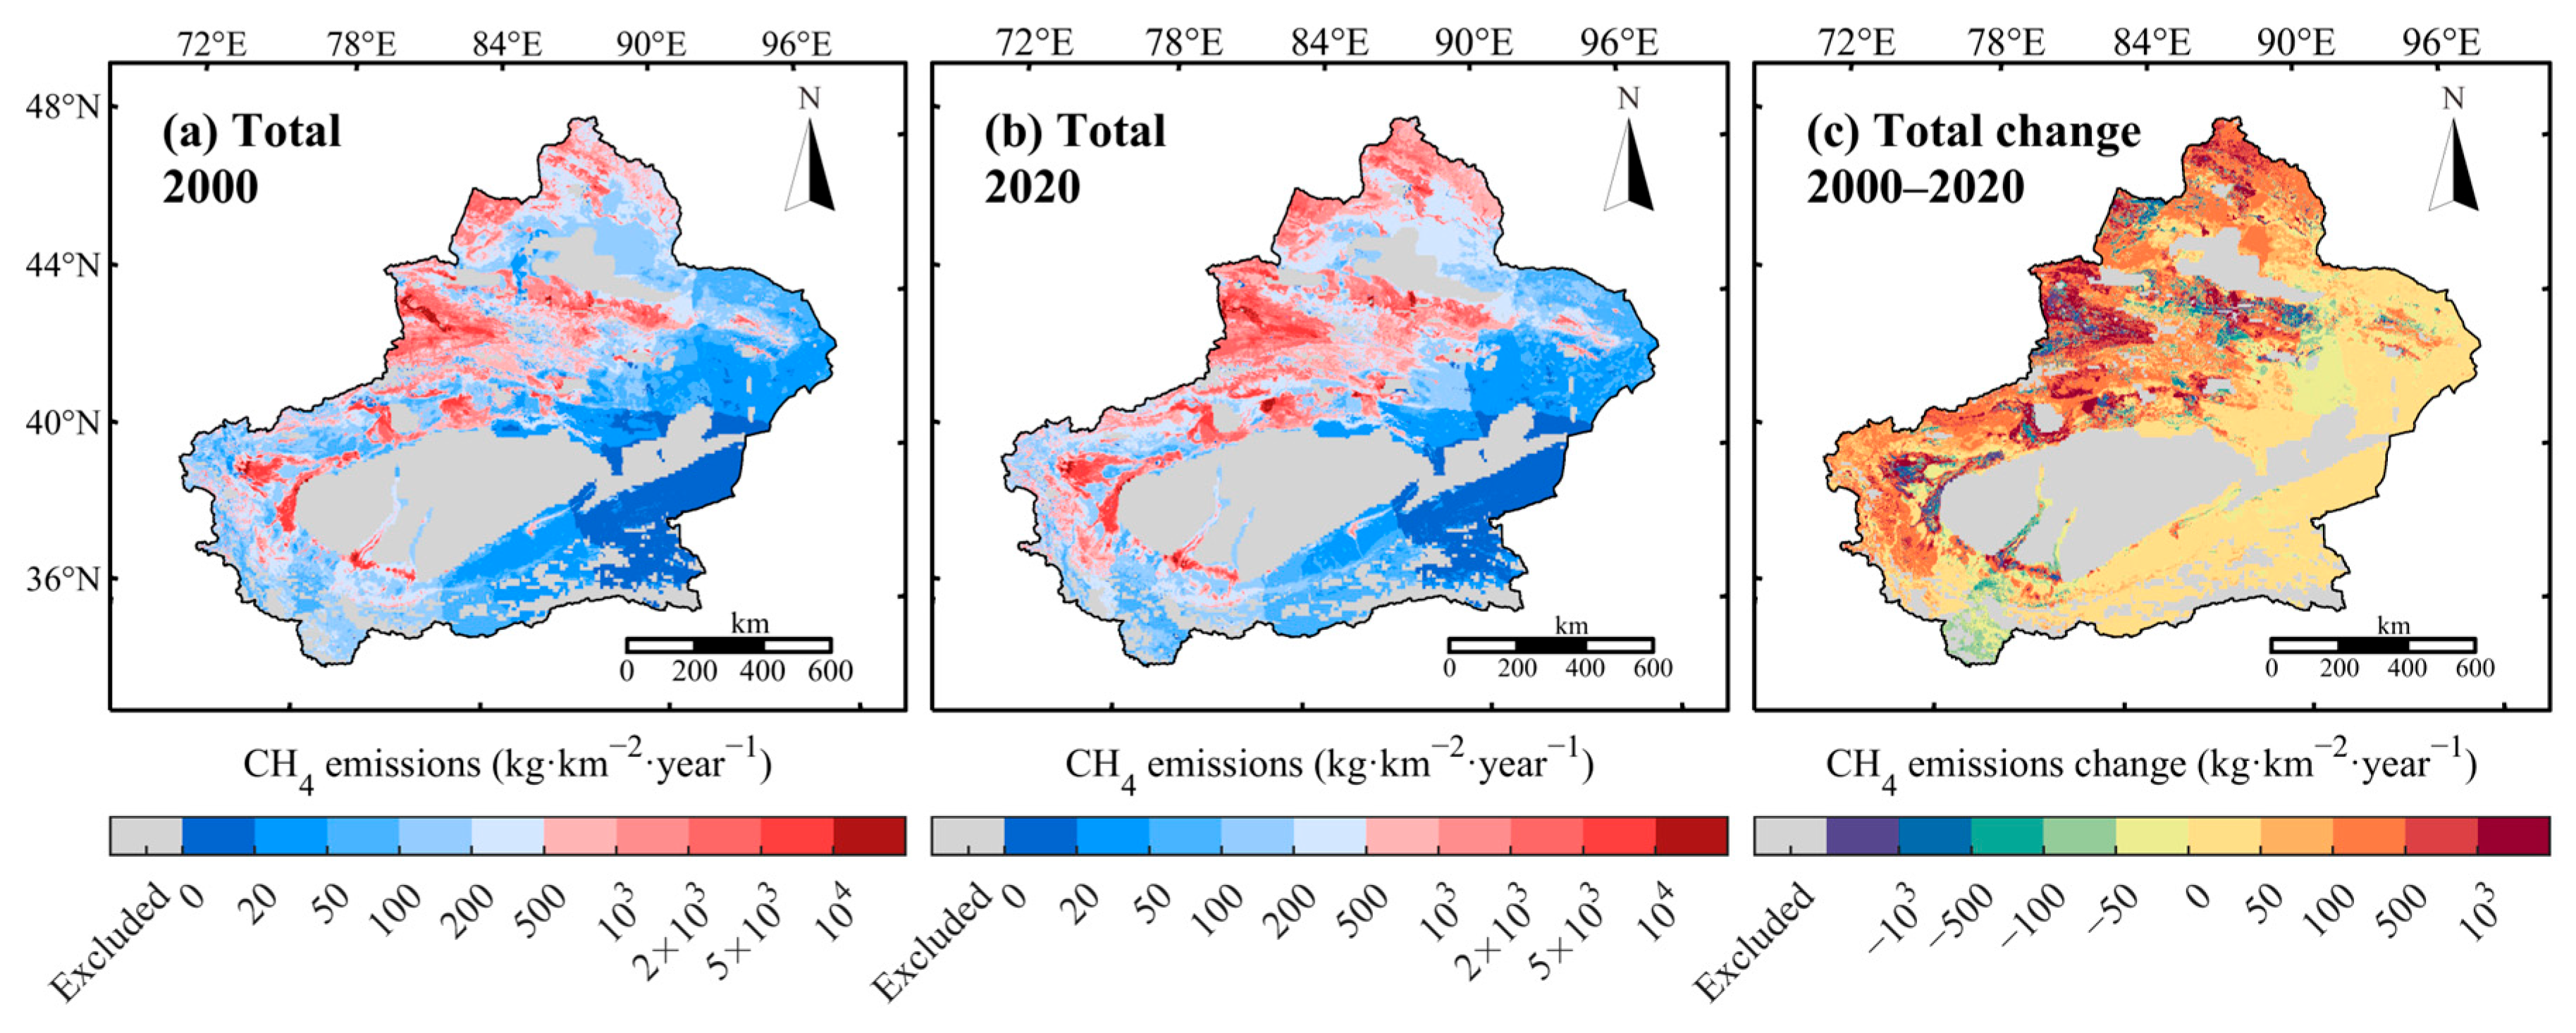
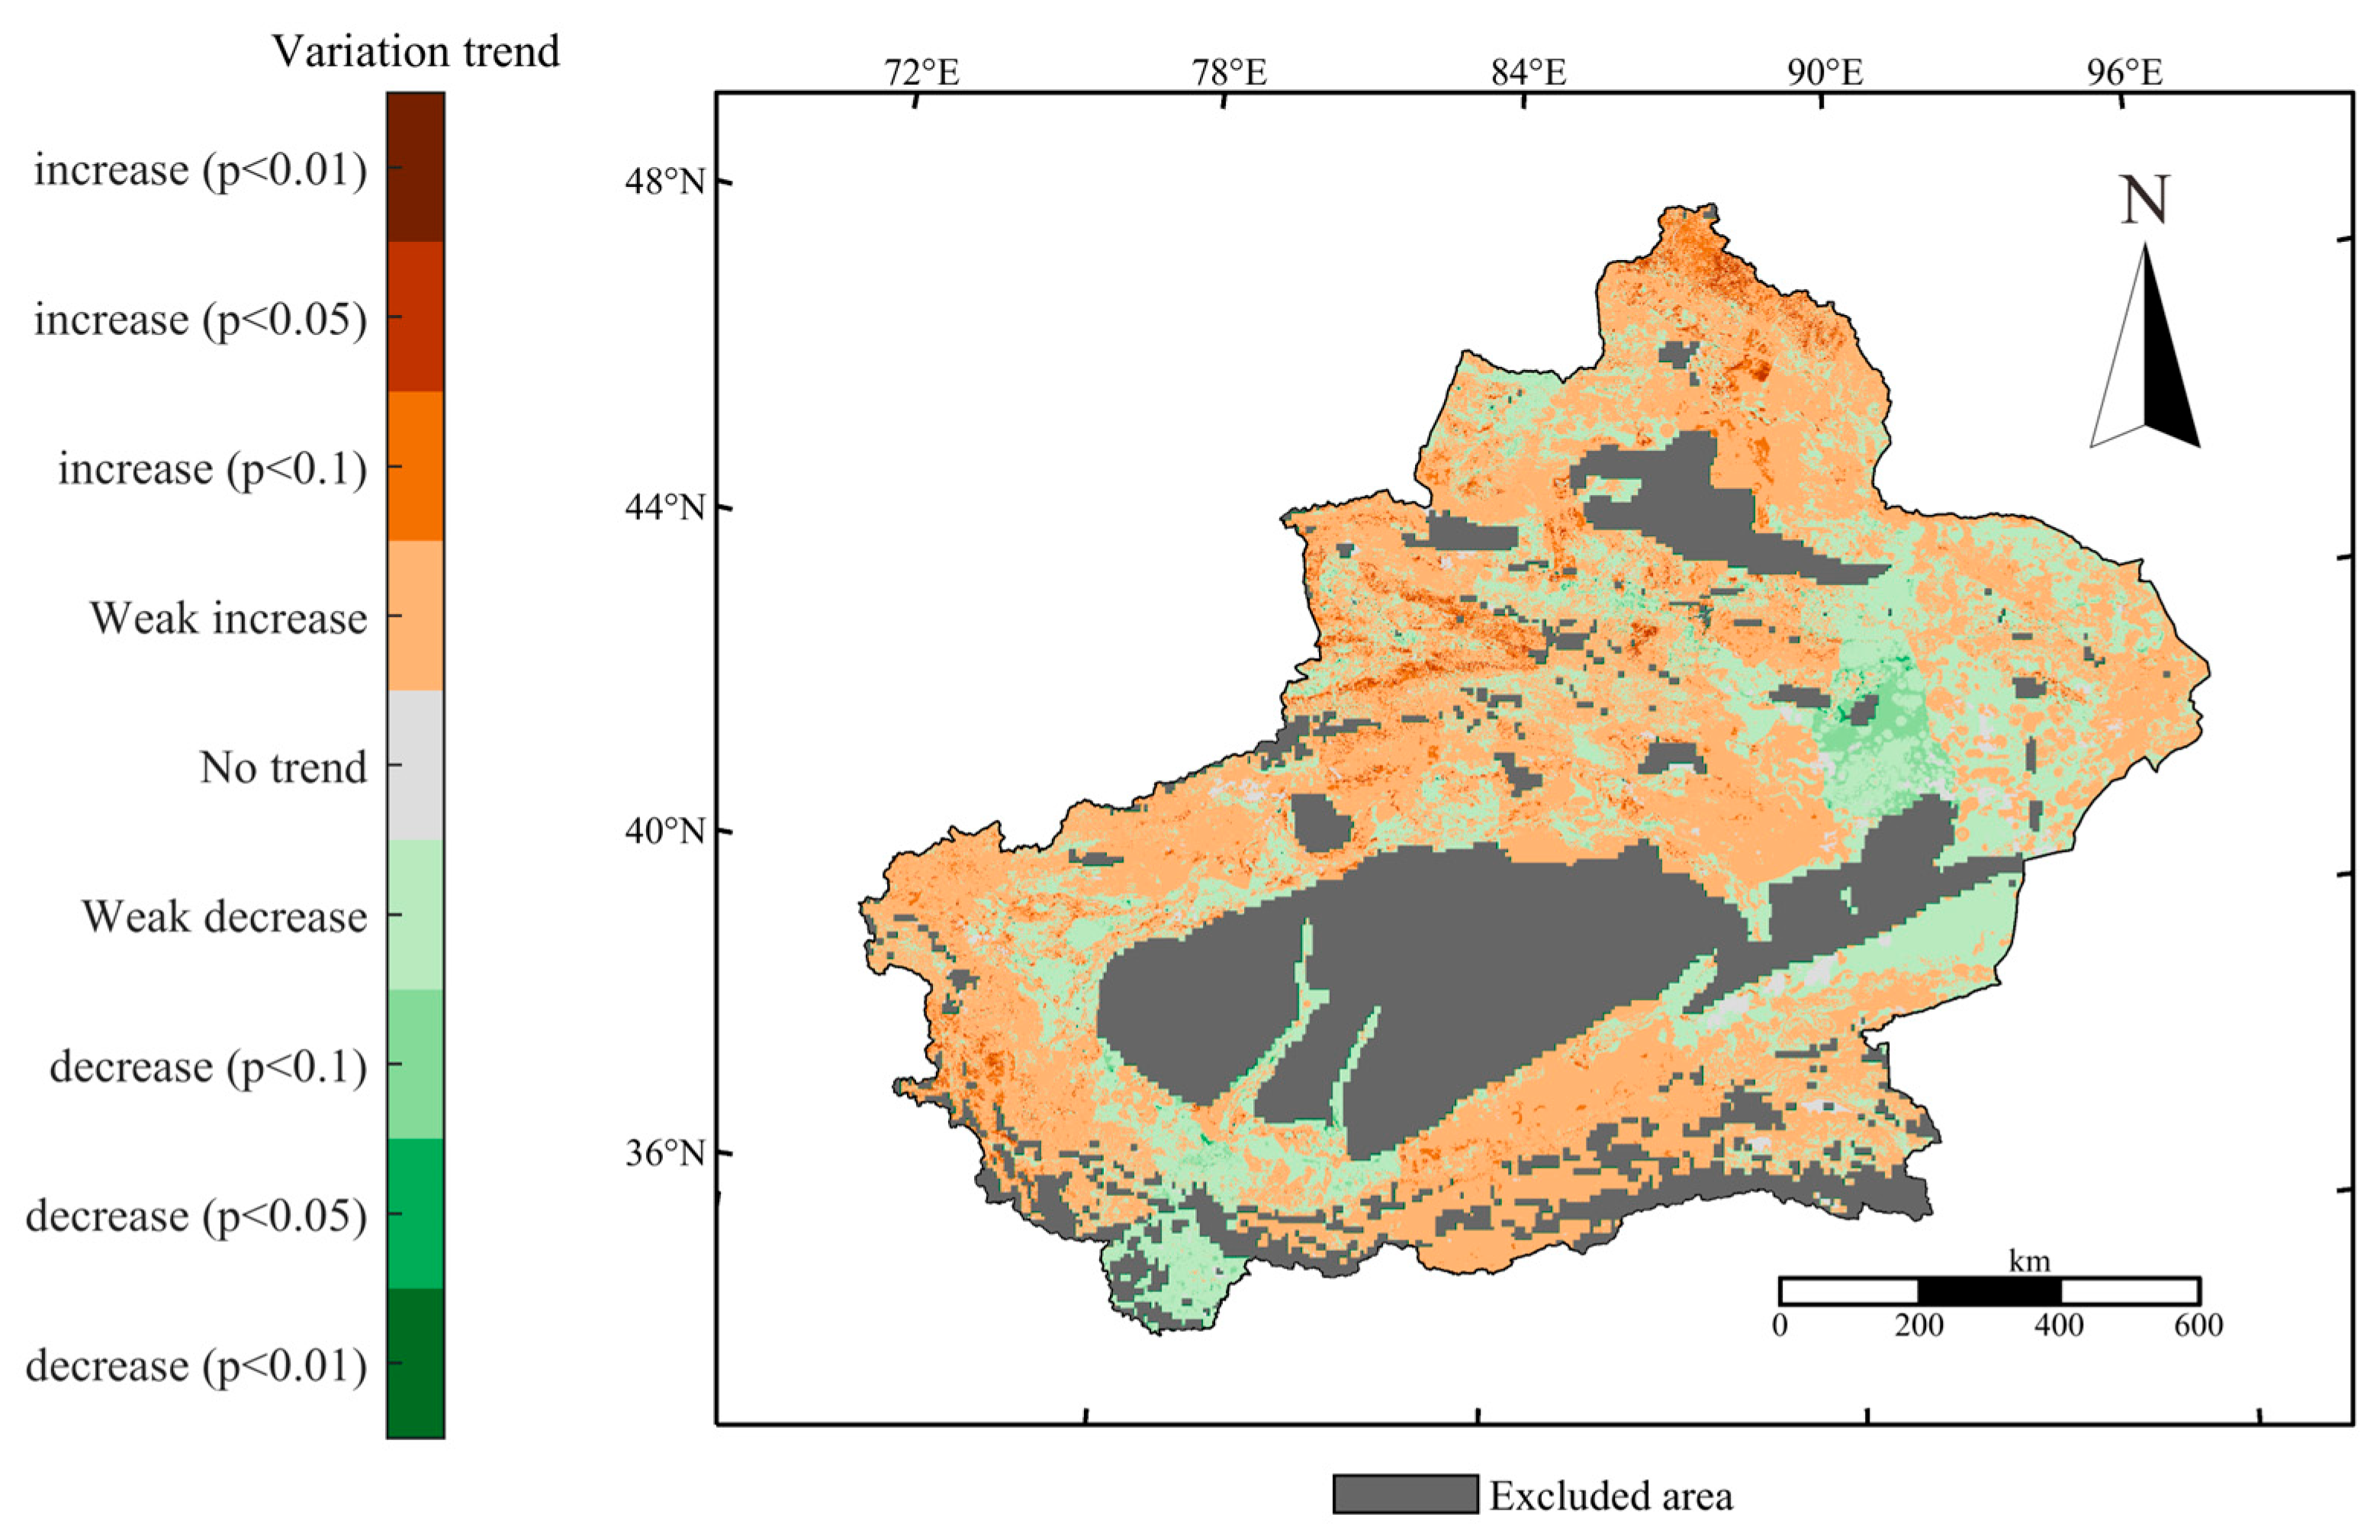
Figure 5 illustrates the spatial variations in the total CH4 emissions from livestock in Xinjiang over the study period. By 2020, high-emission zones were mainly concentrated in the Ili River Valley, oasis regions along the northwestern margin of the Tarim Basin, the southern fringe of the Junggar Basin, the Bortala Mongol Autonomous Prefecture, and parts of the Altay region. Over the past two decades, most areas in Xinjiang experienced slight to moderate increases in CH4 emissions. Notably, high-emission zones in regions such as Aksu Prefecture, the Ili River Valley, and Kashgar exhibited continuous growth, with a marked expansion in areas exceeding 500 kg·km−2·year−1. In contrast, parts of Turpan experienced marked declines, while marginal zones of the Tarim Basin experienced moderate downward trends (Figure 6).
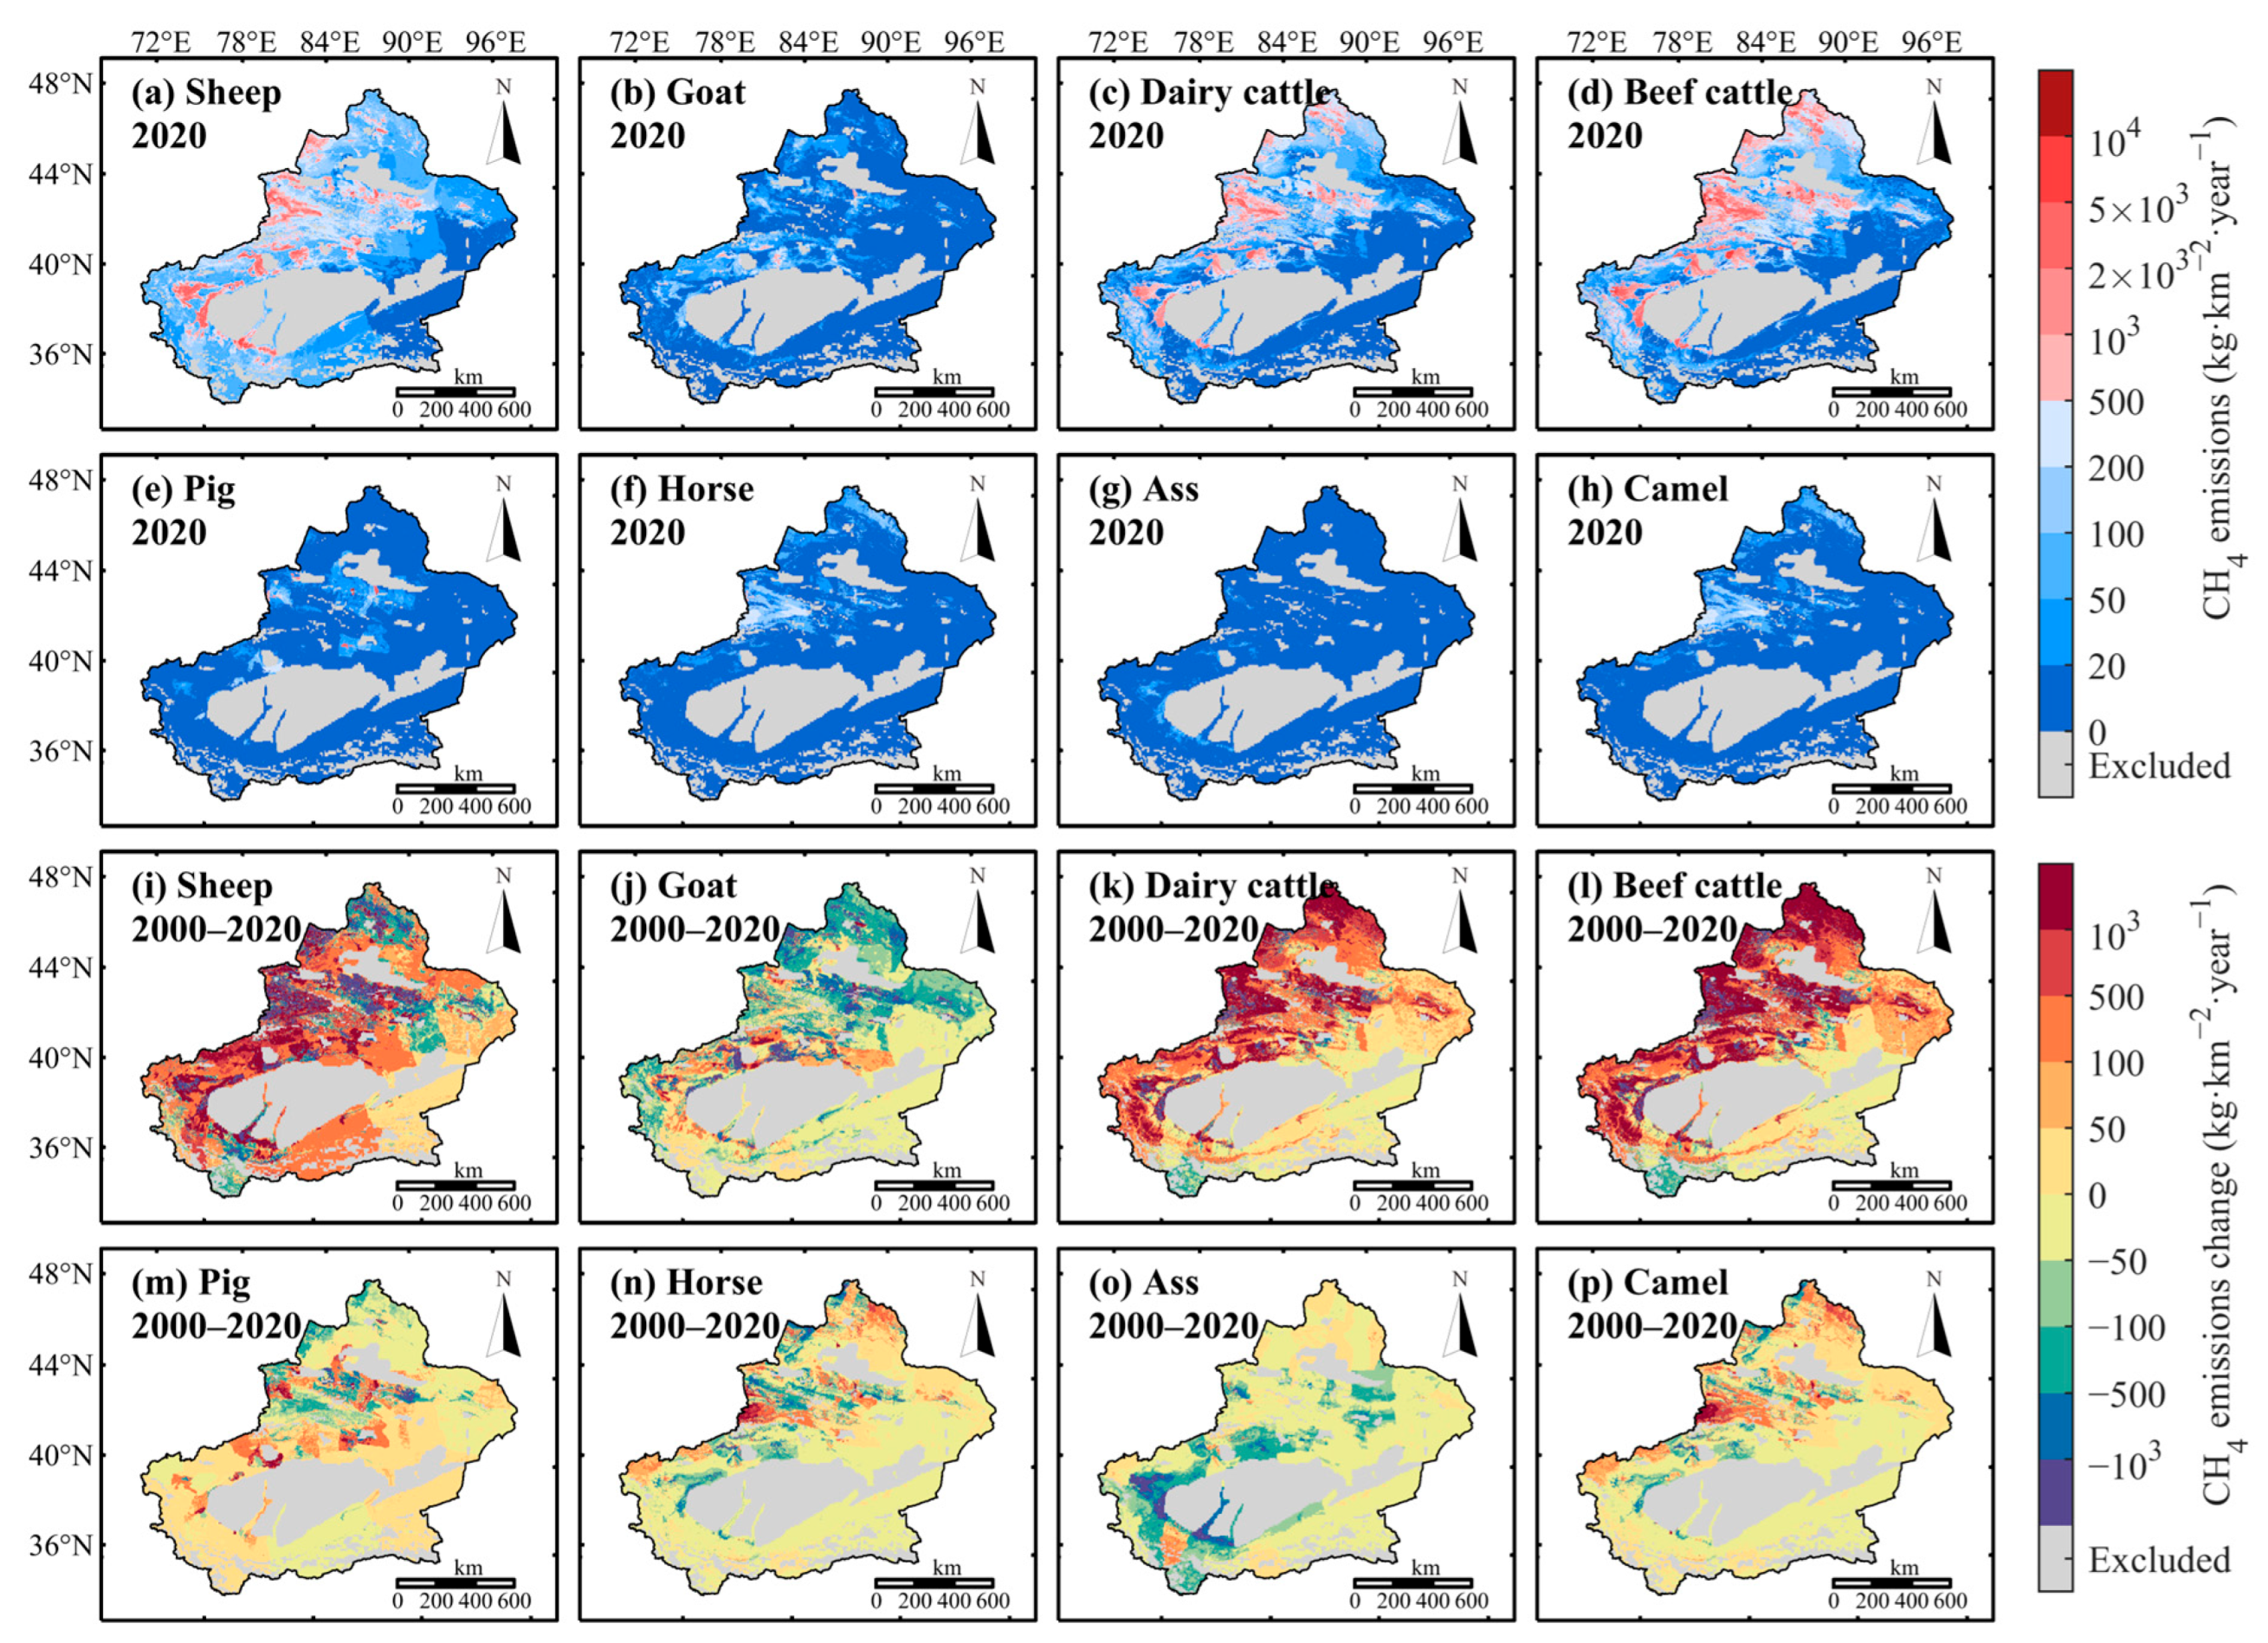
Figure 7 illustrates the spatial patterns of CH4 emissions from different animals. In 2020, sheep, dairy cattle, and beef cattle emerged as the primary contributors to total CH4 emissions, collectively dictating the spatial distribution patterns by spanning nearly all major high-emission hotspots. In high emission areas including the Ili River Valley, Kashgar, and parts of Altay region, CH4 emission densities for these species commonly exceeded 1000 kg·km−2·year−1, with extreme values surpassing 10,000 kg·km−2·year−1. When focusing on the year 2020, beef cattle exhibited the highest emissions and the most extensive high-emission zones among all the species, followed by dairy cattle. Sheep emissions reached 10,000 kg·km−2·year−1 in areas such as the northern slope of the Tianshan Mountains and the Ili River Valley, while less than 20 kg·km−2·year−1 in areas like Hami Prefecture and the southern edge of the Qaidam Basin. Goats, pigs, horses, asses, and camels contributed less to CH4 emissions, with values predominantly below 20 kg·km−2·year−1. Pig emissions were highly localized, primarily confined to Han Chinese settlements, reflecting limited distribution across Xinjiang.
From 2000 to 2020, CH4 emissions from sheep generally increased, although substantial decreases were observed in the Altay region, along the southern margin of the Junggar Basin, and in southern Hotan. Emissions from dairy cattle and beef cattle also showed overall increases, with notable reductions only in the Hotan area. Goat emissions decreased across most of their distribution range, except for the northwestern fringe of the Tarim Basin. Pig emissions increased in a concentrated manner within their limited distribution range. Emissions from horses and camels notably increased in the Ili River Valley and northern Altay, while remaining stable or slightly declining elsewhere. Emissions from asses declined significantly across all of their distribution areas.

4. Discussion

Between 2000 and 2020, livestock-related CH4 emissions in Xinjiang exhibited an overall trend of fluctuating growth. The temporal evolution of total emissions can be divided into three distinct stages. Stage I (2000–2005): This phase corresponds to a phase of policy-driven expansion in animal husbandry. This phase coincides with the issuance of a national policy document by China’s Ministry of Agriculture, titled Opinions on Accelerating the Development of Animal Husbandry, which facilitated the extensive expansion of livestock production in Xinjiang, resulting in a substantial rise in animal numbers and associated emissions. Stage II (2006–2011): The subsequent phase was shaped by the delayed ecological consequences of prior overexpansion. This temporal pattern is closely linked to the dynamics of total livestock population, with the significant reduction in animal numbers around 2006 being the immediate cause of the emission drop. The underlying drivers of this trend likely stem from the resource pressures accumulated during the preceding period of rapid pastoral expansion [37]. There were no effective human interventions in place to protect grasslands in Xinjiang prior to 2005. Before 2005, Xinjiang’s livestock sector experienced accelerated growth under supportive national policies, adopting a highly extensive production model. To accommodate increasing livestock numbers, natural pastures were intensively exploited, leading to rangeland degradation and a decline in ecological carrying capacity. Due to the delayed effects of this degradation, the consequences became prominent around 2006, resulting in a shortage of available forage resources. According to the Xinjiang Environmental Status Bulletin, in 2006 the total grazing pressure across the region reached 40.5 million sheep units, with an overgrazing rate as high as 50% [38]. More than 85% of natural grasslands experienced varying degrees of degradation. At the same time, the development of supplementary feed production lagged behind, exacerbating the imbalance between forage supply and demand [39]. This led to increased production costs, forcing many herders to exit the livestock industry and resulting in a contraction of the sector. Stage III (2011–2020): The final stage reflects the sector’s adaptive responses to earlier ecological stresses and emerging policy shifts. During this phase, driven by new policies and structural adjustments, Xinjiang’s livestock industry began transitioning toward more intensive and sustainable practices. As a result, following the implementation of ecological policies such as the retiring grazing for grassland restoration and a transitional phase from 2006 to 2010, CH4 emissions from livestock began to rise again around 2010, entering a stage of slow yet fluctuating growth that persisted throughout the subsequent decade.
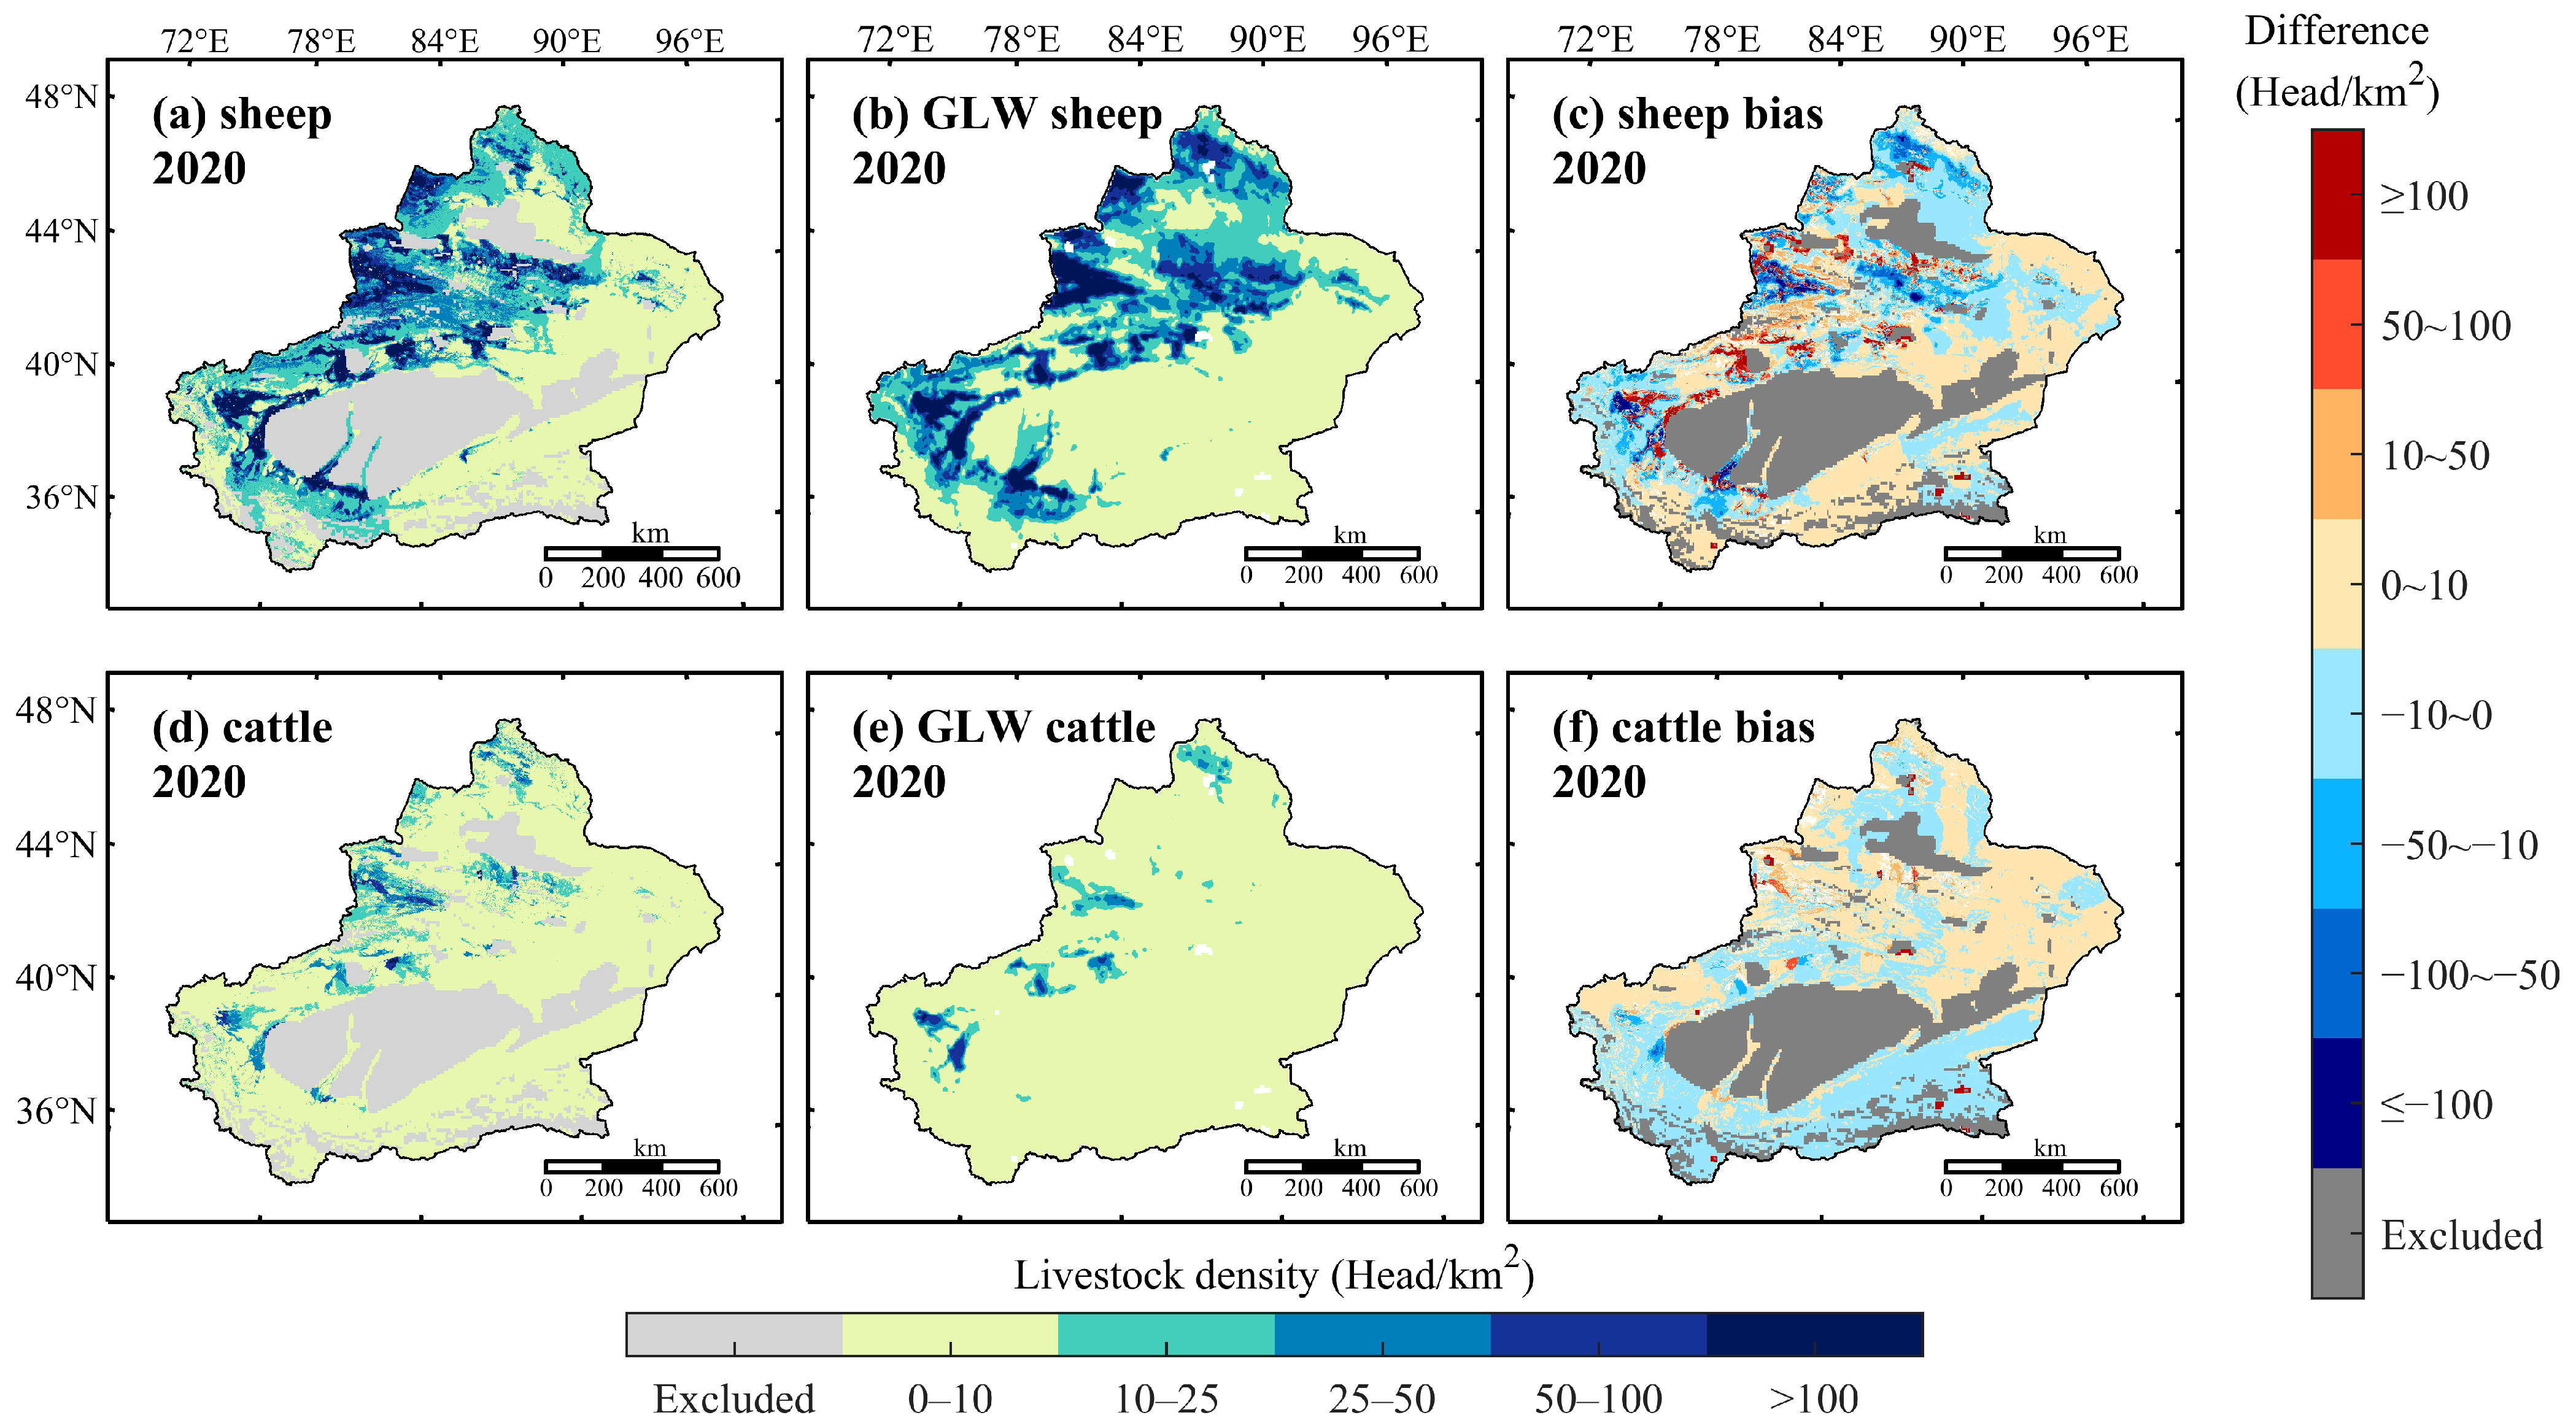
In terms of livestock distribution, the results of this study provide enhanced spatial resolution while maintaining accuracy, enabling a more detailed characterization of the spatial heterogeneity in livestock density. Taking sheep and cattle as representative examples, the 1 km-resolution estimates for 2020 of this study were compared with the 10 km-resolution results from the Global Livestock of the World dataset version 4 (GLW4) in Figure 8 [40]. The comparison reveals a high degree of spatial consistency between the two datasets, with high-density clusters largely corresponding across both maps, indicating the reliability of our model predictions. Moreover, compared to GLW4, our 2020 results offer finer spatial detail. The boundaries of high-density areas are more clearly defined, and medium-to-low-density zones are better represented around high-density clusters. As illustrated in Figure 8d,e, for livestock species such as cattle—which are expensive to raise and typically found in fewer, more concentrated locations—the 1 km model of this study is more capable of capturing localized clustering patterns and avoiding the “spatial dilution” effect often seen at coarser resolutions, thereby providing a more accurate depiction of actual livestock distribution. Further, Figure 8c,f illustrates the distribution of differences between the two datasets, providing an intuitive view of their local discrepancies. Overall, the differences remain within a reasonable range across most areas, indicating good consistency. However, the model results of this study offer finer spatial detail, allowing for a more accurate depiction of local variations and spatial heterogeneity.
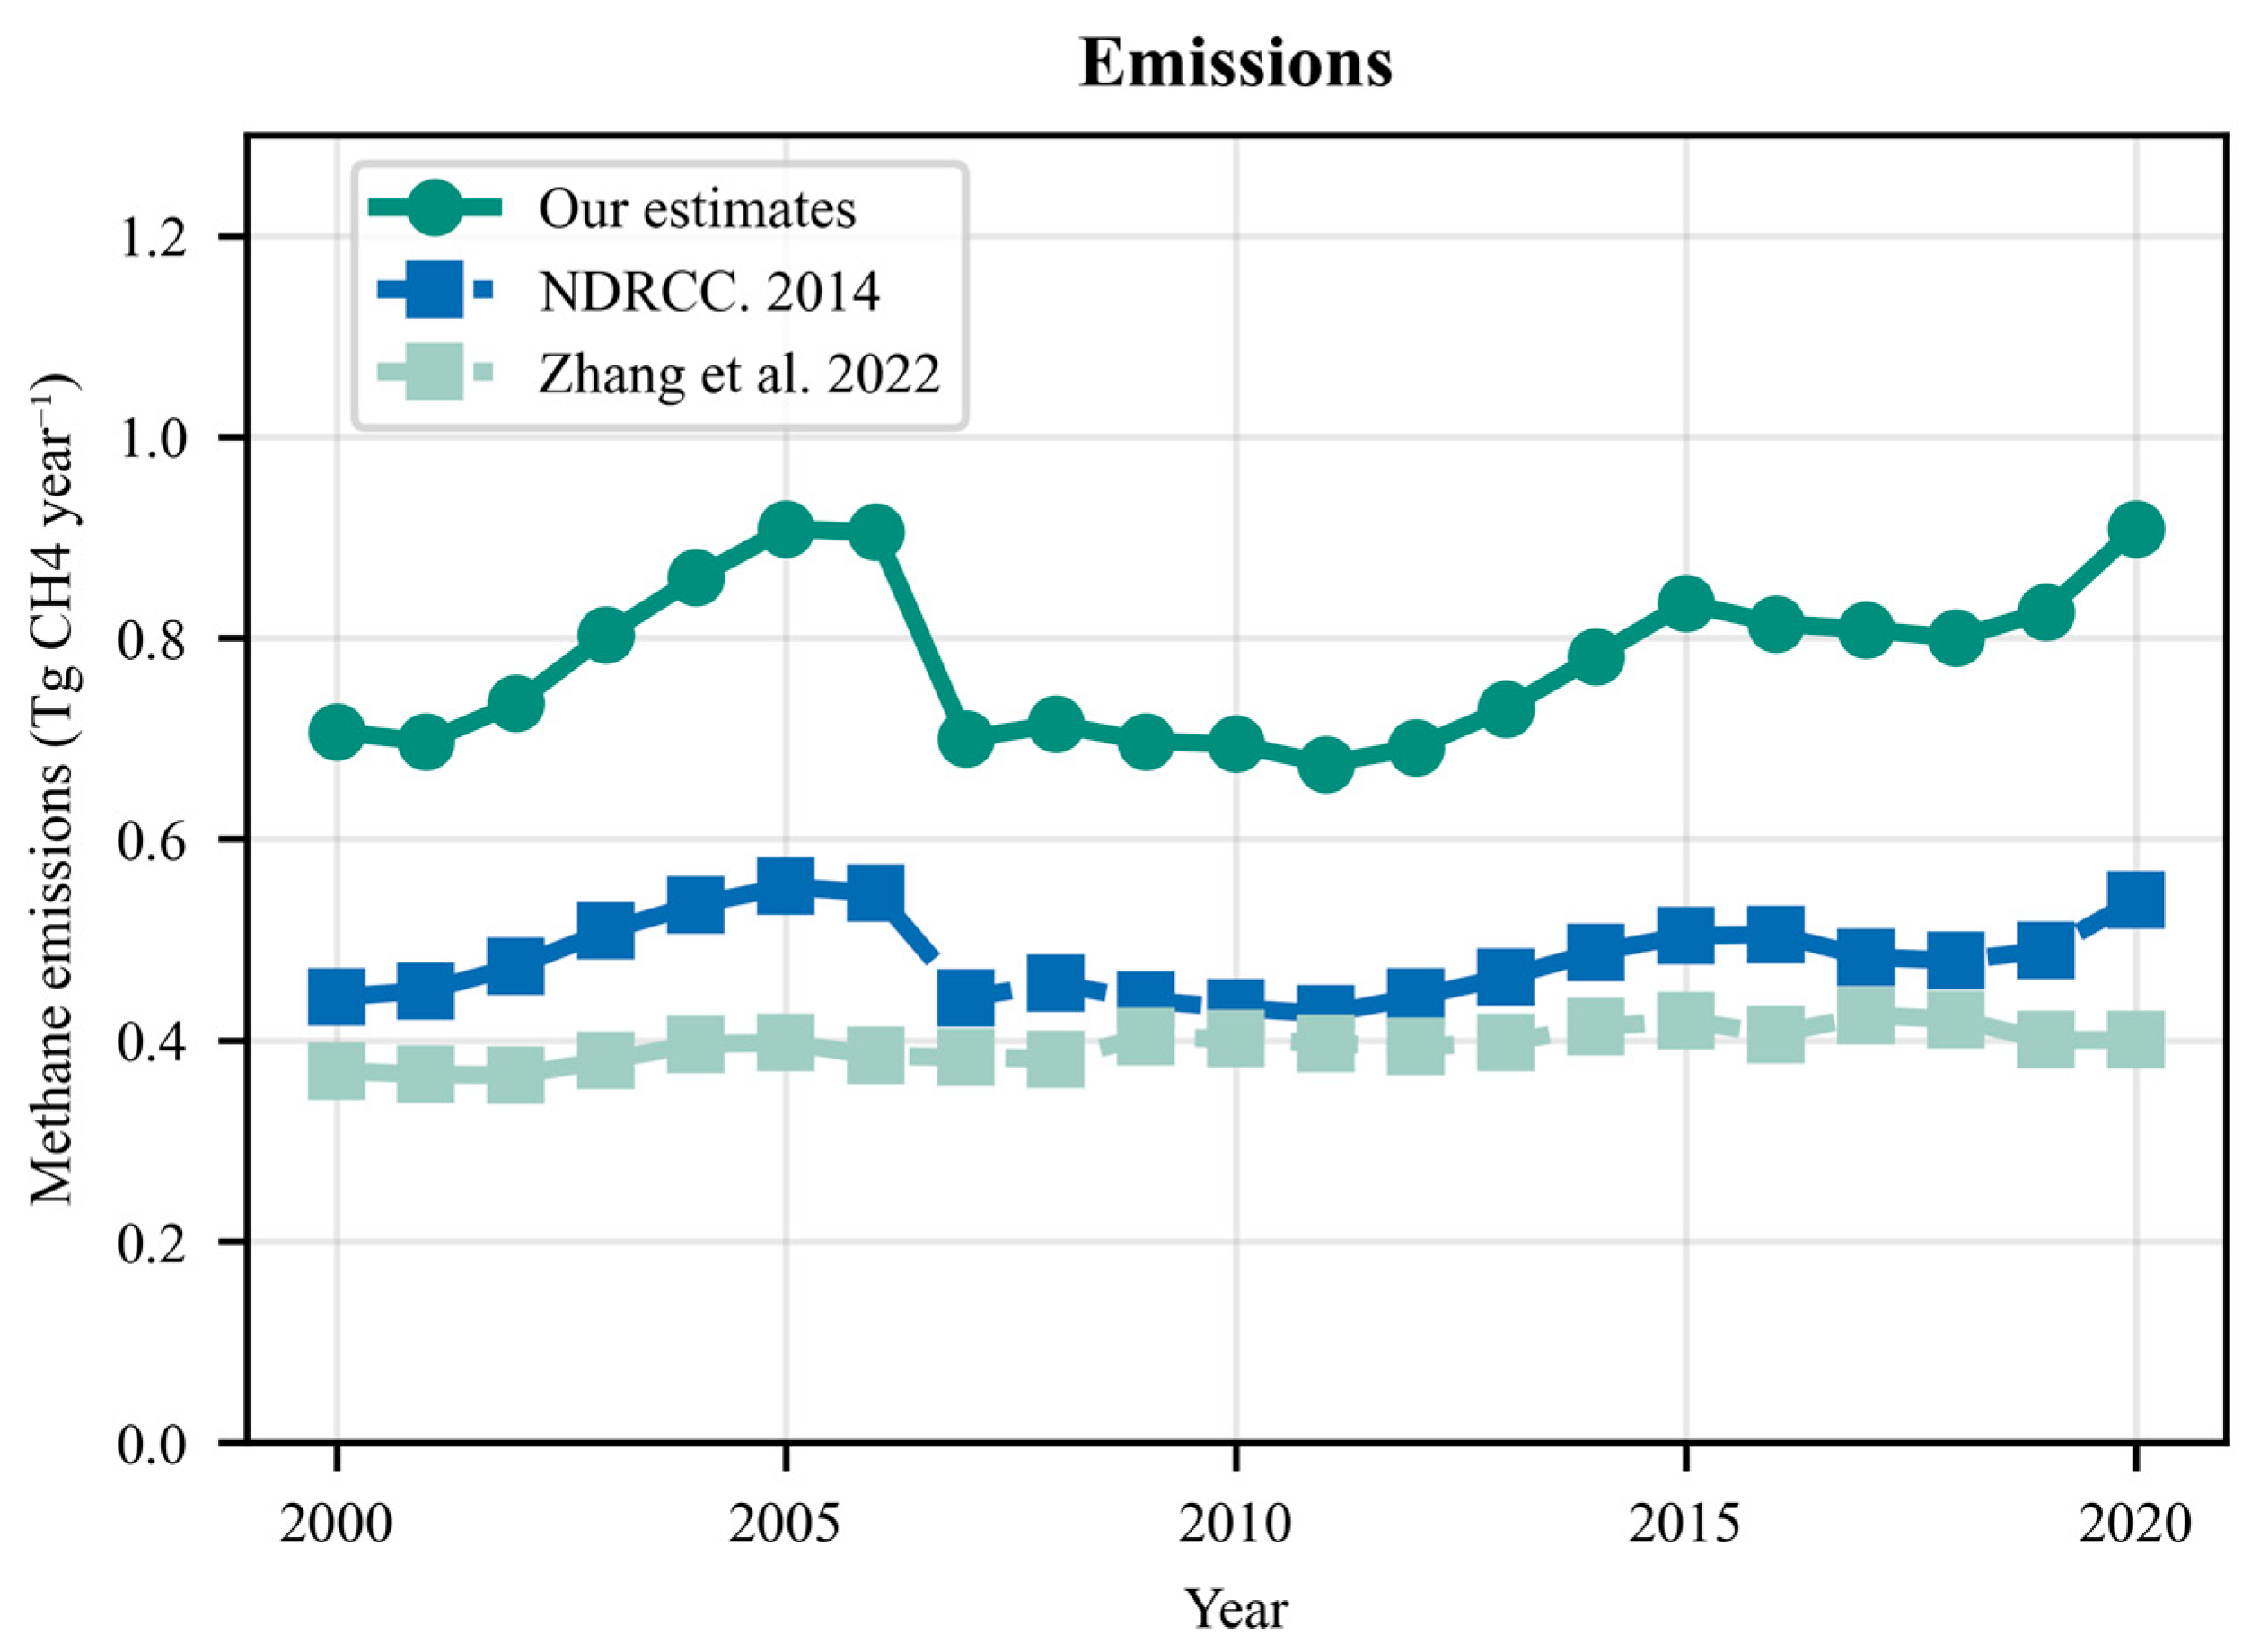
With respect to CH4 emissions, the estimates produced in this study are more regionally appropriate and better reflect the temporal dynamics and interannual variability of livestock-related CH4 emissions in Xinjiang. Our estimates were compared with two representative references (Figure 9): (1) the 2013 livestock CH4 emission factors based on the People’s Republic of China National Greenhouse Gas Inventory issued by the National Development and Reform Commission [41] applied to Xinjiang’s total livestock numbers collected in this study, and (2) the global 130-year livestock CH4 emissions dataset published by Zhang et al. [17]. The results show that the overall emission trends are consistent across the three sources, supporting the reliability of the Tier 2 methodology used in this study. Notably, our emission estimates are consistently higher and exhibit greater variability than those of the NDRCC result and the global dataset. This discrepancy may stem from the fact that the latter two rely on national average livestock parameters, which may not accurately reflect the unique characteristics of Xinjiang’s livestock systems. Due to the region’s specific environmental conditions, local livestock such as cattle and sheep tend to be larger and exhibit higher energy demands [42], which leads to higher methane production potential [19,43]. In contrast, emission factors (EFs) in this study were calculated based on parameters specific to Xinjiang livestock, resulting in estimates that are both higher and more representative of actual regional emissions, thereby reducing the underestimation bias often found in generalized national or global models.
The development of a ~1 km resolution gridded map of livestock CH4 emissions in Xinjiang provides critical insights for spatially explicit emission mitigation. This fine-scale mapping allows for the precise identification of high-emission hotspots—particularly the Ili River Valley, Bortala, and the oasis regions along the northwestern edge of the Tarim Basin—where livestock density and CH4 output have remained consistently high over the past two decades. Targeting these areas is crucial for effective emission reduction, as they not only support intensive livestock production due to abundant pasture and water resources but also exhibit strong spatial coupling between livestock density and CH4 emission intensity.
Temporal trends further reveal important shifts in species-specific contributions to total CH4 emissions. Sheep, goat, dairy cattle, and beef cattle have remained the dominant sources, collectively accounting for ~93% of annual emissions throughout the study period. However, slight variations in their relative shares over time suggest evolving patterns in livestock management and regional adaptation. These changes offer valuable guidance for refining mitigation strategies: for instance, regions experiencing rising cattle emissions may benefit more from interventions focused on ruminant-specific digestion efficiency.
Enteric fermentation continues to be the primary source of CH4, making it the top priority for intervention. Strategies to reduce enteric methane emissions include improving feed digestibility, animal health, and productivity, as well as using methane inhibitors, electron sinks, vegetable oils, and tanniferous forages [44,45,46]. For instance, an 8.5% reduction in methane intensity per kilogram of milk fat can be achieved through supplementation with an essential oil blend [47]. Meanwhile, manure management remains an underutilized but promising mitigation pathway. Effective methane mitigation strategies in manure management include frequent manure removal, anaerobic digestion, composting, and acidification during storage, with acidification shown to reduce methane emissions by 67% to 87% [47,48,49]. Importantly, these approaches must be tailored to local conditions—considering factors such as land competition in oasis zones and cultural livestock preferences (e.g., minimal pig farming in Muslim-majority areas)—to ensure both feasibility and effectiveness. Anaerobic digestion offers a viable methane reduction option within manure management; however, dietary interventions remain the most effective strategy for mitigating methane emissions from livestock [50].
Spatial patterns and temporal trends of methane emissions provide a valuable basis for policymakers to identify high-emission hotspots and formulate targeted mitigation strategies. A wide range of effective approaches have already been proposed and applied, such as breeding livestock with lower methane yields [51], improving forage management, and optimizing dietary formulations [52]. At the same time, Nisbet has emphasized that “better measurement: identification, location, and quantification of emissions” is a prerequisite for the mitigation of agricultural methane emissions [53]. By revealing the spatial distribution and temporal dynamics of methane emissions in Xinjiang, this study enables policymakers to accurately locate high-emission hotspots and set location-based priorities for designing regional mitigation policies. Furthermore, spatially explicit methane emission data can be integrated with other geospatial datasets to generate additional policy-relevant insights. For instance, comparing livestock methane emissions with grassland net primary productivity (NPP) helps to identify areas where forage consumption exceeds ecological carrying capacity, thereby highlighting potential overgrazing hotspots. Such cross-analyses provide a scientific basis for prioritizing intervention areas and contribute to the development of more targeted mitigation and grassland management strategies. Through these pathways, methane reductions can be achieved more efficiently, thereby supporting the broader goal of regional sustainable development.
Although this study significantly improves the spatial and temporal resolution of CH4 emission estimates in Xinjiang, several sources of uncertainty remain. First, the Random Forest (RF) model used for livestock density mapping, while effective in capturing nonlinear relationships, is sensitive to the quality and completeness of input data. Consequently, uncertainties at the data level may propagate into the model. For example, in certain years, missing livestock census data were linearly interpolated, which may introduce bias and amplify errors for specific years, particularly in regions with rapidly changing livestock dynamics. In addition, uncertainties also exist within the covariates used as model inputs; however, this study sought to minimize such effects by relying on high-resolution official datasets wherever possible. Second, at the modeling level, the RF model was trained using county-level averages and subsequently downscaled to 1 km grid cells. This process implicitly assumes that livestock density patterns at the grid-cell level are consistent with those observed at the county scale, which may cause scale mismatches. In areas where this assumption does not hold, local over- or underestimation is possible. Furthermore, due to data limitations, sheep and goats were combined into a single livestock category for modeling purposes. While these species share certain ecological and management characteristics, their methane emission profiles can differ. This aggregation may obscure species-specific spatial patterns and reduce local estimation accuracy. Third, although livestock populations fluctuate throughout the year, they are assumed to remain constant within a single year, as the life span of animals is not taken into account in this study. This simplification may underestimate short-term variability and seasonal emission peaks, though the impact on annual totals is expected to be limited. Fourth, dynamic CH4 emission factors were estimated by incorporating changes in livestock productivity (e.g., body weight), following IPCC 2019 Tier 2 guidelines [18,54]. However, due to limited availability of long-term data, regional differences in feed quality, digestibility, and manure management practices were not fully captured, contributing to residual uncertainty in the emission estimates. However, comparisons with lower-resolution global datasets (e.g., GLW4) suggest that these uncertainties do not fundamentally alter the main conclusions of this study.

5. Conclusions

This study estimated annual livestock CH4 emissions in Xinjiang from 2000 to 2020 using high-resolution livestock distribution predictions and the IPCC (2019) Tier 2 methodology. Results indicate that total emissions increased from 0.7 Tg CH4/year to 0.9 Tg CH4/year, a 28.5% increase over twenty years. Among the eight livestock categories, sheep contributed the most to overall emissions, followed by dairy cattle and beef cattle. High-emission hotspots were consistently located in the Ili River Valley, Bortala, and the northwestern margins of the Tarim Basin. Compared with previous estimates using the Tier 1 approach or national/global-level datasets, our results reveal stronger regional fluctuations and significantly higher emission levels and growth rates. The spatial distribution of livestock CH4 emissions in Xinjiang is primarily influenced by factors such as cropland area, vegetation cover (NDVI), and rural population, as well as by the region’s cultural composition. Interannual variations in emissions are largely driven by grassland degradation, policy shifts, and market dynamics.
By providing spatially explicit and temporally continuous emission estimates, this study delivers a valuable dataset for policymakers. The results can be directly used to identify emission hotspots, prioritize areas for targeted mitigation, and support the design of adaptive grazing and grassland management strategies. Furthermore, our approach demonstrates a scalable framework that can be applied to other pastoral regions facing similar data and management challenges. Despite the uncertainty, this study advances the understanding of livestock-related CH4 emissions in Xinjiang and provides scientific support for the development of region-specific mitigation strategies, thereby contributing to broader efforts to reduce agricultural greenhouse gas emissions and promote sustainable pastoral development.

Supplementary Materials

The following supporting information can be downloaded at: https://www.mdpi.com/article/10.3390/su17209021/s1, Text S1: Tier 2 approach; Figure S1: Spatial patterns of different animals in 2000 and 2020; Figure S2: Changes in livestock body weight in Xinjiang; Figure S3: Changes in livestock milk yield and wool productivity in Xinjiang; Table S1: Enhanced classification of livestock and subcategories; Table S2: Manure management systems (AWMS) in Xinjiang; Table S3: Variance Inflation Factors (VIFs) for all environmental variables. References [18,19,20,21,39,42,55,56,57,58,59,60,61,62,63] are citied in the Supplemental Materials.

Author Contributions

Conceptualization, Q.X. and Y.L.; Data curation, Q.X., Y.L., L.Z., H.Z. and Z.Z.; Formal analysis, Q.X. and Y.L.; Methodology, Q.X., Y.L. and L.Z.; Supervision, L.Z. and Y.Y. (Yongfa You); Validation, L.Z.; Visualization, Q.X. and Y.L.; Writing—original draft, Q.X. and Y.L.; Writing—review & editing, Q.X., Y.L., L.Z., H.Z., Z.Z., Y.Y. (Yongfa You), Y.Y. (Yuanzhi Yao) and Y.H. All authors have read and agreed to the published version of the manuscript.

Funding

This research was funded by (1) the Ministry of Education of China under the 2025 Top-Notch Student Cultivation Program 2.0 in Basic Disciplines, grant number 20251001; (2) the independent project of Xinjiang Institute of Ecology and Geography, Chinese Academy of Sciences, grant number E4500121; (3) the National Science Foundation, grant number 42371410.

Institutional Review Board Statement

Not applicable.

Informed Consent Statement

Not applicable.

Data Availability Statement

The original contributions presented in this study are included in the article. Further inquiries can be directed to the corresponding author.

Acknowledgments

We acknowledge the contributions of the three anonymous referees and the editors, whose suggestions significantly improved this manuscript.

Conflicts of Interest

The authors declare no conflicts of interest.

References

  1. Yuliati, L.; Yoshida, H. Photocatalytic conversion of methane. Chem. Soc. Rev. 2008, 37, 1592–1602. [Google Scholar] [CrossRef] [PubMed]
  2. Tian, H.; Lu, C.; Ciais, P.; Michalak, A.M.; Canadell, J.G.; Saikawa, E.; Huntzinger, D.N.; Gurney, K.R.; Sitch, S.; Zhang, B.; et al. The terrestrial biosphere as a net source of greenhouse gases to the atmosphere. Nature 2016, 531, 225–228. [Google Scholar] [CrossRef]
  3. Lan, X.; Thoning, K.W.; Dlugokencky, E.J. Trends in Globally-Averaged CH4, N2O, and SF6 Determined from NOAA Global Monitoring Laboratory Measurements. Available online: https://doi.org/10.15138/P8XG-AA10 (accessed on 10 July 2025).
  4. Saunois, M.; Martinez, A.; Poulter, B.; Zhang, Z.; Raymond, P.A.; Regnier, P.; Canadell, J.G.; Jackson, R.B.; Patra, P.K.; Bousquet, P.; et al. Global Methane Budget 2000–2020. Earth Syst. Sci. Data 2025, 17, 1873–1958. [Google Scholar] [CrossRef]
  5. Karakurt, I.; Aydin, G.; Aydiner, K. Sources and mitigation of methane emissions by sectors: A critical review. Renew. Energy 2012, 39, 40–48. [Google Scholar] [CrossRef]
  6. Armour, K.; Forster, P.; Storelvmo, T.; Collins, W.; Dufresne, J.L.; Frame, D.; Lunt, D.; Mauritsen, T.; Palmer, M.; Watanabe, M.; et al. The Earth’s Energy Budget, Climate Feedbacks and Climate Sensitivity; Intergovermental Panel on Climate Change: Geneva, Switzerland, 2021; pp. 923–1054. Available online: https://www.ipcc.ch/report/ar6/wg1/chapter/chapter-7/ (accessed on 7 October 2025).
  7. Du, S.; Li, M.; Chai, Y.; Pei, X.; Zhang, J. Optimising breeding strategies for sheep populations in response to dynamic price: A case study in Xinjiang. Adv. Contin. Discret. Models 2025, 2025, 88. [Google Scholar] [CrossRef]
  8. Li, X.L.; Yuan, Q.H.; Wan, L.Q.; He, F. Perspectives on livestock production systems in China. Rangel. J. 2008, 30, 211–220. [Google Scholar] [CrossRef]
  9. Duan, Y.; Gao, Y.; Zhao, J.; Xue, Y.; Zhang, W.; Wu, W.; Jiang, H.; Cao, D. Agricultural Methane Emissions in China: Inventories, Driving Forces and Mitigation Strategies. Environ. Sci. Technol. 2023, 57, 13292–13303. [Google Scholar] [CrossRef]
  10. Liu, Y.; Wang, J.; Yang, K.; Ochir, A. Mapping livestock density distribution in the Selenge River Basin of Mongolia using random forest. Sci. Rep. 2024, 14, 11090. [Google Scholar] [CrossRef]
  11. Meisner, J.; Kato, A.; Lemerani, M.; Miaka, E.M.; Ismail, A.T.; Wakefield, J.; Rowhani-Rahbar, A.; Pigott, D.; Mayer, J.; Rabinowitz, P. A time-series approach to mapping livestock density using household survey data. Sci. Rep. 2022, 12, 13310. [Google Scholar] [CrossRef] [PubMed]
  12. Li, X.; Hou, J.; Huang, C. High-Resolution Gridded Livestock Projection for Western China Based on Machine Learning. Remote Sens. 2021, 13, 5038. [Google Scholar] [CrossRef]
  13. Meng, N.; Wang, L.; Qi, W.; Dai, X.; Li, Z.; Yang, Y.; Li, R.; Ma, J.; Zheng, H. A high-resolution gridded grazing dataset of grassland ecosystem on the Qinghai–Tibet Plateau in 1982–2015. Sci. Data 2023, 10, 68. [Google Scholar] [CrossRef] [PubMed]
  14. Wang, Y.; Zhu, Z.; Dong, H.; Zhang, X.; Wang, S.; Gu, B. Mitigation potential of methane emissions in China’s livestock sector can reach one-third by 2030 at low cost. Nat. Food 2024, 5, 603–614. [Google Scholar] [CrossRef]
  15. Kolluru, V.; John, R.; Saraf, S.; Chen, J.; Hankerson, B.; Robinson, S.; Kussainova, M.; Jain, K. Gridded livestock density database and spatial trends for Kazakhstan. Sci. Data 2023, 10, 839. [Google Scholar] [CrossRef]
  16. Wing, I.S. The synthesis of bottom-up and top-down approaches to climate policy modeling: Electric power technology detail in a social accounting framework. Energy Econ. 2008, 30, 547–573. [Google Scholar] [CrossRef]
  17. Zhang, L.; Tian, H.; Shi, H.; Pan, S.; Chang, J.; Dangal, S.R.S.; Qin, X.; Wang, S.; Tubiello, F.N.; Canadell, J.G.; et al. A 130-year global inventory of methane emissions from livestock: Trends, patterns, and drivers. Glob. Change Biol. 2022, 28, 5142–5158. [Google Scholar] [CrossRef]
  18. Intergovernmental Panel on Climate Change (IPCC). 2019 Refinement to the 2006 IPCC Guidelines for National Greenhouse Gas Inventories. Volume 4: Agriculture, Forestry and Other Land Uses; Intergovernmental Panel on Climate Change: Geneva, Switzerland, 2019; Available online: https://www.ipcc-nggip.iges.or.jp/public/2019rf/ (accessed on 7 October 2025).
  19. Dangal, S.R.S.; Tian, H.; Zhang, B.; Pan, S.; Lu, C.; Yang, J. Methane emission from global livestock sector during 1890–2014: Magnitude, trends and spatiotemporal patterns. Glob. Change Biol. 2017, 23, 4147–4161. [Google Scholar] [CrossRef] [PubMed]
  20. Yu, J.; Peng, S.; Chang, J.; Ciais, P.; Dumas, P.; Lin, X.; Piao, S. Inventory of methane emissions from livestock in China from 1980 to 2013. Atmos. Environ. 2018, 184, 69–76. [Google Scholar] [CrossRef]
  21. Zhang, L.; Tian, H.; Shi, H.; Pan, S.; Qin, X.; Pan, N.; Dangal, S.R. Methane emissions from livestock in East Asia during 1961–2019. Ecosyst. Health Sustain. 2021, 7, 1918024. [Google Scholar] [CrossRef]
  22. Chadwick, D.; Sommer, S.; Thorman, R.; Fangueiro, D.; Cardenas, L.; Amon, B.; Misselbrook, T. Manure management: Implications for greenhouse gas emissions. Anim. Feed. Sci. Technol. 2011, 166, 514–531. [Google Scholar] [CrossRef]
  23. Basarab, J.A.; Beauchemin, K.A.; Baron, V.S.; Ominski, K.H.; Guan, L.L.; Miller, S.P.; Crowley, J.J. Reducing GHG emissions through genetic improvement for feed efficiency: Effects on economically important traits and enteric methane production. Animal 2013, 7, 303–315. [Google Scholar] [CrossRef]
  24. Xu, P.; Liao, Y.; Zheng, Y.; Zhao, C.; Zhang, X.; Zheng, Z.; Luan, S. Northward shift of historical methane emission hotspots from the livestock sector in China and assessment of potential mitigation options. Agric. For. Meteorol. 2019, 272, 1–11. [Google Scholar] [CrossRef]
  25. The Xinjiang Bureau of Statistics. Xinjiang Statistical Yearbook; China Statistics Press: Urumqi, China, 2000–2020. [Google Scholar]
  26. Breiman, L. Random Forests. Mach. Learn. 2001, 45, 5–32. [Google Scholar] [CrossRef]
  27. Cheng, L.; Wang, L.; Feng, R.; Yan, J. Remote Sensing and Social Sensing Data Fusion for Fine-Resolution Population Mapping With a Multimodel Neural Network. IEEE J. Sel. Top. Appl. Earth Obs. Remote Sens. 2021, 14, 5973–5987. [Google Scholar] [CrossRef]
  28. Muñoz Sabater, J. ERA5-Land Monthly Averaged Data from 1950 to Present. 2019. Available online: https://doi.org/10.24381/cds.68d2bb30 (accessed on 15 August 2025).
  29. MacFerrin, M.; Amante, C.; Carignan, K.; Love, M.; Lim, E. The Earth Topography 2022 (ETOPO 2022) global DEM dataset. Earth Syst. Sci. Data 2025, 17, 1835–1849. [Google Scholar] [CrossRef]
  30. Didan, K. MODIS/Terra Vegetation Indices Monthly L3 Global 1 km SIN Grid V061. 2021. Available online: https://doi.org/10.5067/MODIS/MOD13A3.061 (accessed on 7 August 2025).
  31. Zhang, X.; Zhao, T.; Xu, H.; Liu, W.; Wang, J.; Chen, X.; Liu, L. GLC_FCS30D: The first global 30 m land-cover dynamics monitoring product with a fine classification system for the period from 1985 to 2022 generated using dense-time-series Landsat imagery and the continuous change-detection method. Earth Syst. Sci. Data 2024, 16, 1353–1381. [Google Scholar] [CrossRef]
  32. Abatzoglou, J.T.; Dobrowski, S.Z.; Parks, S.A.; Hegewisch, K.C. TerraClimate, a high-resolution global dataset of monthly climate and climatic water balance from 1958–2015. Sci. Data 2018, 5, 170191. [Google Scholar] [CrossRef]
  33. Gaughan, A.; Stevens, F.; Linard, C.; Jia, P.; Tatem, A. WorldPop global project population data: Estimated residential population per 100 × 100 m grid square. In High Resolution Population Distribution Maps for Southeast Asia in 2010 and 2015; PLOS One: San Francisco, CA, USA, 2013. [Google Scholar]
  34. Chen, Z.; Yu, B.; Yang, C.; Zhou, Y.; Yao, S.; Qian, X.; Wang, C.; Wu, B.; Wu, J. An extended time series (2000–2018) of global NPP-VIIRS-like nighttime light data from a cross-sensor calibration. Earth Syst. Sci. Data 2021, 13, 889–906. [Google Scholar] [CrossRef]
  35. Pekel, J.-F.; Cottam, A.; Gorelick, N.; Belward, A.S. High-resolution mapping of global surface water and its long-term changes. Nature 2016, 540, 418–422. [Google Scholar] [CrossRef] [PubMed]
  36. Chang, J.; Peng, S.; Yin, Y.; Ciais, P.; Havlik, P.; Herrero, M. The Key Role of Production Efficiency Changes in Livestock Methane Emission Mitigation. AGU Adv. 2021, 2, e2021AV000391. [Google Scholar] [CrossRef]
  37. Ma, L.; Zheng, J.; Pen, J.; Xiao, X.; Liu, Y.; Liu, L.; Han, W.; Li, G.; Zhang, J. Monitoring and influencing factors of grassland livestock overload in Xinjiang from 1982 to 2020. Front. Plant Sci. 2024, 15, 1340566. [Google Scholar] [CrossRef]
  38. Bureau, X.E.P. 2006 Xinjiang Environmental Status Bulletin; Xinjiang Environmental Protection Bureau: Urumqi, China, 2007. [Google Scholar]
  39. Xu, B.; Yang, X. Monitoring and evaluation of grass–livestock balance in pastoral and semi-pastoral areas of China. Geogr. Res. 2012, 31, 1998–2006. Available online: https://www.dlyj.ac.cn/EN/10.11821/yj2012110008 (accessed on 7 October 2025). (In Chinese).
  40. Wisser, D.; Cinardi, G. GLW 4: Gridded Livestock Density (Global—2020—10 km); Food and Agriculture Organization of the United Nations: Rome, Italy, 2024; Available online: https://data.apps.fao.org/catalog//iso/9d1e149b-d63f-4213-978b-317a8eb42d02 (accessed on 7 October 2025).
  41. National Development and Reform Commission of China (NDRCC). The People’s Republic of China National Greenhouse Gas Inventory; National Development and Reform Commission of China: Beijing, China, 2014.
  42. Zhang, C.-L.; Zhang, J.; Tuersuntuoheti, M.; Zhou, W.; Han, Z.; Li, X.; Yang, R.; Zhang, L.; Zheng, L.; Liu, S. Landscape genomics reveals adaptive divergence of indigenous sheep in different ecological environments of Xinjiang, China. Sci. Total Environ. 2023, 904, 166698. [Google Scholar] [CrossRef]
  43. FAO. The State of Food and Agriculture 1963; Food and Agriculture Organization of the United Nations: Rome, Italy, 2009; Available online: https://openknowledge.fao.org/items/4c08c251-d3cc-4b29-98d4-4a1b5016f8bf (accessed on 7 October 2025).
  44. Gerber, P.J.; Hristov, A.N.; Henderson, B.; Makkar, H.; Oh, J.; Lee, C.; Meinen, R.; Montes, F.; Ott, T.; Firkins, J.; et al. Technical options for the mitigation of direct methane and nitrous oxide emissions from livestock: A review. Animal 2013, 7, 220–234. [Google Scholar] [CrossRef]
  45. Herrero, M.; Henderson, B.; Havlík, P.; Thornton, P.K.; Conant, R.T.; Smith, P.; Wirsenius, S.; Hristov, A.N.; Gerber, P.; Gill, M.; et al. Greenhouse gas mitigation potentials in the livestock sector. Nat. Clim. Change 2016, 6, 452–461. [Google Scholar] [CrossRef]
  46. Lassen, J.; Difford, G.F. Review: Genetic and genomic selection as a methane mitigation strategy in dairy cattle. Animal 2020, 14, s473–s483. [Google Scholar] [CrossRef]
  47. Silvestre, T.; Martins, L.F.; Cueva, S.F.; Wasson, D.E.; Stepanchenko, N.; Räisänen, S.E.; Sommai, S.; Hile, M.L.; Hristov, A.N. Lactational performance, rumen fermentation, nutrient use efficiency, enteric methane emissions, and manure greenhouse gas-emitting potential in dairy cows fed a blend of essential oils. J. Dairy Sci. 2023, 106, 7661–7674. [Google Scholar] [CrossRef] [PubMed]
  48. Yan, X.; Ying, Y.; Li, K.; Zhang, Q.; Wang, K. A review of mitigation technologies and management strategies for greenhouse gas and air pollutant emissions in livestock production. J. Environ. Manag. 2024, 352, 120028. [Google Scholar] [CrossRef] [PubMed]
  49. Nibedita, S.; Swati, P.; Pattnaik, M.; Mohapatra, S. Methane Emission and Strategies for Mitigation in Livestock. In Environmental and Agricultural Microbiology; Wiley-Scrivener: Hoboken, NJ, USA, 2021; pp. 257–274. [Google Scholar]
  50. Wu, X.; Zhang, Y.; Han, Y.; Zhang, Y.; Zhang, Y.; Cheng, X.; Zhong, P.; Yuan, X.; Zhang, Y.; Li, Z. Advances in methane emissions from agricultural sources: Part I. Accounting and mitigation. J. Environ. Sci. 2024, 140, 279–291. [Google Scholar] [CrossRef]
  51. de Haas, Y.; Veerkamp, R.; De Jong, G.; Aldridge, M. Selective breeding as a mitigation tool for methane emissions from dairy cattle. Animal 2021, 15, 100294. [Google Scholar] [CrossRef] [PubMed]
  52. Beauchemin, K.A.; Ungerfeld, E.M.; Abdalla, A.L.; Alvarez, C.; Arndt, C.; Becquet, P.; Benchaar, C.; Berndt, A.; Mauricio, R.M.; McAllister, T.A.; et al. Invited review: Current enteric methane mitigation options. J. Dairy Sci. 2022, 105, 9297–9326. [Google Scholar] [CrossRef]
  53. Nisbet, E.G.; Manning, M.R.; Lowry, D.; Fisher, R.E.; Lan, X.; Michel, S.E.; France, J.L.; Nisbet, R.E.R.; Bakkaloglu, S.; Leitner, S.M. Practical paths towards quantifying and mitigating agricultural methane emissions. Proc. R. Soc. A Math. Phys. Eng. Sci. 2025, 481, 20240390. [Google Scholar] [CrossRef]
  54. Amon, B.; Çinar, G.; Anderl, M.; Dragoni, F.; Kleinberger-Pierer, M.; Hörtenhuber, S. Inventory reporting of livestock emissions: The impact of the IPCC 1996 and 2006 Guidelines. Environ. Res. Lett. 2021, 16, 075001. [Google Scholar] [CrossRef]
  55. China National Commission of Animal Genetic Resources. Animal Genetic Resources in China: Bovines; China Agriculture Press: Beijing, China, 2012; p. 439. ISBN 978-7-109-15351-6. [Google Scholar]
  56. China National Commission of Animal Genetic Resources. Animal Genetic Resources in China: Horses, Donkeys, Camels; China Agriculture Press: Beijing, China, 2012; p. 391. ISBN 978-7-109-15350-9. [Google Scholar]
  57. China National Commission of Animal Genetic Resources. Animal Genetic Resources in China: Pigs; China Agriculture Press: Beijing, China, 2012; p. 486. ISBN 978-7-109-15882-5. [Google Scholar]
  58. China National Commission of Animal Genetic Resources. Animal Genetic Resources in China: Sheep and Goats; China Agriculture Press: Beijing, China, 2012; p. 451. ISBN 978-7-109-15881-8. [Google Scholar]
  59. Intergovernmental Panel on Climate Change (IPCC). 2006 IPCC Guidelines for National Greenhouse Gas Inventories, Volume 4: Agriculture, Forestry and Other Land Use; IGES: Hayama, Japan, 2006; Available online: https://www.ipcc-nggip.iges.or.jp/public/2006gl/vol4.html (accessed on 7 October 2025).
  60. Peng, S. 1-km monthly mean temperature dataset for china (1901–2023). National Tibetan Plateau/Third Pole Environment Data Center 2019. Available online: https://cstr.cn/18406.11.Meteoro.tpdc.270961 (accessed on 7 October 2025). [CrossRef]
  61. Peng, S. 1-km monthly precipitation dataset for China (1901–2023). National Tibetan Plateau/Third Pole Environment Data Center 2020. Available online: https://doi.org/10.5281/zenodo.3114194 (accessed on 7 October 2025).
  62. Peng, S. 1-km annual arid index dataset for China (1901–2023). National Tibetan Plateau/Third Pole Environment Data Center 2023. Available online: https://cstr.cn/18406.11.Atmos.tpdc.300560 (accessed on 7 October 2025). [CrossRef]
  63. Tang, G. Digital elevation model of China (1KM). National Tibetan Plateau/Third Pole Environment Data Center 2019. Available online: https://www.tpdc.ac.cn/zh-hans/data/12e91073-0181-44bf-8308-c50e5bd9a734/ (accessed on 7 October 2025).
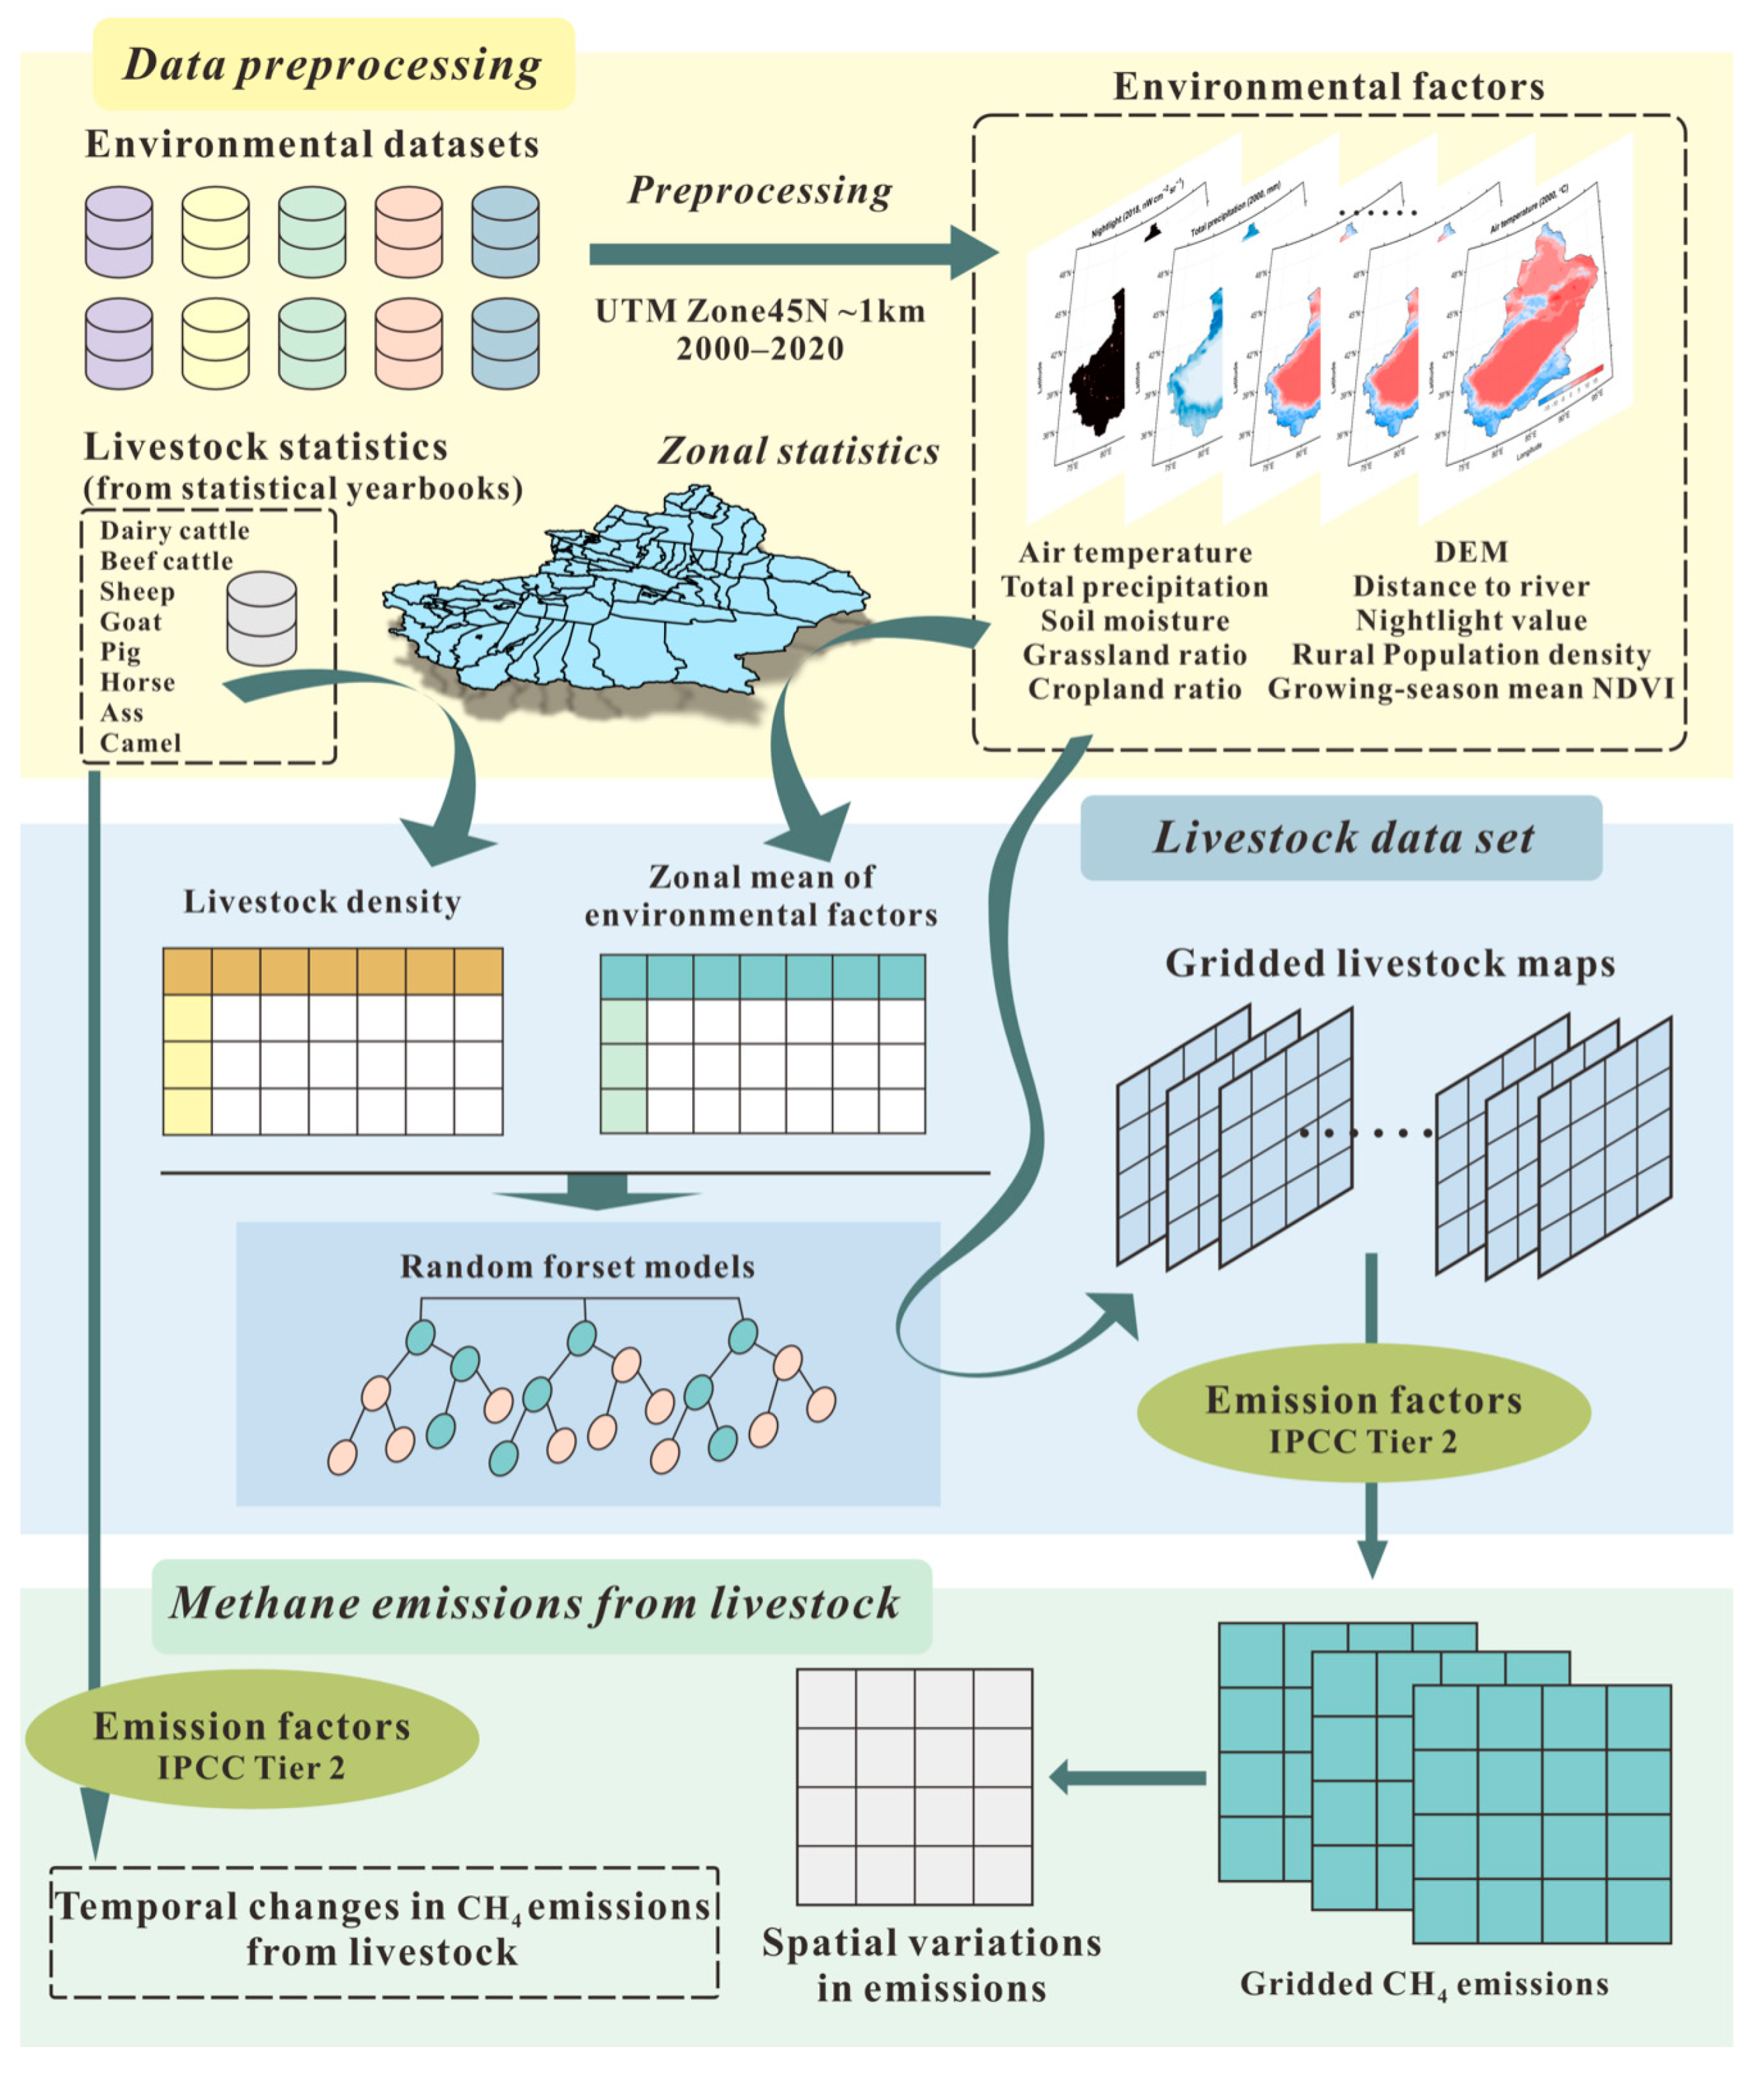
Figure 1. Schematic presentation of mapping livestock density and estimating methane emissions.
Sustainability 17 09021 g001
Figure 2. Overall prediction performance of the model on the test sets for different animals.
Sustainability 17 09021 g002
Figure 3. Spatial distribution of total livestock density in Xinjiang in 2000 and 2020.
Sustainability 17 09021 g003
Figure 4. Changes in CH4 emissions from livestock in Xinjiang from 2000 to 2020.
Sustainability 17 09021 g004
Figure 5. Spatial distribution of livestock CH4 emissions in Xinjiang from 2000 to 2020.
Sustainability 17 09021 g005
Figure 6. Spatial trends in livestock CH4 emissions in Xinjiang between 2000 and 2020.
Sustainability 17 09021 g006
Figure 7. Spatial distribution of CH4 emissions from livestock in 2020.
Sustainability 17 09021 g007
Figure 8. Comparison between this study’s 2020 livestock distribution (a,d), the corresponding results from GLW4 (b,e), and their spatial difference (c,f).
Sustainability 17 09021 g008
Figure 9. Comparison of estimated livestock CH4 emissions in this study with other related datasets [17,41].
Sustainability 17 09021 g009
Table 1. Datasets and environmental variables used in this study.
DatasetVariablesSpatial ResolutionTemporal ResolutionPeriodRef.
ERA5-landMean air temperature0.1°Monthly2000–2020[28]
Total precipitation
ETOPO 2022DEM15″/2022[29]
MOD13A3 v6.1Growing-season mean NDVI1 kmMonthly2000–2020[30]
GLC_FCS30DGrassland ratio30 mYearly2000–2020[31]
Cropland ratio
TERRACLIMATESoil moisture~4 kmYearly2000–2020[32]
WorldPopRural population density100 m/2000–2020[33]
NPP-VIIRS-like NightlightNightlight value~500 mYearly2000–2020[34]
JRC Monthly Water HistoryDistance to river30 mMonthly2000–2020[35]
Table 2. CH4 Emissions by Livestock Species (Tg CH4·year−1).
Beef CattleDairy CattleSheepGoatPigHorseAssCamel
20000.2210.1270.2570.0470.0110.0180.0130.014
20050.2400.2260.3310.0570.0130.0170.0130.013
20100.1890.1900.2370.0340.0140.0140.0080.009
20150.1920.2770.2810.0410.0180.0130.0040.010
20200.3410.1990.2850.0290.0190.0170.0030.016
Disclaimer/Publisher’s Note: The statements, opinions and data contained in all publications are solely those of the individual author(s) and contributor(s) and not of MDPI and/or the editor(s). MDPI and/or the editor(s) disclaim responsibility for any injury to people or property resulting from any ideas, methods, instructions or products referred to in the content.