1. Introduction
More than half a million school buses (SBs) are used to transport public school K-12 students across the United States (US) [
1]. Most of them are powered by diesel engines, which generate significant air pollutants and greenhouse gases that affect students, their families, and local communities [
1,
2]. To overcome these challenges, stakeholders have explored and implemented strategies to transform traditional transportation equipment into electric vehicles [
2]. Electric school buses (ESBs) not only eliminate emissions but also present significant synergistic opportunities through Vehicle-to-Grid (V2G) systems. These projects may be able to provide significant financial benefits to educational institutions through self-consumption or electricity supply to local communities [
3,
4,
5,
6]. Considering that ESBs are idle during significant periods, the potential to use their very large capacity batteries to store sustainable energy and release it in times of high demand has been studied with great interest [
7]. Furthermore, since this equipment is not used during winter and summer holidays, it creates opportunities to supply sustainable electricity to local communities during long periods of potential high consumption [
6,
8].
Most public schools across the US operate within very tight budget limitations [
9,
10]. The introduction of ESB V2G systems has significant potential to provide additional revenue by selling electricity to local communities, reduce energy costs through microgrid self-consumption projects, and offset the total cost of ownership of ESBs [
11]. According to the US Department of Energy, buildings consume 40% of all total energy and 75% of all electricity in the US [
12]. The Environmental Protection Agency reports that industrial and commercial buildings emit around 50% of CO
2 in the US, while commercial buildings consume about 35% of all electricity [
13,
14]. Educational use is the third largest commercial building utilization in terms of total floorspace, after warehouse and office uses. Educational activities use 13,623 million square feet across the US, representing 14% of all area in the commercial building sector. Furthermore, education is the second largest consumer of energy, employing almost 11% of all electricity and 14% of natural gas in the commercial building category [
15]. This showcases the significant benefits that ESB V2G systems could provide for educational institutions.
The cost of energy for K-12 school districts across the US amounts to
$8 billion [
16] and is the second-highest operational cost behind personnel expenditures [
17]. Electricity use and associated costs are expected to significantly rise in the near future [
18]. Factors affecting this increase include inflation, aging, less efficient infrastructure, and the introduction of energy-intensive devices in educational settings. In regard to inefficient facilities, renovation projects to create more energy-efficient facilities are being undertaken by many school districts. The development of ESB V2G would fit very nicely with these improvement plans [
9,
19,
20]. The relevance of these projects is accentuated when considering that electricity usage is expected to grow dramatically due to the introduction and expansion of the use of electronic equipment in the classroom. Devices such as projectors, electronic boards and screens, computer equipment, tablets, communication devices, and Artificial Intelligence, among others, will growth the electricity consumption in K-12 schools [
21,
22].
The incremental use of renewable energy, particularly in situ solar energy, is a very important solution to increase the generation of electricity that is required to power novel technologies while simultaneously reducing costs [
23,
24]. Additionally, renewable energy increases the sustainability of these institutions, reducing their overall carbon footprint [
25]. Many school districts have increased their participation in renewable energy infrastructure, installing solar panels to capture valuable energy for internal use [
26,
27]. However, the intermittency of this resource, caused by the weather and the time of day, creates potential asynchronicity between peak generation and demand times. To overcome this issue, batteries may be installed alongside the solar panels [
28,
29]. However, the increased project cost from the inclusion of storage capacity creates additional obstacles for financing and repaying the new infrastructure. Using ESBs’ massive batteries to store electricity generated by solar panels to sustainably supply the grid is an alternative [
8,
30]. Although at this time the initial investment for ESBs is higher than traditional diesel school buses, the lower fuel and operational costs offset this initial higher investment, generating a much lower lifetime cost for the equipment [
3,
31,
32].
A framework to ascertain the financial viability of these projects is required by stakeholders to ensure a solid return on the investments for the proposed ESB V2G systems. Previous studies have focused on the technical feasibility of harvesting solar energy in diverse K-12 institutions in the US [
6] or on the avoidance of emissions from traditional electricity generation when V2G is considered [
30]. However, there is no comprehensive analytics and geospatial-grounded economic and financial framework that aids stakeholders in ascertaining potential financial results from these systems. This causes the financial implications of these investments to remain insufficiently quantified. The great variability in local rate structures, electricity markets, and school consumption patterns creates significant uncertainties in assessing potential financial benefits. Diverse solar potential across the wide territory and variable inventory of school buses for each location create unique situations that require detailed assessment to evaluate their financial viability. This study aims to close this research gap with the development of a data-driven assessment framework to ascertain the locations, specific projects, and time frames to maximize financial benefits. This study evaluates all K-12 schools across the contiguous US, overlaying them with the potential solar radiation across seasons and months, to evaluate potential energy harvesting and storage. The price of electricity is analyzed for each region to determine potential ranges for income received by individual schools and optimize potential times and seasons on which the ESB V2G system would maximize income and potential revenue. The proposed framework will aid school districts, students, their families, and communities across the US in assessing and evaluating the potential benefits that they could receive from the proposed scheme.
2. Materials and Methods
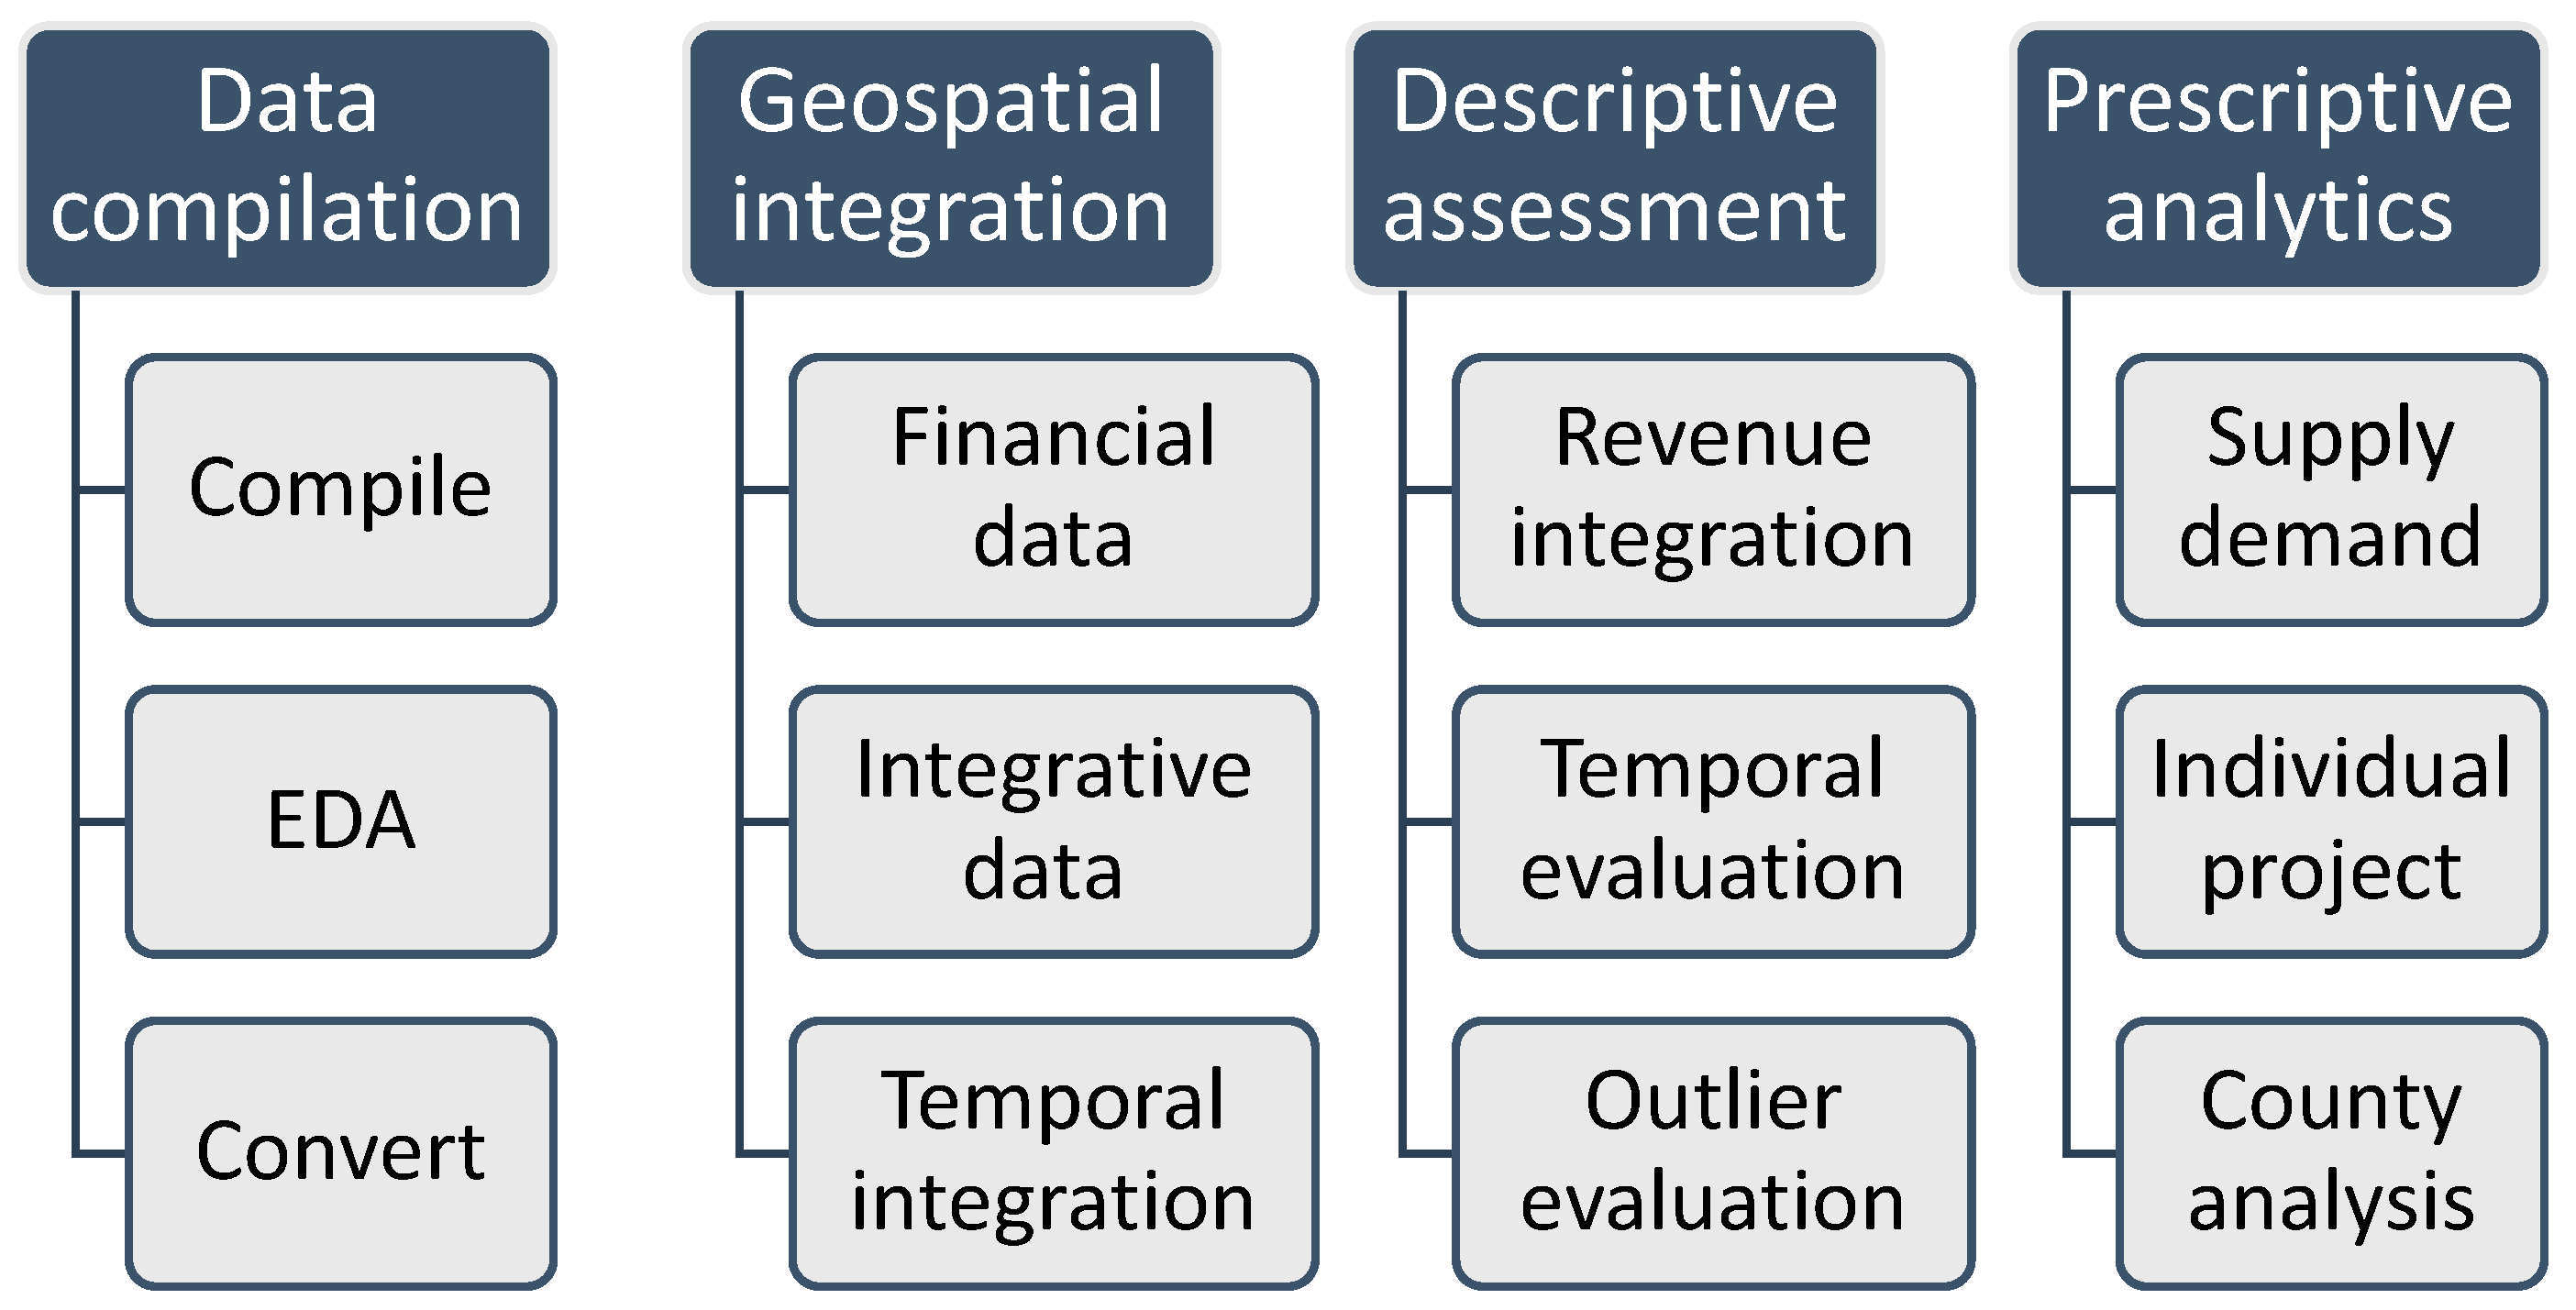
This study, illustrated in
Figure 1, develops a financial framework that applies data analytics, business intelligence, and Geographic Information Systems (GIS) to integrate, assess, and characterize publicly available data from diverse sources. Publicly available data from the US Federal, State, and Local government, National Laboratories, state agencies, and research institutions were applied in this study. Through the proposed framework, this study was able to assess and characterize potential financial benefits from potential ESB V2G systems in schools across the US
The financial framework developed in this study initiated with the selection and compilation of required data sources, as reflected by the activities indicated in the first row of the previous flow chart. Data was obtained from the National Center for Educational Statistics [
33], the Energy Information Administration [
34,
35], the National Renewable Energy Laboratory [
36], and the Department of Energy [
12,
14]. Data from the Environmental Protection Agency [
13,
17], Energy Star [
16], and other databases that will be described in the diverse sections of the study, were applied. All these databases have diverse formats, structures, data fields, content, and key variables. Applying diverse geospatial data analytics tools, including Matlab R2024b and QGIS 3.24.3, the databases were explored, compiled, cleaned, aligned, and integrated into a cohesive body of data that can be applied for the proposed study. Exploratory Data Analysis (EDA) was performed to integrate the required data system. Spatial joints, as well as relational databases applying diverse identifying field variables, were incorporated to convert the body of data into a connected system capable of providing the results required by this study.
Afterwards, all the data sources that do not possess geospatial integration in their original format were integrated into parameters that are a good fit for the proposed framework, as indicated in the second activity of
Figure 1. Attribute joints were performed among diverse databases to create relational models that expand the reach and capabilities of more limited data. Exploration and assessment of adequate joint attributes standardized and aligned them to create a good fit between the two systems being integrated. Geospatial joints were additionally applied through diverse resolution systems, integrating data that could create a good fit to maximize potential analysis. In this fashion, data was integrated with geography and temporal parameters, allowing for the proposed financial framework to be developed.
The descriptive assessment of the proposed framework, indicated in the third activity of
Figure 1, causes the developed integrated database to coalesce into generating useful financial analysis. The Real-time Locational Marginal Pricing (LMP) provided by the US Regional Transmission Organizations (RTOs) [
34,
35] was combined with the more than half a million school buses in the contiguous US, segmented by their corresponding schools. The number of ESBs is evaluated from current school buses, their distribution across the US, the number of students per school, and the proportion of students who are transported by them. A battery size of 250 kWh [
37] was considered for this study, as a common size that allows equipment to be charged and recharged during the day. Although higher storage capacity may be available, up to 660 kWh [
37,
38] for buses with long routes, this study uses a more conservative capacity that can be generalized to most schools in the US. Schools with shorter routes may choose smaller battery packs, ranging from 50 to 250 kWh, while institutions with longer routes would select larger battery packs, starting at 250 kWh, which can reach up to 660 kWh [
37,
38]. Since 250 kWh is the intersection between the two battery types, it was considered as an option that may encompass the whole range of available equipment. Smaller battery packs may have several charging cycles per day, while the larger storage capacity, depending on the charging infrastructure, may only have one cycle per day [
37,
38]. Considering only one charging cycle per day will allow this proposed framework to be applicable to a broader range of institutions, without regard to the existing charging infrastructure. The methodology may be expanded, in a plug-in fashion, to consider other battery sizes and additional daily charging cycles. This would provide stakeholders with the opportunity to perform more granular analysis for particular locations or institutions.
Finally, the framework segments and qualifies results to highlight relevant parameters and factors that should be considered by stakeholders for projects and location selection priority. Exploring how temporal or geographical variability may facilitate revenue maximization and community benefit assessment is an important parameter in the process. For instance, the framework aims to identify the optimal hours per season for energy supply. Selected locations may receive priority for development, considering global community benefits, larger electricity requirements, or revenue potential maximization.
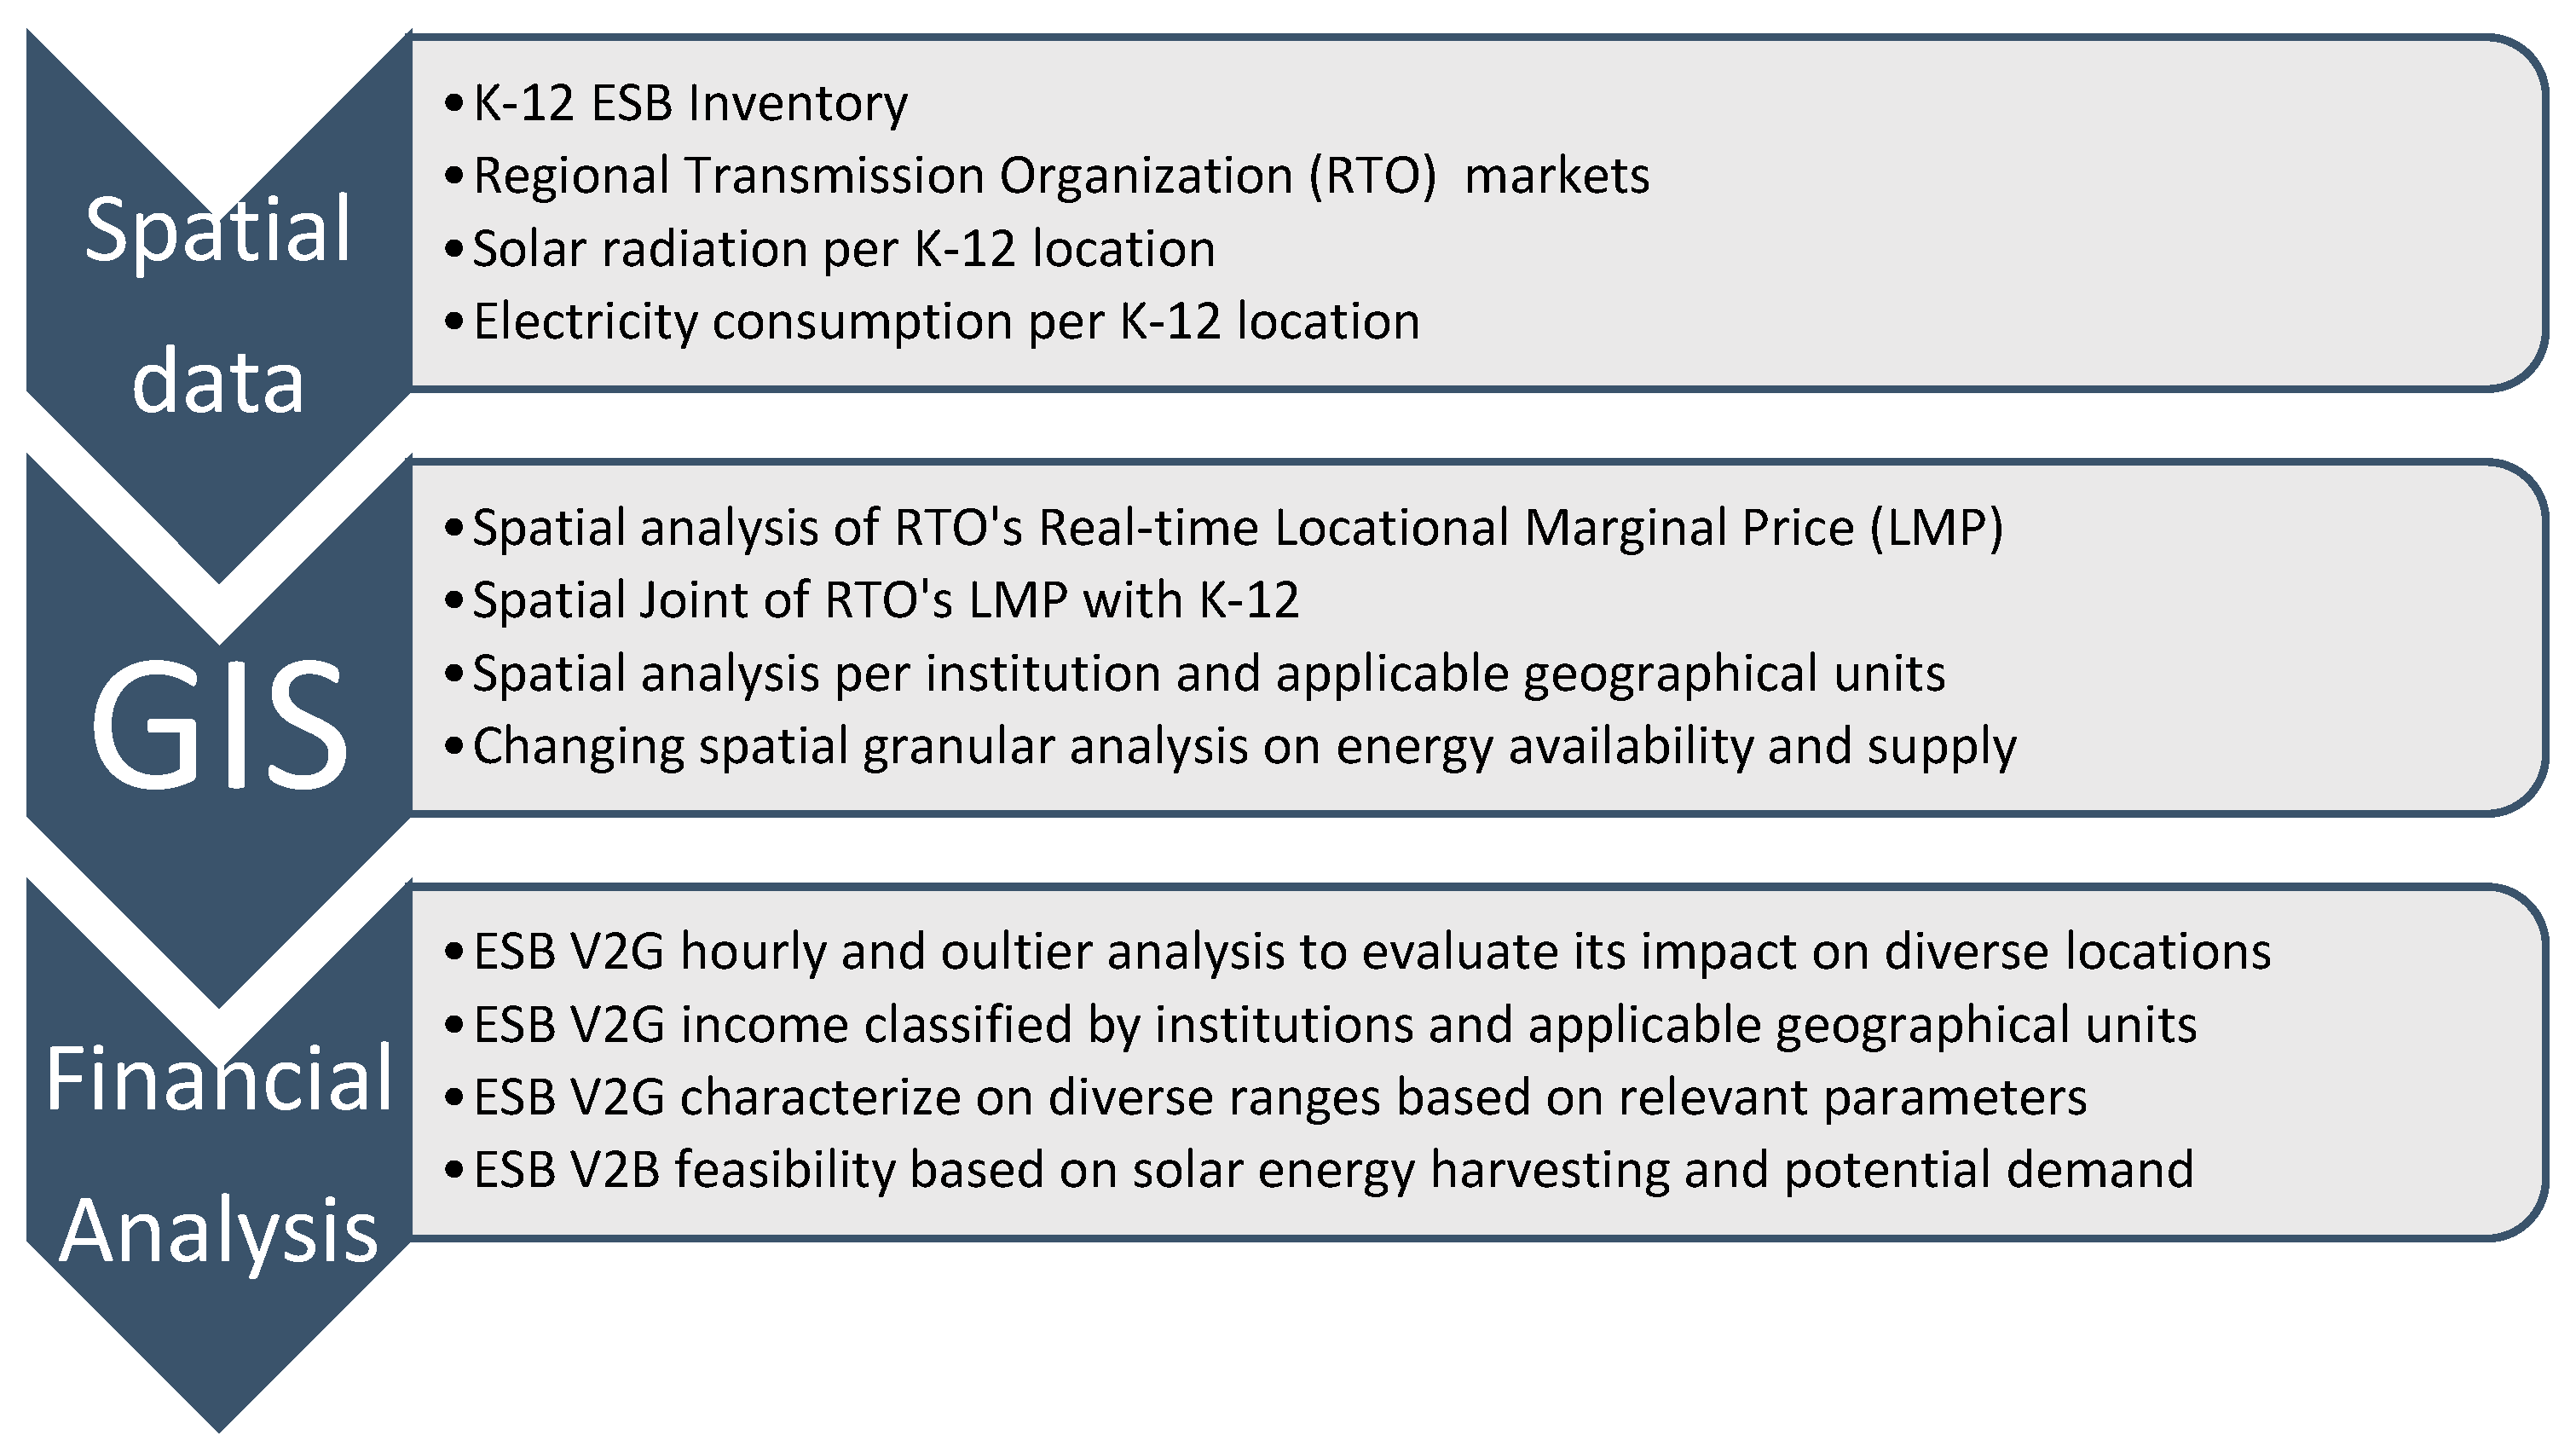
Operationalizing the previously described framework involves the integration of spatiotemporal data into Geographic Information Systems (GIS) and data analytics processes, as presented in
Figure 2. Data from public K-12 institutions in the US, provided by the National Center for Educational Statistics [
33], were integrated in the process. From student enrollment and the proportion of students using school transportation, the number of school buses was determined by the institution. Real-time Locational Marginal Pricing (LMP) provided by the US Regional Transmission Organizations (RTOs) [
34,
35] was integrated into the system to ascertain potential revenue for each school, based on the number of ESBs and battery capacity. Spatiotemporal data for solar energy potential provided and electricity consumption data provided by the National Renewable Energy Laboratory [
36], the Department of Energy [
12,
14], the Environmental Protection Agency [
13,
17], and Energy Star [
16] were additionally incorporated in the system. In the second stage, shown in
Figure 2, the data integrated in the first stage is overlaid to create spatial joints in GIS operations. These spatial joints allow us to ascertain the energy storage capacity for each school, the potential prices that may be obtained, the solar potential, and the demand of each school, community, county, and diverse spatial granular characterizations. The Financial Analysis section applies the integrated spatiotemporal data, which has been overlaid with diverse features in the GIS section. Open source QGIS software was applied to perform geospatial analysis, including integration of layers, spatial joins, and statistical analysis, and exported to be further explored in data analytics systems such as MATLAB and Excel. The potential revenue was calculated by applying the existing energy storage capacity and the price of hourly energy, as reported by RTOs. Evaluating the impact of outliers in all segments was found to create significant impacts in the potential ESB V2G revenue streams. Diverse ESB V2G financial models were developed by characterizing potential income under diverse geographical feature parameters.
The main objective of the results and discussion presented in the manuscript is to showcase the feasibility of implementing the proposed framework. This framework integrates relevant parameters that impact the revenue streams that K-12 institutions could receive from ESB VG systems. The results and discussion currently focus on a national overview for these potential revenues, with the acknowledgment that the framework has the capability of creating much more granular analysis, to the level of individual schools, communities, and counties. Due to the particular aims and scope of this manuscript, the analysis focuses on relevant parameters impacting ESB V2G financial revenue to generate a national panoramic. This will allow stakeholders to have a comprehensive view of the applicability of the proposed system. A significant number of operating environments for each educational institution and communities are already incorporated in the system, and additional parameters and data can be integrated into the framework in a plug-in fashion, without significant modifications to the operational flow. Furthermore, this manuscript focuses on the financial benefits that can be ascertained from the proposed framework. The integration of infrastructure costs, energy losses, battery cycling, and potential degradation will be integrated into future analysis and research for these projects. Therefore, future research will focus on expanding the financial scope of the manuscript and zooming in on predetermined institutions, locations, or communities, showcasing to stakeholders the benefits that the proposed ESB V2G projects can bring to each location.
3. Results
Public education in the United States represents a significant proportion of the Federal, State, and Local budgets. Public elementary and secondary education expenditures exceeded
$818 billion for the Fiscal Year (FY) 2023, with 59% corresponding to instruction expenses and 37% to total support services [
39]. Student transportation accounts for more than
$33 billion yearly. Any savings or cost offsets for this transportation expenditure could be applied to provide schools with significant additional resources to support students.
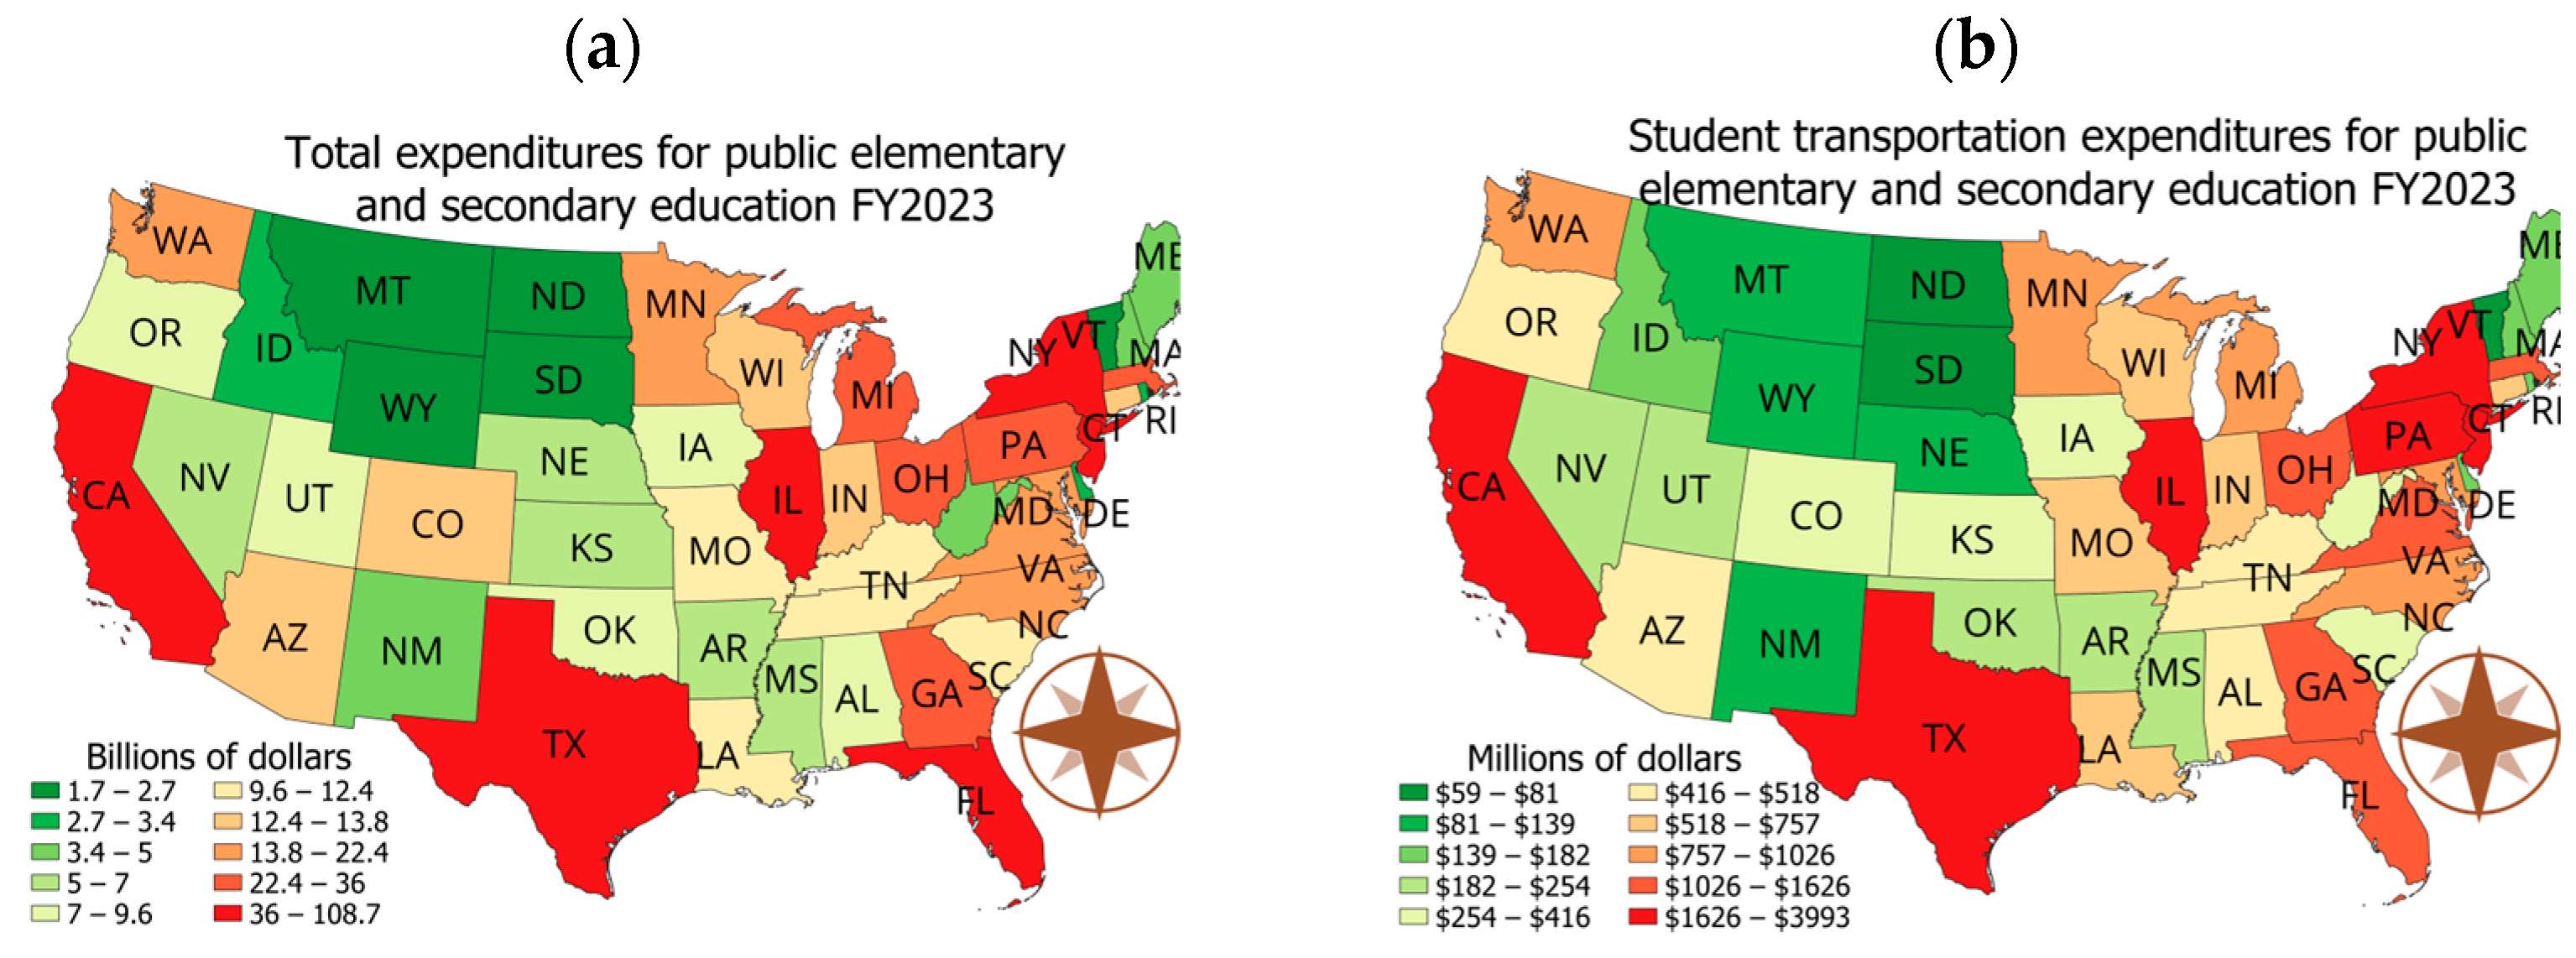
Figure 3 provides an outlook for the educational expenditures per state [
39]. The significant variation per state reflects the number of students in each location and the diversity of the cost per student per state. For instance, California is home to more than 5.8 million K-12 students, with a total per student cost of
$18,568, leading to more than
$108 billion total education cost. Texas, with a similar 5.5 million K-12 students, has a total per student cost of
$12,382, resulting in a total state education cost of
$68.3 billion. On the student transportation expenditures, there is also significant variability in per-student expenses. Many eastern seaborne states, such as New York and New Jersey, spend more than
$1000 per student, while states such as California, Texas, and Oklahoma spend less than
$400 per student. This significant variability can be best explored and assessed by applying geospatial analysis, as proposed in this study.
Although the US has more than half a million school buses to serve almost 50 million students, the variability per location is very significant [
39,
40,
41,
42,
43]. For instance, three states have almost 25% of the school buses inventory in the nation, while 20 states only have 10%. To better assess and analyze the equipment inventory and its usage,
Figure 4 provides the volume of school buses per state and the proportion of students, per state, who are transported using this equipment. Both parameters are critical to analyze the financial benefits that this study will provide. Some states, with a large number of students, such as California and Texas, have a low proportion of transported students, 19% and 31%, respectively. On the other hand, some states with a lower number of students, such as Mississippi and Minnesota, have a much higher proportion of transported students, 93% and 94%, respectively.
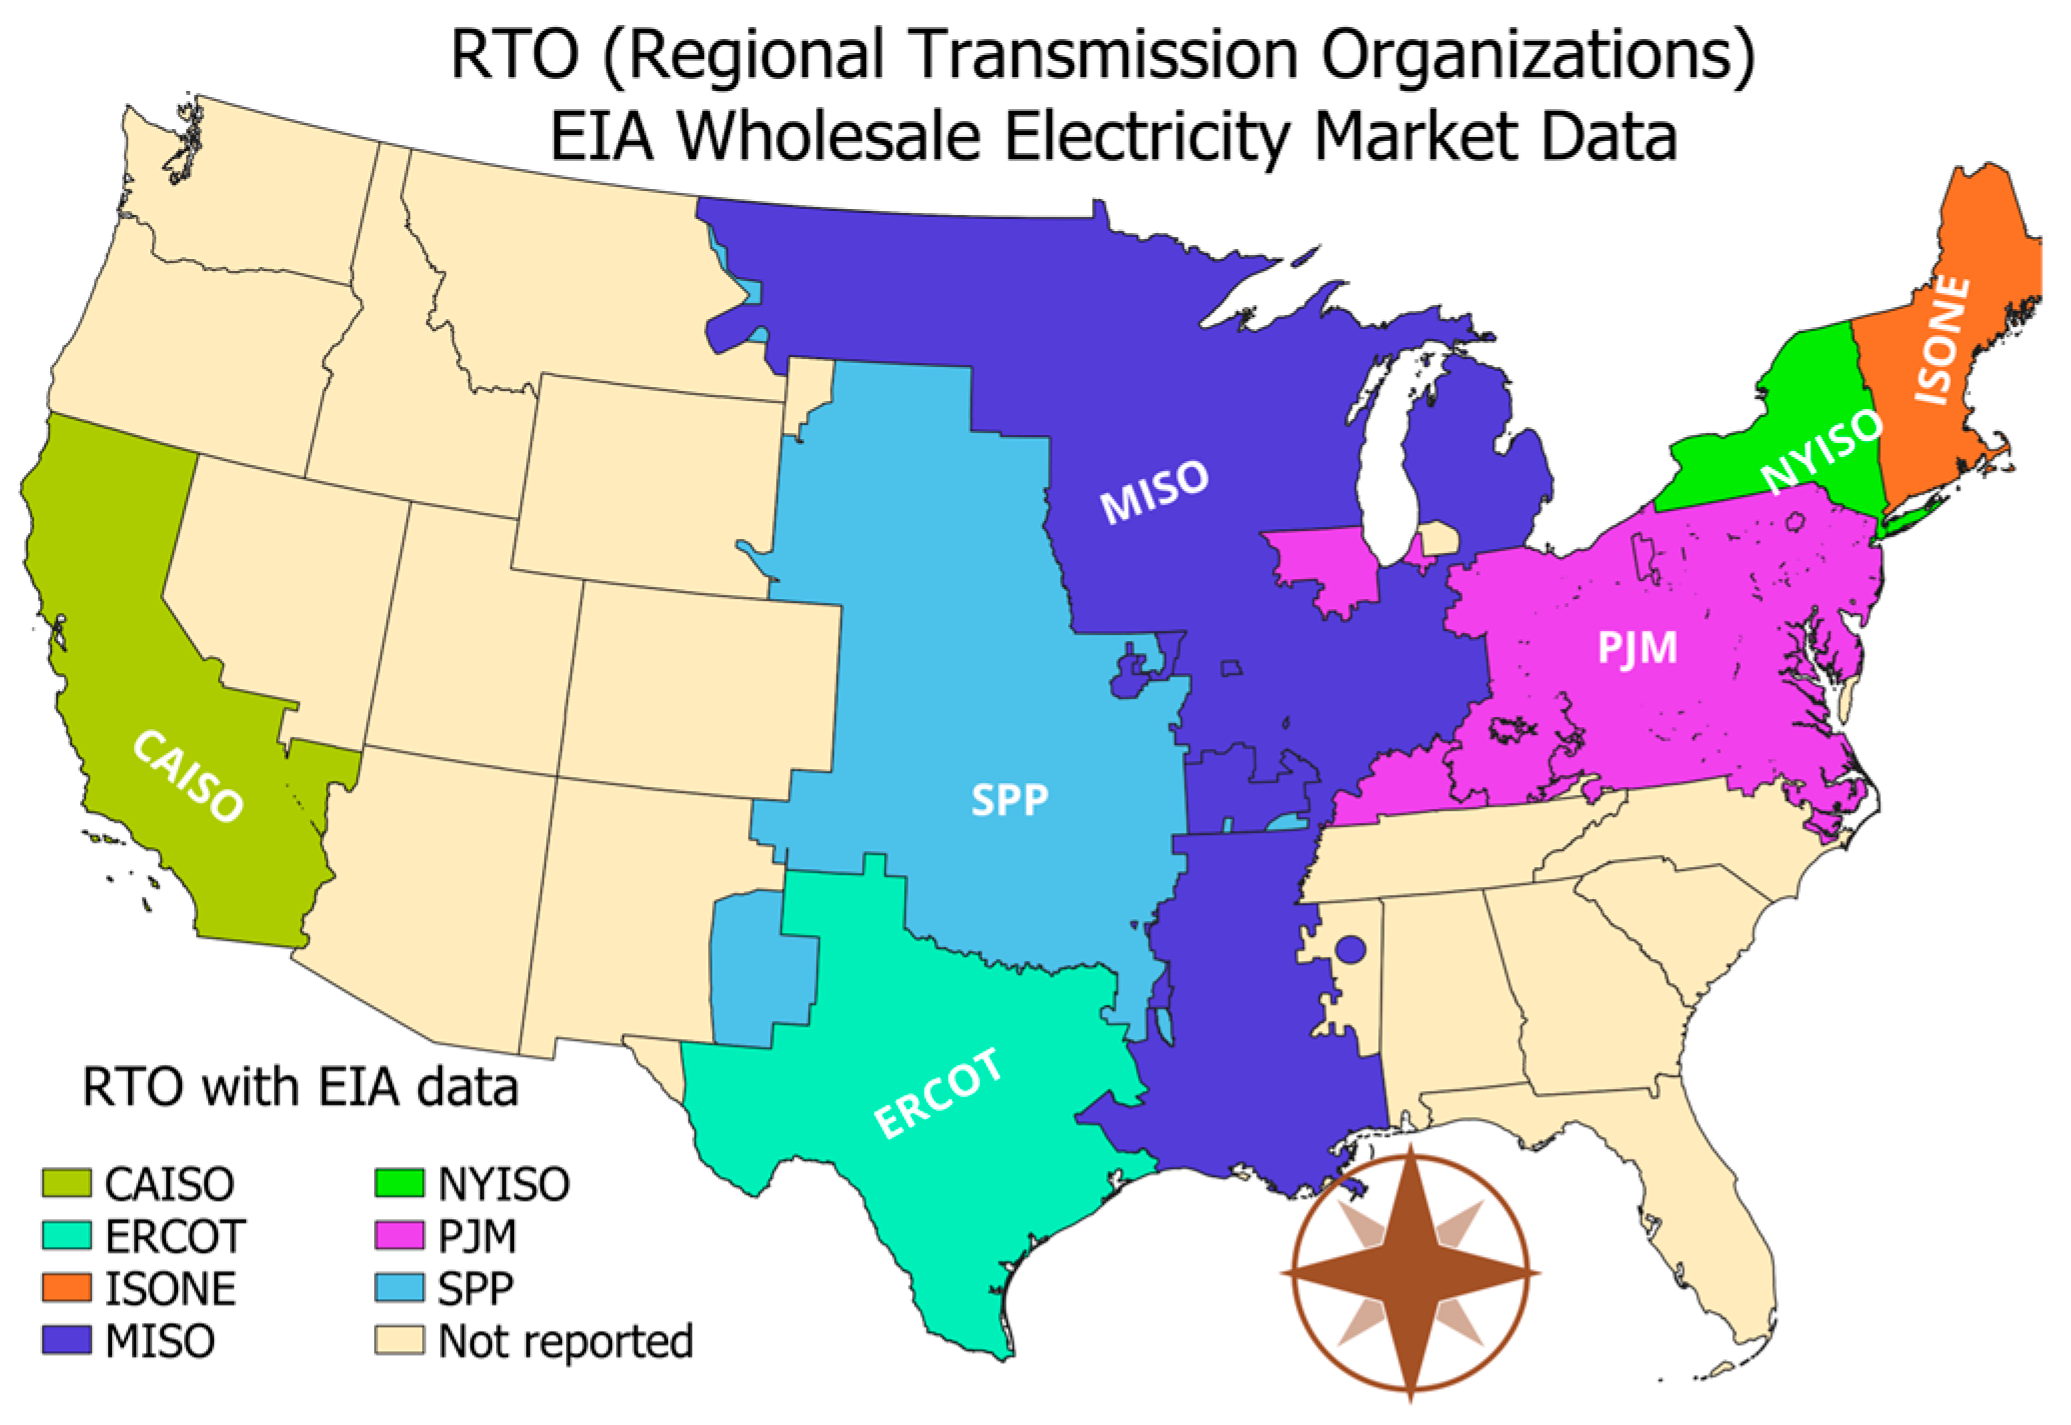
To evaluate the financial benefits that schools across the US may obtain from selling the electricity stored in the batteries of their ESBs, it is important to ascertain the price that they may obtain. In the US, electricity generators, in this case, the schools, sell power to utilities through wholesale electricity markets. These large-scale buyers supply, in turn, to individual consumers. Wholesale electricity markets are managed by Regional Transmission Organizations (RTOs), which are non-profit, independent, and membership-based organizations that optimize and provide reliable electricity supply in their areas. There are seven RTOs in the US managing the areas indicated in
Figure 5 [
34]. The trading platforms managed by these organizations in their wholesale electricity market provide price discoveries to generate efficiency, transparency, and a reliable energy supply to the consumers. Therefore, related data, such as demand, prices, and generation, are publicly available through different platforms, including the EIA.
To ensure the efficient supply of electricity across the contiguous US, Regional Transmission Organizations (RTOs) provide information on Real-time Locational Marginal Pricing (LMP). These prices consider the cost of electricity generation, transmission, congestion, and losses. The prices have significant variation across all the RTOs considering their demand-supply patterns, design of the market, topology of the grid, and fuel mix generation. Therefore, to calculate the revenue that each school may generate from this scheme, the hourly LMP of their local RTOs needs to be considered.
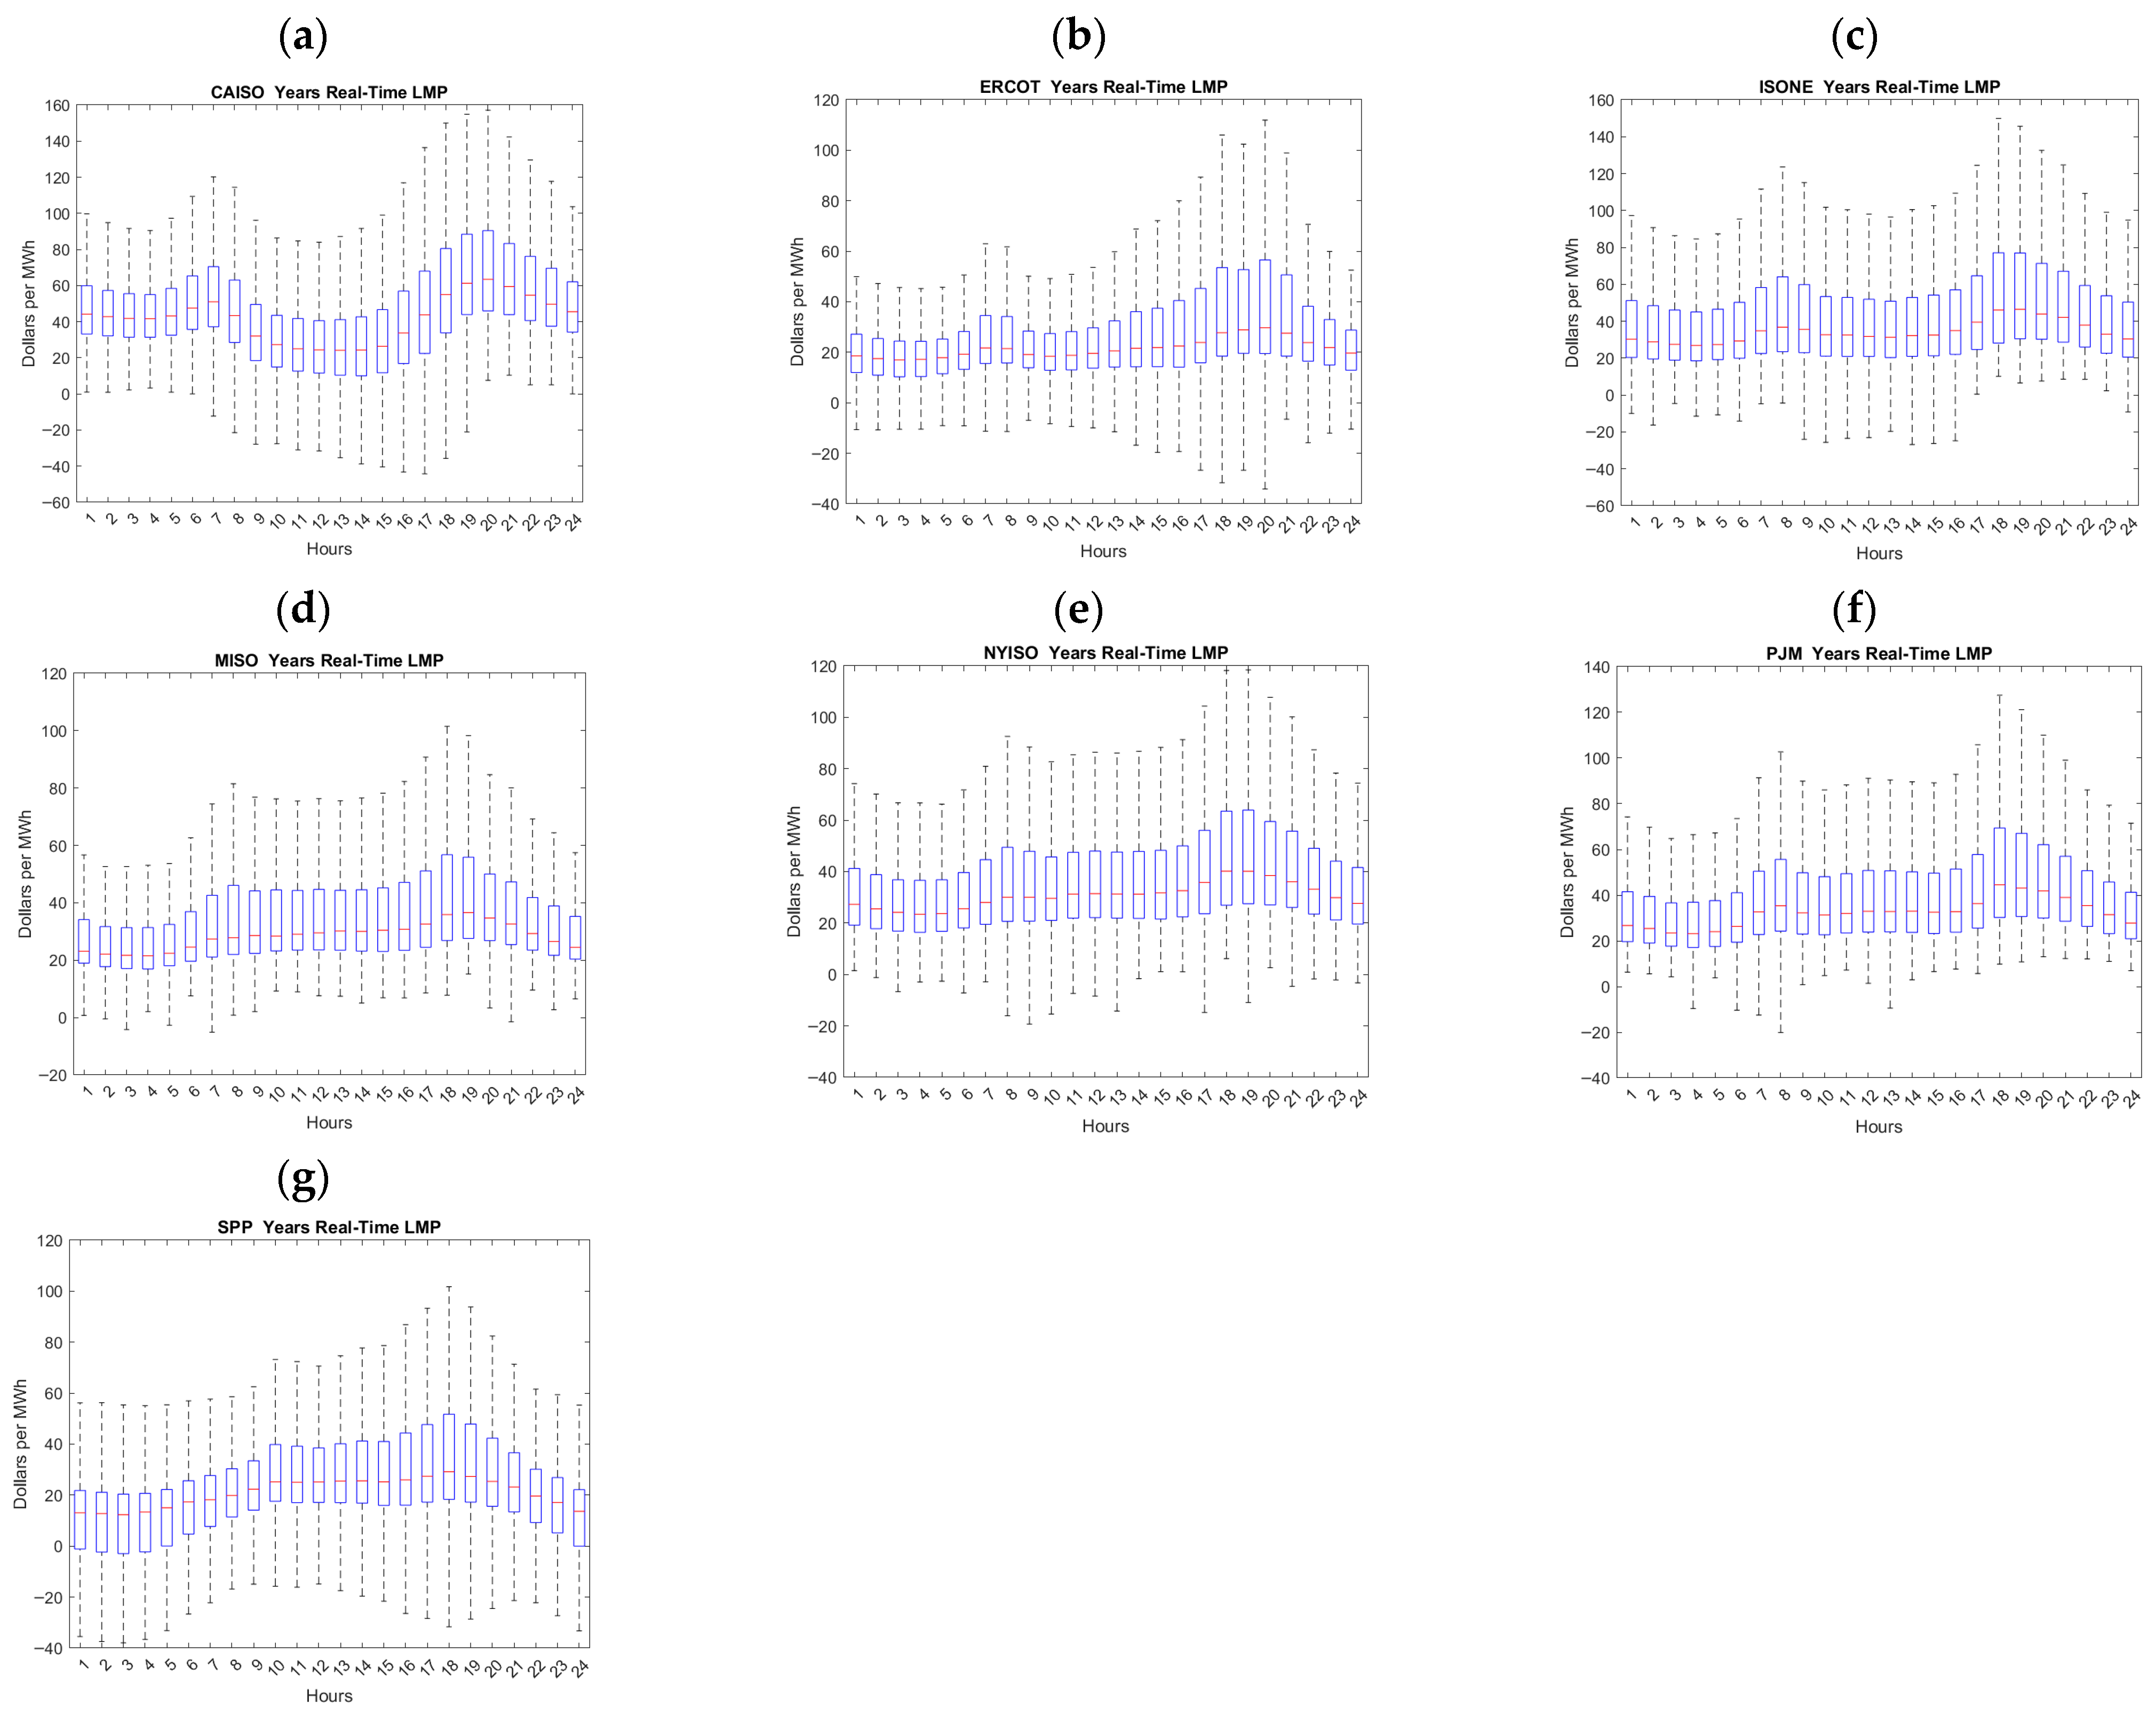
Figure 6 provides a box plot and whiskers showcasing average hourly prices of electricity from January 2020 to May 2025, provided by the US Energy Information Administration RTOs LMP [
35]. This figure reflects the dynamic landscape of wholesale electricity prices across the US, shaped by shifts in generation mix, demand, and supply. This assessment provides stakeholders with parameters to evaluate the optimal times to release electricity from the grid to maximize financial benefits. For instance, CAISO and ISONE reached the highest prices of all RTOs in the afternoon’s high consumption periods, with the fourth quartile ranging from
$85 and as high as
$160 in some time periods. However, CAISO shows the highest median variability of all sections, with many first-quartile values reflecting negative prices. On the other hand, MISO, NYSO, and PJM showcase a more uniform price behavior during the day, with a significant increment in the afternoon hours between 16 and 19 h, with a low frequency of negative prices. SPP wholesale prices have significant variability in the first quartile, with some unique behaviors among RTOs, with significant negative prices during the night and high consumption energy in afternoon periods. This analysis is extremely useful to stakeholders to decide the best time to supply the grid with the energy from ESBs, to maximize each institution’s financial benefits.
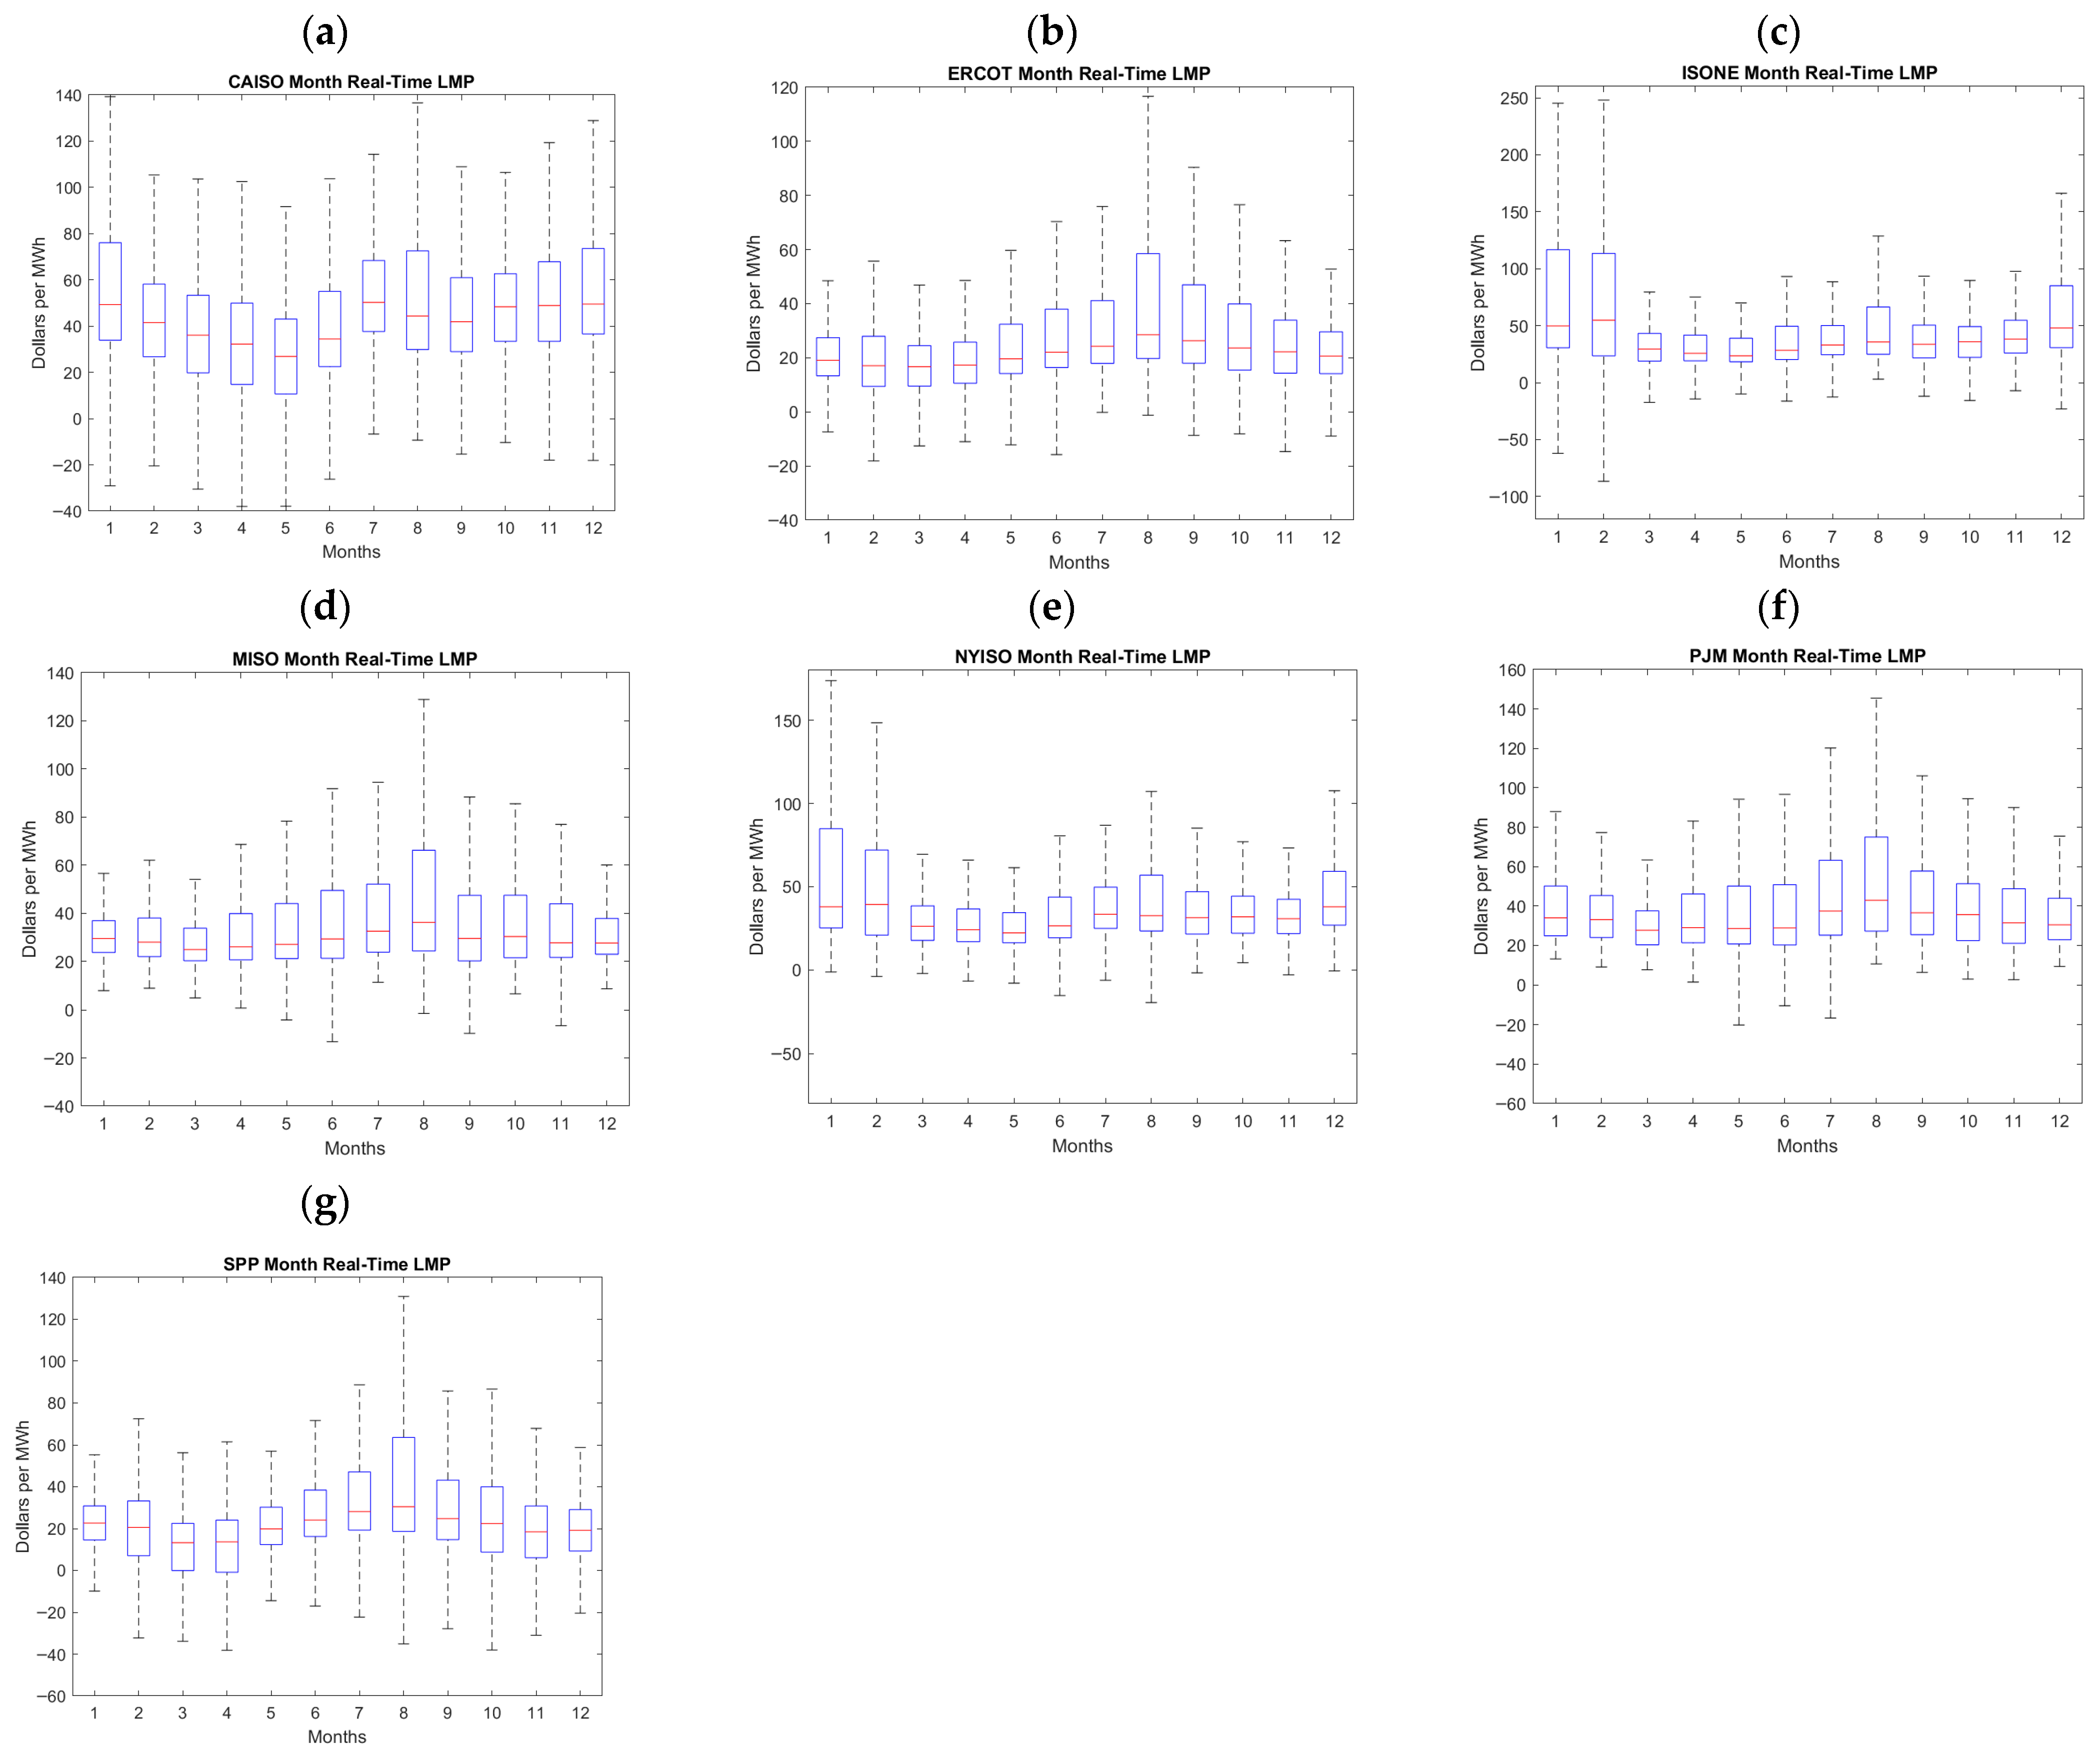
Seasonal behavior of Real-time Locational Marginal Price (LMP) for hourly wholesale electricity across the seven RTOs in the contiguous US is presented in
Figure 7. The box plot and whiskers analysis indicate the electricity price for each month. ISONE, in the northeastern seaborne of the US, presents the highest variability of the whole series during the winter, with the fourth quartile reaching up to
$250 and the first quartile with very significant negative prices. CAISO, ISONE, and NYISO also have significant variability during the winter, reaching their highest yearly prices, with some significant negative prices in this period. For these regions, the school winter break may represent a good opportunity to maximize the sale of EBS stored energy to the grid. However, it is important to consider that during this period, solar radiation is decreased, providing lower harvest from solar panels. Summer periods provide higher prices and variability for other RTOs, creating great potential to maximize the use of stored energy in ESBs, potentially two or three cycles per day. Summers have the potential to increase price variability, with the first quartile containing significant negative prices. Planning and price grid monitoring will be very important for each institution to select the best times to release power and maximize financial benefits. ERCOT, MISO, and PJM have the highest prices and variability during the summer. However, some other regions present hybrid behaviors in electricity prices. CAISO, NYISO, and PJM indicate higher variability and better prices, both during the summer and to some extent in the winter. This analysis will be relevant to stakeholders to optimally manage the V2G systems in their facilities.
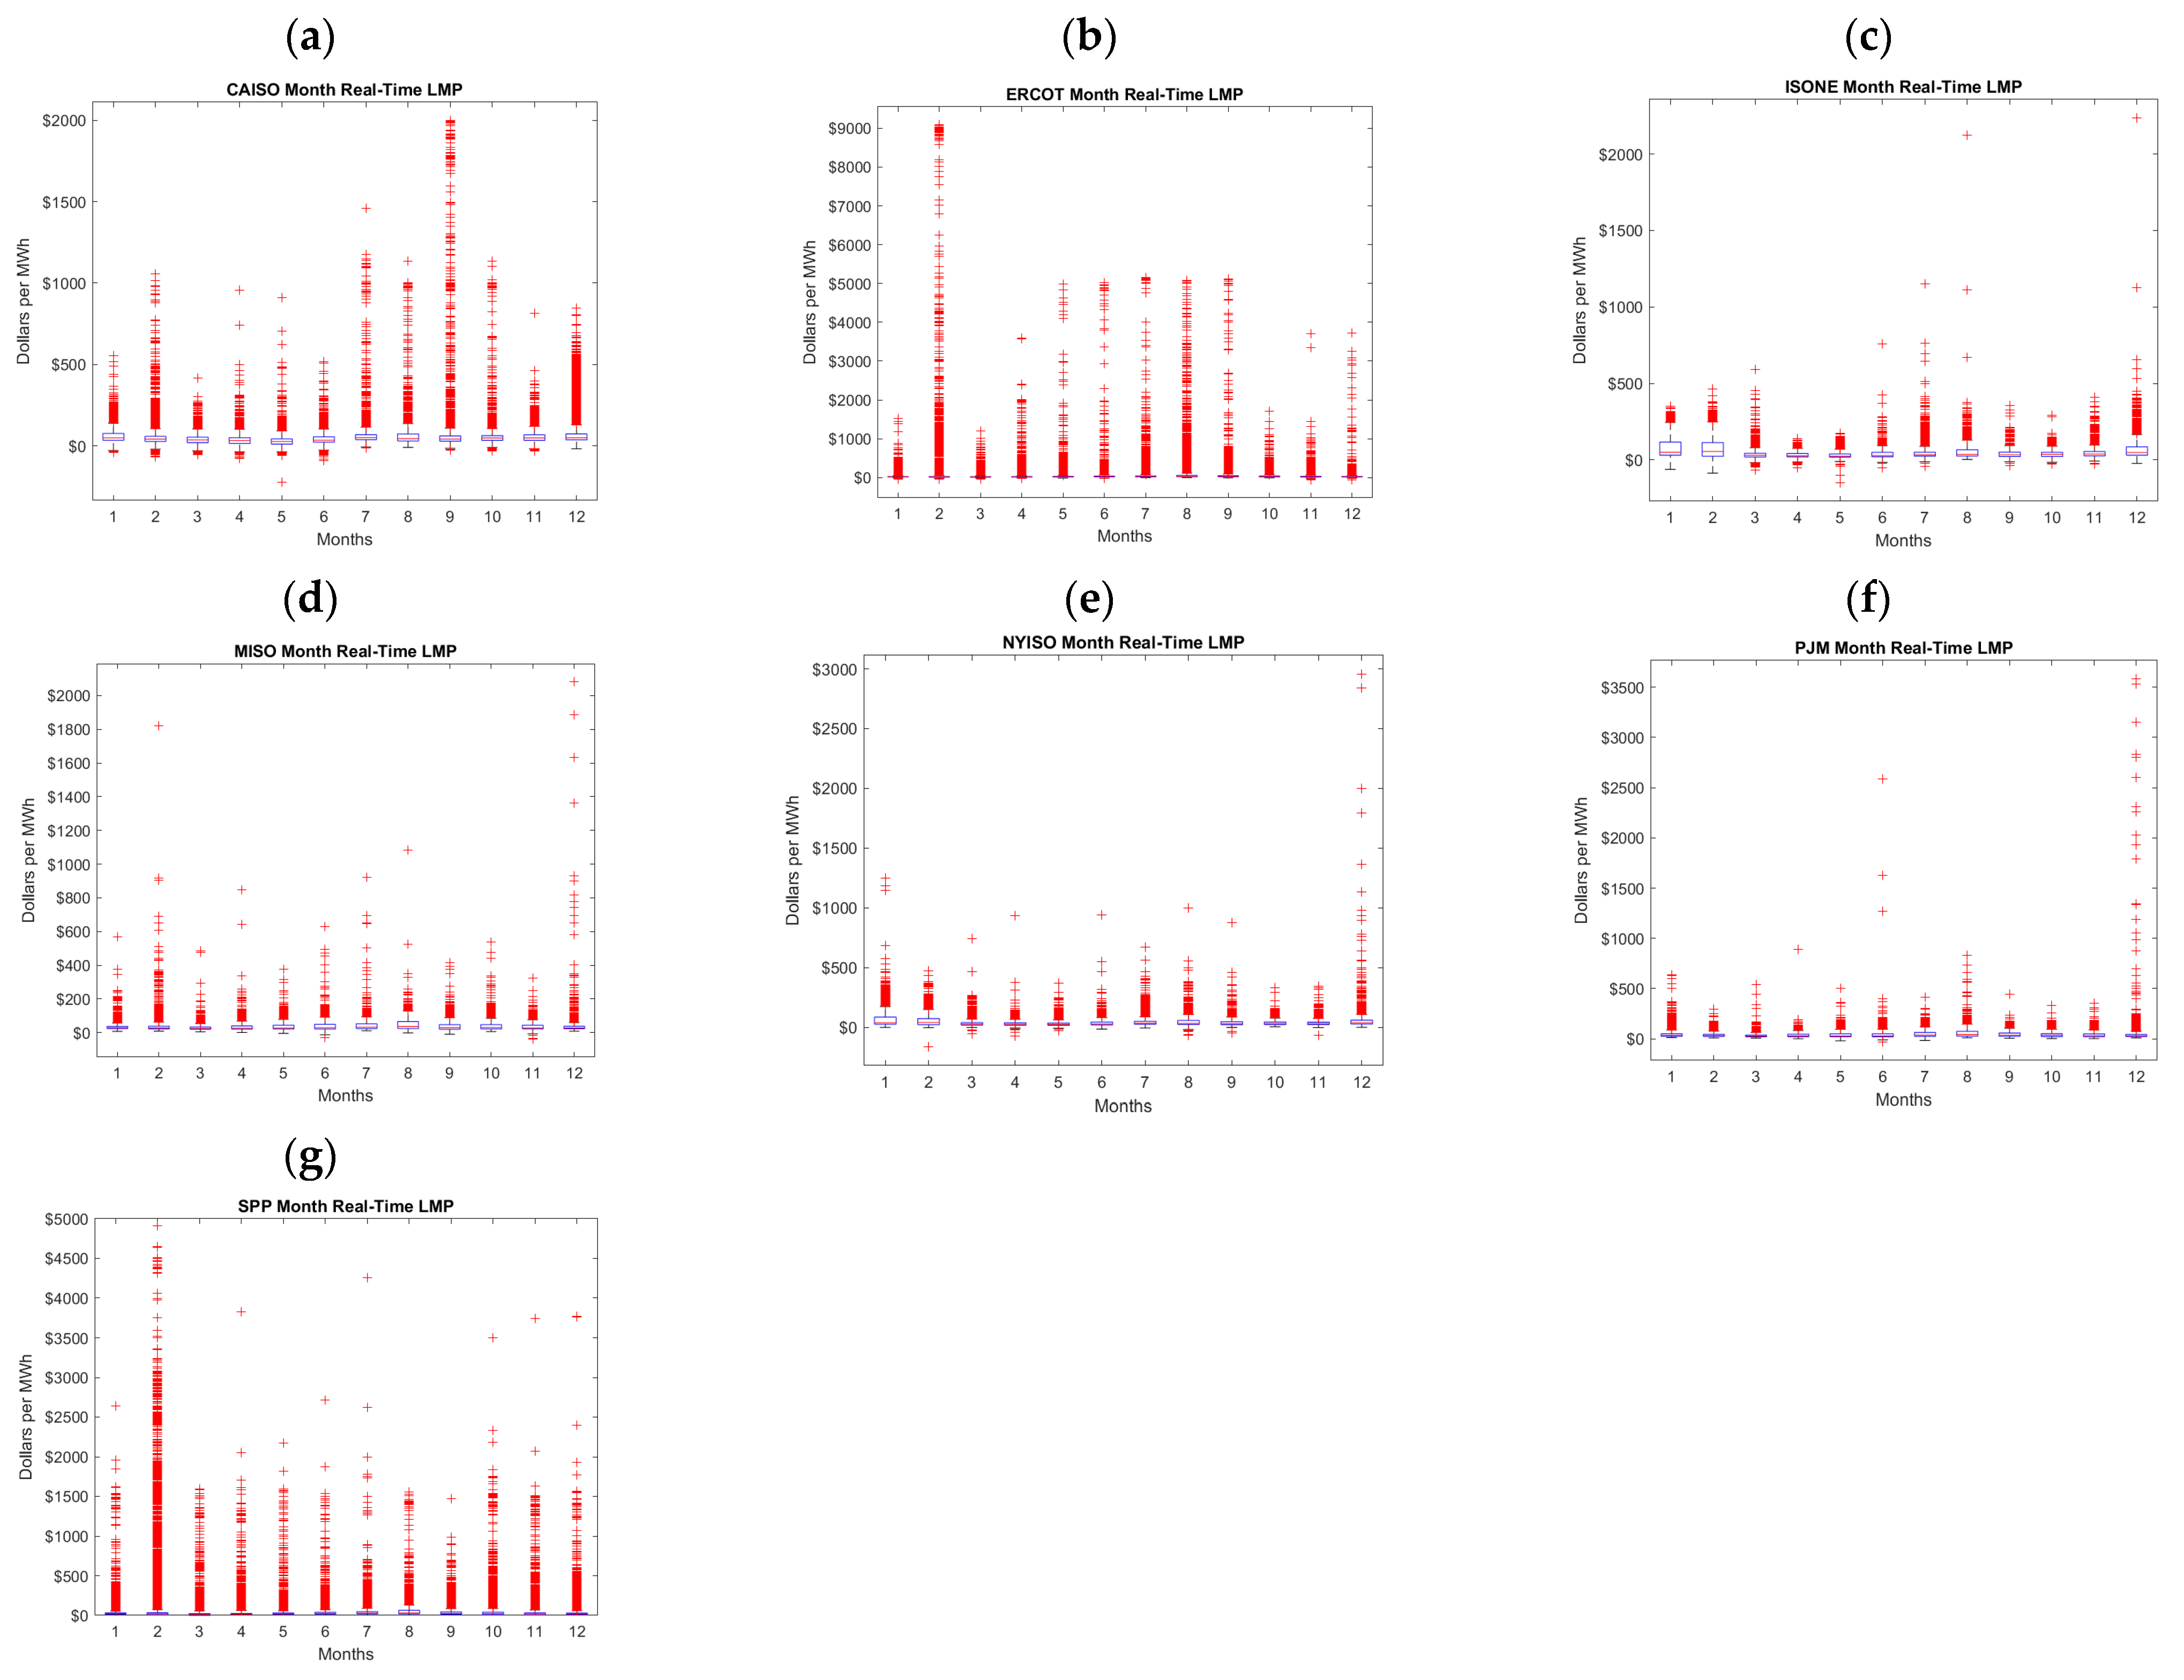
The previous analysis removed the outlier values from the box plot representation to provide better contrast on the limits for quartiles in the analysis. However, when outliers are presented, as shown in
Figure 8, additional assessments and insights may be provided to stakeholders. This analysis highlights that across diverse RTOs, the monthly LMP may have high variability. If schools are able to supply electricity during these time periods, and have access to higher LMP, the income may be maximized. For instance, for CAISO, September has shown significantly high outliers, reaching up to
$2000 per MWh, with February, July, August, October, and December exceeding
$1000 per MWh. This compares very favorably with the box plot values from the previous
Figure 7, which indicates that the highest quartile values only reach
$140 per MWh in the most productive month. This high outlier LMP behavior is present in several RTOs, including CAISO, ERCOT, and SPP, with values reaching up to
$6000 per MWh for ERCOT during the summer months and in February reaching up to
$9000 per MWh. On the other hand, different RTOs have more moderate outlier behavior. For ISONE, MISO, NYISO, and PJM, outliers in most months do not exceed
$500 per MWh, with the exception of December, which may reach some high outlier values. Even these more limited outlier values are significant, considering that they exceed between three and five times the highest quartile LMP presented for each area in
Figure 7. Considering that each school will be targeting the highest LMP period to supply their stored electricity, the outlier values will have a significant impact on revenue, as will be assessed in further sections of this study.
Identifying the RTO to which each school belongs is a critical first step to match with potential electricity wholesale prices that may be obtained for the available energy to be supplied to the grid. The shapefile indicated in
Figure 5 was overlaid with schools in the US, as identified by the National Center for Education Statistics (NCES) for all elementary and secondary schools [
33].
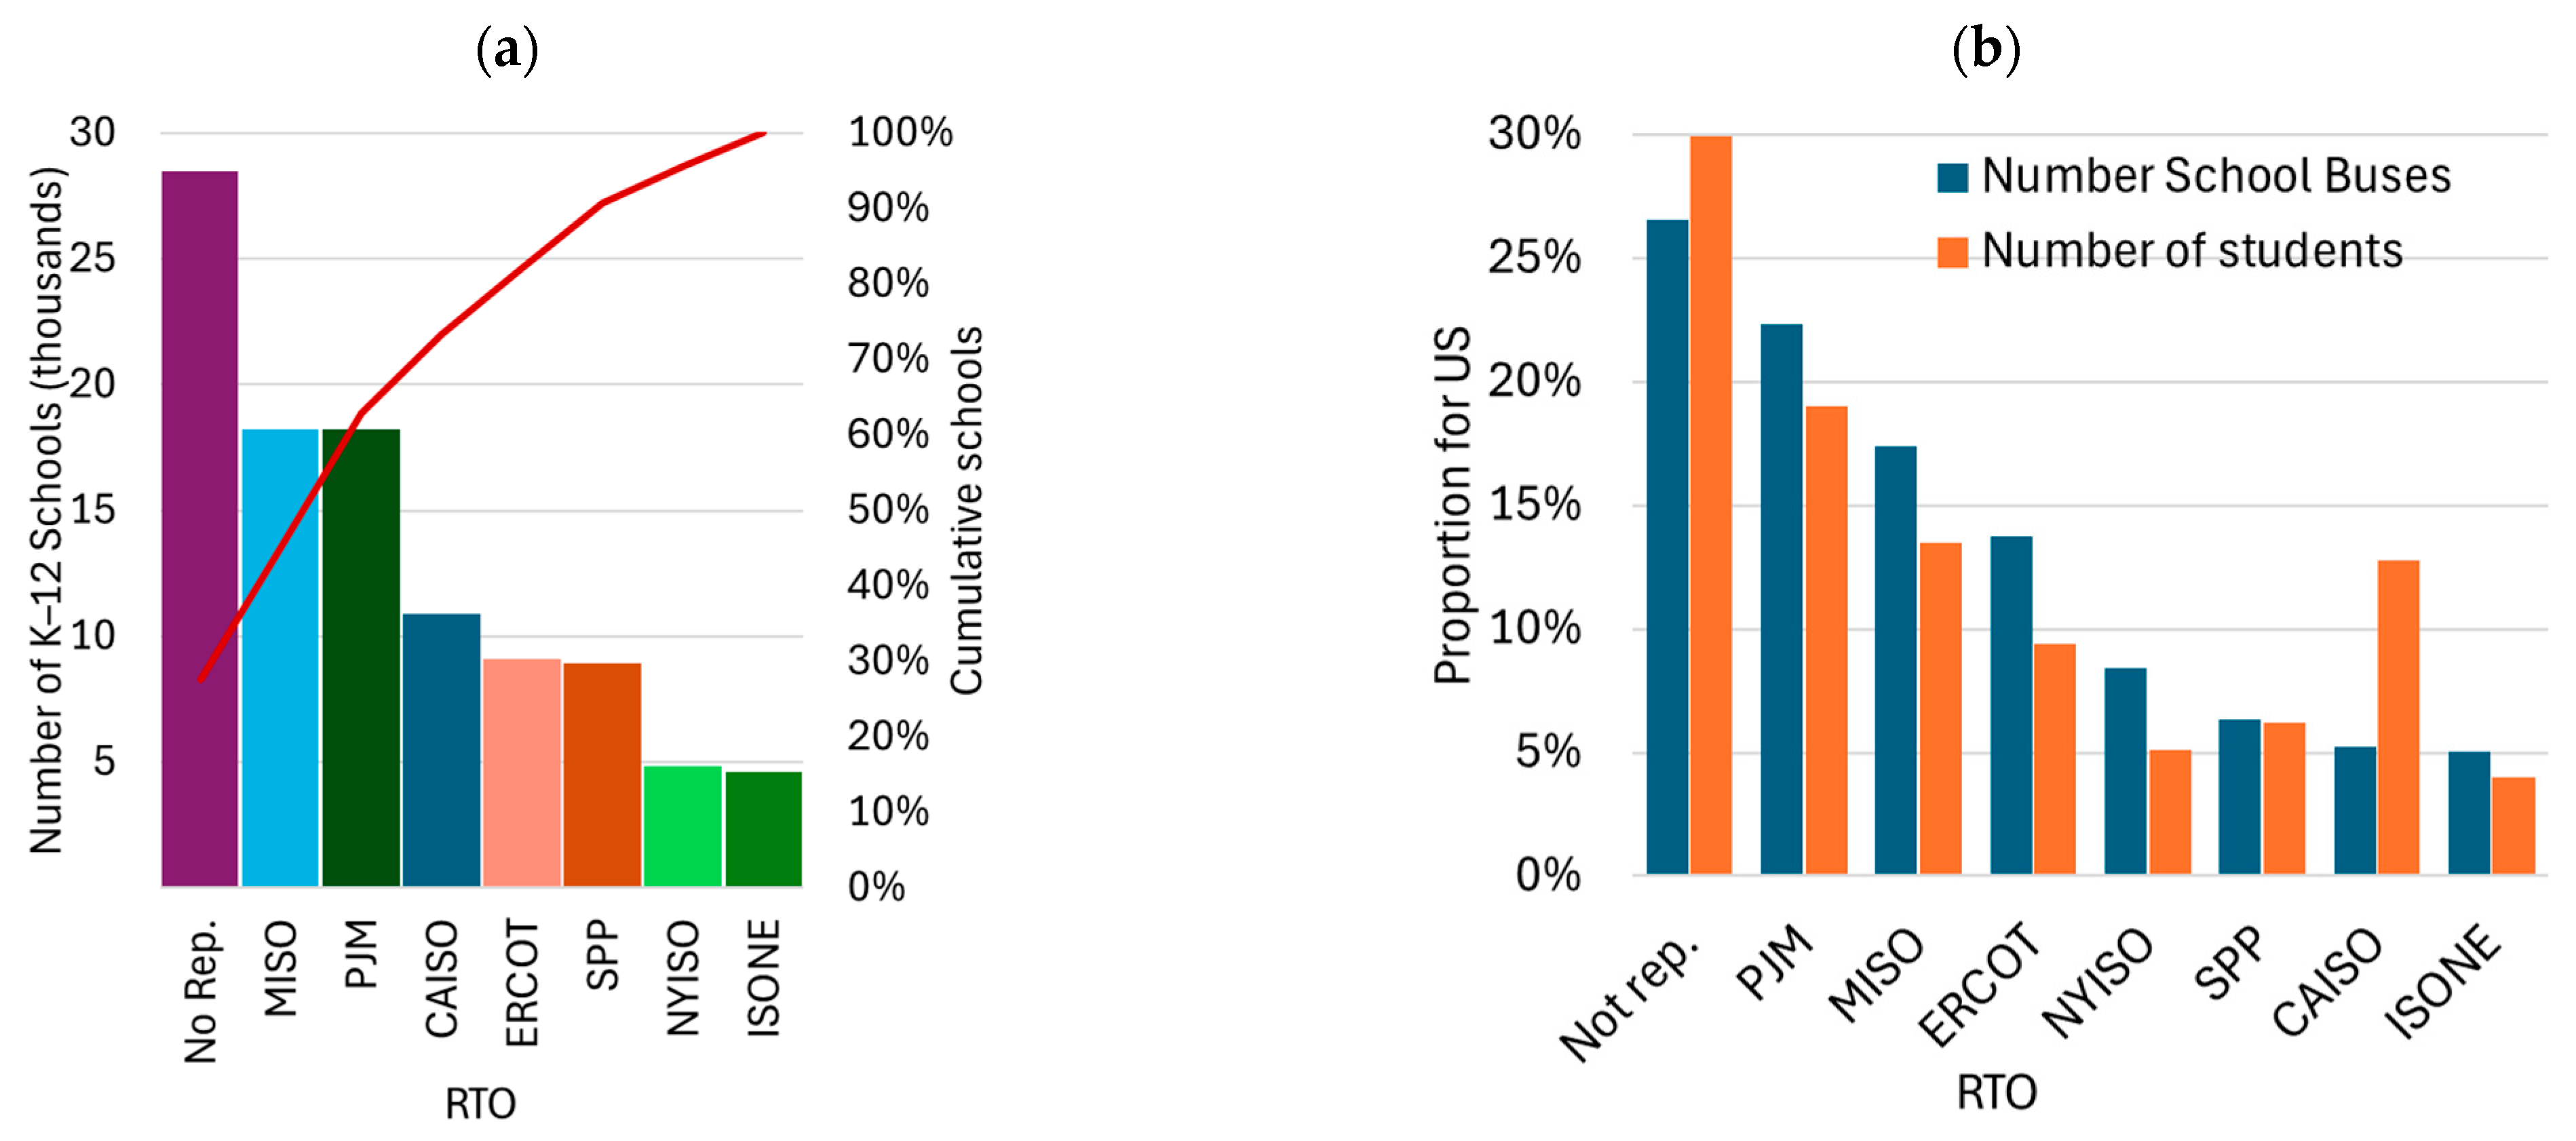
Figure 9a presents a Pareto chart of K-12 schools classified by RTO market area. The RTO market area encompasses 72% of all elementary and secondary schools in the contiguous US, with 36% in the area of two of them, MISO and PJM. These two RTOs, when combined with CAISO and the no-reported areas, comprise 73% of all K-12 schools.
Figure 9b, on the other hand, provides the proportion of the total number of school buses and students located in each RTO market area in the contiguous US. The contrast with analysis per school is relevant. It indicates that some markets with fewer schools have a much higher proportion of school buses, due to larger enrollments and higher use of public transportation. For instance, PJM with 18% of the schools has 22% of the buses, ERCOT with 9% of the schools has 14% of the buses, and NYISO with 5% of the schools has 8% of the buses. On the other hand, SPP, with 9% of the schools, has only 6% of the buses; MISO, with 18% of the schools, has only 13% of the students and 17% of school buses; and CAISO has 11% of schools but only 5% of school buses. This variability in the distribution of transportation equipment in schools makes the use of geospatial analysis a good fit to evaluate financial benefits for these educational institutions.
4. Discussion
Seasonal performance of the ESB V2G project across diverse schools is a relevant analytical subject for the proposed framework.
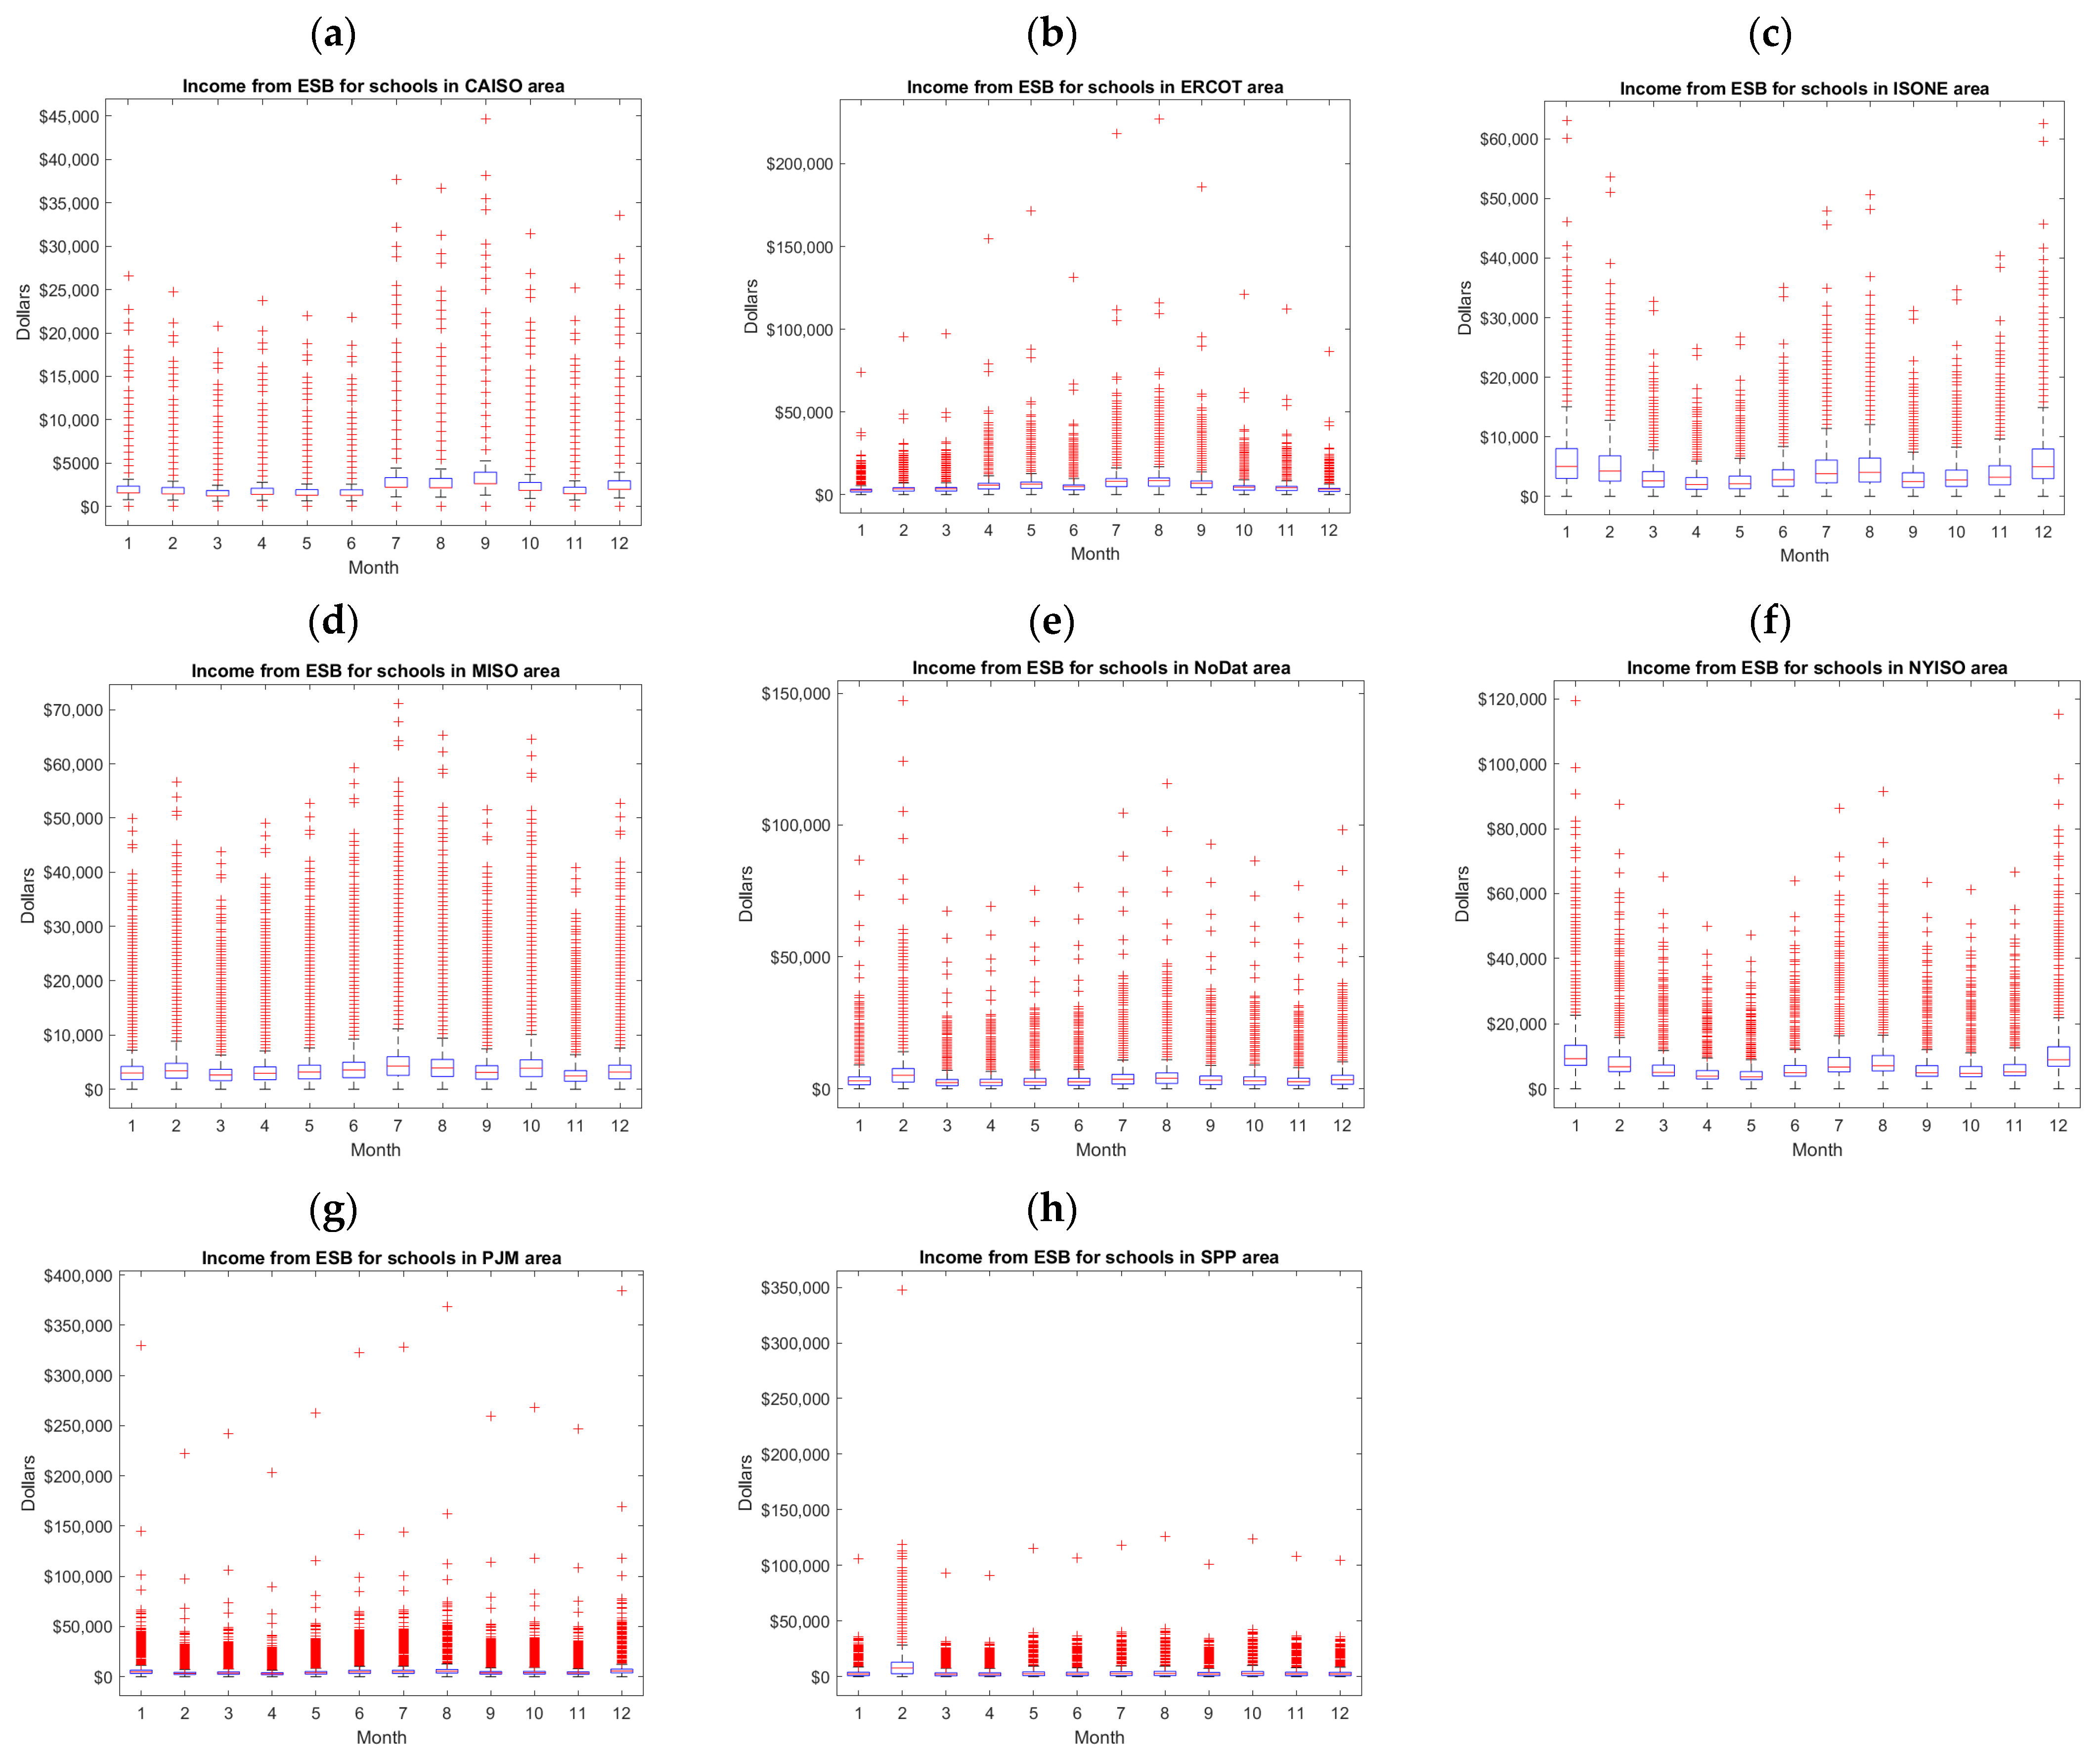
Figure 10 presents a box plot and whiskers classifying potential income for each of the more than a hundred thousand schools by RTO area location and months, presenting the average for each school over the period under analysis. Of the more than
$5 billion of annual income from ESB V2G in the continental US, one quarter corresponds to locations outside the RTO service area. PJM has the highest income level for all RTOs, at 21% of national income, followed by MISO at 16% and ERCOT at 12%. The outlook from the seasonal perspective indicates that the months with the highest income participation are August, February, and July, with values around 10%, while the months with the lowest income are March, April, and November, considering cumulative incomes between 6 and 7% of the total annual income. The impact of outliers LMO and its high monthly variability for RTOs has a significant impact on ESB V2G revenue for each school, as previously evaluated. These assessments, including the evaluation of area and season LMO outliers, will allow stakeholders to have a clear understanding of the performance of individual schools and the impact that the geographical and seasonal variability may have on them. For instance, top income schools located in the NYISO, ISONE, and PJM areas have their fourth quartile reaching between ten and fifteen thousand dollars, while schools in the ERCOT and MISO areas have top income schools during the summer months. This analysis will be very helpful in deciding the best location for each project, considering the periods of highest availability for different ESBs, depending on the school calendar and the times when resources are available for the V2G option.
The assessment presented in
Figure 11 expands the analysis provided by the result in
Figure 10 by including schools that generate significantly high ESB V2G revenue, beyond the maximum quartile values. These revenue outlier schools require particular attention from stakeholders and developers, making them prime candidates for the development of the proposed system. The high performance of each revenue outlier school is not only impacted by the number of school buses at each location but also by the LMO outlier values from the RTO where they are situated and their seasonal behavior. Considering that each facility will release its energy during the highest hourly periods, to maximize revenue, having a clear understanding of all the parameters impacting revenue is relevant. The method proposed in this study, with a combination of data analytics, BI, and GIS, provides stakeholders with a clear perspective and strategy to maximize revenues for each school. The highest concentration of ESB V2G revenue per school occurs in all RTOs in the range of
$50,000 per school. This is very significant, considering that it is between two and five times higher than the highest quartile values indicated by
Figure 11. Furthermore, some RTOs, such as NYISO and PJM, have significant outlier concentration up to
$100,000 per school, with some very high performers reaching up to
$150,000 per school, and beyond. This reflects the impact that LMO variability among RTOs, ESB geographic variability, and diverse geospatial factors have on the potential revenue that may be generated by each school project.
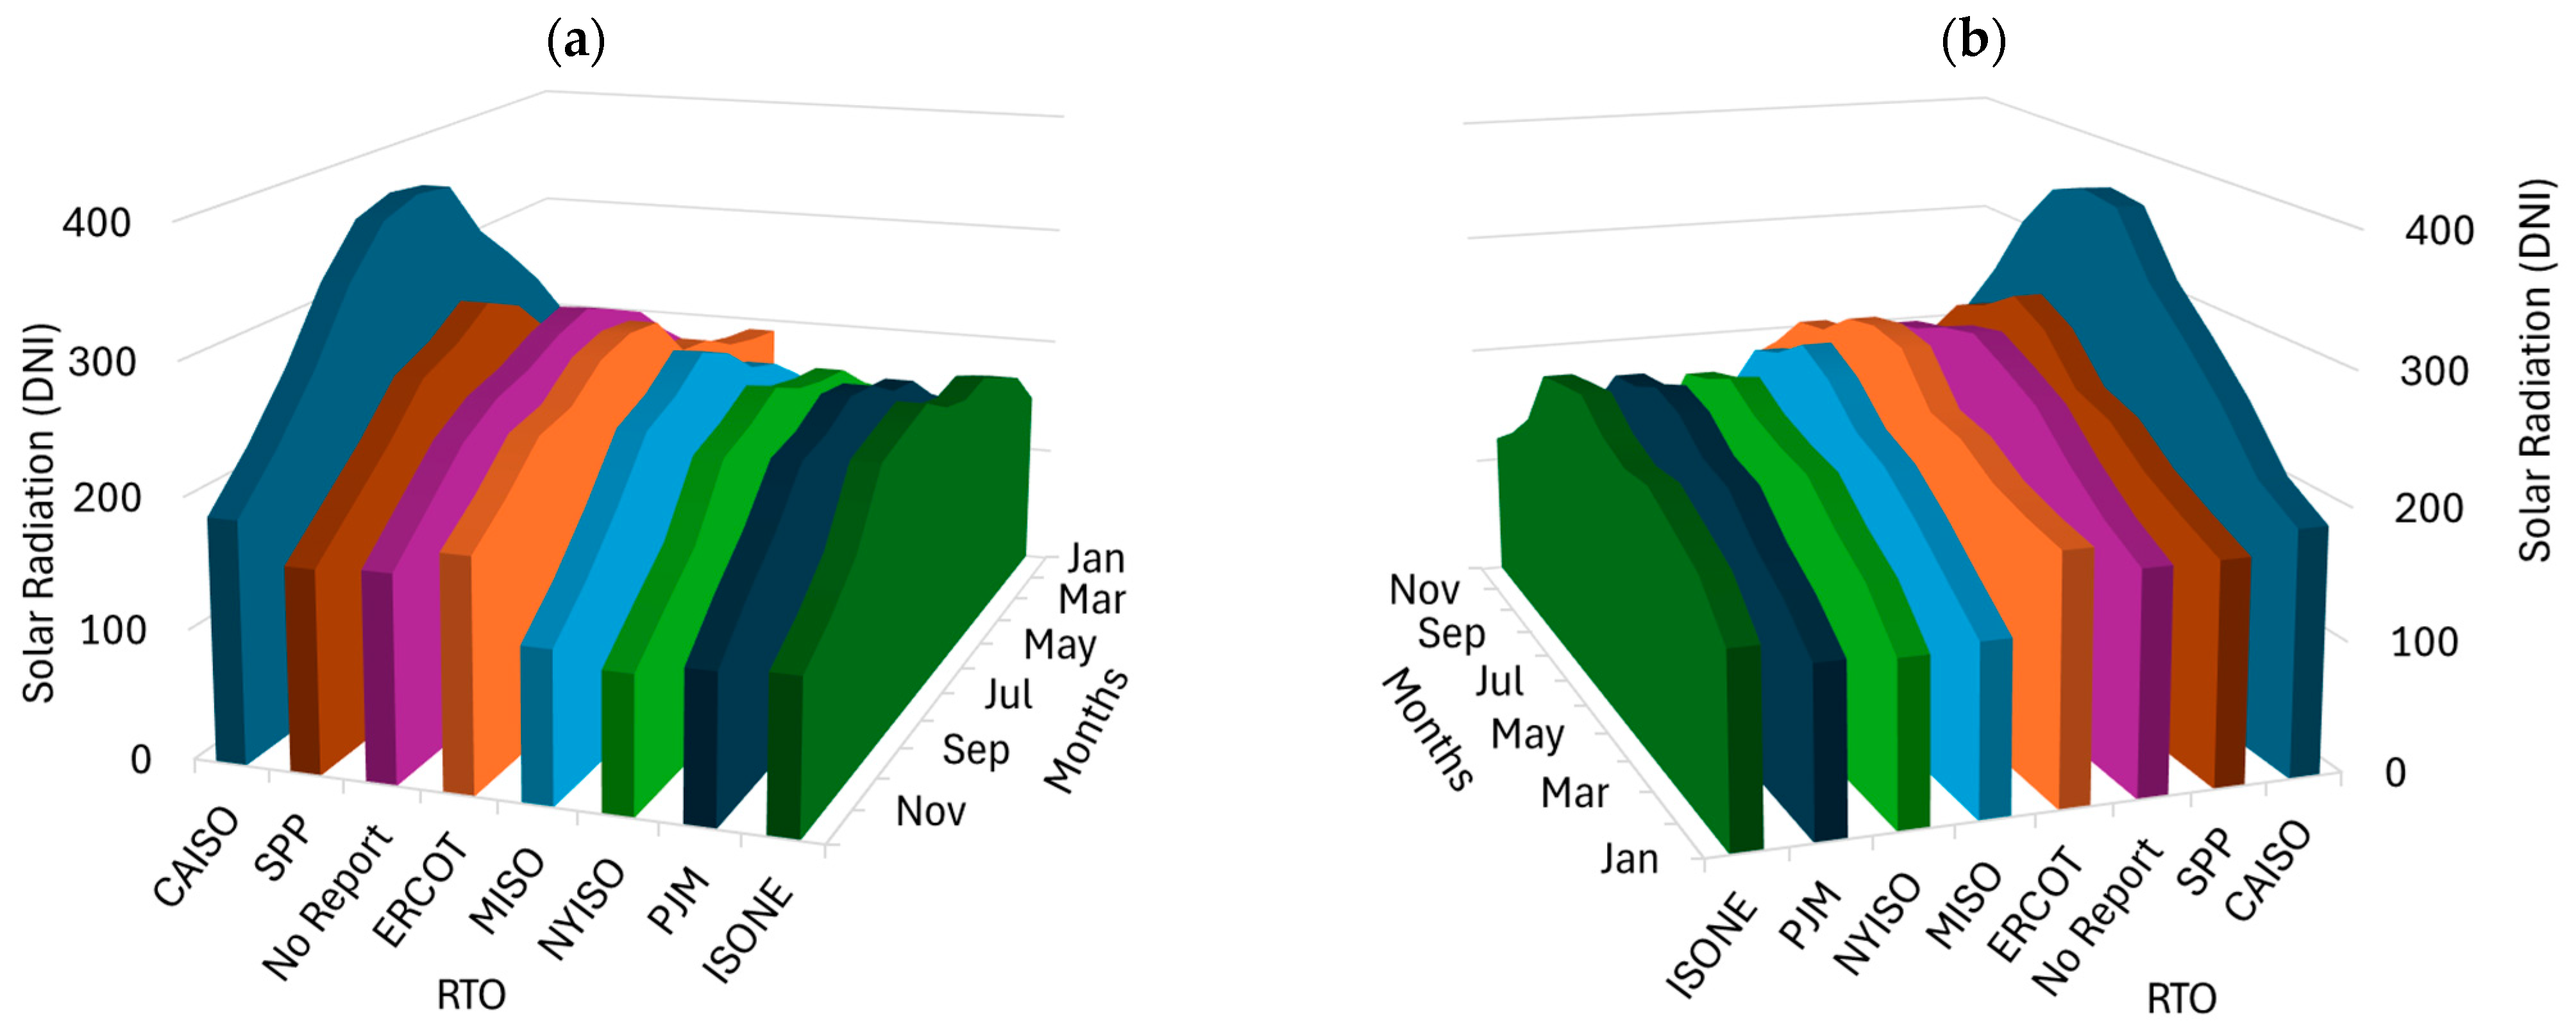
The study considers the harvesting of solar energy as the most desirable generation source for the electricity provided to electric school buses. Therefore, evaluating the availability of solar radiation in each school location throughout the year is an important parameter in assessing the potential financial benefits for each school.
Figure 12 displays two three-dimensional surface charts shown from the front and back, for better visualization. It contains the average solar radiation (DNI) per school classified by months and the RTO where they are located. Results showcase significant variability throughout the year and by geographical location. The highest overall values across the year are found in CAISO, with ERCOT and Not Reported areas having the second-highest overall values. Each RTO area has diverse variability during the year, with CAISO, MISO, NYISO, and PJM having ranges across months of 100% or higher. Additionally, the results shown in this figure indicate that the highest solar radiation, for all RTO areas, occurs during the months of June, July, and August. This creates a very favorable situation, considering that schools are on summer break during this time, allowing higher energy harvesting and storage capacity to be supplied to the grid. This allows for additional financial benefits while schools are on recess.
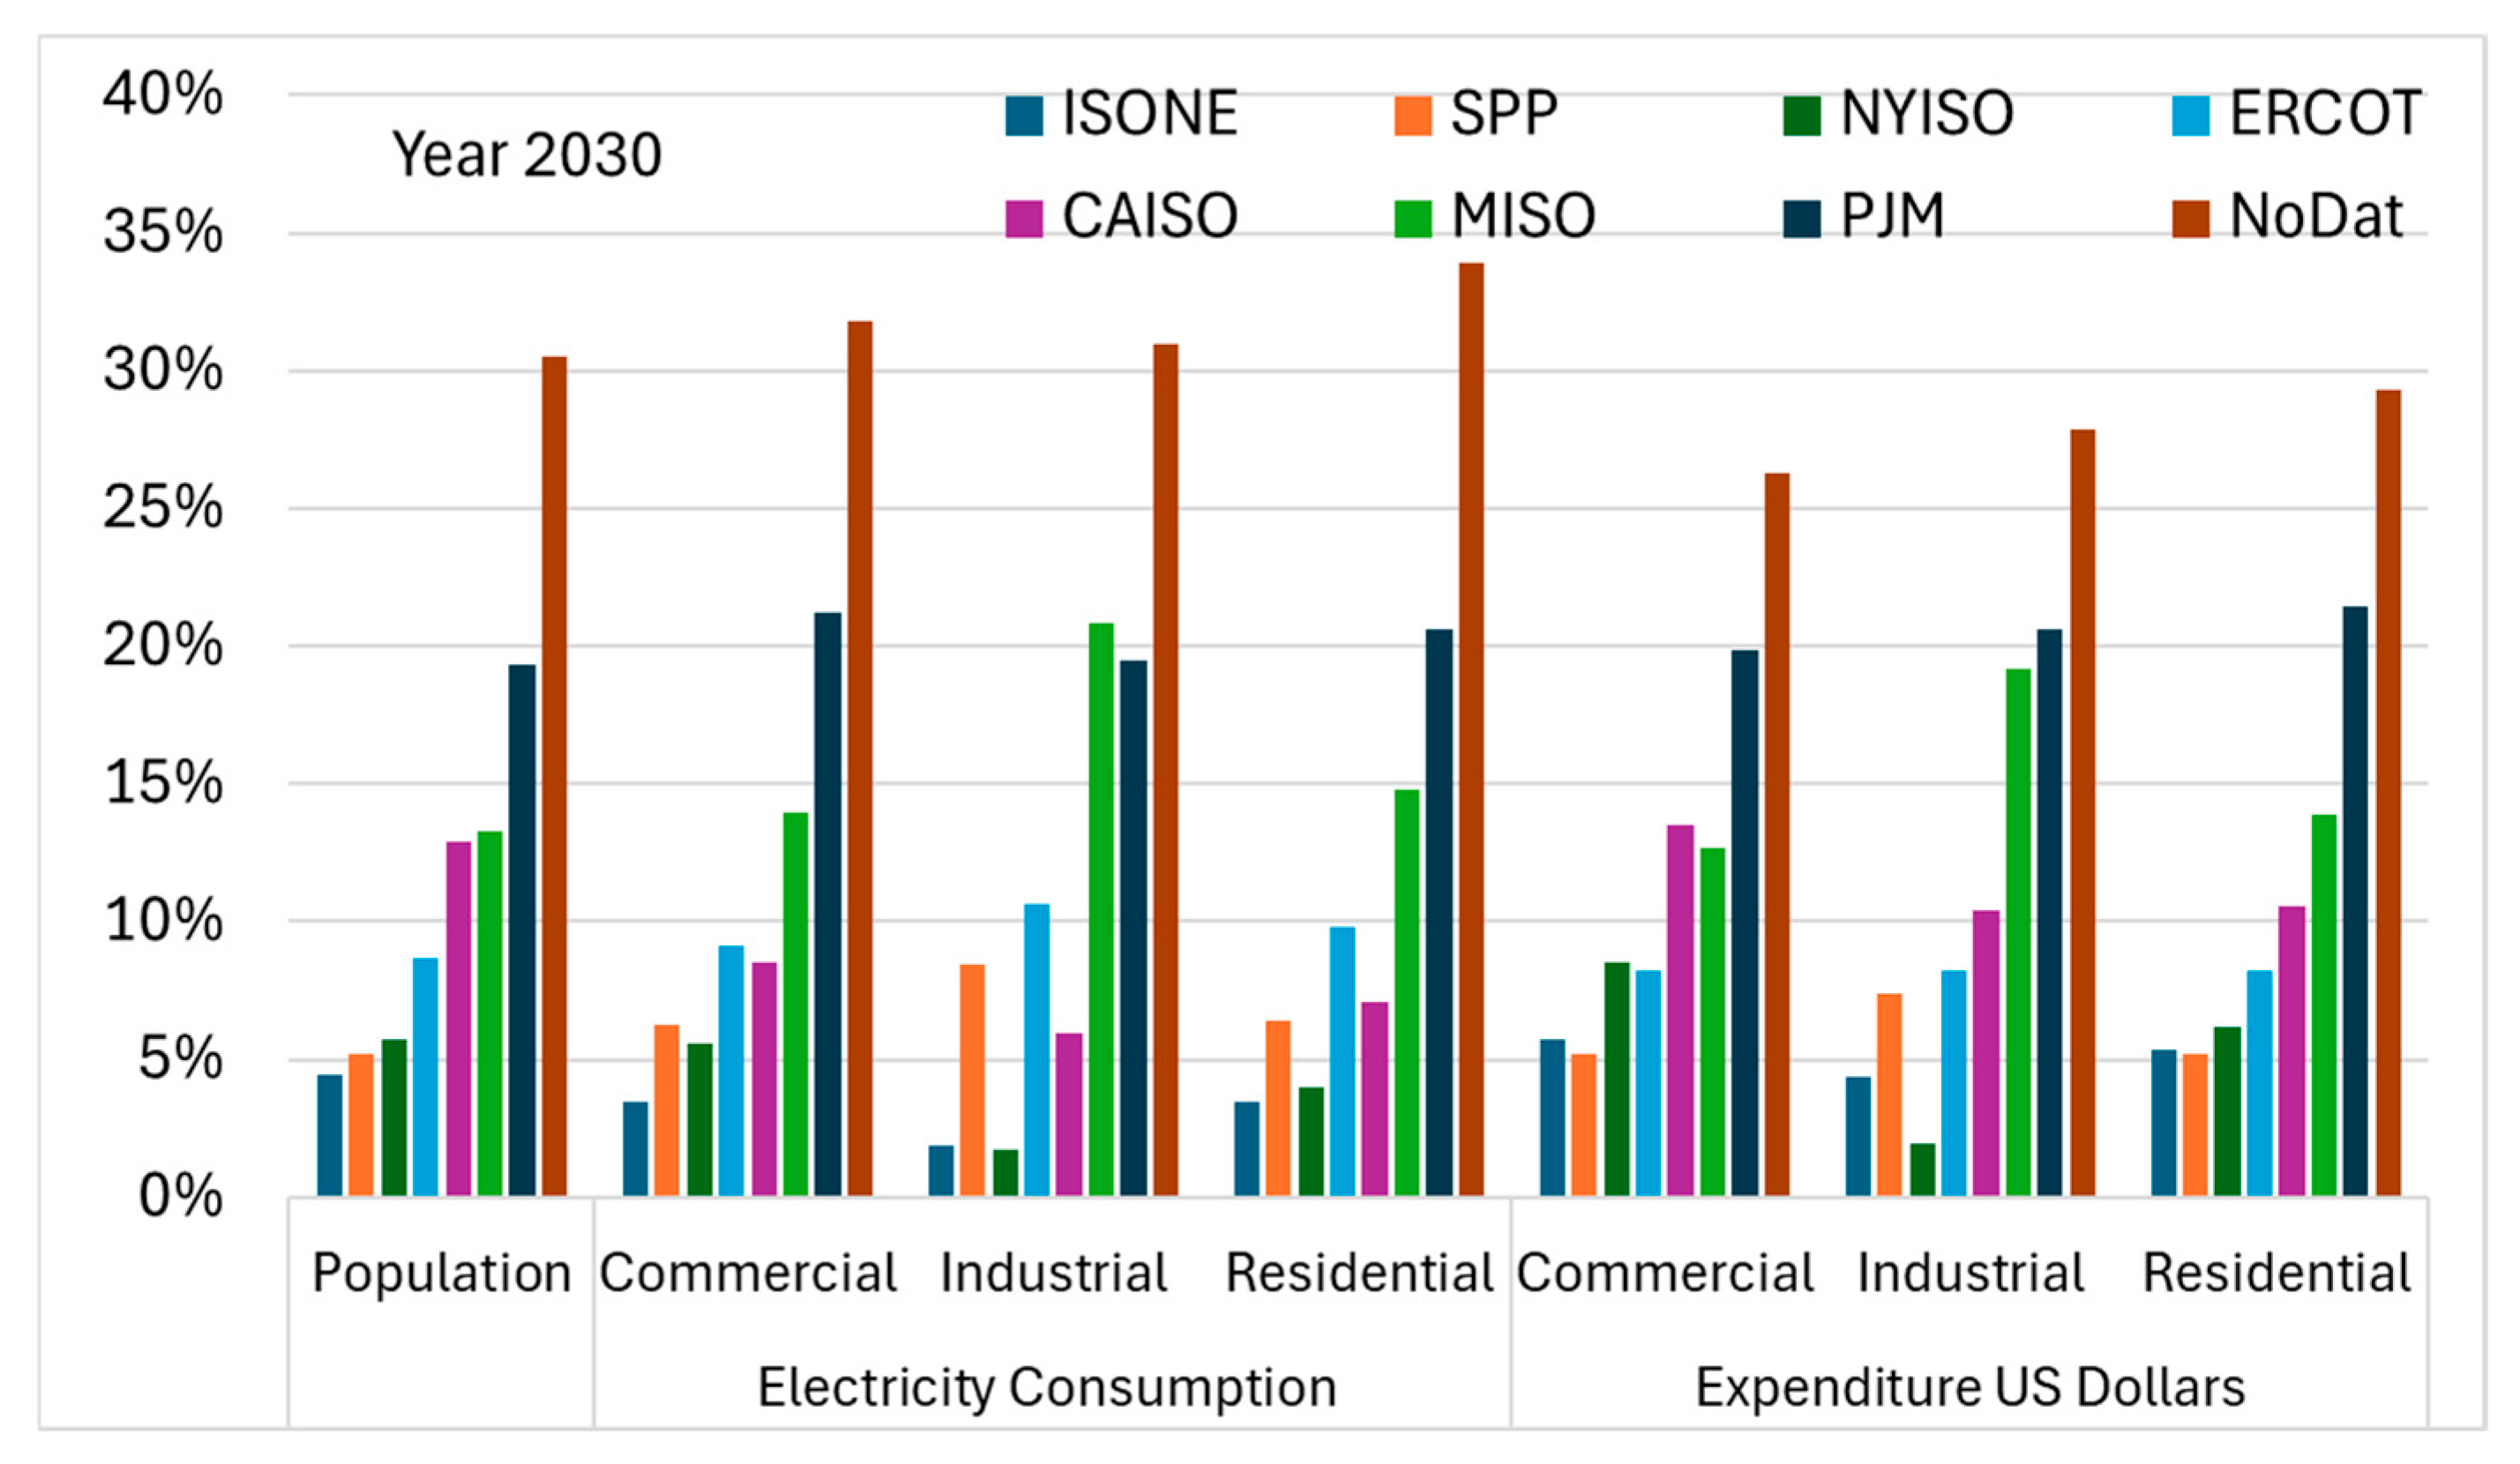
Assessing the potential demand by sector and expenditure on electricity is a relevant parameter to identify communities and areas that may benefit from the proposed system.
Figure 13 identifies potential factors that impact the consumption of electricity per RTO, including its population, electricity consumption, and expenditure per activity. Data was obtained from the National Renewable Energy Laboratory (NREL) State and Local Planning for Energy (SLOPE) for 2030 [
36]. Results from this analysis indicate that ISONE and NYISO have proportional electricity consumption in accordance with their population in residential and commercial activities, but significantly low industrial consumption. On the other hand, MISO, with 13% of the population in the US, has a remarkable 21% industrial electricity consumption and 19% expenditure. ERCOT represents 8.6% of the population and 10.7% industrial consumption, which accounts for 8.2% of national expenditure, reflecting low electricity prices for this RTO. This analysis allows stakeholders to make decisions on the optimal locations and schedules for this project. Locations with high industrial consumption may plan to supply the grid at different times to maximize financial benefits. On the other hand, locations with higher domestic consumption may choose afternoon supply during the late afternoon, with higher consumption and prices.
Figure 14 showcases electricity consumption and expenditure across the contiguous United States as forecasted by the NREL SLOPE system [
36]. Comparing these maps with
Figure 5, it indicates that sixteen states in the contiguous US are in the No Data category, outside the RTO areas, with Mississippi partially in the MISO and No Data categories. The most relevant state outside RTO sections is Florida, with 5% of electricity consumption and expenditure in the US. Georgia, North Carolina, and Tennessee are all in the 3–4% range for both categories, also outside RTO territory. The remaining states that are in the No Data sections are all between 1% and 2% for both consumption and expenditure of electricity. This creates a balanced category distribution between the RTO area and the No Data states and will allow the performance of relevant financial analysis, including all sections, with an even distribution of electricity consumption and expenditure between diverse segments.
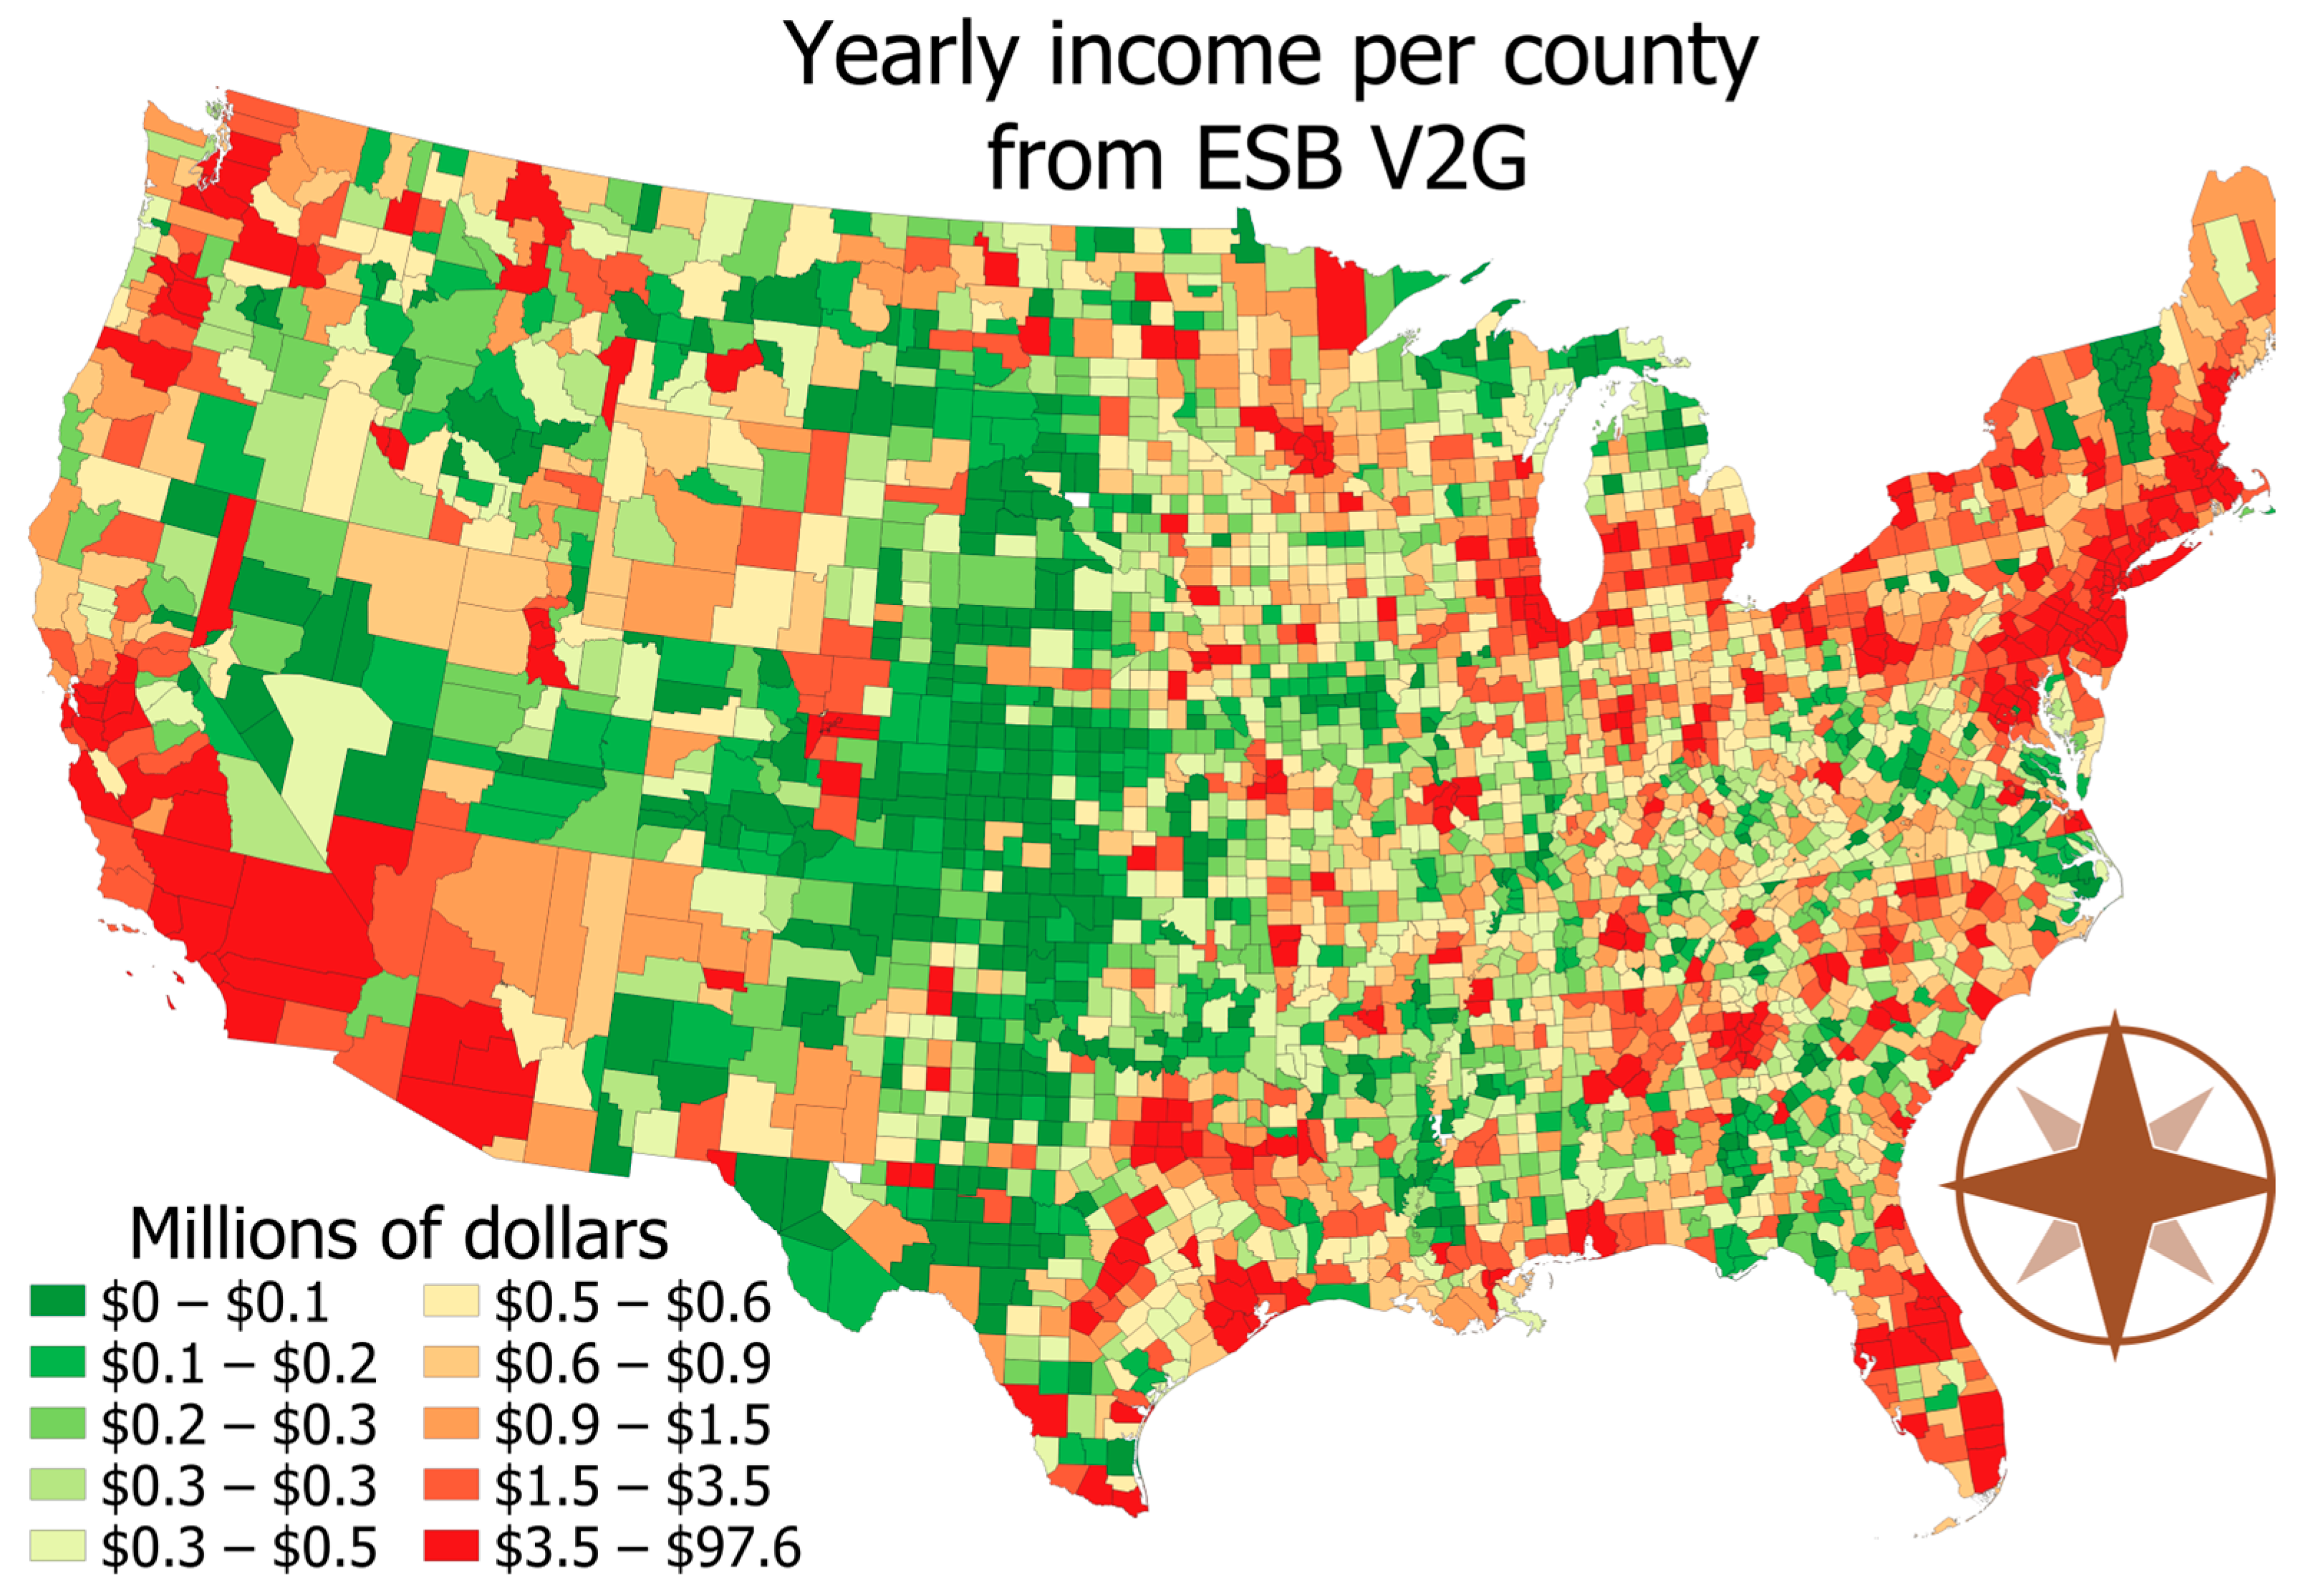
The map shown in
Figure 15 indicates potential income from ESB V2G projects, considering one full battery discharge per day, with energy being provided from solar harvesting. The income is calculated from the highest daily Real-time LMP for the hourly wholesale price of electricity, in accordance with the RTO on which each school is located. The system assessed the highest daily hourly price at which schools’ systems will supply electricity. Potential income for the years in the period was averaged, and income per county was assessed, as shown in the map provided. This analysis showcases the wide geographical variability and distribution of the income that could be generated from this scheme and the relevance of using geospatial tools to make relevant decisions. Results indicate that 80% of the national income is generated by 23% of the counties, providing significant grounds for a Pareto analysis. Furthermore, 10% of the national income is generated by 9 counties, with 4 located in Texas, 2 in New York, and one each in California, Arizona, and Illinois, respectively. Additional Pareto results showcase that 20% of the income is generated by 1% of the counties, 30% by 1.9% of the counties, and 40% is comprised in 3.35% of the counties. On the other hand, counties generating lower income represent a significant proportion of the geography. For instance, 10% of cumulative EBS V2G income is generated in 60% of the counties. However, real annual revenue may be significant for the majority of the counties. For instance, 896 have an annual income higher than one million dollars, while 1145 counties (37% of the counties) have an annual income higher than
$700,000. Furthermore, 1474 (47% of all counties) have an ESB V2G income higher than half a million dollars. This highlights the relevance of the potential income that each county may receive from these projects and the relevance of applying geospatial analysis to perform feasibility studies for each situation.
As shown in previous sections, the implications and benefits for local economies from the proposed ESB V2G scheme are significant. Apart from providing their communities with stable and clear electricity, local schools can obtain important additional revenue that can be applied to offset the educational costs and provide additional services to students.
Figure 16a showcases seasonal variability across counties in the contiguous US. For three months, February, July, and August, the fourth quartile value is higher than
$250,000 per county, while for five months it is higher than
$200,000. Furthermore, the box plots for all months indicate a positive (right) skew, showing a third quartile much larger than its second quartile. This indicates that the potential for some counties to receive income significantly higher than the median. Identifying these outstanding revenue-generating counties through geospatial analysis will allow stakeholders to prioritize developments in particular locations. The largest median corresponds to February, larger than
$50,000 per county, with July and August higher than
$45,000, and all the other months higher than
$29,000 per county per month. The third quartile reaches beyond
$100,000 per county per month for five months and beyond
$89,000 for four months. This reflects a high financial potential for diverse counties without considering the outlier revenue locations. As counties that have revenue on the outlier segment are incorporated in the analysis, the potential to maximize financial benefits expands, as shown by
Figure 16b. There are a significant number of counties that have the potential to earn up to two million dollars per month, as shown by the corresponding outlier values. Furthermore, some selected high-revenue counties may be able to generate potential ESB V2G revenue up to eight million dollars and even twelve million dollars for the extreme outlier counties. This analysis indicates that counties that have revenue considered in the outlier segment have the potential to generate significant monthly revenue from this scheme.
A national overview of the contribution of each geographical location to the potential revenue generation from the ESB V2G projects is presented in
Figure 17. The first bar chart in
Figure 17a indicates the county revenue generation from the proposed scheme, characterized by population. It shows how counties with populations smaller than 100,000 people generate almost one quarter of the national revenue from these projects, while 50% is generated by counties with populations lower than 300,000. Additionally, counties with populations smaller than half a million people generate 75% of the revenue. This shows how the proposed systems would benefit a wide variety of counties, distributed across the nation. When this analysis is contrasted with the counties that generate revenue characterized as outlier values, there is a significant contribution from these areas. Results from
Figure 17b,c indicate that almost 69% of all the national revenue from the proposed systems is provided by counties considered as outliers. Counties with a population smaller than 100,000 have a smaller contribution, with only 46 counties (0.64% of the counties in the contiguous US) classified as outliers and contributing only 1% of the total revenue. As the population increases, the number of outlier counties grows as well, with higher revenue values for the system. For instance, counties with up to half a million people contribute more than a quarter of all the ESB V2G national revenue. Furthermore, counties with a population of between half a million and one million people contribute almost 19% to the national revenue. These results are very significant, providing decision makers and stakeholders with important insight into the best locations to prioritize the development of these systems.
5. Conclusions
This study proposes a financial assessment framework to aid stakeholders regarding decisions of vehicle-to-grid (V2G) electric school bus (ESB) projects across the US. The framework integrates publicly available data from diverse disconnected sources provided by the federal, state, and local governments, as well as national laboratories and research institutions. Applying data analytics, Geographic Information Systems (GIS), and Business Intelligence (BI), an operational tool is applied to select the optimal locations, time periods, and seasons to maximize revenue from these systems. This will allow stakeholders to make informed decisions regarding the financial viability of V2G ESB systems across the US.
Results from this study indicate that many locations across the US offer significant revenue potential for ESB V2G projects. Results for county analysis reflect positive (right) skew for all locations and seasons, showcasing high revenue potential for a limited number of high-revenue generating counties, which is higher than the median value of the national data. Applying geospatial analysis through the proposed framework, stakeholders may identify these locations, which may have a much higher potential return on investment. The study indicates that the incorporation of data analytics, spatiotemporal analysis, and BI provides stakeholders with a clear panoramic view of the optimal locations, time frames, and seasons to operate the system.
The developed framework offers a flexible and adaptable tool for stakeholders to maximize revenue with the operation of V2G ESB systems. This will allow school districts to receive additional income that will aid them in pursuing their educational goals while simultaneously providing their local communities with sustainable energy. Future research will expand the proposed framework to include potential health and environmental benefits, financially quantified. This granular analysis will be performed for each individual educational institution, providing stakeholders with a broader perspective on the benefits of these projects.
