Article

China’s Rural Industrial Integration Under the “Triple Synergy of Production, Livelihood and Ecology” Philosophy: Internal Mechanisms, Level Measurement, and Sustainable Development Paths

1
Research Center of Digital Development and Governance in Minority Areas, South-Central Minzu University, Wuhan 430074, China
2
School of Management, South-Central Minzu University, Wuhan 430074, China
*
Author to whom correspondence should be addressed.
Sustainability 2025, 17(20), 8972; https://doi.org/10.3390/su17208972
Submission received: 28 August 2025 / Revised: 25 September 2025 / Accepted: 26 September 2025 / Published: 10 October 2025
(This article belongs to the Section Sustainable Urban and Rural Development)

Abstract

Against the backdrop of global agricultural transformation, rural China faces the critical challenge of reconciling economic development with environmental conservation and social well-being. This study, grounded in the rural revitalization strategy, investigates the internal mechanisms, level measurement, and sustainable development paths of rural industrial integration based on the “Triple Integration of Production, Livelihood and Ecology” (PLE) philosophy. Firstly, we discussed the suitability and the mechanisms of this philosophy on China’s rural industrial integration. Secondly, based on a textual corpus extracted from academic journals and policy documents, we employed an LDA topic model to cluster the themes and construct an evaluation indicator system comprising 29 indicators. Then, utilizing data from the China Statistical Yearbook and the China Rural Statistical Yearbook (2013–2022), we measured the level of China’s rural industrial integration using the entropy method. The composite integration index displays a continuous upward trend over 2013–2022, accelerating markedly after the 2015 stimulus policy, yet a temporary erosion of “production–livelihood–ecology” synergy occurred in 2020 owing to an exogenous shock. Lastly, combining the system dynamics model, we simulated over the period 2023–2030 the three sustainable development scenarios: green ecological development priority, livelihood standard development priority and production level development priority. Research has shown that (1) the “Triple Synergy of Production, Livelihood and Ecology” philosophy and China’s rural industrial integration are endogenously unified, and they form a two-way mutual mechanism with the common goal of sustainable development. (2) China’s rural industrial integration under this philosophy is characterized by production-dominated development and driven mainly by processing innovation and service investment, but can be constrained by ecological fragility and external shocks. (3) System dynamics simulations reveal that the production-development priority scenario (Scenario 3) is the most effective pathway, suggesting that the production system is a vital engine driving the sustainable development of China’s rural industrial integration, with digitalization and technological innovation significantly improving integration efficiency. In the future, efforts should focus on transitioning towards a people-centered model by restructuring cooperative equity for farmer ownership, building community-based digital commons to bridge capability gaps, and creating market mechanisms to monetize and reward conservation practices.

1. Introduction

Globally, rural regions are grappling with the interconnected challenges of economic stagnation, social inequity, and environmental degradation. The pursuit of sustainable rural development has become a paramount concern on the international agenda, notably reflected in the United Nations Sustainable Development Goals (SDGs). Florin-Constantin Mihai emphasizes that transitioning to a circular economy and adopting sustainable development strategies are essential to address these challenges, requiring innovative solutions, multi-disciplinary approaches, and policy interventions to achieve the SDGs [1]. Since the 18th National Congress of the Communist Party of China, the rural revitalization strategy has been established as the overarching principle for the field of agriculture, farmers, and rural areas. And as a key driver, rural industrial integration has always been at the forefront of policy deployment. China’s No. 1 central document for 2015 first proposed “integrated development of the primary, secondary, and tertiary industries in rural areas”. It pointed out how to realize the internalization of the division of labor between primary, secondary and tertiary industries, with agriculture and rural areas as the base, and to solve the “three simultaneous increases” of agricultural production—high inventory, high imports, and high output. Currently, China’s rural industrial integration is facing three dilemmas in the aspects of production, livelihood, and ecology: (1) a single industrial structure, traditional resource-intensive agriculture yields low added value and weak risk resistance; (2) severe population loss and aging lead to rural hollowing out and talent shortages, restricting industrial growth [2]; (3) rough production results in over-depletion of resources, soil and water pollution, and biodiversity loss [3]. The “Triple Synergy of Production, Livelihood and Ecology” (PLE) philosophy integrates these three aspects and breaks the split between industrial expansion, population loss, and environmental deterioration in traditional development to prevent unsustainable development traps like high costs and low benefit, village hollowing out, etc.
A critical review of the existing literature reveals several important theoretical and methodological gaps. (1) Previous studies on rural industrial integration have often adopted a singular perspective, focusing predominantly on either economic efficiency or ecological conservation. Limited research has comprehensively examined the synergistic mechanisms and inherent tensions among production, livelihood, and ecological dimensions within an integrated theoretical framework. (2) Methodologically, conventional approaches to measuring rural industrial integration levels have relied on predetermined indicator systems that may not fully capture the evolving nature of rural integration. Furthermore, while some studies have acknowledged rural industrial integration as a complex system, few have employed computational simulation methods like system dynamics to model its internal causal relationships and predict long-term development pathways under different policy scenarios.
The objectives of this study are threefold: (1) to examine the endogenous unity and internal mechanisms between the PLE philosophy and China’s rural industrial integration; (2) to construct a comprehensive evaluation system and measure the development level of China’s rural industrial integration from 2013 to 2022; and (3) to simulate different development scenarios and identify the most sustainable pathway for China’s rural industrial integration under the PLE framework.
To explore the sustainable development paths of China’s rural industrial integration under the PLE philosophy, we innovatively use an LDA topic model to identify the themes of China’s rural industrial integration text corpus and construct an evaluation indicator system according to the results. Also, we analyze the causal relationship between the factors in the complex system of China’s rural industrial integration through system dynamics and find the optimal path for sustainable development via simulation. This study breaks through the conventional single economic-efficiency or ecological-protection perspective, provides a new paradigm for understanding the synergy between production efficiency, livelihood standards improvement, and ecological protection, and expands upon the theoretical connotations of the cross-study of rural revitalization and sustainable rural industrial integration. Furthermore, it provides policymakers with practical solutions to the triple dilemmas of high cost and low efficiency, lagging quality of life, and ecological constraints, so as to achieve a win–win goal to serve the rural revitalization strategy: “value-added” for industry, “income-added” for farmers, and “greenery-added” for the environment.

2. Literature Review

2.1. The “Triple Synergy of Production, Livelihood and Ecology” Philosophy

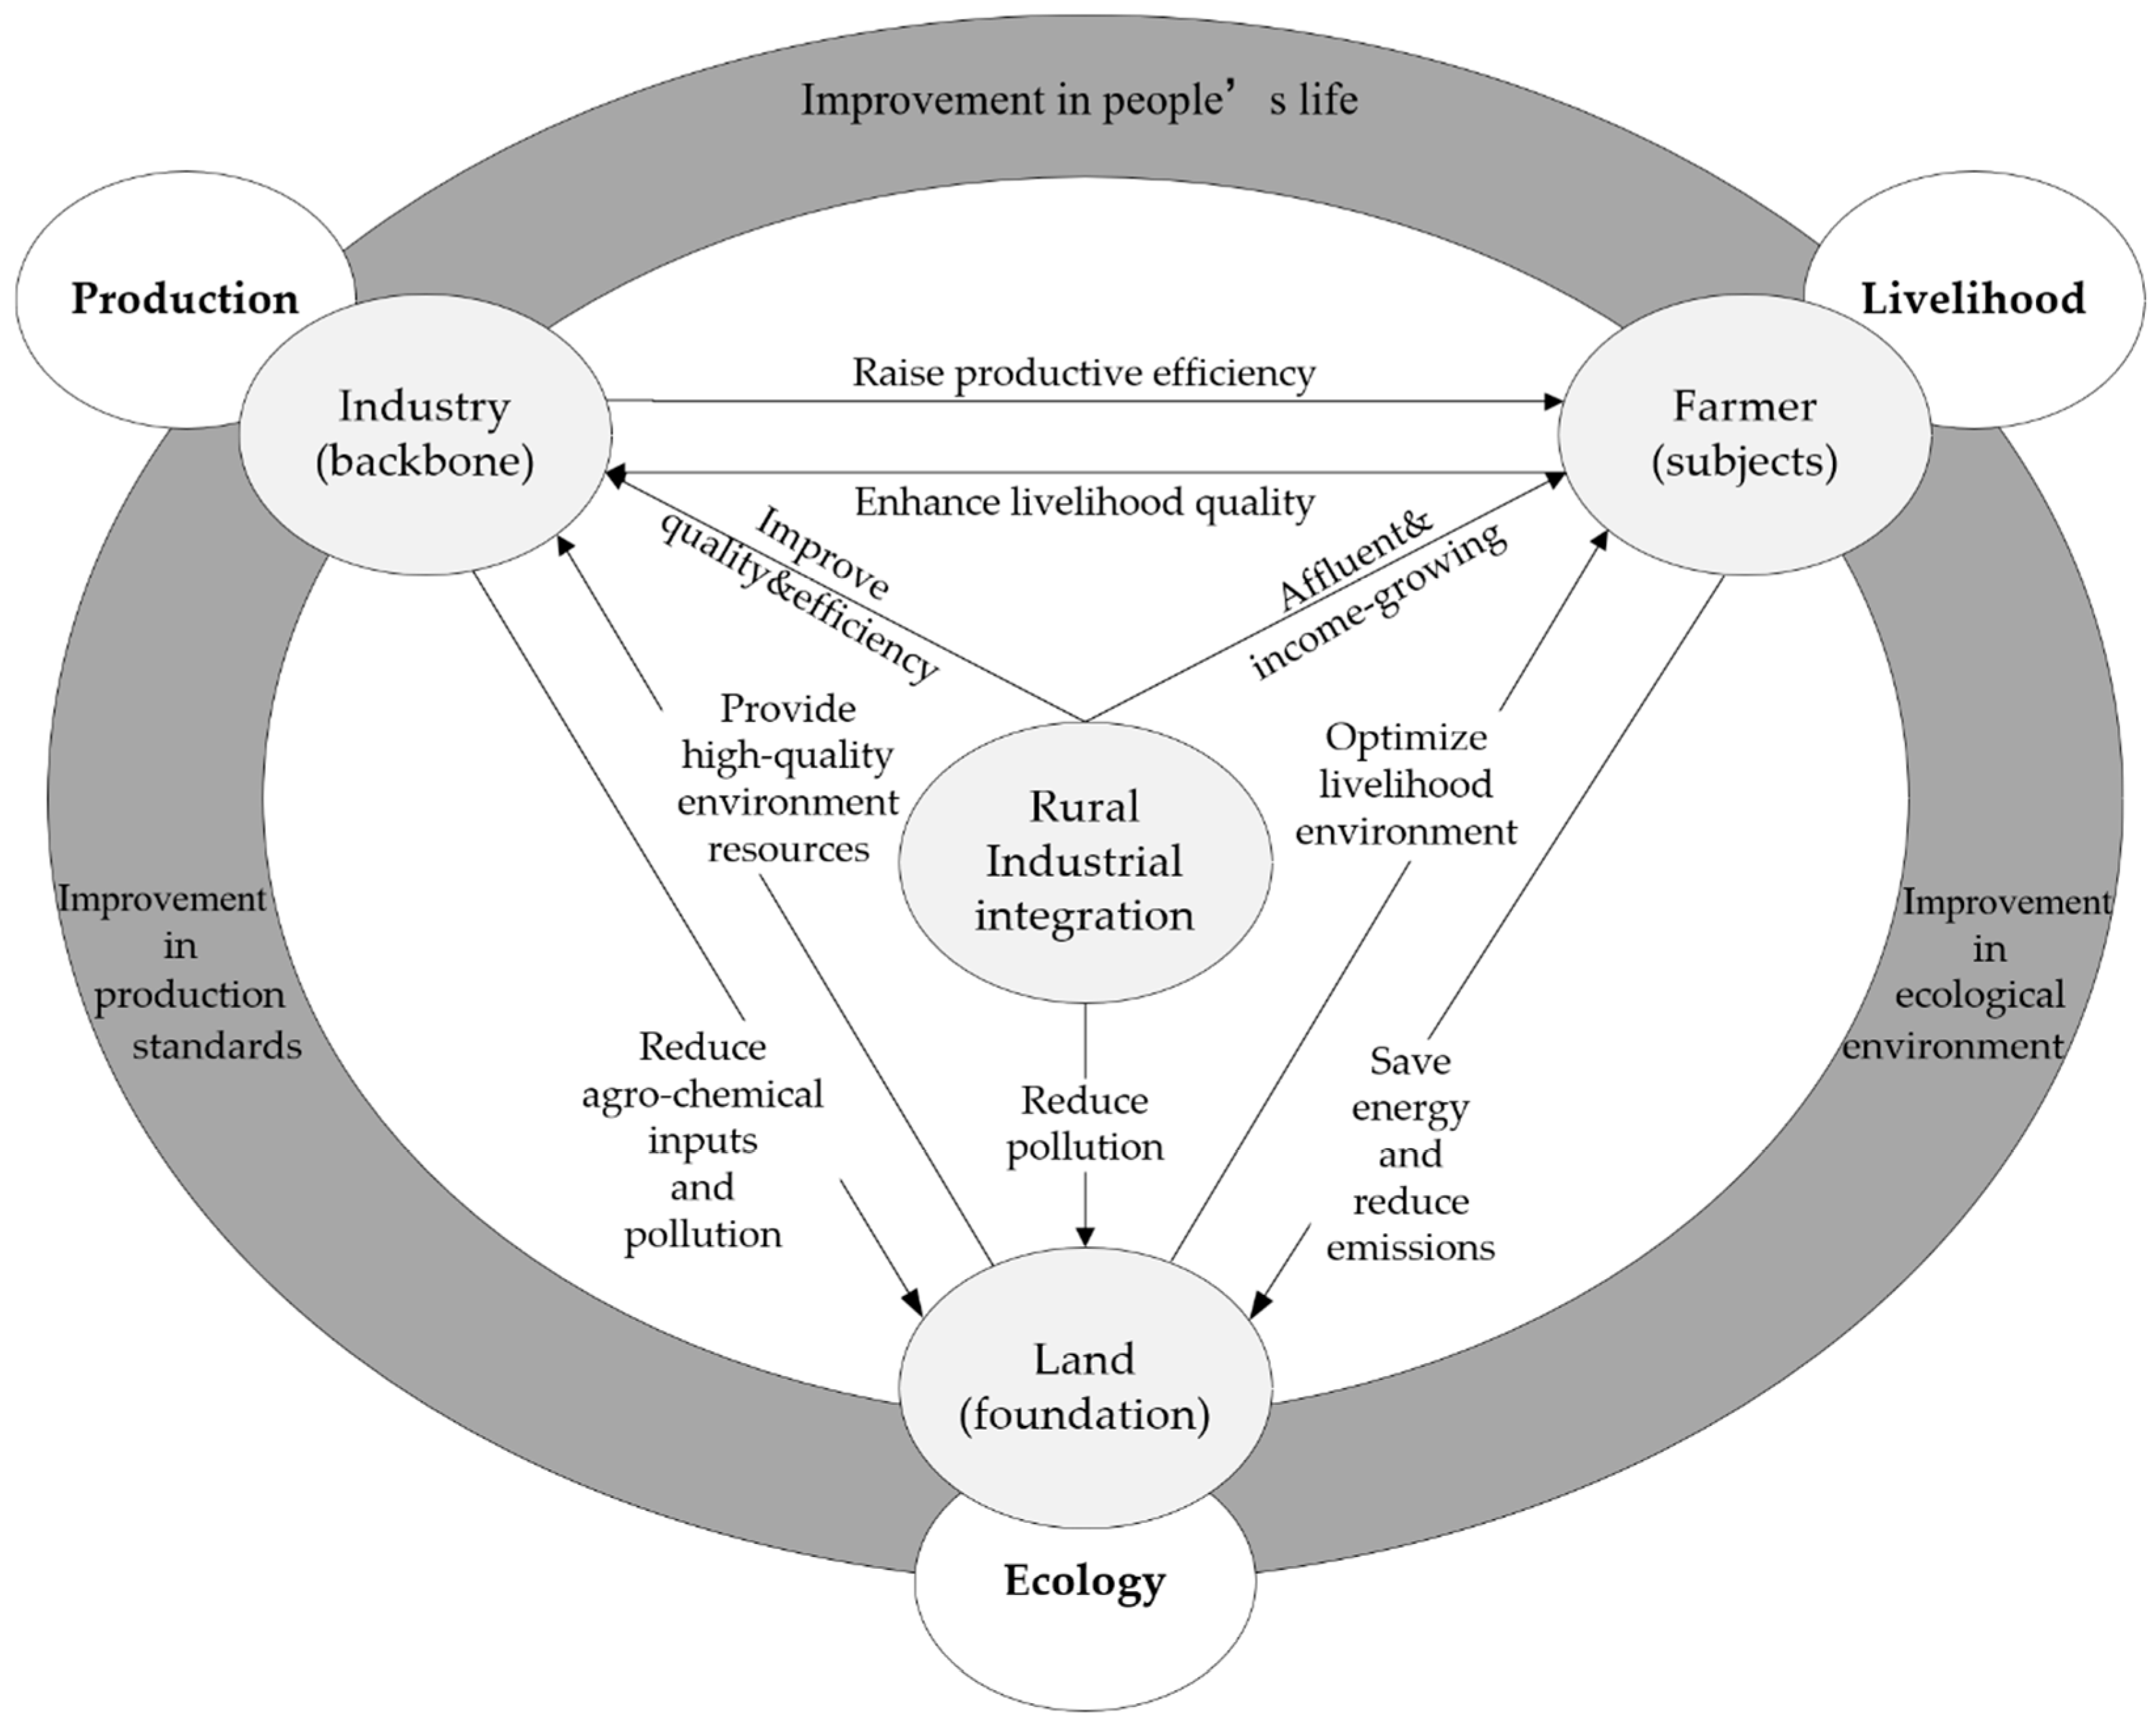
In the 1990s, Taiwan Province of China faced significant challenges in its agriculture sector, including scale reduction, labor loss, etc. In response, the “Triple Synergy of Production, Livelihood and Ecology” philosophy was put forward to promote sustainable agricultural development through agritourism, which emphasizes the harmonious integration of three key dimensions: production, livelihood, and ecology [4]. “Production” includes the formation and development of industries, which refers to the reorganization of local traditional agricultural resources, which are gathered to form a certain scale of industry and advance toward high-precision development of agriculture. “Livelihood” includes material and spiritual aspects, which refers to the improvement of rural infrastructure, living environments, and the availability of insurance and financial services to strengthen the foundation of rural livelihoods, as well as the promotion of rural culture and civil social practices to enhance residents’ sense of belonging and happiness. “Ecology” includes both natural and human-made ecosystems, focusing on preserving the original state of natural ecological resources or restoring and upgrading damaged ecosystems to create an ecological style of man-made intervention. The philosophy cleverly reconciles the conflict between development and ecological conservation. By adhering to a people-centered principle, it achieves the integrated development of production, livelihood, and ecology, offering new methods and perspectives for sustainable development paths of China’s rural industrial integration. According to Figure 1, industrial development provides a driving force for this integration, life services constitute the core content of this integration, and the ecological environment serves as the foundation of this integration.
Initially, the PLE philosophy was applied in single aspects of production, livelihood, and ecology with other fields. It was not until 2002 that this philosophy was widely used in geography research with the production–livelihood–ecology research area. In 2002, the CPC Central Committee prioritized optimizing territorial spatial development pattern as the primary measure for ecological civilization construction, and put forward “an ecologically sound space with clear waters and lush mountains, an intensive and efficient production space, and a habitable living space” as the goal, which sparked a surge in research on this philosophy [5]. Since 2015, this research has expanded beyond geography, and has begun to combine with rural landscape design, continuously broadening its application in agriculture. (1) From 2014 to 2015, the academic community directly related the concept of “Production-Livelihood-Ecology for win-win situation” to sustainable agricultural development. Zhu pointed out that agriculture was facing problems at the time, such as scarcity of arable resources, intensification of environmental pollution, and degradation of ecology. He was the first to propose that Chinese agriculture needed to take the road of “Production-Livelihood-Ecology for win-win situation”, explicitly incorporating ecological space protection into the sustainable development paths of Chinese agriculture [6]. (2) From 2016 to 2019, the research deepened from exploring functional zoning to coordination mechanisms. Wang et al. established an index system for rural production–living–ecological space function with the production–living–ecological space theory in territorial space planning, based on a coupling coordination model that was built. They revealed a spatial pattern of “high in east and low in west”, and revealed living-ecological space function should be strengthened in rural areas [7]. Zhou proposed a macro control mechanism of urban–rural layout with three lines, three spaces, and three controls, stressing that the coordinated control of permanent farmland red lines, urban development boundaries, and ecological protection lines should avoid three conceptual misunderstandings about delimitations [8]. Liu et al. created a rural development evaluation model for the rural revitalization strategy by using multi-source data such as remote sensing images, land use status data, and POI data, based on the functions of production [9]. Cao et al. clarified the concept and classification system of “ecological space, living space, and production space”, and used them to replace the conventional categorization of ecological, agricultural, and development uses in spatial planning and research [10]. Based on a survey of several rural tea gardens in Fujian Province, Liu et al. suggested a new coupling ecosystem of production, ecology, and life in mountain areas, which they refer to as “production-ecology-life” coupling tea gardens, according to the rural revitalization strategy and green development requirements for the mountain tea industry [11]. Rural multifunctional values in urban fringes are prominent at the current stage of urbanization in China. Therefore, Ma et al. developed a comprehensive method for delineating “production- living- ecological” spaces in urban fringes based on rural multifunction evaluation, focusing on Tongshan District in Xuzhou for their empirical research. The method they proposed, which delineates “production- living-ecological” spaces based on rural multifunctional evaluation, can provide a scientific basis for spatial planning [12]. (3) From 2020 to 2025, the research delved into spatial differentiation rules across multiple geographical scales, from broader provincial areas to more localized urban and rural settings [13]. It particularly highlighted the ecological vulnerabilities and the need for conflict diagnosis and remediation in sensitive areas such as karst landscapes [14], arid oases [15], and the Yellow River region [16]. Additionally, this phase included in-depth studies on the synchronization of ecological safety and high-quality growth in key strategic areas like the Yangtze River Economic Belt [17] and the lower Yellow River plains [18], aiming to provide comprehensive insights into sustainable development strategies.

2.2. Rural Industrial Integration

In a sense, rural industrial integration is a form of industrial convergence, commonly referred to in China as the integration of the primary, secondary, and tertiary industries in rural areas. A systematic review of the literature suggests that its definition can be divided into two stages, taking 2015 as a watershed year.
  • Stage I (pre-2015): Early definitions approached integration from three complementary angles. First, focusing on outcomes, rural industrial integration was understood as the blending of agricultural technologies, products, services, and markets with other sectors, thereby creating new value propositions and novel business models [19]. Second, emphasizing process, rural industrial integration was characterized as the reconfiguration of agricultural and non-agricultural goods or services to form an integrated whole under a unified set of standards [20]. Third, adopting a synthesis view, the phenomenon of rural industrial integration was framed as a resource-optimizing, innovation-driven reorganization of micro-level actors across sectoral boundaries, ultimately yielding a new agricultural form distinguished by its hybrid industrial attributes [21].
  • Stage II (post-2015): Since China’s No. 1 central document for 2015 formally proposed the notion of “integration of the primary, secondary, and tertiary industries in rural areas”, Chinese scholars have adopted a more holistic stance, integrating analyses of modalities, pathways, drivers, and outcomes of convergence. Representative perspectives are summarized in Table 1.
Identifying the challenges of rural industrial integration is tantamount to diagnosing how the traditional boundaries between the primary, secondary, and tertiary sectors become internalized within a single rural economy. Two constitutive elements are critical. First, the integration is the merger of formerly discrete sectoral actors into a single market entity or a common interest coalition. Internalization of the division of labor implies the blurring (and sometimes the complete erasure) of inter-sectoral boundaries. It is both a process and an outcome of micro-economic agents engaging in cross-sectoral production and management, thereby re-embedding functions previously distributed across different industries within one firm or an intermediary organization. Second, rural industrial integration must be based on agriculture. Adam Smith believed that the progress of labor productivity in agriculture is always lower than that in manufacturing, and its division of labor is consistently less extensive and profound than in other industries. The integration of industries breaks through the limitations of the agricultural division of labor, allowing agriculture to participate in social division of labor on a larger scale and share the developmental benefits brought about by socioeconomic progress. Objectively, it requires rural industrial integration to be anchored in agriculture while absorbing advanced elements from secondary and tertiary industries on a broader scale, thereby enhancing agricultural production efficiency and promoting agricultural modernization. Accordingly, the rural industrial integration this article proposes is the internalization of the primary–secondary–tertiary division of labor, characterized by farmers as the principal actors, rural industries as the backbone, and rural ecological environment as the foundation.

3. Adaptability and Mechanism: Rural Industrial Integration and the “Triple Synergy of Production, Livelihood and Ecology” Philosophy

As the “production–livelihood–ecology” attribute becomes increasingly salient in contemporary rural industries, it is imperative to examine both the adaptability between the philosophy and rural industrial integration and the mechanisms through which this philosophy shapes the latter.

3.1. Adaptability

3.1.1. Congruent Development Core

As shown in Figure 2, both the PLE philosophy and rural industrial integration are anchored in the same common objective: the sustainable development of the system. The PLE philosophy emphasizes a symbiotic and win–win relationship between production, livelihood, and ecology, which promotes the coordinated development of production activities, living standards, and the ecological environment to ensure long-term economic–environmental sustainability. Rural industrial integration aims to internalize the division of labor in primary, secondary, and tertiary industries, and it is necessary to focus on the development of production activities, livelihood standards, and the ecological environment to achieve sustainability in rural industrial development.

3.1.2. Mutual Implementation Vehicles

As shown in Table 2, the PLE philosophy and rural industrial integration can serve as reciprocal vehicles for one another under the shared premise of harmonizing productive activity, livelihood standards, and ecological integrity. On the one hand, rural industrial integration provides a tangible platform for translating the PLE philosophy into rural practice. As a systemic project that integrates economic, technological, ecological, and social dimensions, rural industrial integration is oriented toward sustainable development, which upgrades productive capacities, improves rural ecosystems, and diversifies farmers’ income streams while safeguarding environmental quality. Consequently, the philosophy can be grounded in, and advanced through, the concrete instruments of rural industrial integration. On the other hand, the PLE philosophy supplies a normative compass for enhancing the quality of rural industrial integration itself. By guiding the optimal allocation and efficient utilization of resources within the integration system, it raises both economic returns and environmental performance, ultimately steering rural areas toward high-quality development.

3.2. Mechanisms

3.2.1. Rural Production Activities and Industrial Integration

Under the PLE philosophy, “production” encompasses all activities tied to rural output, including state fiscal support across farm-level value chains, the resultant economic growth, and evolving organizational forms. Fiscal transfers raise the productivity of subsidized segments, thereby lengthening and deepening agricultural value chains [26]. Growth is captured through increases in primary-sector GDP, rural employment, and farmers’ incomes. Recent evidence shows that industrial integration boosts county-level entrepreneurship, with income gains most pronounced in counties where both integration and overall development are already advanced [27]. Digitization of production extends value chains and multiplies agriculture’s non-food functions, catalyzing new rural business models and exerting a positive, technology-mediated influence on integration [28]. Novel organizational vehicles, such as farmers’ cooperatives, leading agribusiness firms, and other intermediaries, aggregate information and, critically, shape the benefit-sharing mechanisms that underpin rural industrial integration [29].

3.2.2. Rural Livelihood and Industrial Integration

Within the PLE philosophy, “livelihood” denotes improvements in rural infrastructure, the built environment, and the protective functions delivered by insurance and financial services. The emergence of new business models, for example, rural e-commerce and live-streaming commerce, has uncovered vast, still-untapped consumer potential across the countryside. Consequently, fiscal resources are being channeled into digital infrastructure and multi-chain, integrated development schemes to accelerate industrial integration and, ultimately, deliver common prosperity [30]. Upgrades to the rural living environment are state-led. Robust public services and high-quality infrastructure not only institutionalize balanced rural development but also entice returnee entrepreneurs back to their hometowns. Agricultural insurance further underwrites this process by compensating farmers for losses under extreme conditions, thereby cushioning operational risk and stabilizing both production and livelihoods [31].

3.2.3. Rural Ecological Environment and Industrial Integration

Within the PLE philosophy, the rural ecological environment encompasses soil-chemical conditions, the stock and quality of ecological resources, and the effectiveness of conservation efforts. This environment constitutes the biophysical foundation for rural industrial integration; conversely, unsustainable farming practices degrade it and thereby impede long-term integration. First, maintaining or increasing yields in deteriorating environments requires escalating input use, generating surplus fertilizer, pesticide, and energy expenditures. Second, treating pollution abatement as a factor of production raises marginal abatement costs, pushing overall production costs upward. In the context of China’s carbon peaking and carbon neutrality goals, rural regions must therefore shift from coal-dominant energy systems to electricity, wind, and other clean sources. Leveraging abundant local renewables, these low-carbon energy streams can power processing, logistics, and digital services more efficiently, unlocking new drivers of economic growth and rural industrial integration while simultaneously safeguarding ecological integrity.

4. Evaluation of China’s Rural Industrial Integration Levels

Before employing a system dynamics model to identify the optimal path for sustainable rural industrial integration, it is necessary to establish an empirically grounded picture of current national performance. To this end, this section extracts textual corpora from academic journals and policy documents dealing with rural industrial integration by means of an LDA topic model. The resulting cluster structure informs the construction of an evaluation index system that operationalizes the PLE philosophy. Entropy-weighting is then applied to produce a composite index of rural industrial integration levels across China.

4.1. Evaluation Index System Construction Based on LDA Topic Model

Evaluation indicator construction must satisfy the principles of hierarchy, representativeness, and quantifiability. Accordingly, we combine the topic clusters and term-frequency statistics generated by LDA to build the evaluation indicator system of China’s rural industrial integration. The workflow is illustrated in Figure 3.

4.1.1. Text Acquisition and Pre-Processing

The textual corpus for LDA-based analysis is assembled from two authoritative sources: (1) peer-reviewed CSSCI journal articles retrieved from CNKI using the search strings “rural industrial integration”, “rural three-sector integration”, and “rural primary–secondary–tertiary integration”; (2) national and local policy documents located on the PKULAW platform with the same keywords.
To isolate policy content pertinent to rural industrial integration, we first filtered the corpus by keyword and retained only relevant excerpts. Pre-processing was performed in Python 3.13: (1) HIT’s stop-word list was applied to remove noise; (2) Jieba segmentation, augmented by a custom dictionary of compound terms, prevented over-splitting; and (3) an HMM with the Viterbi algorithm resolved out-of-vocabulary tokens.

4.1.2. LDA Topic Extraction

The LDA topic model, introduced by Blei et al. while investigating the parameter-explosion problem in PLSA, is a generative probabilistic framework that infers latent themes from textual corpora. Owing to its robustness and interpretability, it has become a standard instrument in policy research.
  • Identifying the Optimal Number of Topics
The choice of k critically determines the quality of an LDA solution. Lower perplexity indicates superior predictive performance. Hence, we employ perplexity to select k. The measure is defined as follows.
P e r p l e x i t y D = e x p ( m = 1 M log D p ( w m ) m = 1 M N m )
p w m = d n = 1 T j = 1 T p w i z i = j ) × ( z j = j | w m ) × ( d )
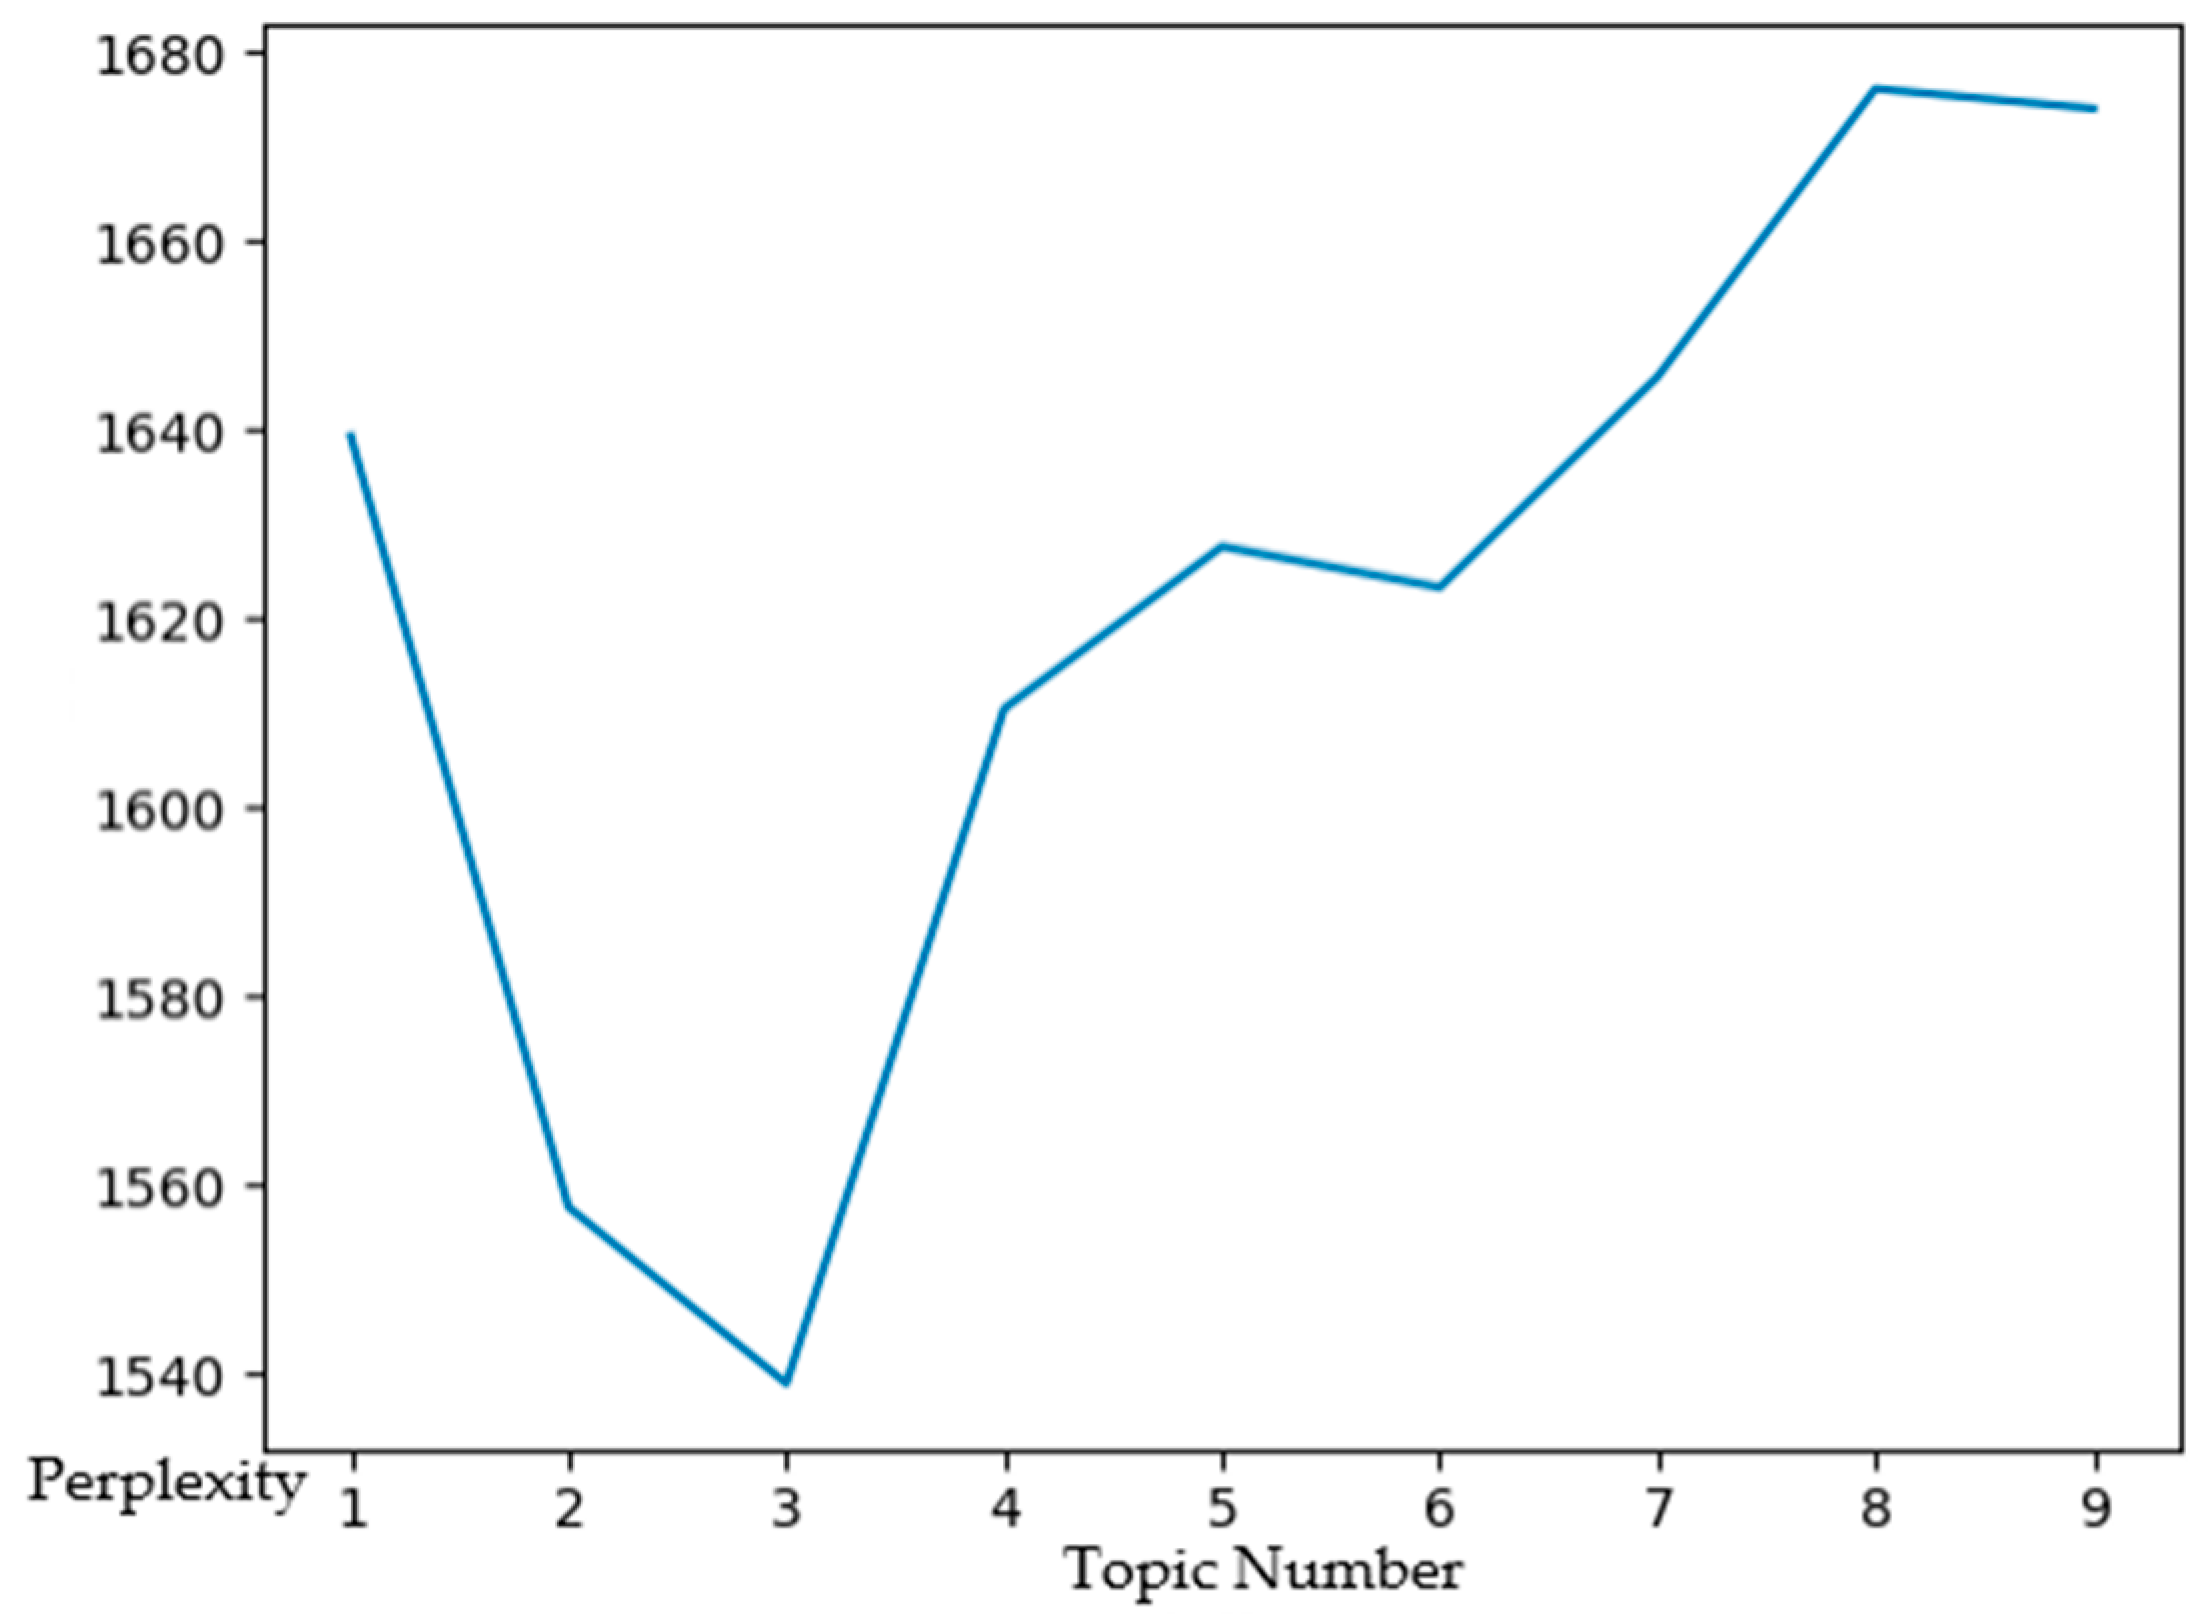
Let D denote the test corpus drawn from the full text collection, M the number of documents in that collection, Nm the number of word tokens in the document, and p(wm) the probability of wm. Selecting an excessively large number of topics reduces inter-topic distinctiveness and yields ambiguous results. We therefore evaluated topic counts from 1 to 9. As illustrated in Figure 4, the perplexity reaches its minimum when the number of topics equals 3. Accordingly, we set N = 3 as the optimal topic number for the rural industrial integration corpus.
2.
Topic Clustering and Keyword Frequency Analysis
With the optimal topic number fixed at N = 3 via perplexity, the characteristic words for each latent topic are reported in Table 3. When mapped onto the rural industrial integration context, the three topics correspond directly to the triadic dimensions of the “Production–Livelihood–Ecology” philosophy.
The term-frequency profile of the LDA-derived keywords offers a concise map of the salient issues commanding the attention of both policymakers and scholars in the field of rural industrial integration. As shown in Table 4, at present, the policy agenda is focused on deepening the convergence of agro-processing and green ecological industries. By mobilizing resources from rural tourism, modern agriculture, and cooperatives, this strategy seeks to extend agricultural value chains and thereby raise the aggregate value added, manifesting most visibly in the rapid expansion of rural leisure and sightseeing activities. These initiatives not only diversify consumer recreation options but also open entirely new revenue streams for rural economies and stimulate local employment. Meanwhile, intelligent and digital technologies are being diffused throughout the agricultural sector, catalyzing a paradigmatic shift in production models, raising on-farm productivity, and safeguarding product quality. Equally significant is the emergence of new types of agribusiness entities—cooperatives, family farms, and other collective forms—that are steadily expanding in scale and scope. Their growth is paralleled by the progressive refinement of rural socialized service systems, driving agriculture towards greater specialization, organization, and socialization.
Throughout this process, the protection of natural resources and the ecological environment remains a guiding imperative. This commitment ensures that economic and social development in rural areas proceeds along a sustainable trajectory, enabling the simultaneous advancement of production, livelihood standards, and ecological integrity
3.
Evaluation Index System Construction
Guided by the LDA-derived topic clusters and the principles of hierarchy, representativeness, and quantifiability, we construct a 29-index system that operationalizes rural industrial integration within the “Triad Integration of Production, Livelihood and Ecology” framework, as shown in Table 5. All indicators are sourced from the China Statistical Yearbook and China Rural Statistical Yearbook, except for “operating revenue of leisure agriculture”, which is compiled from announcements by central ministries and provincial governments. The indicator “Fiscal expenditure for consolidating poverty-alleviation achievements and advancing rural revitalization” uses the series “central fiscal expenditure on poverty alleviation” prior to 2020; after the national poverty-eradication target was declared achieved in 2020, the statistical definition was adjusted to reflect the shift toward rural revitalization.
Production indicators capture the structural upgrading and modernization of the rural economy.
  • The GDP of the primary sector measures the aggregate scale of primary-industry activity and directly reflects the agricultural dimension of integration;
  • The rural employment situation counts rural workers;
  • Per capita disposable income of rural residents is the most immediate standard measurement of integration success;
  • Central government fiscal expenditure on agriculture, forestry and water affairs describes state funds channeled into rural development, which boosts farm incomes and reveals latent consumption growth;
  • The total power of agricultural machinery—the sum of rated power of all farm machines—marks the pace of agricultural mechanization and uptake of advanced equipment;
  • The agro-processing industry output (operating revenue of processing enterprises) captures value addition and the depth of agriculture–secondary-industry integration;
  • New-product projects in above-scale agro-processing enterprises reflect technology spill-overs from integrated production;
  • Rural retail sales measure turnover of consumer goods in rural retail outlets and mirrors local market vitality;
  • Rural household investment in services (fixed-asset investment in wholesale, retail, transport, storage, and postal services) indicates commitment to rural special industries and the breadth of agriculture–service integration;
  • Rural household investment in accommodation and catering underpins visitor infrastructure and diversification into agritourism; it is a direct proxy for farmer-level capital allocation to leisure agriculture;
  • The rural entrepreneurship activity index—defined as the ratio of rural private-enterprise plus self-employed workers to the total rural population—infuses integration with new dynamism;
  • The number of rural cooperatives signals cooperative intensity in production, fosters scaled and intensive management, and improves benefit-sharing among farmers.
  • The operating revenue of leisure agriculture captures income generated by leisure-oriented activities and provides evidence for primary–tertiary sector convergence.
Livelihood indicators capture the human, social, and technological foundations of rural industrial integration.
  • Share of rural population records the proportion of rural residents in the total population;
  • The number of senior-secondary graduates in rural areas reflects rising educational levels in rural areas and provides a cohort of knowledgeable, skilled workers for integration, underscoring human-capital gains within the process;
  • Length of rural postal delivery routes measures the total length of delivery networks in rural areas and serves as a proxy for digital-logistics infrastructure.
  • The amount of rural broadband subscribers gauges the penetration of high-speed internet and underpins the digital layer of rural industrial integration;
  • Agricultural insurance coverage provides risk protection, strengthens farmers’ resilience to natural disasters and market shocks, and safeguards the continuity of agricultural production, reflecting the maturity of rural social services;
  • Fiscal expenditure for consolidating poverty-alleviation achievements and advancing rural revitalization captures central transfers earmarked for the transition from poverty eradication to rural revitalization;
  • The number of rural residents receiving minimum living allowances records the number of beneficiaries under rural subsistence schemes.
Ecology indicators capture the extent to which rural industrial integration safeguards and enhances the natural resource base on which agriculture depends.
  • Chemical fertilizer application, pesticide use and agricultural plastic film use quantify anthropogenic inputs to farmland; while moderate use can raise short-term yields, excessive application degrades soil health and surrounding ecosystems, thereby contravening long-term sustainability objectives;
  • Soil-erosion control area and water-saving irrigation area measure physical interventions that conserve soil and water, directly evidencing environmental stewardship within the integration process;
  • National afforestation area reflects large-scale ecological restoration efforts and the expansion of rural green infrastructure;
  • The number of solar water heaters in rural areas reflects the uptake of renewable and efficient energy technologies, signaling a shift toward low-carbon rural production and consumption patterns.

4.2. Measuring the Level of Rural Industrial Integration Based on the Entropy Method

4.2.1. Entropy Method

As an objective weighting technique, the entropy method is widely employed to assess the level of technological innovation. It derives the weight of each indicator from its information entropy, the degree of dispersion in the indicator’s observed values, so that the resulting weights faithfully reflect each variable’s relative importance to the overall objective. The procedure is as follows:
  • Dimensionless processing
Apply the range-normalization method to standardize every indicator, constraining all values to the closed interval [0, 1].
For positive indicators:
X i j = X X m i n X m a x X m i n
For negative indicators:
X i j = X m a x X X m a x X m i n
  • Translation of the normalized data:
P i j = X i j i = 1 m X i j
  • Compute the entropy:
e j = k i = 1 m P i j ln P i j
  • Calculate the coefficient of variation:
g i = 1 e j
  • Calculate the weight:
W i = g j j = 1 n g j
  • Compute the composite index of rural industrial integration:
F j = j = 1 n W j X j

4.2.2. Results and Discussion

  • Indicator Weights for Rural Industrial Integration
Using the entropy method procedure described above, we obtain the indicator weights reported in Table 6. Within the triad-integration framework, rural production activities exert the strongest influence on integration, accounting for 43.653% of the total weight, followed by rural livelihood standards at 32.945% and rural ecological levels at 23.402%.
At the secondary-indicator level, the six variables with the largest individual weights are
  • Rural household investment in accommodation and catering;
  • Length of rural postal delivery routes;
  • Chemical fertilizer application;
  • Pesticide use;
  • Agricultural insurance coverage;
  • New-product projects in above-scale agro-processing enterprises.
Weight analysis reveals clear sectoral priorities within the triad-integration framework:
  • Production activities
The two highest-weight indicators, (i) new-product projects in above-scale agro-processing enterprises and (ii) agro-processing industry operating revenue, are both positive, confirming that upgrading processing capacity and innovation intensity are powerful levers for integration. The large weights of the GDP of the primary sector, rural employment situation, and per capita disposable income underscore that a solid economic base, expanding job opportunities, and rising household incomes remain indispensable to the integration process. Meanwhile, the total power of agricultural machinery, number of rural cooperatives, and operating revenue of leisure agriculture highlight the catalytic roles played by agricultural modernization, new cooperative organizations, and rural tourism.
  • Livelihood standards
The high weights of length of rural postal delivery routes and the number of rural broadband subscribers show that improvements in information, communication, and transport infrastructure exert a strong positive effect on integration. The substantial weights of agricultural insurance coverage and fiscal expenditure for consolidating poverty-alleviation achievements and advancing rural revitalization indicate that risk-mitigation instruments and targeted fiscal transfers are also critical enablers.
  • Ecology level
The large negative weights of chemical fertilizer use, agricultural plastic-film use, and pesticide use point to significant ecological pressures, signaling the need for more prudent chemical input management. Conversely, the positive weights of soil-erosion control area, water-saving irrigation area, and national afforestation area confirm that ecological protection and sustainable-development principles must be prioritized if rural industrial integration is to remain viable over the long term.
2.
Annual Evaluation Index Results of China’s Rural Industrial Integration
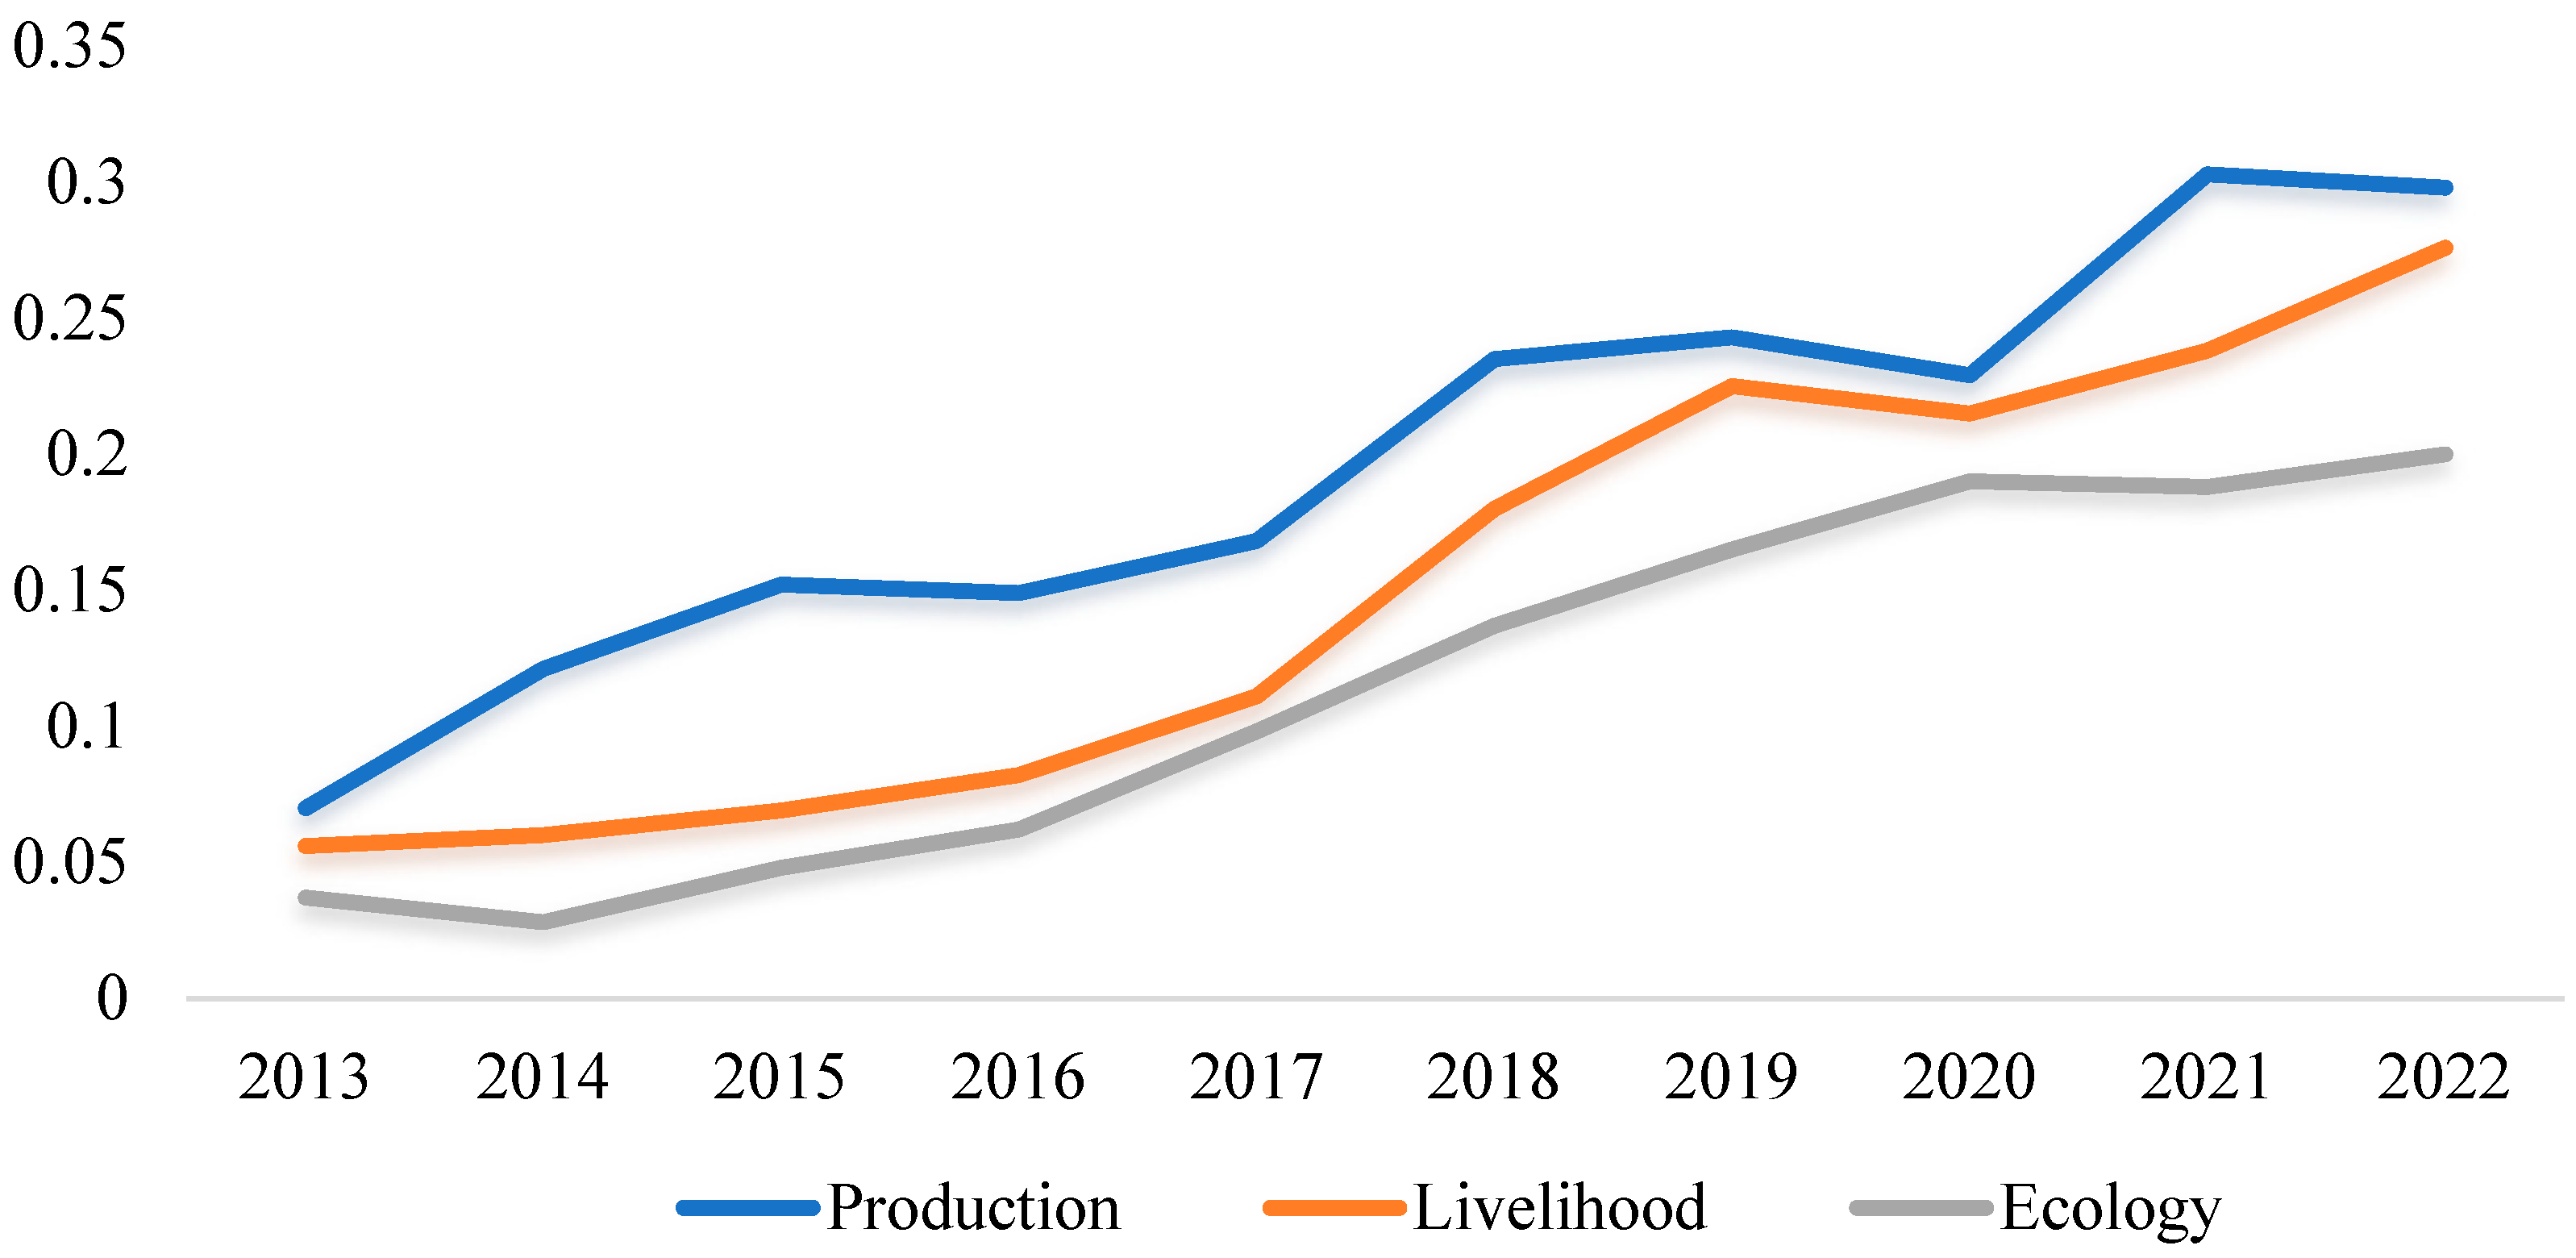
As shown in Table 7, we computed annual composite indices for each primary dimension and plotted their trends in Figure 5.
The composite index of rural industrial integration rose continuously from 2013 to 2022, accelerating markedly after 2015. This inflection coincides with the Central No. 1 Document for 2015 that formally launched the national strategy for integrating the primary, secondary, and tertiary sectors in rural areas, and with the subsequent surge in policy and financial support.
Viewed through the production–livelihood–ecology integration lens, scores for all three dimensions have trended upward.
  • Production
Between 2013 and 2019 the production index climbed from 0.070 to 0.243 (a 3.47-fold increase). The 2020 downturn, driven by external shocks, was reflected in reduced rural retail sales, lower fixed-asset investment in accommodation and catering, and contractions in cooperative numbers and leisure-agriculture revenue—each dampening the overall integration trajectory.
  • Livelihood
The livelihood dimension improved even more rapidly: from 0.056 in 2013 to 0.225 in 2019 (a 4.01-fold rise). Enhanced rural infrastructure, together with the penetration of live-streaming and e-commerce, provided a platform for higher farm incomes and expanded employment. Again, 2020 saw a temporary reversal as cultural–recreational consumption and the length of rural postal delivery routes stagnated, slowing progress.
  • Ecology
Despite occasional retracements, the ecology index recorded the strongest relative growth—from 0.037 in 2013 to 0.190 in 2020 (a 5.14-fold increase). Although this dimension carries the lowest weight in the composite index, its sustained ascent reflects the intensifying national focus on low-carbon, green, and energy-efficient rural development. The rising score demonstrates that eco-friendly practices and lifestyles are already generating positive feedback loops for ecological protection and sustainable rural growth.
Notably, after the 2020 shock, all three dimensions rebounded strongly, and rural industrial integration has become more resilient and continues to deepen.

5. Sustainable Development Paths for Rural Industrial Integration

This section deploys a system dynamics approach to explore the causal relationships embedded in this complex system and sustainable development paths for rural industrial integration. Building upon the empirical findings presented earlier, we construct a stock-and-flow model of the rural integration system and subject it to simulation experiments. The resultant scenarios illuminate leverage points and policy levers, thereby furnishing a forward-looking roadmap for the long-term development of rural industrial integration.

5.1. Methods

System dynamics is the trans-disciplinary study of information-feedback systems. Grounded in systems thinking, it constructs formal models from causal feedback loops among endogenous variables and simulates their behavior over time. Its principal strength lies in coping with high-order, non-linear complexity, thereby exposing the underlying mechanisms and evolutionary trajectories of social–ecological systems.
Conventional econometric approaches typically handle only a limited set of variables, making them ill-suited to capture the dense web of causal relations and optimization pathways that characterize rural industrial integration. In addressing this limitation, we adopt system dynamics for three principal reasons.
  • Multifactor complexity
Rural industrial integration involves heterogeneous actors—farmers, cooperatives, processors, financial institutions, and local governments—whose interactions are non-linear, feedback-rich, and temporally layered. System dynamics explicitly models these cross-sectoral, multi-agent relationships, thereby clarifying how variables reinforce or counteract one another and revealing the dynamic trajectories that lead to rural prosperity.
  • Feedback-driven uncertainty
Within the integration system, positive feedback amplifies growth (e.g., successful processing firms attract downstream service providers), while negative feedback can dampen or destabilize development (e.g., excessive regulatory intervention). System-dynamics models incorporate both loops, allowing us to explore how the system self-regulates under alternative policy regimes.
  • Long-run dynamic analysis
Integration is an inherently long-term process in which factors evolve at different speeds: digital infrastructure diffuses rapidly, ecological capital changes slowly, and policy effects may lag by several years. System dynamics captures these heterogeneous timescales, enabling us to distinguish short-term fluctuations from medium- and long-term trends and to design temporally coherent policy sequences.

5.2. System Dynamics Model Construction for Rural Industrial Integration

5.2.1. Subsystem and Causal Loop Diagram

The system boundary is defined by the LDA topic-clustering results reported in Section 4. Rural industrial integration is therefore partitioned into three mutually interacting subsystems: the rural production subsystem, rural livelihood subsystem, and rural ecological subsystem. The diagram is provided in Appendix A.
  • Rural Production Subsystem
The rural production subsystem denotes the systematic introduction of state-of-the-art equipment, digital information technologies, and a suite of new business models that jointly raise agricultural output and stimulate frequent entrepreneurial activity in rural areas, thereby fostering the convergence of rural industries. For analytical purposes, we employ three principal indicators: (i) rural retail sales, which proxy the level of retail activity and local purchasing power; (ii) new-product projects in above-scale agro-processing enterprises, which captures the depth of integration between agriculture and the secondary sector; and (iii) total agricultural machinery power, which reflects the degree of mechanization in primary production.
Fiscal transfers to rural regions can reactivate under-utilized resources and endow production processes with science- and technology-enabled capabilities, leading to higher yields and greater productive efficiency. Indigenous technological innovation further refines production workflows, extends value chains, and augments the value added throughout the agri-food system. Concurrently, novel rural organizational forms, which have been characterized by multi-stakeholder participation, integrate heterogeneous resources and forge robust interest-linkage mechanisms among actors, thereby facilitating business-model innovation and accelerating the integrated development of rural industries.
2.
Rual Livelihood Subsystem
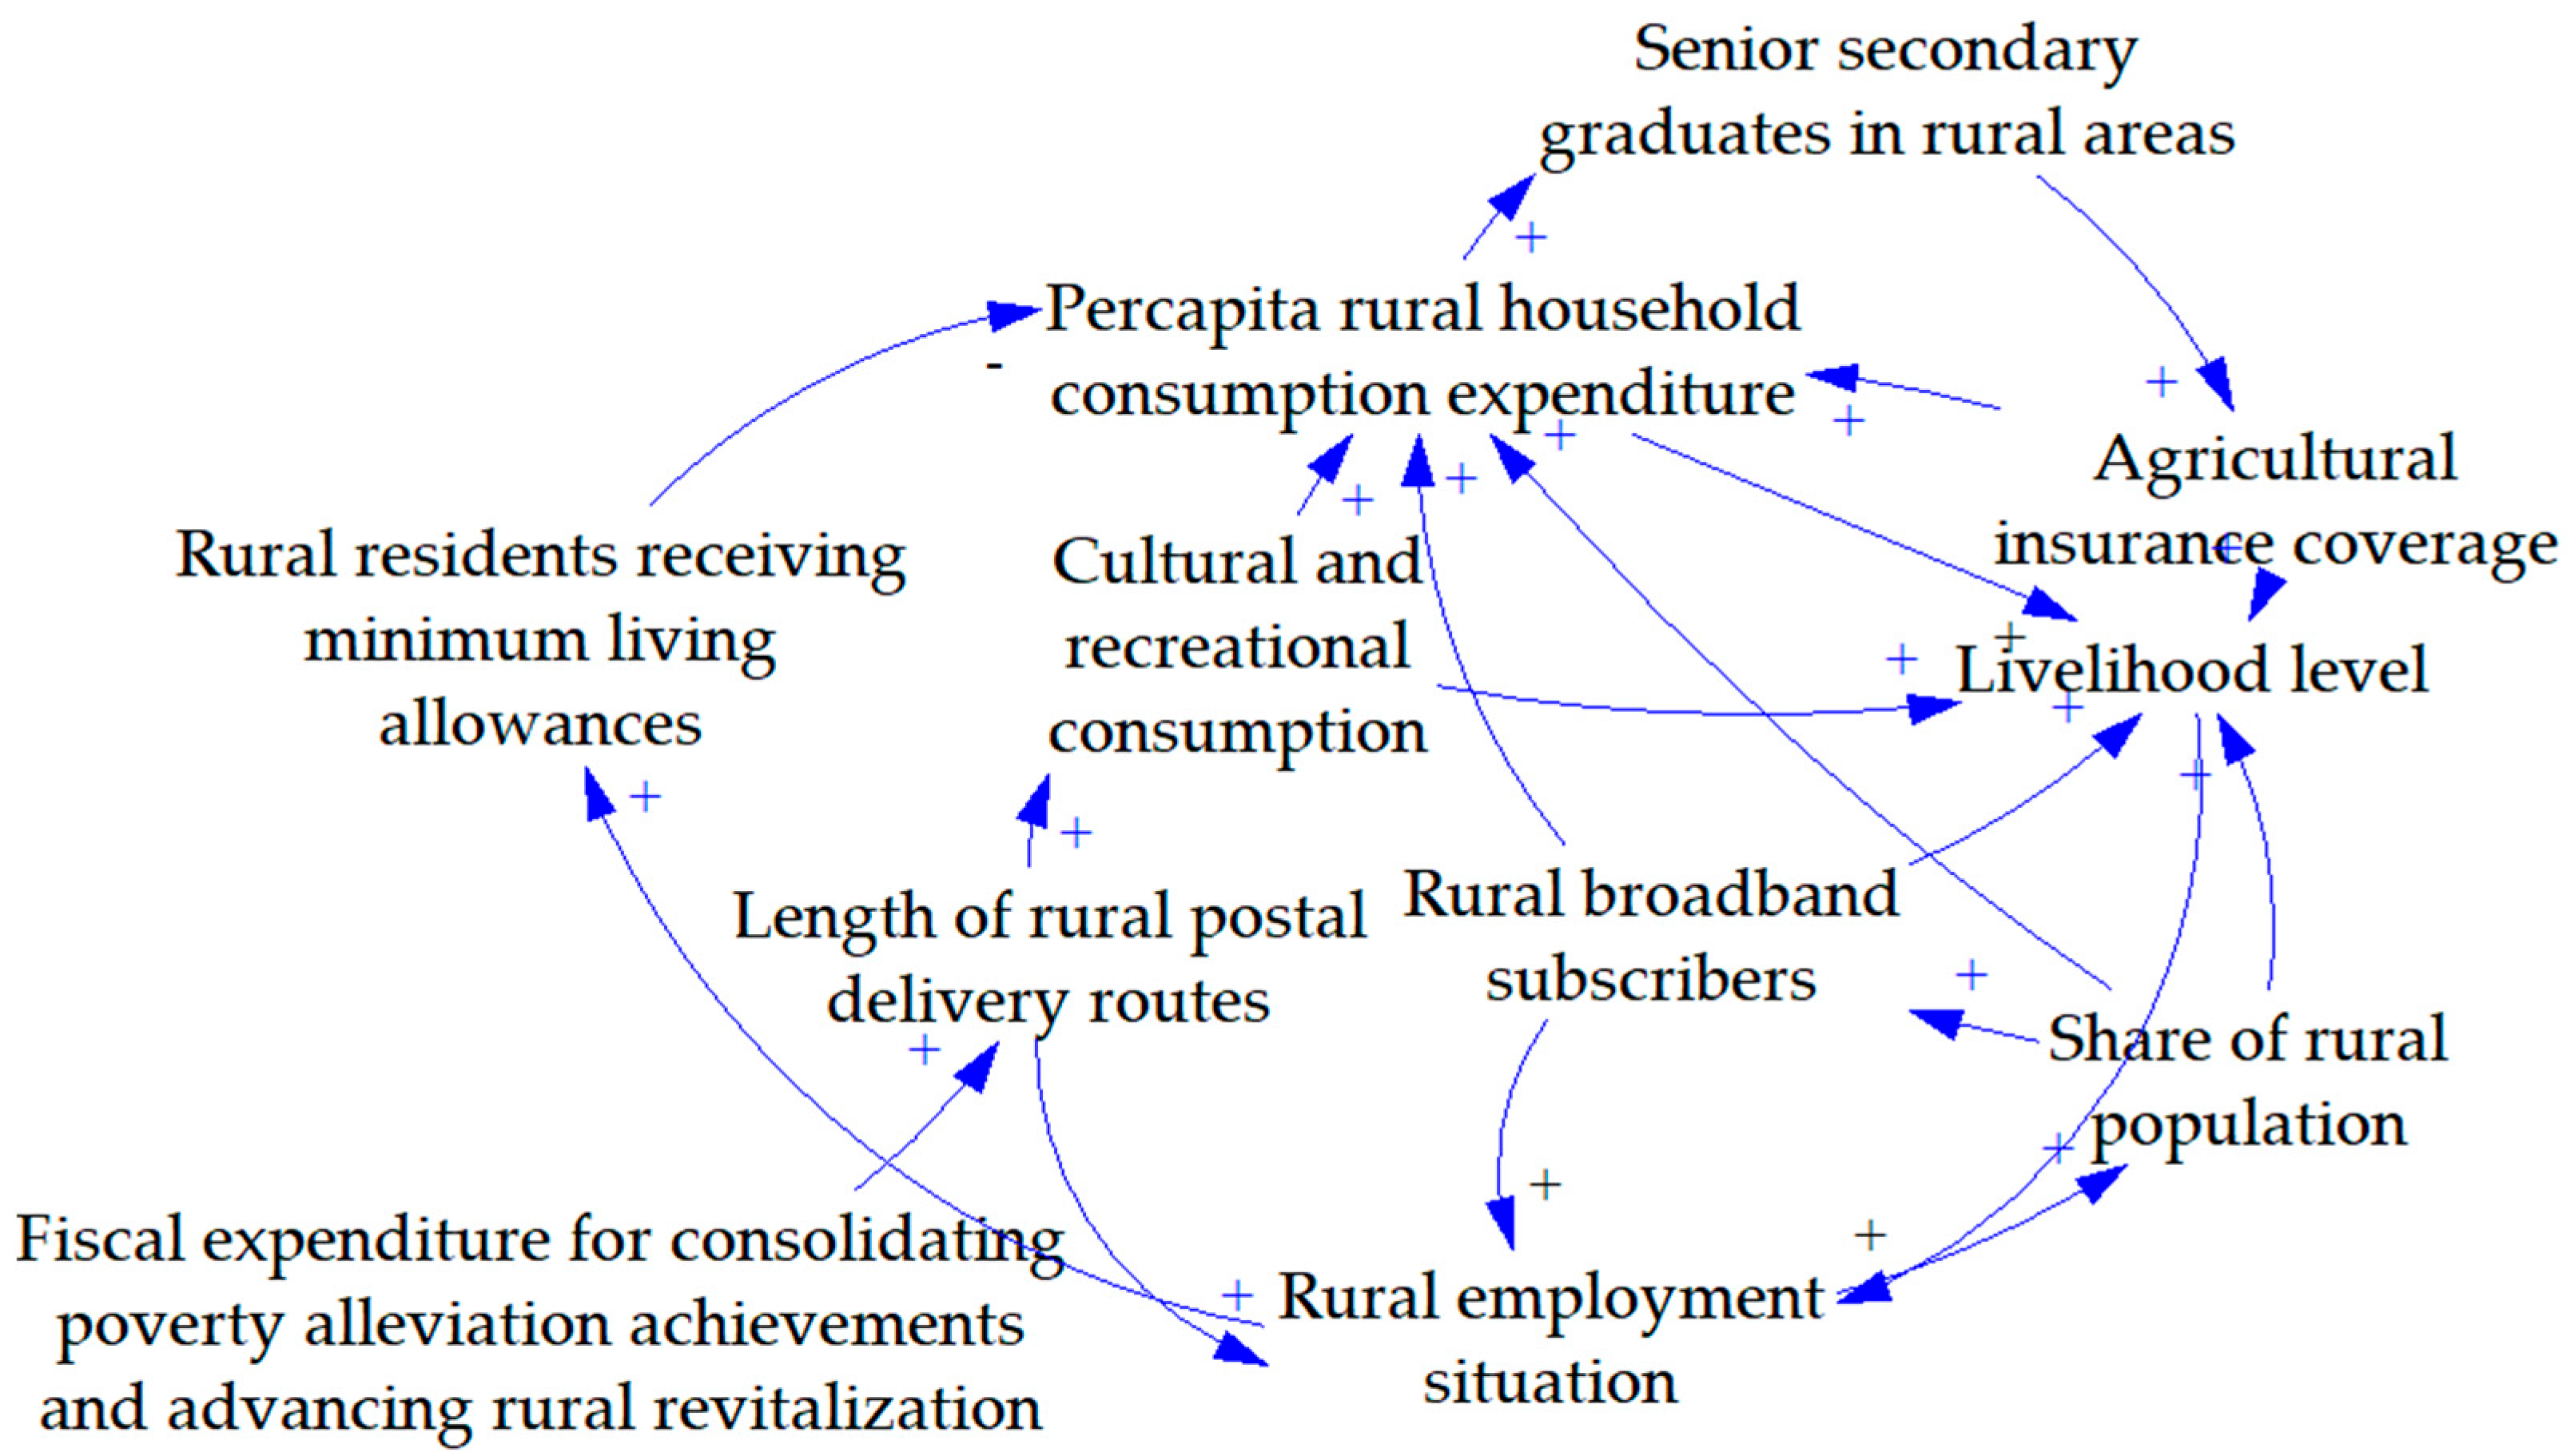
The rural livelihood subsystem must be conceptualized not only with reference to variables that directly shape rural residents’ incomes and employment prospects, but also with regard to the broader living environment in which these economic processes are embedded. The proliferation of internet connectivity has enabled e-commerce and modern logistics to penetrate rural localities, unlocking the latent value of agricultural products and, in turn, augmenting household incomes. Accordingly, this study operationalizes the rural living subsystem through four salient indicators: (i) rural broadband subscribers, which proxy the intensity of digital infrastructure; (ii) length of rural postal delivery routes, which captures the depth of last-mile logistics networks; (iii) expenditure on cultural and leisure consumption, which indexes non-material aspirations and quality-of-life improvements; and (iv) the share of rural population, which reflects local employment capacity.
Collectively, these variables illuminate the internal mechanisms through which rural industrial convergence translates into elevated living standards. The causal loop diagram of the rural living subsystem encapsulates the mutually reinforcing relationship between rising farm incomes and the continuous upgrading of rural public infrastructure.
3.
Rural Ecological Subsystem
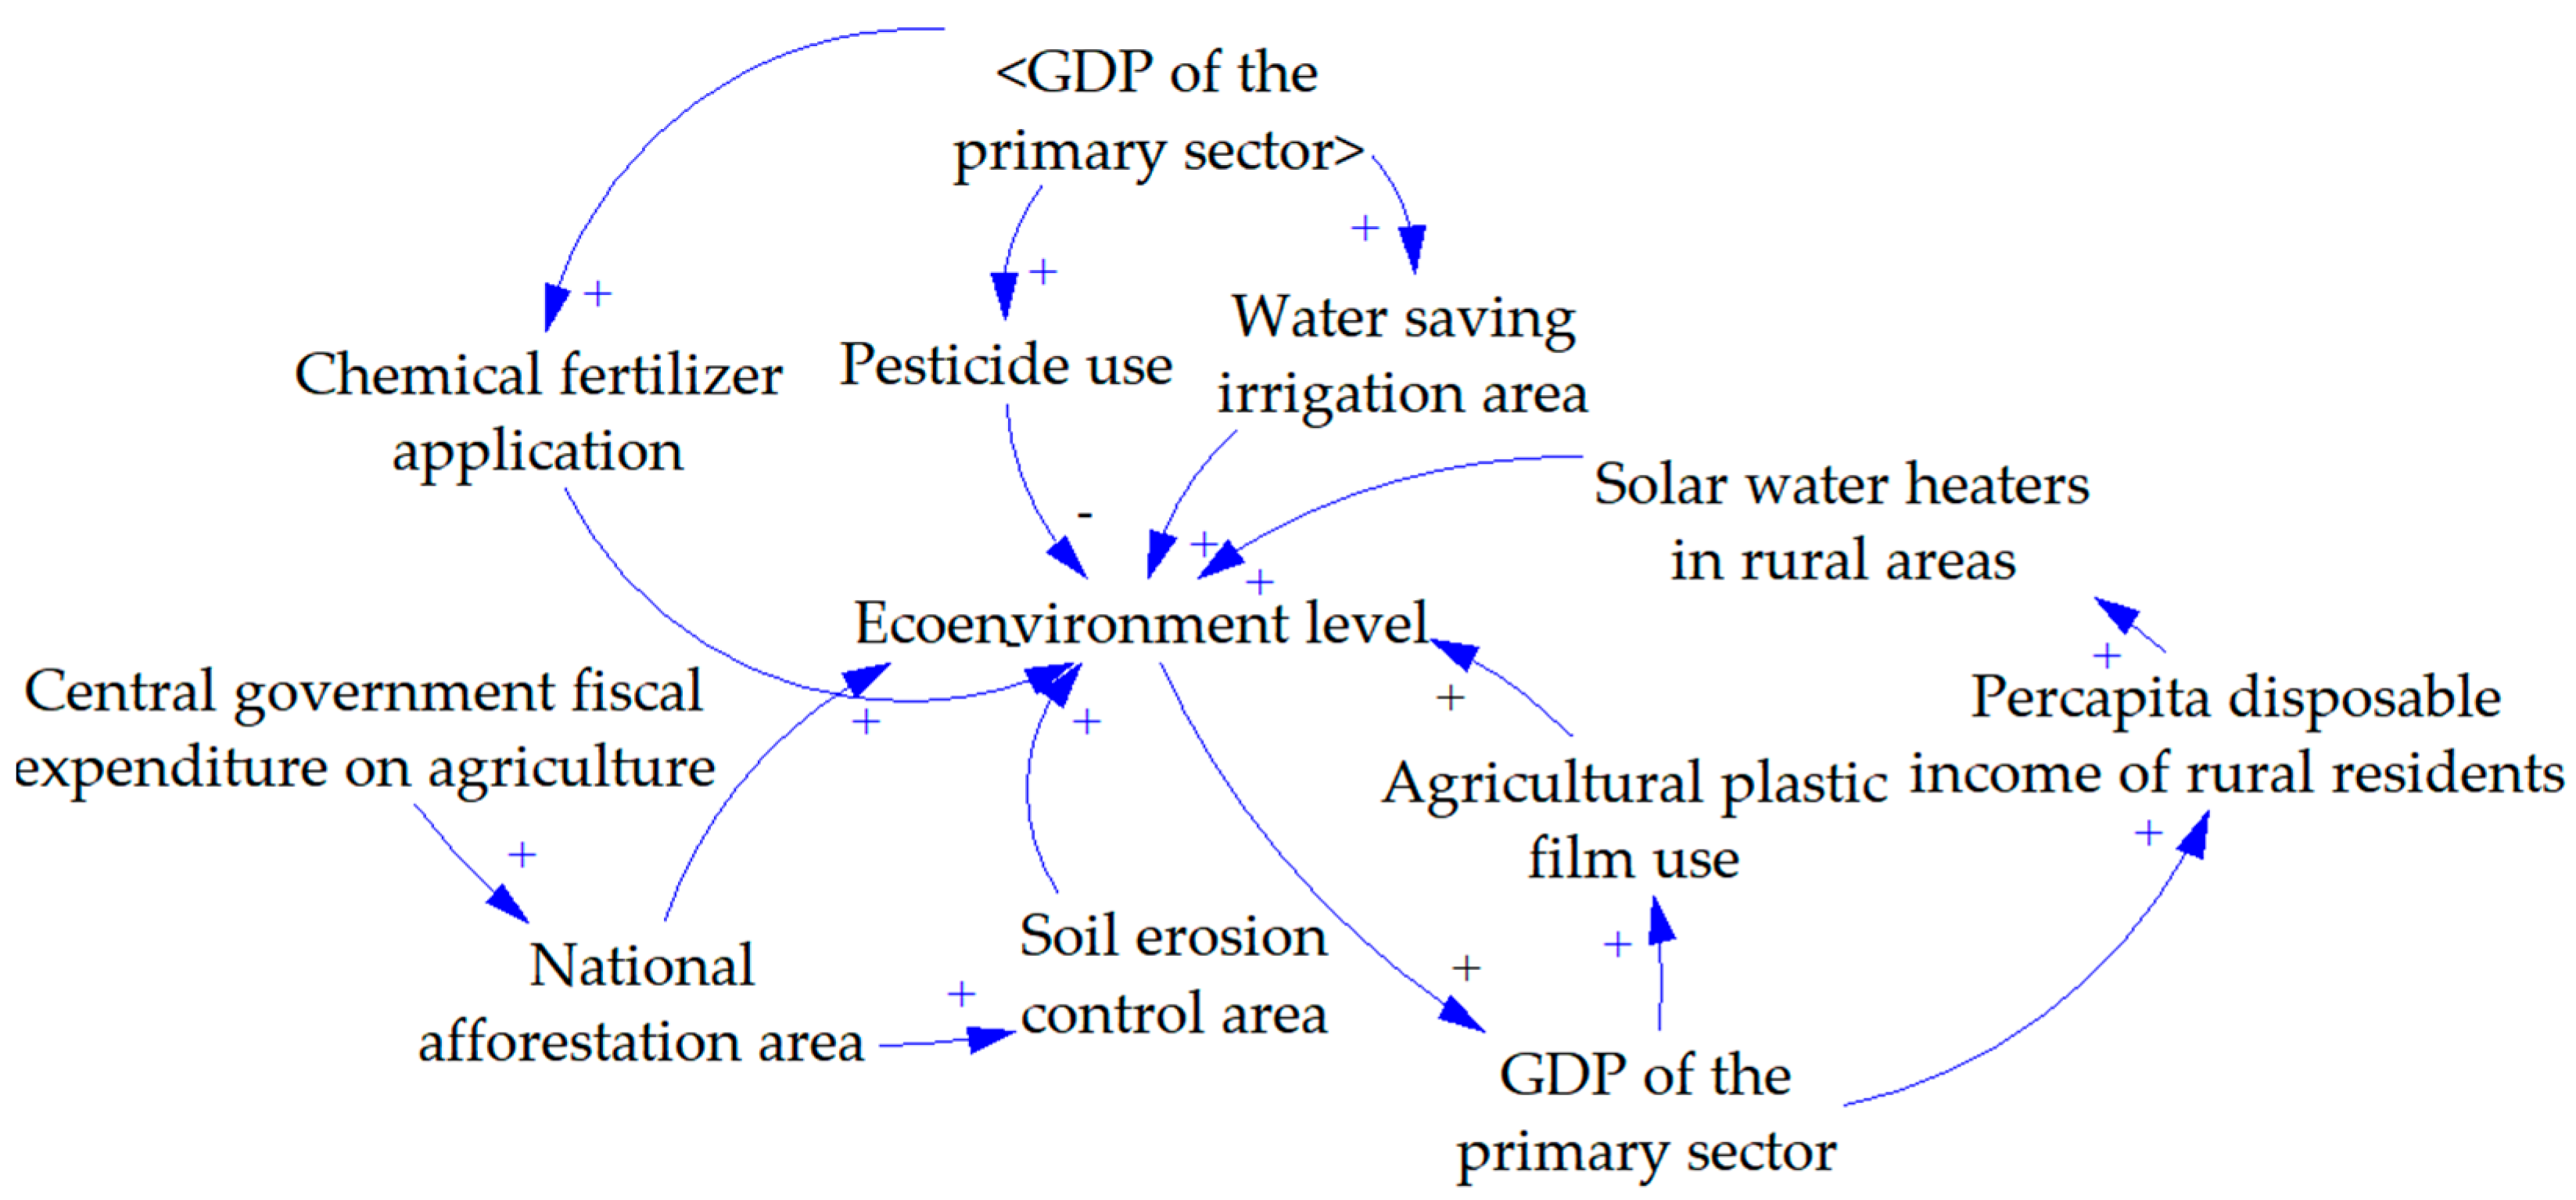
The rural ecological subsystem is operationalized through variables that directly condition the long-term sustainability of rural soils and the broader biophysical milieu. Chief among these are the application rates of chemical fertilizers, pesticides, and plastic mulch films, whose excessive or improper use generates negative externalities such as soil degradation, non-point-source pollution, and micro-plastic accumulation. Conversely, the expansion of water-saving irrigation areas constitutes a restorative intervention that mitigates resource depletion and enhances ecological resilience. These factors are not only interdependent but also jointly determine the aggregate level of eco-environmental quality.
Importantly, several variables within the rural ecological subsystem exhibit endogenous linkages with both the rural production and rural livelihood subsystems. A salient example is the incremental allocation of central-government fiscal transfers earmarked for rural development, which not only finances agro-technological upgrading but also stimulates afforestation and silvicultural activities—thereby embedding ecological restoration within broader processes of rural industrial convergence and welfare enhancement.
Finally, by synthesizing the three subsystems delineated above, we derive a causal loop diagram of the rural industrial integration system under the PLE philosophy, as illustrated in Figure 6.

5.2.2. Construction of the Stock-And-Flow Diagram and Specification of Model Equations

The causal loop diagram developed in the preceding section identifies the directional relationships among variables but lacks the quantitative underpinnings necessary for simulation. To enable dynamic modeling, the causal structure was therefore translated into a stock-and-flow framework. Using Vensim PLE x32, a system dynamics model of rural industrial integration was constructed with the following simulation settings: Initial Time = 2018, Final Time = 2023, and Time Step = 1 year. Historical data spanning 2013–2022 were employed for calibration. Key model equations—whose coefficients were derived from the indicator weights reported in Section 4—are specified in Appendix B.
Subsequently, a stock-and-flow diagram of the rural industrial integration system was constructed using Vensim PLE x32, as depicted in Figure 7.

5.2.3. Model Validity Assessment

Validity testing assesses the structural soundness and operational stability of the model. Drawing on annual data from 2013 to 2022 for 10 level variables—including the GDP of the primary sector, per capita disposable income of rural residents, per capita rural household consumption expenditure, and number of senior-secondary graduates in rural areas—the historical-fit exercise showed that the absolute percentage error for each variable remained below 5% (detailed results are provided in Appendix C). Consequently, the rural industrial integration model was deemed to offer an adequate representation of reality and is therefore employed for the subsequent simulation analyses.

5.3. Development Pathways for Rural Industrial Integration

5.3.1. Scenario Simulation of Development Pathways and Parameter Configurations

This study sets the scenario simulation period from 2023 to 2030. Drawing on the three subsystems—rural production, rural livelihood, and rural ecology—three distinct development pathways for rural industrial integration are specified: a green ecological development priority pathway, a livelihood-standard enhancement pathway, and a production-growth priority pathway.
  • Scenario 1: Green Ecological Development Priority Pathway
Under this scenario, the ecological dimension of the PLE philosophy is accorded primacy; corresponding policies and resource allocations are deliberately skewed toward rural eco-environmental protection to secure the long-term sustainability of rural industrial integration. Parameter settings (all relative to the baseline unless stated otherwise) are as follows: GDP of the primary sector is held constant; chemical fertilizer application is increased to 110%; pesticide use is reduced to 90%; water-saving irrigation area is expanded to 110%; agricultural plastic film use is curtailed to 90%; soil-erosion control area is contracted to 70%; central government fiscal expenditure on agriculture, forestry and water affairs is elevated to 110%; national afforestation area is scaled up to 110%; and solar water heaters in rural areas are raised to 110%. All variables within the rural livelihood and rural production subsystems remain unchanged.
  • Scenario 2: Livelihood Standard Development Priority Pathway
In this scenario, the livelihood dimension of the PLE philosophy is prioritized; both government and other relevant actors channel policies and resources toward the improvement of rural living infrastructure and household welfare. The following parameter adjustments (expressed as percentages of the baseline) are imposed: length of rural postal delivery routes is expanded to 110%; rural residents receiving minimum living allowances is reduced to 90%; cultural and recreational consumption is elevated to 110%; per capita rural household consumption expenditure is increased to 110%; senior-secondary graduates in rural areas are raised to 110%; agricultural insurance coverage is augmented to 130%; rural employment situation is lifted to 110%; and rural broadband subscribers are expanded to 130%. All variables in the rural ecology and rural production subsystems remain unchanged.
  • Scenario 3: Production Level Development Priority Pathway
In this scenario, the production dimension of the PLE philosophy is accorded overriding importance. Government and allied actors prioritize the advancement of rural productive activities by deepening digitalization and intensifying science-and-technology enablement, thereby accelerating economic growth and privileging industrial expansion. The parameter settings (expressed relative to the baseline unless otherwise indicated) are as follows: agro-processing industry operating revenue is expanded to 110%; rural household investment in accommodation and catering is elevated to 130%; number of rural cooperatives is increased to 130%; per capita disposable income of rural residents is elevated to 125%; total power of agricultural machinery is augmented to 110%; the GDP of the primary sector is increased by 0.1; rural retail sales are increased by 0.1. All variables within the rural ecology and rural livelihood subsystems remain unaltered.

5.3.2. Scenario Forecasting Results

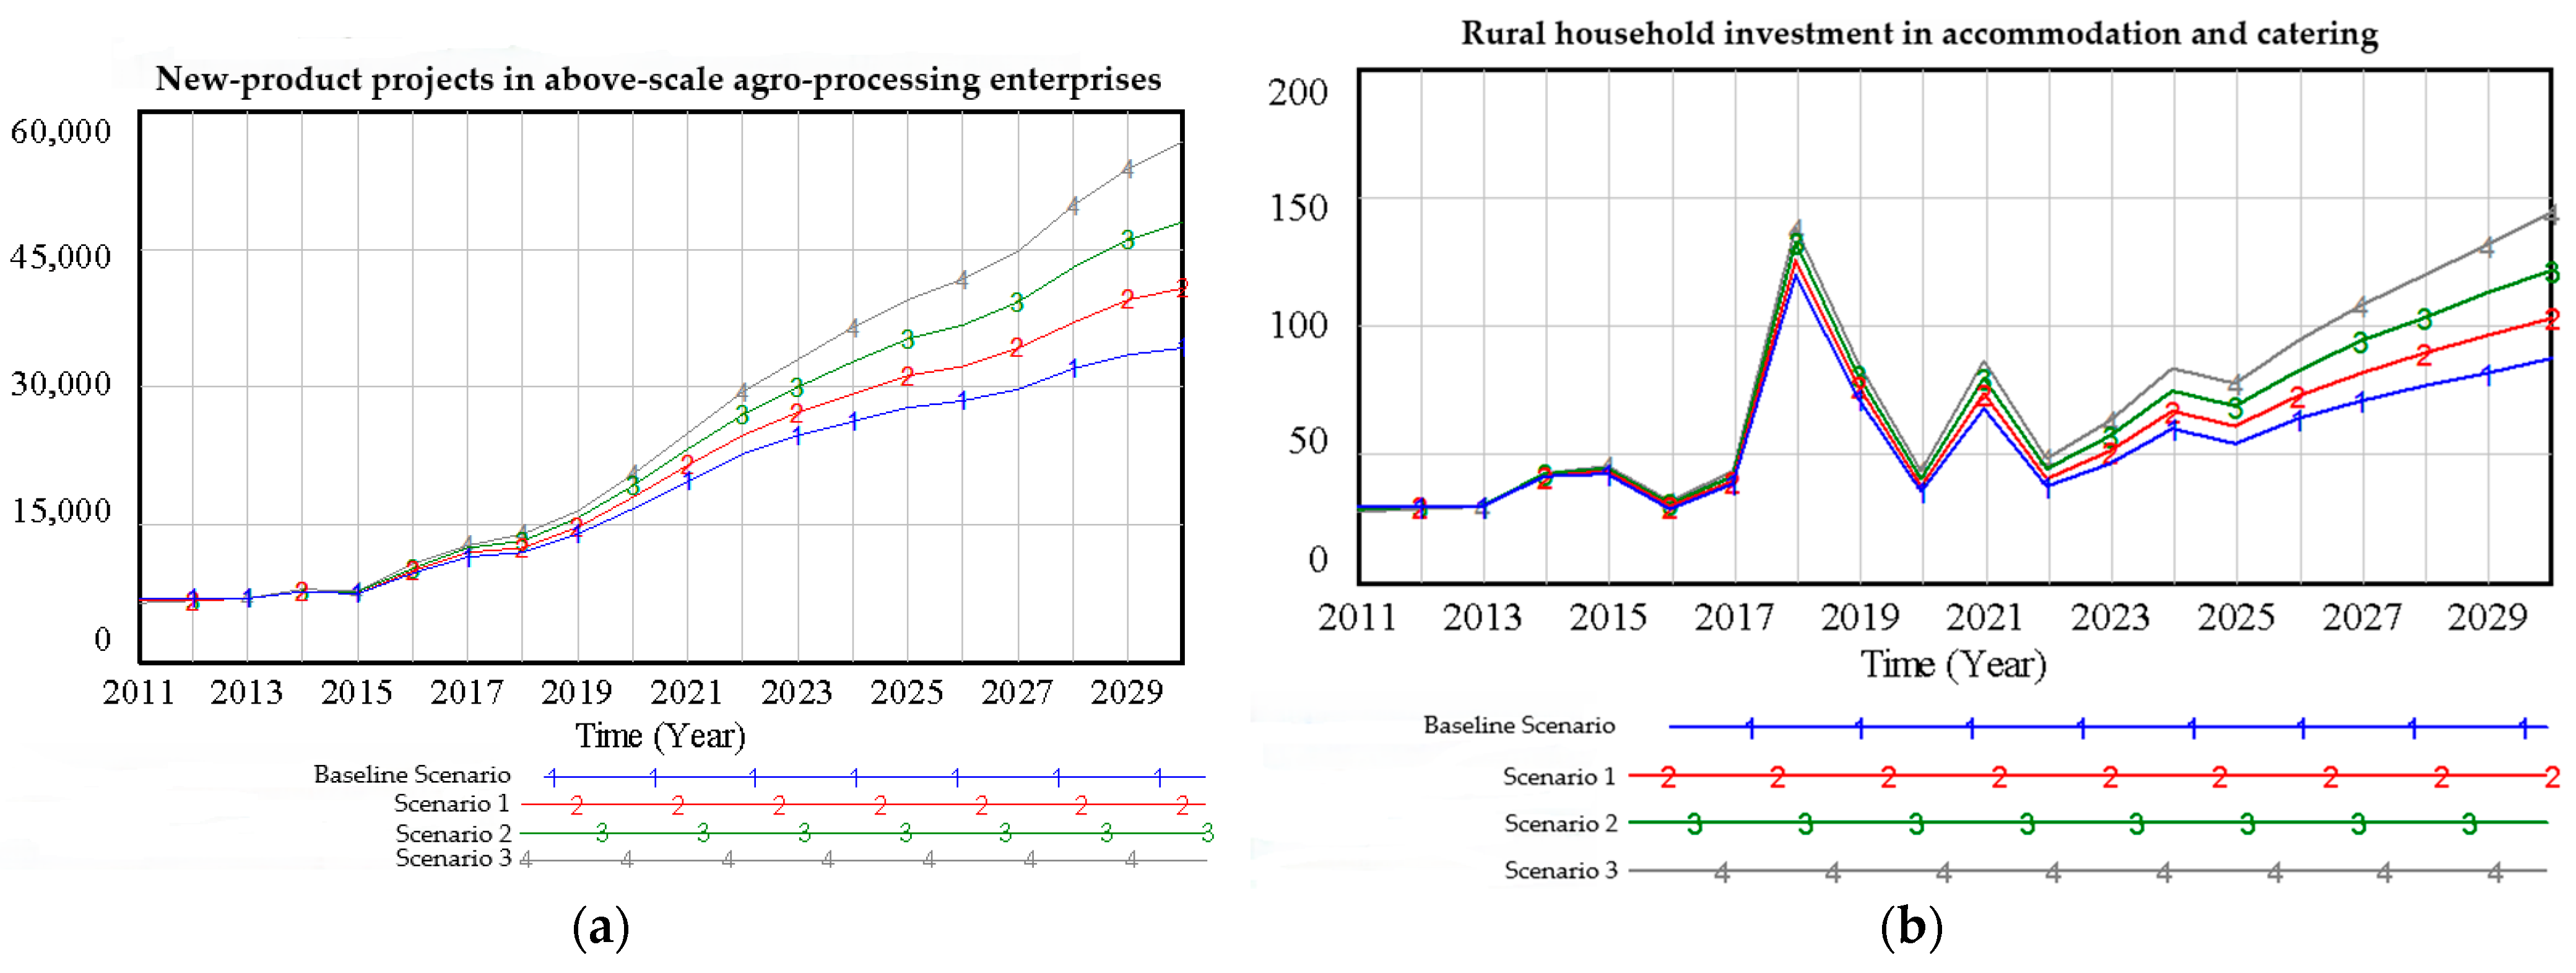
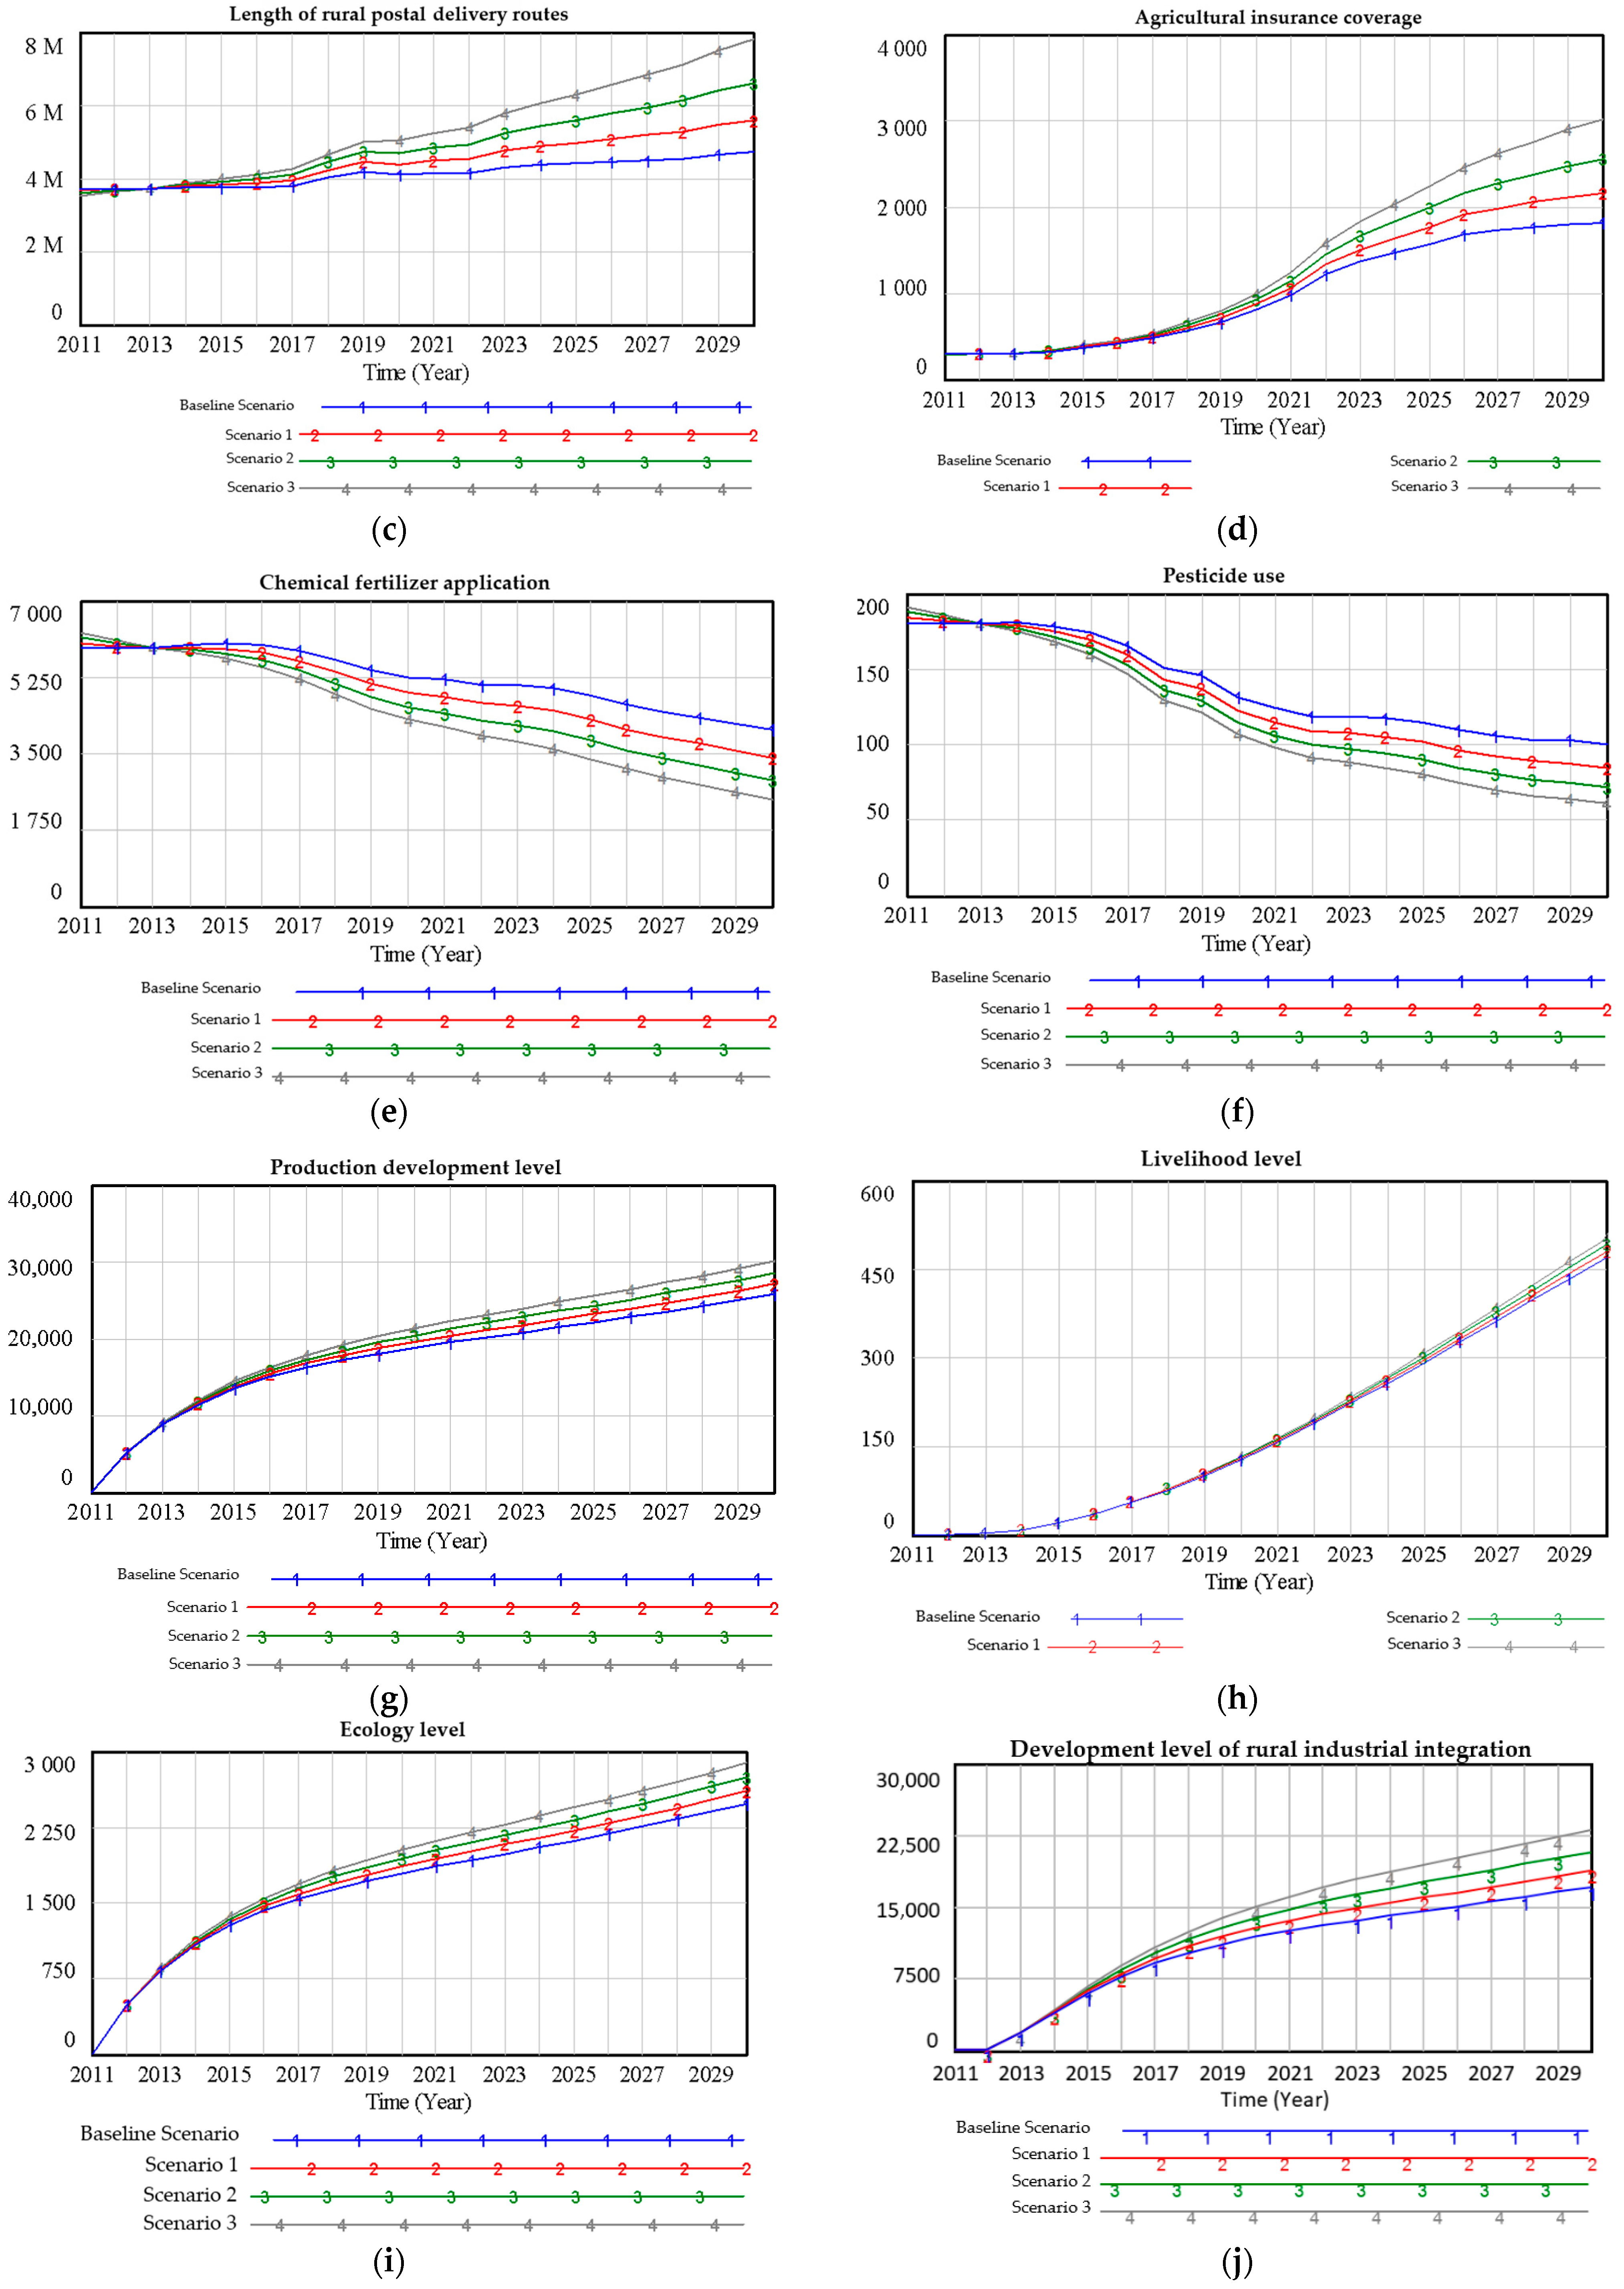
Based on the scenarios delineated above, selected variables from each subsystem were subjected to scenario-based forecasting simulations. The simulations tracked the evolution of production development level, livelihood development level, ecology development level, and an aggregated index of rural industrial integration. The resulting scenarios for rural industrial integration under the alternative scenarios are presented in Appendix D.

5.3.3. Forecasting Results Analysis

As shown in Table 8, comparative analysis of the three scenario-specific projections reveals that Scenario 3—production-development priority—outperforms both Scenarios 1 and 2, as well as the baseline scenario, in fostering rural industrial integration. Under Scenario 3, the composite index of rural industrial integration attained its highest value, and simultaneous maxima were observed for the indices of rural production level, living standard, and eco-environmental quality. Accordingly, the optimal pathway for China’s rural industrial integration between 2023 and 2030 should be anchored in the advancement of rural productive activities: raising agricultural output and its associated value added, endowing rural industries with digital technologies and scientific innovation, and leveraging technological spill-over effects to achieve deep industrial convergence. This scenario aligns precisely with the national agendas of digital village construction and the development of new quality productive forces in rural areas.

6. Discussion

This study yields several key findings with significant theoretical and methodological implications. (1) The PLE philosophy and China’s rural industrial integration exhibit an endogenous convergence. Along the production dimension, targeted government investment and new types of agri-business reconfigure benefit-sharing mechanisms, reinforcing the sustainability of industrial integration; this effect is particularly pronounced in counties with more advanced economies. In the livelihood dimension, upgraded infrastructure and improved settlement environments unlock latent rural consumption potential and attract return and migration of talent, while agricultural insurance systems enhance farmers’ resilience to shocks, jointly constituting the human-capital foundation of industrial integration. Ecologically, environmental quality directly constrains the cost structure of integration, whereas the transition to clean energy and the capitalization of ecological assets can foster new drivers of green growth. (2) Under the PLE philosophy, China’s rural industrial integration exhibits a production-led trajectory whose core impetus derives from processing innovation and service-sector investment; nevertheless, ecological fragility and external shocks constitute binding constraints on sustainable development. Production functions as the central driver, while livelihood conditions provide the critical substrate, and ecology operates as the sustainability baseline, but the high weights accorded to negative indicators such as chemical fertilizer and pesticide use signal persistent ecological pressure. Additionally, these findings demonstrate that the current integration path remains structurally imbalanced, prioritizing production at the expense of ecological considerations; future trajectories must therefore incorporate green-technology inputs to realize sustainable integration objectives. (3) Within the PLE philosophy, the production system functions as the pivotal engine driving the sustainable development of rural industrial integration, markedly enhancing integration efficiency through digital empowerment and technological innovation. In the short term, the production system should serve as the breakthrough point to activate integration momentum, while over the medium to long term, it is imperative to reinforce the feedback mechanisms among the three subsystems—production, livelihood, and ecology—to construct a sustainable trajectory that simultaneously boosts production efficiency, alleviates ecological pressure, and improves livelihood quality, thereby achieving the deeper objectives of rural revitalization.
Theoretically, this research provides empirical validation for the PLE framework as an effective paradigm for understanding rural sustainability transitions. We contribute to the theoretical literature by operationalizing this philosophy into measurable dimensions and demonstrating how their interaction creates synergistic effects that advance rural revitalization objectives. Methodologically, our study offers methodological innovation through integrating LDA topic modeling with the entropy method to construct a novel evaluation indicator system derived directly from policy and academic discourse. The application of system dynamics modeling further enables simulation of complex interactions among production, livelihood, and ecological subsystems, providing a replicable approach for assessing sustainable development pathways in rural contexts.

7. Conclusions

In the future, deepening China’s rural industrial integration urgently requires dismantling the systemic impasse of the production-dominated paradigm. Although the current preponderant weight of the production subsystem propels short-term growth, it simultaneously incubates a triple predicament: rising mechanization rates crowd smallholders out of viable livelihood niches; innovation within processing enterprises fails to transmit commensurate income gains to farmers; and revenue growth in leisure agriculture coincides with continued rural out-migration. These contradictions compel a reconfiguration of the ethical foundations of industrial development, shifting the logic from “industrial attraction of people” to “people-centred industrial vitality”. Future policy should redesign cooperative equity structures so that farmers become equity-holders rather than mere participants along the value chain, translating the production-priority trajectory identified in our system dynamics simulation into an inclusive development model. Such a model must embed repatriation mechanisms for native talent within integrated activities—agro-processing, rural tourism, and similar sectors—so that value added generated by industry is effectively converted into social capital that anchors people to their home villages.
Digital empowerment must transcend the mere extension of infrastructure and confront the structural reconfiguration of social relations. While rural broadband penetration and e-commerce volume continue to rise, older farmers’ silence in livestream marketing and smallholders’ structural disadvantage within platform algorithms have become new barriers; the digital divide has shifted from an “access gap” to a deepening “capability gap” and “returns gap”. Future interventions therefore require the construction of a community-based digital commons that converts emerging activities such as rural tourism and leisure agriculture into collectively managed assets. For instance, village-level digital cooperatives could unify the operation of homestay reservations and farm-product traceability, preventing unilateral extraction of local resources by urban capital. At the theoretical level, indicator systems should incorporate dimensions that capture social empowerment, such as “digital-skills diffusion rate” and “share of data assets held by village collectives”, so that technological dividends serve as the lifeblood for rebuilding rural social networks rather than as blades that sever traditional ties.
Ecological governance must evolve from indicator-driven constraints to civilizational self-awareness. At present, the ecological subsystem’s contribution is dominated by passive controls on pesticide and fertilizer reduction, whereas active investments in water-saving afforestation remain disproportionately low. This “punish the bad yet insufficiently reward the good” mechanism is inherently unsustainable. Future efforts should externalize and monetize the ecological value embedded in the three living spheres: soil-and-water conservation areas can be converted into tradable carbon-sink assets, ensuring that farmers’ green production behaviors receive direct market remuneration. In key regions such as the Yangtze River Economic Belt, pilot “ecological-credit banks” could be established: after third-party certification, villagers’ practices—organic farming, straw return to fields, and the like—are tokenized into inheritable ecological assets. Thus, landscapes of lucid waters and lush mountains are transformed from policy abstractions into legible patrimonies of home, ultimately precipitating a civilizational leap from “being told to protect the environment” to “choosing perpetual stewardship.”

Author Contributions

Conceptualization, J.Z., M.M., J.Q. and L.M.; methodology, J.Q. and L.M.; software, M.M. and J.Q.; validation, J.Z., M.M., J.Q. and L.M.; formal analysis, M.M. and J.Q.; investigation, M.M. and J.Q.; resources, J.Q.; data curation, J.Q.; writing—original draft preparation, J.Q.; writing—review and editing, M.M.; visualization, M.M.; supervision, J.Z.; project administration, M.M. and J.Q.; funding acquisition, J.Z. All authors have read and agreed to the published version of the manuscript.

Funding

This research was funded by the Key Program of the National Social Science Foundation (grant number: 19AGL029); and the Fundamental Research Funds for the Central Universities, South-Central MinZu University (Grant Number: CSQ25011).

Institutional Review Board Statement

Not applicable.

Informed Consent Statement

Not applicable.

Data Availability Statement

The data that support the findings of this study are available in China Statistical Yearbook at https://www.stats.gov.cn/sj/ndsj/ (accessed on 27 August 2025); China Rural Statistical Yearbook at https://www.shujuku.org/china-rural-statistical-yearbook.html (accessed on 27 August 2025).

Conflicts of Interest

The authors declare no conflicts of interest.

Appendix A

Figure A1. Casual loop diagram of the production subsystem in China’s rural industrial integration.
Sustainability 17 08972 g0a1
Figure A2. Casual loop diagram of the livelihood subsystem in China’s rural industrial integration.
Sustainability 17 08972 g0a2
Figure A3. Casual loop diagram of the ecology subsystem in China’s rural industrial integration.
Sustainability 17 08972 g0a3

Appendix B

  • Incremental change in livelihood level = INTEG (0.030199 × share of rural population + 0.026891 × per capita rural household consumption expenditure + 0.029496 × cultural and recreational consumption + 0.0538 × senior-secondary graduates in rural areas + 0.037409 × agricultural insurance coverage + 0.048617 × rural broadband subscribers);
  • Incremental change in ecology level = INTEG (−0.030578 × chemical fertilizer application + 0.038682 × national afforestation area + 0.038213 × solar water heaters in rural areas − 0.05071 × agricultural plastic film use − 0.018457 × pesticide use + 0.022509 × soil-erosion control area + 0.021776 × water-saving irrigation area);
  • GDP of the primary sector = INTEG (incremental change in GDP of the primary sector + 0.02 × rural industrial integration level);
  • Incremental change in GDP of the primary sector = INTEG (GDP for the primary sector × growth rate of GDP of the primary sector + 0.0013 × rural retail sales + 0.0053 × rural household investment in accommodation and catering + 0.0017 × agro-processing industry operating revenue + 0.0058 × new-product projects in above-scale agro-processing enterprises);
  • Rural industrial integration development level = INTEG (0.3 × production development level + 0.5 × ecology level + 0.2 × livelihood level − 0.5 × rural industrial integration development level);
  • Rural household investment in services = INTEG (0.04523 × agro-processing industry operating revenue + 0.0374 × central government fiscal expenditure on agriculture, forestry, and water affairs).

Appendix C

Table A1. Historical validation results for selected model variables.
VariablesYearTrue
Value
Predicted ValueError
GDP of the primary sector201353,02854,0441.92%
201455,62656,3721.34%
201557,77559,9783.81%
201660,13962,1063.27%
201762,10062,8871.27%
201864,74566,7053.03%
201970,47471,6431.66%
202078,03178,8121.00%
202183,21784,8111.92%
202288,34588,7610.47%
Per capita disposable income of rural
residents
2013943094960.70%
201410,48910,6951.96%
201511,42211,7853.18%
201612,36312,9494.74%
201713,43213,9924.17%
201814,61715,0002.62%
201916,02116,7954.83%
202017,13217,3381.20%
202118,93119,8224.71%
202220,13320,4481.57%
Per capita rural household consumption
expenditure
2013748577914.09%
2014838384991.38%
2015922393060.90%
201610,13010,4873.52%
201710,95511,3483.59%
201812,12412,4512.69%
201913,32813,7453.13%
202013,71314,0232.25%
202115,91616,2031.80%
202216,63217,3314.20%
Senior-secondary graduates in rural areas201326.00273.25%
201425.20264.70%
201524.70263.42%
201623.30244.60%
201723.10244.61%
201824.10240.50%
201924.90263.55%
202024.90250.30%
202124.80251.84%
202227.50280.52%
New-product projects in above-scale
agro-processing enterprises
201368167032.143.17%
201475947695.671.34%
201572957396.151.39%
201696499771.791.27%
201711,32311,490.511.48%
201811,86211,893.250.26%
201913,77113,806.000.25%
202016,65817,427.794.62%
202119,65819,664.120.03%
202222,52823,100.892.54%
Rural household investment in
accommodation and catering
201329.930.803.03%
201441.342.031.77%
201542.442.921.23%
201628.930.184.42%
201738.339.122.14%
2018119.4124.754.48%
201971.773.111.97%
202035.335.320.05%
202168.170.413.40%
202237.137.360.69%
Length of rural postal delivery routes20133,744,7333,806,541.341.65%
20143,775,8753,912,093.763.61%
20153,756,0433,777,766.630.58%
20163,767,6603,847,005.222.11%
20173,805,3323,985,117.804.72%
20184,030,5824,074,393.761.09%
20194,198,8134,209,943.730.27%
20204,104,1284,264,459.933.91%
20214,155,4964,354,446.784.79%
20224,146,8534,198,283.541.24%
Agricultural insurance coverage2013306.59321.324.80%
2014325.78334.092.55%
2015374.90385.382.80%
2016417.71423.671.43%
2017478.90482.360.72%
2018572.74572.910.03%
2019672.48680.151.14%
2020814.93818.690.46%
2021975.80992.701.73%
20221219.301238.131.54%
Chemical fertilizer application20135911.96039.662.16%
20145995.96257.884.37%
20156022.66314.244.84%
20165984.45992.810.14%
20175859.45953.911.61%
20185653.45923.184.77%
20195403.65659.014.73%
20205250.75483.054.43%
20215191.35273.501.58%
20225079.25191.482.21%
Pesticide use2013180.2182.201.11%
2014180.7186.373.14%
2015178.3183.232.77%
2016174177.221.85%
2017165.5170.412.97%
2018150.36157.844.97%
2019145.6151.373.96%
2020131.3133.071.35%
2021123.9129.344.39%
2022119121.462.07%

Appendix D

Figure A4. Scenario simulation forecast trend chart. (a) New-product projects in above-scale agro-processing enterprises; (b) rural household investment in accommodation and catering; (c) length of rural postal delivery routes; (d) agricultural insurance coverage; (e) chemical fertilizer application; (f) pesticide use; (g) production development level; (h) livelihood level; (i) ecology level; (j) development level of rural industrial integration.
Sustainability 17 08972 g0a4aSustainability 17 08972 g0a4b

References

  1. Mihai, F.-C. Circular Economy and Sustainable Rural Development. Sustainability 2023, 15, 2139. [Google Scholar] [CrossRef]
  2. Zhou, G.; Long, H.; Lin, W.; Qiao, J.; Tan, H.; Yang, K.; Yue, W.; Yun, W.; Huang, X.; Lu, H.; et al. Theoretical Debates and Practical Development of the “Three Rural Issues” and Rural Revitalization in the New Era. J. Nat. Resour. 2023, 38, 1919–1940. [Google Scholar] [CrossRef]
  3. Cai, M.; Shi, M. Discussion on the Path of Coordinated Development of Regional Economy under the Background of Rural Revitalization. Int. J. Front. Sociol. 2023, 5, 28–33. [Google Scholar] [CrossRef]
  4. Wang, S. Planning and Management of Tourist Agricultural Parks; China Social Sciences Press: Beijing, China, 2007. [Google Scholar]
  5. Wu, Q.; Feng, J.; Chen, G.; Chen, T. The Spatial Evolution and Optimization of Production—Living—Ecology Space Inmountainous Rural Tourism Destinations: A Case Study of Jinlin Watery Area inDeqing County, Guangdong Province. Acta Ecol. Sin. 2020, 40, 5560–5570. [Google Scholar]
  6. Zhu, L. Connotations, Challenges and Strategic Ideas for the Sustainable Development of China’s Agriculture. Theor. Investig. 2014, 73–76. [Google Scholar] [CrossRef]
  7. Wang, C.; Tang, N. Spatio-Temporal Characteristics and Evolution of Rural Production-Living-Ecological Space Function Coupling Coordinationin Chongqing Municipality. Geogr. Res. 2018, 37, 1100–1114. [Google Scholar]
  8. Zhou, J. Macro Control Mechanism of Urban-Rural Layout with Three Lines, Three Spaces, and Three Controls. Planners 2019, 5–12. [Google Scholar]
  9. Liu, Y.; Ren, Y.; Pan, Y.; Tang, L. Rural Development Pattern and Zoning for Rural Revitalization Strategy. Trans. Chin. Soc. Agric. Eng. 2019, 35, 281–289. [Google Scholar]
  10. Cao, G.; Gu, C.; Zhang, Q. Recognition of “Ecological Space, Living Space, and Production Space” in the Urban Central Area Based on POI Data: The Case of Shanghai. Urban Plan. Forum 2019, 2, 44–53. [Google Scholar]
  11. Liu, P.; Wang, Y.; Huang, Y.; Luo, X.; Gao, C.; Weng, B. Development of a “Production-Ecology-Life” Coupling Tea Garden in a Mountain Area. Chin. J. Eco-Agric. 2019, 27, 785–792. [Google Scholar]
  12. Ma, X.; Li, X.; Hu, R.; Khuong, M.H. Delineation of “Production-Living-Ecological” Space for Urban Fringe Based on Rural Multifunction Evaluation. Prog. Geogr. 2019, 38, 1382–1392. [Google Scholar] [CrossRef]
  13. Zhou, H.; Jin, P.; Xia, W. Functional Zoning of Territorial Space in Provincial Level Based on the Production-Living-Ecological Functions: A Case of Henan Province. China Land Sci. 2020, 34, 10–17. [Google Scholar]
  14. Zhou, Y.; Zhou, G.; Huang, Q.; Yue, L. A Study on Distribution of Production, Living and Ecological Spaces in Karst Areas Based on Lorenz Curves and Land Use Transitions. Bull. Soil Water Conserv. 2020, 40, 297–304+325. [Google Scholar]
  15. Huang, J.; Xue, D.; Dong, C.; Wang, C.; Zhang, C.; Ma, B.; Song, Y. Eco-Environmental Effects and Spatial Differentiation Mechanism of Land Use Transition in Agricultural Areas of Arid Oasis: A Perspective Based on the Dominant Function of Production-Living-Ecological Spaces. Prog. Geogr. 2022, 41, 2044–2060. [Google Scholar] [CrossRef]
  16. Liu, H.; Li, Q.; Di, W.; Lu, J.; Yu, L. Land-Use Transformation of Production-Living-Ecology Space along Yellow River in Henan Province: Eco-Environment Effect and Driving Factors. Environ. Sci. Technol. 2024, 47, 186–189. [Google Scholar]
  17. Zeng, Y.; Su, X.; Wang, M.; Wen, C. Eco-Environmental Effects and Spatial Differentiation Mechanism of Transformation of Productional-Living-Ecological Space in Upper Reaches of Yangtze River. Bull. Soil Water Conserv. 2024, 44, 284–295. [Google Scholar]
  18. Gui, J.; Guo, G.; Zhang, H. Spatial Characteristics of Production-Living-Ecological Geographical Space of a Typical City in the Lower Yellow River Plain Area. Yellow Rive 2022, 44, 105–110. [Google Scholar]
  19. Sun, Z. Path Transformation in Agricultural Industrialization: Industrial Convergence and Industrial Clustering. Econ. Surv. 2005, 37–39. [Google Scholar] [CrossRef]
  20. Wang, X. Industry Convergence——New Concept of Agriculture Industrilization. Res. Agric. Mod. 2007, 28, 303–306+321. [Google Scholar]
  21. Jiang, C. Thoughts on Developing Agricultural Productive Service Industry. Issues Agric. Econ. 2016, 37, 8–15+110. [Google Scholar]
  22. Jiang, C. The Paths and Key Points of Promoting Industrial Integrated Development among Primary, Secondary and Tertiary Industries in Rural China. Acad. J. Zhongzhou 2016, 5, 43–49. [Google Scholar]
  23. Zhao, X.; Han, Y.; Jiang, N. Integration of Three Industries in Rural Areas: Connotation Definition, Realistic Meanings and Driving Factors Analysis. Issues Agric. Econ. 2017, 38, 49–57+111. [Google Scholar]
  24. Chen, J.; Chen, C.; Chen, M. Several Reflections on the Integrated Development of Primary, Secondary and Tertiary Industries in Rural China. Agric. Econ. 2017, 3–5. [Google Scholar]
  25. Zheng, Y. Identifying the Integration of the Primary, Secondary, and Tertiary Industries in Rural Areas: Issues and Policy Applications. J. Party Sch. Fujian Prov. Comm. Communist Party China 2017, 101–105. [Google Scholar] [CrossRef]
  26. Hu, Y.; Ding, Y. The Influence of Government Subsidy on the Value Added of the Industrial Chain Under the Background of Rural Industrial Integration. Public Financ. Res. 2019, 11, 91–101. [Google Scholar]
  27. Chen, Y. Rural Industrial Integration, County Entrepreneurial Activities and Farmers’Income Increase. J. Shanxi Univ. Financ. Econ. 2024, 46, 73–83. [Google Scholar]
  28. Wang, D.; Ran, X. Rural Digitalization, human Capital and Integrated Development of Rural Industries: Empirical Evidence Based on China Provincial Panel Data. J. Chongqing Univ. (Soc. Sci. Ed.) 2022, 28, 1–14. [Google Scholar]
  29. Li, Q.; Jia, C. Policies, Motives and Realization Mechanisms of Cooperatives Promoting the Integration of Rural Industries. J. Northwest A F Univ. (Soc. Sci. Ed.) 2020, 20, 33–41. [Google Scholar]
  30. Wang, T.; Yang, L.; Yang, G.; Luo, X. Digital Infrastructure, Integration of Rural Three Industries and Common Prosperity. East China Econ. Manag. 2024, 38, 93–103. [Google Scholar]
  31. Zheng, J.; Deng, M. Agricultural Insurance, Agricultural Industrial Structure and Rural Integrated Development. Jin Rong Yan Jiu 2024, 44, 103–119. [Google Scholar]
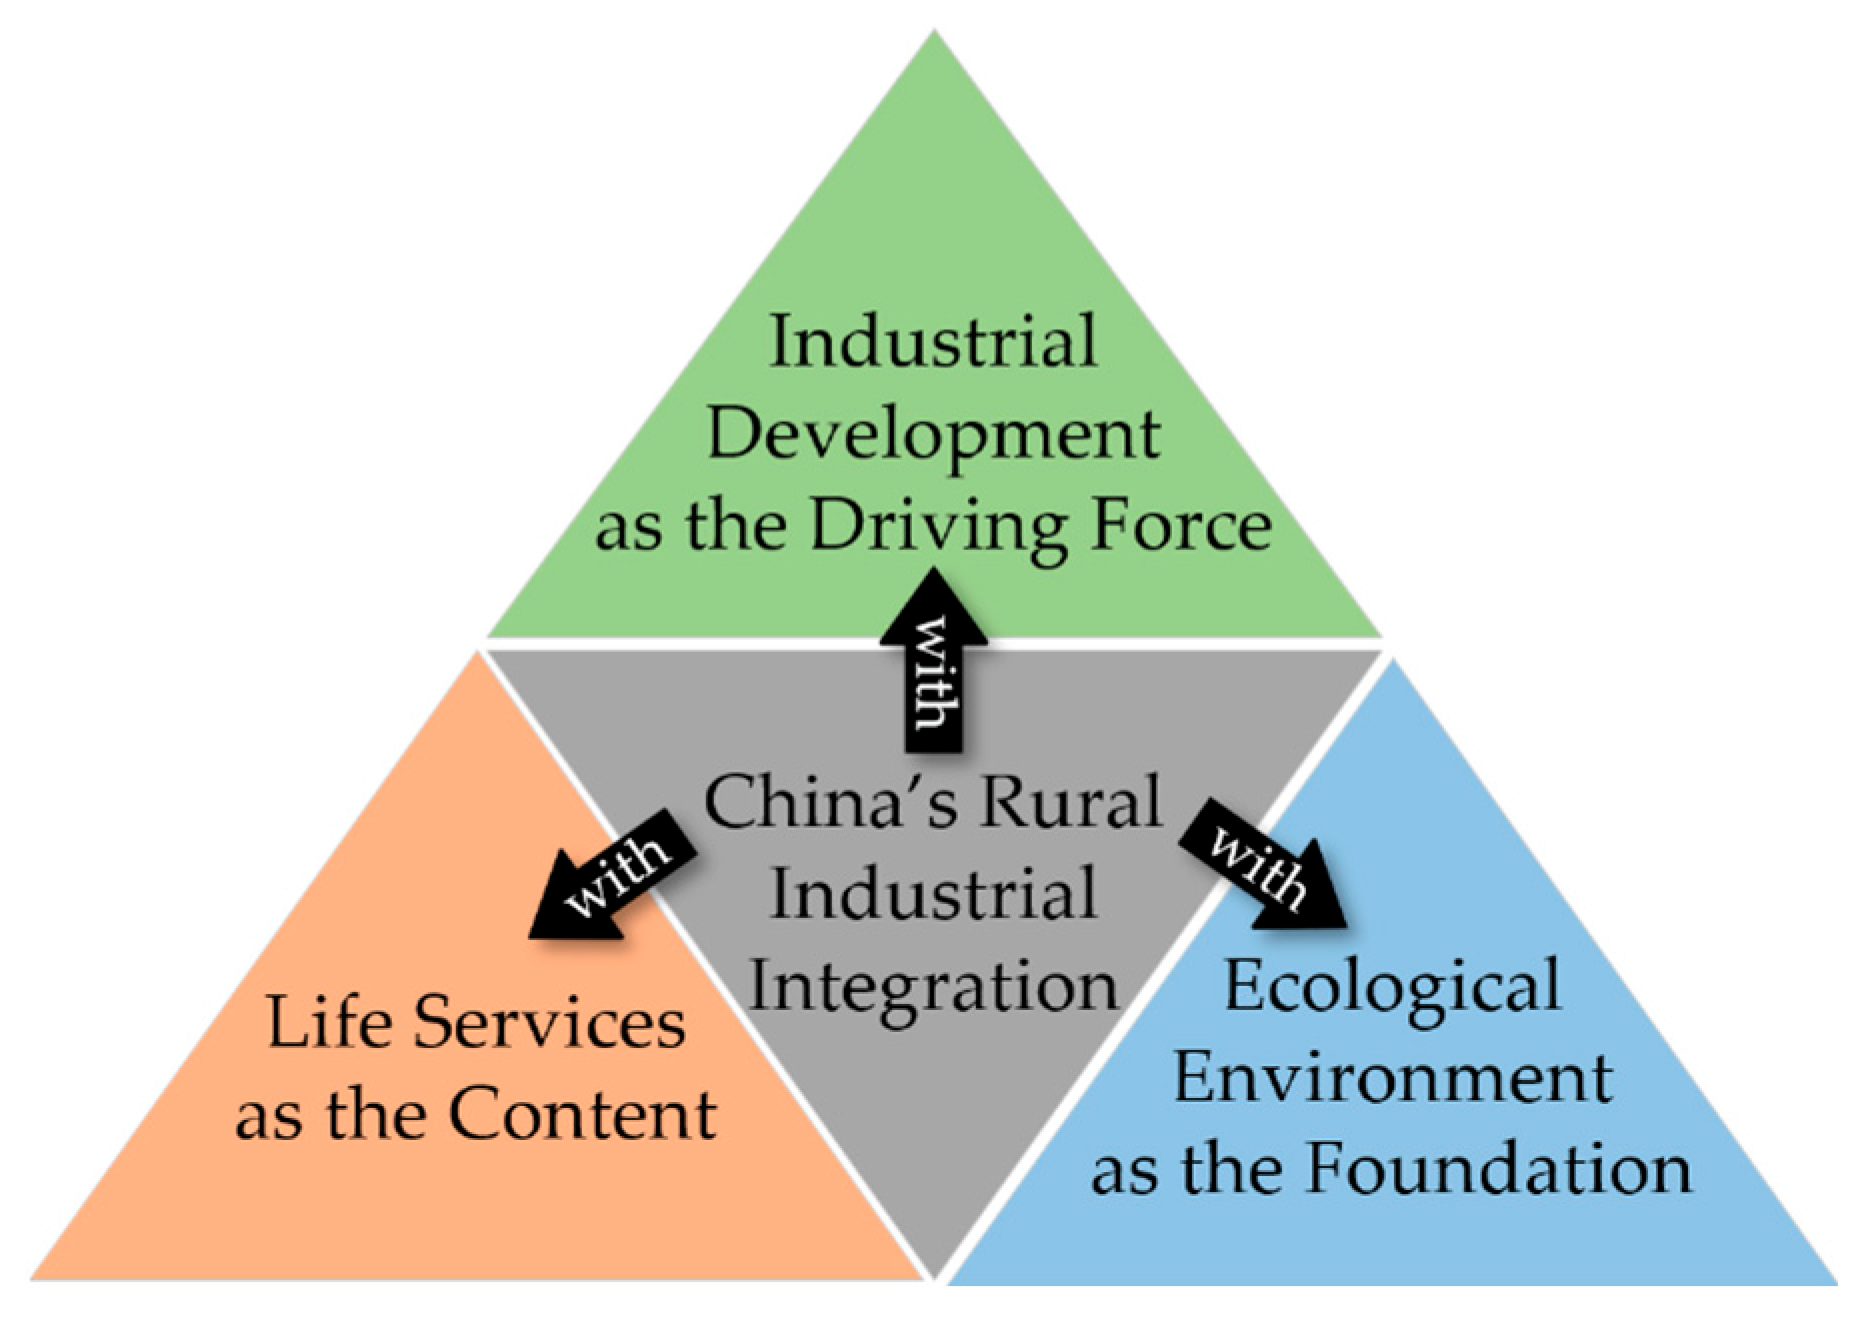
Figure 1. China’s industrial integration model based on the “Triple Synergy of Production, Livelihood and Ecology” philosophy.
Sustainability 17 08972 g001
Figure 2. Mechanisms of the “Triple Synergy of Production, Livelihood and Ecology” philosophy on China’s rural industrial integration.
Sustainability 17 08972 g002
Figure 3. Workflow for constructing China’s rural industrial integration evaluation indicator system.
Sustainability 17 08972 g003
Figure 4. Perplexity of textual corpora.
Sustainability 17 08972 g004
Figure 5. Trends of the annual evaluation indices of China’s rural industrial integration, 2013–2022.
Sustainability 17 08972 g005
Figure 6. Causal loop diagram of rural industrial integration under the “Triple Synergy of Production, Livelihood and Ecology” Philosophy.
Sustainability 17 08972 g006
Figure 7. Stock-and-flow diagram of China’s rural industrial integration system.
Sustainability 17 08972 g007
Table 1. Conceptual synthesis of rural industrial integration.
AuthorsConceptualization
Jiang [22]Characterization: functional transformation, chain extension, and sectoral expansion. Impetus: institutional innovation and technological convergence. Pathways: involve the penetration and cross-reorganization of crop production, agro-processing, and associated services to optimize resource allocation, facilitate factor mobility, and concentrate market demand, thereby reshaping rural industrial layouts. Outcomes: a shift in development patterns.
Zhao et al. [23]Actors: farmers and diverse production–business organizations. Pathways: sector extension, high-tech penetration, and institutional innovation to achieve intensive resource allocation. Outcomes: an integrated industrial chain, transformation of farming practices, and synergistic development of the three sectors.
Chen et al. [24]Foundation: rural endowments of all kinds. Modes: industrial clustering, institutional, and technological innovation. Outcomes and Objectives: progressive permeation or intersection of different sectors until they coalesce into a single integrated entity.
Zheng [25]Impetus: evolving market demand and the internalization of operating costs. Modes: technological and institutional innovation. Outcomes: technical, product and market convergence across sectors, blurred industrial boundaries, and the emergence of new technologies, business formats, or models.
Table 2. Manifestations of the adaptability between the PLE philosophy and rural industrial integration.
DimensionManifestation
Goals and PrinciplesBoth prioritize sustainable development.
Means and ApproachesBoth rely on comprehensive, systemic methods that emphasize multi-dimensional coordination.
Fields and MeasuresBoth require the joint participation of government, enterprises, and civil society, and their respective policy instruments are highly compatible.
Table 3. Topic and characteristic words.
TopicCharacteristic Words
Rural industrial activitiesprocessing, tourism, entrepreneurship, leisure, modern agriculture, cooperatives, return-to-home entrepreneurs, science and technology, farms, e-commerce, online retail, finance, technicians in services, public finance, technological innovation, mechanization, agro-by-products
Rural living standardsinfrastructure, urban–rural links, internet, poverty alleviation, urbanization, human capital, poverty eradication networks, farm household income, common prosperity, digitalization, express delivery, information technology, postal services, insurance
Rural ecology and environmentecology, green, health and wellness, forests, eco-agriculture, farmhouse stays, rural tourism, green food, ecological environment, eco-tourism, environmental protection, pesticides
Table 4. High-frequency keywords in corpus.
KeywordsFrequencyKeywordsFrequency
Processing990Green263
Tourism960E-commerce248
Entrepreneurship824Urban–rural247
Leisure712Finance229
Modern Agriculture602Employment228
Cooperatives591Insurance225
Return Migration499Service Sector187
Science and Technology351Internet183
Ecology317Poverty Alleviation145
Farms274Urbanization136
Infrastructure273Talent122
E-commerce Platforms272Poverty Eradication112
Table 5. Evaluation indicator system for rural industrial integration under the triad-integration philosophy.
Primary IndicatorSecondary IndicatorUnitData Source
ProductionGDP of the primary sectorbillion CNYChina Statistical Yearbook
Rural employment situation10,000 personsChina Statistical Yearbook
Per capita disposable income of rural residentsCNYChina Statistical Yearbook
Central government fiscal expenditure on agriculture, forestry, and water affairsbillion CNYChina Statistical Yearbook
Total power of agricultural machinerykwChina Statistical Yearbook
Agro-processing industry operating revenuebillion CNYChina Statistical Yearbook
New-product projects in above-scale agro-processing enterprisesitemChina Statistical Yearbook
Rural retail salesbillion CNYChina Statistical Yearbook
Rural household investment in servicesbillion CNYChina Rural Statistical Yearbook
Rural household investment in accommodation and cateringbillion CNYChina Rural Statistical Yearbook
Rural entrepreneurship activity indexentityChina Statistical Yearbook
Number of rural cooperativesunitChina Agricultural Management Statistics Annual Report
Operating revenue of leisure agriculturebillion CNYCompiled from national ministries’ official releases
LivelihoodShare of rural populationpercentChina Statistical Yearbook
Per capita rural household consumption expenditureCNYChina Statistical Yearbook
Cultural and recreational consumptionCNYChina Statistical Yearbook
Senior-secondary graduates in rural areaspersonChina Statistical Yearbook
Length of rural postal delivery routes10,000 kmChina Rural Statistical Yearbook
Rural broadband subscribers10,000 householdsChina Rural Statistical Yearbook
Agricultural insurance coveragepercentChina Statistical Yearbook
Fiscal expenditure for consolidating poverty-alleviation achievements and advancing rural revitalizationbillion CNYChina Rural Statistical Yearbook
Rural residents receiving minimum living allowances10,000 personsChina Rural Statistical Yearbook
EcologyChemical fertilizer applicationtonChina Rural Statistical Yearbook
Soil-erosion control areakm2China Rural Statistical Yearbook
Water-saving irrigation areakm2China Rural Statistical Yearbook
National afforestation areakm2China Statistical Yearbook
Agricultural plastic film usetonChina Rural Statistical Yearbook
Pesticide usetonChina Rural Statistical Yearbook
Solar water heaters in rural areasunitChina Statistical Yearbook
Table 6. Weights of China’s rural industrial integration indicators.
Primary IndicatorSecondary IndicatorWeight (%)Attributes
ProductionGDP of the primary sector3.821+
Rural employment situation3.495+
Per capita disposable income of rural residents3.051+
Central government fiscal expenditure on agriculture, forestry and water affairs2.428+
Total power of agricultural machinery2.722+
Agro-processing industry operating revenue3.927+
New-product projects in above-scale agro-processing enterprises4.497+
Rural retail sales2.246+
Rural household investment in services1.314+
Rural household investment in accommodation and catering6.345+
Rural entrepreneurship activity index3.428+
Number of rural cooperatives3.681+
Operating revenue of leisure agriculture2.698+
LivelihoodShare of rural population3.659+
Per capita rural household consumption expenditure3.020+
Cultural and recreational consumption2.690+
Senior-secondary graduates in rural areas2.950+
Length of rural postal delivery routes5.380+
Rural broadband subscribers3.879+
Agricultural insurance coverage4.862+
Fiscal expenditure for consolidating poverty-alleviation achievements and advancing rural revitalization3.741+
Rural residents receiving minimum living allowances2.765
EcologyChemical fertilizer application5.132+
Soil-erosion control area3.058+
Water-saving irrigation area2.251+
National afforestation area2.178+
Agricultural plastic film use3.868
Pesticide use5.071
Solar water heaters in rural areas1.846+
Table 7. Annual evaluation indices of China’s rural industrial integration, 2013–2022.
YearProductionLivelihoodEcologyComposite
20130.0700.0560.0370.163
20140.1210.0600.0280.209
20150.1520.0690.0480.270
20160.1490.0820.0620.292
20170.1680.1110.0980.377
20180.2350.1800.1370.551
20190.2430.2250.1650.633
20200.2290.2150.1900.634
20210.3030.2380.1880.729
20220.2980.2760.2000.773
Table 8. Projected values of selected national rural industrial integration indicators under the production development priority scenario, 2023–2030.
YearRural
Household
Investment in Accommodation and Catering
Agricultural Insurance CoverageTotal Power of Agricultural MachineryPer Capita Disposable
Income of
Rural
Residents
Length of Rural Postal Delivery RoutesChemical
Fertilizer
Application
Pesticide UseGDP of the
Primary
Sector
New-Product
Projects in
Above-Scale
Agro-Processing
Enterprises
202346.991380.47113,881.8422,357.334,361,507.005006.95117.3592,428.5524,781.85
202460.911487.52117,402.2224,403.994,431,124.504945.33116.1195,720.1326,502.47
202555.111591.00121,218.3326,165.444,470,643.504761.49112.9899,226.3027,953.23
202664.871700.82123,711.9427,392.534,544,310.504554.15108.13103,428.8028,689.12
202772.141756.24126,620.3028,622.054,581,201.004405.70104.38107,253.4329,994.22
202877.751799.29131,012.7029,384.694,633,576.504270.84101.59109,949.0932,284.23
202983.121834.56136,316.9830,162.724,748,604.004114.35101.00113,207.8134,017.94
203088.331855.83140,079.1632,120.084,818,017.503967.1098.32116,709.6034,796.79
Disclaimer/Publisher’s Note: The statements, opinions and data contained in all publications are solely those of the individual author(s) and contributor(s) and not of MDPI and/or the editor(s). MDPI and/or the editor(s) disclaim responsibility for any injury to people or property resulting from any ideas, methods, instructions or products referred to in the content.