1. Introduction
Considering the ever-increasing requirements regarding emissions, today, thermal engines are built to work efficiently and, at the same time, with ever-lower environmental impact, being equipped with emission control devices. Thus, companies producing lubricants must make available, to those who manufacture vehicles equipped with thermal engines, products that take these impositions into account. Moreover, increased operating temperatures and demands regarding the manufacturing tolerances of the components make the periodic analysis of the oil a necessity [
1].
Engine oil is a fluid that contains base oil and is mixed in various proportions with additives that give it different properties necessary to fulfill its functions when operating in the internal combustion engine. The oil used in both gasoline and diesel engines fulfills several functions. Thus, in addition to ensuring the reduction of friction between parts in motion relative to each other (approximately 40% of the energy produced by fuel combustion is lost through friction [
2]), the oil protects the parts against corrosion, cleans the surfaces on which various residues are deposited, maintains the engine temperature within the limits provided by the manufacturer, mitigates shocks, and maintains the sealing of the combustion chamber [
3]. Therefore, the operation of the engine with damaged oil, unable to perform the functions mentioned above, leads to wear with serious consequences for both maintenance costs and environmental damage. A worn, damaged engine that no longer operates at its designed parameters emits toxic pollutants into the atmosphere, with negative effects on human health and ecosystems. Moreover, the increase in fuel consumption in the case of these engines leads to higher emissions of greenhouse gases and, implicitly, to an increase in global temperature.
Replacement and repair of engine components are also factors that pollute and affect the resource market, i.e., raw materials, in the long term. Changing consumption patterns in order to use resources sustainably is today a priority not only for authorities but also for companies.
The vehicle manual recommends an oil usage interval. However, several factors such as driving style, atmospheric conditions, engine condition, and speed regime influence the quality of the oil in the period between two successive changes. Even if it is no longer recommended to change the oil after a certain number of kilometers driven, this is still practiced. Doing this does not take into account a very important factor, namely, the periods of operation in the idling regime [
1].
Obviously, the problem that arises is determining the most suitable time to change the oil. In this sense, the authors of the same paper [
1] state that the best advice would be to carry out a used oil change after an analysis of its physico-chemical properties. Moreover, oil analysis can provide important information about engine faults that are not noticeable in the first phase, helping to implement preventive maintenance [
4,
5].
Preventive maintenance of internal combustion engines consists of a series of activities carried out periodically to prevent defects and ensure optimal engine operation. By applying it, problems can be identified and remedied before they cause major damage or affect the performance of vehicles powered by these engines. Preventive maintenance ensures longer engine life, reduced repair costs, greater economic efficiency of vehicle operation by reducing downtime in auto service, lower fuel consumption, and engine operation in accordance with environmental regulations. The authors of the paper [
3] state that the analysis of used engine oil, which can simultaneously monitor both the state of engine wear and oil degradation, is one of the most widely used forms of preventive maintenance.
In this paper, the authors propose a method to periodically analyze, between scheduled overhauls, the physico-chemical properties of used engine oil. Based on the obtained results, appropriate vehicle maintenance strategies can be issued, and recommendations can also be made for the prolonged use of oil, provided that it undergoes periodic evaluation.
For this purpose, 43 oil samples taken from 43 trucks were analyzed. All trucks were equipped with the same type of Euro 6 engine and used the same type of oil. At the time of sampling, the engines had each been driven 100,000 km with that oil.
The authors focused their research on trucks for the following reasons: (1) in recent years, road transport is the main method of freight transportation at the European (EU) level (according to EUROSTAT data [
6,
7], in 2023, the volume of freight transported by road was over 4.5 times greater than that by rail); (2) they use large amounts of lubricants and travel long distances, on different routes and in different climatic conditions, and, as such, the consequences regarding sustainable development are considerable.
The following physico-chemical properties were analyzed: kinematic viscosity at 40 °C, density at 15 °C, flash point, fuel content, water content, and metal content (iron (Fe), copper (Cu), and zinc (Zn)). The values obtained for fresh oil were used as a baseline for comparison, and the limits proposed in the literature for the analyzed properties were also considered. To obtain a clearer picture of certain samples in which more pronounced variations were detected, oil stain analysis was additionally performed. Based on these evaluations, a method for diagnosing the engine was developed through the analysis of the physico-chemical properties of used engine oil and the issuance of appropriate vehicle maintenance strategies. This method was applied particularly to those samples in which significant variations in property values were observed. The summary presentation of the proposed maintenance strategies in accordance with the properties of the used oil can be seen in
Section 5.
This work may be useful for companies that manage truck fleets and aim to reduce vehicle operating costs while simultaneously contributing to environmental protection through the implementation of sustainable development practices. The novelty of this study lies in the fact that the research was carried out on a large number of trucks equipped with identical engines that used the same type of oil. Smith [
8] emphasizes that, while it is important to compare an engine with its previous stages, it is equally crucial to conduct studies on a large number of identical engines. However, even though subjective factors remain significant, the test sheets did not include drivers’ notes regarding engine sound signals, drivability, driving style, road infrastructure conditions, or traffic circumstances. Collecting such information is often difficult, particularly in this case where a large number of drivers were involved. Consequently, the analysis of the properties of used engine oil becomes even more important.
2. Physico-Chemical Properties of the Oil
Viscosity is a measure of a fluid’s resistance to flow at a given temperature. High viscosity may indicate contamination of the oil with residues from incomplete combustion, leaks at the cylinder head gasket (which may be damaged), failures in cooling system components, engine operation at high temperatures leading to oil oxidation, or the presence of solid particles resulting from material detachment under dry friction. Increased oil viscosity can cause damage to the camshaft, pistons, piston rings, valves, and the oil sump [
9]. Conversely, low viscosity may indicate oil dilution with fuel, oil shear, or the use of an inappropriate oil type [
2,
10]. A decrease in viscosity may also result from thermal cracking or from topping up with an unsuitable oil [
9]. Low viscosity can prevent the formation of an adequate oil film, leading to boundary lubrication conditions. In such cases, wear on moving part surfaces accelerates significantly [
11]. Smith [
8] emphasizes that viscosity and the degree of oxidation are the key properties that must be analyzed when monitoring engine oil degradation.
Fuel dilution can occur as a result of using inappropriate fuel, operating under repeated acceleration regimes, improper fuel dosing, or the presence of a diesel particulate filter. In such cases, abnormal combustion may arise, and unburned liquid fuel can dilute the lubricant during the combustion process.
Oil shear refers to the deterioration of the chemical structure of the oil under conditions of high pressure and temperature, particularly in areas with low tolerances, such as between the cylinder and piston rings, in gears, or in bearings. Oil shear may also occur when frequent on/off cycling is present. When oil shear develops, the additives are destroyed, preventing the oil from performing its intended functions [
12].
Oil oxidation is another critical phenomenon, which is accelerated by increased oxygen levels, elevated engine operating temperatures, and high pressures. Advanced oxidation leads to higher viscosity values and, consequently, the deterioration of lubrication [
1]. According to [
9], a high level of oxidation in engine oil can cause severe damage to components such as bearings, camshaft, pistons, piston rings, valves, and the oil sump.
Consequently, the use of oil with either higher or lower viscosity than the limits recommended by the manufacturer leads to overheating of the engine, poor lubrication, increased friction, and the formation of harmful deposits. These, in turn, accelerate engine wear, reduce performance, increase fuel consumption, and raise exhaust emission levels.
The density of a substance is the physical quantity that represents the mass contained in a given volume and is influenced by both chemical composition and temperature. In the case of engine oil, density can directly affect lubrication, with consequences for engine wear, fuel consumption, and operating temperature. Oil with a higher density may generate a more efficient lubricating film, reducing friction and, implicitly, wear. However, a significant increase in density reduces lubrication efficiency, increases component wear, and makes oil circulation more difficult at low temperatures. An increase in oil density may also indicate operating problems, such as contamination with combustion residues from incomplete fuel burning, metal particles, coolant, or water. Oxidation, which produces heavier compounds like varnishes and resins, can also raise density. Conversely, contamination with fuel can reduce density but may simultaneously trigger chemical reactions that form heavier compounds, ultimately increasing density.
According to [
13], using a lubricant with the correct density can reduce engine wear by up to 30% and extend engine life by up to 20%. Efficient lubrication decreases friction, reducing fuel consumption by up to 5% and thereby lowering polluting gas emissions. Furthermore, oil with optimal density, due to its heat dissipation properties, can lower operating temperatures by up to 15% compared to engines using unsuitable lubricants.
The flash point is the lowest temperature at which vapors released at the oil’s surface ignite in the presence of oxygen and a spark. A reduced flash point indicates contamination with fuel. The authors of [
14] recommend checking the engine for fuel leaks if the flash point drops by more than 30 °C compared to fresh oil. Fuel dilution not only increases fuel consumption but also raises pollutant and CO
2 emissions, with environmental and economic consequences. In addition, using oil with a flash point below the recommended minimum can lead to explosions with devastating effects on both the vehicle and its occupants.
Although an increased flash point does not represent a major problem for engine function, its causes should still be investigated. Such an increase can result from contamination with metal particles, combustion residues, or other impurities; oil oxidation at high operating temperatures and in oxygen-rich environments; or evaporation of volatile oil fractions, leaving heavier compounds behind. Transformation of additives into heavier chemical compounds and the presence of coolant in the oil may also raise the flash point.
Contamination of engine oil with water or coolant can occur through atmospheric air, condensation of fuel during cold-engine operation, or leaks from the cooling system. Such contamination leads to increased viscosity, engine overheating, reduced lubrication, corrosion of engine parts, and the formation of acids, which further intensify the corrosion process. The presence of water in engine oil can cause significant wear on the camshaft, with serious consequences for engine operation [
9]. Moreover, water tends to strip oil additives, thereby damaging its protective properties [
15].
Oils have a specific water
saturation point, which marks the limit at which oil can no longer hold additional water molecules. For lubricating oils, this value typically ranges between 500 and 600 parts per million (ppm). Interestingly, older oils can hold three to four times more dissolved water than fresh oil. Small amounts of water are usually fully dissolved in oil and remain invisible, causing less damage than when concentrations exceed the saturation point. Beyond this threshold, water may appear in free form and/or as an emulsion with the oil. To minimize harmful effects, the water content must remain as low as possible and below the saturation value. One of the first indicators of excess water is a change in oil viscosity. Oxidation reactions can also be catalyzed by compounds formed when free water combines with iron and copper particles from wear. Free water can penetrate the microscopic structure of metal surfaces, accelerating corrosion. The resulting particles then cause further abrasive wear. Additionally, free water settling at the bottom of the oil tank, or circulating within emulsions, reduces lubrication efficiency, leading to accelerated component wear. Water contamination also depletes additives, accelerates oil degradation, and contributes to sludge and sediment formation, which may clog filters [
16,
17,
18].
Another key indicator of oil degradation is the content of metal elements. Metal particles act as abrasives, damaging engine components, and also serve as catalysts in oil oxidation. According to Grimmig et al. [
19], oil composition elements can be grouped into four categories: base oil, additives, wear elements, and contaminants. Wear elements originate from friction between moving parts and may include aluminum, iron, copper, chromium, lead, nickel, silver, molybdenum, manganese, and tin. Additive degradation releases elements such as zinc, calcium, barium, and magnesium. Contaminants may enter via leaks in the cooling system, introducing sodium, boron, silicon, and phosphorus, or via the air intake system, where silicon and calcium indicate air filter damage.
Excessive solid content in oil shortens engine life by clogging filters and impairing lubrication. Detecting these particles through used oil analysis enables early diagnosis and the implementation of suitable maintenance strategies. In diesel engines, soot is the primary solid contaminant, and in combination with other oil elements under varying temperatures, it contributes to sludge formation [
1,
2,
3]. Smith [
8] highlights that metal content is the main factor leading to oil deterioration and, consequently, engine failure.
Advanced computational intelligence techniques have been increasingly applied in engineering diagnostics. For instance, the authors of [
20] propose a neuro-fuzzy model (ANFIS) that classifies diesel engines according to corrosion levels in their components. The model’s variables—such as water, fuel, and metal content—are derived from used oil analysis.
Table 1 briefly presents each property, its units, and its relevance for oil condition monitoring.
In conclusion, a more complete analysis of used engine oil could lead to early engine diagnosis with positive consequences on repair costs but also on the impact on the environment. Obviously, corroborating these results with the symptoms observed by the driver during engine operation and collected in specially designed sheets can lead to a much more precise diagnosis and appropriate maintenance recommendations.
3. Methodology and Experimental Setup
The approach proposed in this paper consists of several steps, which are listed and discussed in detail below. Trucks with the same type of engine but different mileage were selected. Oil samples were collected during the scheduled oil change, each having been used for 100,000 km. These samples were then subjected to laboratory analysis, and the results were compared to those of unused (fresh) oil. By analyzing the differences between the physico-chemical properties of the used oil samples and those of fresh oil, and by correlating the data with the operating characteristics of each vehicle, files containing appropriate maintenance recommendations based on engine diagnostics were issued.
Figure 1 presents the graphical representation of the research methodology.
A total of 43 trucks belonging to the fleet of a transport company were selected. All trucks were equipped with the same type of diesel engine and used the same oil recommended by the manufacturer.
Table 2 presents the experimental conditions:
Taking oil samples from the engine must be carried out under strict conditions to ensure that the collected sample is representative of the entire amount of oil circulating in the engine [
8,
14]. For this reason, sampling was performed while the engine was running. To prevent contamination with impurities not originating from the engine, both the container and the sampling instruments were thoroughly cleaned and dried. Approximately 250 mL of oil was collected, with the container only partially filled to allow vigorous shaking before laboratory analysis. The container was then perfectly sealed to prevent leakage and contact with the atmosphere. Each sample was accompanied by the data sheet shown in
Figure 2.
The samples were analyzed in the laboratory, and the corresponding methods and equipment are detailed in
Table 3.
For some samples, it was necessary to obtain a more complete picture of the degree of oil wear; therefore, an oil stain analysis was also performed. This analysis aimed to evaluate the level of sediment contained in the engine oil as well as the degree of oxidation [
5,
27]. The measured values of the physico-chemical properties of the used oil samples were compared with those of the fresh oil, and the differences were assessed against the limits reported in the specialized literature. Based on these results, a method for analysis and maintenance recommendations was developed, as illustrated in
Figure 3.
Finally, for those samples where noticeable differences were found, according to the method presented in
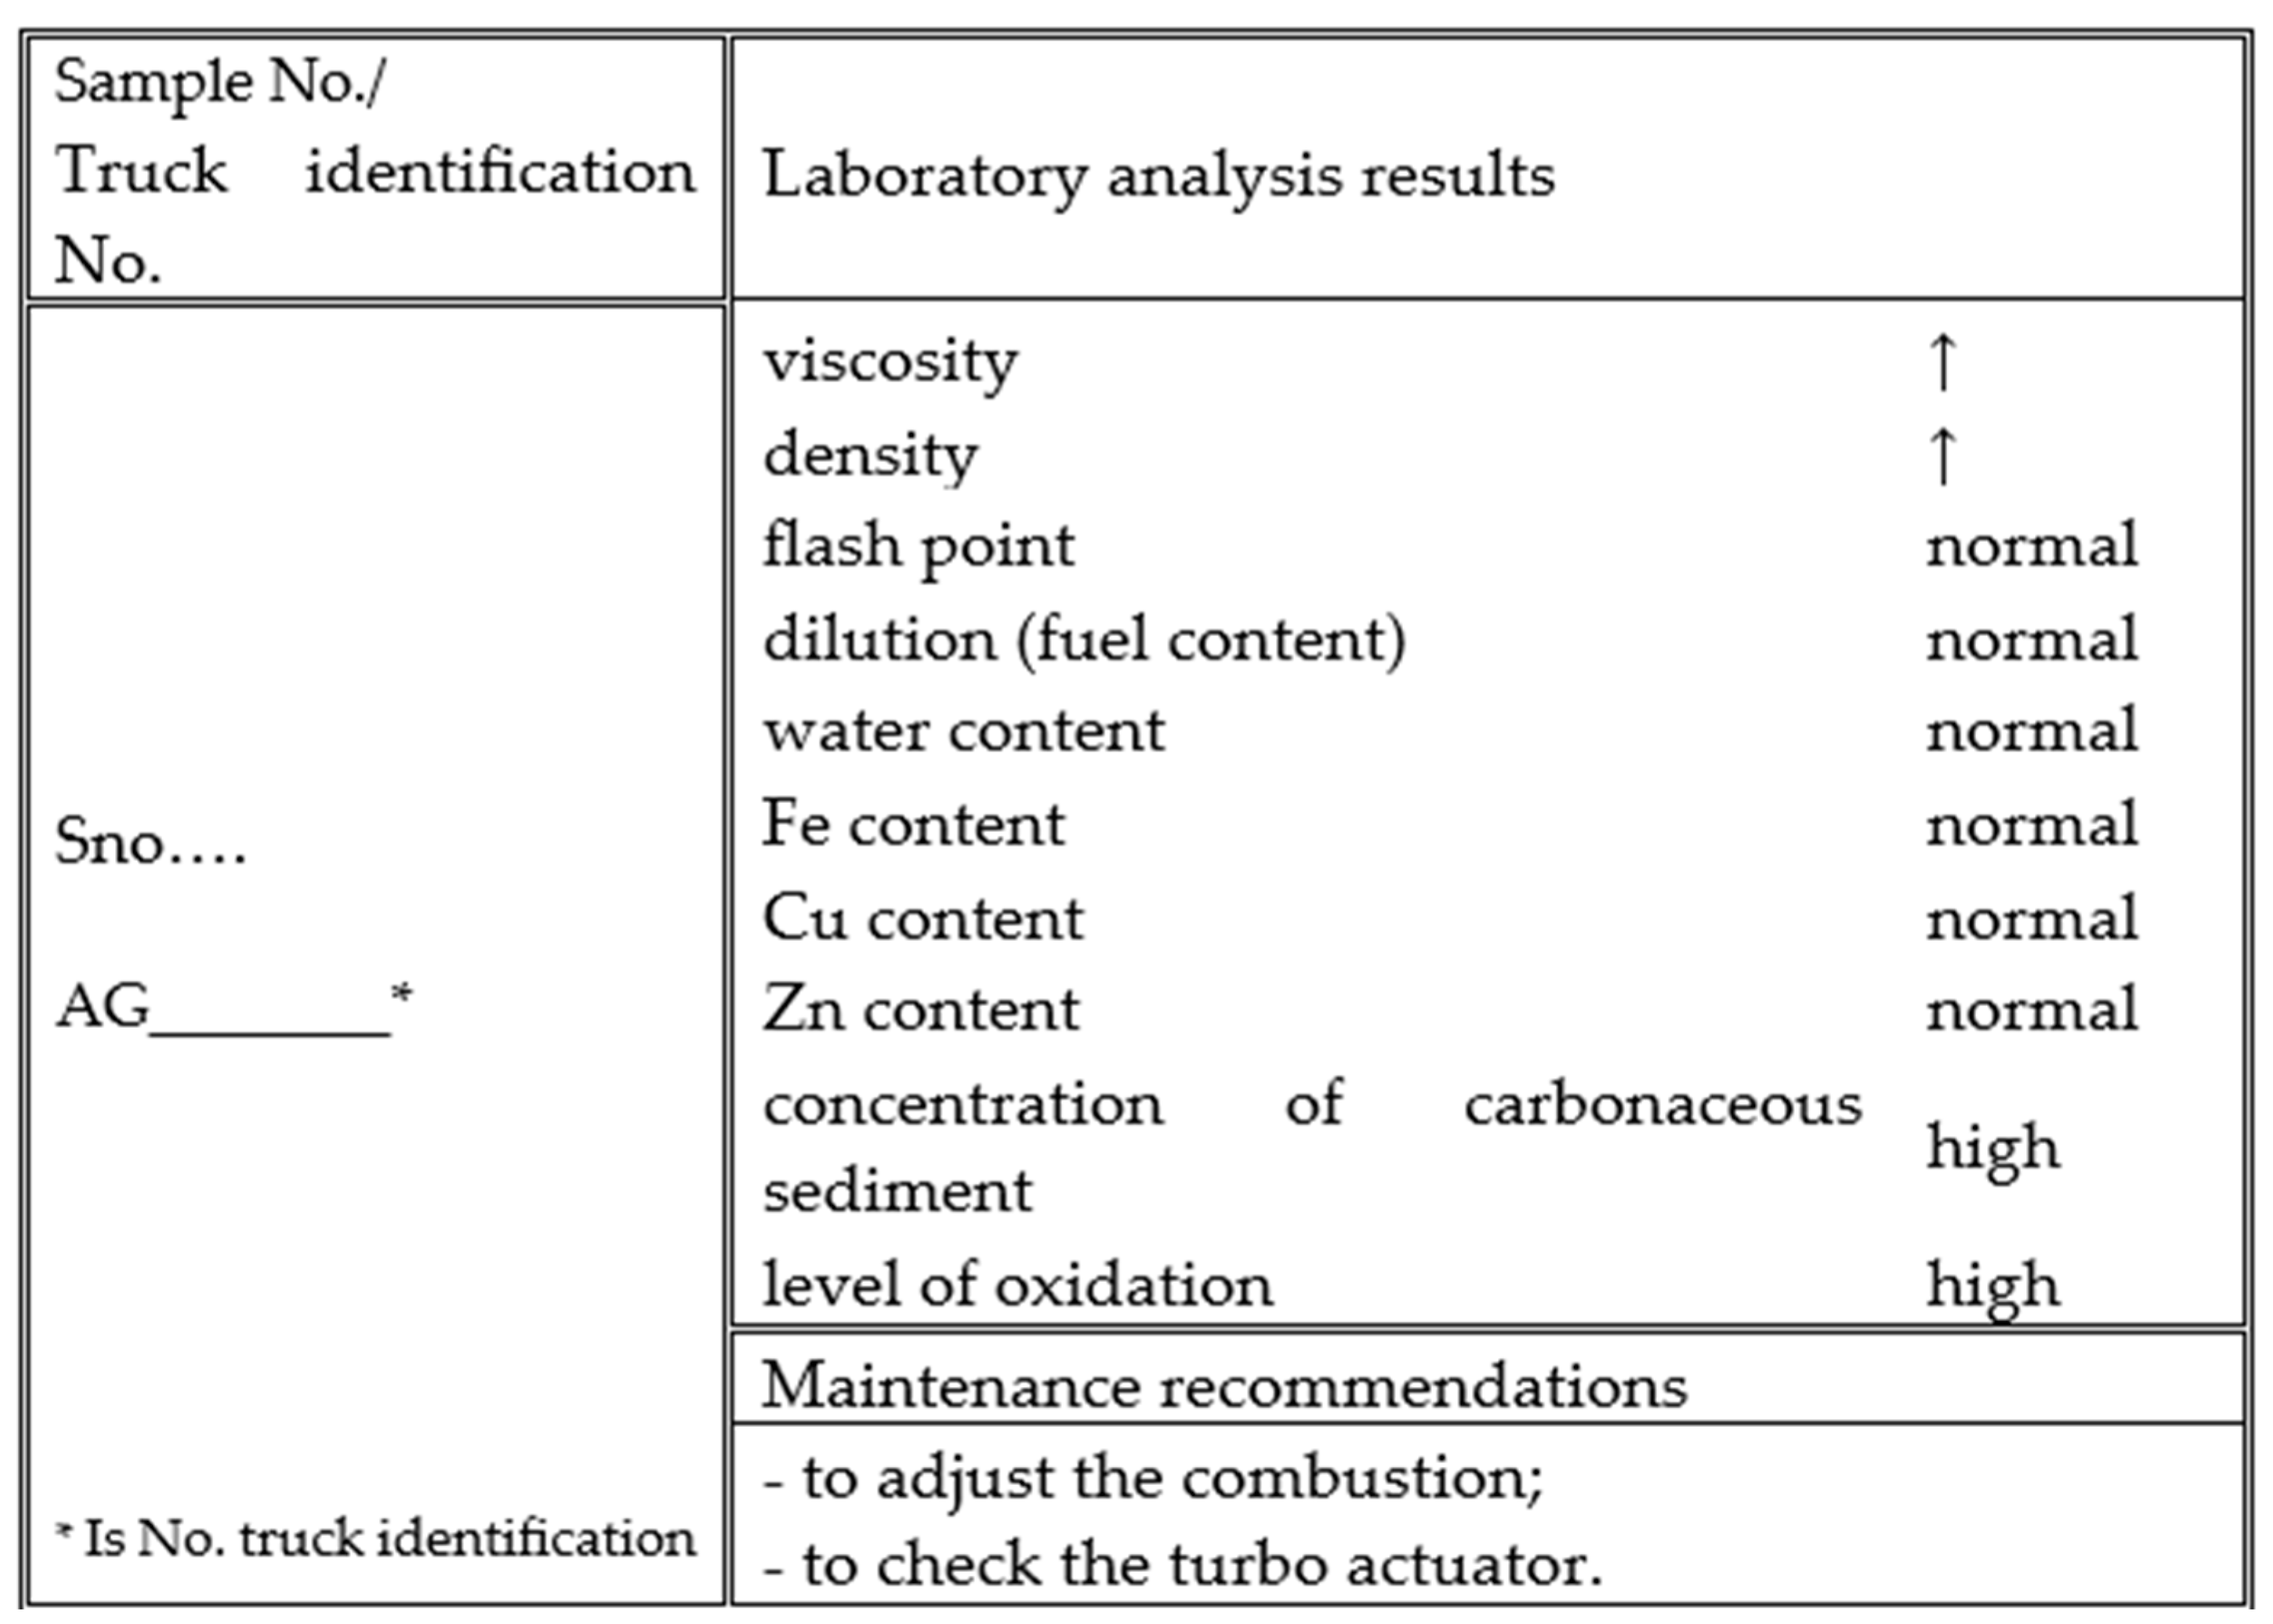
Figure 3, preventive maintenance recommendations are issued, and a sample file is drawn up according to the model in
Figure 4.
4. Results and Discussion
4.1. Kinematic Viscosity @ 40 °C [mm2/s]
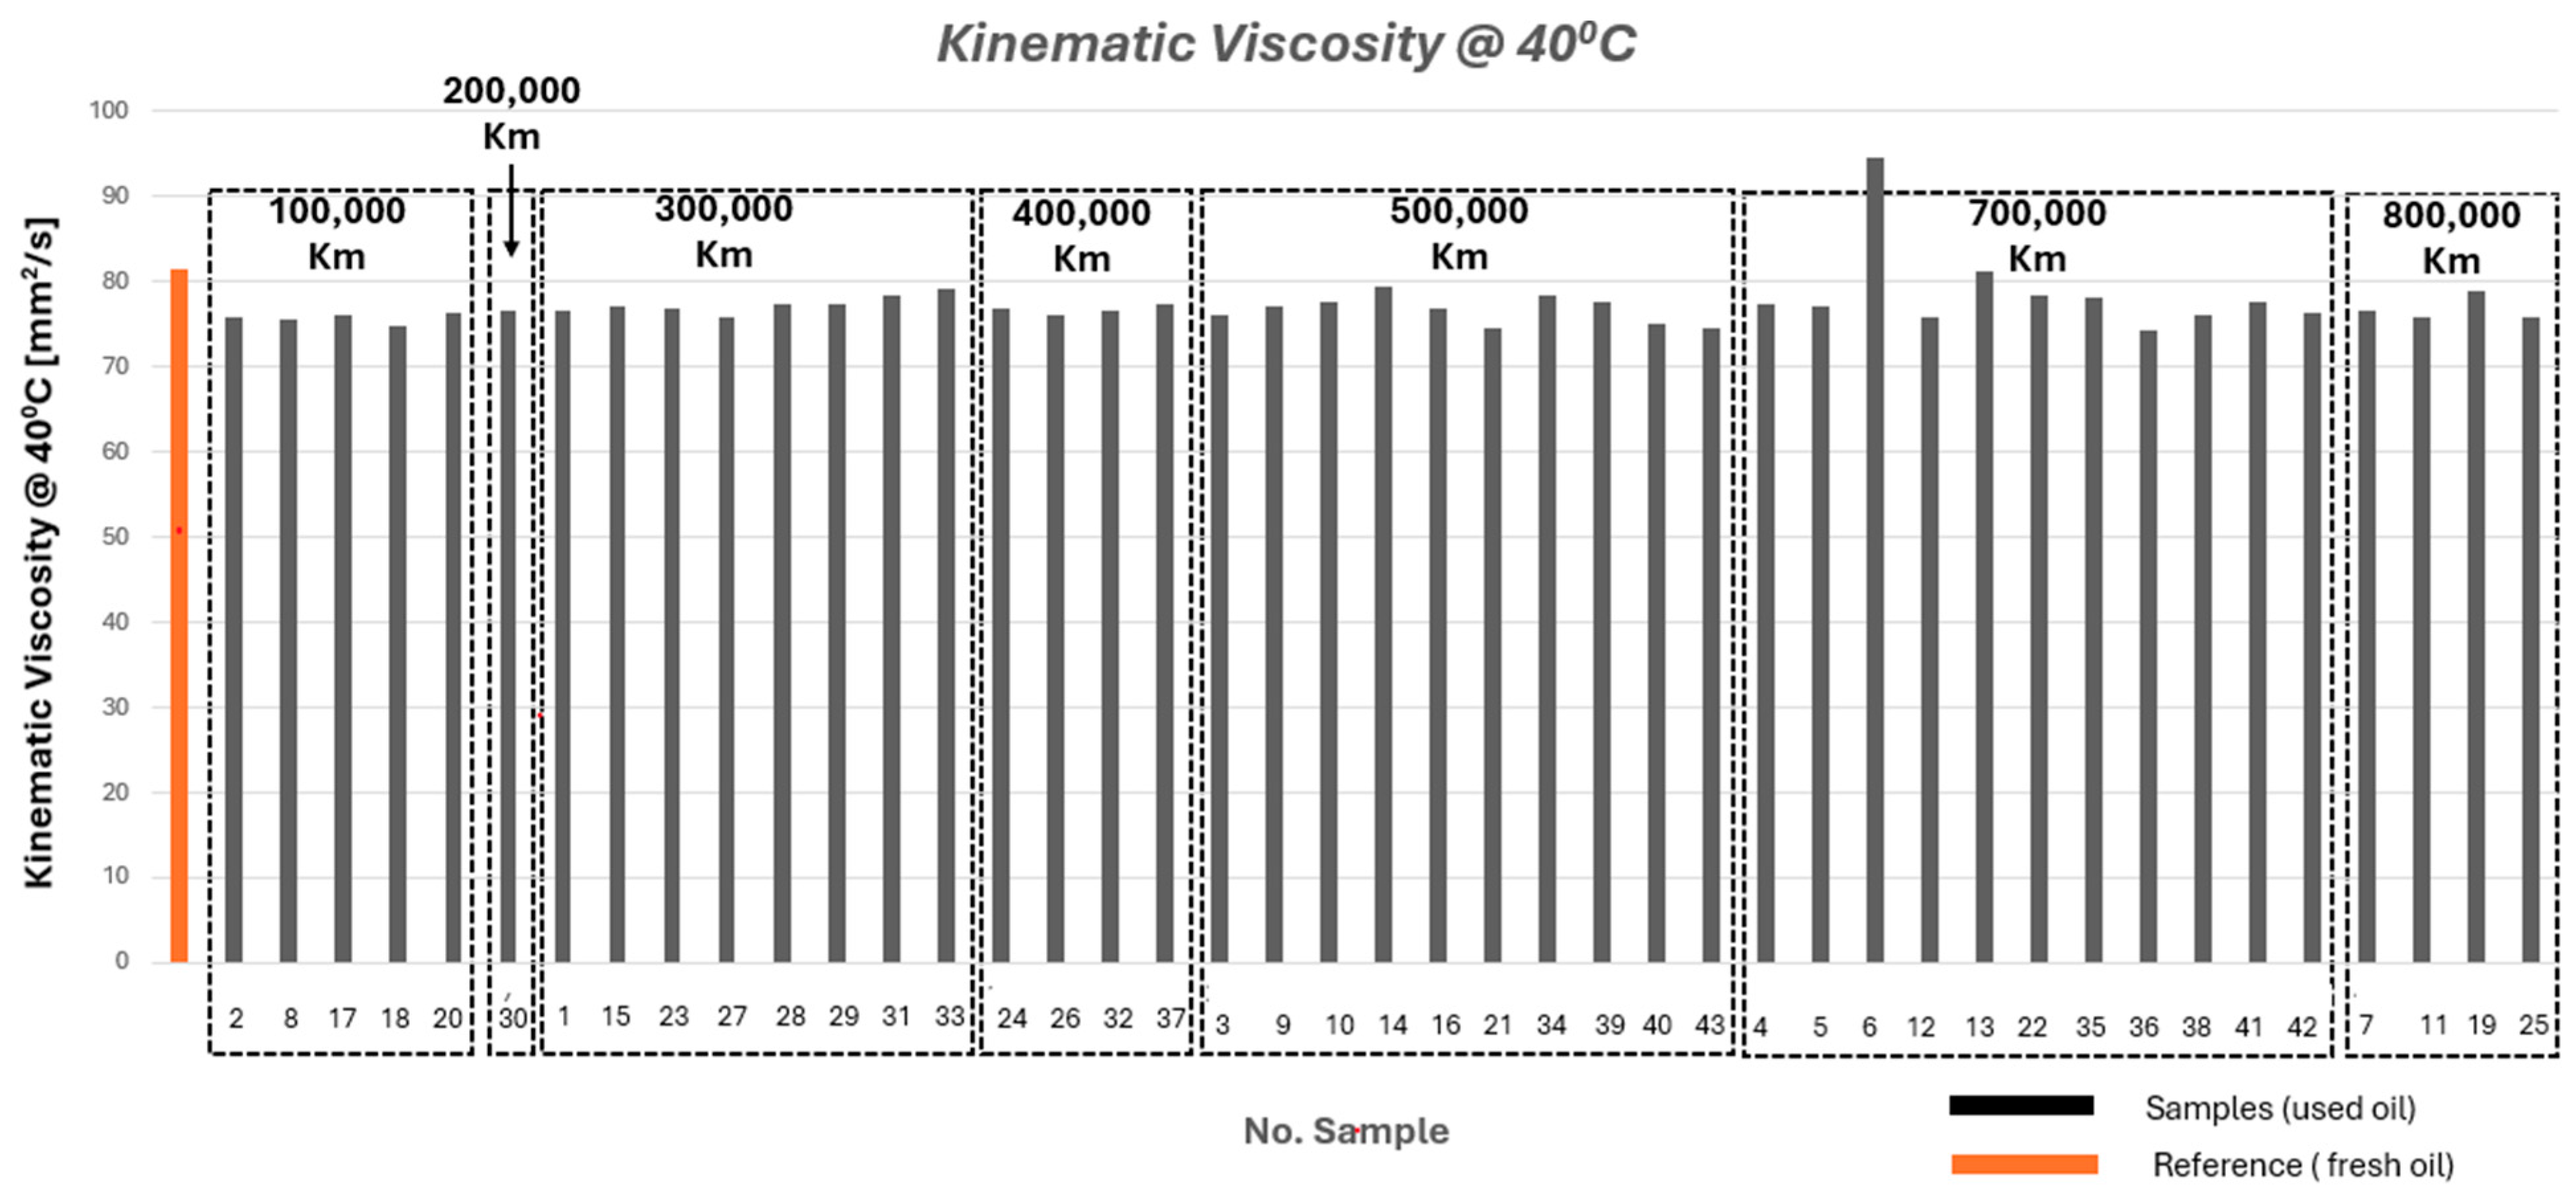
Figure 5 presents the values obtained from the analysis of the 43 samples, along with the reference value of the fresh (unused) oil.
It is observed that viscosity decreases slightly compared to the reference value, except for one sample, Sno.6 taken from a truck with a mileage of 700,000 km, for which the viscosity increased.
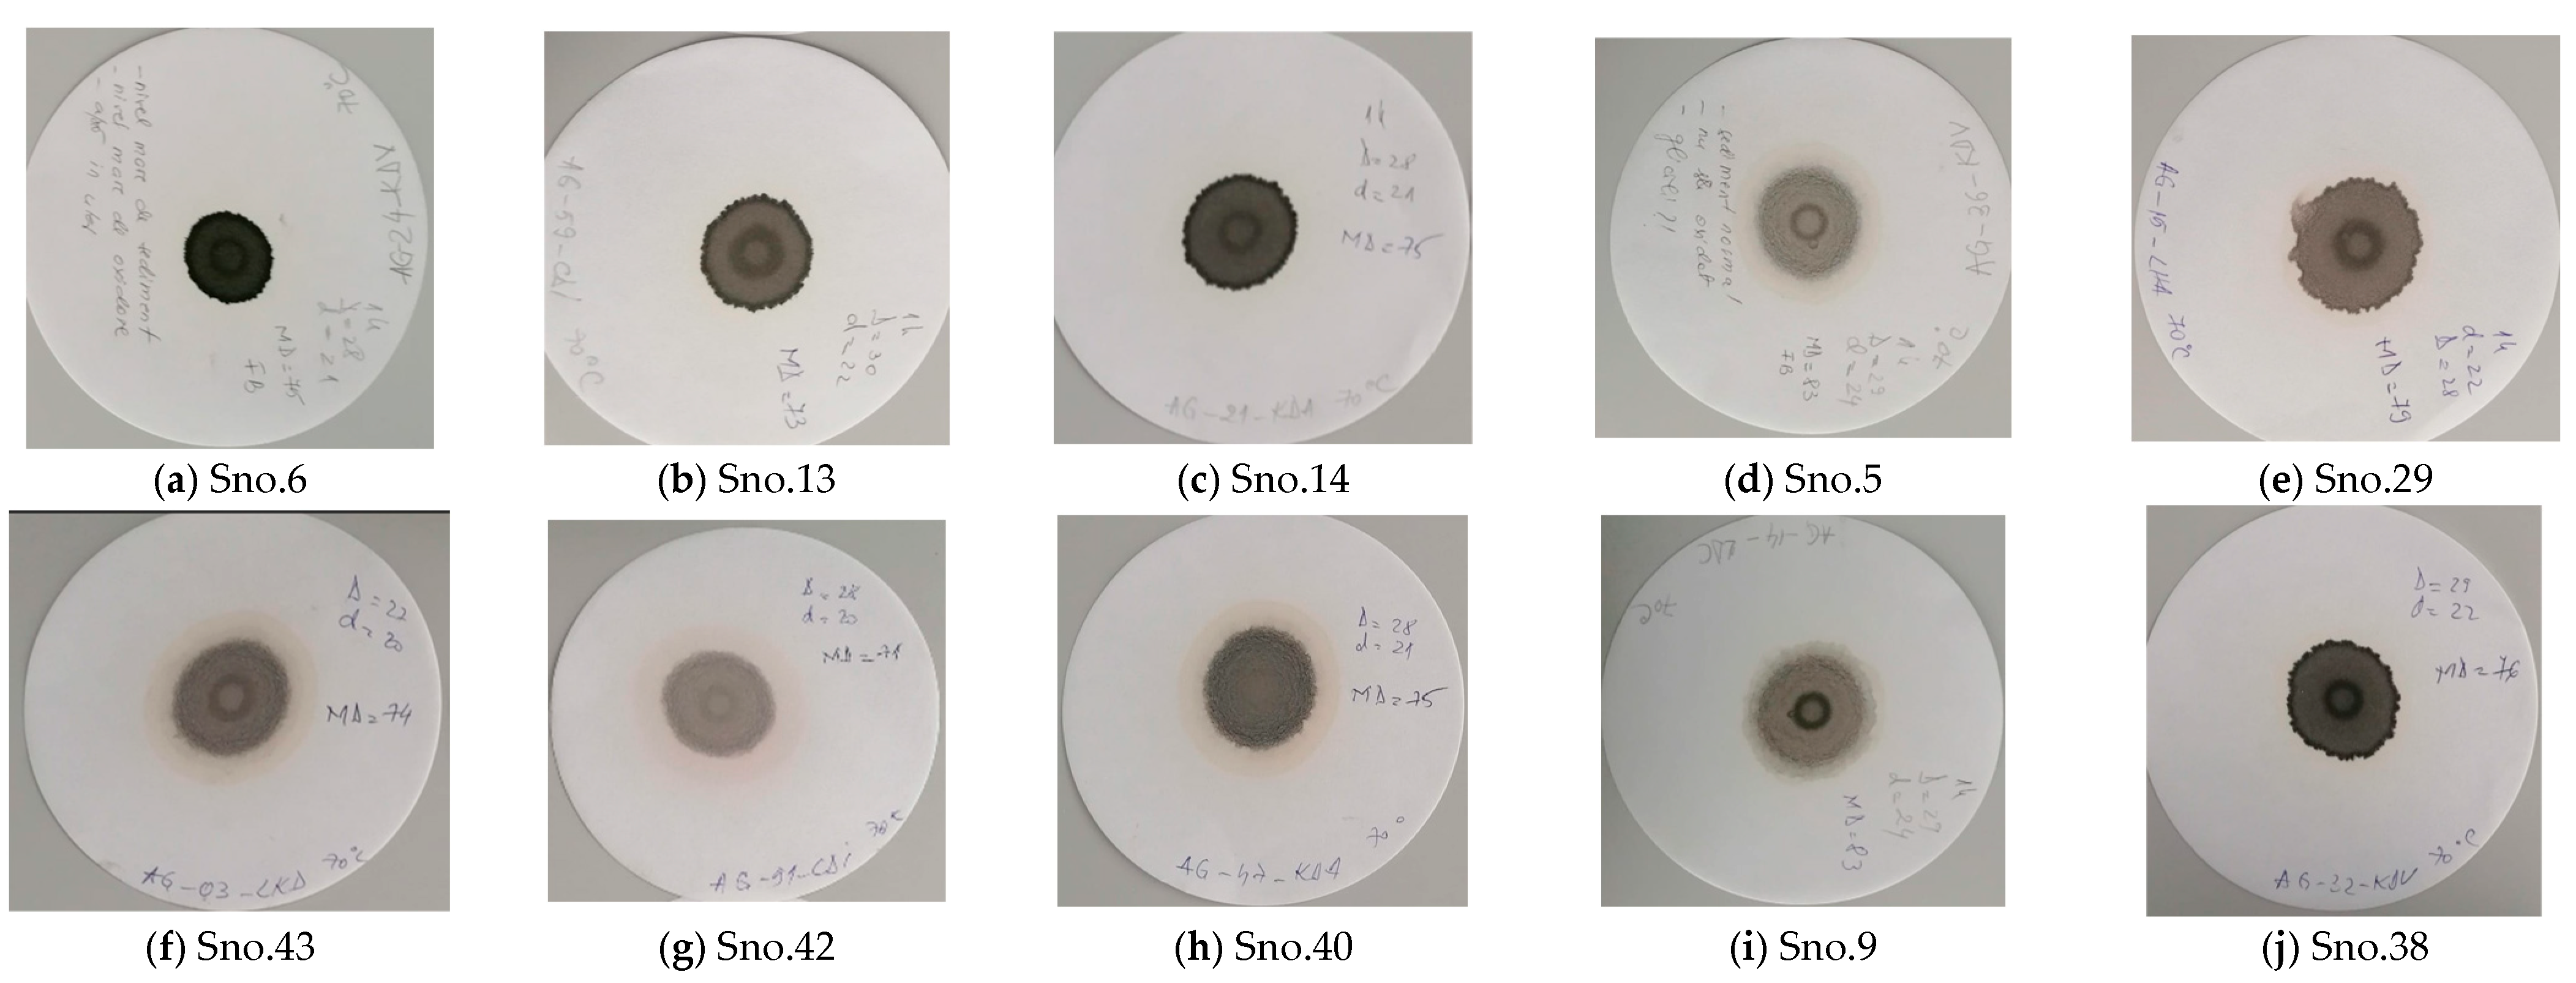
Analyzing sample Sno. 6, no large amounts of metals or water were detected. Therefore, an oil stain analysis was performed (
Figure 6a), which revealed a high concentration of carbonaceous sediment and an elevated level of oxidation. Based on these findings, it is recommended to adjust the combustion process. This involves checking the engine timing, upgrading the camshaft, replacing the cam followers and gaskets, adjusting the high-pressure diesel pump, and also inspecting the turbocharger actuator, which controls the closing and opening of the exhaust valve while maintaining the compression pressure at predetermined values. A malfunction of this component could either decrease the boost pressure, reducing the engine’s energetic performance, or increase the pressure to dangerous levels, potentially causing severe engine damage.
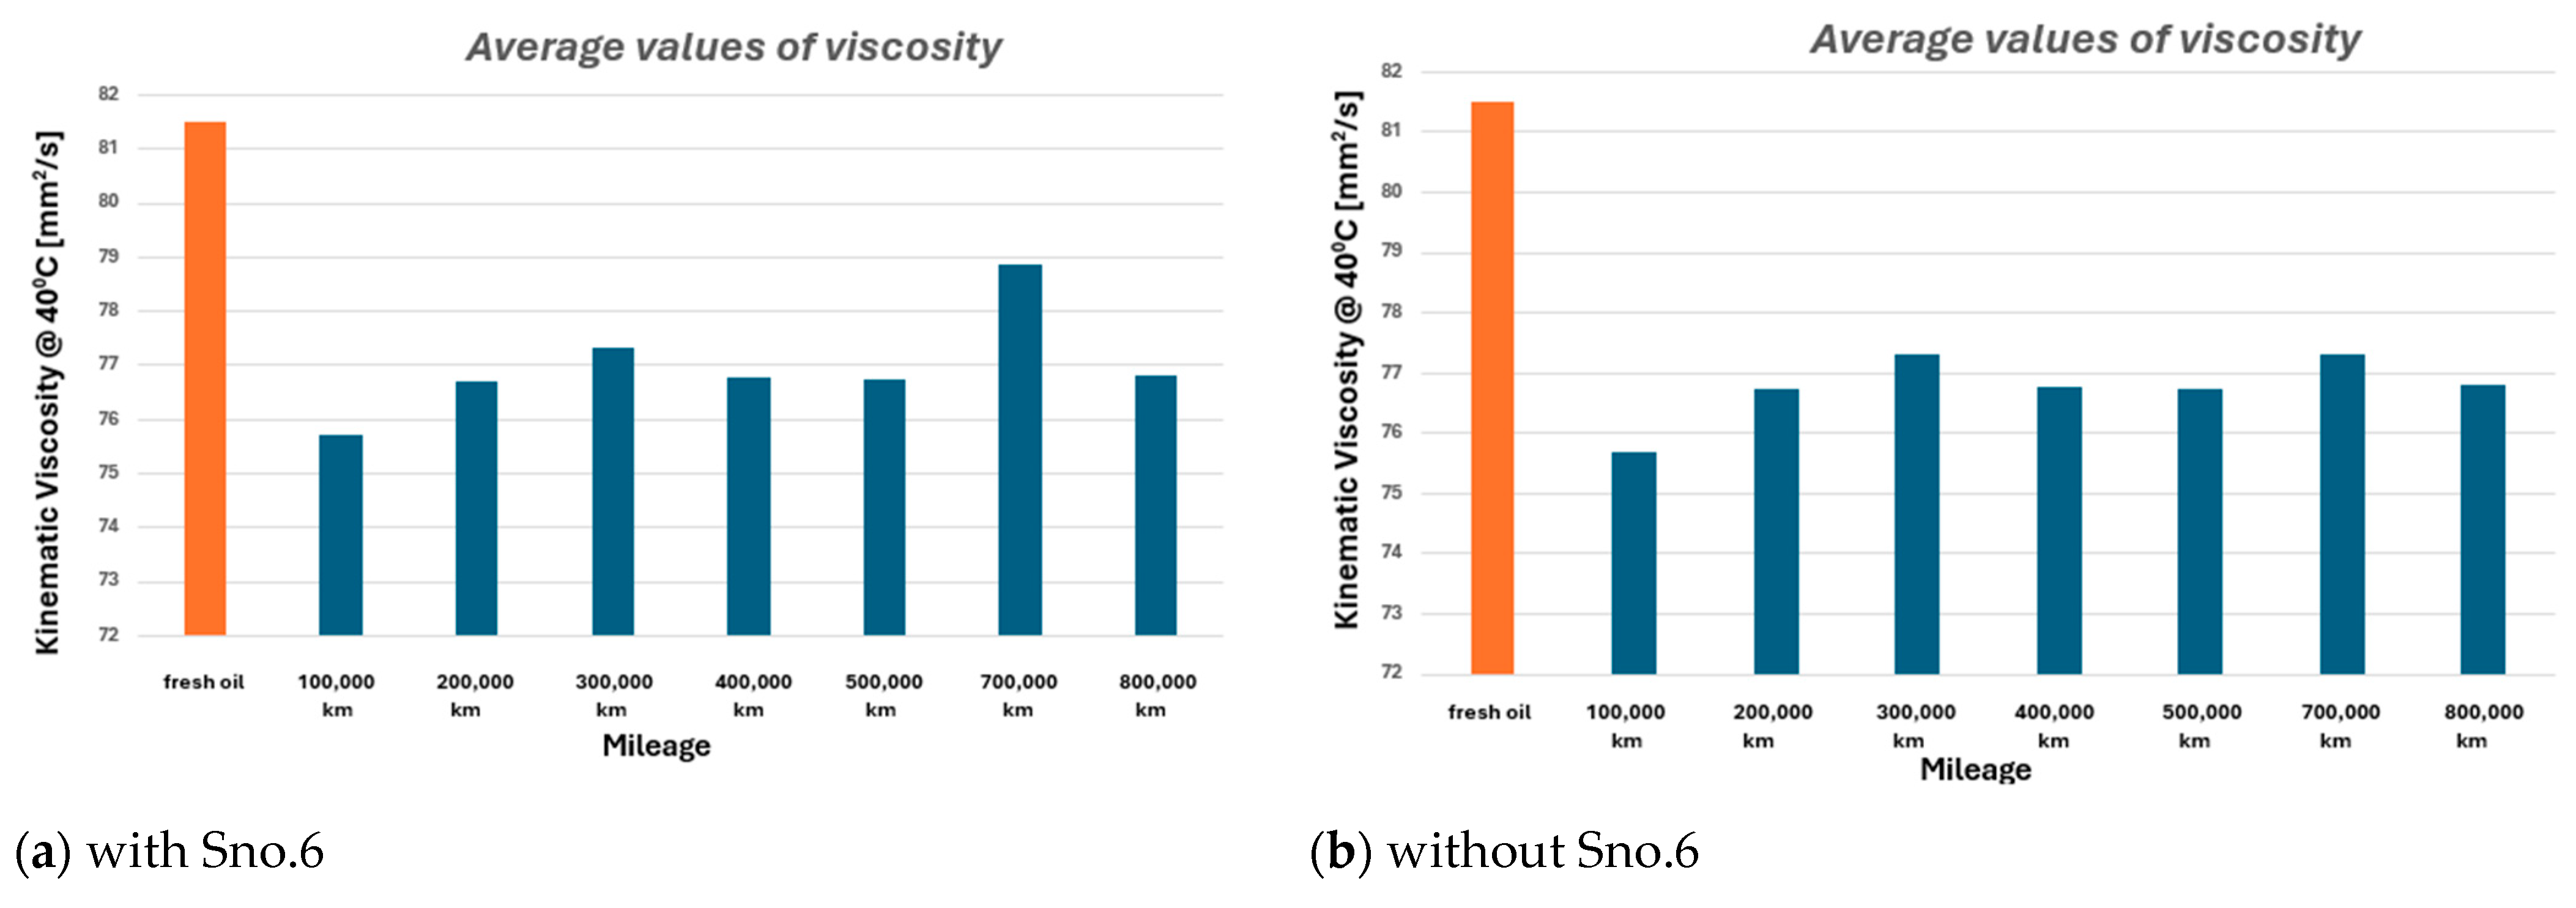
To follow the viscosity variation trend,
Figure 7a presents the average viscosity variation by mileage category. A smaller decrease is observed for the 700,000 km category, which is most likely due to sample Sno. 6. After eliminating this sample,
Figure 7b shows more consistent values. However, the most pronounced drop in viscosity occurs in new trucks with a mileage of 100,000 km. This effect is explained by the fact that new engines are still in the break-in period, during which the operating thermal regime is relatively high due to increased friction.
As mentioned in [
2], the deviation of engine oil viscosity during operation must not exceed 20%.
Figure 8 shows that all samples fall within these limits.
4.2. Density @ 15 °C [g/cm3]
The density was measured at a temperature of 15 °C and, according to [
28,
29], its values for most oils are 700–950 [kg/m
3], and for compression ignition engine oil it must be 820–950 [kg/m
3].
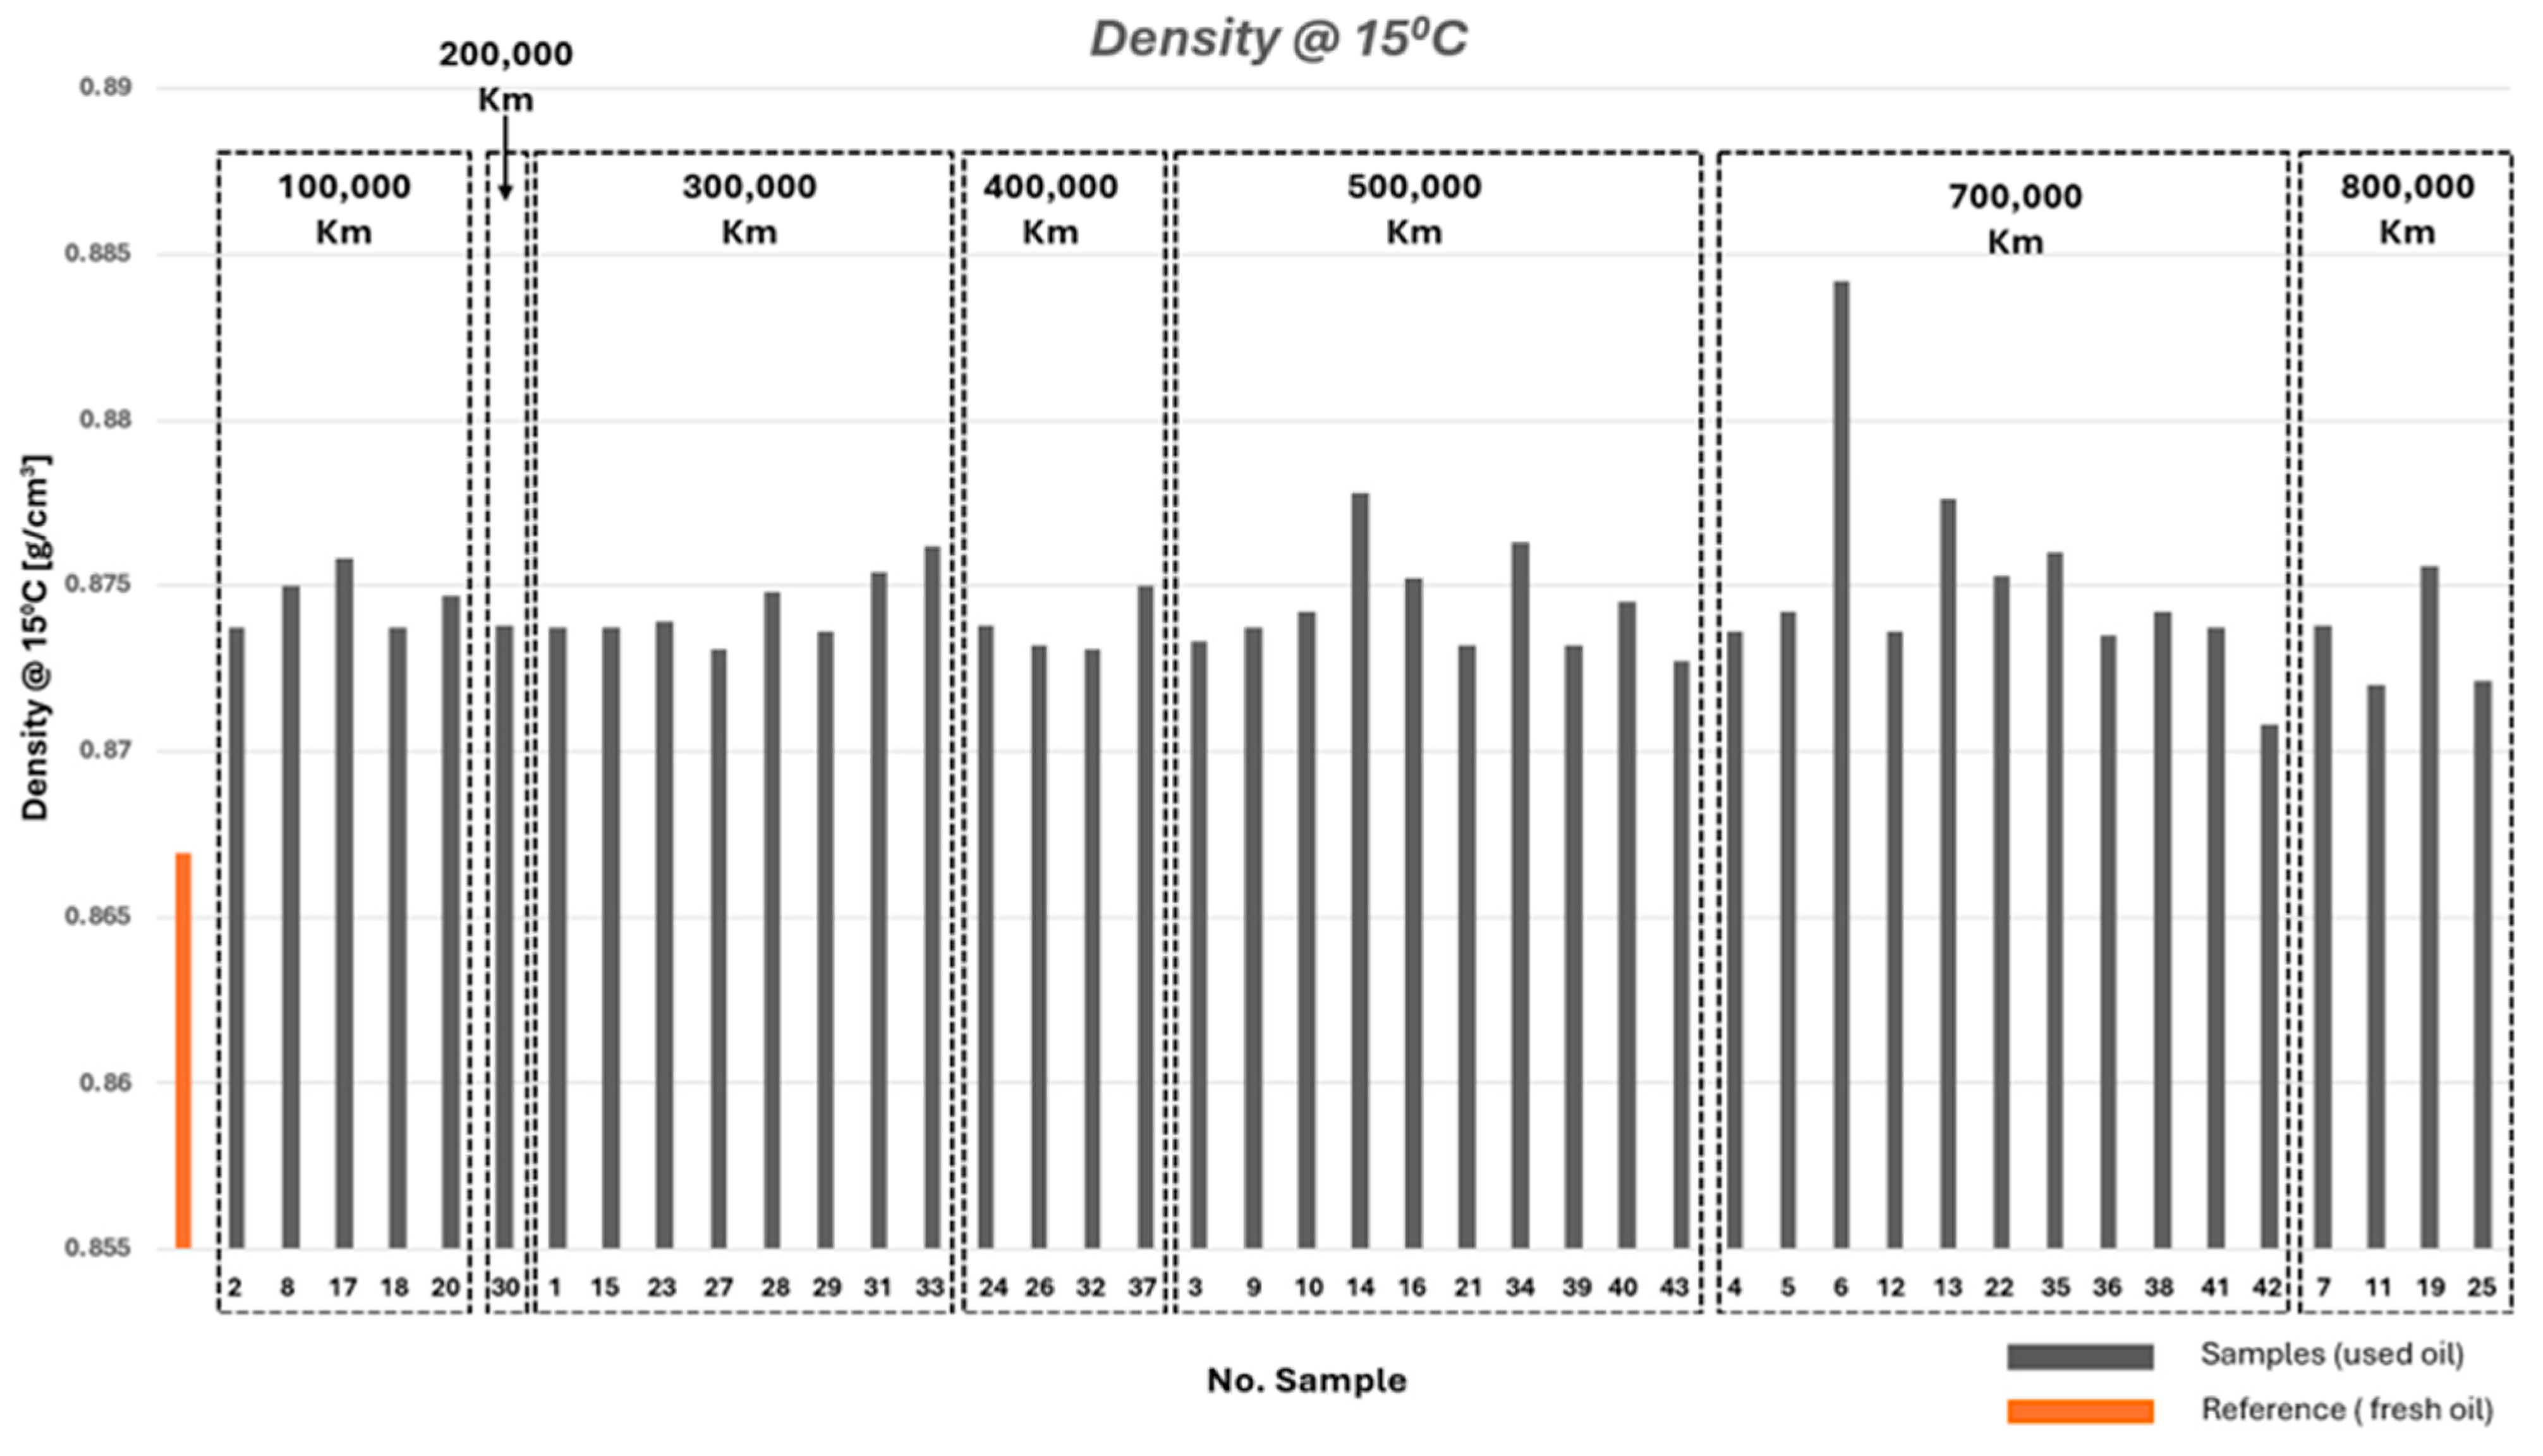
Figure 9 presents the density values of the 43 samples compared with that of the fresh oil. All samples show higher density than the fresh oil, with Sno.6 recording the highest value. Elevated density values were also observed for Sno.13 and Sno.14.
For Sno.6, which also has the highest viscosity value, recommendations were made above, in
Section 4.1. For Sno.13, a very slight decrease in viscosity is also observed (
Figure 5), but also a high iron content (see
Section 4.5), thus, it is necessary to check the wear of the engine block, crankshaft, segments, cylinders, valve guides, camshafts, gears, bearings, and fuel pump elements. To complete the analysis of samples Sno.13 and Sno.14, an oil stain analysis was also performed (
Figure 6b,c) and, for both, a high level of sediment and high oxidation level are found. Thus, it is recommended to adjust the engine to obtain complete combustion, check the sealing elements in the cooling system (cylinder head gasket, thermoflot, which is a heat exchanger used to regulate the temperature of the engine oil, i.e., cooling the oil during operation or heating the oil during a cold start, etc.), and, also, check the turbo actuator.
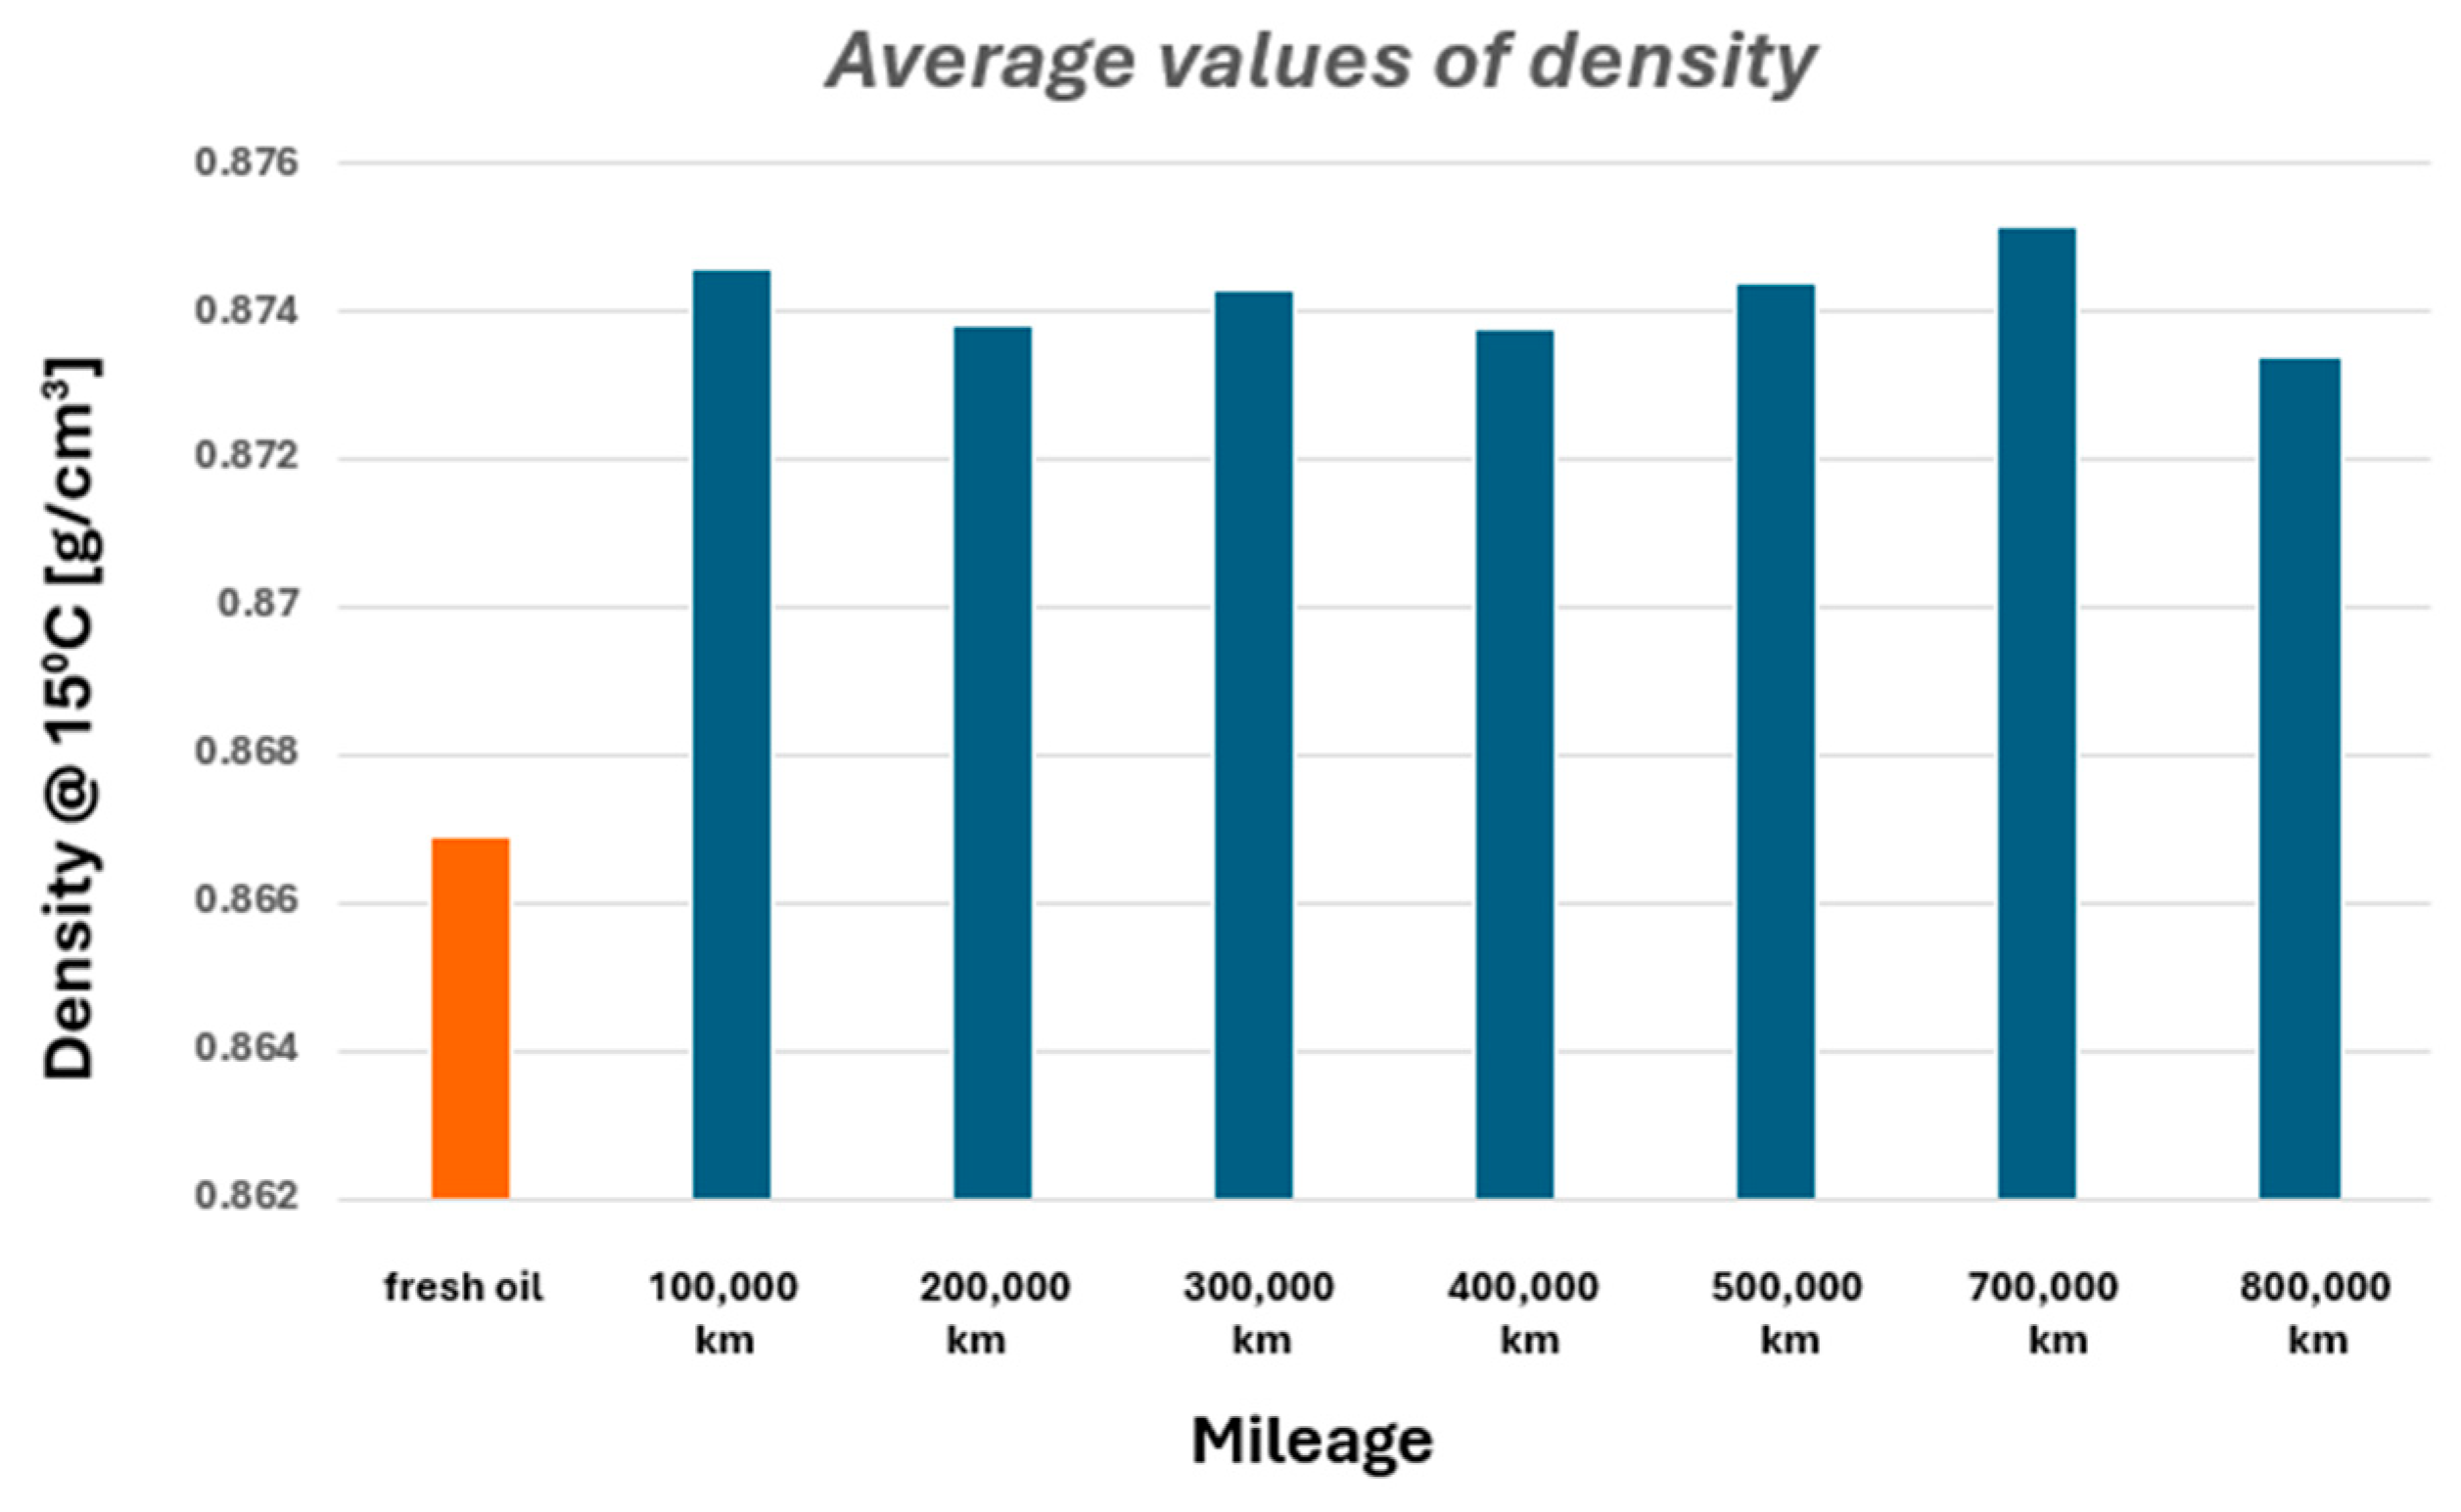
The average values of the oil density in engines with the same mileage are presented in
Figure 10. Comparatively, between the different mileage categories, small variations in these values are observed.
The largest increases in density can be seen in the 700,000 km and 100,000 km mileage categories. In
Figure 11, the density limits of the engine oil during operation are presented. It can be observed that all the samples are within these limits.
4.3. Flash Point and Oil Dilution
The flash point (FP) was determined using the “continuous closed cup” method.
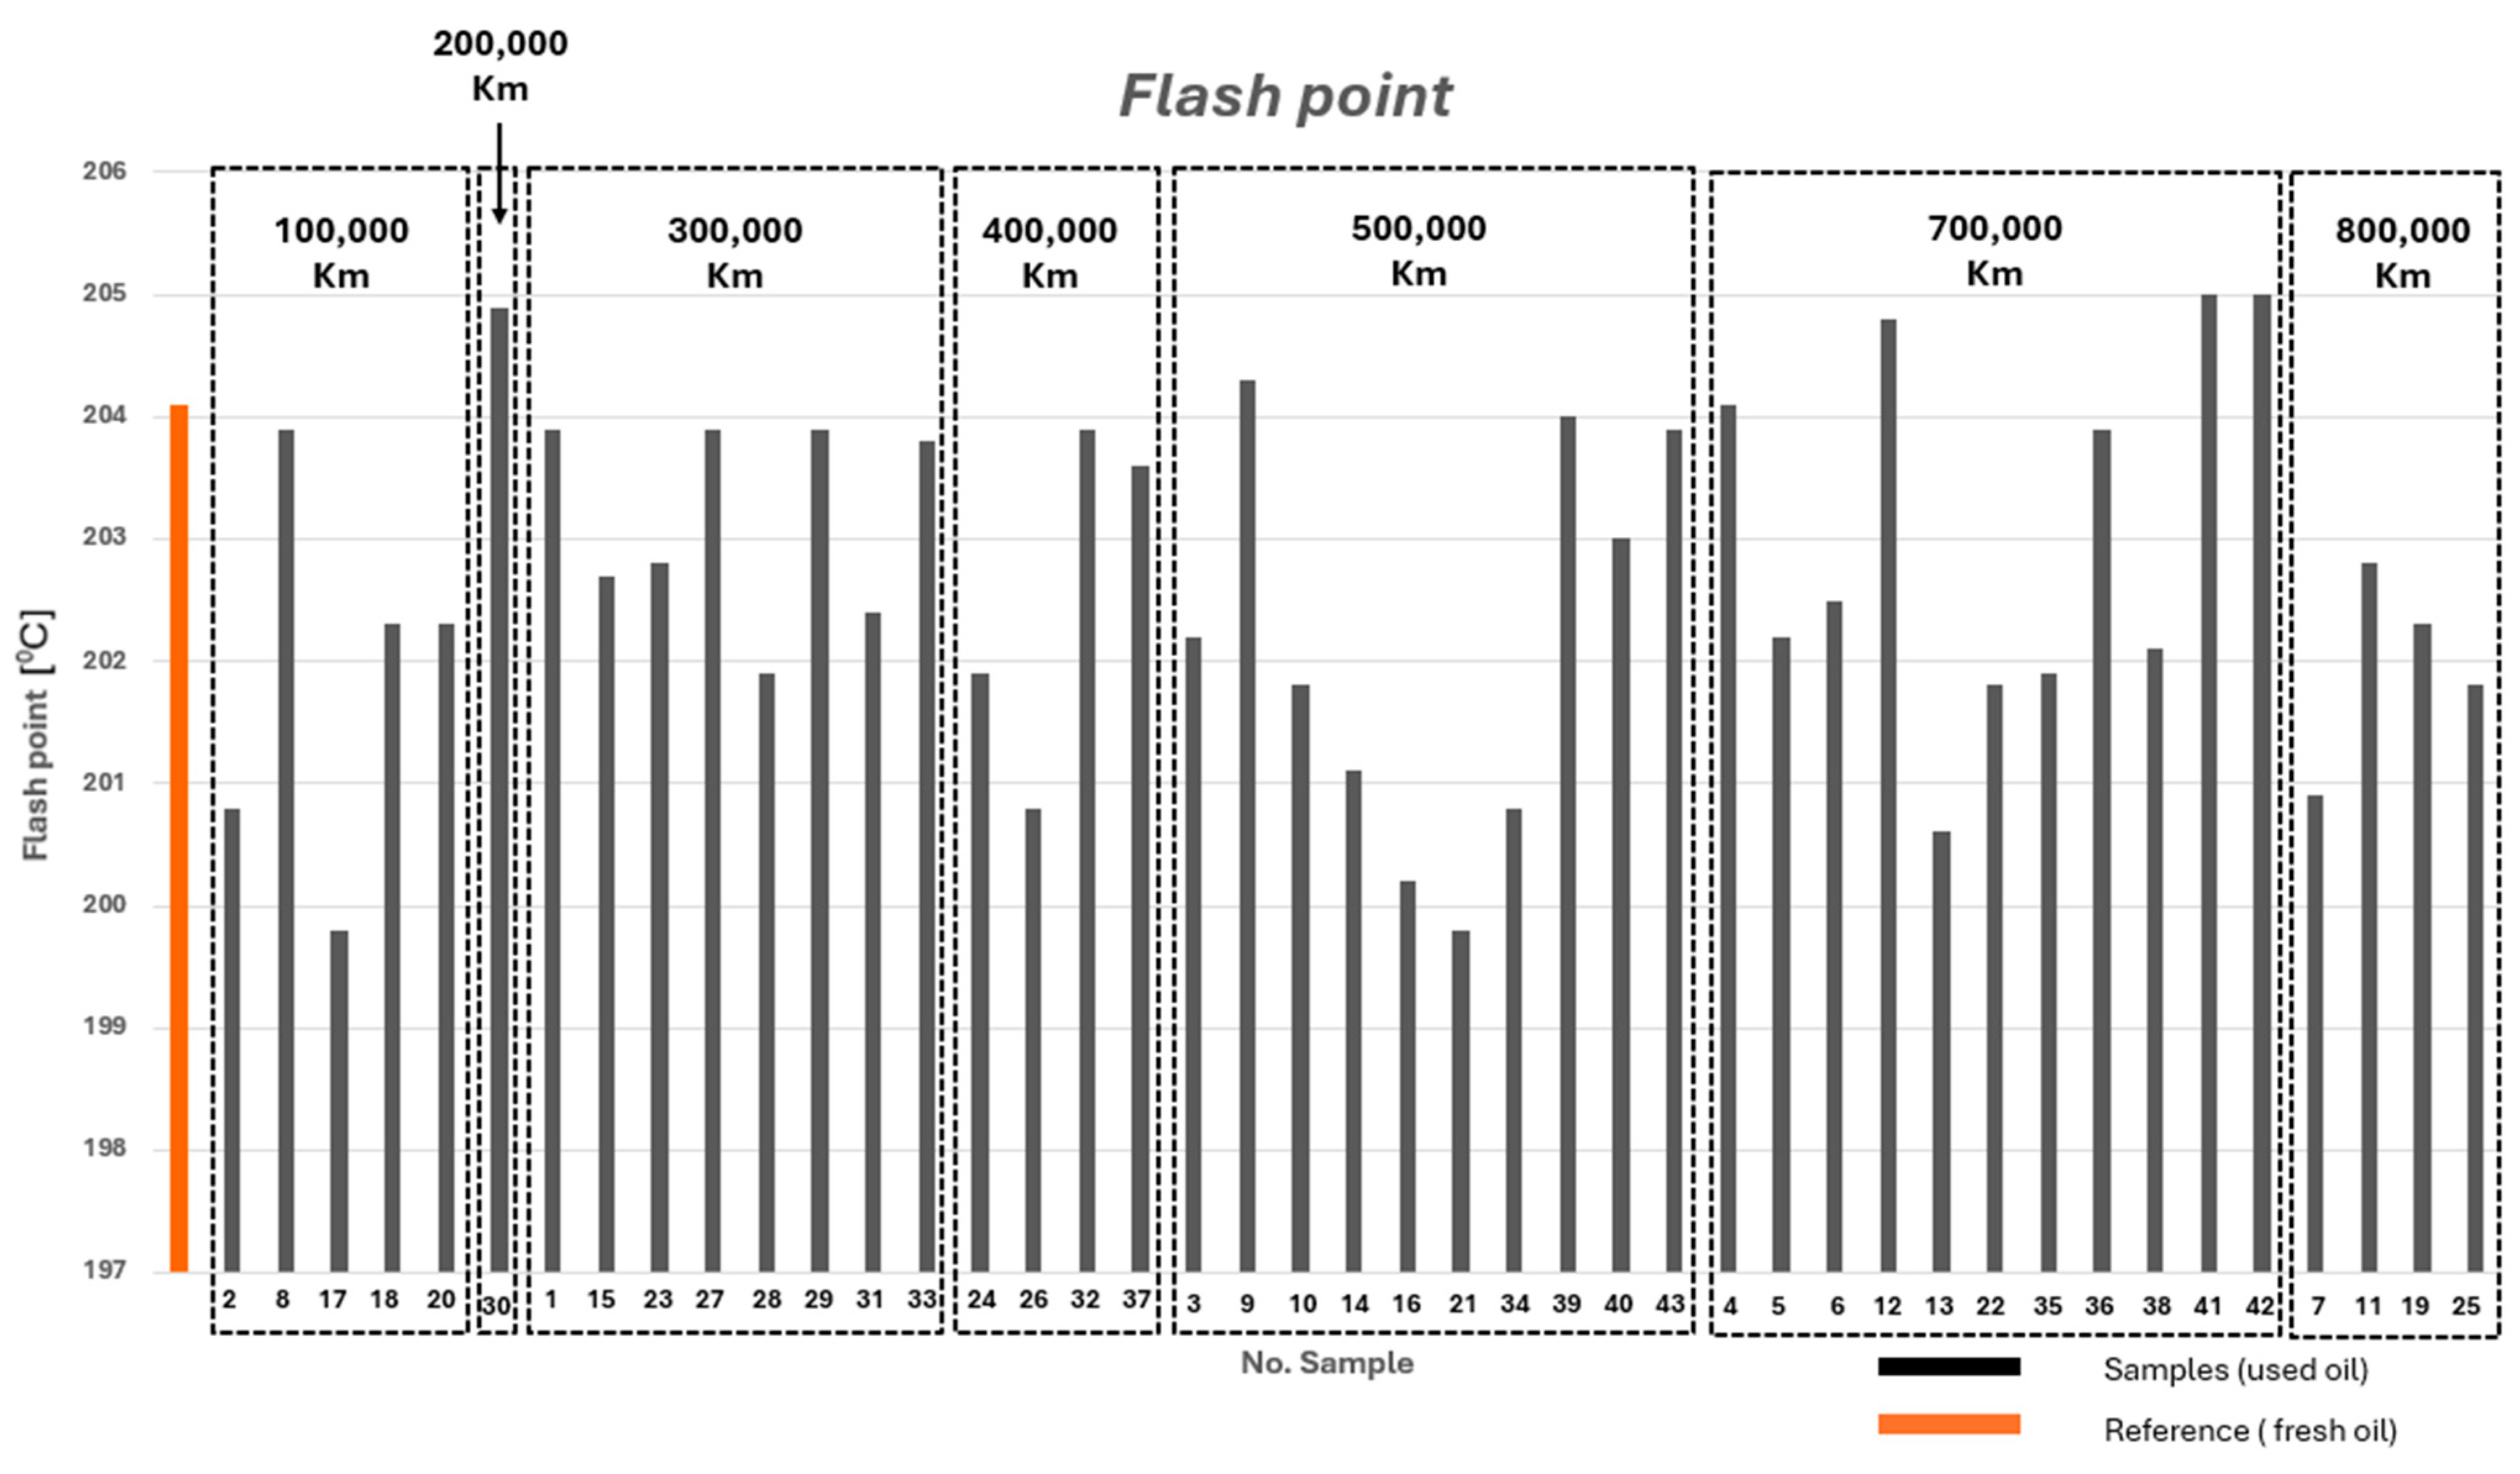
Figure 12 shows the flash point values for the 43 used oil samples compared with the fresh oil. Five samples (Sno.30, Sno.9, Sno.12, Sno.41, and Sno.42) recorded an increase, one sample (Sno.4) showed no change, while the others exhibited a decrease in flash point.
Considering the causes of the increase in the flash point presented in
Section 2, analyzing the results obtained from samples Sno.9 and Sno.42, a low Zn content was also found (see
Section 4.5), which indicates the deterioration of the additives in the oil. Therefore, as a maintenance strategy, it is recommended to check the temperature level and adjust the engine to obtain combustion within normal limits, it being necessary to also check the turbocharger actuator, which, if damaged, can lead to engine overheating and increased engine pressures. In the case of sample Sno.41, according to
Section 4.4, the presence of coolant/water is observed which may be the cause of the increase in the flash point. In this case, it is recommended to check the sealing elements. Damage to the thermoflot gasket may be a problem. It is also recommended, for all these five samples, to check the gas purifier filter which has the role of recycling/filtering crankcase gases.
The lowest FP values (below 200 °C) are found in samples Sno.17 and Sno.21, and fuel dilution could be the main cause. Defective injectors, or abnormal fuel combustion, can lead to fuel leakage into the oil pan. For these samples, it is recommended to adjust the engine, as well as checking the injectors and turbo actuator.
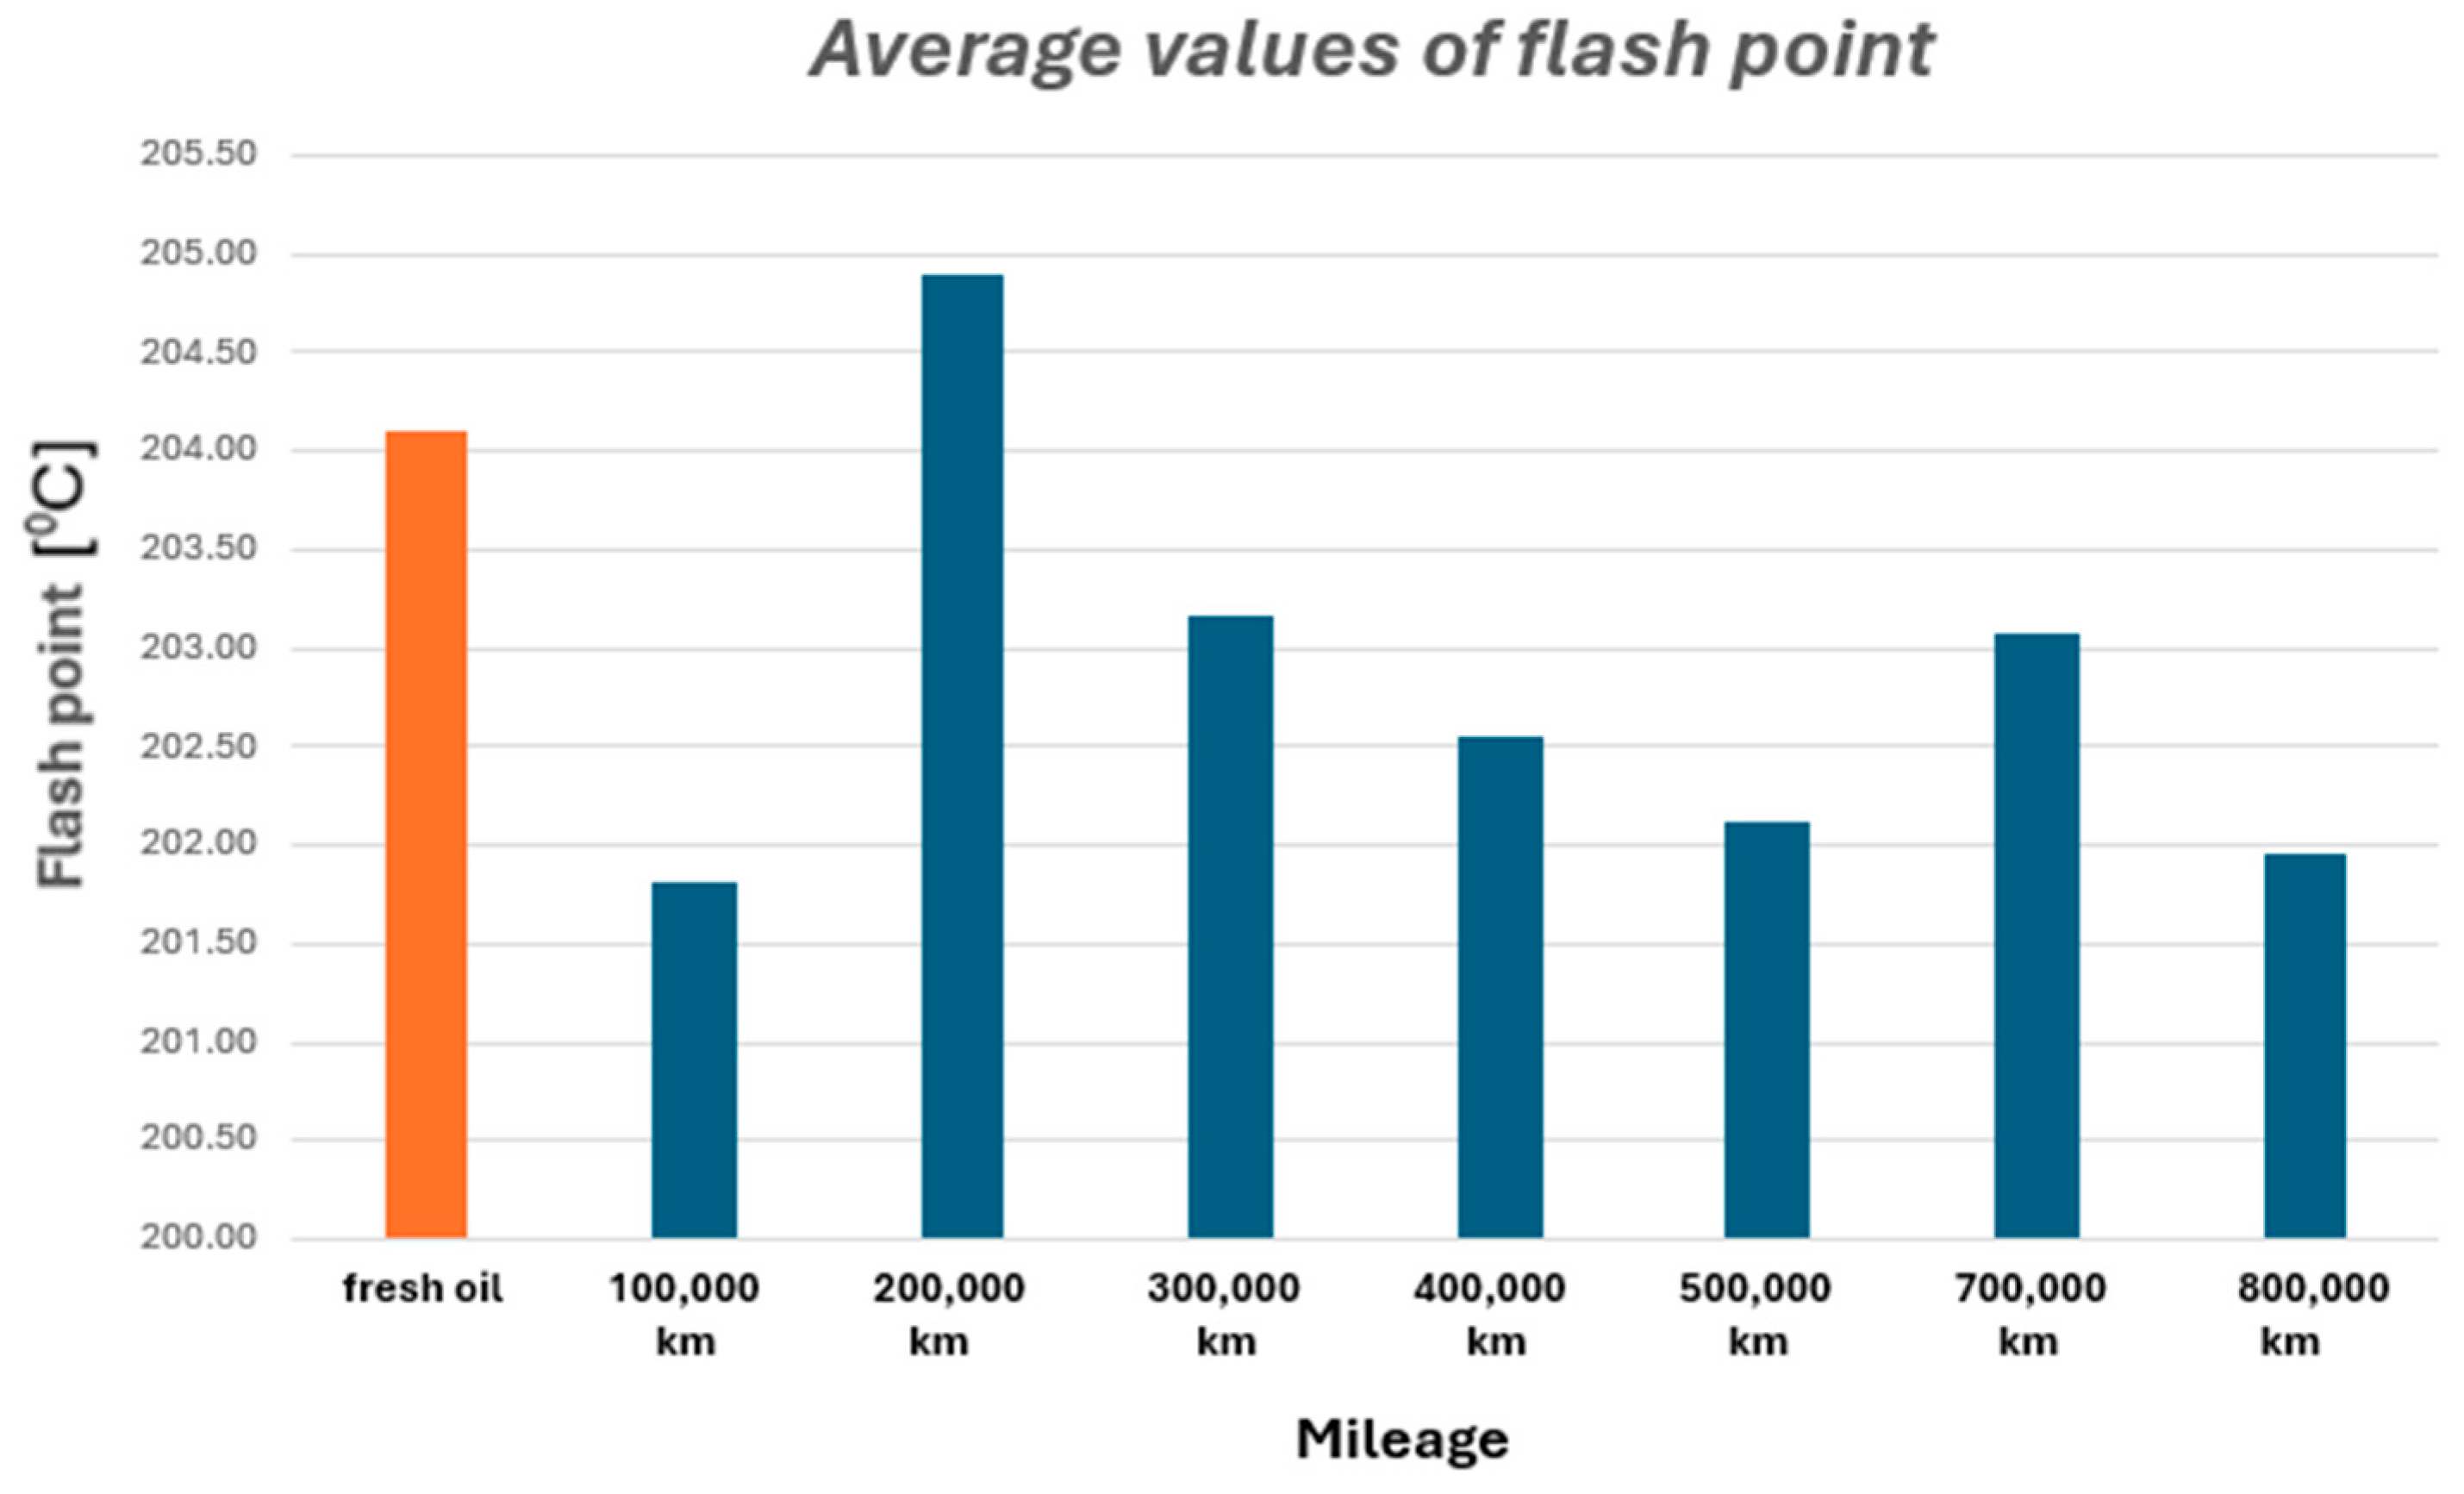
In
Figure 13, the average values of the flash point by mileage are presented. It is observed that the most pronounced decrease is in the mileage segment of 100,000 km. In the segment of 200,000 km an increase in the flash point is observed, but being only one sample, in this case it is not conclusive. Comparatively, between the different mileage categories, small variations in flash point values are observed.
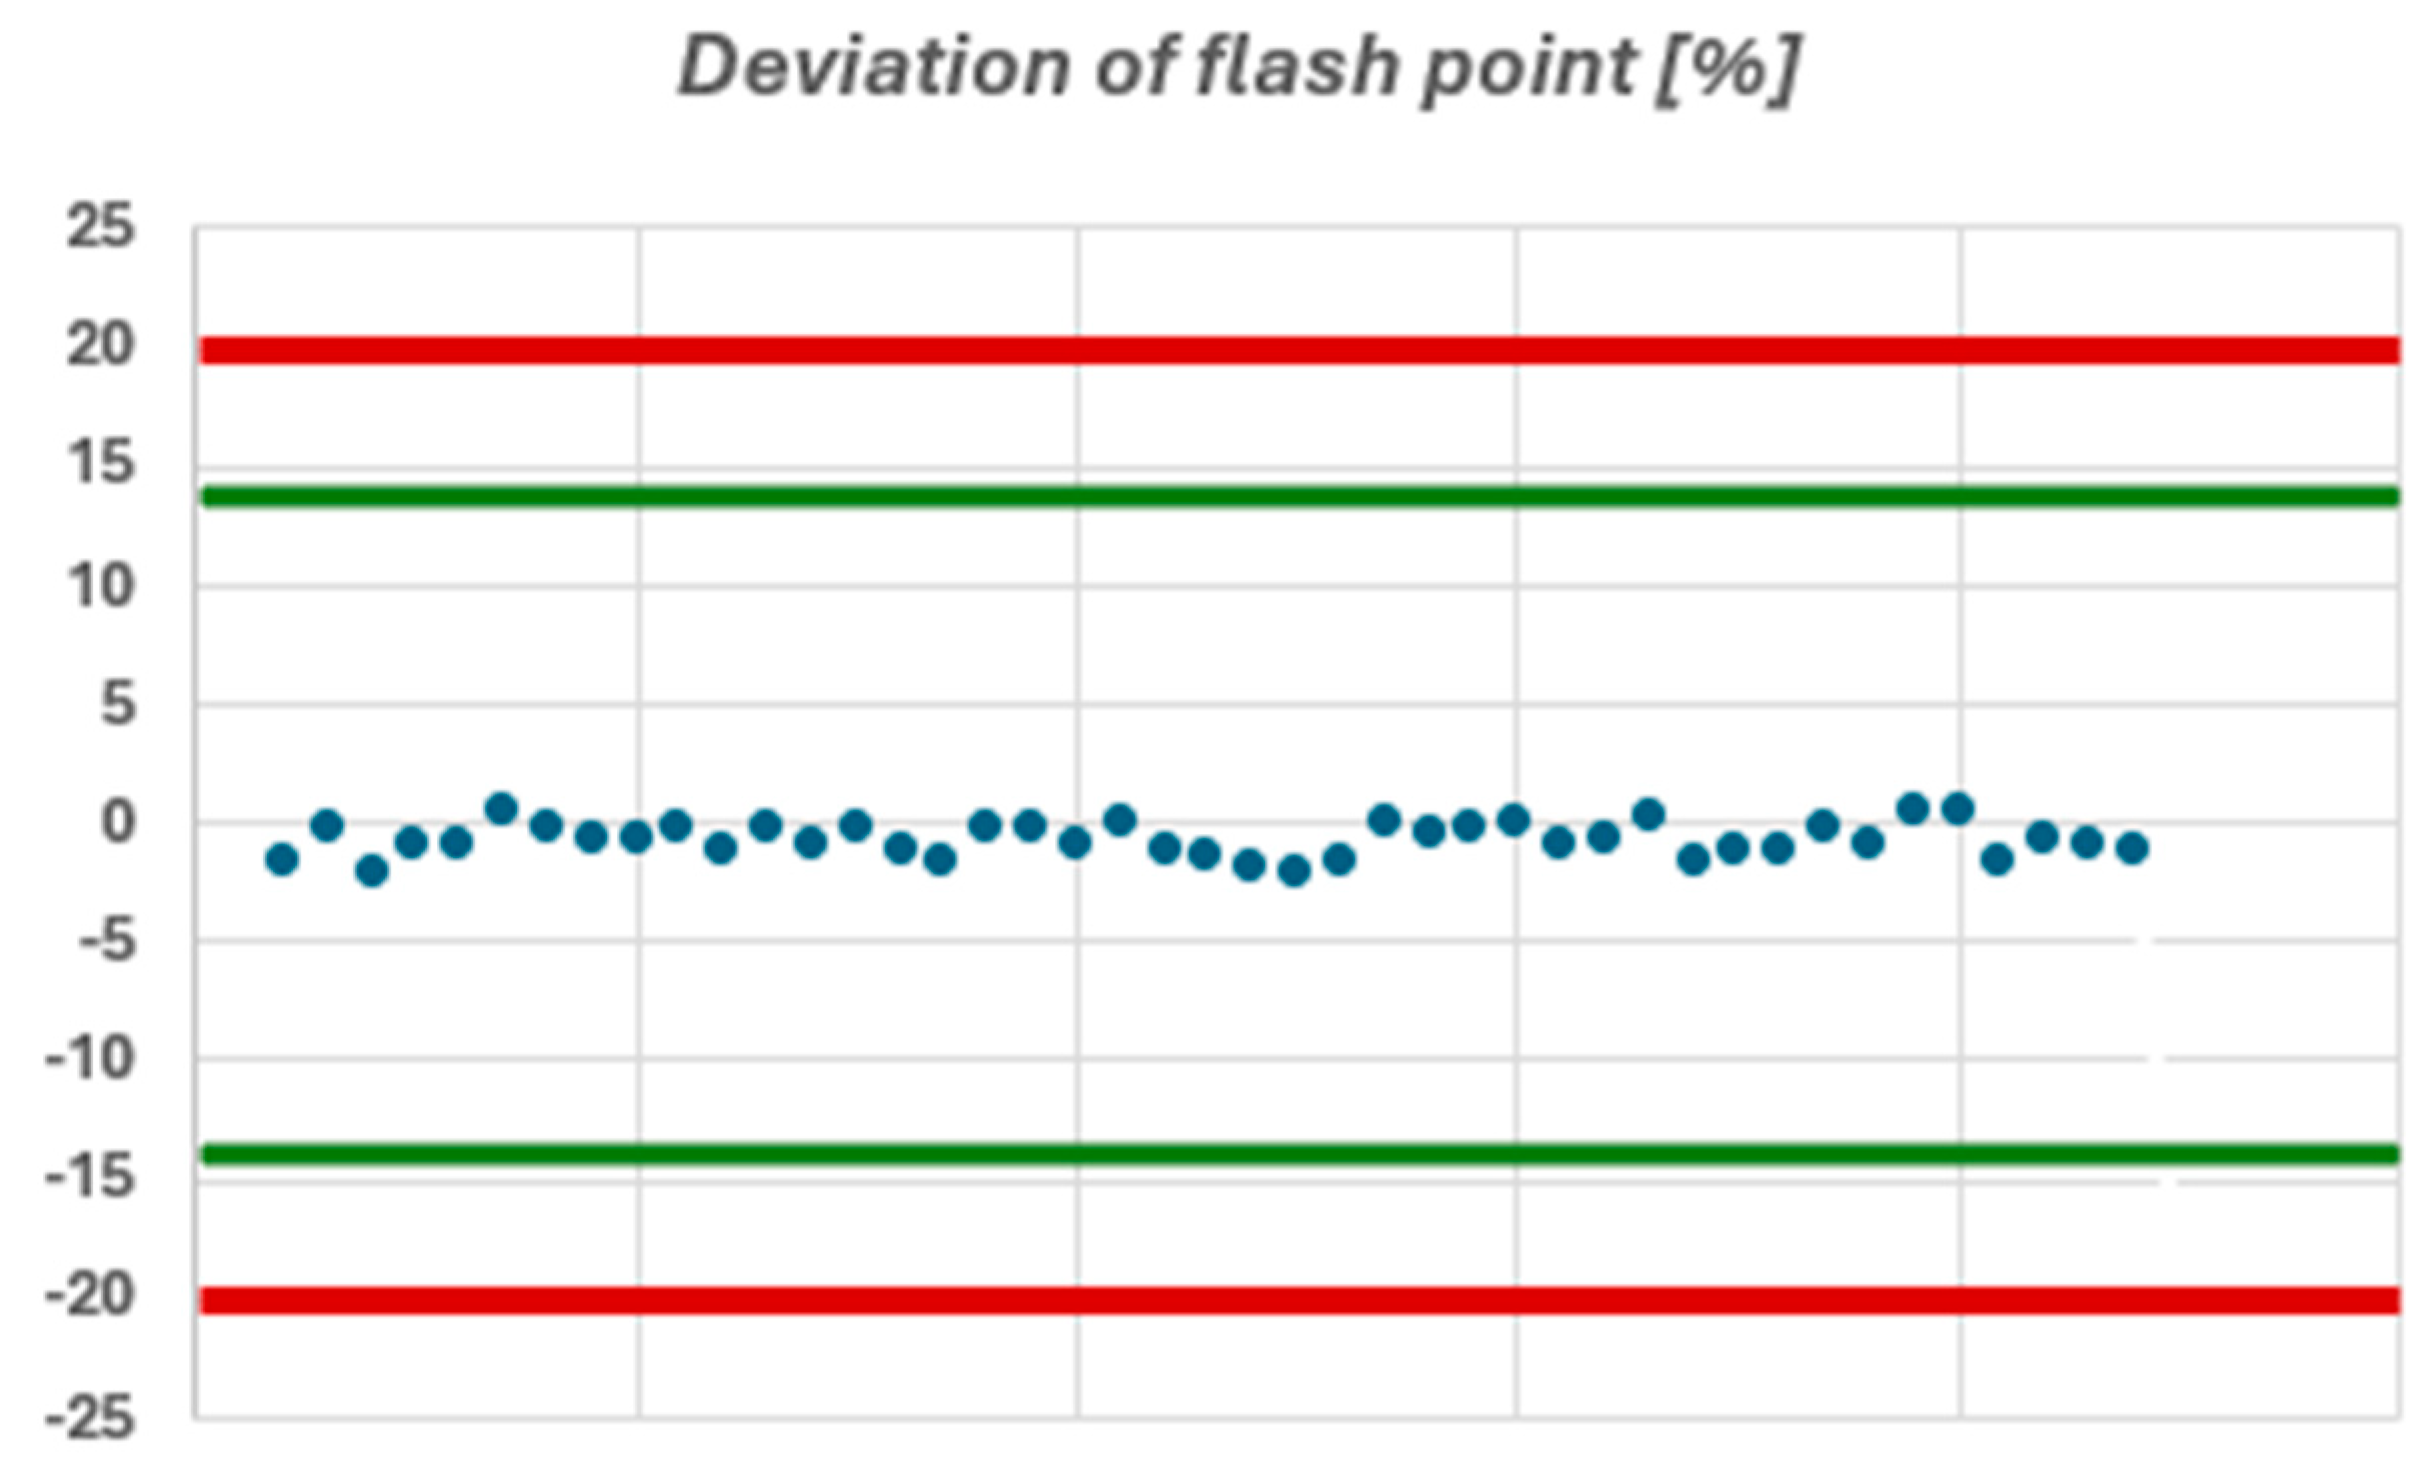
According to paper [
2], the maximum allowable deviation from the reference value is 20%.
Figure 14 shows that none of the samples exceeded this limit. If we refer instead to the limit of 30 °C reported in paper [
14], which corresponds to a deviation of 14.7% from the reference value, we find that no sample exceeded this threshold either.
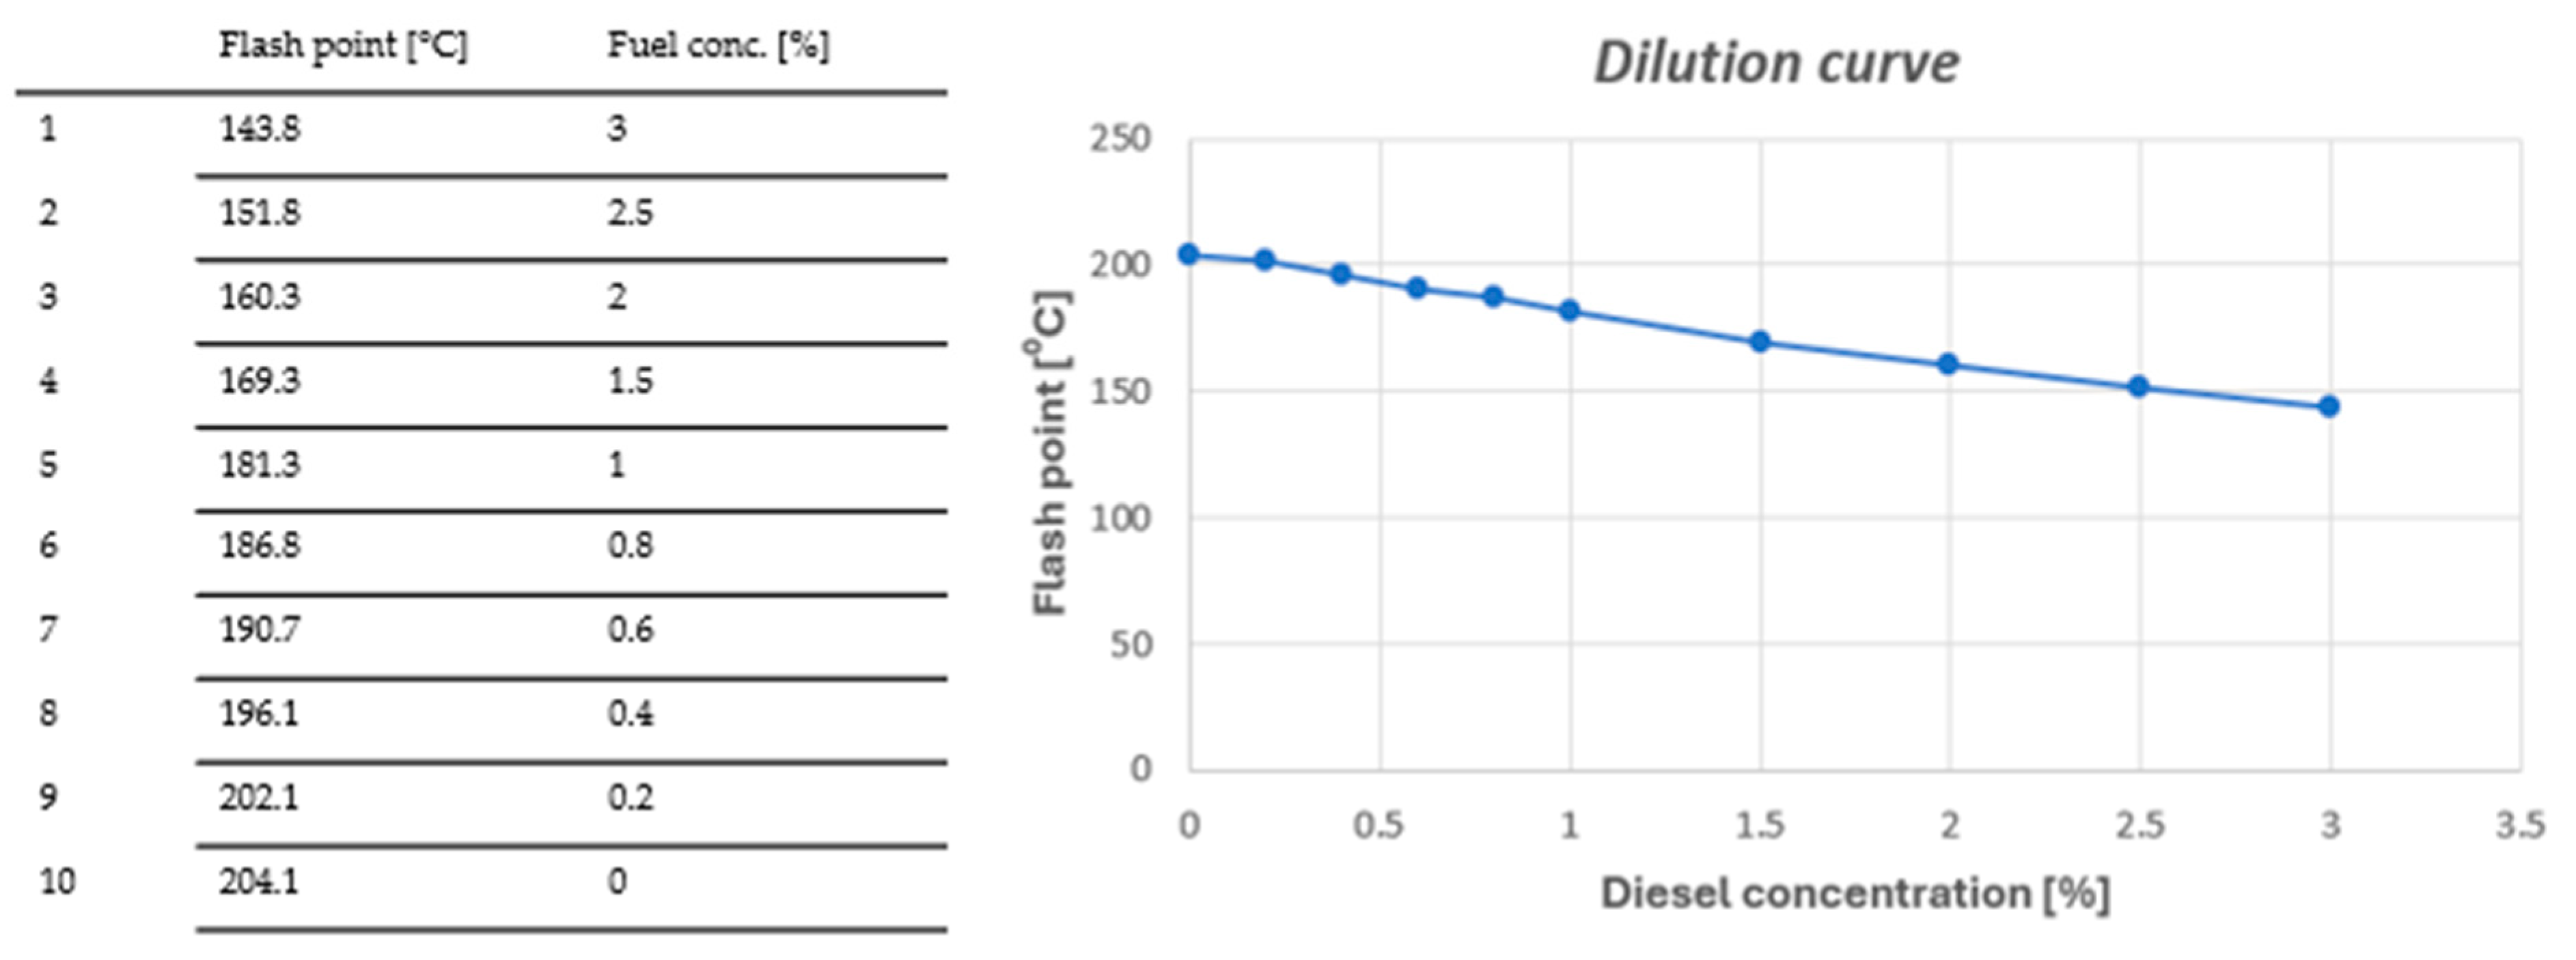
To determine the diesel content of the used oil samples, it was first necessary to establish the dilution curve, shown in
Figure 15. For this purpose, the flash point was measured for several known mixtures of fresh oil with diesel fuel. The diesel used was the same as that normally employed by the company that owns the truck fleet from which the samples were collected.
In
Figure 16 diesel content results are presented. The fuel content limit up to which the oil can be used in the engine is 2.5–5% [
30].
Furthermore, as the dilution of engine oil has direct consequences on the flash point values which are within the permissible limits (
Figure 12), we conclude that the fuel dilution level, for all the analyzed samples, is also within the permissible limits.
In
Figure 17, the average values of the diesel content by mileage are presented. It is observed that the most pronounced dilution is in the mileage segment of 800,000 km followed by that of the segment of 100,000 km. The high dilution values for the 100,000 km category are explainable, the engine being in the running-in period. For the 800,000 km category, the signals can be directed towards the following aspects: the combustion parameters are not suitable, the wear of the segments is high and the fuel leaks on the cylinder walls and into the oil pan.
Other sources of oil dilution with fuel could be particulate filter regeneration processes, damaged injectors, wear of some elements of the diesel pump, or excessive engine idling. Thus, given the relatively low values of fuel dilution, it is recommended to check these aspects by correlating with other observations of the driver.
4.4. Water Content (ppm)
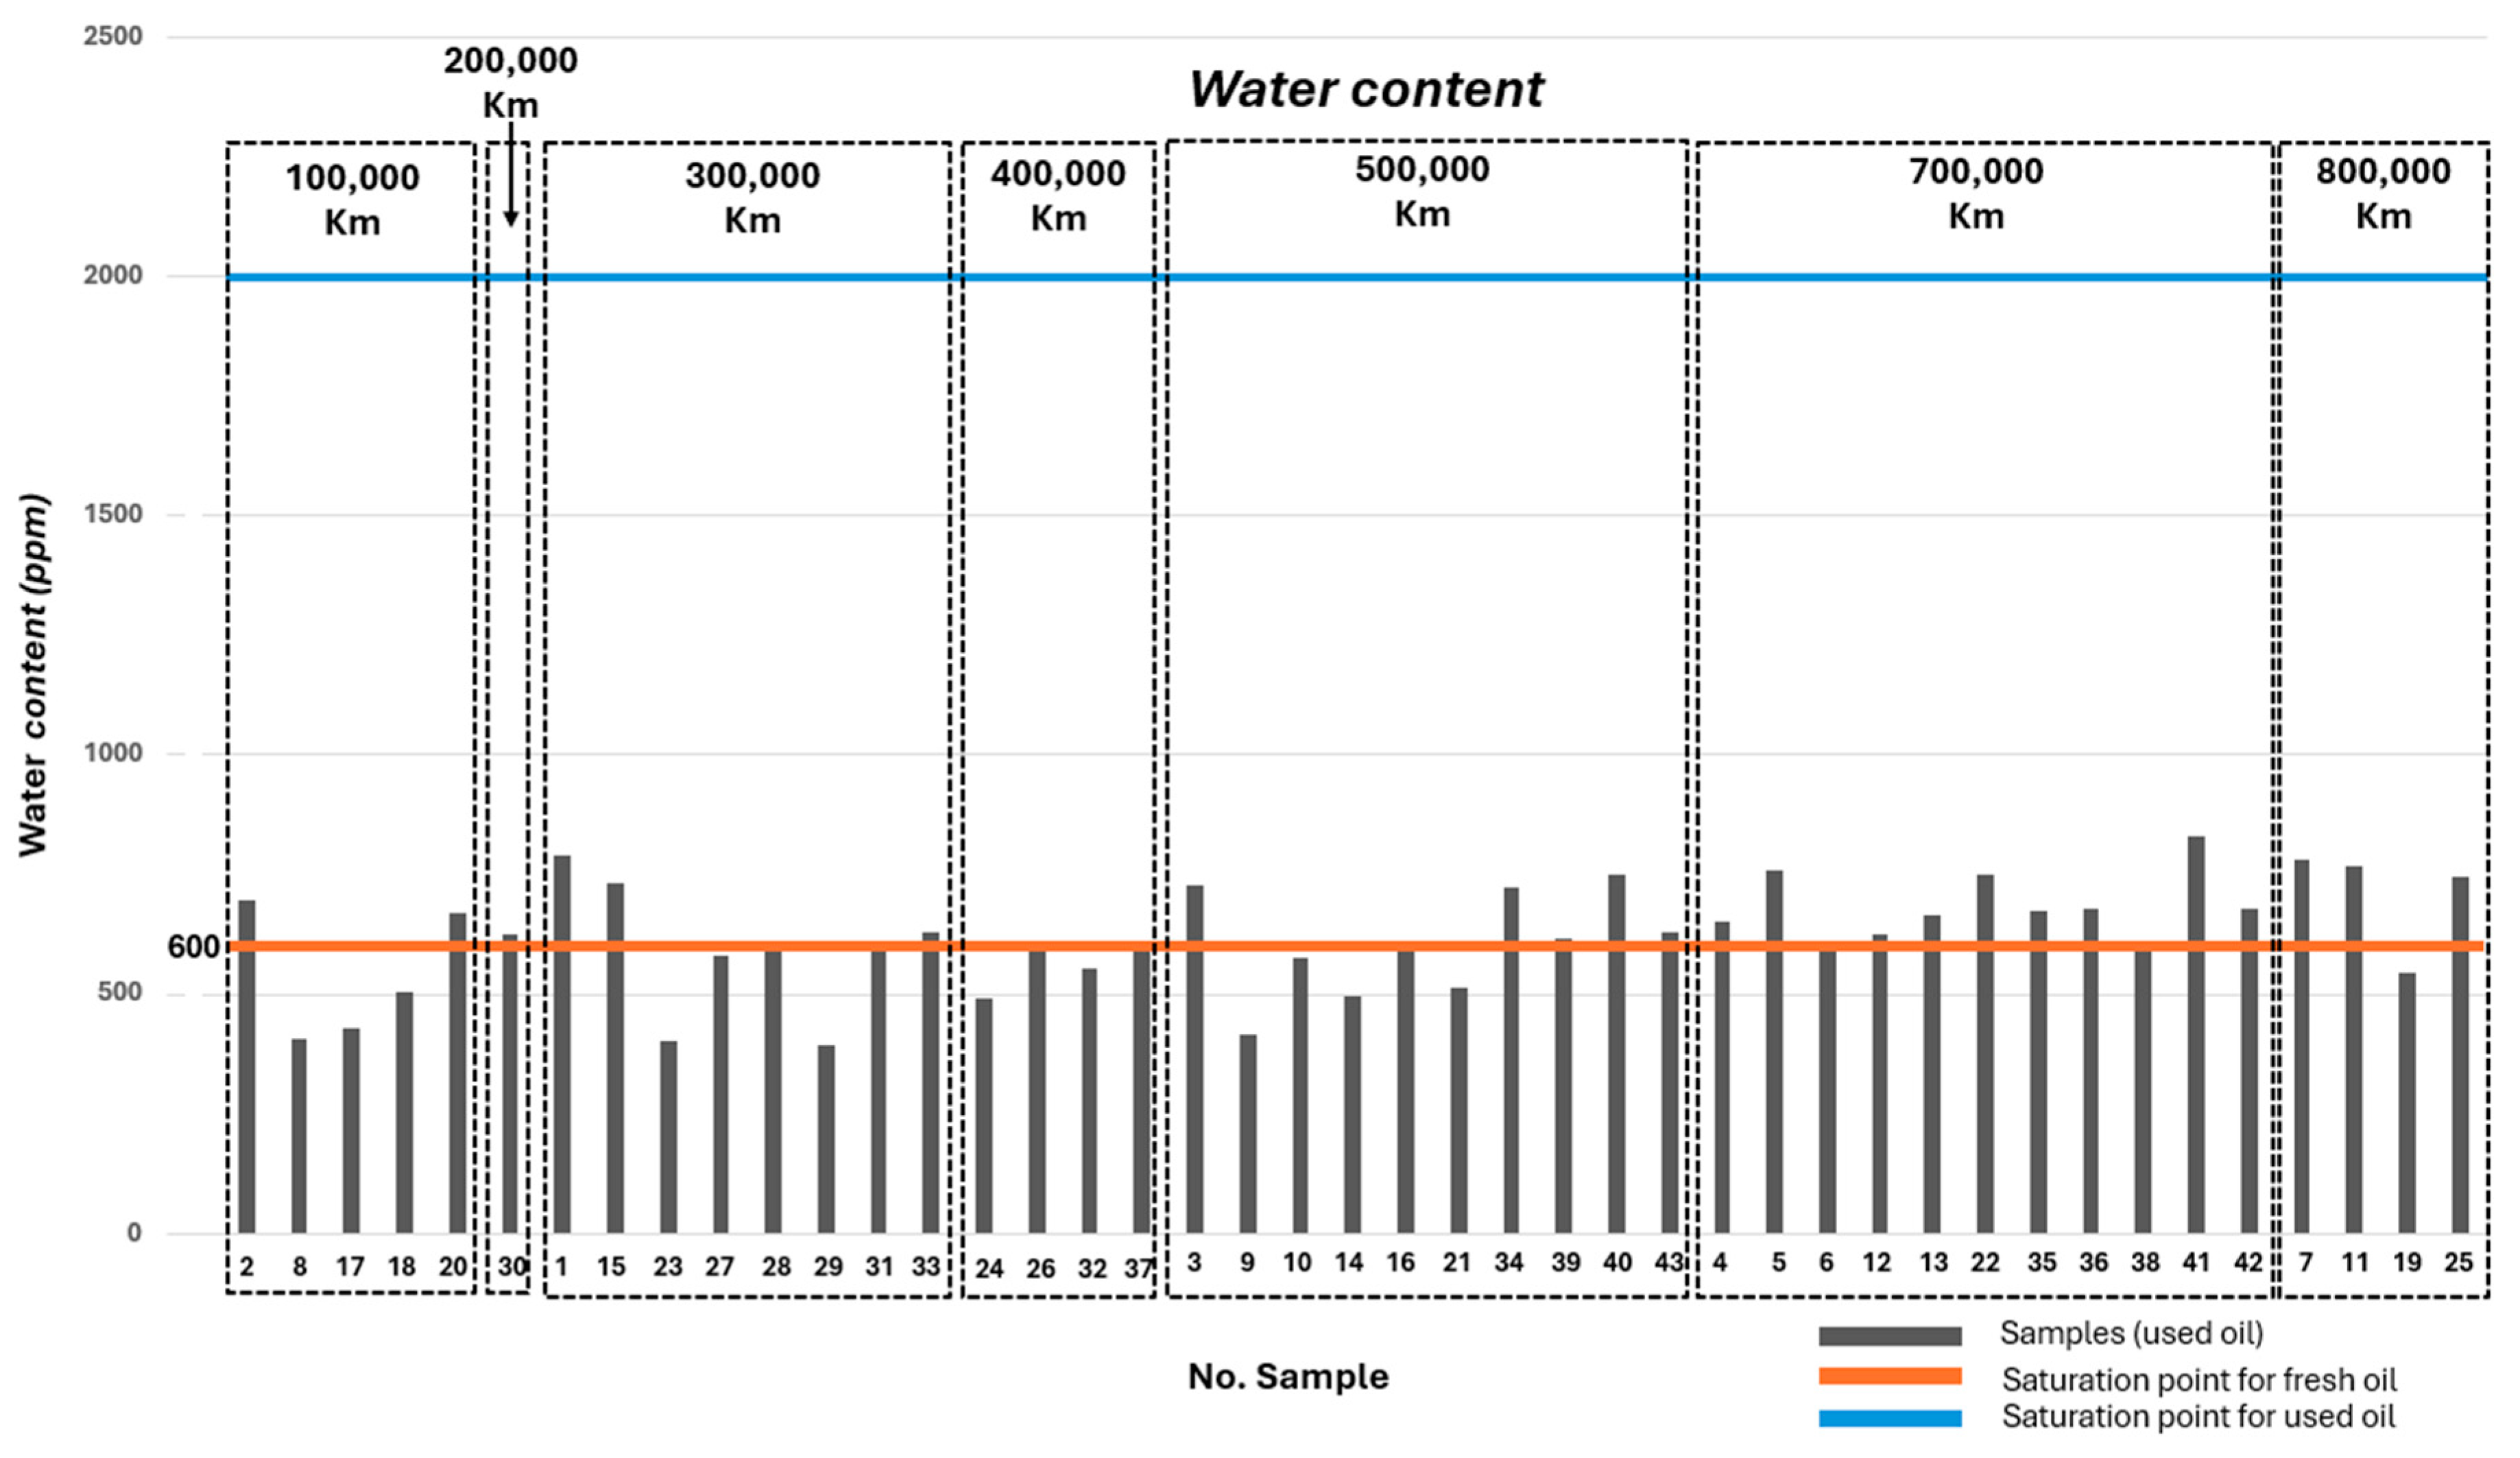
Figure 18 presents the water content values for the 43 used oil samples, together with the maximum saturation point of 600 ppm, both for fresh oil and for used oil.
As stated in
Section 2 the latter is 3–4 times higher than the former, i.e., 1800–2400 ppm. According to [
2] the water content must not exceed 0.2%. In
Figure 18 we have highlighted a limit of 2000 ppm.
While the upper limit of 2000 ppm was not exceeded by any sample, the 600 ppm threshold was slightly surpassed in samples Sno.1, Sno.3, Sno.5, Sno.7, Sno.11, Sno.15, Sno.22, Sno.25, Sno.34, Sno.40, and Sno.41. The highest water content was recorded in sample Sno.41, for which recommendations were already made in
Section 4.3. For the other samples, it is recommended to check the truck’s engine cooling system and the oil cooling system, which may develop cracks or damaged sealing elements as mileage increases, as well as to inspect the gas purifier filter.
Figure 19 shows an increase in water content for the mileage categories of 700,000 km and 800,000 km. In addition, it is very important to verify the storage conditions of the engine oil before it is introduced into the engine.
4.5. Metal Content
Grimmig et al. [
19] state that Fe and Cu are the main elements resulting from the wear of moving engine components, while Zn is one of the main elements found in oil additives. Iron (Fe) is present in a large number of engine components, such as the engine block, crankshaft, piston rings, cylinders, valve guides, camshafts, gears, and bearings. Copper (Cu) is found in cylinders, pistons, bearings, and bushings. Moreover, copper is a metal with high thermal conductivity, which is why it is used in components where rapid heat dissipation is required. For this reason, copper is also used in the construction of heat exchangers for oil or coolant. In addition, copper can be found in antioxidant additives, where it serves to prevent oxidation. Zinc (Zn), on the other hand, is primarily used in the formulation of extreme-pressure and antioxidant additives for engine oils. It is not typically used in the manufacture of thermal engine components, but rather in alloys [
1,
2,
3,
9].
Using the analytical technique of X-ray fluorescence (XRF) spectrometry, a qualitative analysis of the iron, copper, and zinc content was performed. The device counts the photons emitted from the analyzed sample, recording them as impulses that are processed by the equipment’s data system under the name of intensity. The resulting spectrum is a graphical representation of intensity peaks, with each peak corresponding to an element in the sample and its height being associated with the element’s concentration [
26].
Spectra were obtained for each of the 43 used oil samples and compared with the spectrum of fresh oil. The assessment of metal content was carried out by highlighting the percentage differences between the values in the two spectra for each metal under study.
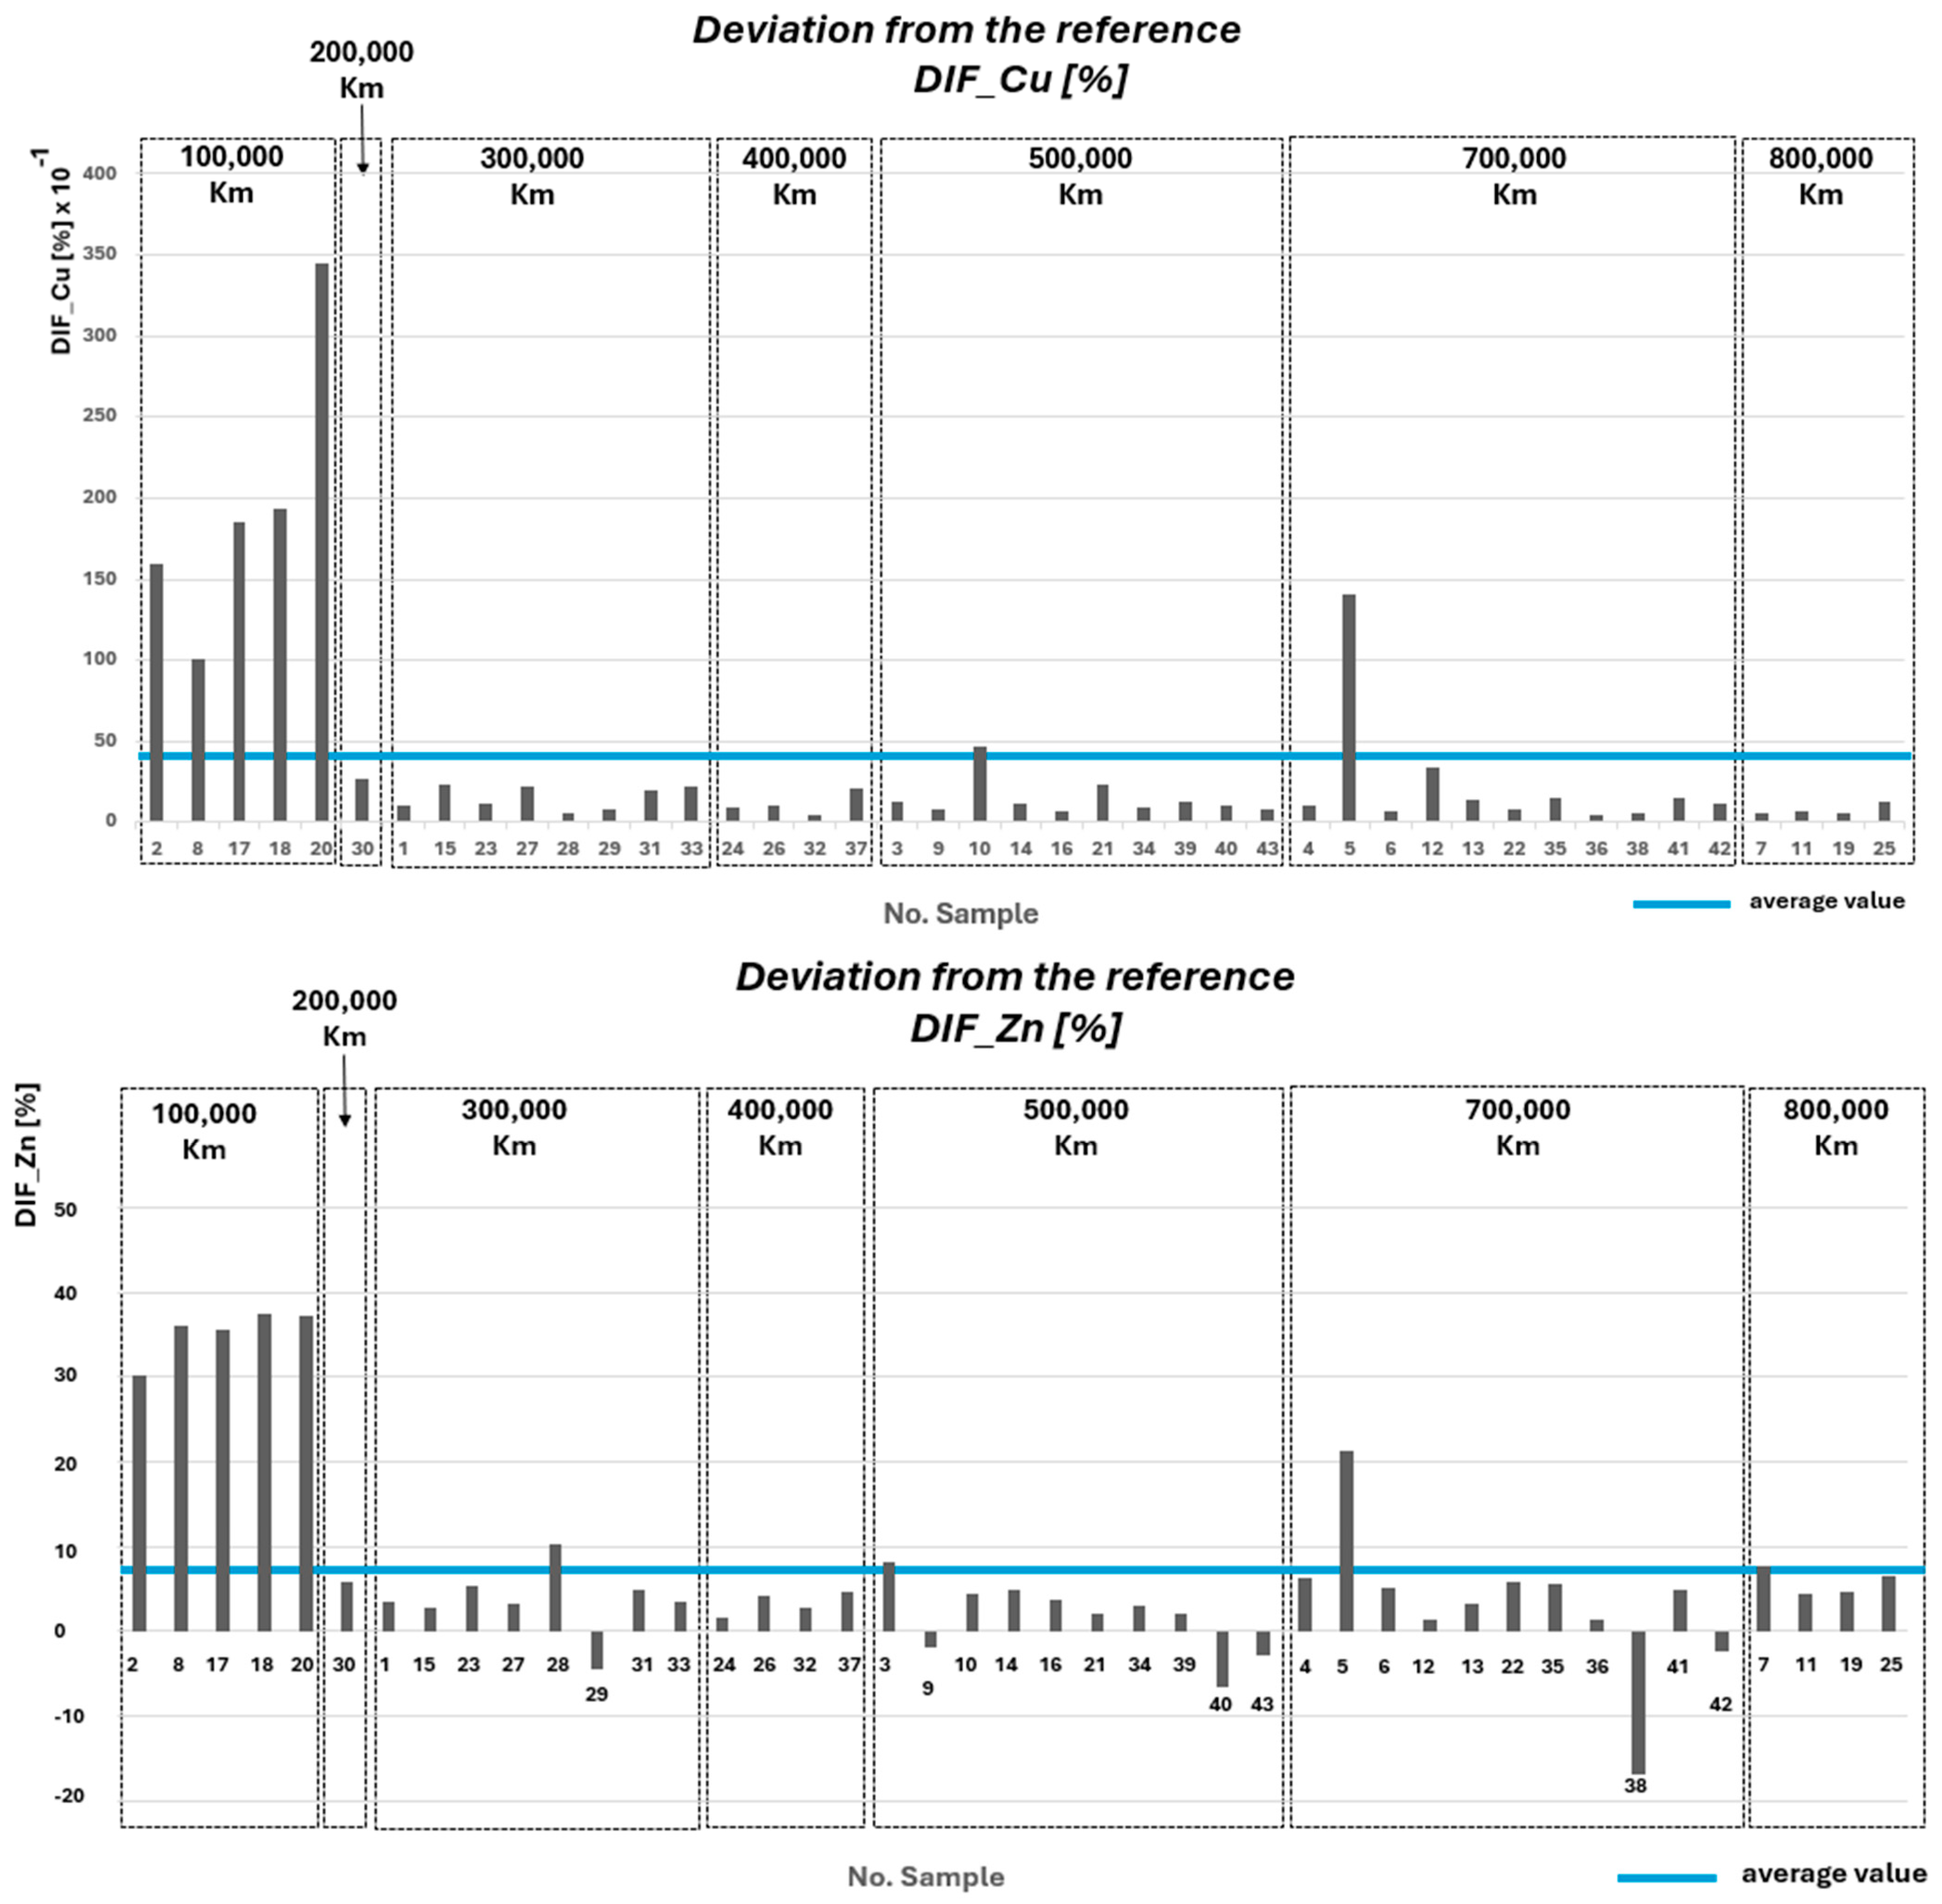
Figure 20 shows the deviations, expressed as percentages, of Fe, Cu, and Zn content in the used oil samples compared to the reference sample (fresh oil). To better identify samples with out-of-trend metal content, the average deviation value was also included in each diagram.
It is observed that the highest increase is recorded for Fe. This can be explained by the fact that iron is present in the structure of many engine components. However, the high values of the difference in iron content (DIF_Fe), expressed as percentages, are not inappropriate, since the intensity value measured in the fresh oil spectrum is 0.02193.
The largest increases in Fe content are observed in samples Sno.5 and Sno.13. For Sno.13, recommendations were already made in
Section 4.2. It is also recommended to check for excessive oil consumption and abnormal oil pressure, unusual engine noise, performance irregularities, or stuck/worn piston components. For sample Sno.5, both water and Cu contents also exceeded the trend, with recommendations provided previously in
Section 4.4. Additionally, for Sno.5, an oil stain analysis revealed normal levels of sediment and oxidation (
Figure 6d). Nevertheless, for both samples, it is recommended to check the condition of the engine block, crankshaft, piston rings, cylinders, valve guides, camshafts, gears, bearings, as well as fuel pump elements.
Zinc, as already noted in this paper, is present in engine oil mainly in the form of additives that provide wear protection and also have antioxidant properties. Zinc can adhere to the surfaces of engine components—especially those subject to friction, such as cams, tappets, and various bearings—forming a protective layer. Thus, a moderate decrease in the zinc content of used diesel engine oil may indicate that the additive has fulfilled its protective function. However, a significant decrease in zinc suggests additive degradation, which can be caused by engine operation at high temperatures, fuel contamination, the presence of coolant or soot, or oil oxidation and acid formation.
For six samples (Sno.29, 9, 40, 43, 38, and 42), decreases in Zn content were recorded, indicating additive deterioration. The most severe degradation was observed in sample Sno.38. Oil stain analysis was also performed for these samples (
Figure 6e–j). In Sno.38 and Sno.40, a high level of sediment and pronounced oxidation were observed, indicating that the engine was operating at high temperatures and the oil was not being cooled adequately. For these cases, it is recommended to adjust combustion, check the turbocharger actuator, and verify the oil cooling system. For Sno.9 and Sno.42, which also showed high flash point values, sediment concentration and oxidation were within normal limits; recommendations for these samples were already made in
Section 4.3. For Sno.29 and Sno.43, normal levels of sediment and oxidation were observed.
In conclusion, for these samples, it is recommended to check the injectors, the turbocharger actuator, the gas purifier filter, particle filter regeneration, possible cracks in the thermoflot, and the condition of seals. In addition, corroborating these results with other operational symptoms, it is also advisable to inspect the degree of wear on the camshaft and tappets.
In
Figure 21, the average values of Fe, Cu, and Zn content by mileage categories are presented. It can be seen that the highest increases occur in the 100,000 km category. This is clearly explained by the running-in process of the moving components in this mileage range. For higher mileage categories, the metal content decreases with only small variations.
5. Conclusions
In the current context of global climate change, sustainable mobility plays a crucial role. Any action taken to reduce both pollution and costs must therefore be treated with the utmost seriousness. Preventive vehicle maintenance is one effective way to achieve these goals. One of the main approaches to designing preventive maintenance strategies is the analysis of used engine oil. Such analysis allows engine problems to be identified before they produce harmful effects. It also makes it possible, in some cases, to recommend the prolonged use of oil, provided that it is periodically monitored.
This type of analysis is particularly important for vehicle fleets—such as trucks—for obvious reasons: they operate over long distances and under varying external conditions; engine repair is expensive; taking vehicles out of service for maintenance causes material losses; and large quantities of oil are required. Extending the controlled useful life of oil therefore brings both financial and ecological benefits. Given the current expansion of road freight transport by trucks and its impact on the environment, companies must adopt sustainable development strategies. Implementing preventive maintenance strategies based on used oil analysis can significantly contribute to this objective.
In this study, 43 oil samples, each used for 100,000 km in trucks equipped with the same type of engine (model years 2016–2021, diesel Paccar MX–11,330 H2, cylinder capacity 10,800 cm3, engine power 449 HP @ 1600 rpm, equipped with exhaust gas recirculation, diesel particulate filter, and selective catalytic reduction, emissions standard EURO 6, mileage between 100,000 km and 800,000 km) and using the same type of oil (DAF Xtreme 10W30), were analyzed.
The following physico-chemical properties were evaluated: viscosity @ 40 °C, density @ 15 °C, flash point, and diesel content, water content, and metal content (Fe, Cu, Zn). For some samples, it was necessary to complement this analysis with oil stain testing in order to assess the level of carbonaceous sediment concentration and the degree of oxidation. Results showed that all oil samples remained within the acceptable usage limits, suggesting that the oil could continue to be used under controlled monitoring, with evaluations every 5000 km.
However, several samples presented more pronounced variations in certain properties. Consequently, a diagnostic method was developed based on the analysis of the physico-chemical properties of used engine oil, leading to the issuance of appropriate vehicle maintenance strategies.
To develop this method, correlations were established between the abnormal functioning of engine components/systems and the resulting changes in oil properties. Conversely, by analyzing the variations in oil properties, engine diagnoses were made, from which targeted maintenance strategies were derived.
A summary of the proposed maintenance strategies, according to the properties of used oil, is presented in
Table 4.


