
Effect of Freeze–Thaw Cycles on the Microstructure Characteristics of Unsaturated Expansive Soil


Abstract
1. Introduction
2. Test Materials and Methods
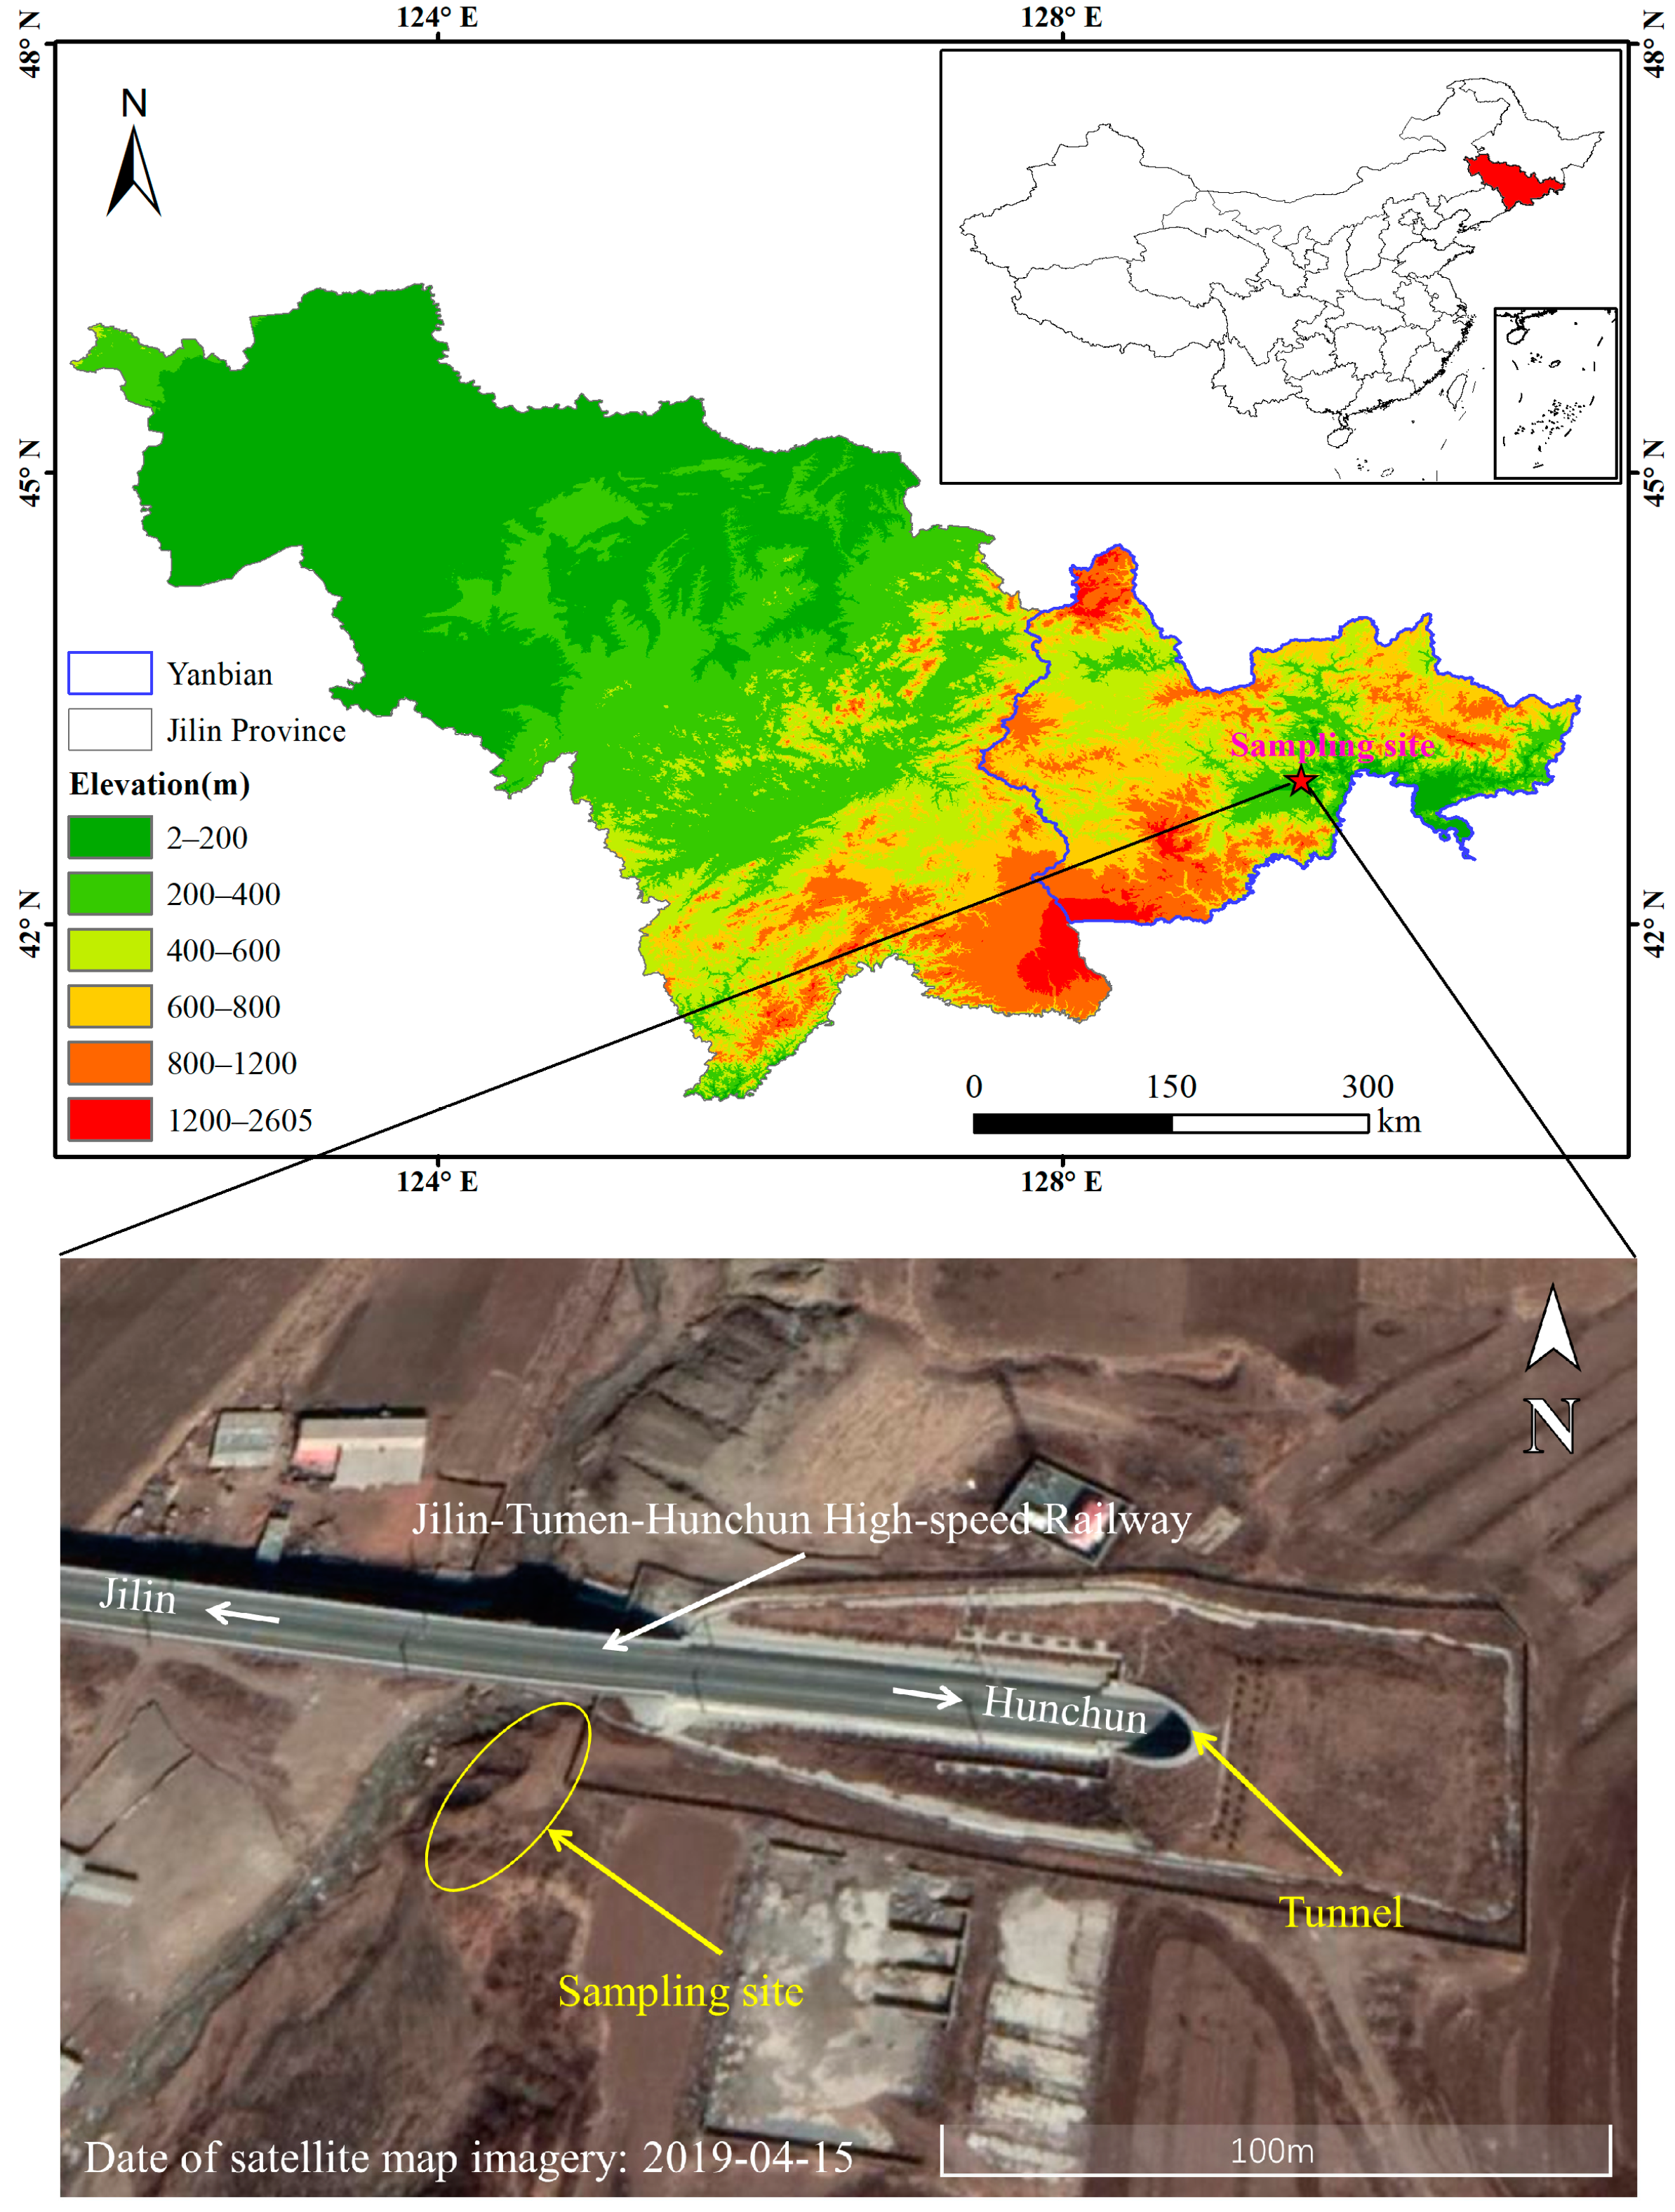
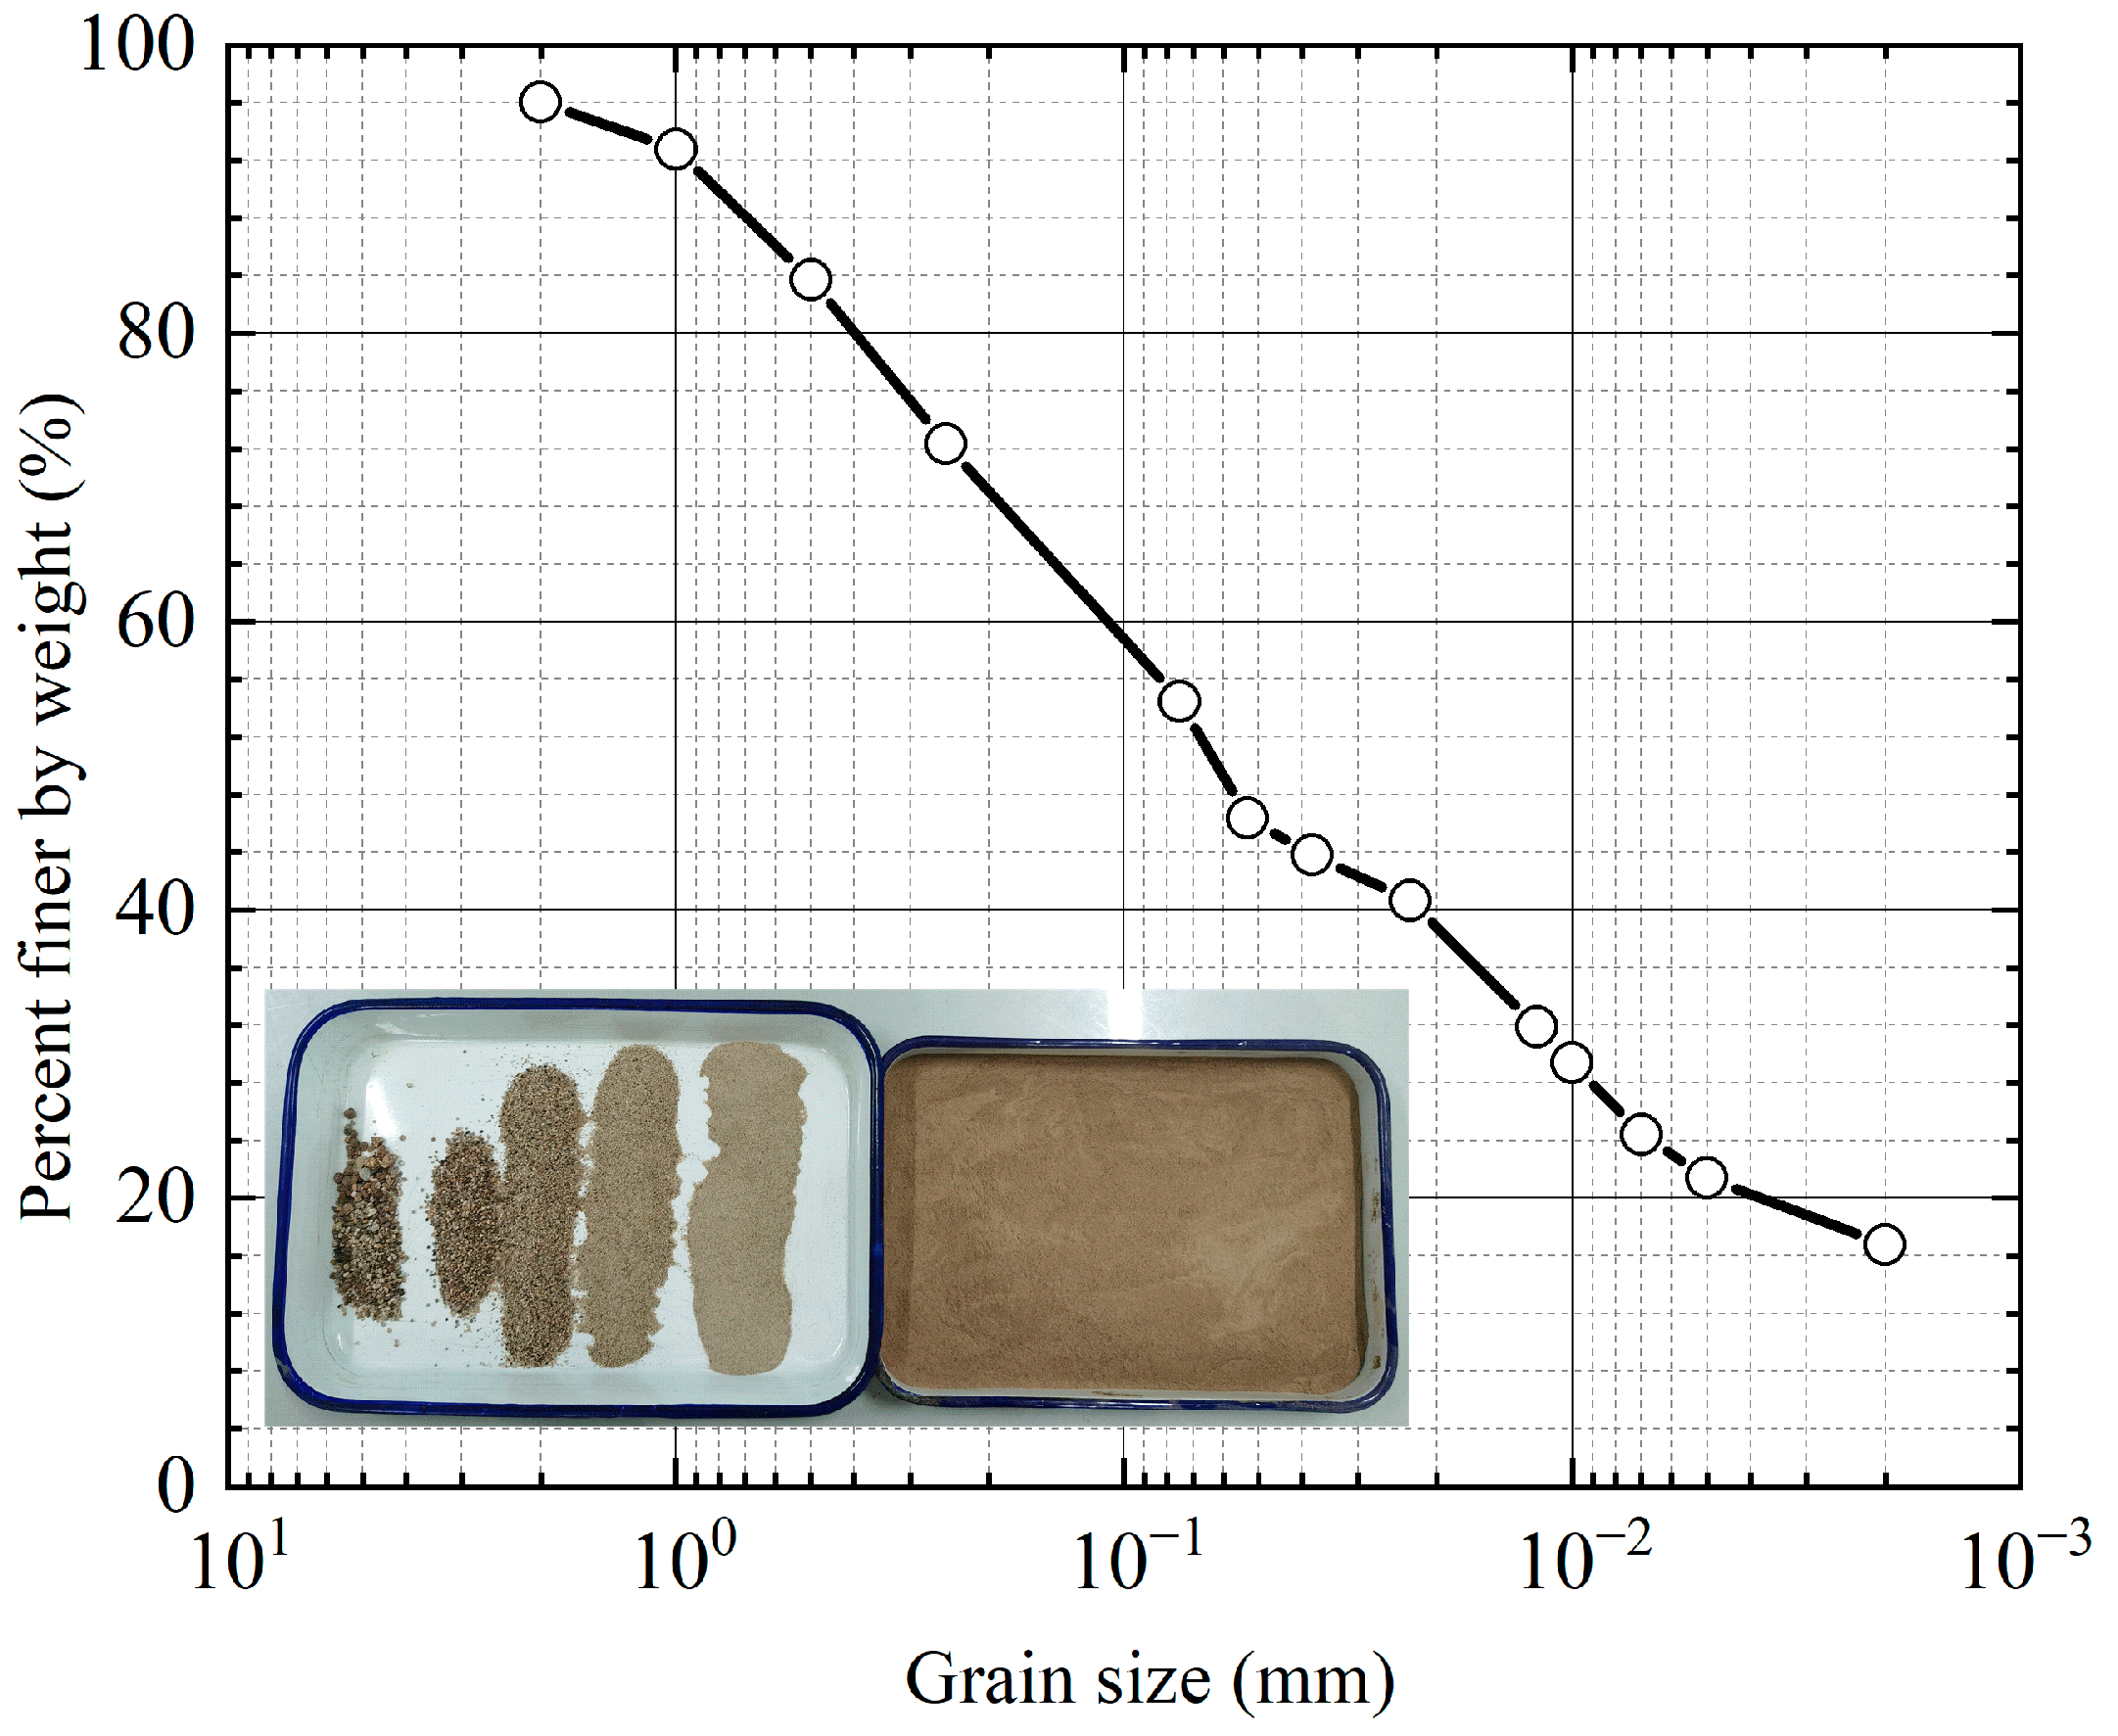
2.1. Basic Physical Properties of Soil
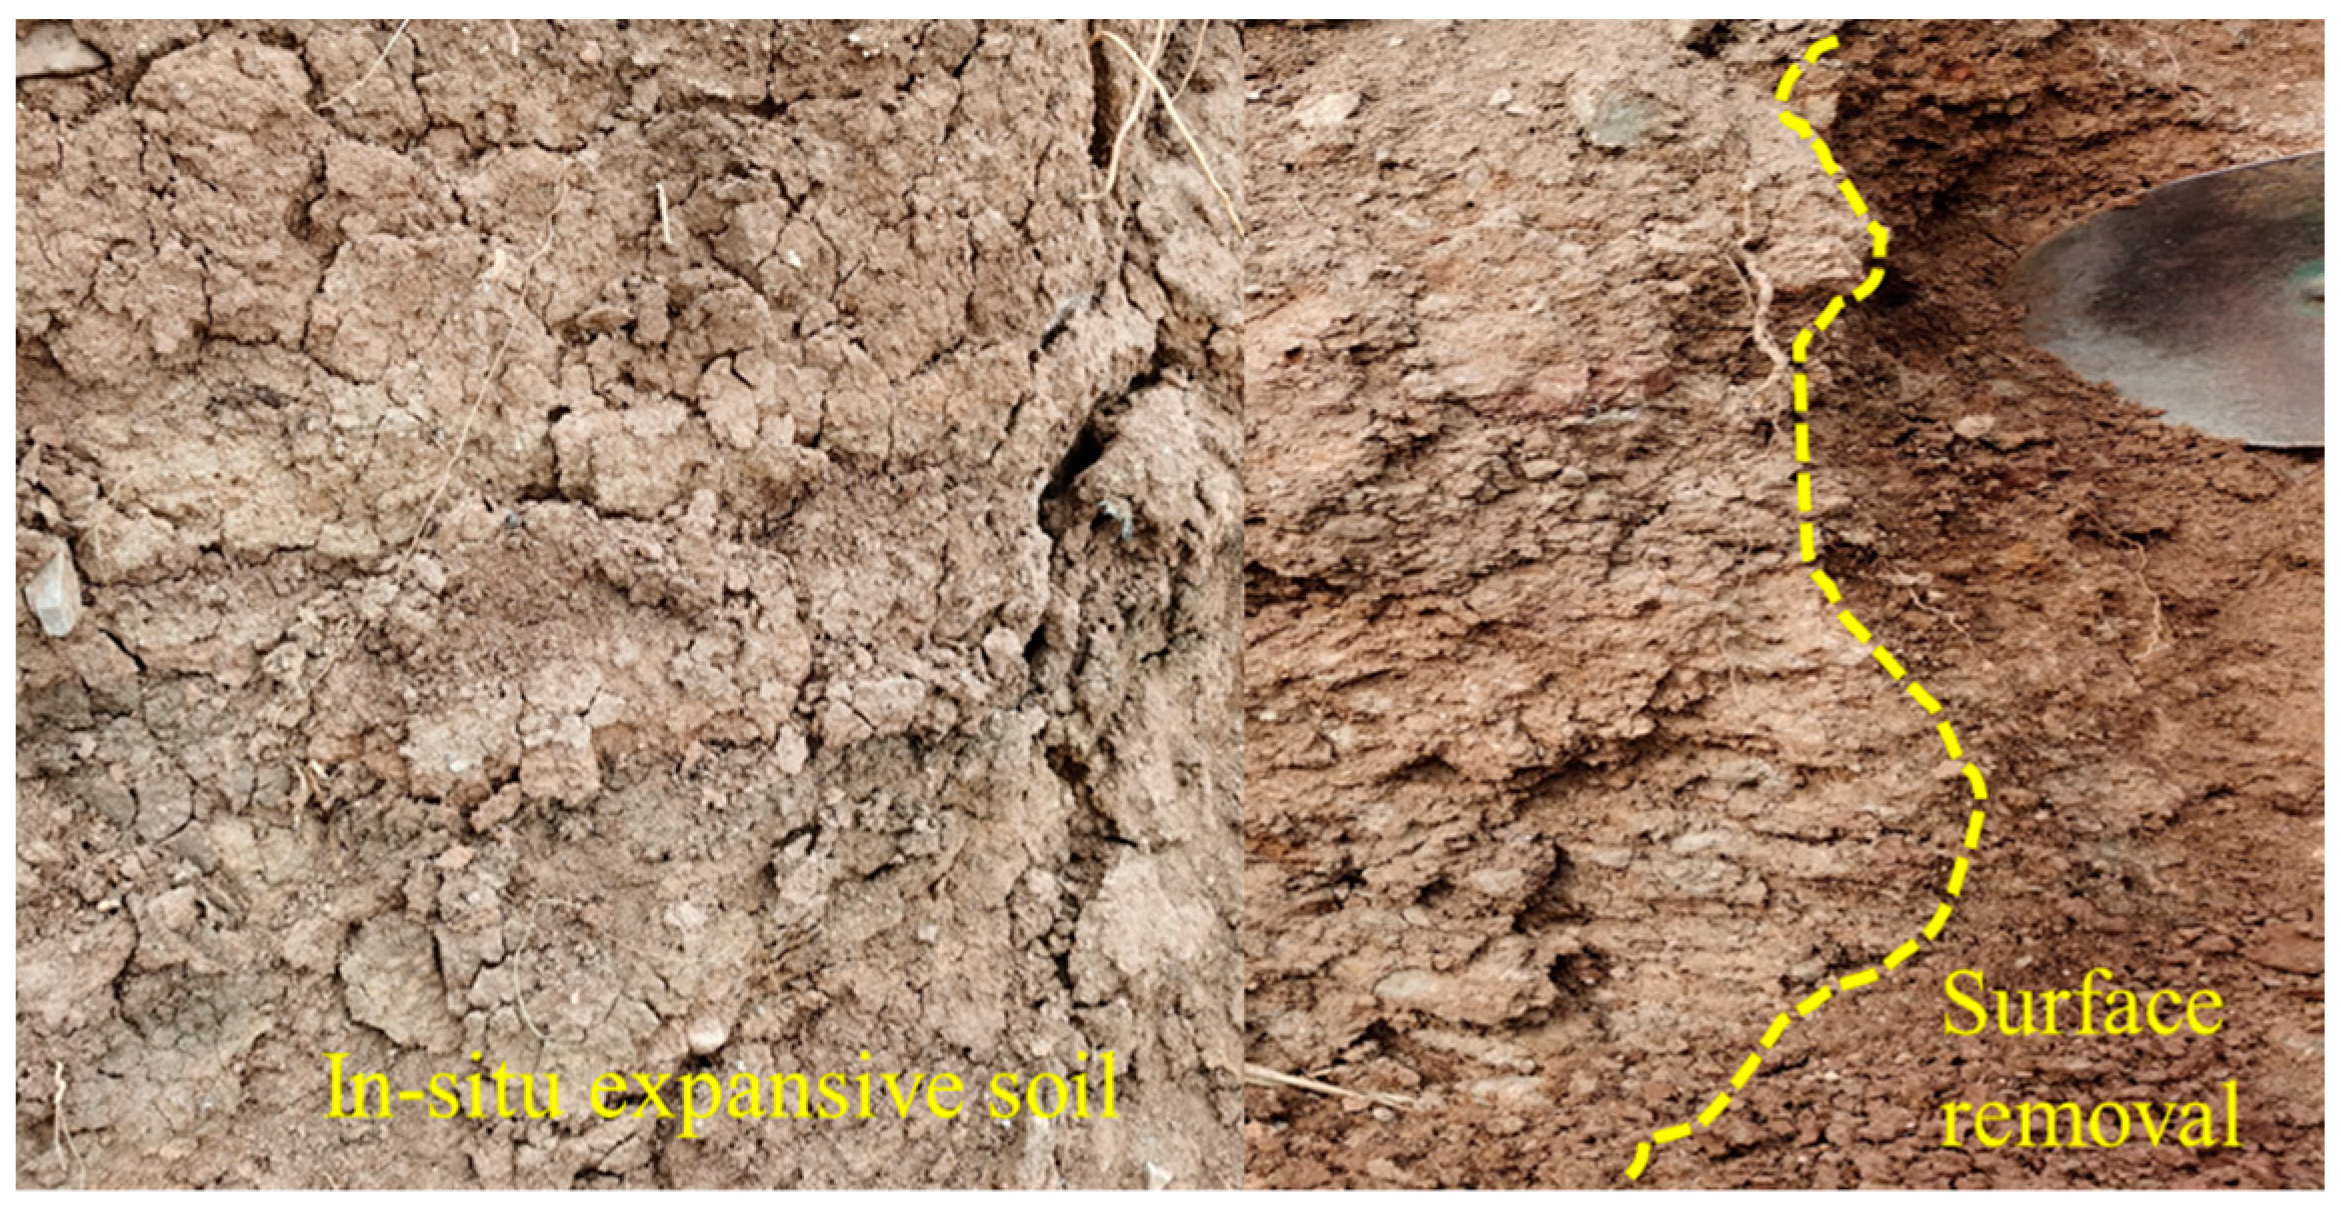
2.2. Sample Preparation and Tests
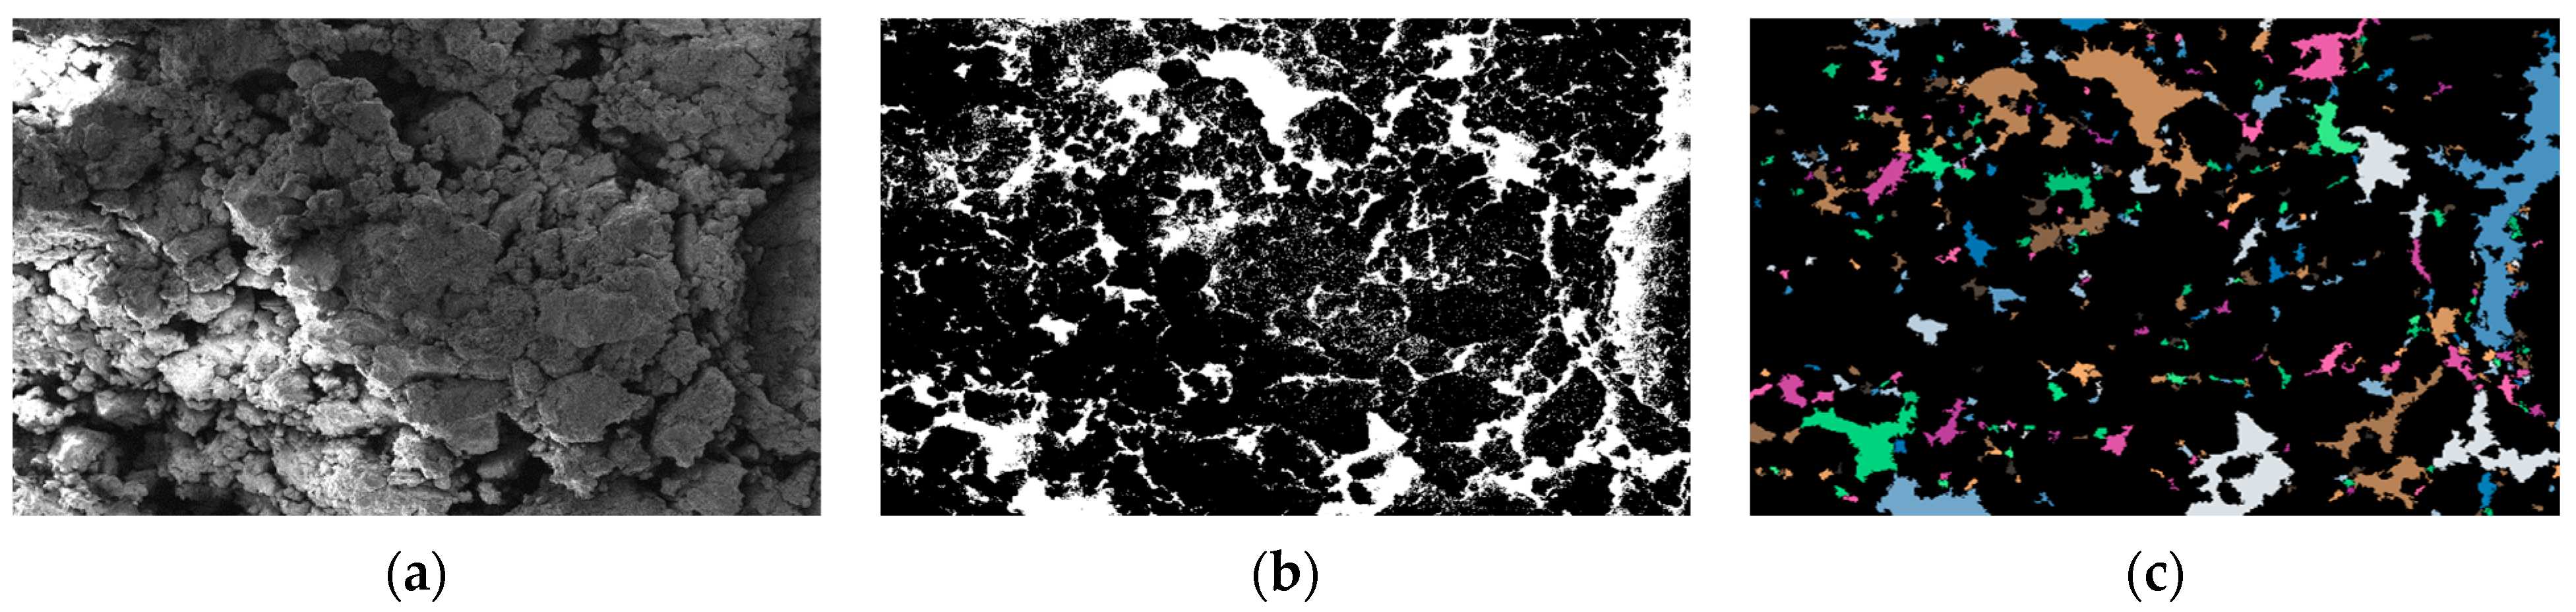
2.3. Microscopic Image Analysis Methods
- (a).
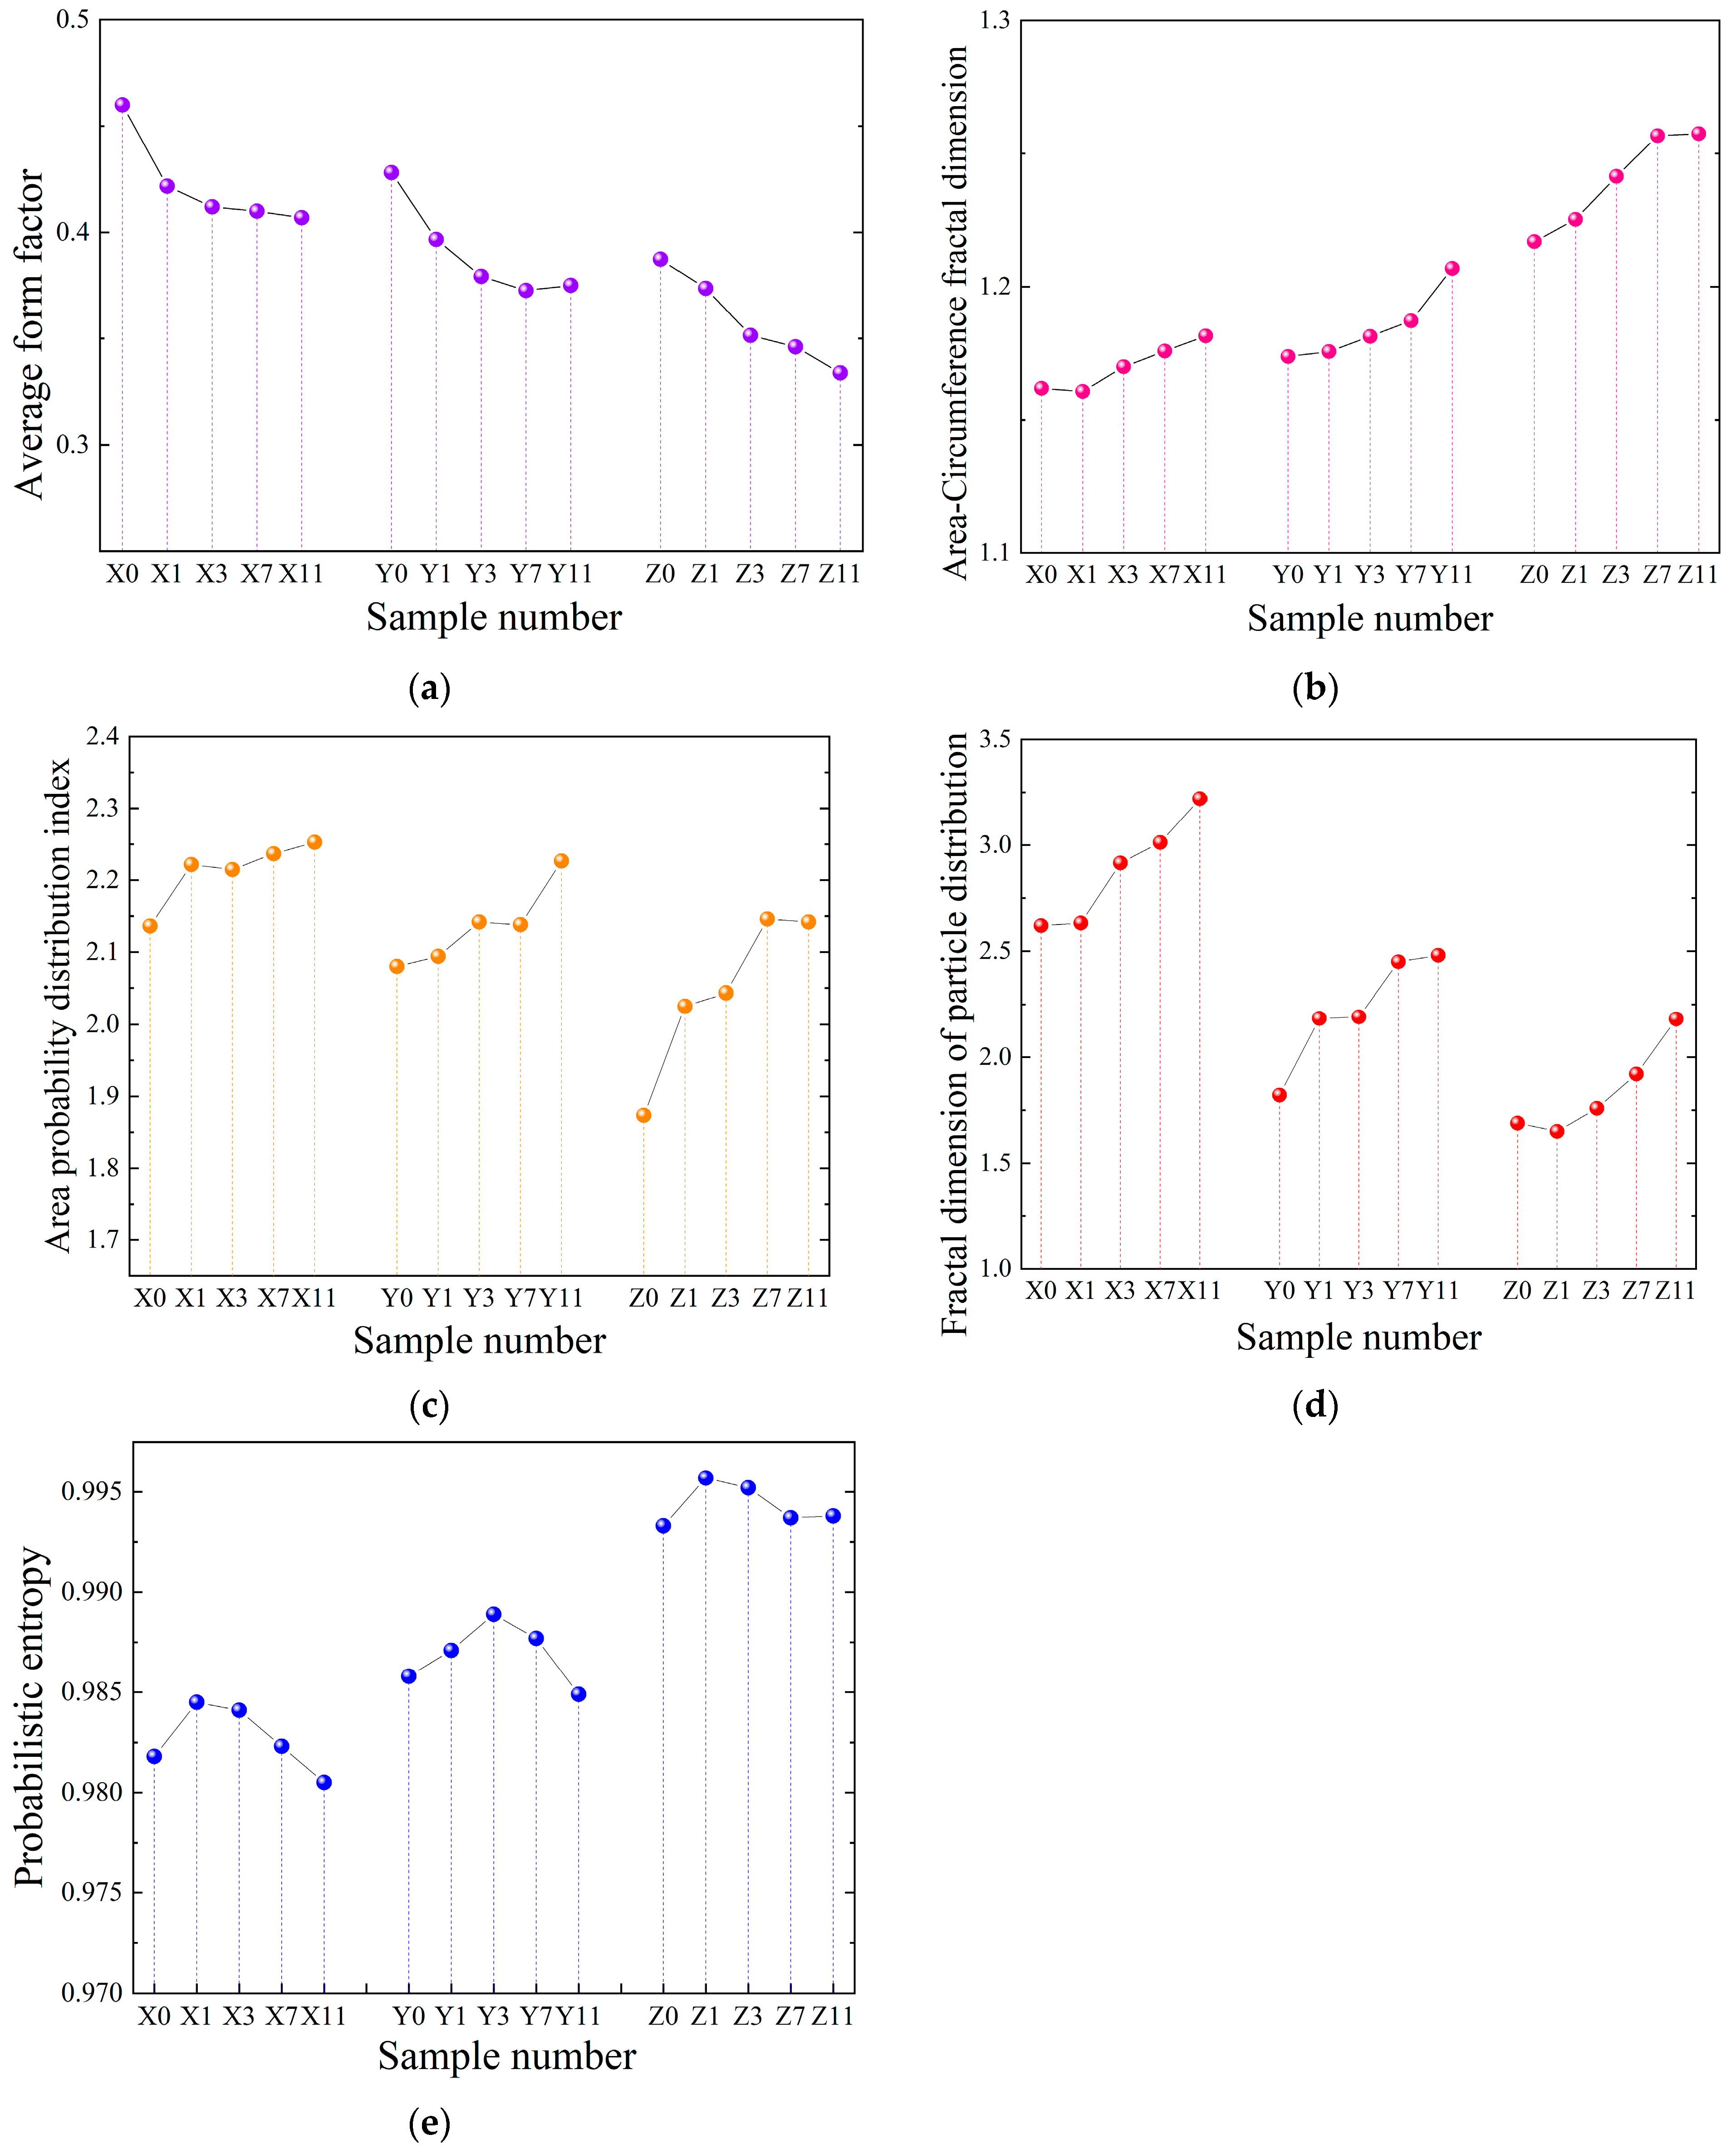
- The average form factor of different particles in the same plane is used to describe the roundness of soil particles and the shape of particle edges. The closer the value is to 0, the rougher and more uneven the shape of particle edges;
- (b).
- According to the fractal characteristics of the particle shape, the area-circumference fractal dimension D is between 1 and 2. The smaller the D value, the simpler the particle structure and the greater the degree of smoothness of surface of the spatial morphology of the particles;
- (c).
- The area probability distribution index b represents the trend in particle count as the particle area increases, with the relationship between the two following a power function. A higher value of the area probability distribution index indicates a predominance of smaller particles and fewer larger ones;
- (d).
- The fractal dimension of the particle distribution Dd characterizes the degree of particle homogenization and indicates the variability in particle size. A larger fractal dimension signifies poorer particle uniformity, a more concentrated distribution, and a higher degree of collectivization;
- (e).
- The probabilistic entropy Hm is a parameter that reflects the arrangement of the particles. The value range of Hm is [0, 1]. A higher value indicates a more disordered particle arrangement, with lower levels of order.
3. Test Results and Analysis
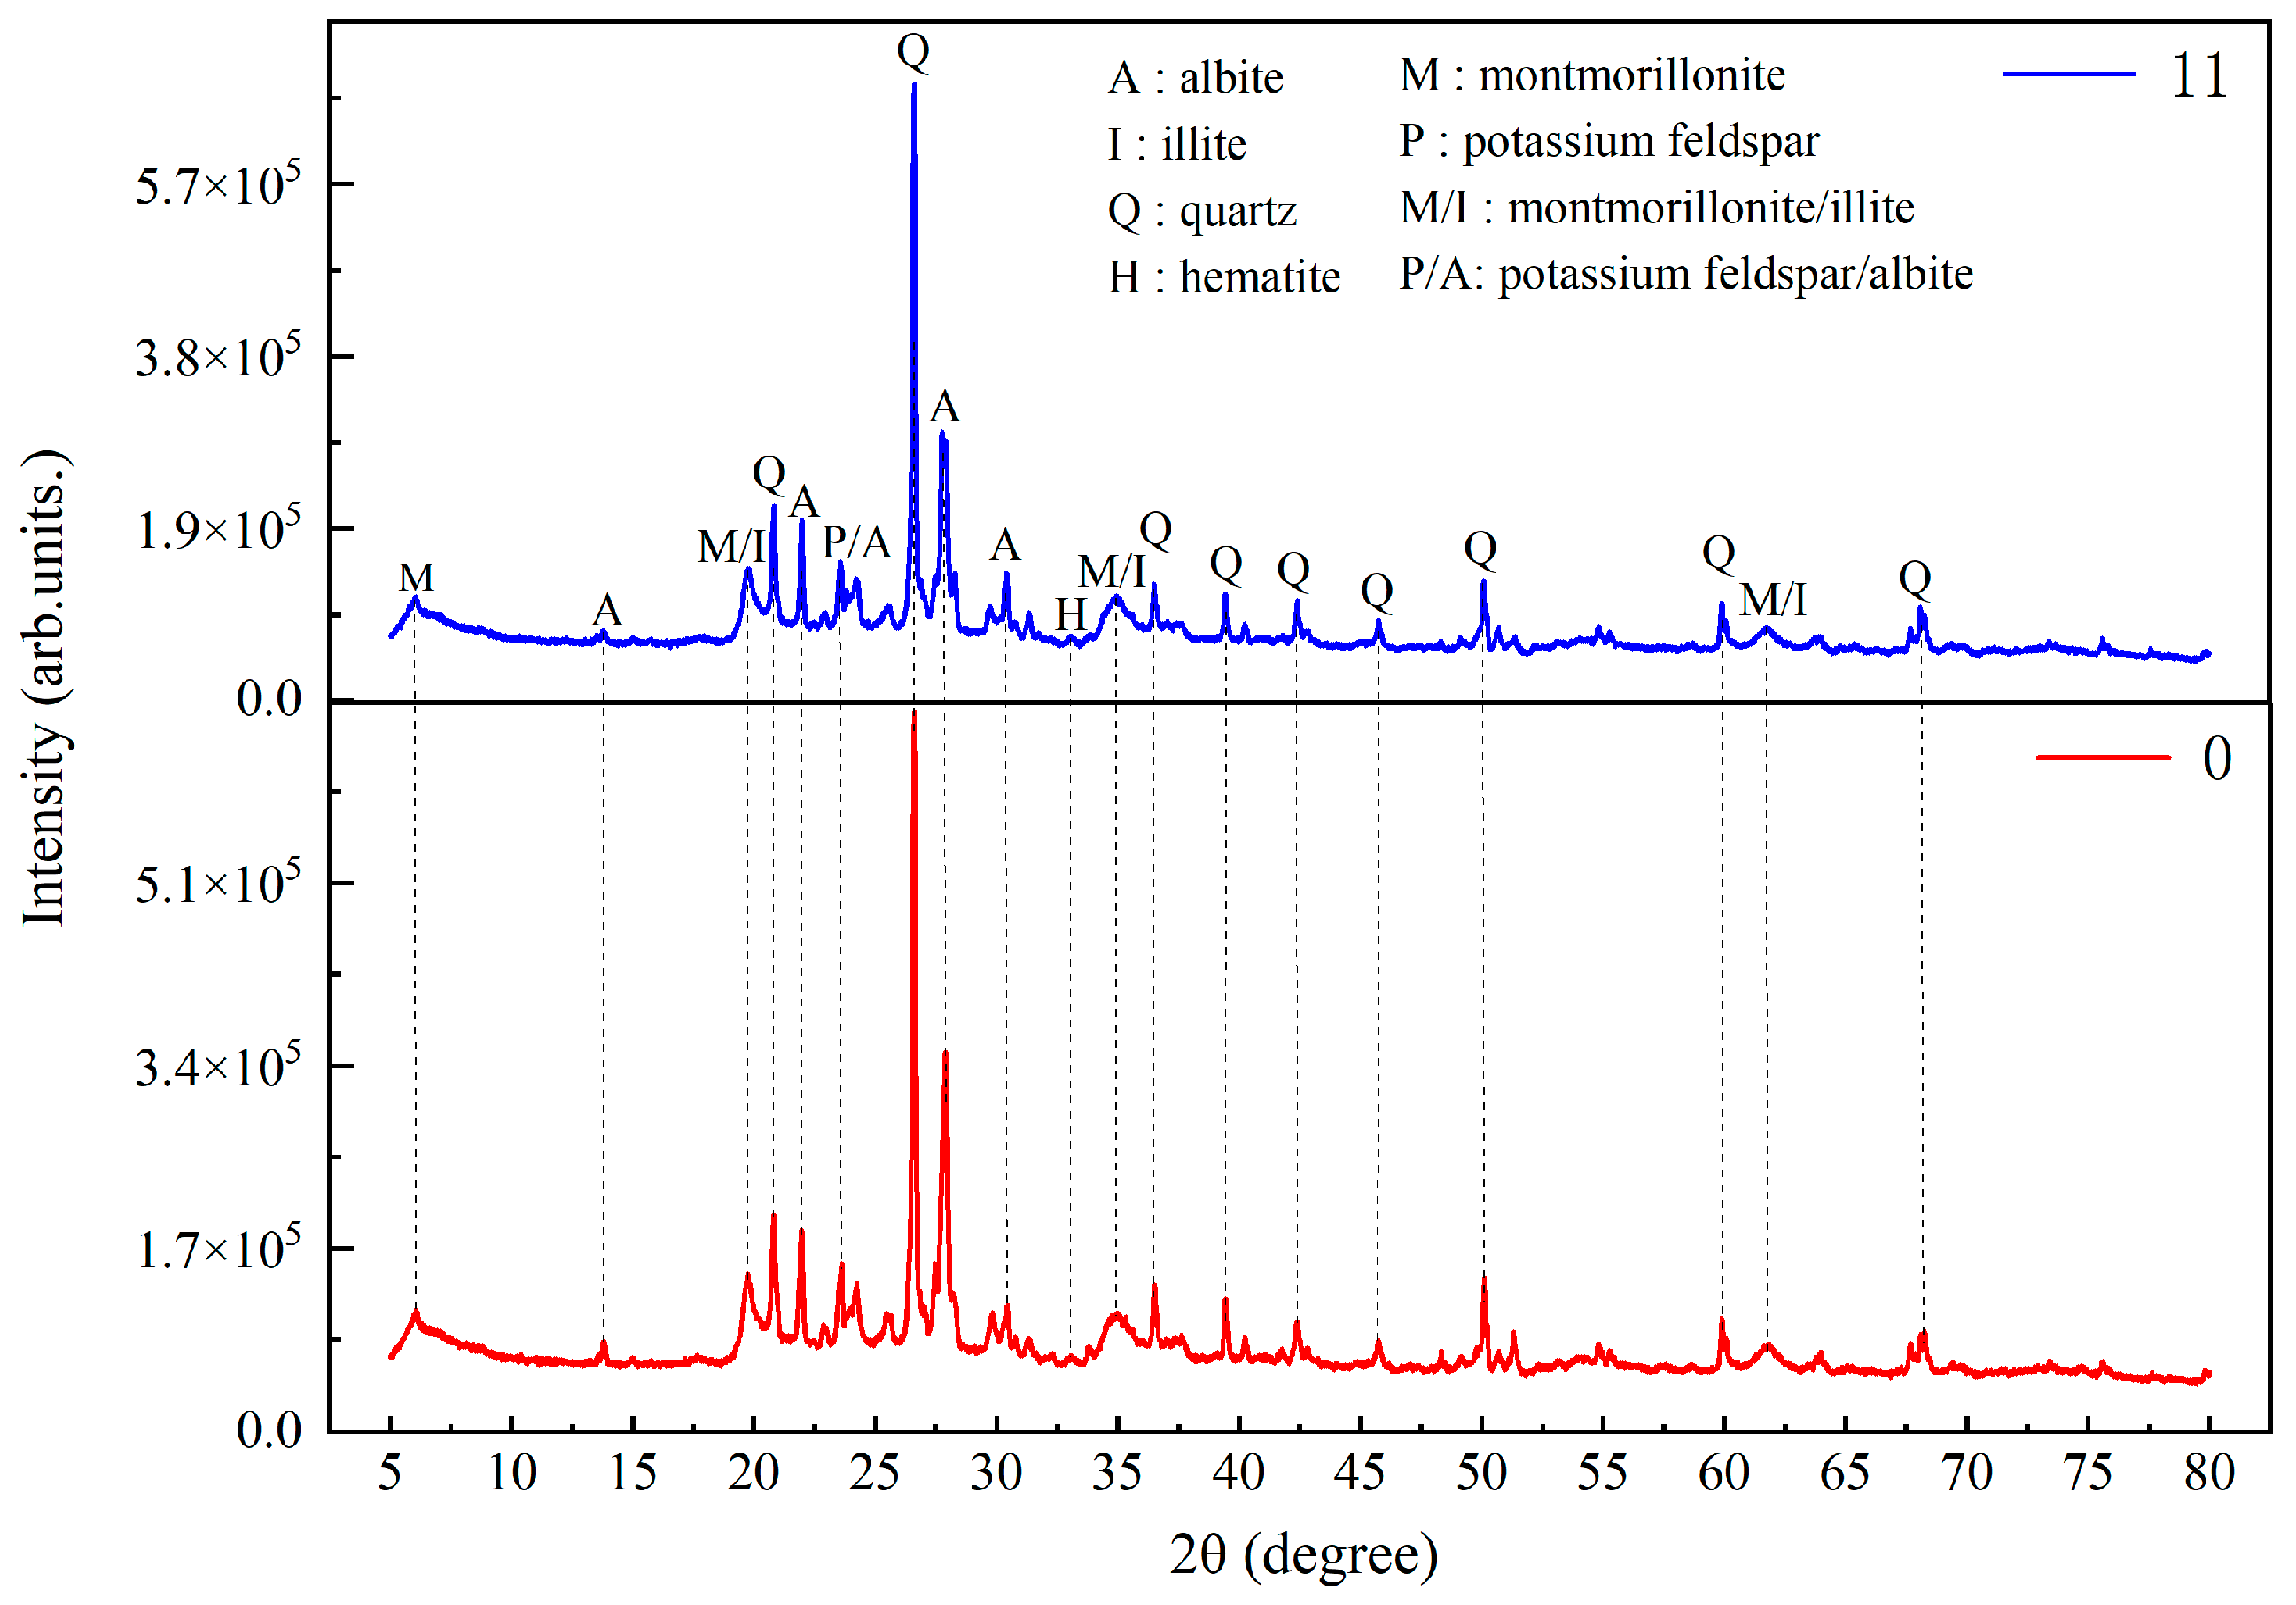
3.1. XRD Results
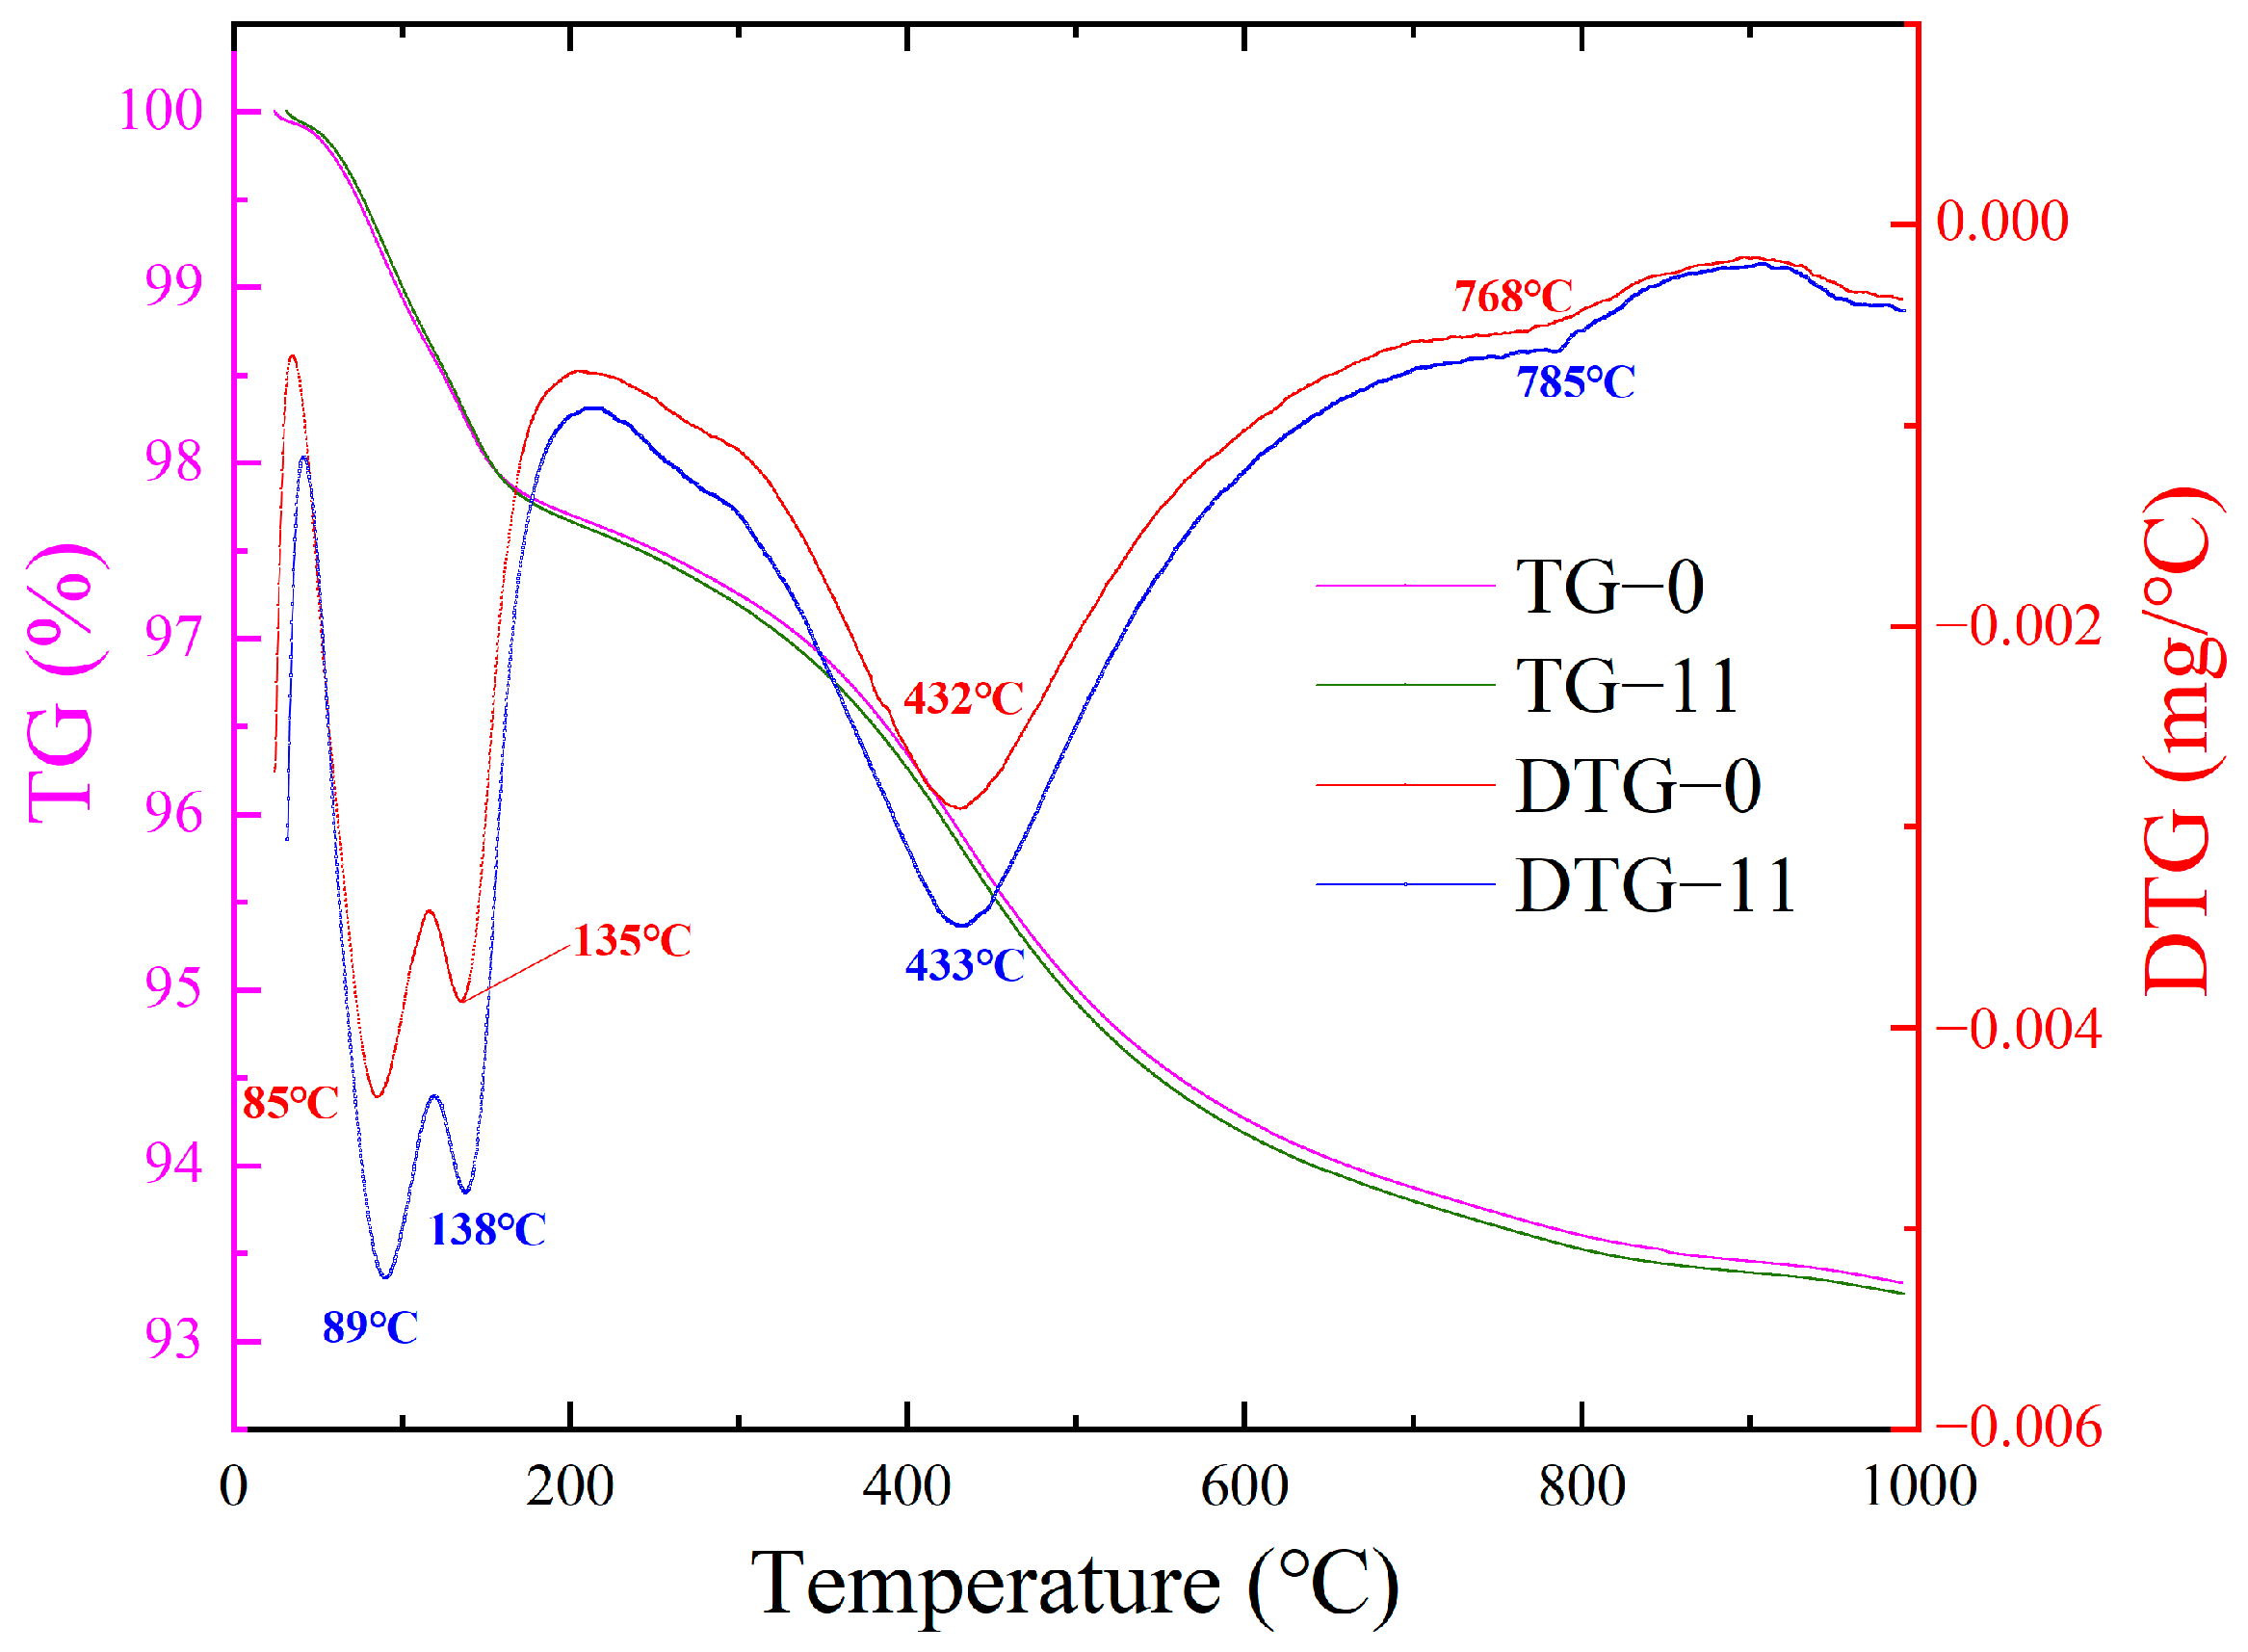
3.2. Thermogravimetric Analysis
3.3. Characteristics of Microstructure
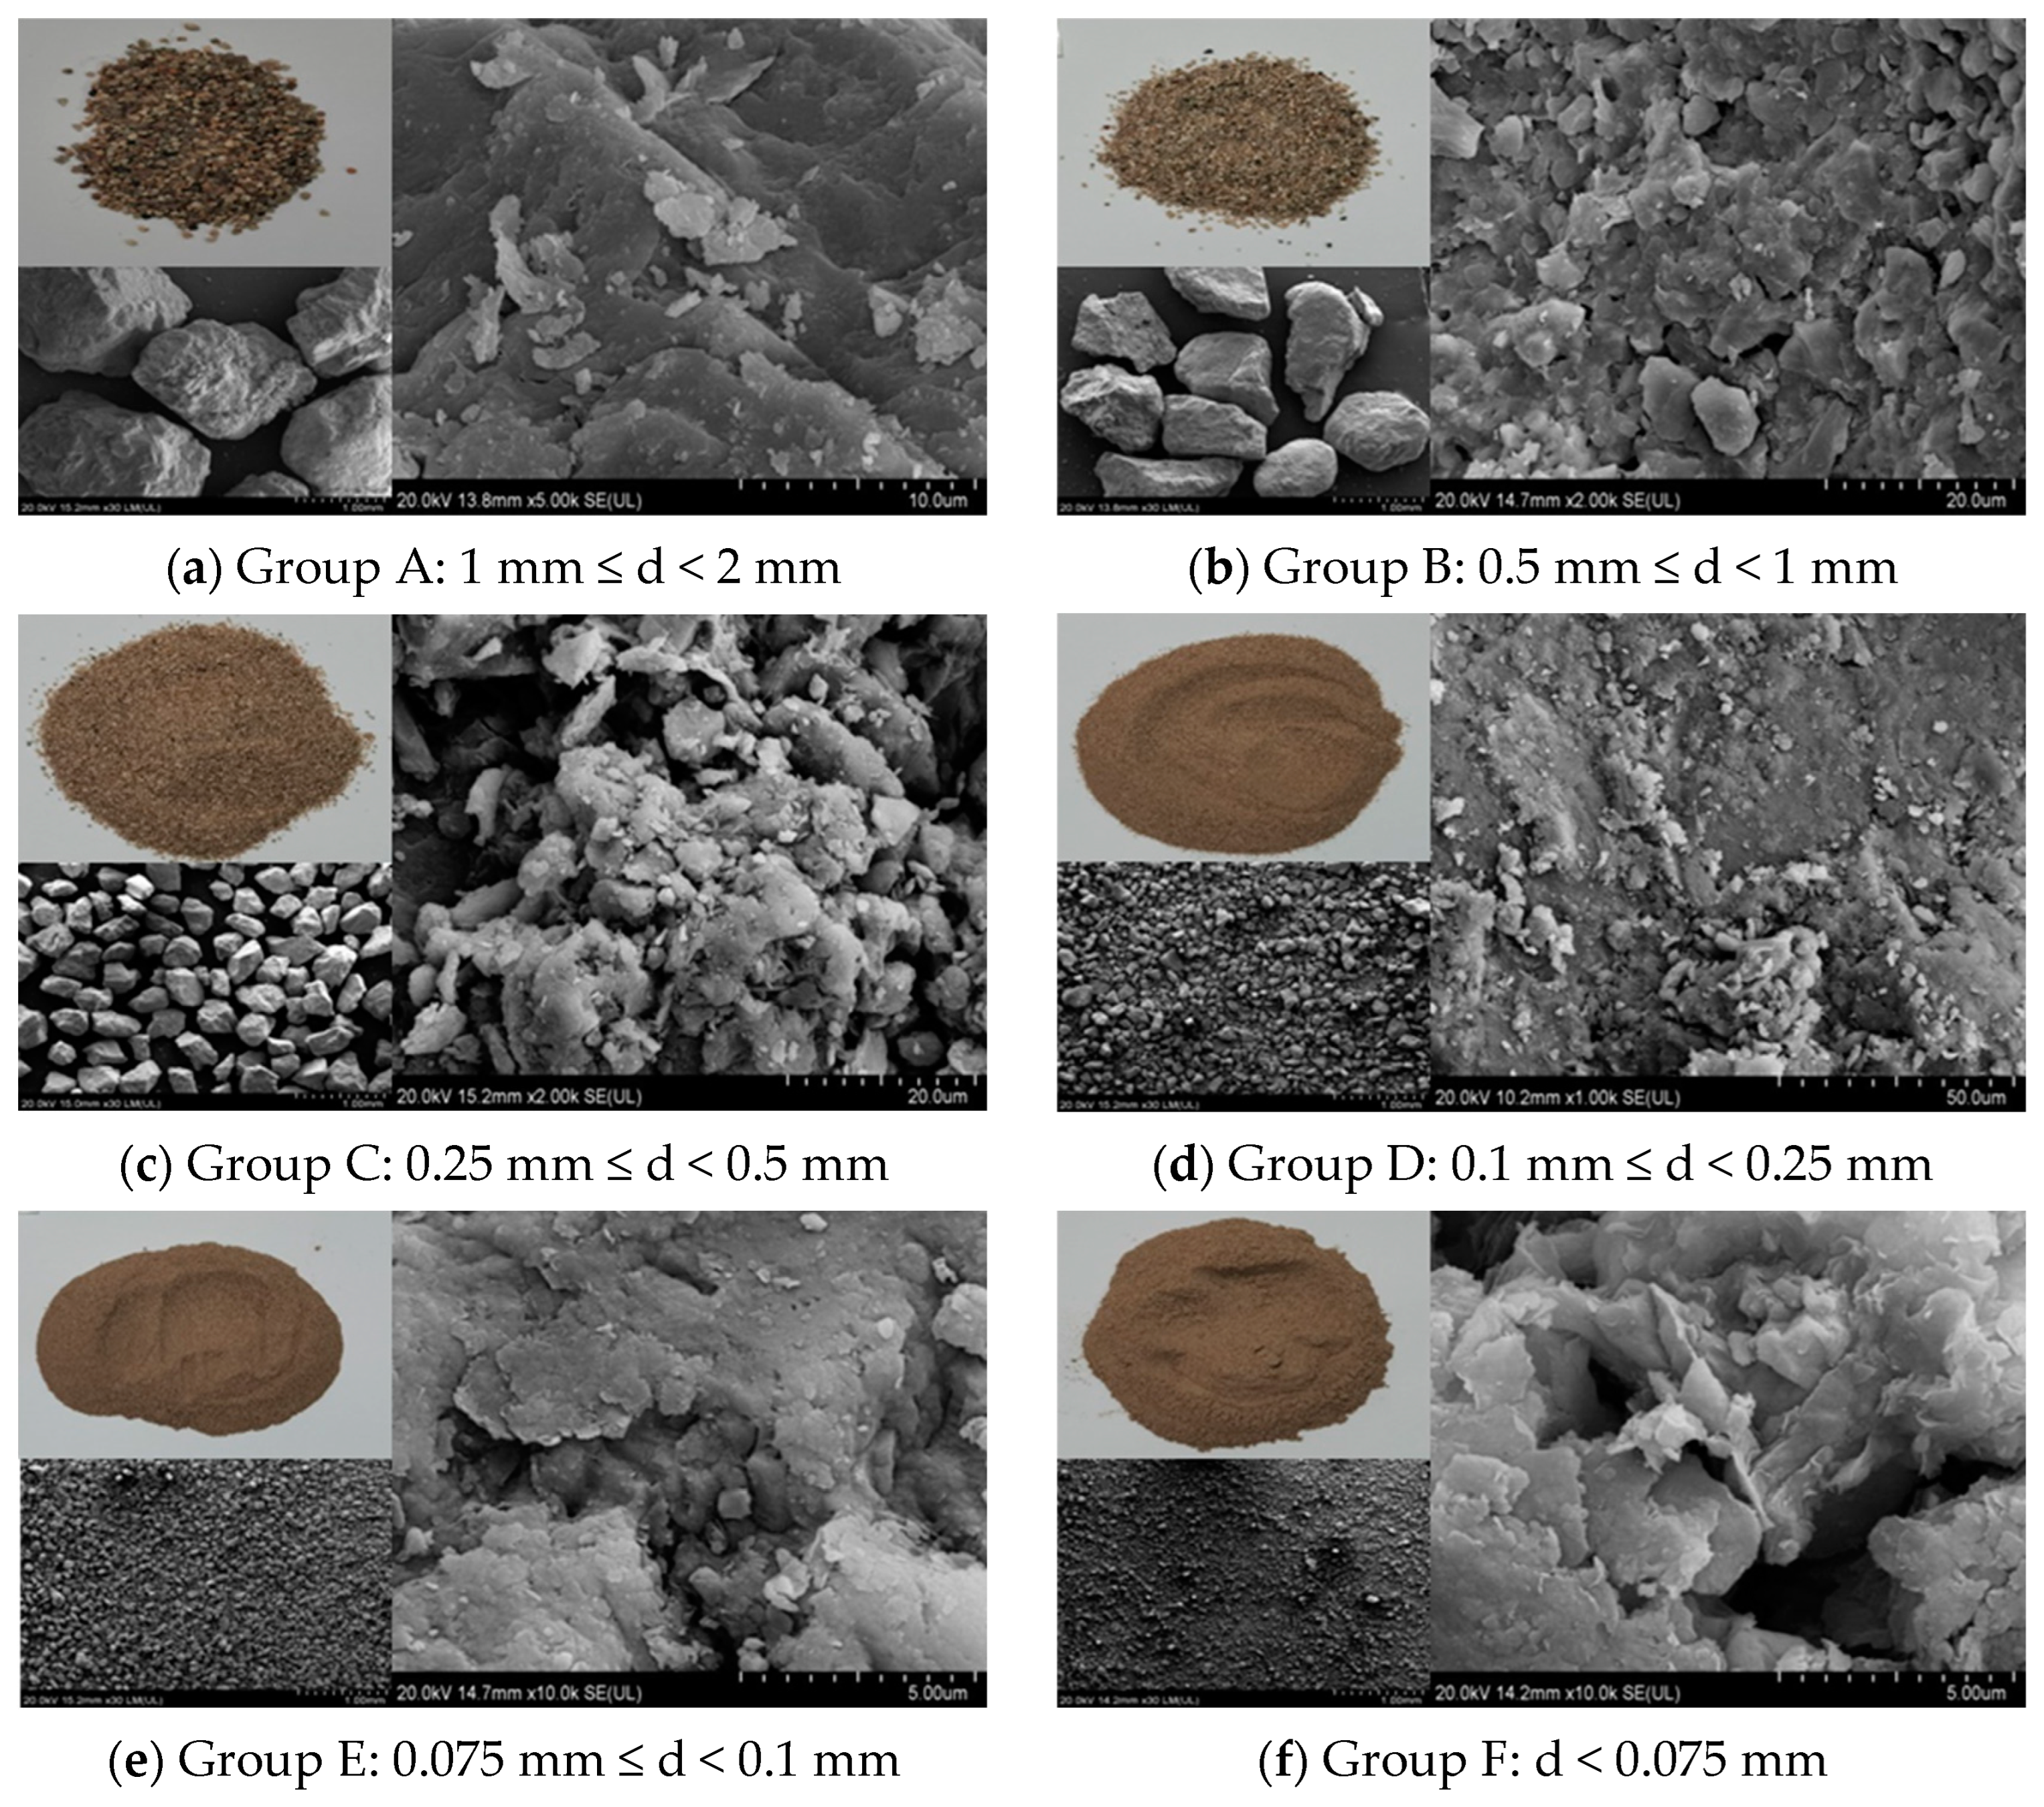
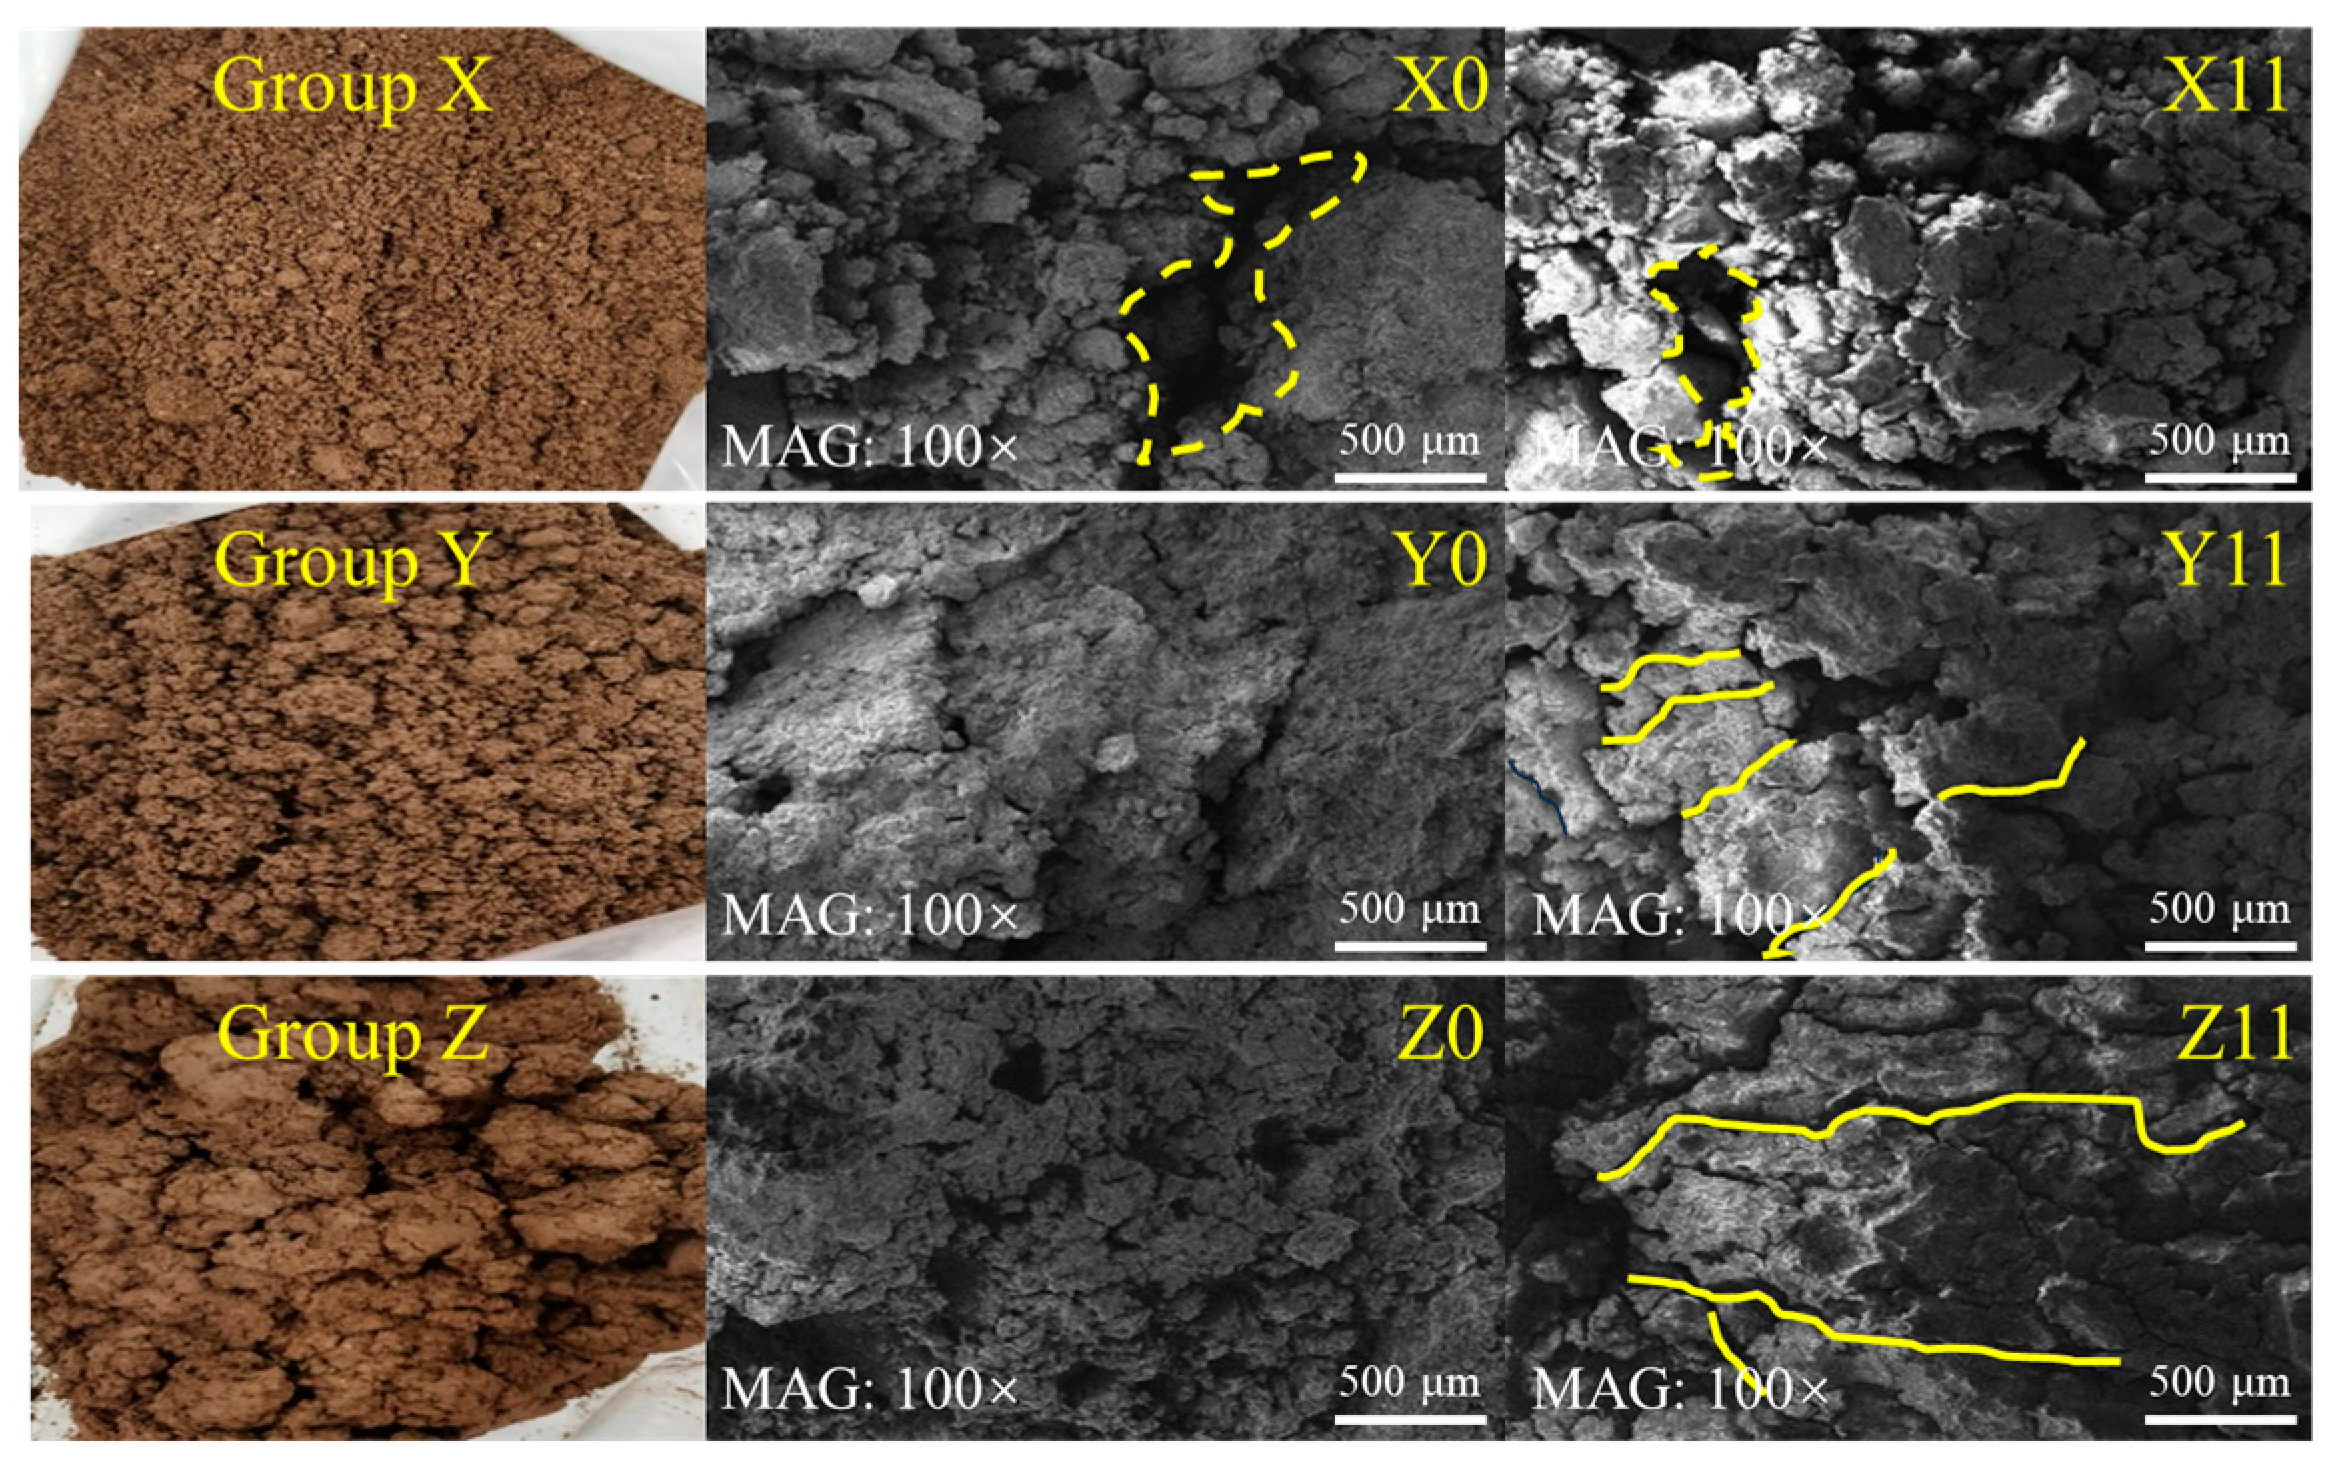
3.3.1. Microscopic Characteristics of Particle Separation
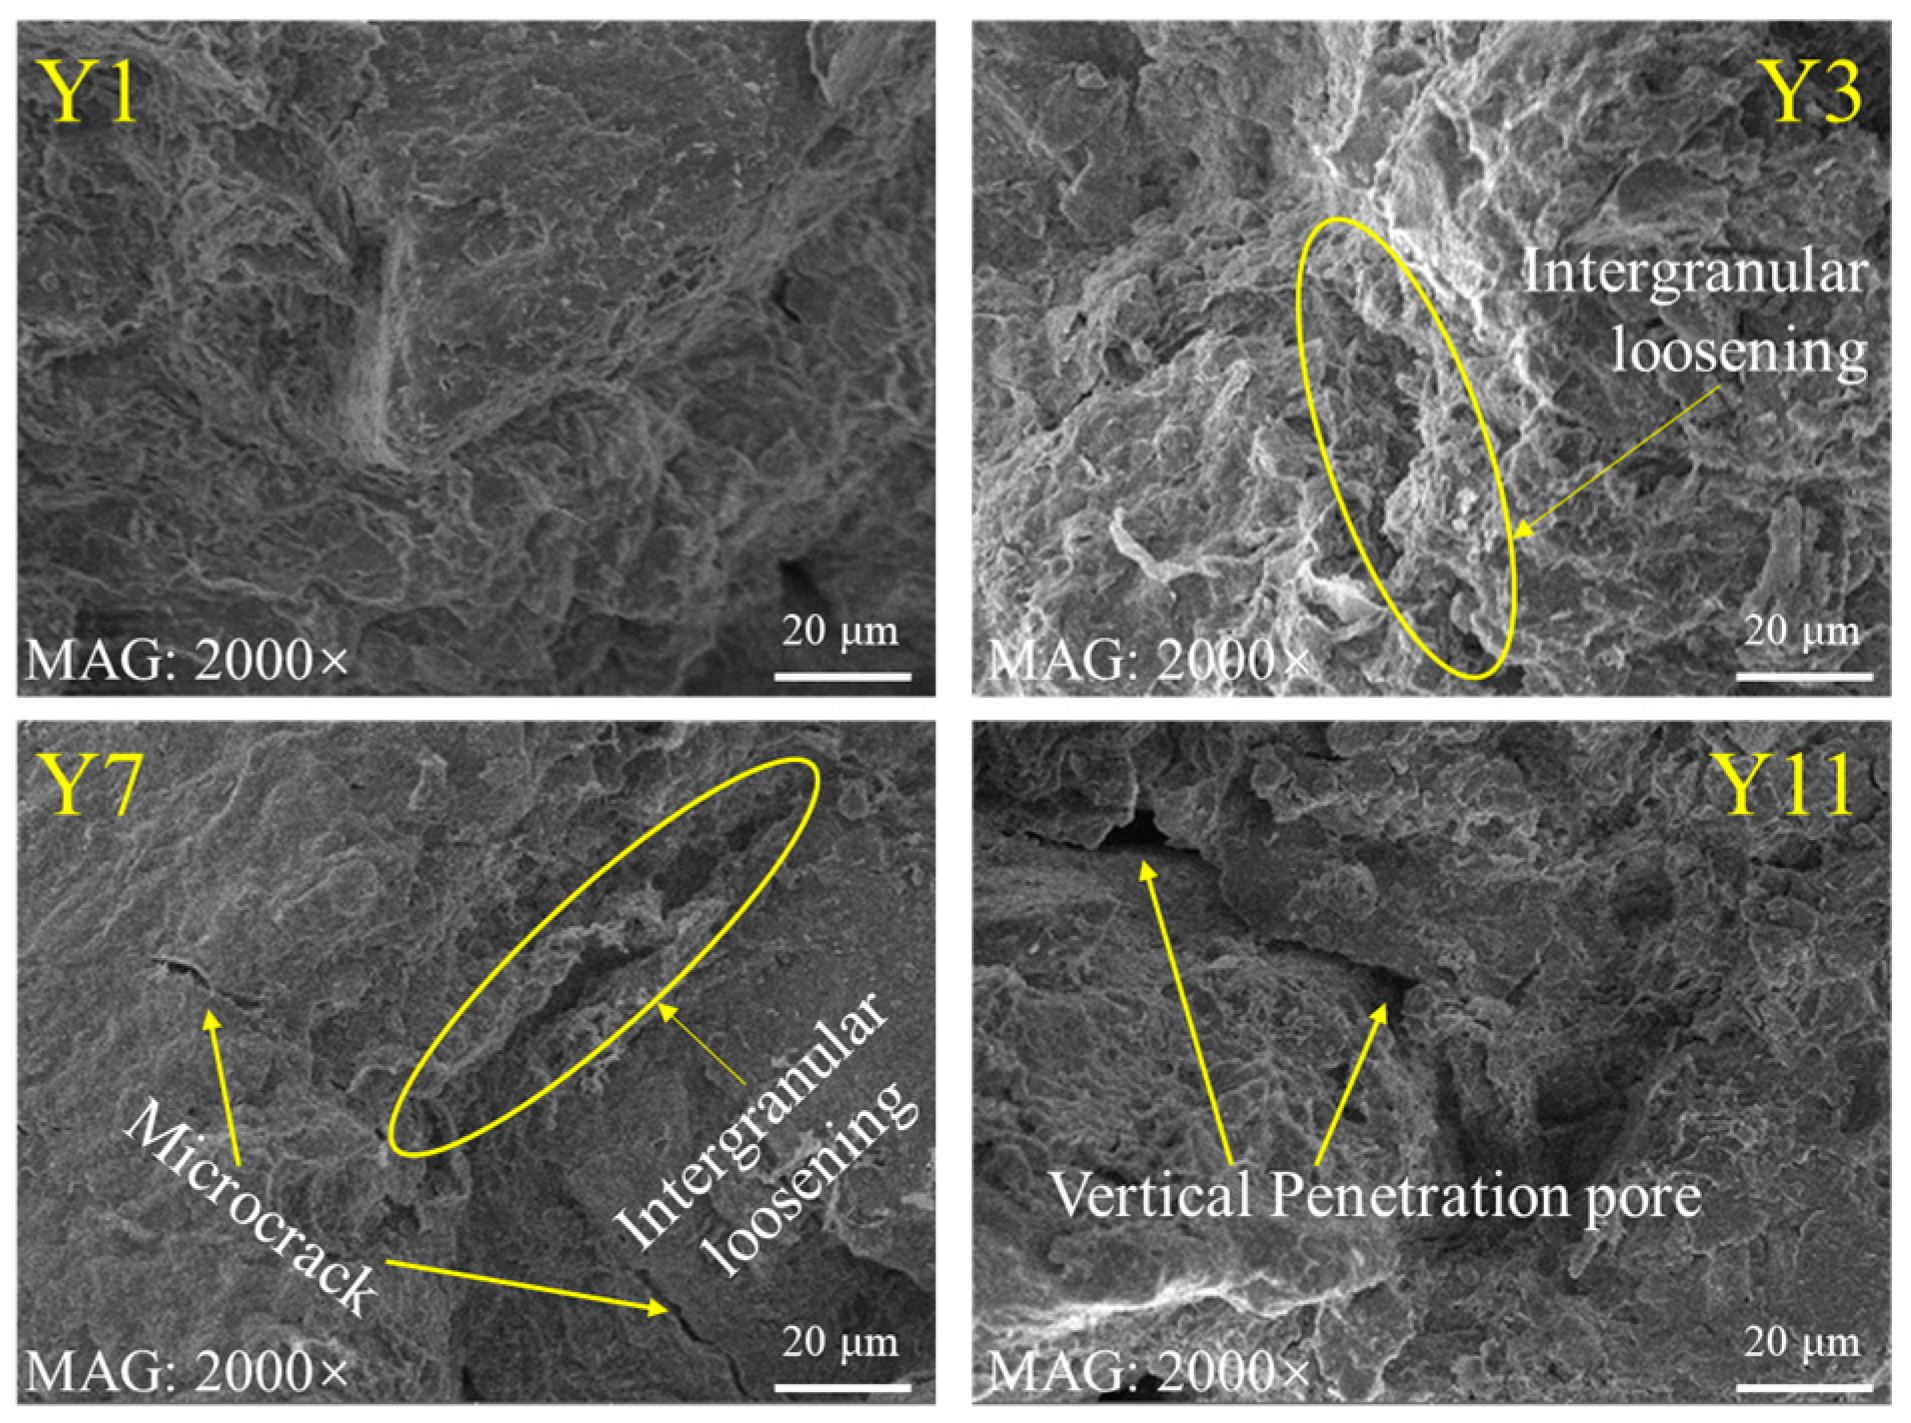
3.3.2. Qualitative Analysis of Microscopic Characteristics
3.3.3. Quantitative Analysis of Microscopic Characteristics
4. Discussion
4.1. Effect of Freeze–Thaw Cycles on Microstructure
4.2. Mechanism of Freeze–Thaw Action in Unsaturated Expansive Soil
5. Conclusions
- (1)
- Compared with other expansive soil sections, the expansive soil section in Yanji is prone to disasters because the soil has a high sand content and low liquid limit. The expansive soil particles of the samples from Yanji are partially blocky particles, which are mainly subrounded or subangular. Under the influence of FTCs, the structural thermal stability was enhanced, the expansion was weakened, and the FTCs amplified the weight loss characteristics of and structural damage effects on the soil samples at high temperatures;
- (2)
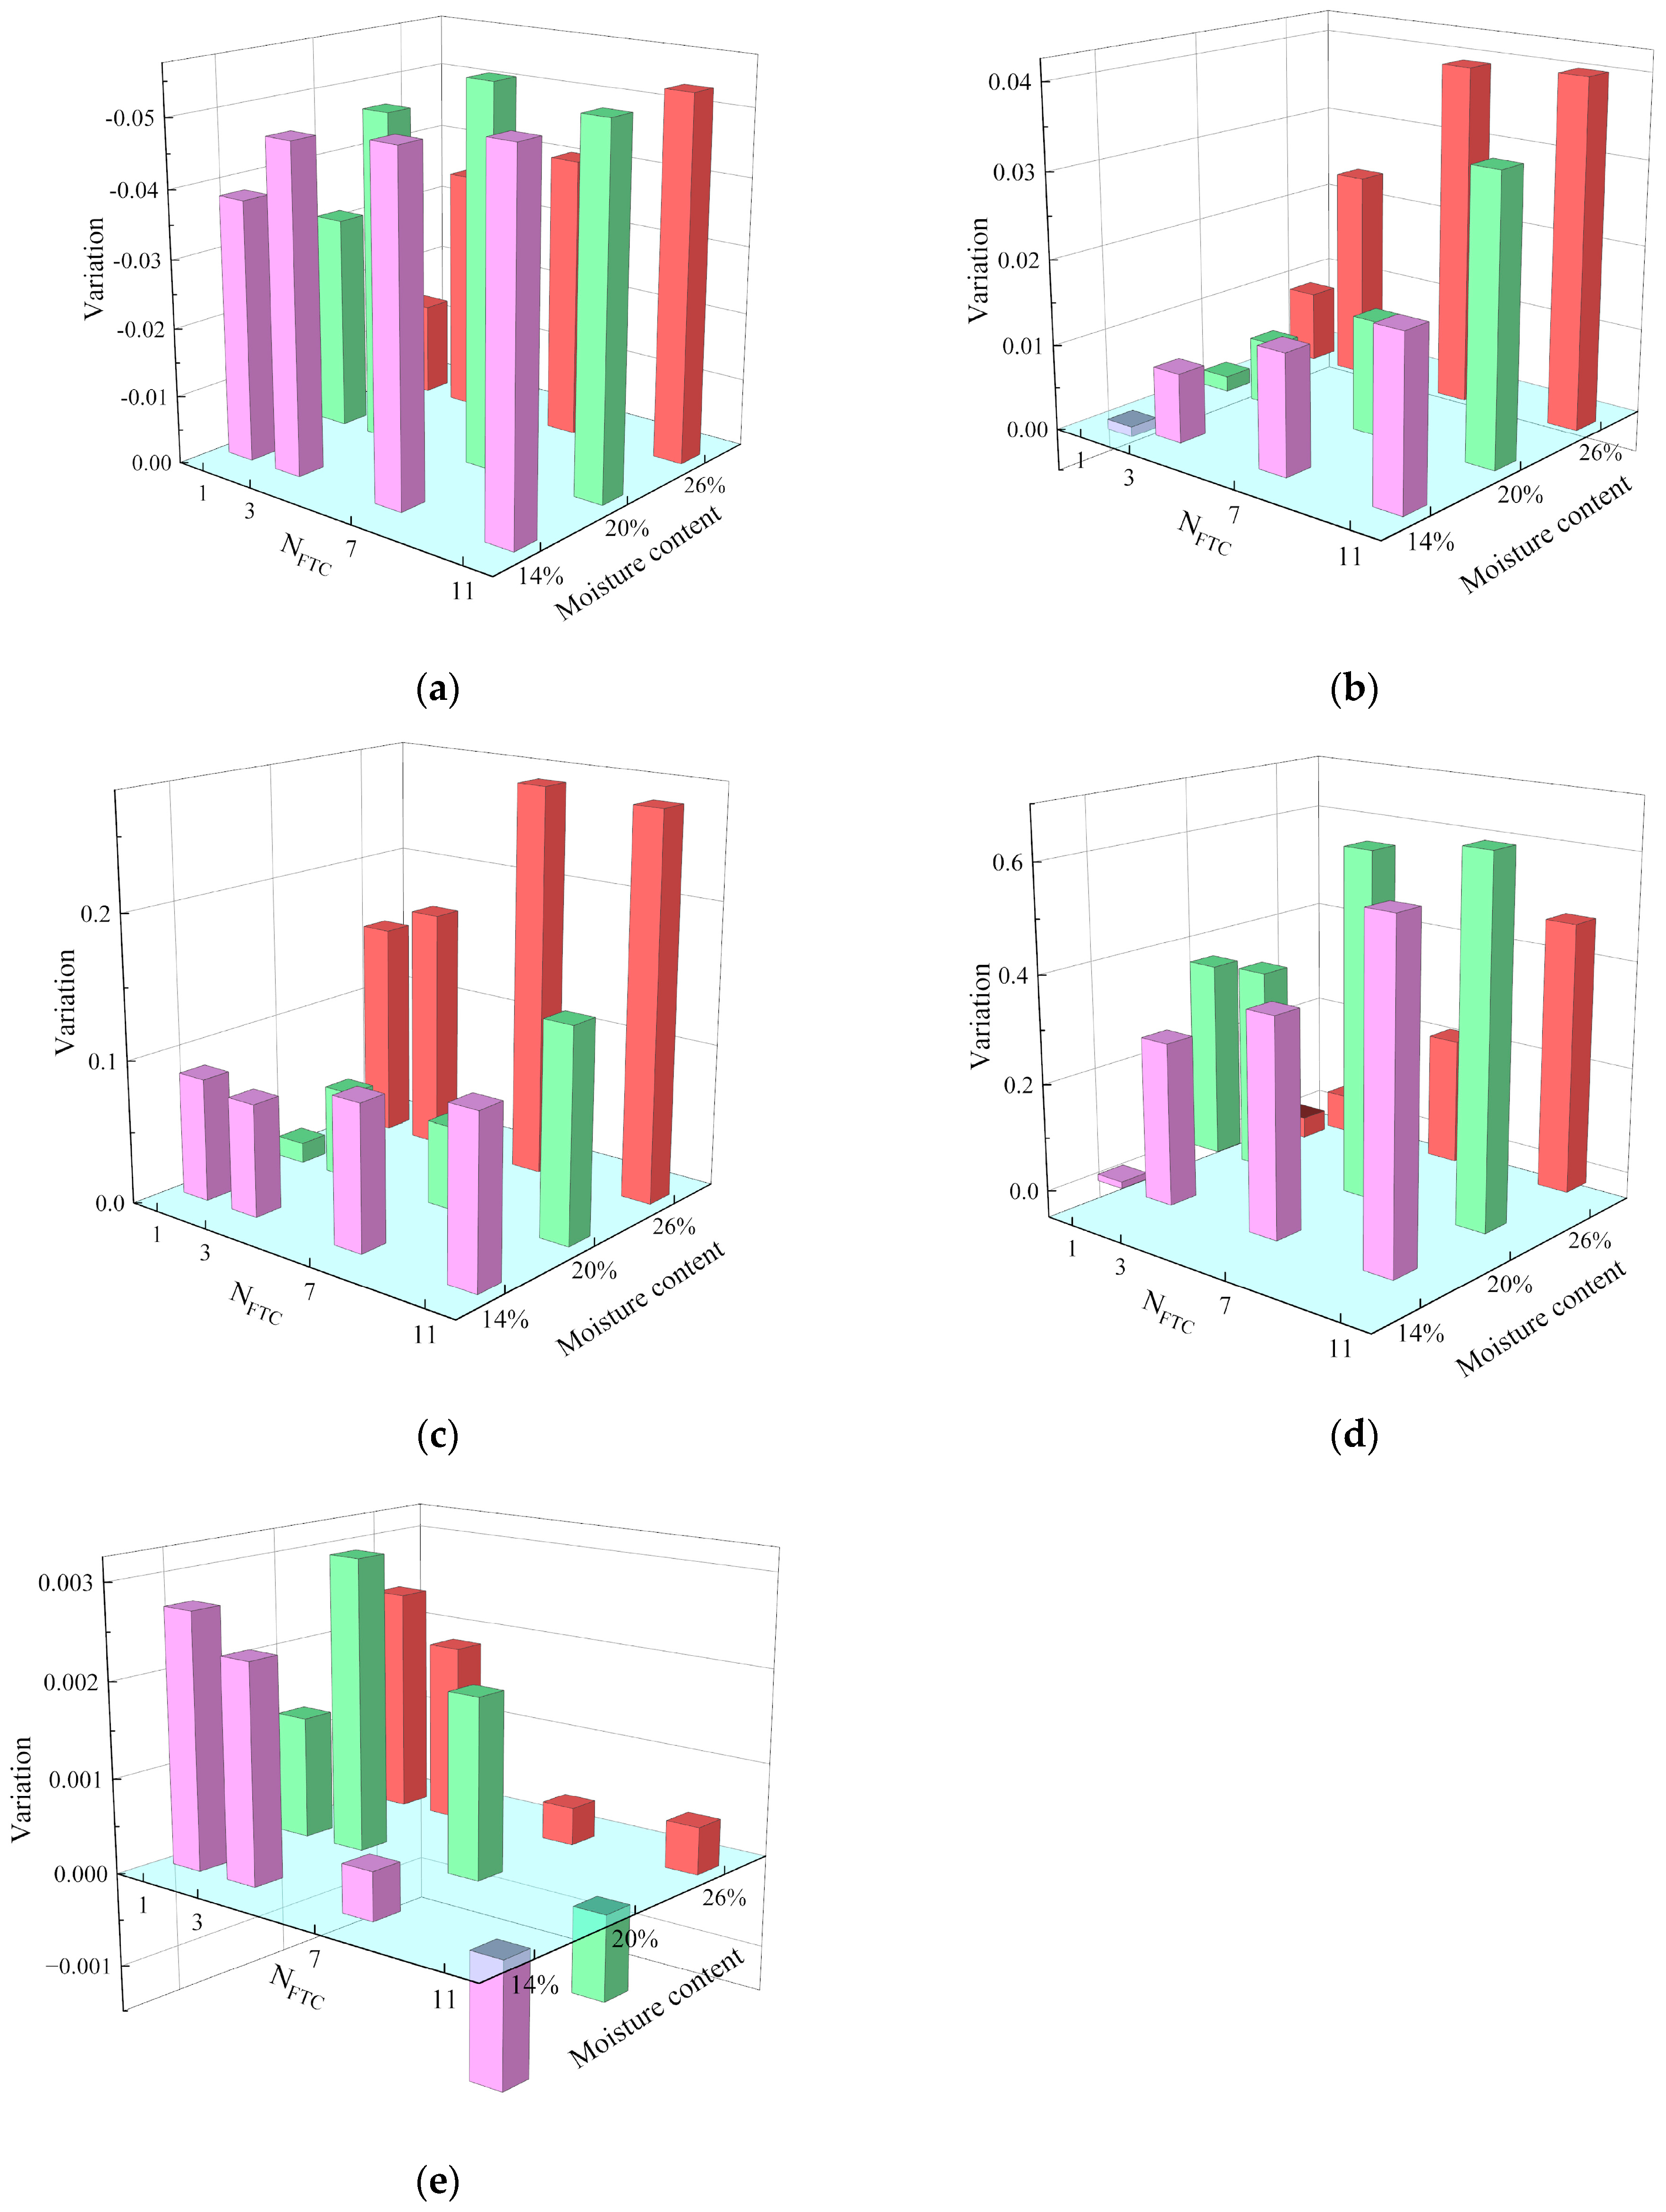
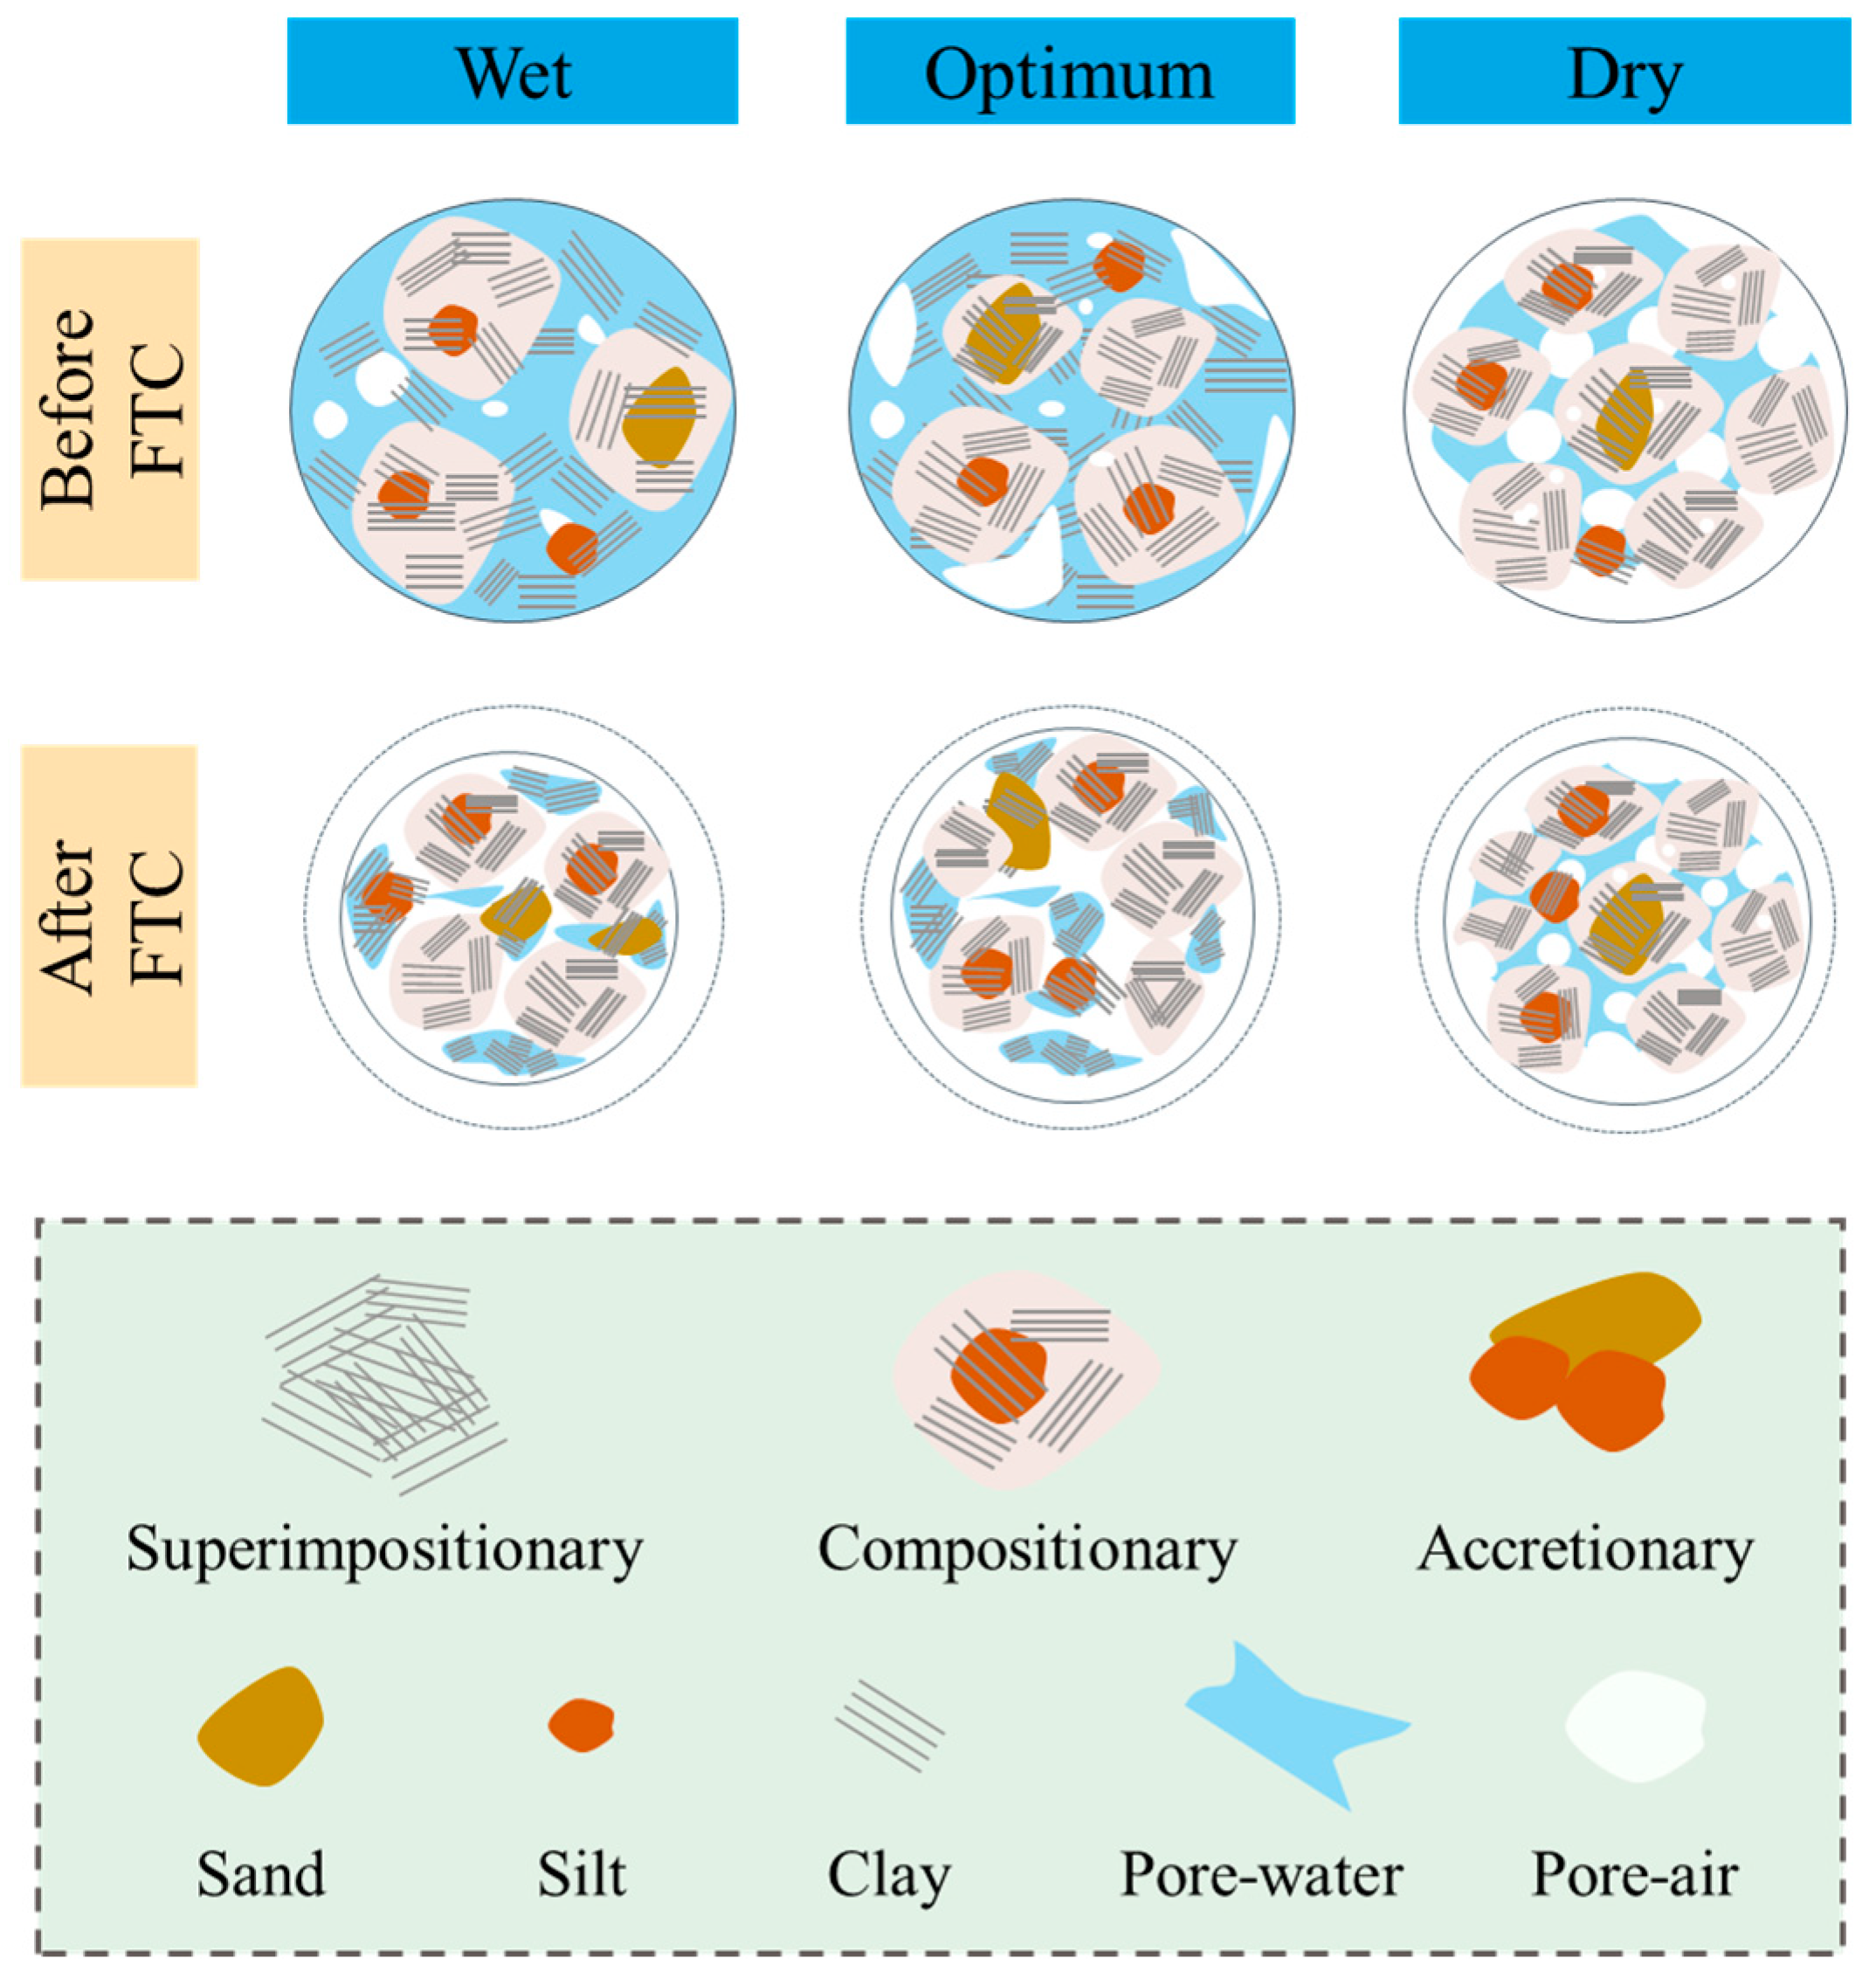
- For the remolded expansive soil sample, the soils with different moisture contents also exhibited distinct characteristics, and, the greater the moisture content, the more significant the effect of the FTCs;
- (3)
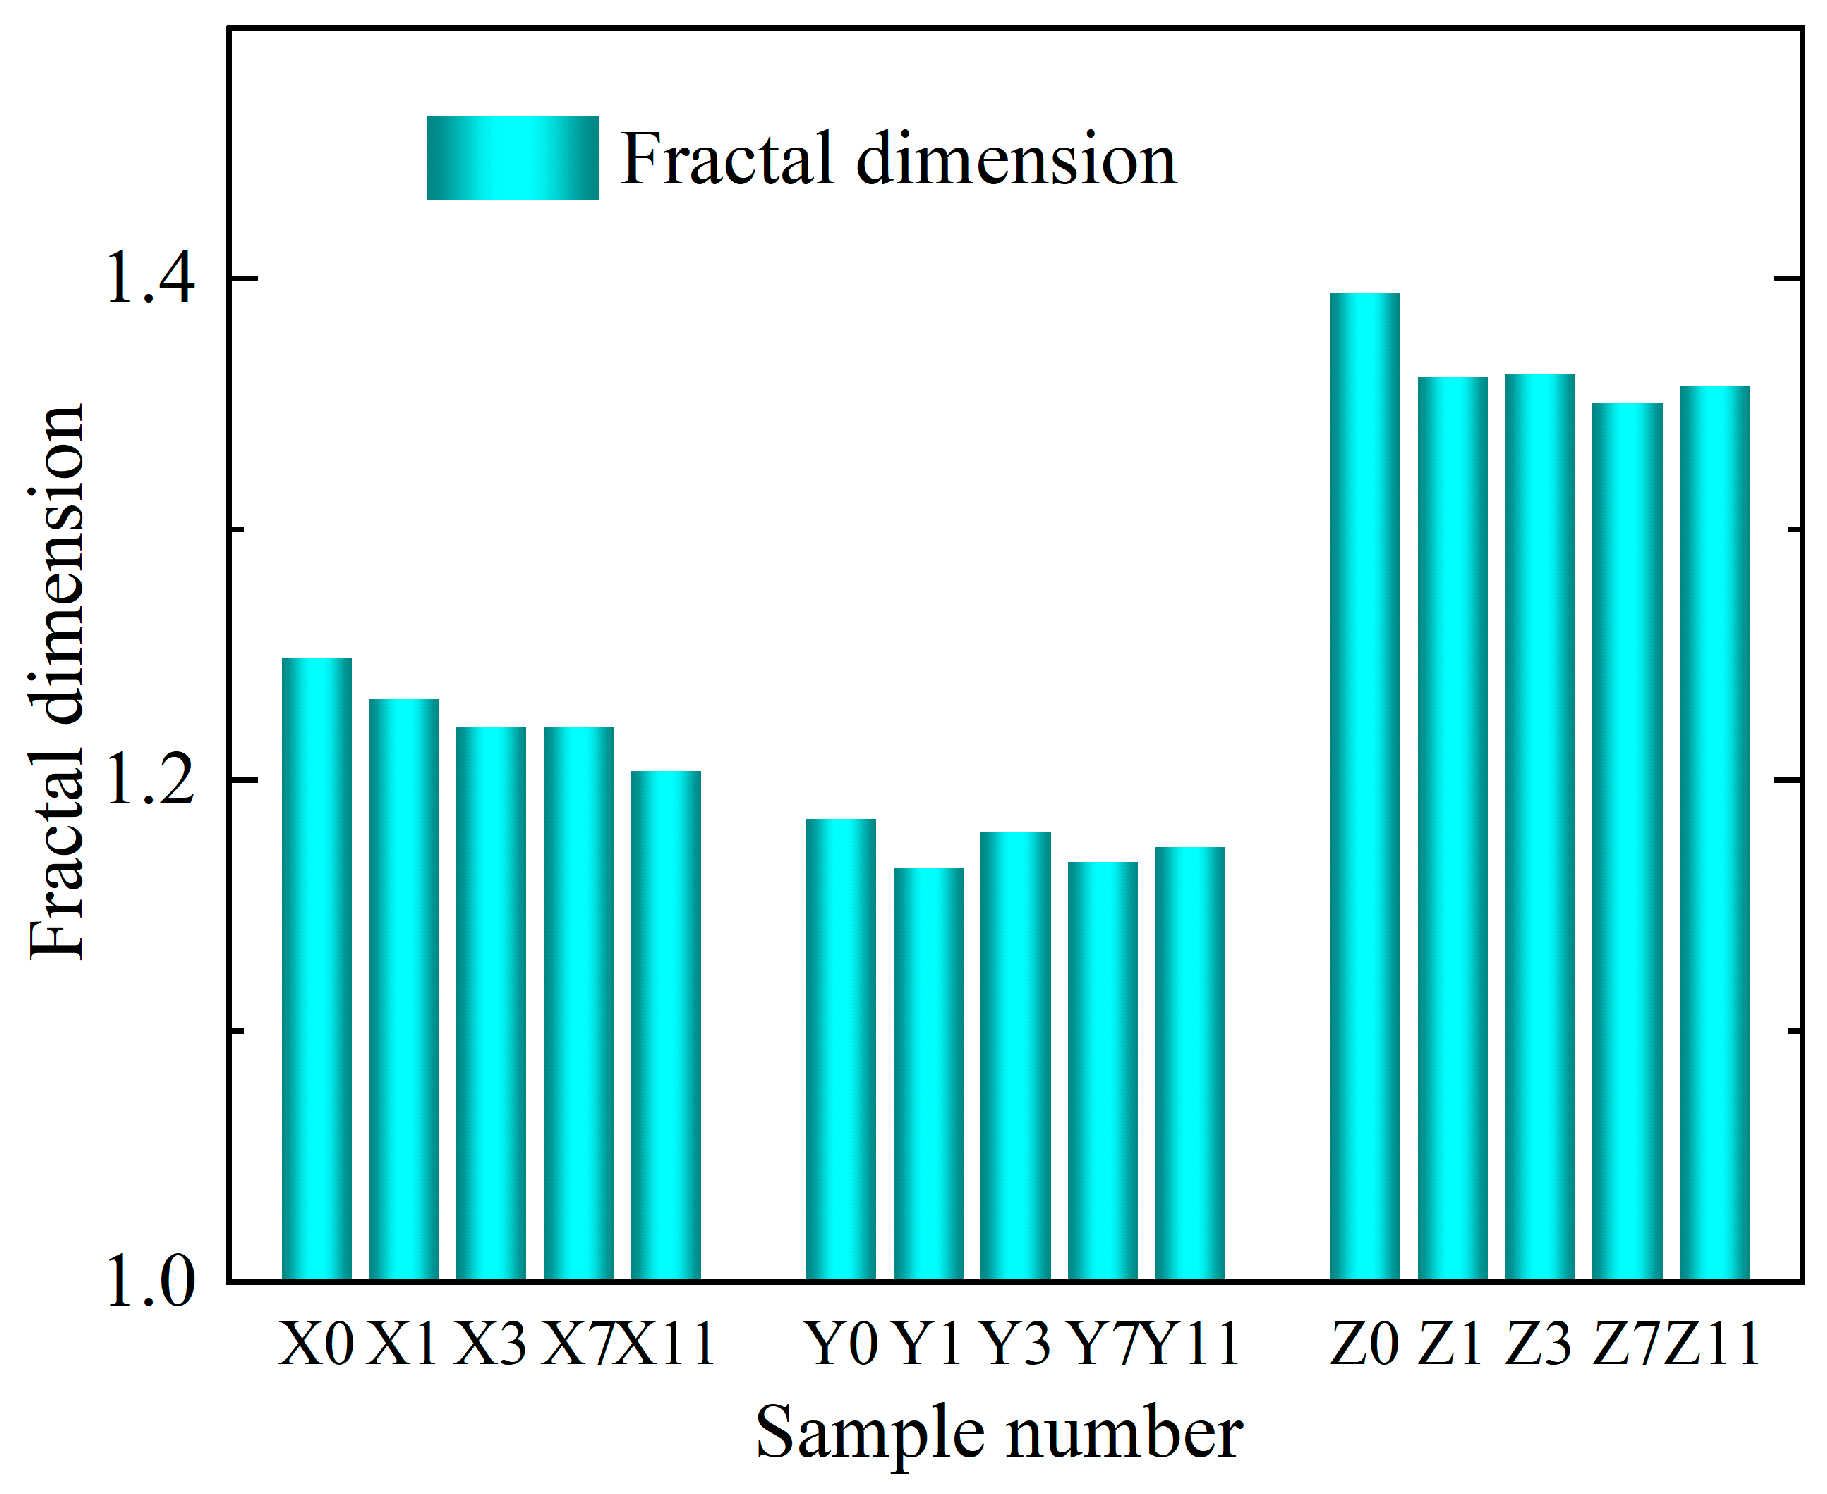
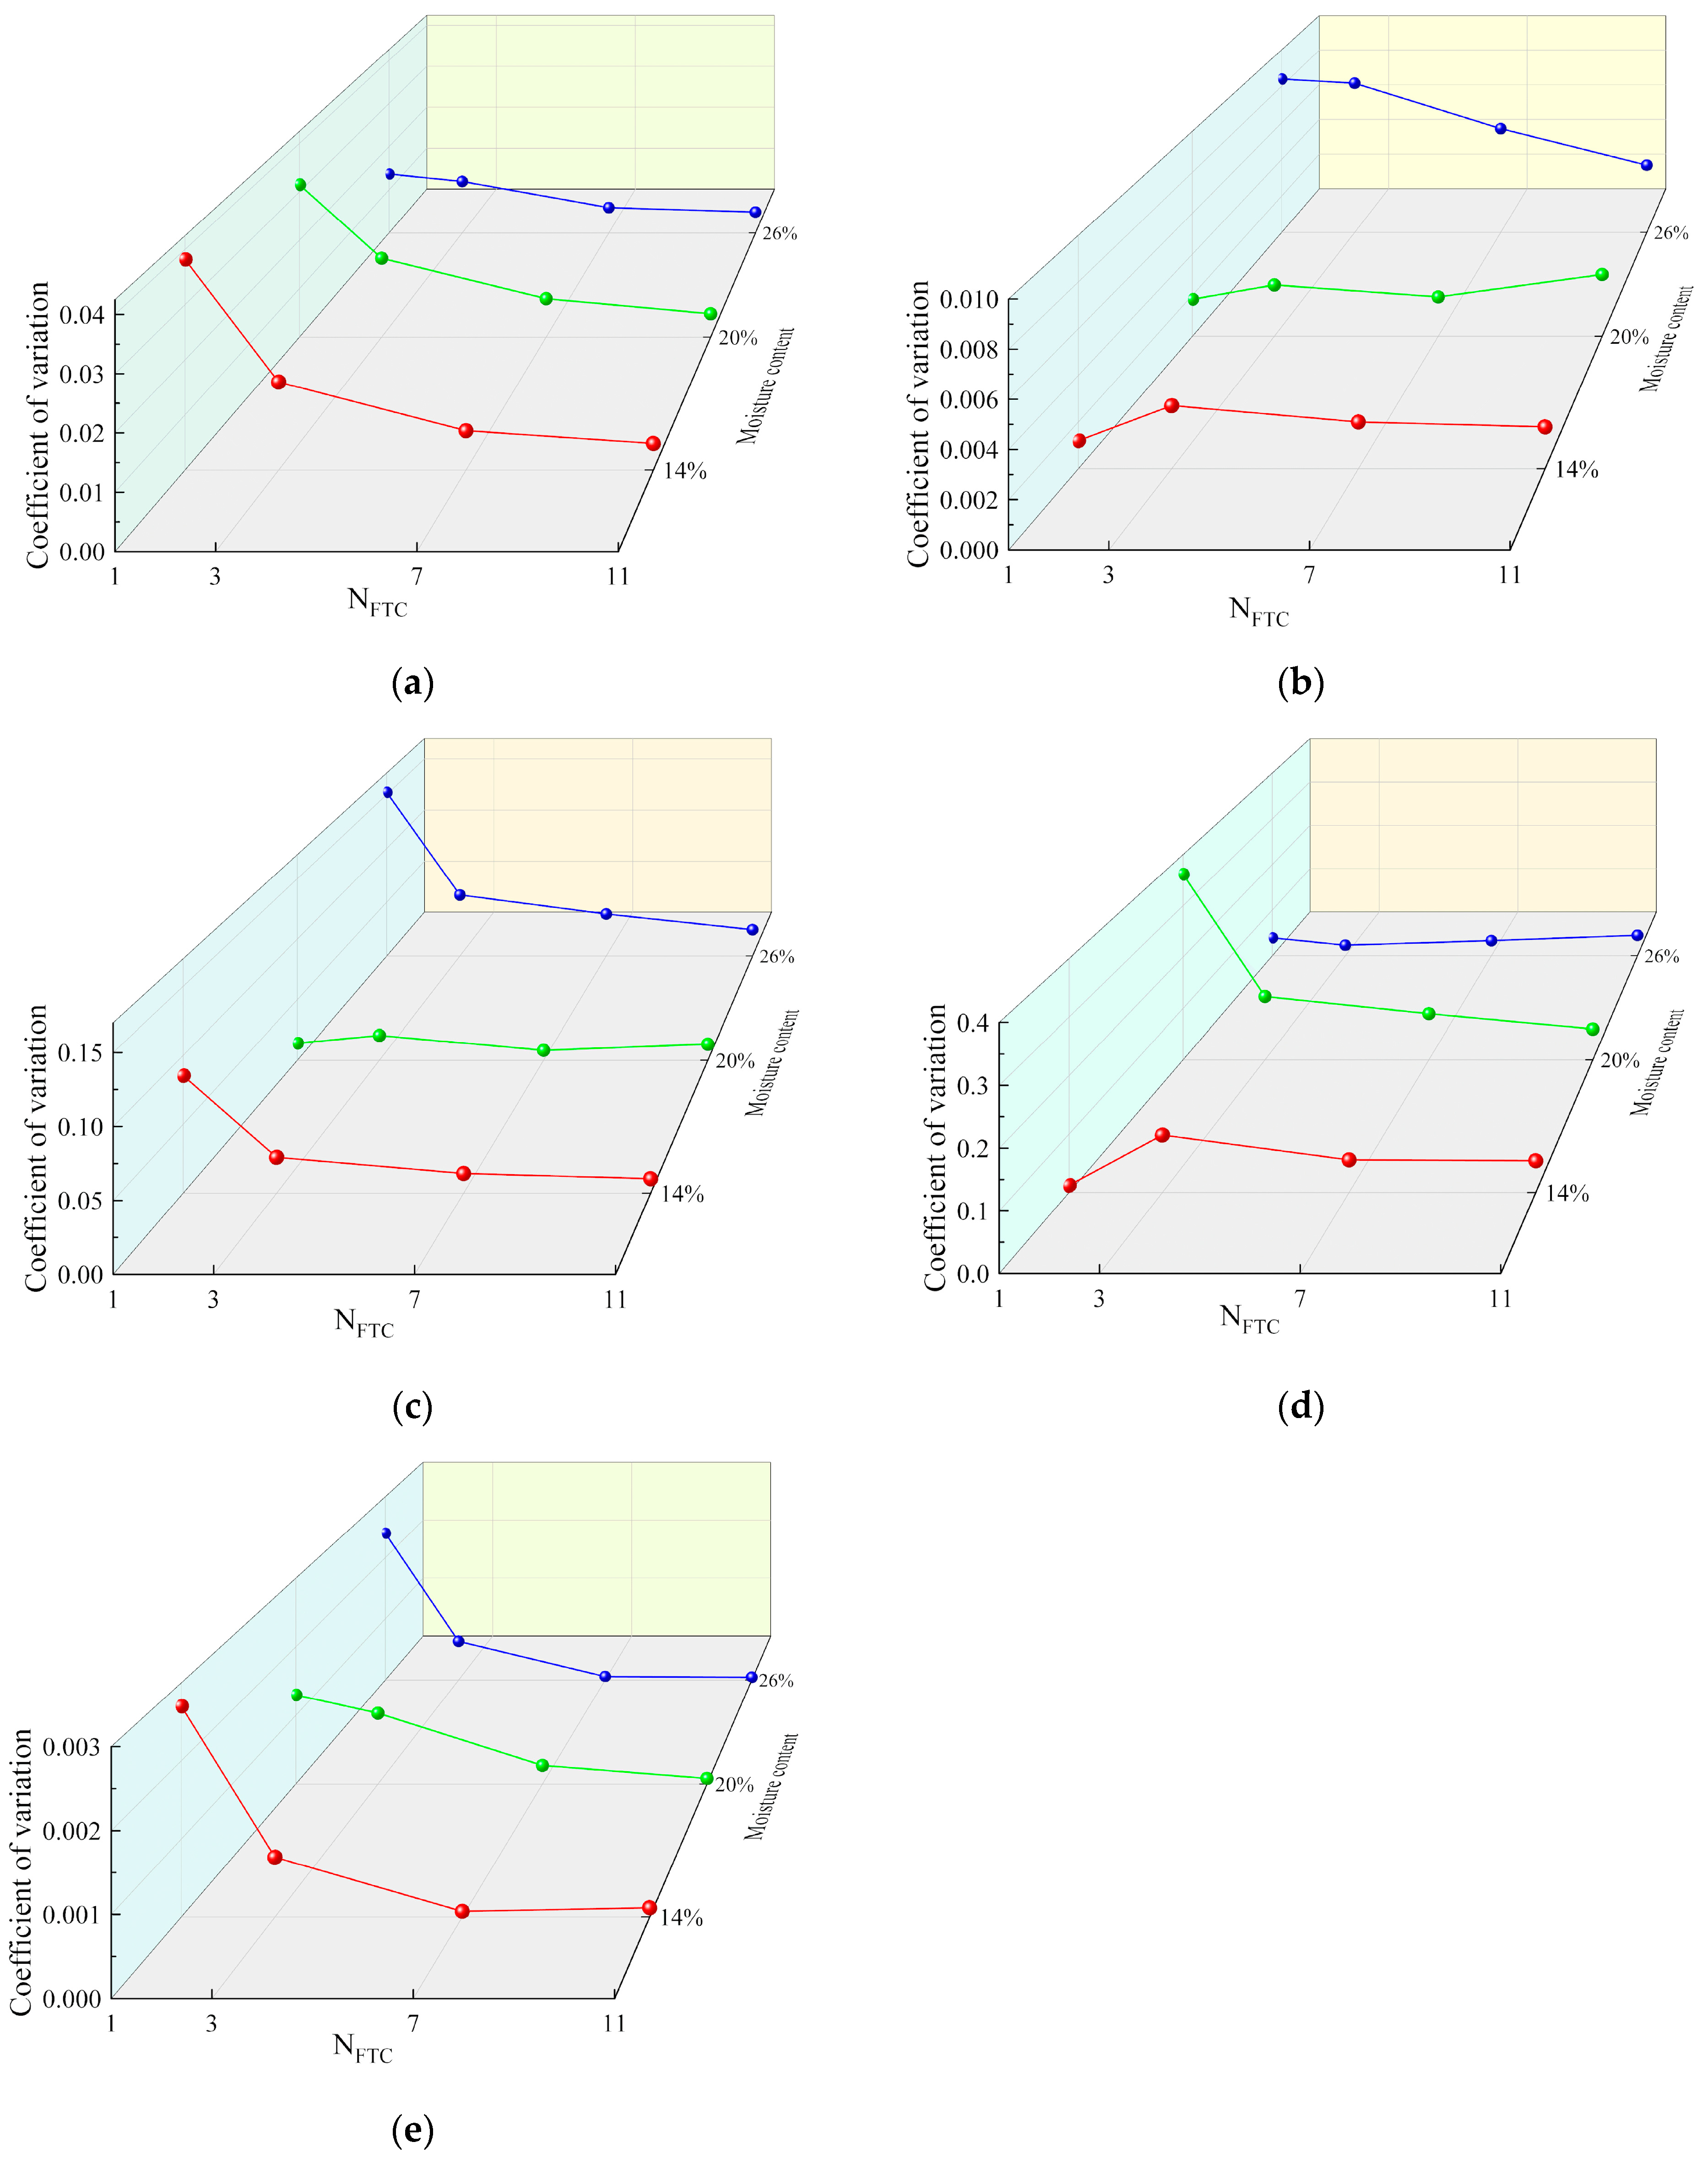
- The FTCs increased the complexity of the particle edge shape, changed the particle distribution from dispersed to concentrated, decreased the proportion of large particles, and caused the spatial morphological characteristics of the particles to become more complicated. The variabilities of the area probability distribution index and the fractal dimension of the particle distribution were medium, and their coefficients of variation were large before the 3rd FTC; then, their variabilities gradually decreased;
- (4)
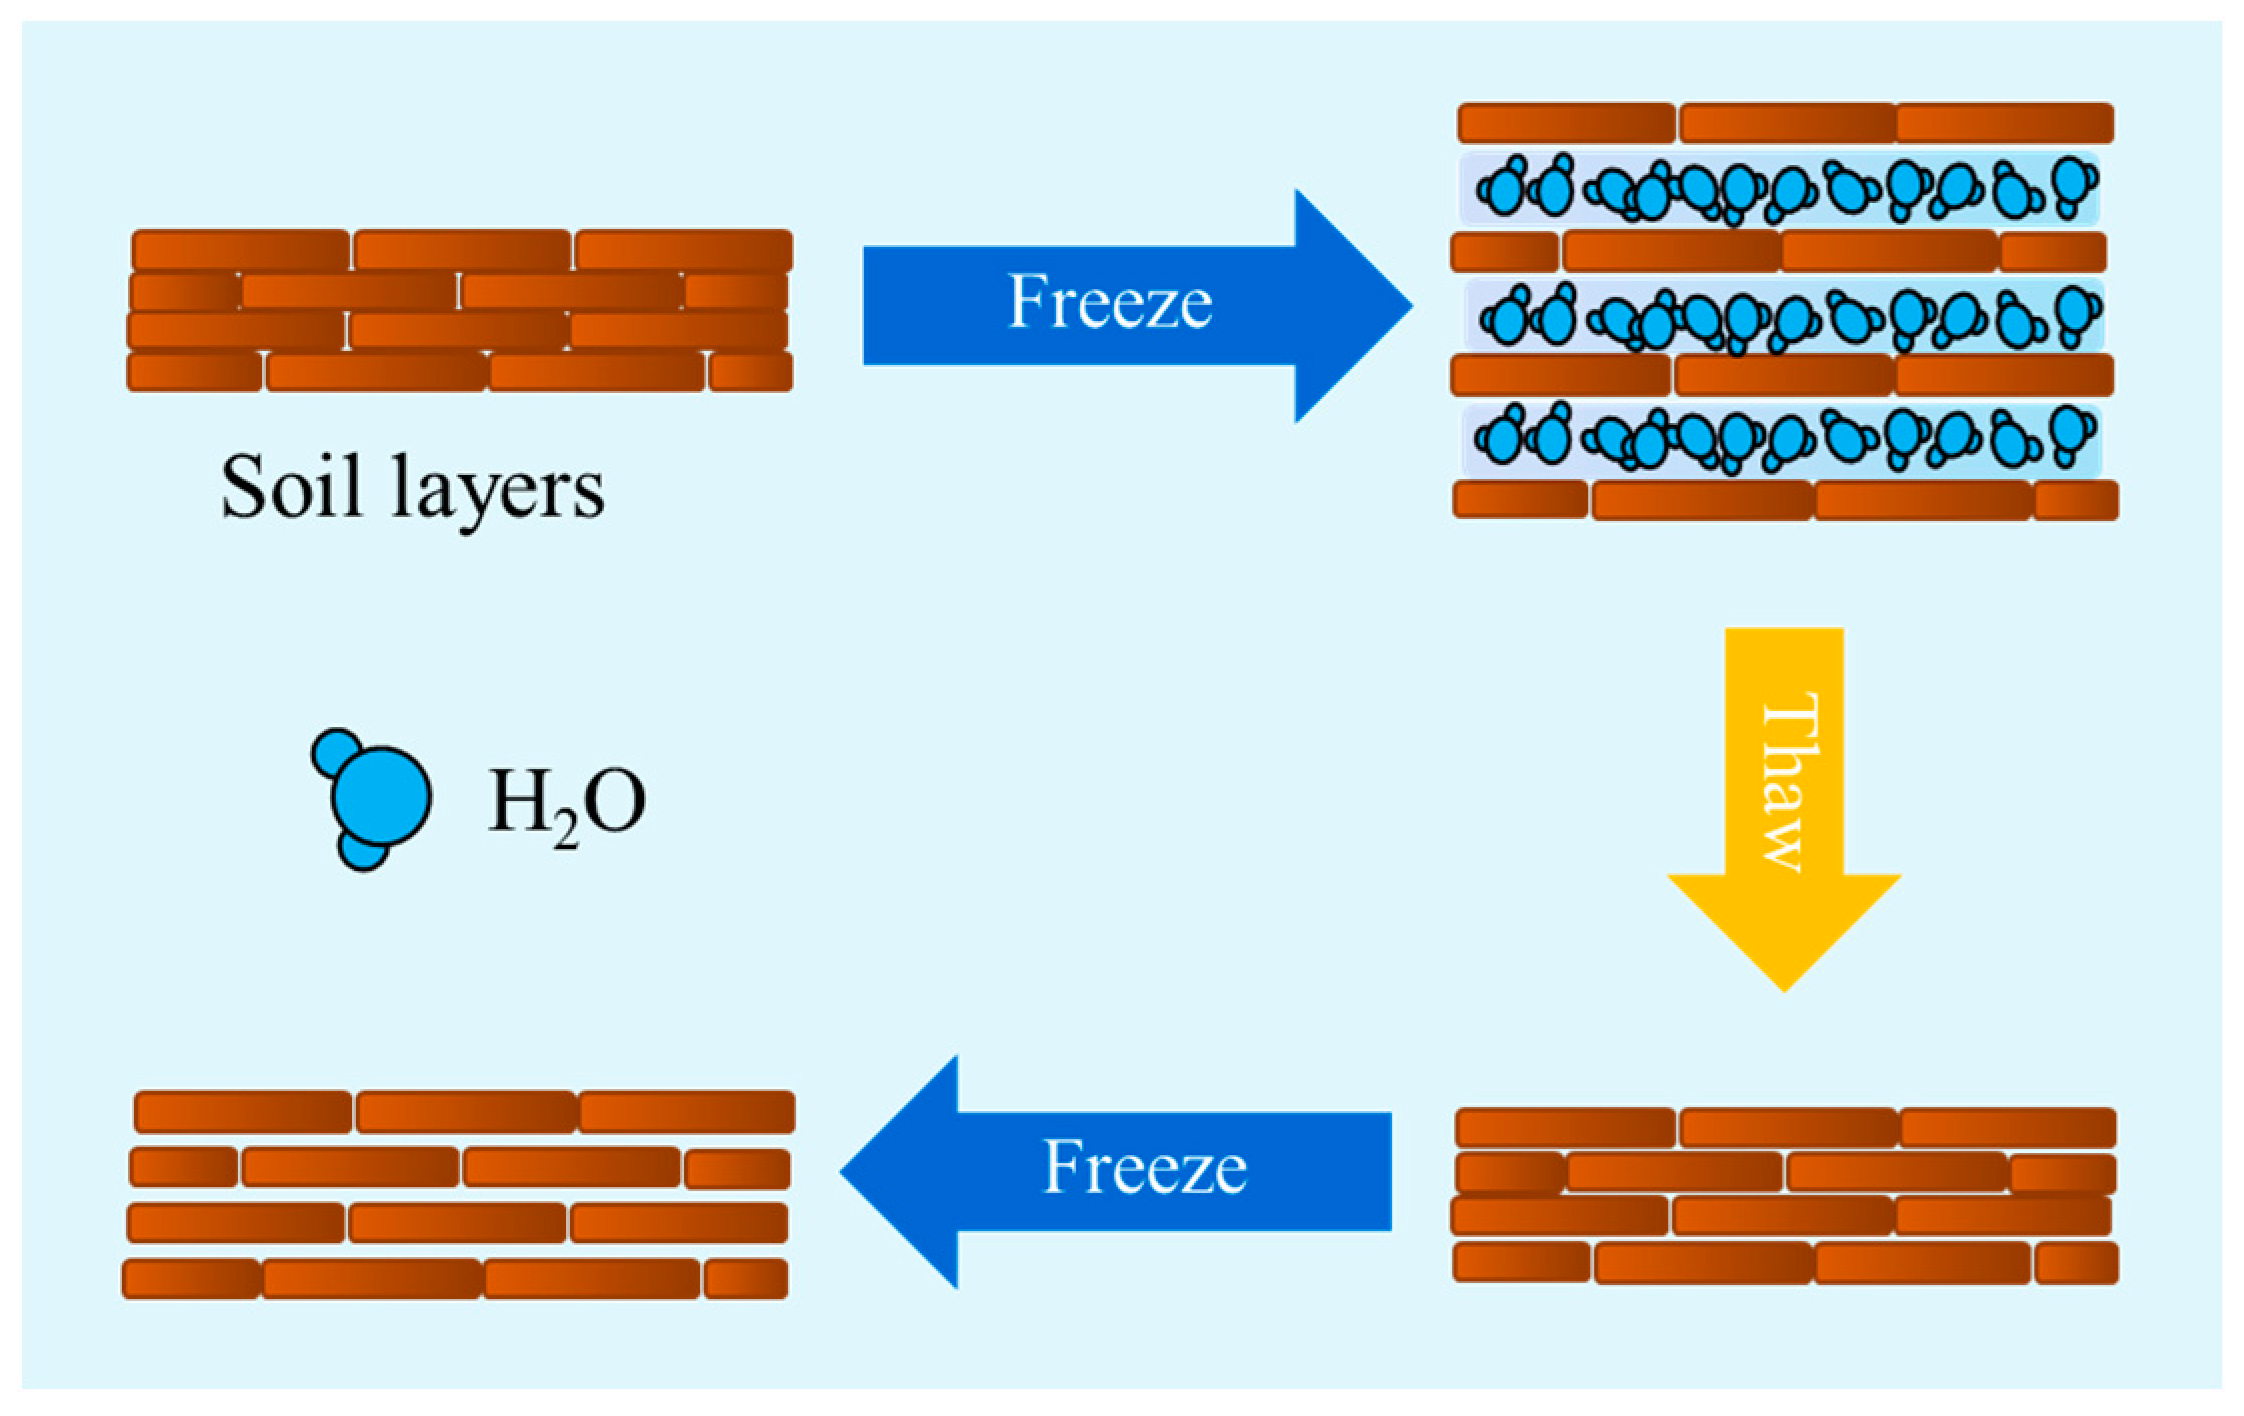
- After the FTCs, the original structure of the soil particles was disrupted, leading to the formation of a new structure. Repeated FTCs caused the expansive soil particles to break and agglomerate, resulting in a more uniform particle size. Following three to five FTCs, the soil microstructure stabilized.
Author Contributions
Funding
Institutional Review Board Statement
Informed Consent Statement
Data Availability Statement
Conflicts of Interest
Glossary
| Symbol | Description |
| FTC | Freeze–thaw cycle |
| NFTC | Number of freeze–thaw cycles |
| XRD | X-ray diffraction |
| SEM | Scanning electron microscopy |
| TG | Thermogravimetric |
| DTG | Derivative thermogravimetric |
| PCAS | Particles (pores) and crack analysis system |
| The average form factor | |
| D | The area–circumference fractal dimension |
| b | The area probability distribution index |
| Dd | The fractal dimension of the particle distribution |
| Hm | The probabilistic entropy |
| ΔM | Variations in the property parameters during the FTCs |
| Bn | Parameter values of the material properties after FTCs |
| A | Parameter values of the material properties without FTC |
| n | NFTC in the calculation formula |
| K | The coefficient of variation |
References
- Chen, F.H. Foundations on Expansive Soils; Elsevier: Amsterdam, The Netherlands, 2012. [Google Scholar]
- Nayak, N.V.; Christensen, R.W. Swelling characteristics of compacted expansive soils. Clays Clay Miner. 1971, 19, 251–261. [Google Scholar] [CrossRef]
- Luo, P.; Ma, M. Failure Mechanisms and Protection Measures for Expansive Soil Slopes: A Review. Sustainability 2024, 16, 5127. [Google Scholar] [CrossRef]
- Cong, S.Y.; Nie, Z.; Li, X.Y.; Tang, L.; Ling, X.Z.; Hu, Q.L.; Li, G.Y. Prediction of compressive creep behaviors of expansive soil exposed to freeze-thaw cycle using a disturbed state concept-based model. Cold Reg. Sci. Technol. 2022, 204, 103664. [Google Scholar] [CrossRef]
- Ito, M.; Azam, S. Relation between flow through and volumetric changes in natural expansive soils. Eng. Geol. 2020, 279, 105885. [Google Scholar] [CrossRef]
- Khemissa, M.; Mekki, L.; Mahamedi, A. Laboratory investigation on the behaviour of an overconsolidated expansive clay in intact and compacted states. Transp. Geotech. 2018, 14, 157–168. [Google Scholar] [CrossRef]
- Kyokawa, H. A double structure model for hydro-mechano-chemical behavior of expansive soils based on the surface phenomena of mineral crystals. Eng. Geol. 2021, 294, 106366. [Google Scholar] [CrossRef]
- Zhang, X.; Huang, T.; Wu, Y. Soil drainage clogging mechanism under vacuum preloading: A review. Transp. Geotech. 2024, 45, 101178. [Google Scholar] [CrossRef]
- Yan, J.B.; Kong, L.W.; Wang, J.T. Evolution law of small strain shear modulus of expansive soil: From a damage perspective. Eng. Geol. 2023, 315, 107017. [Google Scholar] [CrossRef]
- Zhang, F.; Cui, Y.J. Microstructure-based insight into different swelling pressure determination methods. Eng. Geol. 2022, 307, 106777. [Google Scholar] [CrossRef]
- Zou, W.L.; Ding, L.Q.; Han, Z.; Wang, X.Q. Effects of freeze-thaw cycles on the moisture sensitivity of a compacted clay. Eng. Geol. 2020, 278, 105832. [Google Scholar] [CrossRef]
- Tang, L.; Cong, S.; Ling, X.; Xing, W.; Nie, Z. A unified formulation of stress-strain relations considering micro-damage for expansive soils exposed to freeze-thaw cycles. Cold Reg. Sci. Technol. 2018, 153, 164–171. [Google Scholar] [CrossRef]
- Zhang, X.; Ye, P.; Wu, Y.; Zhai, E. Experimental study on simultaneous heat-water-salt migration of bare soil subjected to evaporation. J. Hydrol. 2022, 609, 127710. [Google Scholar] [CrossRef]
- Tang, L.; Cong, S.; Geng, L.; Ling, X.; Gan, F. The effect of freeze-thaw cycling on the mechanical properties of expansive soils. Cold Reg. Sci. Technol. 2018, 145, 197–207. [Google Scholar] [CrossRef]
- Al-Rawas, A.A.; McGown, A. Microstructure of Omani expansive soils. Can. Geotech. J. 1999, 36, 272–290. [Google Scholar] [CrossRef]
- Katti, D.R.; Shanmugasundaram, V. Influence of swelling on the microstructure of expansive clays. Can. Geotech. J. 2001, 38, 175–182. [Google Scholar] [CrossRef]
- Basma, A.A.; Al-Homoud, A.S.; Husein, A. Laboratory assessment of swelling pressure of expansive soils. Appl. Clay Sci. 1995, 9, 355–368. [Google Scholar] [CrossRef]
- Zhang, X.; Du, D.; Man, T.; Ge, Z.; Huppert, H. Particle clogging mechanisms in hyporheic exchange with coupled lattice Boltzmann discrete element simulations. Phys. Fluids 2024, 36, 013312. [Google Scholar] [CrossRef]
- Sharma, R.S. Mechanical Behaviour of Unsaturated Highly Expansive Clays; University of Oxford: Oxford, UK, 1998. [Google Scholar]
- Lu, Y.; Liu, S. Cracking in an expansive soil under freeze-thaw cycles. Sci. Cold Arid Reg. 2017, 9, 392–397. [Google Scholar]
- Li, T.; Kong, L.; Liu, B. The California Bearing Ratio and Pore Structure Characteristics of Weakly Expansive Soil in Frozen Areas. Appl. Sci. 2020, 10, 7576. [Google Scholar] [CrossRef]
- Zhang, X.; Huang, T.; Ge, Z.; Man, T.; Huppert, H.E. Infiltration characteristics of slurries in porous media based on the coupled Lattice-Boltzmann discrete element method. Comput. Geotech. 2025, 177, 106865. [Google Scholar] [CrossRef]
- Olgun, M. The effects and optimization of additives for expansive clays under freeze-thaw conditions. Cold Reg. Sci. Technol. 2013, 93, 36–46. [Google Scholar] [CrossRef]
- Yu, H.; Hao, F.; Yi, P.; Zhang, Q.; Ma, T. Experimental Investigation on the Effect of Salt Solution on the Soil Freezing Characteristic Curve for Expansive Soils. Sustainability 2024, 16, 363. [Google Scholar] [CrossRef]
- Sun, X.; Song, S.; Niu, C.; Zhang, X.; Dou, C.; Xia, W.; Li, X.; Wang, Q. Investigation of the Structural Strength of Expansive Soil in a Seasonally Frozen Region. Buildings 2024, 14, 789. [Google Scholar] [CrossRef]
- Yang, Z.; Lv, J.; Shi, W.; Jia, C.; Wang, C.; Hong, Y.; Ling, X. Experimental study of the freeze thaw characteristics of expansive soil slope models with different initial moisture contents. Sci. Rep. 2021, 11, 23177. [Google Scholar] [CrossRef] [PubMed]
- Han, L.; Ji, W.; Ma, L.; Guo, R.; Zhang, Y.; Zhang, H. Microscopic Mechanisms and Evolution Models of Crack Development in an Expansive Soil under Conditions of Rainfall Evaporation Cycles. Sustainability 2024, 16, 7617. [Google Scholar] [CrossRef]
- Zhao, G.T.; Han, Z.; Zou, W.L.; Wang, X.Q. Evolution of mechanical behaviours of an expansive soil during drying-wetting, freeze-thaw, and drying-wetting-freeze-thaw cycles. Bull. Eng. Geol. Environ. 2021, 80, 8109–8121. [Google Scholar] [CrossRef]
- Ding, L.Q.; Vanapalli, S.K.; Zou, W.L.; Han, Z.; Wang, X.Q. Freeze-thaw and wetting-drying effects on the hydromechanical behavior of a stabilized expansive soil. Constr. Build. Mater. 2021, 275, 122162. [Google Scholar] [CrossRef]
- Liu, C.; Shi, B.; Zhou, J.; Tang, C. Quantification and characterization of microporosity by image processing, geometric measurement and statistical methods: Application on SEM images of clay materials. Appl. Clay Sci. 2011, 54, 97–106. [Google Scholar] [CrossRef]
- Ye, W.; Li, C. The consequences of changes in the structure of loess as a result of cyclic freezing and thawing. Bull. Eng. Geol. Environ. 2019, 78, 2125–2138. [Google Scholar] [CrossRef]
- Liu, C.; Tang, C.; Shi, B.; Suo, W. Automatic quantification of crack patterns by image processing. Comput. Geosci. 2013, 57, 77–80. [Google Scholar] [CrossRef]
- Liu, X.Y.; Zhang, X.W.; Kong, L.W.; Wang, G.; Li, C.S. Multiscale structural characterizations of anisotropic natural granite residual soil. Can. Geotech. J. 2023, 60, 1383–1400. [Google Scholar] [CrossRef]
- Zhang, Z.; Ma, W.; Qi, J.L. Structure evolution and mechanism of engineering properties change of soils under effect of freeze-thaw cycle. J. Jilin Univ. Earth Sci. Ed. 2013, 43, 1904–1914. (In Chinese) [Google Scholar]
- Zhan, J.W.; Wang, Q.; Zhang, W.; Shangguan, Y.L.; Song, S.Y.; Chen, J.P. Soil-engineering properties and failure mechanisms of shallow landslides in soft-rock materials. Catena 2019, 181, 104093. [Google Scholar] [CrossRef]
- Akagawa, S.; Nishisato, K. Tensile strength of frozen soil in the temperature range of the frozen fringe. Cold Reg. Sci. Technol. 2009, 57, 13–22. [Google Scholar] [CrossRef]
- Lai, Y.M.; Wu, D.Y.; Zhang, M.Y. Crystallization deformation of a saline soil during freezing and thawing processes. Appl. Therm. Eng. 2017, 120, 463–473. [Google Scholar] [CrossRef]
- Wei, Y.; Tang, C.S.; Zhu, C.; Cheng, Q.; Lu, Y.; Li, L.; Tian, B.G.; Shi, B. Influence of desiccation during freeze-thaw cycles on volumetric shrinkage and tensile strength of compacted clayey soils. Eng. Geol. 2024, 334, 107513. [Google Scholar] [CrossRef]


| Plastic Limit (%) | Liquid Limit (%) | Plasticity Index (%) | Optimum Moisture Content (%) | Maximum Dry Density (g⁄cm3) | Free Swelling Ratio (%) |
|---|---|---|---|---|---|
| 19.10 | 37.39 | 18.29 | 19.83 | 1.69 | 50 |
| General Designation of Fraction | Fine Grain | Coarse Grain | ||
|---|---|---|---|---|
| Name of fraction | Clay | Silt | Sand | Gravel |
| Particle size range (mm) | d ≤ 0.005 mm | 0.005 mm < d ≤ 0.075 mm | 0.075 mm < d ≤ 2 mm | 2 mm < d ≤ 20 mm |
| Proportion (%) | 21.41 | 33.05 | 41.58 | 3.96 |
| Pore Type | Pore Size Range (μm) | Pore Composition | |
|---|---|---|---|
| Coarse pores | d > 75 μm | Inter-aggregate pores | |
| Fine pores | Large pores | 20 μm < d ≤ 75 μm | Inter-aggregate pores and some inner-aggregate pores |
| Medium pores | 10 μm < d ≤ 20 μm | Inner-aggregate pores | |
| Small pores | 5 μm < d ≤ 10 μm | Inner-aggregate pores and some inter-particle pores | |
| Micropores | 0.1 μm < d ≤ 5 μm | Inter-particle pores | |
| Ultramicropores | d ≤ 0.1 μm | Inner-particle pores | |
| Sample | Montmorillonite (%) | Illite (%) | Albite (%) | Potassium Feldspar (%) | Quartz (%) | Hematite (%) |
|---|---|---|---|---|---|---|
| FT-0 | 51.9 | 2.8 | 26.4 | 3.8 | 14.9 | 0.2 |
| FT-11 | 51 | 4 | 26 | 2 | 16 | 1 |
| Maximum | Minimum | Range | Mean | Mid-Value | |
|---|---|---|---|---|---|
| Elongation | 0.95 | 0.13 | 0.79 | 0.51 | 0.57 |
| Proximal sphericity | 0.78 | 0.01 | 0.77 | 0.33 | 0.36 |
| Roundness | 0.93 | 0.16 | 0.87 | 0.53 | 0.47 |
Disclaimer/Publisher’s Note: The statements, opinions and data contained in all publications are solely those of the individual author(s) and contributor(s) and not of MDPI and/or the editor(s). MDPI and/or the editor(s) disclaim responsibility for any injury to people or property resulting from any ideas, methods, instructions or products referred to in the content. |
© 2025 by the authors. Licensee MDPI, Basel, Switzerland. This article is an open access article distributed under the terms and conditions of the Creative Commons Attribution (CC BY) license (https://creativecommons.org/licenses/by/4.0/).
Share and Cite
Li, X.; Cong, S.; Tang, L.; Ling, X. Effect of Freeze–Thaw Cycles on the Microstructure Characteristics of Unsaturated Expansive Soil. Sustainability 2025, 17, 762. https://doi.org/10.3390/su17020762
Li X, Cong S, Tang L, Ling X. Effect of Freeze–Thaw Cycles on the Microstructure Characteristics of Unsaturated Expansive Soil. Sustainability. 2025; 17(2):762. https://doi.org/10.3390/su17020762
Chicago/Turabian StyleLi, Xinyu, Shengyi Cong, Liang Tang, and Xianzhang Ling. 2025. "Effect of Freeze–Thaw Cycles on the Microstructure Characteristics of Unsaturated Expansive Soil" Sustainability 17, no. 2: 762. https://doi.org/10.3390/su17020762
APA StyleLi, X., Cong, S., Tang, L., & Ling, X. (2025). Effect of Freeze–Thaw Cycles on the Microstructure Characteristics of Unsaturated Expansive Soil. Sustainability, 17(2), 762. https://doi.org/10.3390/su17020762