

Establishment and Application of Biomass Model for Vegetation Condition Assessment After Ecological Restoration—Yixing Quarry Case Study

Abstract
1. Introduction
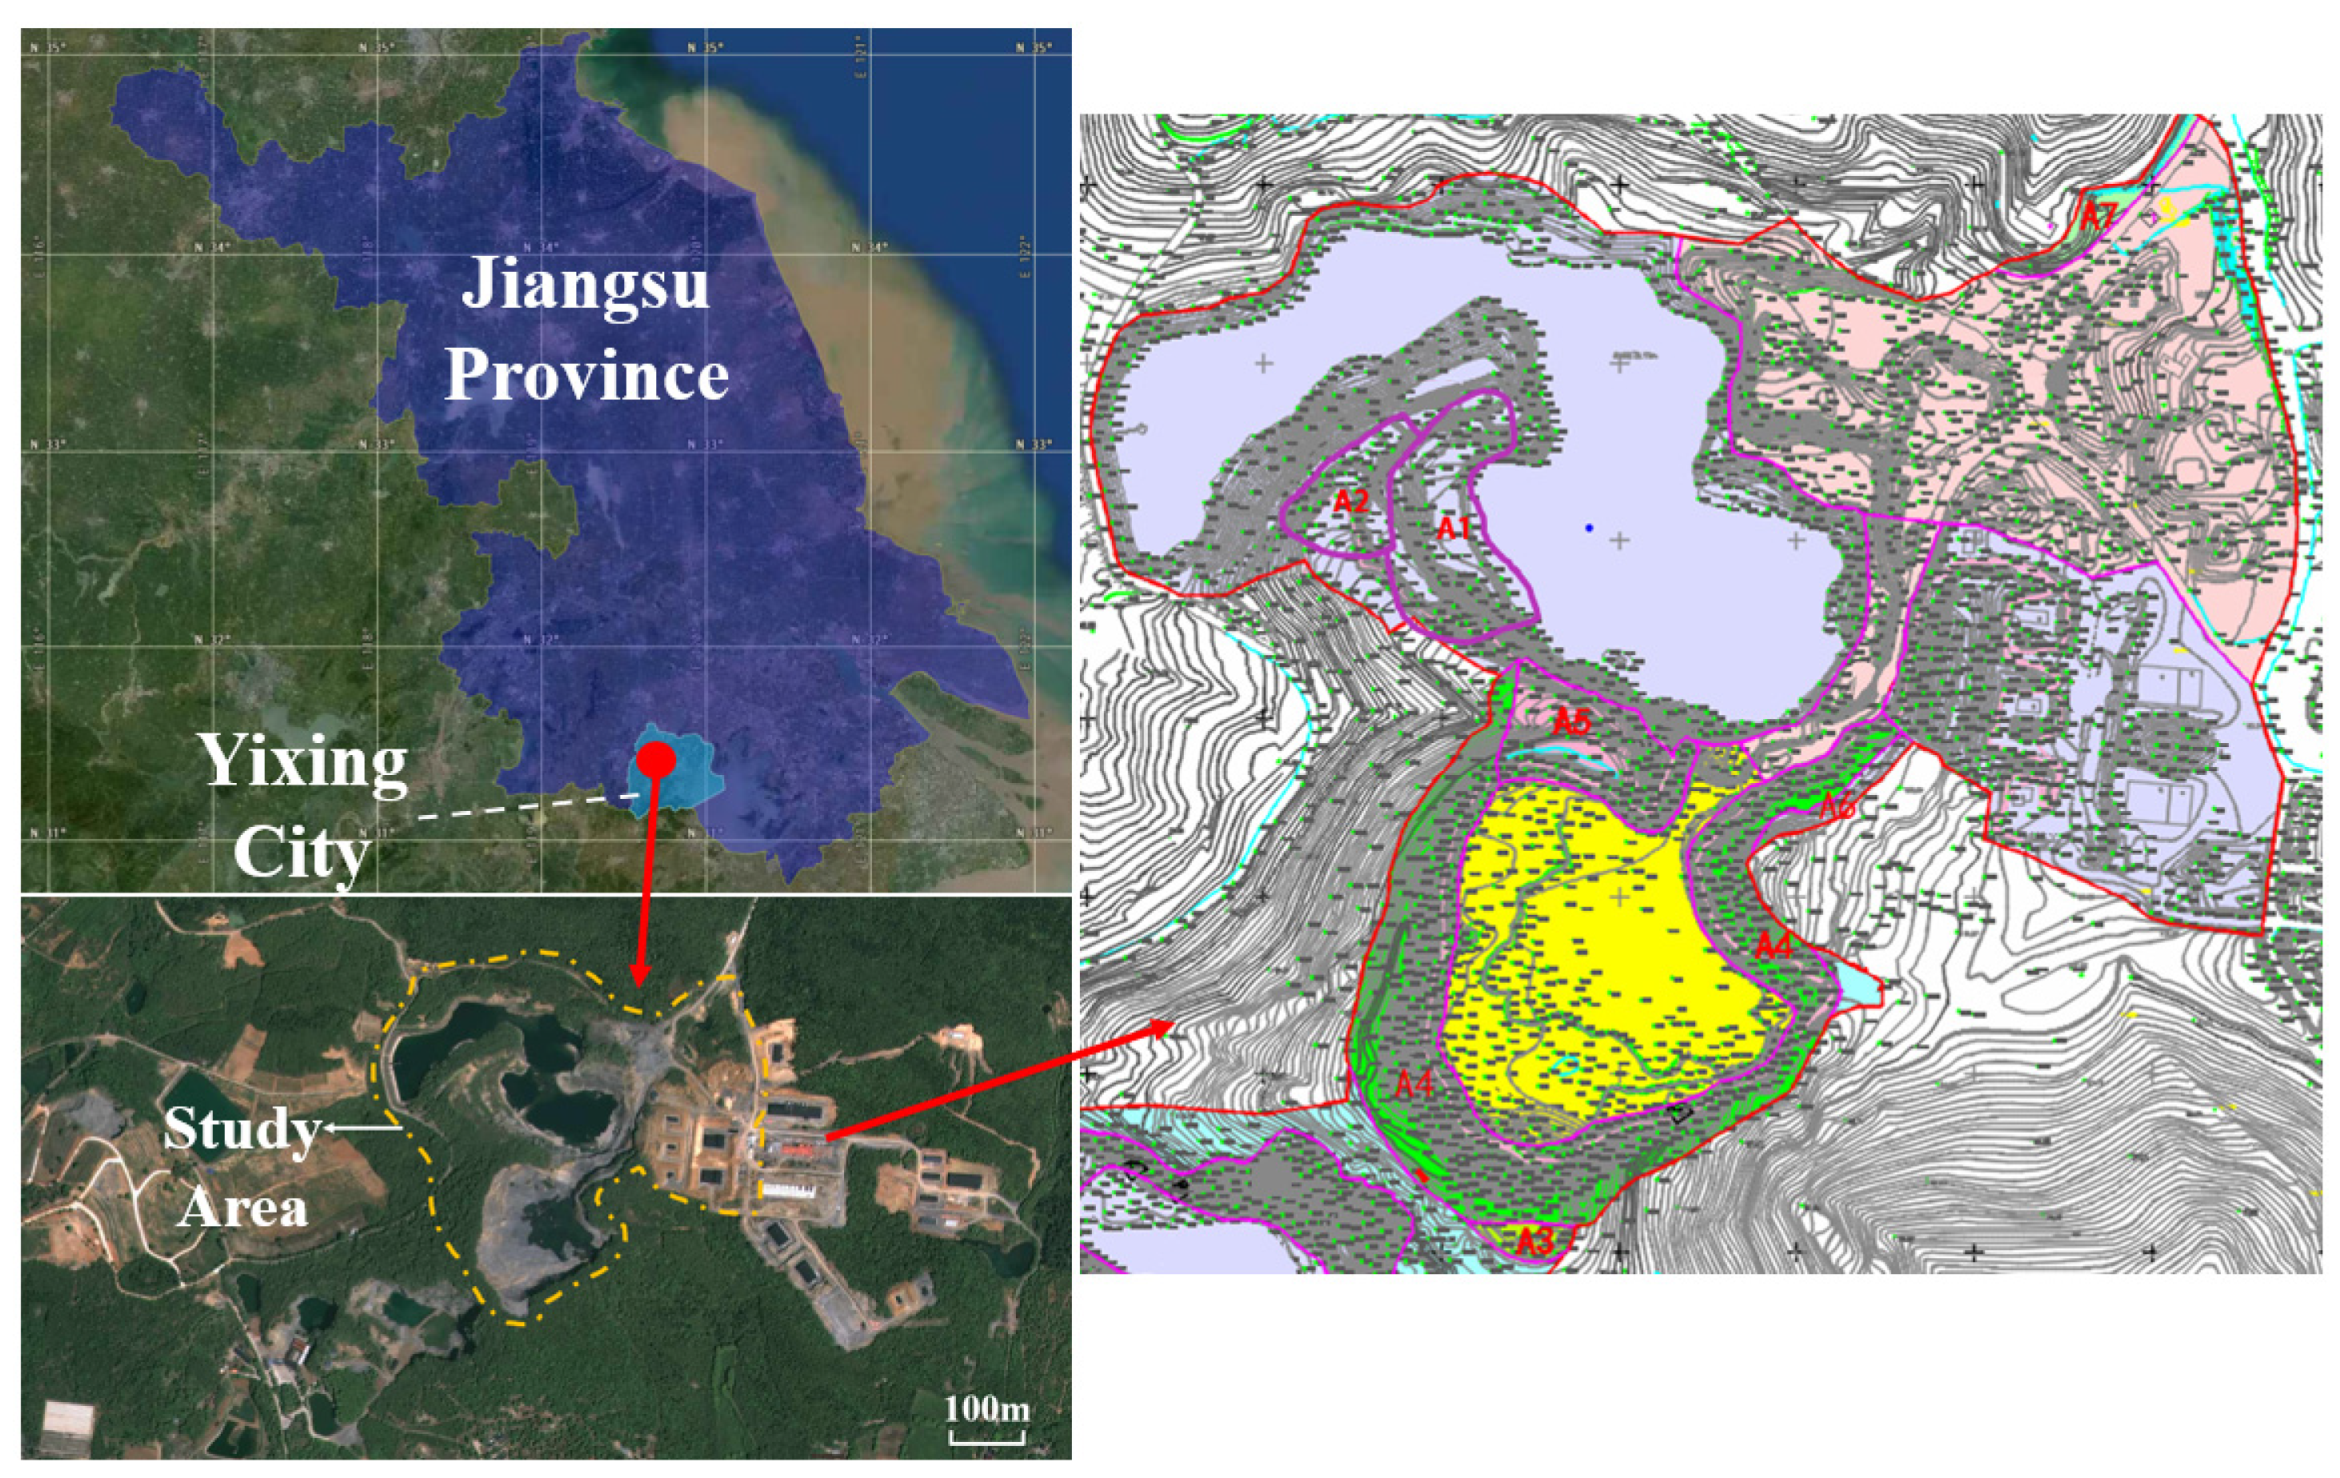
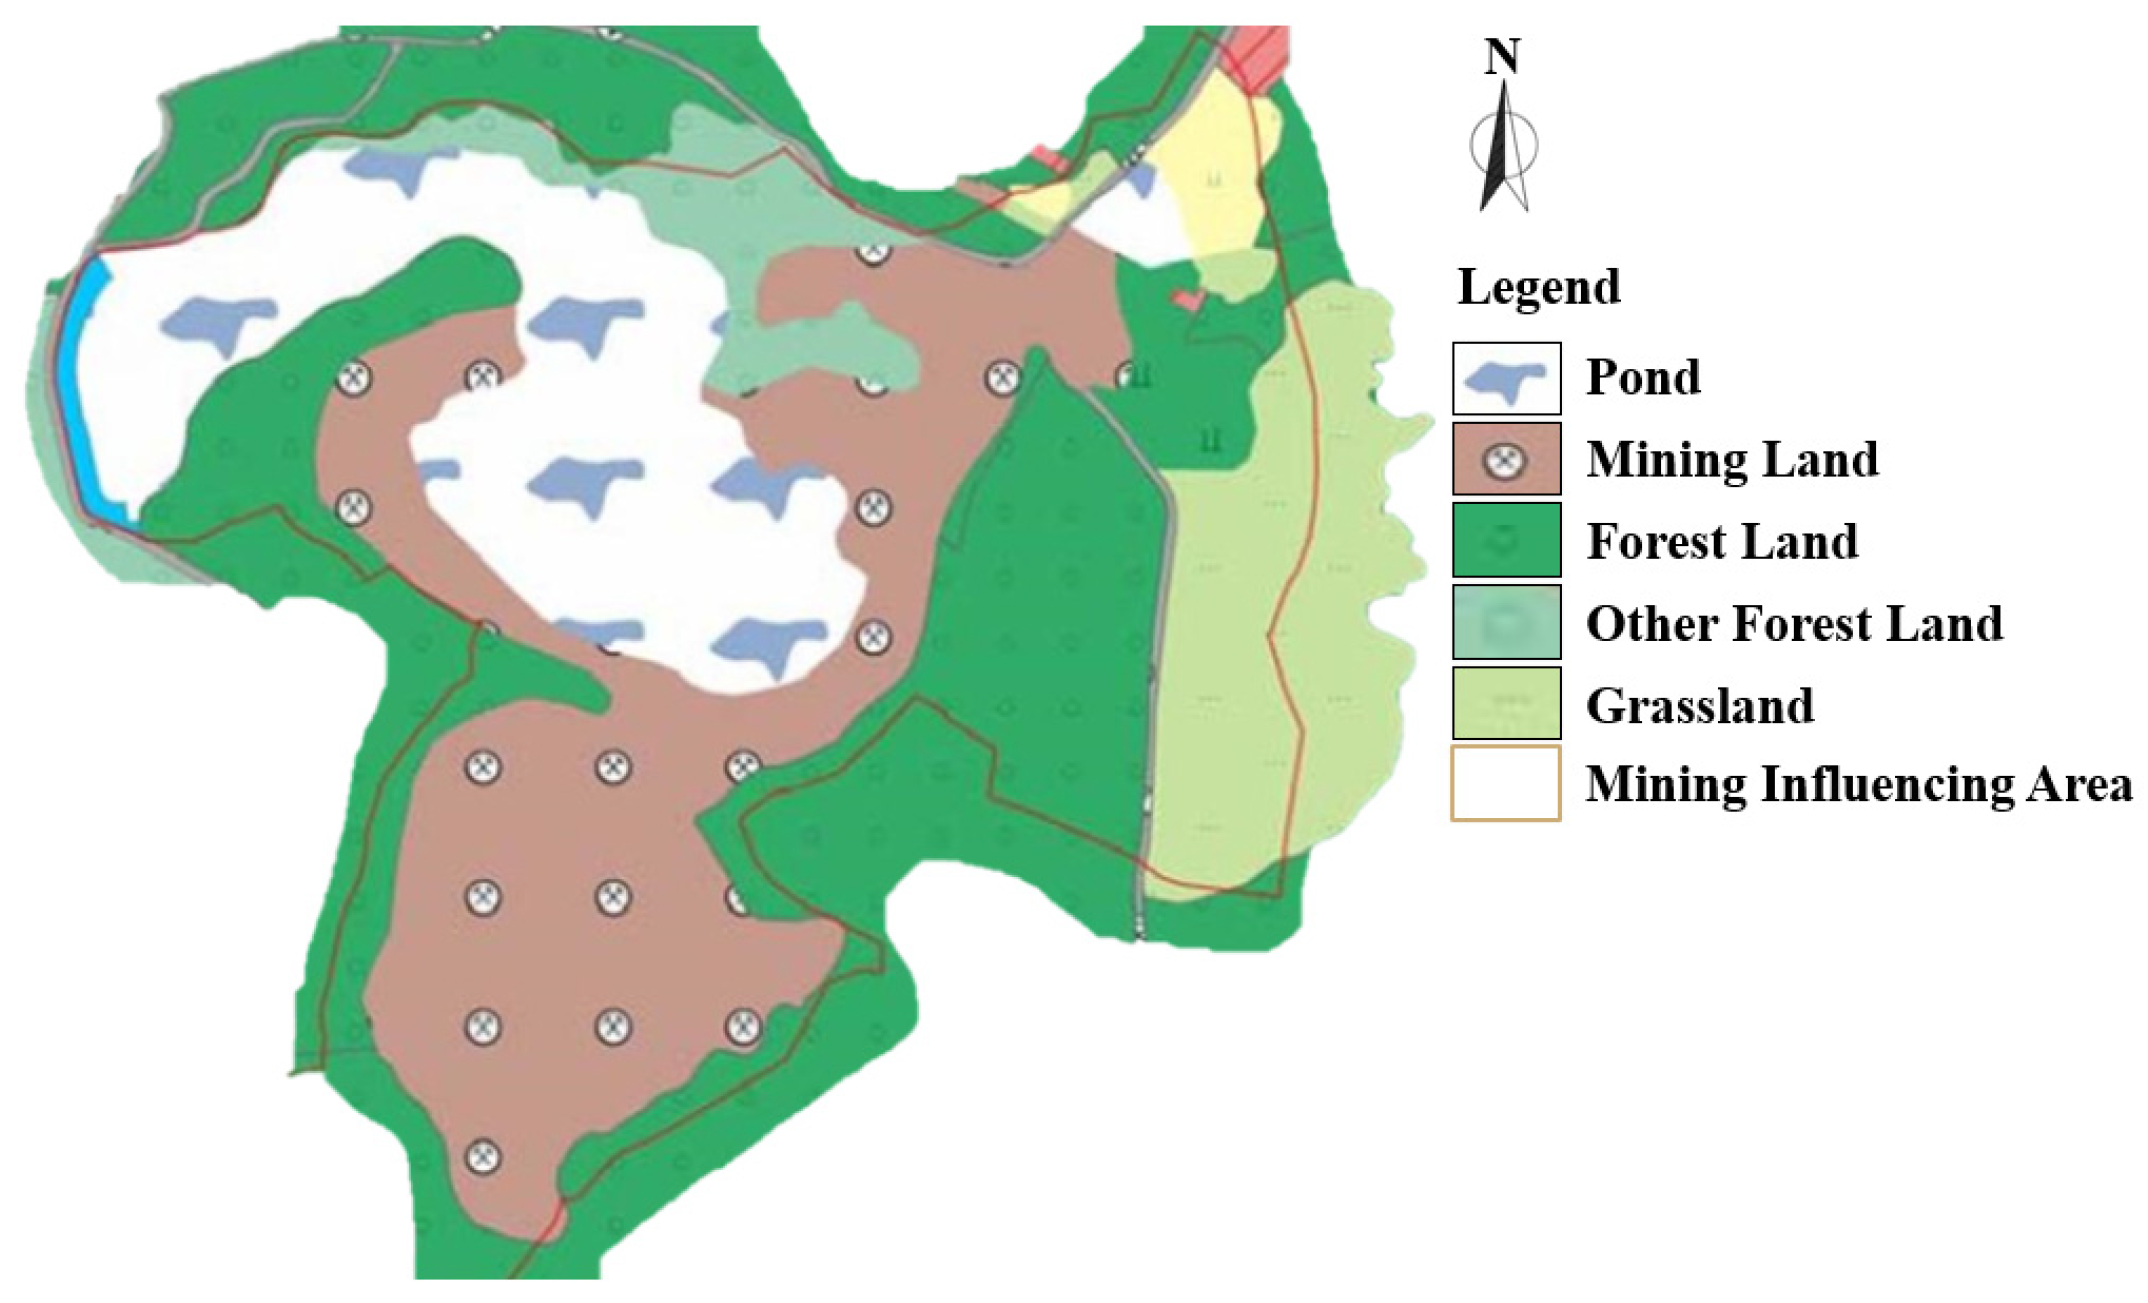
2. Study Area
2.1. General Introduction of Study Area
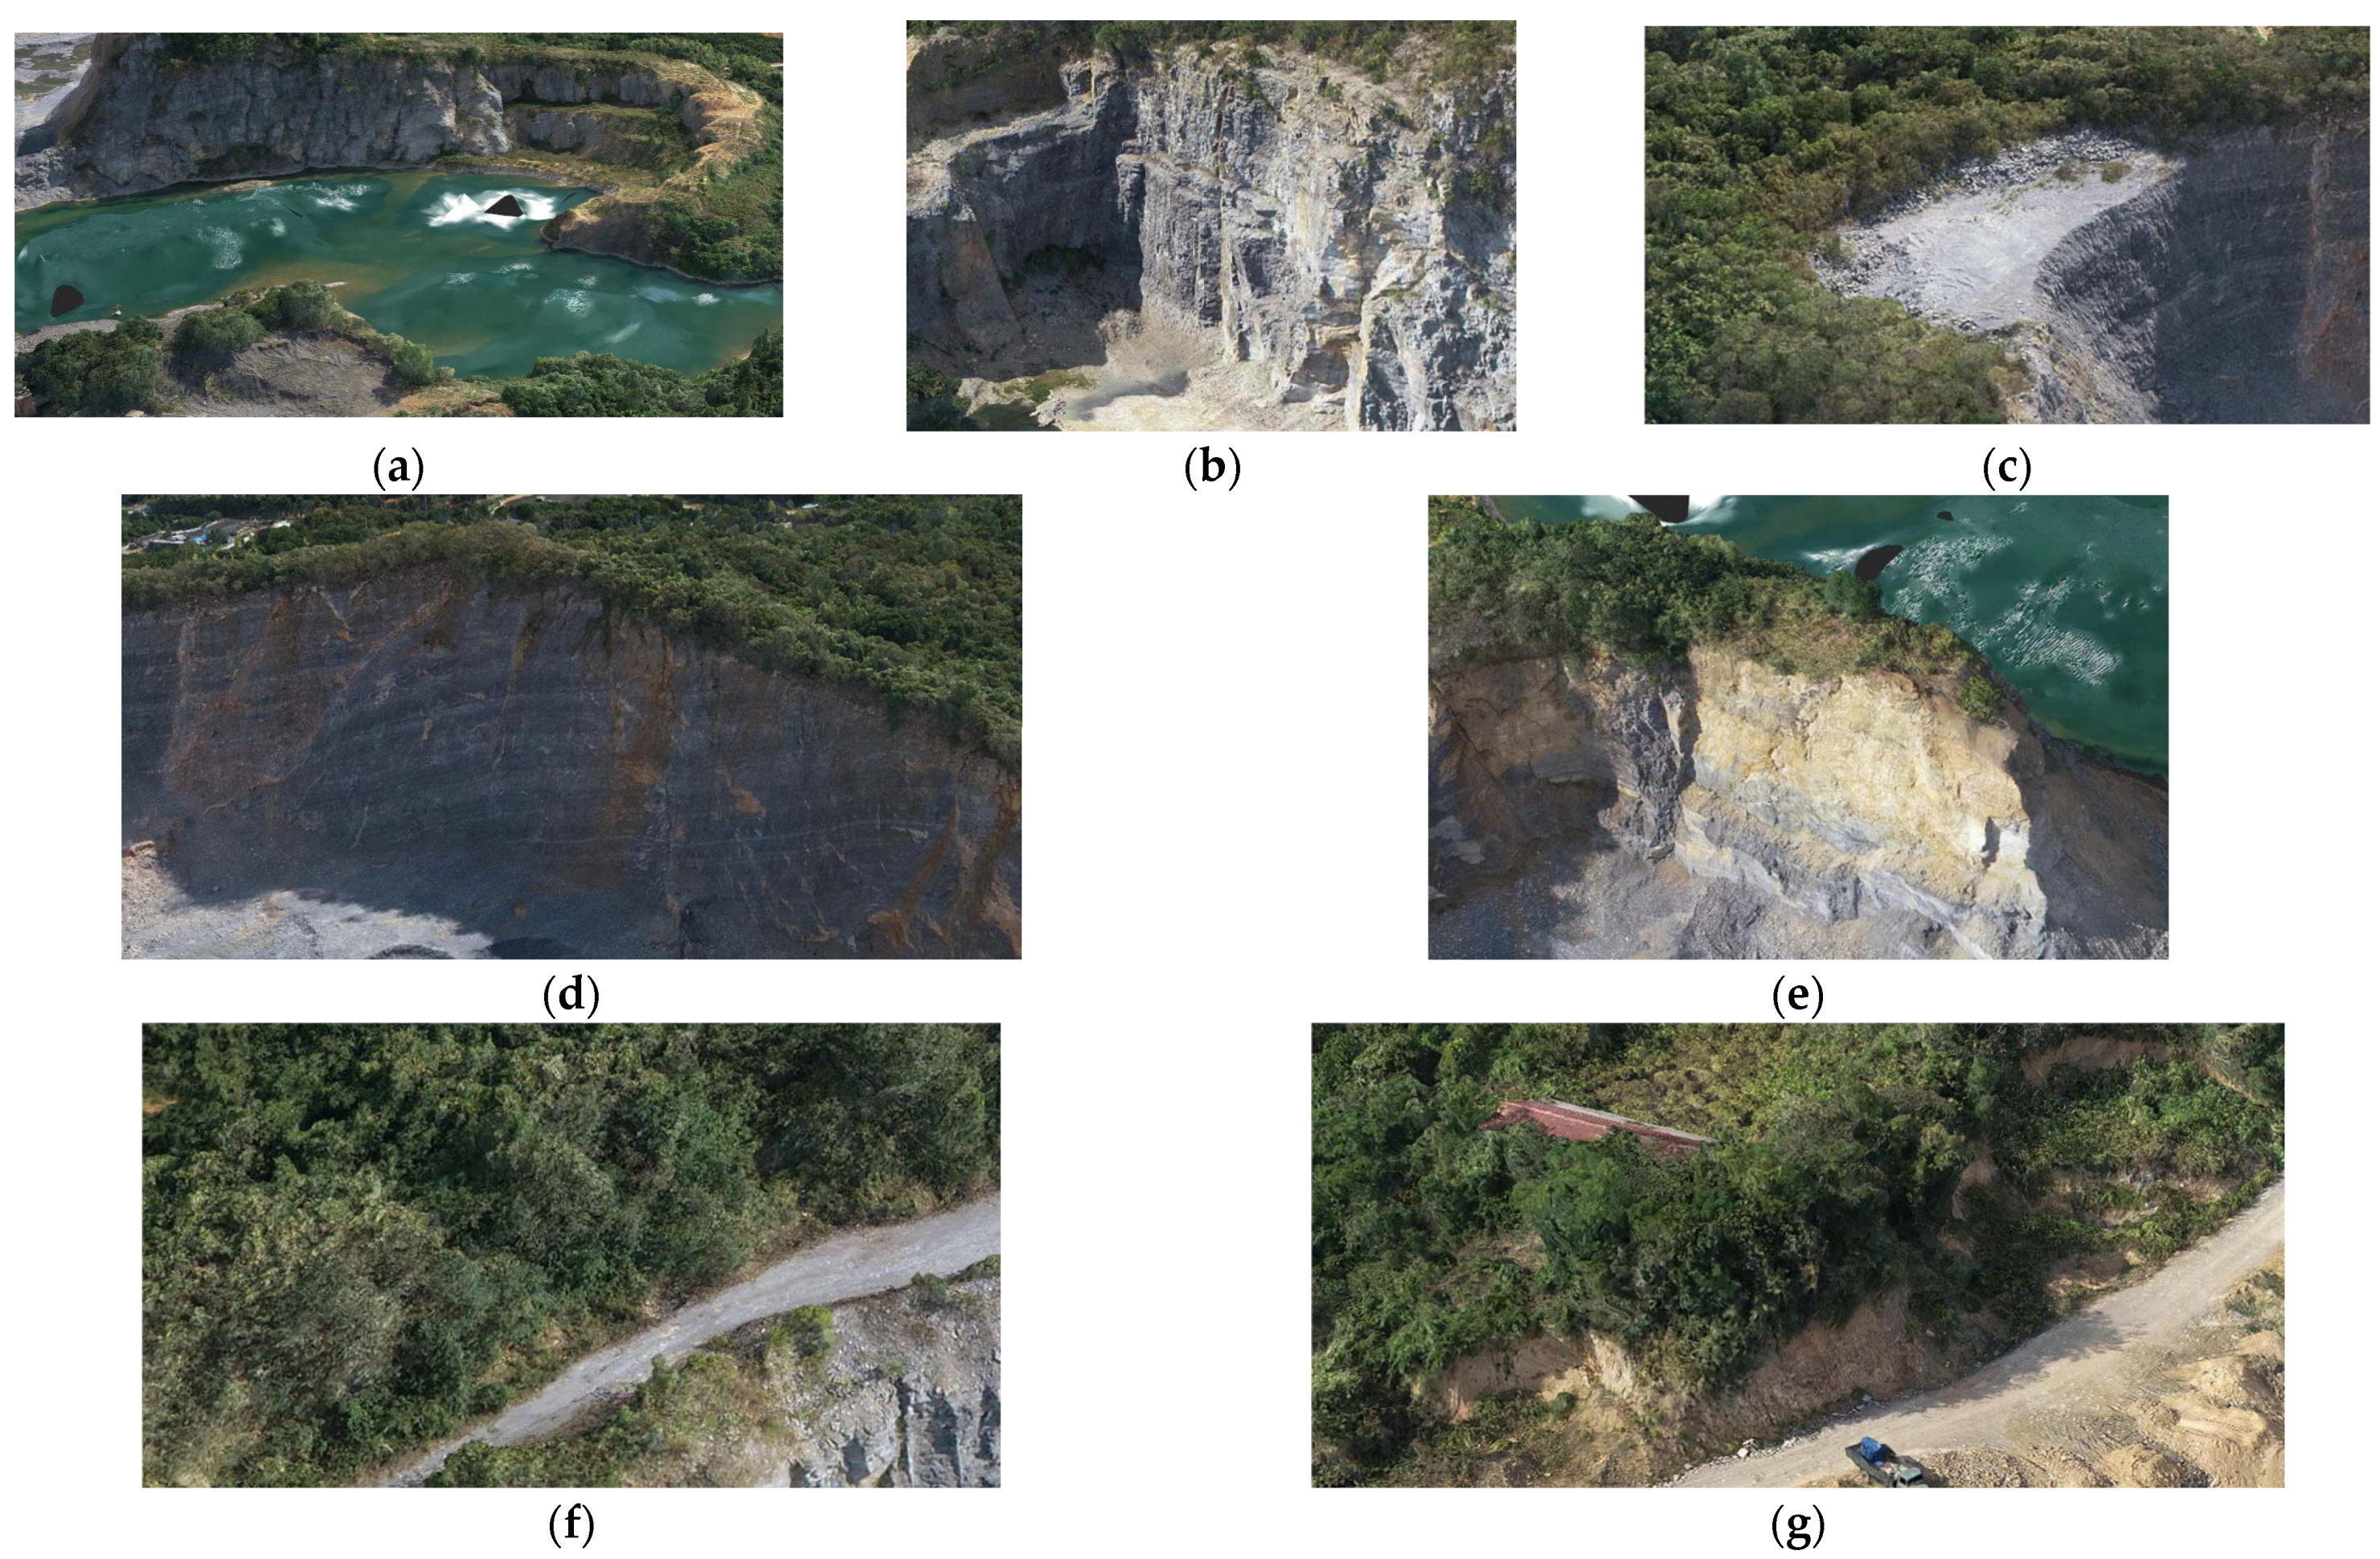
2.2. Ecological Assessment of Abundant Quarry
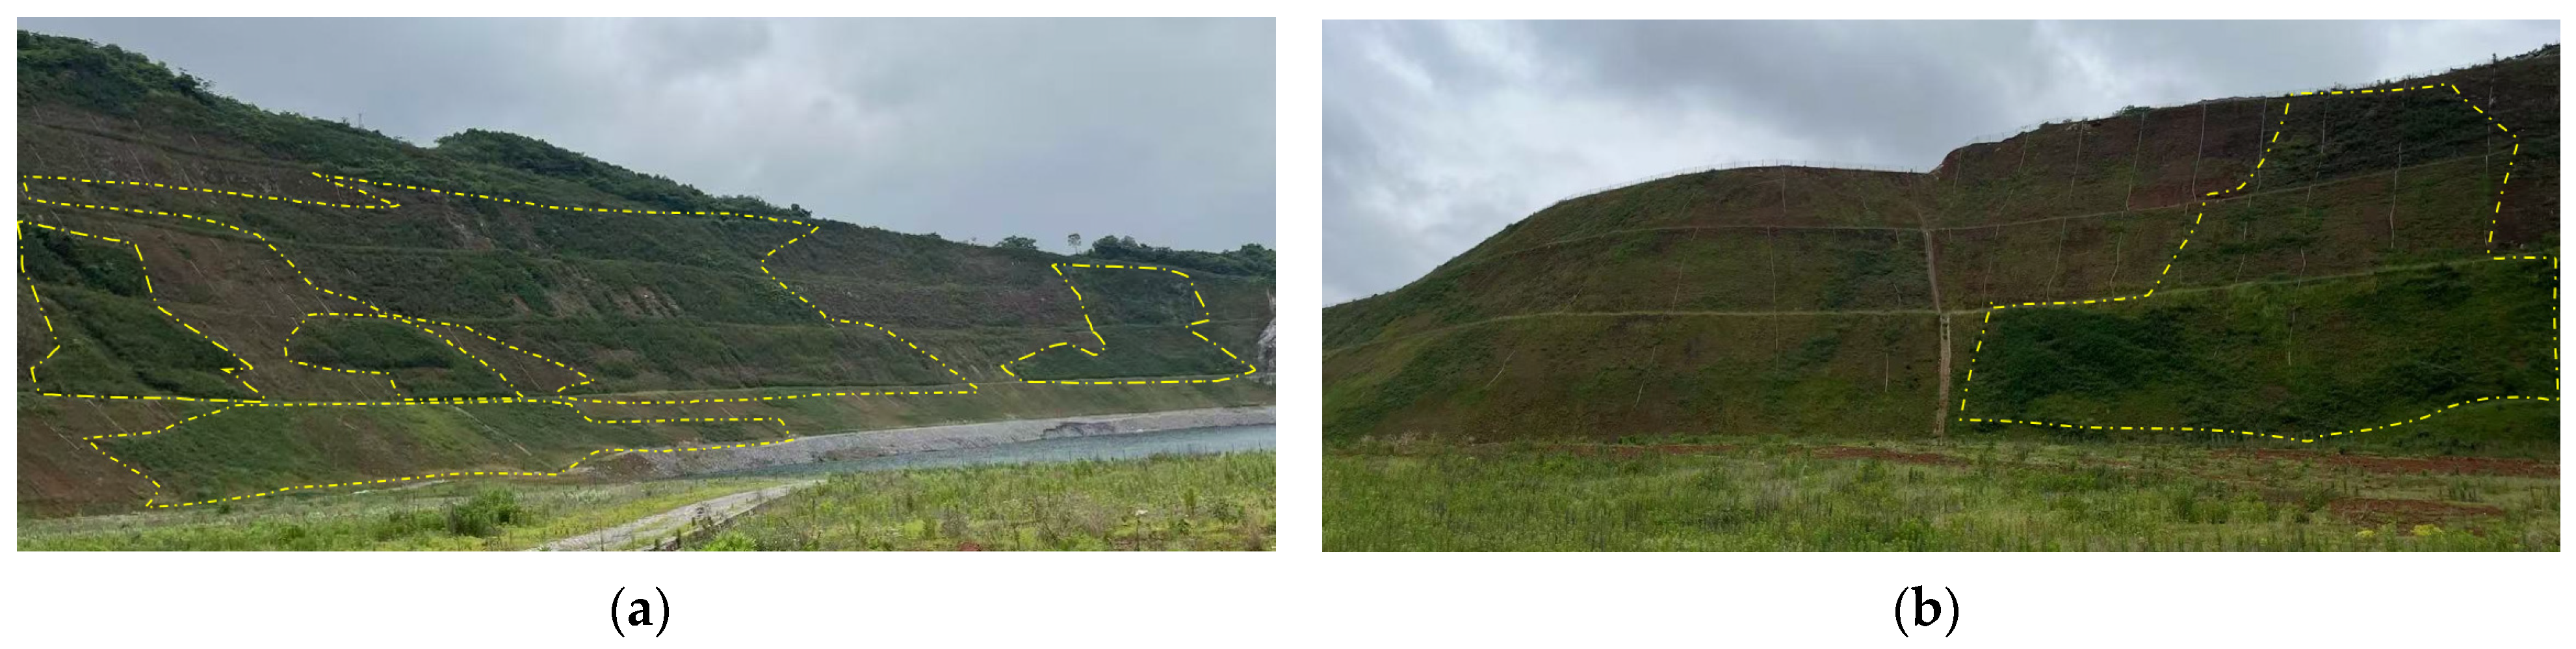
2.3. Ecological Restoration Measures
- (1)
- Slope reinforcement
- (2)
- Vegetation-soil system rebuilding
3. Methodology
3.1. Assessment of Vegetation Community Condition After Remediation
3.1.1. Field Investigation
3.1.2. Laboratory Testing
3.2. Establishment of the Vegetation Biomass Calculation Model
3.2.1. Data Analysis
3.2.2. Model Establishment and Verification
3.3. Establishment of the Vegetation Carbon Storage Prediction Model
4. Results
4.1. Correlation Analysis Between the Biomass and Variables
4.2. Establishment, Optimal Selection, and Accuracy Verification of Biomass Models
4.3. Vegetation Carbon Storage Calculation
5. Discussion
5.1. Analysis of Vegetation Rebuilding Effect on the Mining Slopes
5.1.1. Analysis of the Biomass with the Rebuilt Vegetation Effect
5.1.2. Analysis of the Carbon Storage with the Rebuilt Vegetation Effect
5.2. Limitations of This Study and Future Work
6. Conclusions
Author Contributions
Funding
Data Availability Statement
Conflicts of Interest
References
- Mounsey, C.M.; Stevens, J.C.; Renton, M.; Dixon, K.W.; Miller, B.P. The influence of environmental drivers and restoration intervention methods on postmine restoration trajectories. Restor. Ecol. 2022, 30, 13503. [Google Scholar] [CrossRef]
- Sun, Y.; Yao, X.X.; Li, C.H.; Xie, Y.L. Physiological adaptability of three gramineae plants under various vegetation restoration models in mining area of Qinghai-Tibet Plateau. J. Plant Physiol. 2022, 276, 153760. [Google Scholar] [CrossRef] [PubMed]
- Xia, D.; Li, F.P.; Yuan, X.T.; Xi, H.C. Research Situation of Ecological Rehabilitation Technology in Rock Open-pit Mine and Its Developing Trend. Met. Mine 2018, 499, 1–10. [Google Scholar] [CrossRef]
- Lu, S.D.; Zhang, D.; Tu, M.Y.; Zhou, H.W.; Pan, R.H.; Ke, B. Optimization of Slope Ecological Restoration Scheme of Open-pit Mine Based on Digital Identification Technology of Rock Mass Structure. Met. Mine 2021, 545, 181–187. [Google Scholar] [CrossRef]
- Shao, Y.; Xu, Q.X.; Wei, X. Progress of Mine Land Reclamation and Ecological Restoration Research Based on Bibliometric Analysis. Sustainability 2023, 15, 10458. [Google Scholar] [CrossRef]
- Zhang, J.D.; Xi, F.R. Study on ecological restoration of abandoned mines in China. Acta Ecol. Sinaca 2020, 40, 7921–7930. [Google Scholar] [CrossRef]
- Jiang, W.C.; Ran, J.H.; Wang, M.Y.; Fan, C.M.; Jin, G.F.; Geng, Q.B.; Zeng, R.J.; Kong, W.B. Research on Vegetation Community Structure Characteristics in Abandoned Mines for Ecological Restoration. Adm. Tech. Environ. Monit. 2020, 36, 69–73. [Google Scholar] [CrossRef]
- Riviera, F.; Renton, M.; Dobrowolski, M.P.; Veneklaas, E.J.; Mucina, L. Patterns and drivers of structure, diversity, and composition in species-rich shrublands restored after mining. Restor. Ecol. 2021, 29, e13360. [Google Scholar] [CrossRef]
- Wu, Y.; Xia, D.; Liang, B.; Jia, Y.F.; Yang, Y.D. Ecological reconstruction technology of rock slope in open pit based on rock mass quality evaluation and division. J. China Coal Soc. 2019, 44, 2133–2142. [Google Scholar] [CrossRef]
- Lu, Z.; Gao, Q.; Yun, J.J.; Hu, H.Y.; Li, Y.L. Present situation of environmental geological problems and ecological restoration scheme of abandoned mines in arid area: Take Baotou City as an example. China Min. Mag. 2024, 33, 111–115. [Google Scholar] [CrossRef]
- Hao, J.; Li, H.T.; An, C.L.; Zhao, Z.W.; Han, L.; Wang, H.W. Difficulty Evaluation Method and Application Study of Geological Environment Restoration in Open-pit Limestone Mines. China Min. Mag. 2024, 44, 175–184. [Google Scholar]
- Faiz, H.; Ng, S.; Rahman, M. A state-of-the-art review on the advancement of sustainable vegetation concrete in slope stability. Constr. Build. Mater. 2022, 326, 126502. [Google Scholar] [CrossRef]
- Li, R.P.; Shi, C.Q.; Yang, J.Y.; Wei, G.K.; Liu, J.Q.; Kui, G.X.; Ai, X.F.; Xiao, F.; Su, R.D. Site Type Classification and Ecological Restoration Technology Selection of Open-pit Coal Mine Dumps in Grassland Mining Area. J. Resour. Ecol. 2023, 14, 757–766. [Google Scholar] [CrossRef]
- Song, Z.Z.; Liu, J.; Wang, Z.; Bu, F.; He, Z.C. Experimental study on dry shrinkage cracking of sisal fiber-polyacrylamide modified external soil. J. Resour. Ecol. 2024, 32, 28–38. [Google Scholar] [CrossRef]
- Arun, L.; Sujatha, E.R.; Baldovino, J.A.; de la Rosa, Y. Microcrystalline Cellulose-A Green Alternative to Conventional Soil Stabilizers. Polymers 2024, 16, 2043. [Google Scholar] [CrossRef]
- Azam, F.A.A.; Omar, R.B.C.; Roslan, R.B.; Baharudin, I.N.Z.; Muchlas, N.H.M. Enhancing the soil stability using biological and plastic waste materials integrated sustainable technique. Alex. Eng. J. 2024, 91, 321–333. [Google Scholar] [CrossRef]
- Gastauer, M.; Massante, J.C.; Ramos, S.J.; da Silva, R.d.S.S.; Boanares, D.; Guedes, R.S.; Caldeira, C.F.; Medeiros-Sarmento, P.S.; de Castro, A.F.; Prado, I.G.d.O.; et al. Revegetation on Tropical Steep Slopes after Mining and Infrastructure Projects: Challenges and Solutions. Sustainability 2022, 14, 17003. [Google Scholar] [CrossRef]
- Zhang, L.; Lu, Z.H.; Tang, S.Y.; Zhang, M.; Zhang, R.T.; Huang, Y.K.; Shang, Z. Slope vegetation characteristics and community stability at different restoration years of open-pit coal mine waste dump. Acta Ecol. Sin. 2021, 41, 5764–5774. [Google Scholar] [CrossRef]
- Lu, Z.H.; Zhang, L. Ecological stability evaluation of revegetation community on open-pit coal mine dump slopes. Coal Sci. Technol. 2024, 52, 334–344. [Google Scholar] [CrossRef]
- Shang, Y.; Li, G.T.; Ma, Y.X.; Zhang, Y.X.; Jia, Q.; Jia, Z. Vegetation succession law of dump slope with different restoration years in Ordos mining area. J. Shanxi Agric. Univ. 2024, 44, 108–118. [Google Scholar] [CrossRef]
- Shen, J.; Li, M.M.; Zhou, M.T.; Wang, C.Y.; Cheng, W. Impacts of Slope Type and Ecological Factors on Vegetation Restoration at DG Hydropower Station in Xizang Autonomous Region. Bull. Soil Water Conserv. 2023, 43, 31–43. [Google Scholar] [CrossRef]
- López-Marcos, D.; Turrión, M.B.; Martínez-Ruiz, C. Linking soil variability with plant community composition along a mine-slope topographic gradient: Implications for restoration. Ambio 2020, 49, 337–349. [Google Scholar] [CrossRef] [PubMed]
- Zou, L.L.; Feng, Q.Y.; Hao, M.; Meng, Q.J.; Wang, L.Y.; Qin, D.F. Ecological restoration effect and driving factors analysis of Lingquan Open-Pit Mine. China Min. Mag. 2024, 33, 43–50. [Google Scholar] [CrossRef]
- Golos, P.J.; Merino-Martín, L.; Commander, L.E.; Elliott, C.P.; Williams, M.R.; Miller, B.P.; Dixon, K.; Stevens, J. Interactions between soil covers and rainfall affect post-mining plant restoration in a semi-arid Banded Iron Formation. Ecol. Eng. 2021, 159, 106101. [Google Scholar] [CrossRef]
- Zhou, S.L.; Li, X.K.; Zhang, P.C.; Lu, G.; Zhang, X.L.; Zhang, H.Q.; Zhang, F.M. Carbon Sequestration Capacity after Ecological Restoration of Open-Pit Mines: A Case Study in Yangtze River Basin, Jurong City, Jiangsu Province. Sustainability 2024, 16, 8149. [Google Scholar] [CrossRef]
- Zhang, X.P.; Li, Z.C.; Wang, Y.; Wu, Z.Y.; Wu, D.B.L.; Men, C. Synergistic benefit analysis of carbon sink capacity and biodiversity function of artificial ecosystems in mining reclamation sites. Coal Sci. Technol. 2024, 52, 257–266. [Google Scholar] [CrossRef]
- Du, Z.Y.; Wang, J.W.; Xin, W.L.; Xiao, J.; Xue, L.; Hou, H.; Chen, G.C. Plant Species Diversity and Community Stability in Vegetation Restoration Area of Karst Antimony Mining Sites in Guizhou, China. Res. Environ. Sci. 2023, 36, 188–197. [Google Scholar] [CrossRef]
- Hu, X.; Wang, D.; Zhang, X.; Liu, S.H.; Xie, W.D. Diversity and biomass characteristics of vegetation types in restoration area of an antimony mining area. J. Hefei Univ. Technol. (Nat. Sci.) 2023, 46, 1314–1321+1330. [Google Scholar] [CrossRef]
- Kumar, P.; Kumar, A.; Patil, M.; Sharma, N.K.; Singh, A.N. Herbaceous vegetation under planted woody species on coal mine spoil acts as a source of organic matter. Acta Oecologica-Int. J. Ecol. 2022, 114, 103809. [Google Scholar] [CrossRef]
- Wang, C.L.; Wang, Y.M. A review of research on grassland biomass estimation based on remote sensing and mechanistic models. Pratacultural Sci. 2024, 41, 2104–2117. [Google Scholar] [CrossRef]
- Yang, K.M.; Peng, L.S.; Zhang, Y.H.; Gu, X.R.; Chen, X.Y.; Jiang, K.G. Research on biomass inversion of multiple vegetation types on the surface of mining areas. Ecol. Environ. Sci. 2024, 33, 1027–1035. [Google Scholar] [CrossRef]
- Silva, J.L.D.; de Araujo, R.A.; Esteves, V.P.P.; Loebmann, D.G.D.W.; Vicente, L.E.; Paschoal, J.P.; Morgado, C.D.V. Analysis of vegetation recovery in areas impacted by bauxite mining in the Amazon Forest. Clean Technol. Environ. Policy 2021, 23, 1617–1640. [Google Scholar] [CrossRef]
- Yang, Y.; Zhao, Y.N.; Fan, R.Y.; Zhang, Y.N.; Liu, L.; Ding, Y. The Influence of Grassland Surface Mine Restoration on Soil Organic Carbon: A Review. Chin. J. Grassl. 2024, 46, 129–138. [Google Scholar] [CrossRef]
- Bosch-Serra, A.D.; Cruz, J.; Poch, R.M. Soil Quality in Rehabilitated Coal Mining Areas. Appl. Sci. 2023, 13, 9592. [Google Scholar] [CrossRef]
- Penalver-Alcala, A.; Alvarez-Rogel, J.; Peixoto, S.; Silva, I.; Silva, A.R.R.; Gonzalez-Alcaraz, M.N. The relationships between functional and physicochemical soil parameters in metal(loid) mine tailings from Mediterranean semiarid areas support the value of spontaneous vegetation colonization for phytomanagement. Ecol. Eng. 2021, 168, 106293. [Google Scholar] [CrossRef]
- Misebo, A.M.; Pietrzykowski, M.; Wos, B. Soil Carbon Sequestration in Novel Ecosystems at Post-Mine Sites-A New Insight into the Determination of Key Factors in the Restoration of Terrestrial Ecosystems. Forests 2022, 13, 63. [Google Scholar] [CrossRef]
- Gao, X.H.; Li, S.; Song, G.L.; Qi, Y.T.; Yu, Y. Analysis on variation characteristics of vegetation carbon sequestration in highway rock cutting slope with different restoration years. Grassl. Turf 2023, 43, 105–112. [Google Scholar] [CrossRef]
- Ghosh, D.; Maiti, S.K. Eco-Restoration of Coal Mine Spoil: Biochar Application and Carbon Sequestration for Achieving UN Sustainable Development Goals 13 and 15. Land 2021, 10, 1112. [Google Scholar] [CrossRef]
- Tang, J.J.; Dong, J.; Yang, Y.J.; Xu, M.S.; Lei, S.G.; Hua, X. Inversion of Aboveground Carbon Stock of Vegetation in Mine Ecological Restoration Area by Combining LiDAR and Hyperspectral Data. Met. Mine 2023, 559, 65–72. [Google Scholar] [CrossRef]
- Yang, F.; Cui, K.K.; Zhang, C.Y.; Li, J.; Wang, J.Y.; Du, T.M.; Zhang, H.R. Construction and analysis of a method for grading long-term vegetation carbon sink in waste dumps of an open-pit coal mine. Coal Geol. Explor. 2024, 52, 139–150. [Google Scholar] [CrossRef]
- Zhai, Z.J.; Yang, H.H.; Zhang, Y.; Wu, L.P.; Chai, Z.F.; Wang, T.J. Study on Relationship Between Plant Species Diversity and Above Ground Biomass During Mine Natural Rehabilitation Process. Yellow River 2018, 40, 93–97. [Google Scholar] [CrossRef]
- 42. DZ/T 0279.25-2016; Analysis Methods for Regional Geochemical Sample—Part25: Determination of Carbon Contents by Combustion—Infrared Absorption Spectrometry. Chinese Standard: Beijing, China, 2016.
- Guo, G.Y.; Lei, S.G.; Ren, L.X.; Duan, R.T.; Li, Y.T.; Duan, L. Spatial Heterogeneity Detection of Vegetation Change Based on Pearson Time Series Algorithm. J. Hunan Univ. Sci. Technol. (Nat. Sci. Ed.) 2023, 38, 119–124. [Google Scholar] [CrossRef]
- Huu, B.V.; Hieu, N.Q.; Hieu, L.T. Monitoring growth and predicting crop yield through UAV-mounted spectral camera analysis of the interplay between soil compaction and vegetation index. Emir. J. Food Agric. 2024, 36, 14. [Google Scholar] [CrossRef]
- Qiao, M.; Hu, B.; Li, J.; Wei, E.J.; Li, J.F. Research on sensitivity of slope control parameters considering mine slope stability and economic benefit. Chin. J. Nonferrous Met. 2023, 33, 2745–2752. [Google Scholar] [CrossRef]
- Guo, Y.D.; Zhang, Q.L.; Zhang, R.; Chen, X.Y.; Mi, H.Z. Construction of Remoting Sensing Model for Biomass Estimation of Artificial Shrubbery in Kubuqi Desert. J. Northeast. For. Univ. 2022, 50, 56–60. [Google Scholar] [CrossRef]
- Liu, Y.B.; Pang, J.H.; Liang, S.; Yu, D.M.; Shi, X.P.; Li, G.R.; Miao, X.X.; Wang, Y.X.; Zhu, H.L.; Hu, X.S. Characteristics of Runoff and Sediment Production on Mine Dump Slopes with Different Recovery Periods in Alpine Regions. Bull. Soil Water Conserv. 2024, 44, 1–11. [Google Scholar] [CrossRef]
- Zhu, J.B.; Zhang, Z.C.; Li, H.Q.; Wu, Q.H.; He, H.D.; Zhang, F.W.; Li, Y.N. Characteristics and interrelationship of vegetation biomass and soil properties in alpine meadow under grazing gradients. Sci. Sin. Vitae 2023, 53, 1166–1175. [Google Scholar] [CrossRef]
- Shen, Q.; Zhu, C.M.; Zhang, X. Fractional vegetation cover estimation in aird and rare vegetation area aided by GF-2 remote sensing data. For. Eng. 2019, 7, 33–38. [Google Scholar] [CrossRef]
- Sun, Y.; Li, F.R.; Xie, L.F.; Dong, L.H. Construction of the stand-level biomass model of Larix olgensis plantations based on stand and topographic factors. J. Nanjing For. Univ. (Nat. Sci. Ed.) 2023, 47, 129–136. [Google Scholar] [CrossRef]
- Chen, F.; Zhu, Y.F.; Ma, J.; Dong, W.X.; You, Y.N.; Yang, Y.J. Mechanism, potential and regulation of carbon sequestration and sink enhancement in ecological restoration of mining areas in the Loess Plateau. Coal Sci. Technol. 2023, 51, 502–513. [Google Scholar]
- Hublova, L.; Frouz, J. Contrasting effect of coniferous and broadleaf trees on soil carbon storage during reforestation of forest soils and afforestation of agricultural and post-mining soils. J. Environ. Manag. 2021, 290, 112567. [Google Scholar] [CrossRef] [PubMed]


| Slope Area | Slope Description | Slope Stability | Vegetation Status | Projected Area (m2) | Surface Area (m2) |
|---|---|---|---|---|---|
| A1 | Circular arc shape on plane and steep or ladder shape in vertical direction, slope angle of 65–75°, slope direction of 87°, slope length of 250 m, slope width of 15–20 m, maximum slope height of 40 m | Good stability, developed joints, and local collapse | Completely exposed slope surface | 5714 | 6313 |
| A2 | Nearly linear shape on the plane and steep in the vertical direction, slope angle of 60–70°, slope direction of 312°, slope length of 120 m, slope width of 7–16 m, maximum slope height of 40 m | Stable, developed joints and local collapse | Completely exposed slope surface | 4623 | 5083 |
| A3 | Flat terrain with semicircle shape on plane, slope angle of 60–70°, elevation of 128–130 m | / | Completely exposed surface | 947 | 1738 |
| A4 | Circle shape on the plane and steep in the vertical direction, slope angle of 60–65°, slope direction of 30°, slope length of 750 m, slope width of 20–37 m, maximum slope height of 50 m | Good stability, developed joints, loose rock mass, and local collapse | Completely exposed slope surface | 26,155 | 34,746 |
| A5 | Nearly linear shape on the plane and steep in the vertical direction, slope angle greater than 65°, slope direction of 230°, slope length of 105 m, slope width of 50 m, maximum slope height of 35 m | Poor stability, developed joints, and loose rock mass | Completely exposed slope surface | 5880 | 6111 |
| A6 | Nearly linear shape on the plane and gentle in the vertical direction, slope angle of 40°, slope direction of 329°, slope length of 115 m, slope width of 10 m, maximum slope height of 10 m | Good stability, little deposit on the slope surface | Affected by original vegetation, vegetation developed on the slope surface | 1055 | 1377 |
| A7 | Nearly linear shape on plane and gentle in vertical direction, slope angle of 30–50°, slope direction of 135°, slope length of 150 m, slope width of 10–20 m, slope height of 3–9 m | Good stability, little deposit on the slope surface | Affected by original vegetation, vegetation developed on the slope surface with severe soil erosion | 1857 | 2145 |
| Vegetation Type | Quadrat Size | Sampling Method | Sampling Requirement |
|---|---|---|---|
| Herb | 1 m × 1 m | Cutting method | Cut off the aboveground herbs in the quadrat. |
| Shrub | 1 m × 1 m | Partly cutting method | Cut off a quarter of aboveground shrubs within the quadrat corner. |
| Vegetation Type | Data Type | Recorded Content |
|---|---|---|
| Herb | Vegetation community | Connectivity of each herb on the slope (α), coverage rate of the quadrat (C). |
| Plant | Average height (H), maximum height (Hmax). | |
| Shrub | Vegetation community | Connectivity of each shrub on the slope (α), coverage rate of the quadrat (C), total shrub counts in the quadrat (n). |
| Per plant | Height of per-shrub plant (H), diameter of per-shrub plant (D). |
| Vegetation | Independent Variables | Code of Variable | Vegetation | Independent Variables | Code of Variable |
|---|---|---|---|---|---|
| Herb | Average height (m) | H | Shrub | Average height (m) | H |
| Coverage rate of the quadrat (%) | C | Diameter of per-shrub plant | D | ||
| Product of average height and coverage rate (m) | CH | Plant projected area (m2) | A (A = πD2/4) | ||
| Product of average height and square of coverage rate (m) | C2H | Plant volume (m3) | V (V = AH, m3) | ||
| Product of square of average height and coverage rate (m2) | CH2 | Product of average height and diameter of per-shrub plant (m2) | DH | ||
| Product of square of diameter of per-shrub plant and average height (m3) | D2H |
| Model Type | Mathematical Expression |
|---|---|
| Linear function model | W = a + bx |
| Quadratic function model | W = a + bx + cx2 |
| Cubic function model | W = a + bx + cx2 + dx3 |
| Logarithmic function model | W = a + b·lnx |
| Power function model | W = a·xb |
| Exponential function model | W = a·ebx |
| Vegetation Type | Correlation Coefficients | D | A | V | D2H | DH | H | W |
|---|---|---|---|---|---|---|---|---|
| Amorpha fruticosa L. | D | 1.000 | 0.981 | 0.856 | 0.856 | 0.766 | 0.357 | 0.675 |
| A | 0.981 | 1.000 | 0.876 | 0.876 | 0.754 | 0.323 | 0.676 | |
| V | 0.856 | 0.876 | 1.000 | 1.000 | 0.962 | 0.689 | 0.868 | |
| D²H | 0.856 | 0.876 | 1.000 | 1.000 | 0.962 | 0.689 | 0.868 | |
| DH | 0.766 | 0.754 | 0.962 | 0.962 | 1.000 | 0.851 | 0.900 | |
| H | 0.357 | 0.323 | 0.689 | 0.689 | 0.851 | 1.000 | 0.781 | |
| W | 0.675 | 0.676 | 0.868 | 0.868 | 0.900 | 0.781 | 1.000 | |
| Indigofera tinctoria L. | D | 1.000 | 0.981 | 0.856 | 0.856 | 0.766 | 0.357 | 0.675 |
| A | 0.981 | 1.000 | 0.876 | 0.876 | 0.754 | 0.323 | 0.676 | |
| V | 0.856 | 0.876 | 1.000 | 1.000 | 0.962 | 0.689 | 0.868 | |
| D2H | 0.856 | 0.876 | 1.000 | 1.000 | 0.962 | 0.689 | 0.868 | |
| DH | 0.766 | 0.754 | 0.962 | 0.962 | 1.000 | 0.851 | 0.900 | |
| H | 0.357 | 0.323 | 0.689 | 0.689 | 0.851 | 1.000 | 0.781 | |
| W | 0.675 | 0.676 | 0.868 | 0.868 | 0.900 | 0.781 | 1.000 |
| Vegetation Type | Correlation Coefficients | H | C | CH | C2H | CH2 | W |
|---|---|---|---|---|---|---|---|
| Solidago canadensis L. | H | 1.000 | −0.145 | 0.915 | 0.777 | 0.940 | 0.951 |
| C | −0.145 | 1.000 | 0.242 | 0.472 | 0.114 | 0.134 | |
| CH | 0.915 | 0.242 | 1.000 | 0.964 | 0.963 | 0.982 | |
| C2H | 0.777 | 0.472 | 0.964 | 1.000 | 0.890 | 0.915 | |
| CH2 | 0.940 | 0.114 | 0.963 | 0.890 | 1.000 | 0.969 | |
| W | 0.951 | 0.134 | 0.982 | 0.915 | 0.969 | 1.000 | |
| Vegetation Type | Correlation Coefficients | H | C | CH | C2H | CH2 | W |
| Erigeron canadensis L. | H | 1.000 | −0.191 | 0.771 | 0.603 | 0.863 | 0.803 |
| C | −0.191 | 1.000 | 0.446 | 0.631 | 0.21 | 0.414 | |
| CH | 0.771 | 0.446 | 1.000 | 0.971 | 0.934 | 0.988 | |
| C2H | 0.603 | 0.631 | 0.971 | 1.000 | 0.851 | 0.946 | |
| CH2 | 0.863 | 0.21 | 0.934 | 0.851 | 1.000 | 0.936 | |
| W | 0.803 | 0.414 | 0.988 | 0.946 | 0.936 | 1.000 |
| Function Type | Fitting Variable | Regression Parameters | Coefficient of Determination (R2) | Regression Test Significance (P) | Joint Hypotheses Test (F) | |||
|---|---|---|---|---|---|---|---|---|
| Constant | Coefficients | |||||||
| a | b | c | d | |||||
| Linear function | DH | 26.680 | 104.426 | / | / | 0.809 ** | <0.001 | 97.691 |
| Quadratic function | 153.529 | 109.487 | / | / | 0.717 ** | <0.001 | 58.242 | |
| Cubic function | 21.306 | 113.814 | −3.089 | / | 0.810 ** | <0.001 | 46.860 | |
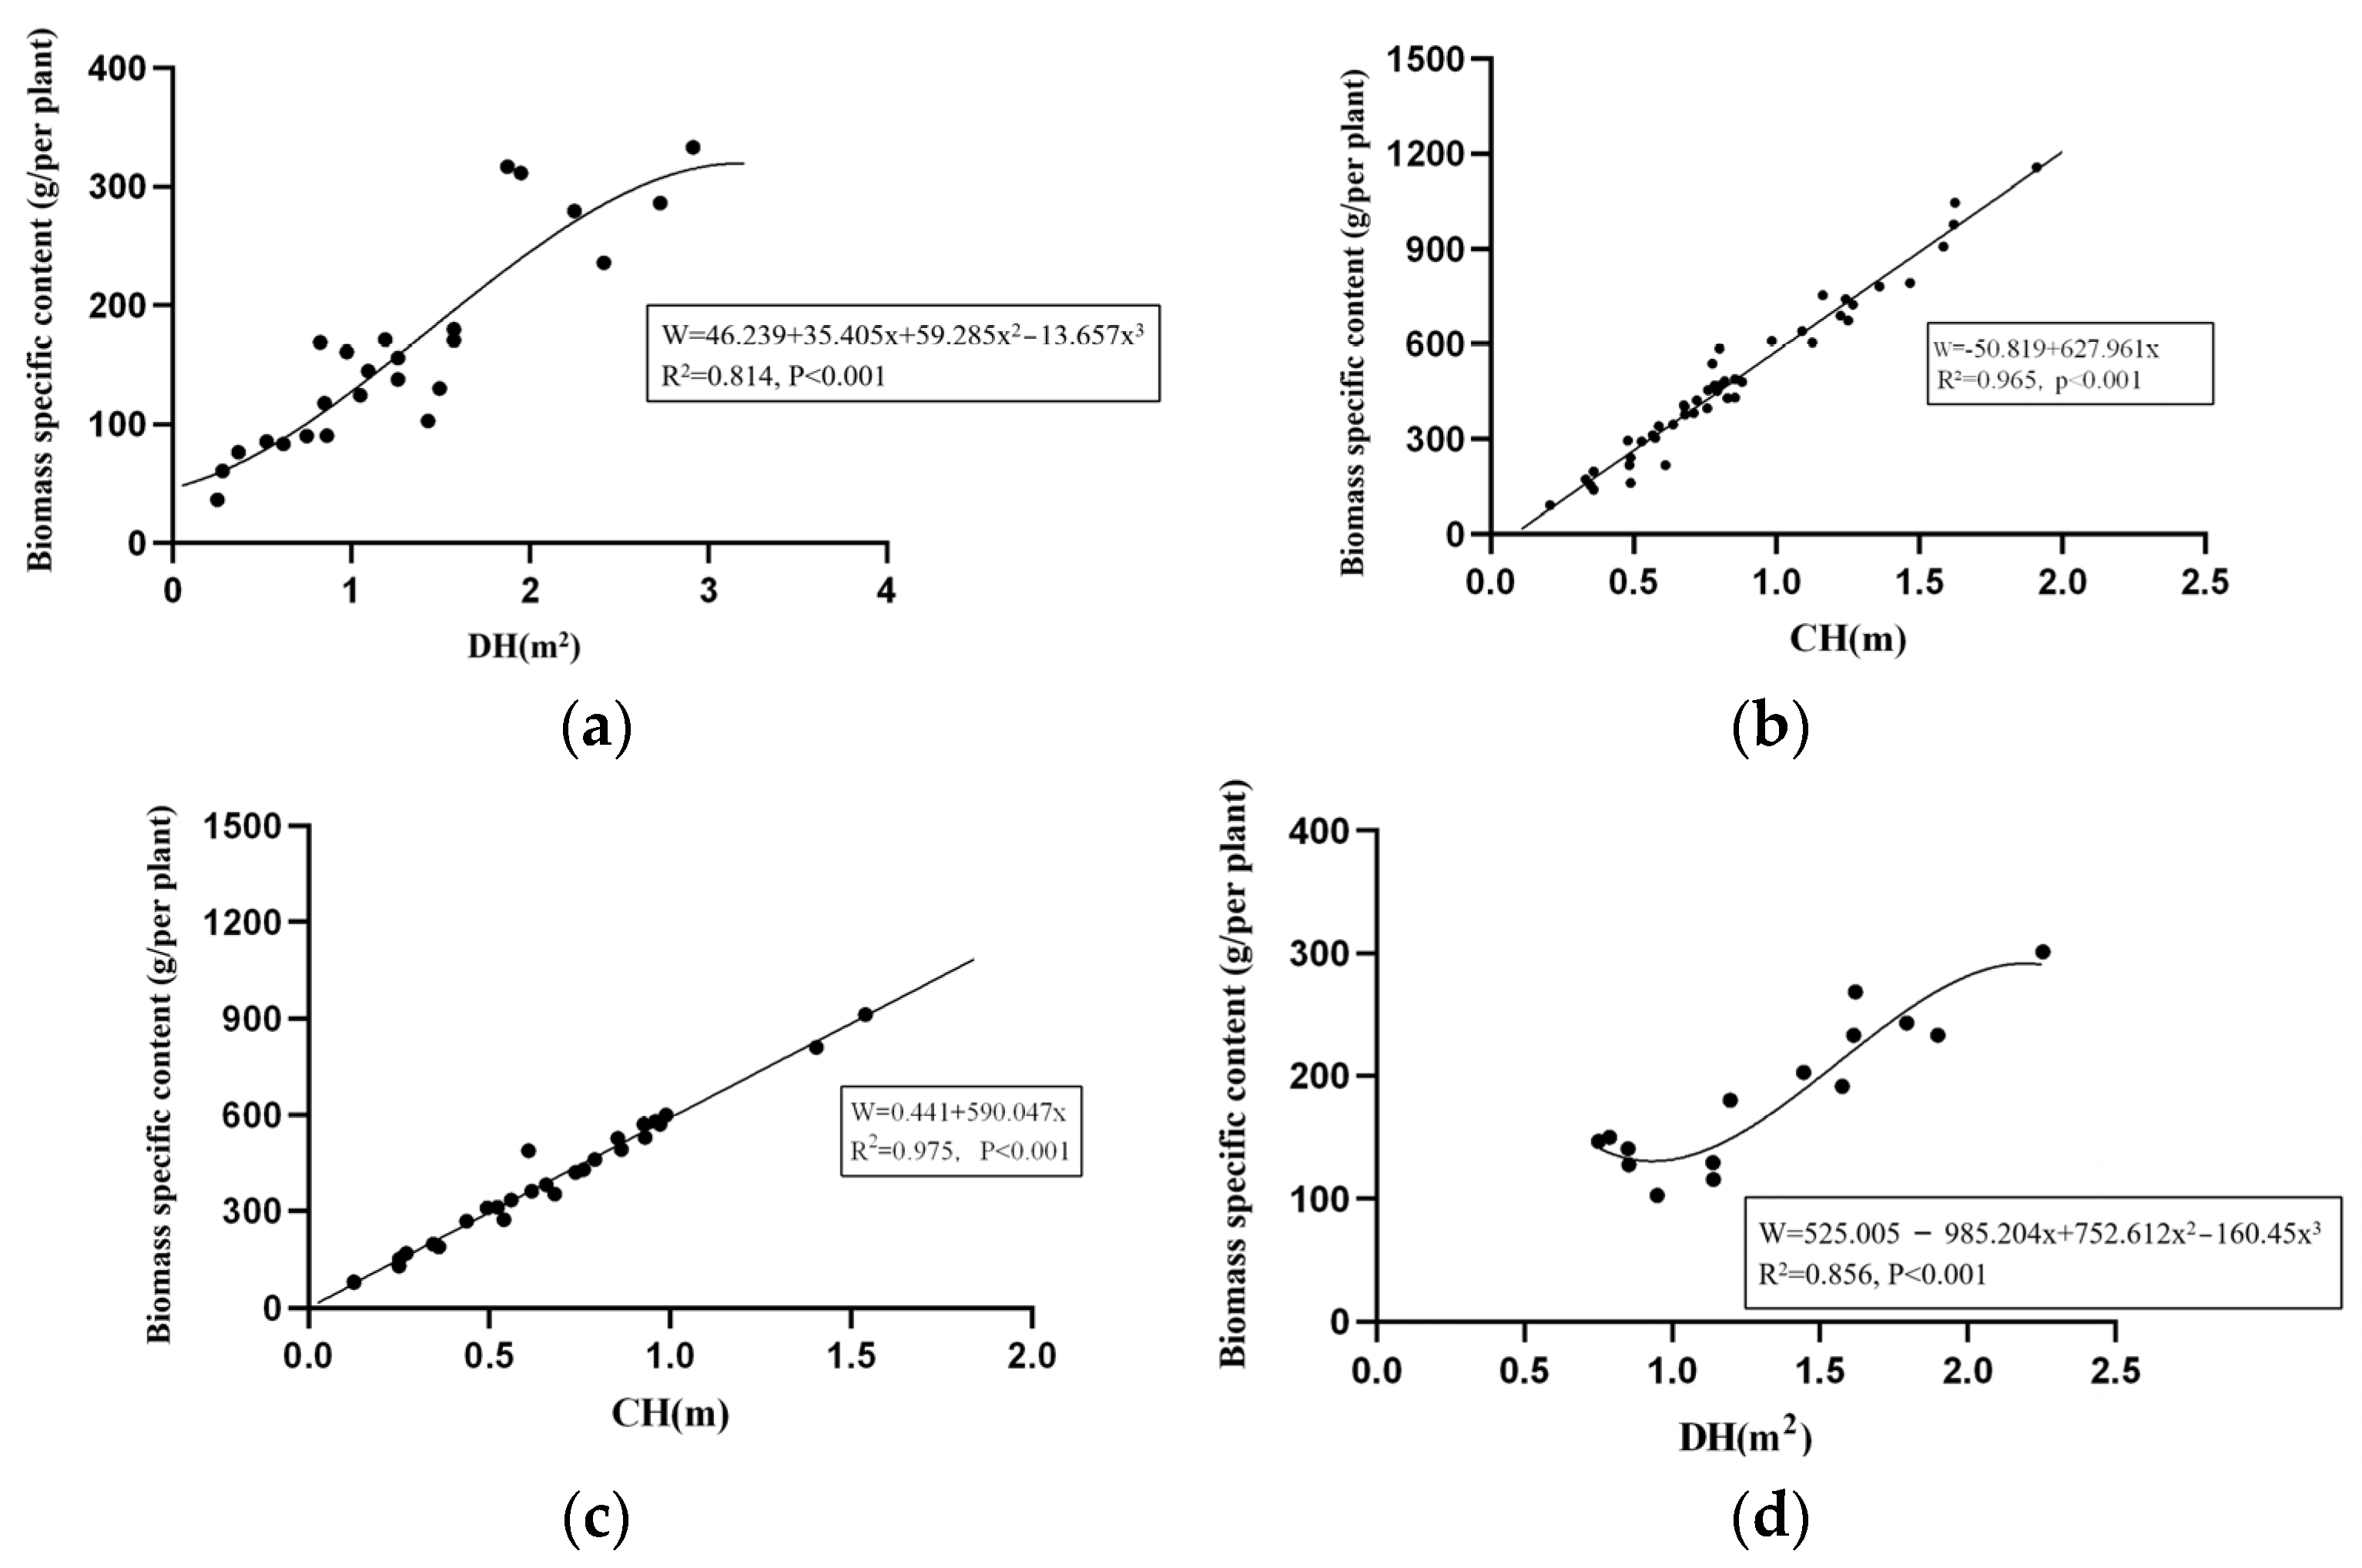
| Logarithmic function | 46.239 | 35.405 | 59.285 | −13.657 | 0.814 ** | <0.001 | 30.668 | |
| Power function | 4.084 | 0.667 | / | / | 0.777 ** | <0.001 | 80.126 | |
| Exponential function | 59.406 | 0.667 | / | / | 0.777 ** | <0.001 | 80.126 | |
| Vegetation Type | Fitting Variable | Correlation Coefficient | Model Expression | Coefficient of Determination (R2) | Regression Test Significance (P) | Joint Hypotheses Test (F) | Average Error (RS) | Average Relative Error (RMA) |
|---|---|---|---|---|---|---|---|---|
| Indigofera tinctoria L. | DH | 0.895 | 0.965 ** | <0.001 | 1224.113 | 0.76% | 5% | |
| Solidago canadensis L. | CH | 0.982 | 0.975 ** | <0.001 | 989.299 | 0.91% | 3% | |
| Erigeron canadensis L. | CH | 0.988 | 0.856 ** | <0.001 | 51.997 | 2.8% | 6% |
| No. | Surface Area (m2) | Dominant Vegetation Type | Vegetation Connectivity on the Slope (%) | Vegetation Carbon Content (%) | Vegetation Biomass of per Unit Area (g) | Vegetation Carbon Storage (t) |
|---|---|---|---|---|---|---|
| A1 | 6313 | Erigeron canadensis L. | 43.7 | 30.627 | 1013.6 | 0.856 |
| Solidago canadensis L. | 10.4 | 33.180 | 990.9 | 0.216 | ||
| Amorpha fruticosa L. | 24.3 | 44.266 | 4622.7 | 3.139 | ||
| A2 | 5083 | Erigeron canadensis L. | 8.0 | 36.280 | 460.6 | 0.068 |
| Amorpha fruticosa L. | 33.8 | 44.922 | 3719.7 | 2.871 | ||
| Indigofera tinctoria L. | 21.9 | 45.046 | 3317.6 | 1.664 | ||
| A3 | 1738 | Amorpha fruticosa L. | 90.0 | 41.732 | 3509.7 | 2.291 |
| A4 | 34,746 | Solidago canadensis L. | 15.6 | 35.421 | 489.7 | 0.940 |
| Erigeron canadensis L. | 20.4 | 36.733 | 394.5 | 1.027 | ||
| Amorpha fruticosa L. | 31.2 | 43.018 | 4208.3 | 19.625 | ||
| Indigofera tinctoria L. | 29.7 | 41.771 | 4011.0 | 17.290 | ||
| A5 | 6111 | Erigeron canadensis L. | 43.0 | 39.830 | 571.2 | 0.598 |
Disclaimer/Publisher’s Note: The statements, opinions and data contained in all publications are solely those of the individual author(s) and contributor(s) and not of MDPI and/or the editor(s). MDPI and/or the editor(s) disclaim responsibility for any injury to people or property resulting from any ideas, methods, instructions or products referred to in the content. |
© 2025 by the authors. Licensee MDPI, Basel, Switzerland. This article is an open access article distributed under the terms and conditions of the Creative Commons Attribution (CC BY) license (https://creativecommons.org/licenses/by/4.0/).
Share and Cite
Huang, C.; Wu, Y.; Yang, S.; Zhang, F.; Li, X.; Zhang, H.; Zhang, X. Establishment and Application of Biomass Model for Vegetation Condition Assessment After Ecological Restoration—Yixing Quarry Case Study. Sustainability 2025, 17, 734. https://doi.org/10.3390/su17020734
Huang C, Wu Y, Yang S, Zhang F, Li X, Zhang H, Zhang X. Establishment and Application of Biomass Model for Vegetation Condition Assessment After Ecological Restoration—Yixing Quarry Case Study. Sustainability. 2025; 17(2):734. https://doi.org/10.3390/su17020734
Chicago/Turabian StyleHuang, Chaokui, Yueping Wu, Shaohui Yang, Faming Zhang, Xiaokai Li, Huaqing Zhang, and Xiaolong Zhang. 2025. "Establishment and Application of Biomass Model for Vegetation Condition Assessment After Ecological Restoration—Yixing Quarry Case Study" Sustainability 17, no. 2: 734. https://doi.org/10.3390/su17020734
APA StyleHuang, C., Wu, Y., Yang, S., Zhang, F., Li, X., Zhang, H., & Zhang, X. (2025). Establishment and Application of Biomass Model for Vegetation Condition Assessment After Ecological Restoration—Yixing Quarry Case Study. Sustainability, 17(2), 734. https://doi.org/10.3390/su17020734