
Comparative Techno-Economic Analysis of Gray Hydrogen Production Costs: A Case Study


Abstract
1. Introduction
- -
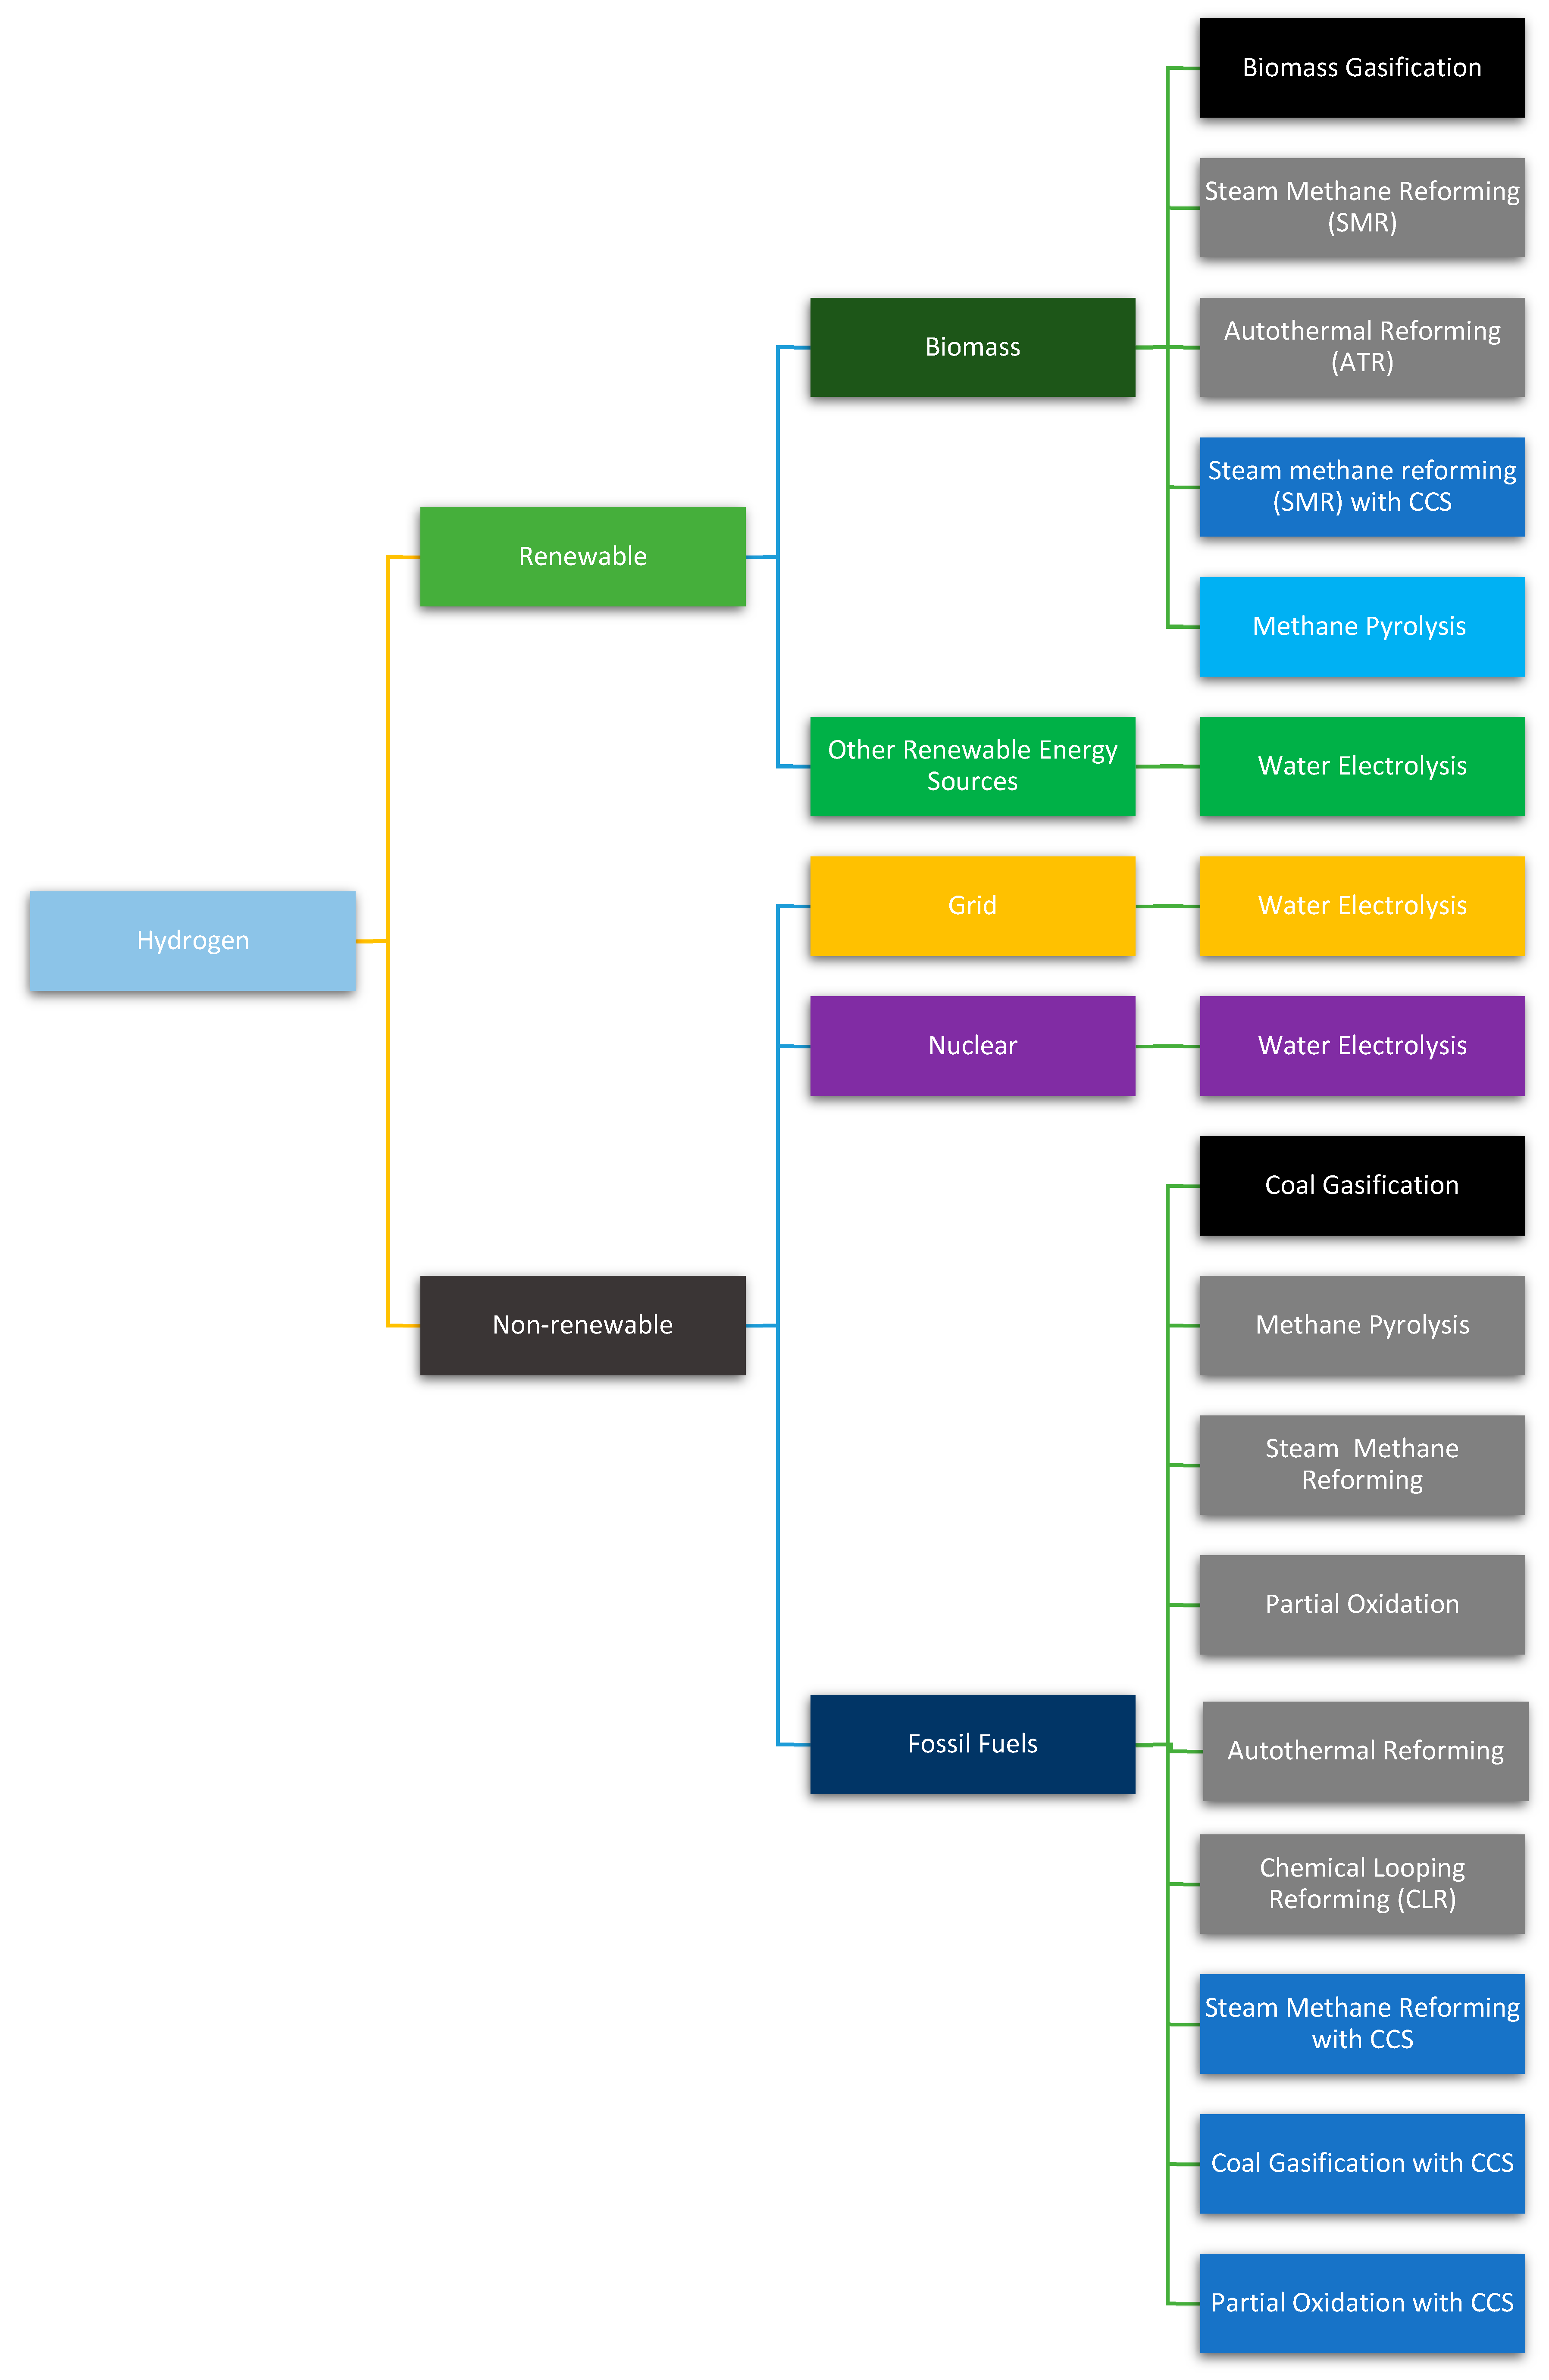
- Green hydrogen: Produced by water electrolysis using RE sources, which have no carbon emissions.
- -
- Blue hydrogen: Produced by steam methane reforming. In this method, the generated CO2 is captured and stored to prevent its release.
- -
- Gray hydrogen: Produced by steam methane reforming. CO2 is released into the atmosphere.
- -
- Black/brown hydrogen: Produced by the gasification of coal or oil. CO2 and other pollutants are emitted.
2. Energy Resources
3. The Studied Area
4. Software Used
5. The Required Data
5.1. Inflation Rate
5.2. The Photovoltaic System’s Specification and Solar Radiation Level
5.3. Converter Efficiency and Costs
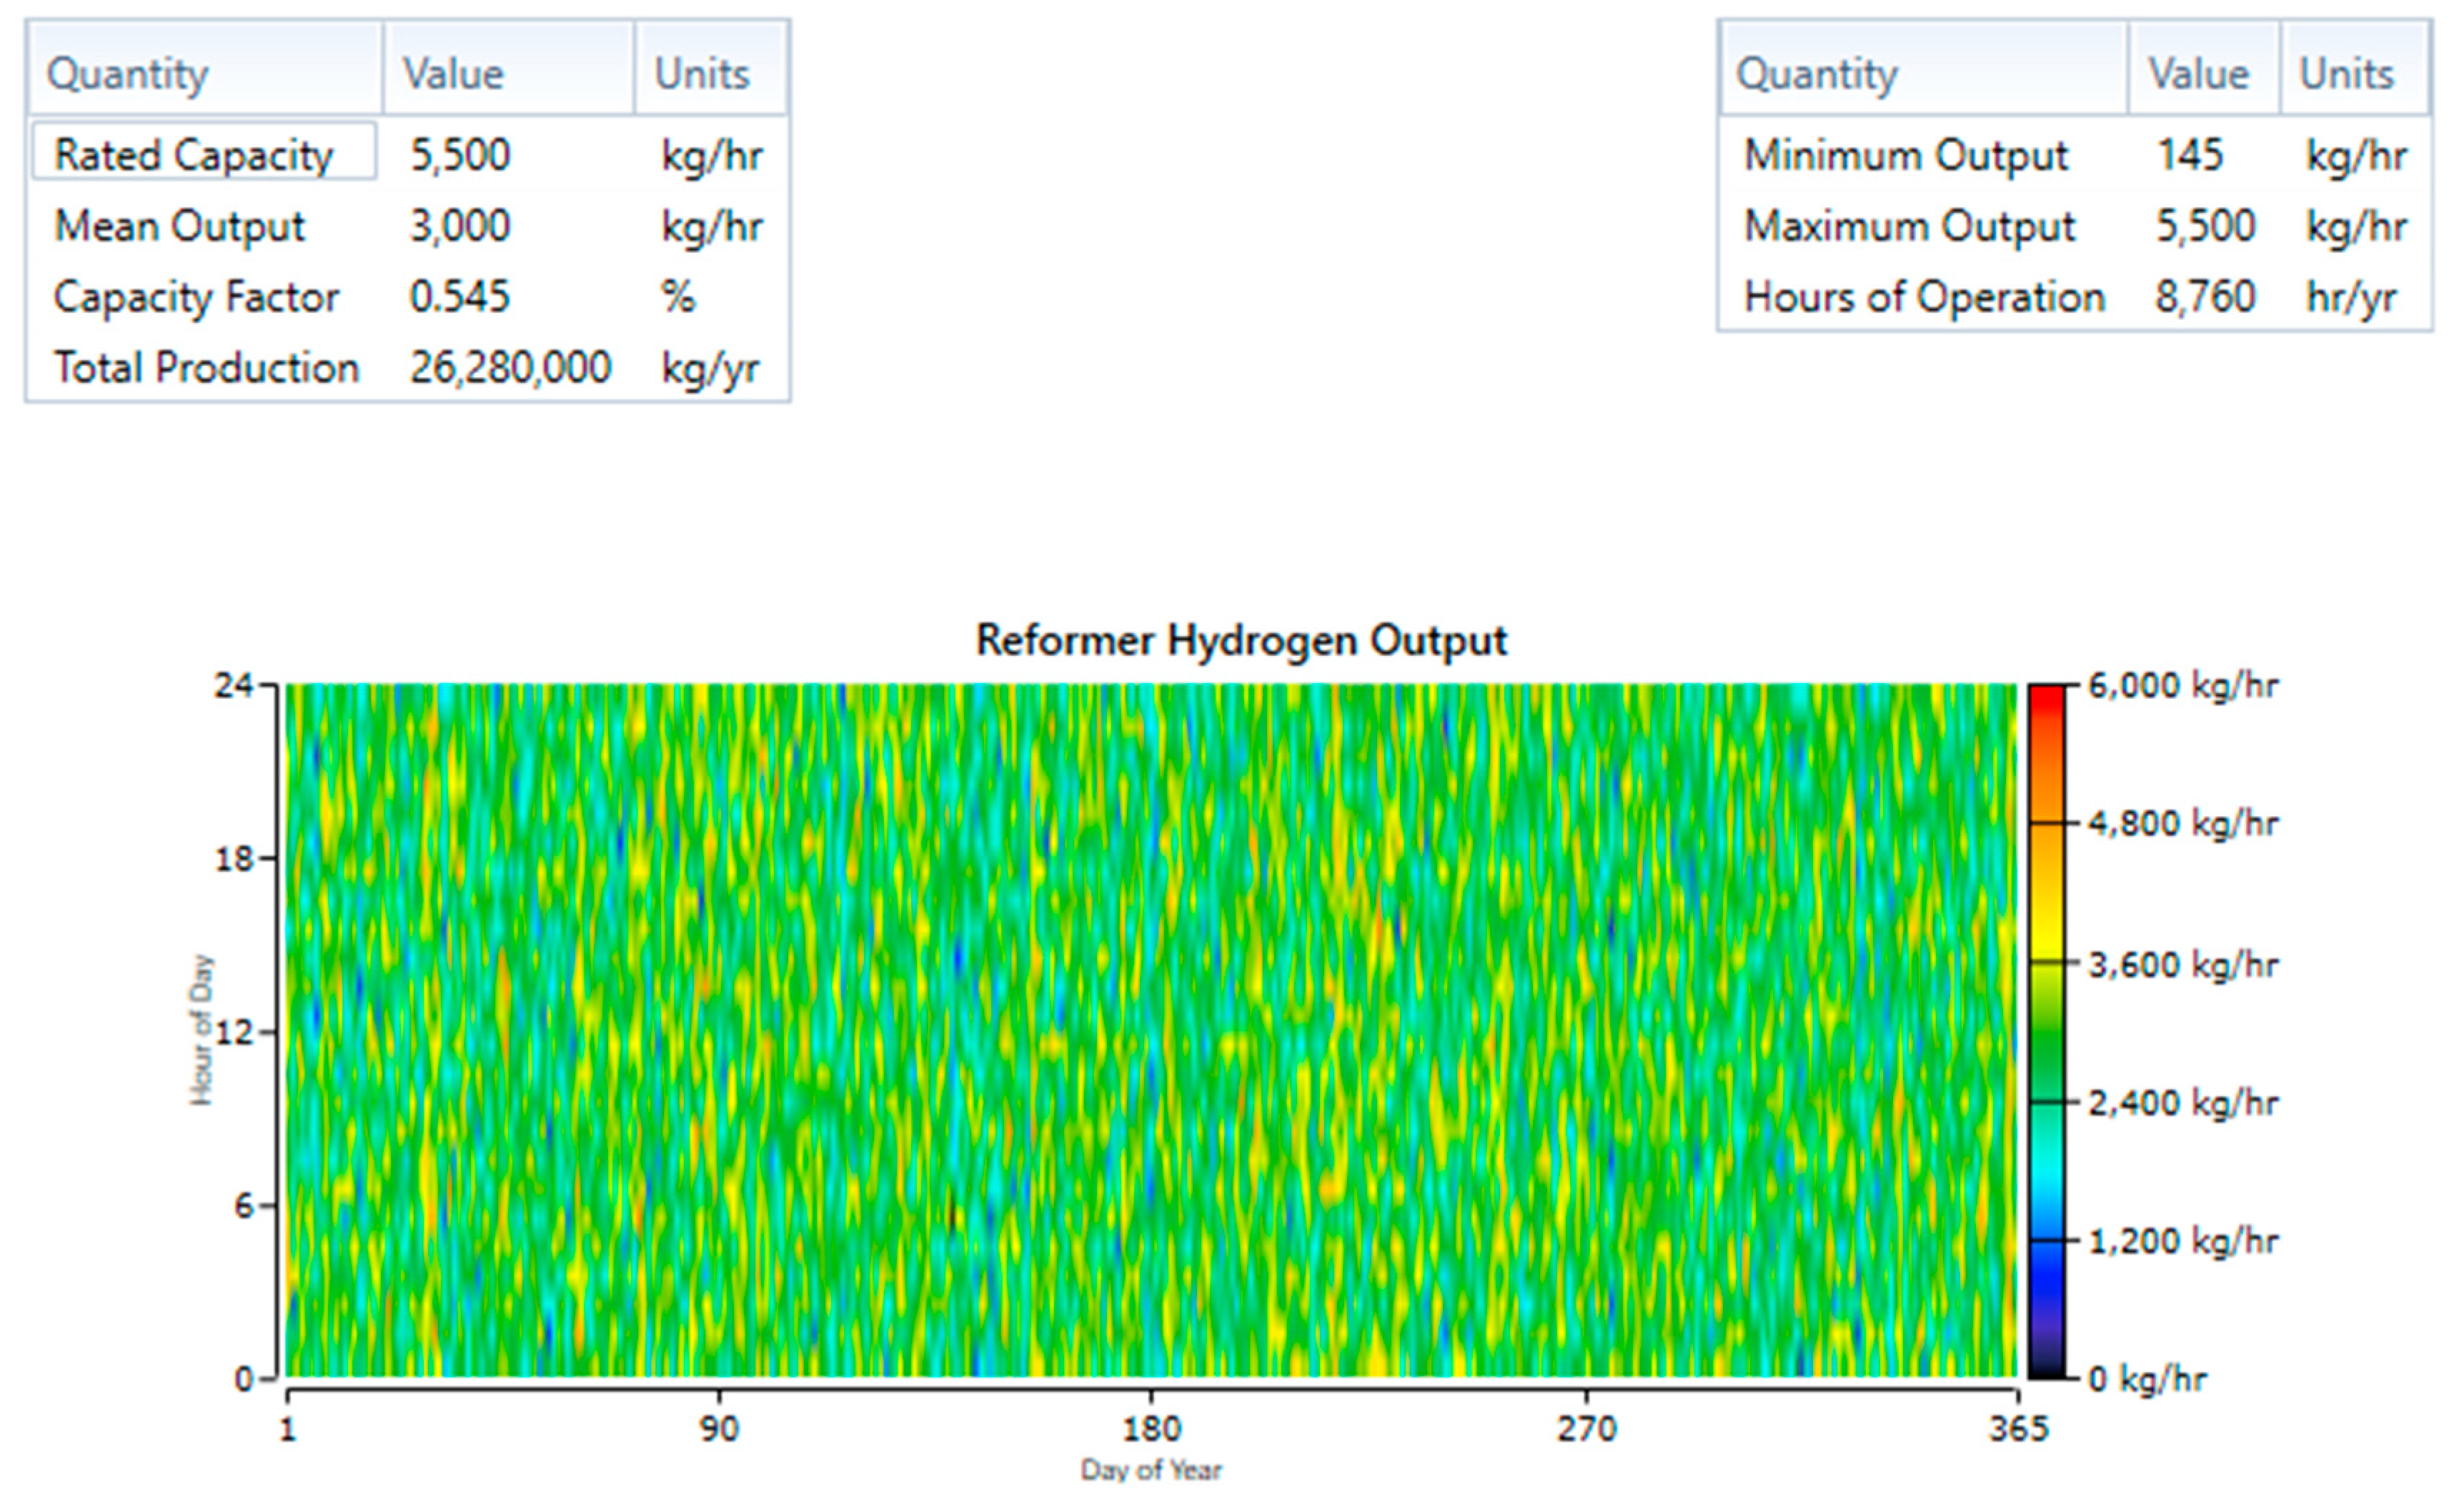
5.4. Reformer Performance and Costs
5.5. Hydrogen Production and Load
6. Results
6.1. Renewability
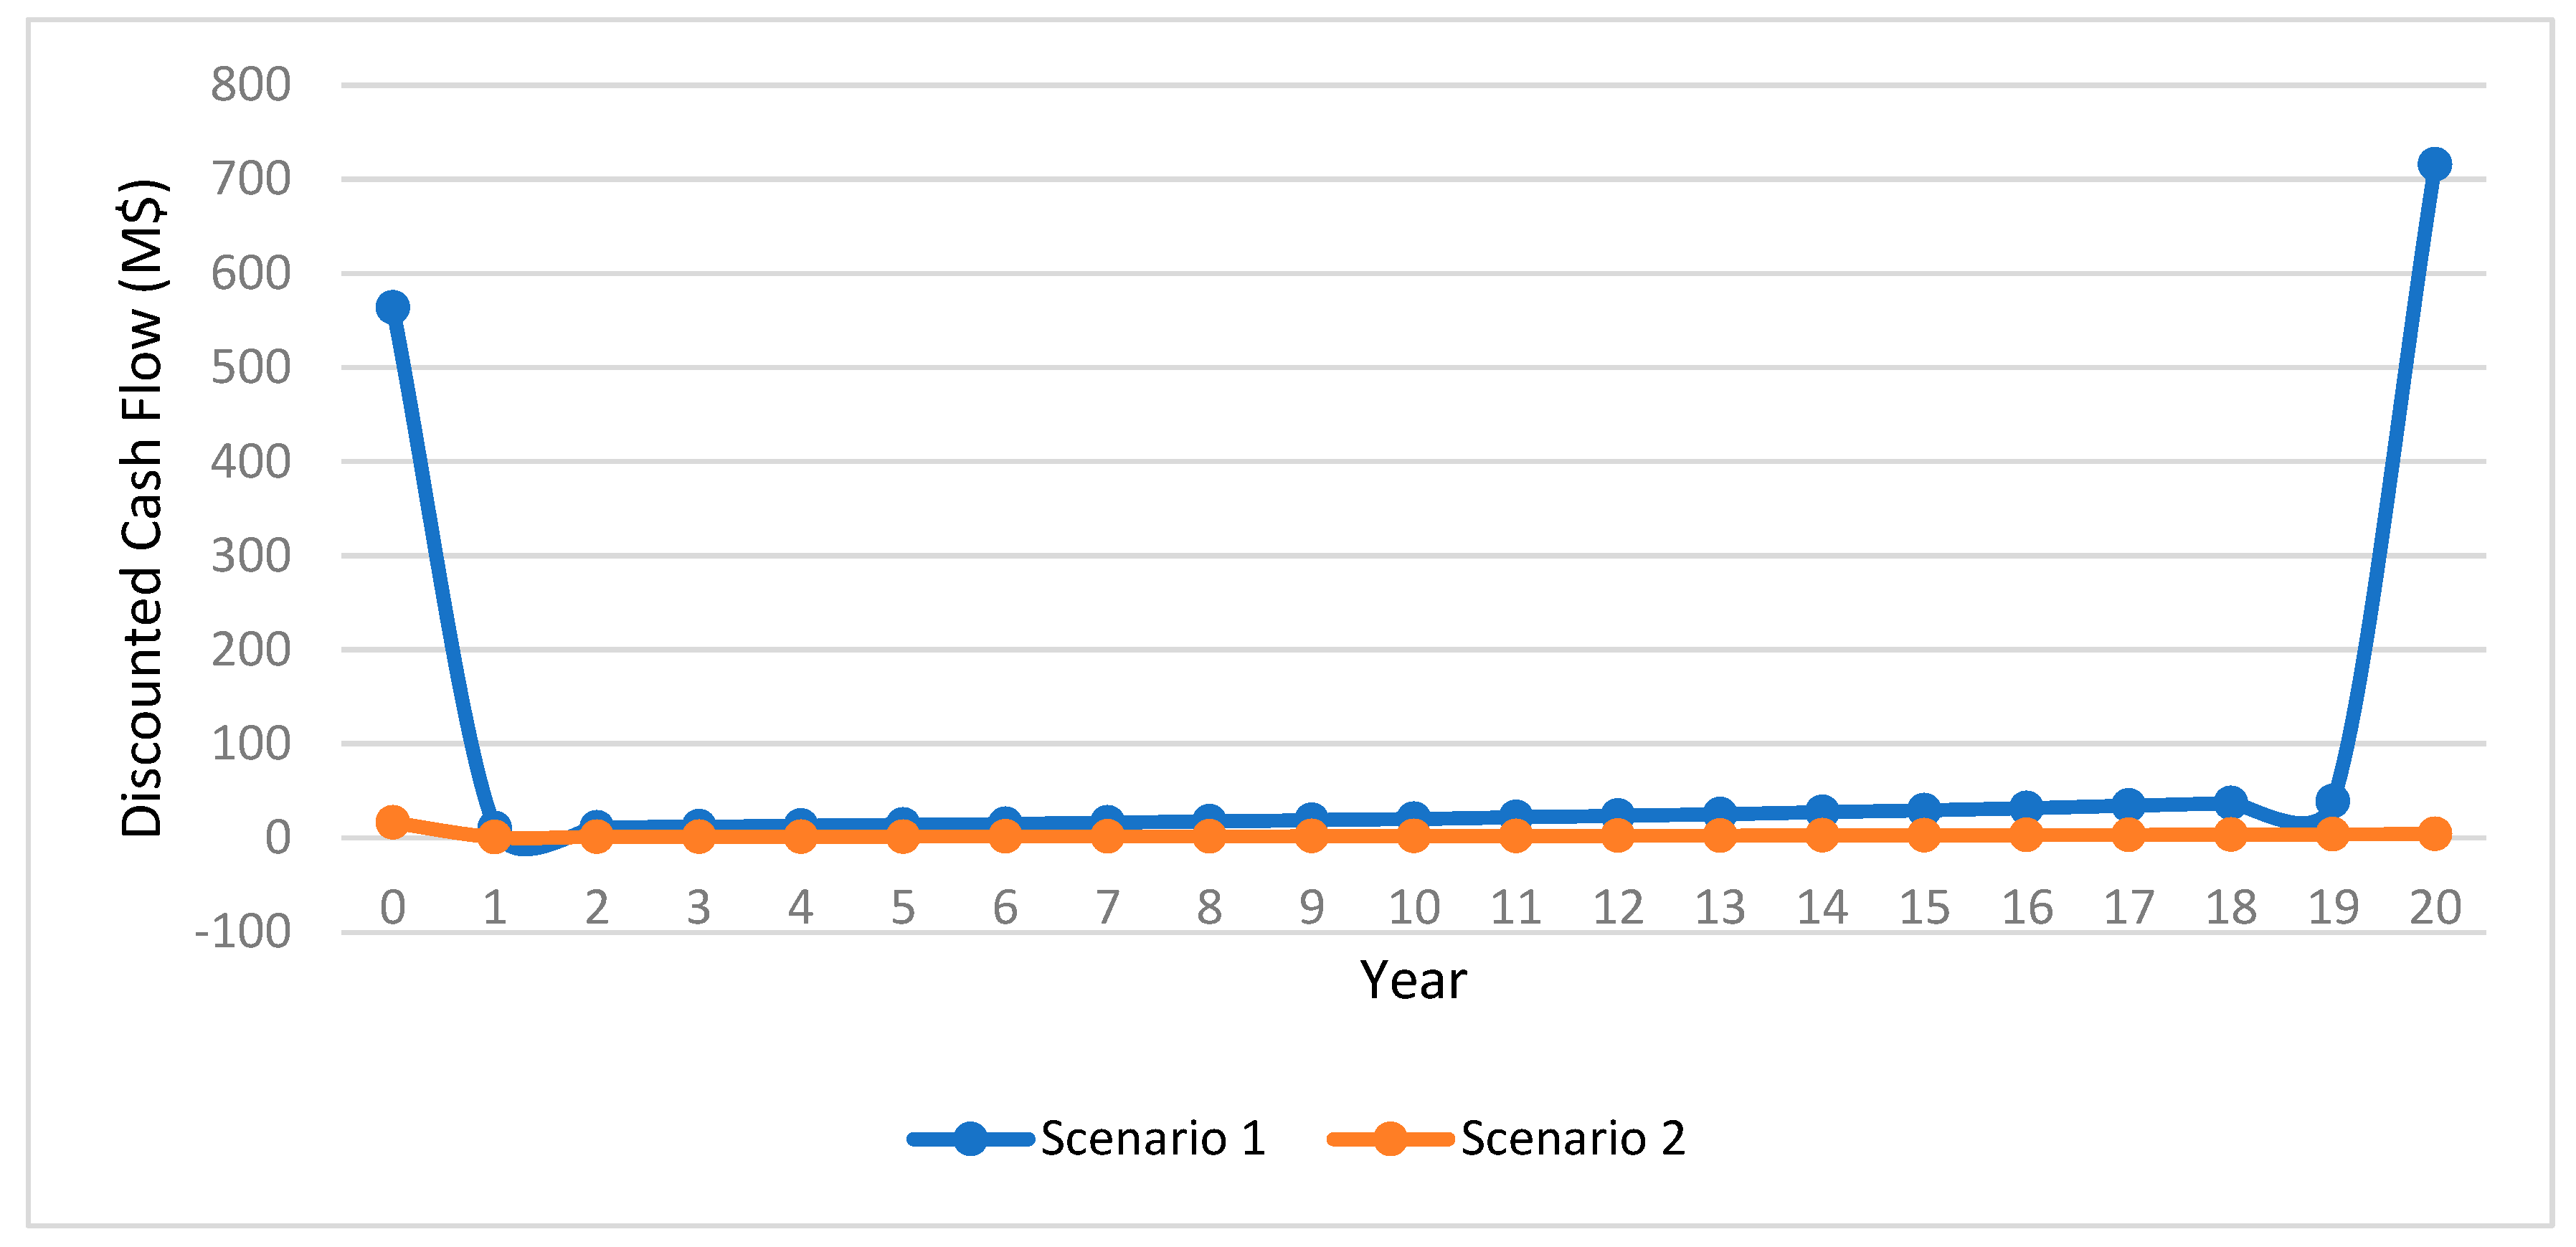
6.2. NPC
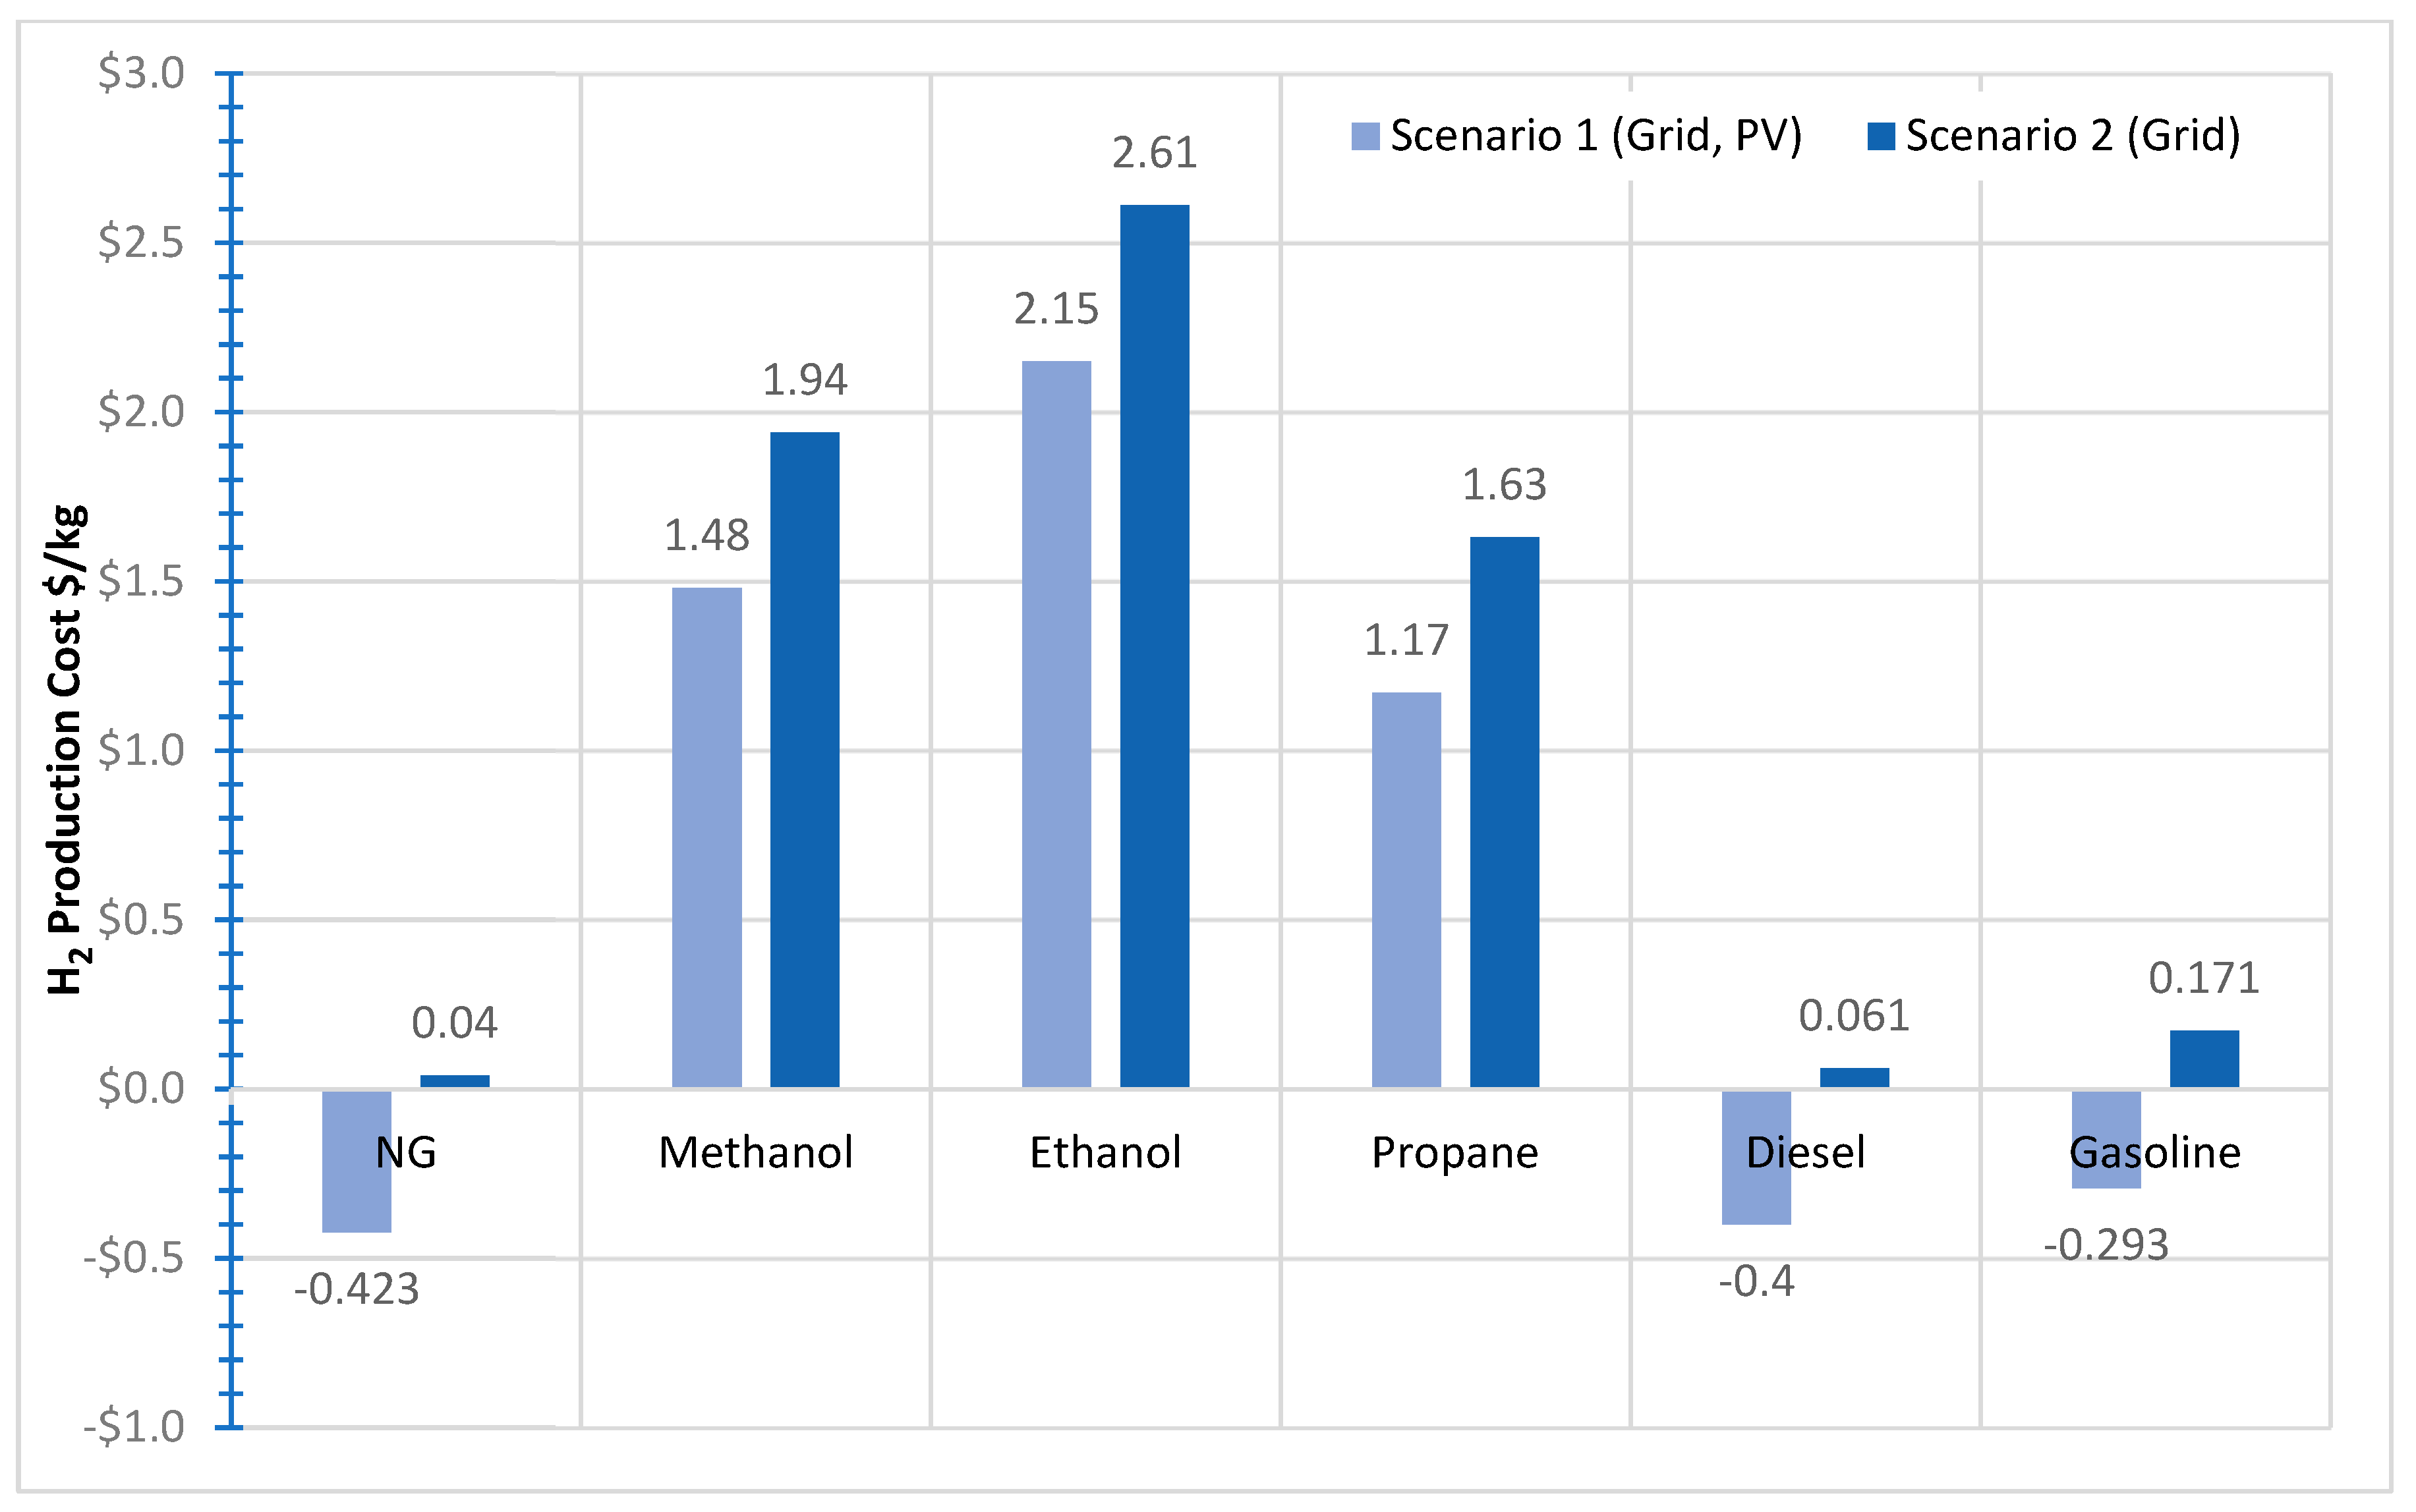
6.3. LCOH
6.4. Initial Cost
6.5. Sale of Electricity
7. Future Works
- -
- Given the fact that the focus of this study is on fossil fuels and steam methane reforming, it is highly recommended that future studies examine green fuels such as biomass and other production methods, photocatalysis for example [103].
- -
- -
8. Conclusions
Author Contributions
Funding
Institutional Review Board Statement
Informed Consent Statement
Data Availability Statement
Conflicts of Interest
References
- BP Statistical Review of World Energy 2021. Available online: https://www.bp.com/en/global/corporate/energy-economics/webcast-and-on-demand.html (accessed on 25 September 2024).
- Donaghy, T.Q.; Healy, N.; Jiang, C.Y.; Battle, C.P. Fossil fuel racism in the United States: How phasing out coal, oil, and gas can protect communities. Energy Res. Soc. Sci. 2023, 100, 103104. [Google Scholar] [CrossRef]
- Understanding Global Change. Burning of Fossil Fuels. Available online: https://ugc.berkeley.edu/background-content/burning-of-fossil-fuels (accessed on 25 September 2024).
- Chen, T.M.; Kuschner, W.G.; Gokhale, J.; Shofer, S. Outdoor air pollution: Nitrogen dioxide, sulfur dioxide, and car-bon monoxide health effects. Am. J. Med. Sci. 2007, 333, 249–256. [Google Scholar] [CrossRef] [PubMed]
- Watson, R.T.; Press, C.U.; The Core Writing Team. Climate Change 2001: Synthesis Report. In Third Assessment Report; Intergovernmental Panel on Climate Change: Cambridge, UK, 2001; p. 398. [Google Scholar]
- Soeder, D.J. Fracking and the Environment, 1st ed.; Springer: Cham, Switzerland, 2020; ISBN 978-3-030-59121-2. [Google Scholar]
- Allen, L.; Cohen, M.J.; Abelson, D.; Miller, B. Fossil Fuels and Water Quality. In The World’s Water; Gleick, P.H., Ed.; Island Press: Washington, DC, USA, 2012; pp. 73–96. ISBN 978-1-61091-048-4. [Google Scholar]
- Haibin, L.; Zhenling, L. Recycling utilization patterns of coal mining waste in China. Resour. Conserv. Recycl. 2010, 54, 1331–1340. [Google Scholar] [CrossRef]
- Zhang, X.; Dincer, I. Energy Solutions to Combat Global Warming, 1st ed.; Springer: Cham, Switzerland, 2016; ISBN 978-3-319-26950-4. [Google Scholar]
- Stančin, H.; Mikulčić, H.; Wang, X.; Duić, N. A review on alternative fuels in future energy system. Renew. Sustain. Energy Rev. 2020, 128, 109927. [Google Scholar] [CrossRef]
- Amin, M.; Shah, H.H.; Bashir, B.; Iqbal, M.A.; Shah, U.H.; Ali, M.U. Environmental Assessment of Hydrogen Utilization in Various Applications and Alternative Renewable Sources for Hydrogen Production: A Review. Energies 2023, 16, 4348. [Google Scholar] [CrossRef]
- Reza, M.; Hannan, M.; Ker, P.J.; Mansor, M.; Lipu, M.H.; Hossain, M.; Mahlia, T.I. Uncertainty parameters of battery energy storage integrated grid and their modeling approaches: A review and future research directions. J. Energy Storage 2023, 68, 107698. [Google Scholar] [CrossRef]
- Rosen, M.A.; Koohi-Fayegh, S. The prospects for hydrogen as an energy carrier: An overview of hydrogen energy and hydrogen energy systems. Energy Ecol. Environ. 2016, 1, 10–29. [Google Scholar] [CrossRef]
- Keçebaş, A.; Kayfeci, M. Chapter 1—Hydrogen Properties. In Solar Hydrogen Production; Calise, F., D’Accadia, M.D., Santarelli, M., Lanzini, A., Ferrero, D., Eds.; Academic Press: Cambridge, MA, USA, 2019; pp. 3–29. [Google Scholar]
- Al-Fatesh, A.S.; Al-Garadi, N.Y.A.; Osman, A.I.; Al-Mubaddel, F.S.; Ibrahim, A.A.; Khan, W.U.; Alanazi, Y.M.; Alrashed, M.M.; Alothman, O.Y. From plastic waste pyrolysis to Fuel: Impact of process parameters and material selection on hydrogen production. Fuel 2023, 344, 128107. [Google Scholar] [CrossRef]
- Karduri, R.K.R.; Ananth, C. Hydrogen economy: Opportunities and challenges for a sustainable future. Int. J. Adv. Res. Basic Eng. Sci. Technol. (IJARBEST) 2020, 6, 69–76. Available online: https://www.ijarbest.com/journal/v6i2/2347 (accessed on 8 November 2024). [CrossRef]
- Singla, M.K.; Nijhawan, P.; Oberoi, A.S. Hydrogen fuel and fuel cell technology for cleaner future: A review. Environ. Sci. Pollut. Res. 2021, 28, 15607–15626. [Google Scholar] [CrossRef]
- Shah, R.K. Introduction to Fuel Cells. In Recent Trends in Fuel Cell Science and Technology; Basu, S., Ed.; Springer: New York, NY, USA, 2007; pp. 1–9. ISBN 978-0-387-68815-2. [Google Scholar]
- Chasta, G.; Himanshu, N.; Dhaka, M.S. A review on materials, advantages, and challenges in thin film based solid oxide fuel cells. Int. J. Energy Res. 2022, 46, 14627–14658. [Google Scholar] [CrossRef]
- Energy.gov. Hydrogen’s Role in Transportation. Available online: https://www.energy.gov/eere/vehicles/articles/hydrogens-role-transportation (accessed on 25 September 2024).
- Thomas, C.E. Fuel cell and battery electric vehicles compared. Int. J. Hydrogen Energy 2009, 34, 6005–6020. [Google Scholar] [CrossRef]
- Energy.gov. Fuel Cells. Available online: https://www.energy.gov/eere/fuelcells/fuel-cells (accessed on 24 April 2005).
- Muthukumar, M.; Rengarajan, N.; Velliyangiri, B.; Omprakas, M.A.; Rohit, C.B.; Raja, U.K. The development of fuel cell electric vehicles—A review. Mater. Today Proc. 2020, 45, 1181–1187. [Google Scholar] [CrossRef]
- Tanç, B.; Arat, H.T.; Baltacıoğlu, E.; Aydın, K. Overview of the next quarter century vision of hydrogen fuel cell electric vehicles. Int. J. Hydrogen Energy 2018, 44, 10120–10128. [Google Scholar] [CrossRef]
- Fueleconomy.gov. All-Electric Vehicles. Available online: https://www.fueleconomy.gov/feg/evtech.shtml#:~:text=Conventional%20gasoline%20vehicles%20only%20convert (accessed on 7 August 2024).
- Di Pierro, G.; Bitsanis, E.; Tansini, A.; Bonato, C.; Martini, G.; Fontaras, G. Fuel Cell Electric Vehicle Characterisation under Laboratory and In-use Operation. Energy Rep. 2023, 11, 611–623. [Google Scholar] [CrossRef]
- Energy Institute. Transport. Available online: https://www.energyinst.org/exploring-energy/topic/transport (accessed on 25 September 2024).
- Ahn, S.Y.; Kim, K.J.; Kim, B.J.; Hong, G.R.; Jang, W.J.; Bae, J.W.; Park, Y.K.; Jeon, B.H.; Roh, H.S. From gray to blue hydrogen: Trends and forecasts of catalysts and sorbents for unit process. Renew. Sustain. Energy Rev. 2023, 186, 113635. [Google Scholar] [CrossRef]
- Kaiwen, L.; Bin, Y.; Tao, Z. Economic analysis of hydrogen production from steam reforming process: A literature review. Energy Sources Part B Econ. Plan. Policy 2017, 13, 109–115. [Google Scholar] [CrossRef]
- IEA. Global Hydrogen Review 2023. Available online: https://www.iea.org/reports/global-hydrogen-review-2023#downloads (accessed on 24 April 2005).
- El-Emam, R.S.; Zamfirescu, C.; Gabriel, K.S. Hydrogen Production Pathways for Generation-IV Reactors. In Handbook of Generation IV Nuclear Reactors, 2nd ed.; Pioro, I.L., Ed.; Woodhead Publishing: Sawston, UK, 2023; pp. 665–680. ISBN 9780128205884. [Google Scholar]
- Dehshiri, S.S.H.; Firoozabadi, B. Building integrated photovoltaic with hydrogen storage as a sustainable solution in Iranian rural healthcare centers. Energy Convers. Manag. 2024, 314, 118710. [Google Scholar] [CrossRef]
- Chamazkoti, S.S.; Hajinezhad, A.; Moosavian, S.F. Feasibility study of a flexible hybrid energy model with power-hydrogen production in wastewater treatment plant. Energy Rep. 2024, 11, 3189–3201. [Google Scholar] [CrossRef]
- Rad, M.A.V.; Ghasempour, R.; Rahdan, P.; Mousavi, S.; Arastounia, M. Techno-economic analysis of a hybrid power system based on the cost-effective hydrogen production method for rural electrification, a case study in Iran. Energy 2019, 190, 116421. [Google Scholar] [CrossRef]
- Aboutalebi, G.R.; Khalili, M.; Jahangiri, M. Effect of temperature coefficient and efficiency of PV technologies on 3E performance and hydrogen production of On-Grid PV system in a very hot and humid climate. J. Sol. Energy Res. 2023, 8, 1715–1727. [Google Scholar]
- Kakavand, A.; Sayadi, S.; Tsatsaronis, G.; Behbahaninia, A. Techno-economic assessment of green hydrogen and ammonia production from wind and solar energy in Iran. Int. J. Hydrogen Energy 2023, 48, 14170–14191. [Google Scholar] [CrossRef]
- Ajanovic, A.; Sayer, M.; Haas, R. The economics and the environmental benignity of different colors of hydrogen. Int. J. Hydrogen Energy 2022, 47, 24136–24154. [Google Scholar] [CrossRef]
- Newborough, M.; Cooley, G. Developments in the global hydrogen market: The spectrum of hydrogen colours. Fuel Cells Bull. 2020, 2020, 16–22. [Google Scholar] [CrossRef]
- Arcos, J.M.M.; Santos, D.M.F. The Hydrogen Color Spectrum: Techno-Economic analysis of the available technologies for hydrogen production. Gases 2023, 3, 25–46. [Google Scholar] [CrossRef]
- Wilkinson, J.; Mays, T.; McManus, M. Review and meta-analysis of recent life cycle assessments of hydrogen production. Clean. Environ. Syst. 2023, 9, 100116. [Google Scholar] [CrossRef]
- Megía, P.J.; Vizcaíno, A.J.; Calles, J.A.; Carrero, A. Hydrogen Production Technologies: From Fossil Fuels toward Renewable Sources. A Mini Review. Energy Fuels 2021, 35, 16403–16415. [Google Scholar] [CrossRef]
- Mirnezami, S.R.; Cheraghlou, A.M. Wind power in Iran: Technical, policy, and financial aspects for better energy resource management. Energies 2022, 15, 3230. [Google Scholar] [CrossRef]
- Motahar, S. Harnessing Renewable Energy for Sustainable Employment: A Comparative Study with a Focus on Iran. Environ. Energy Econ. Res. 2024, 8, S091. [Google Scholar] [CrossRef]
- Alamdari, P.; Nematollahi, O.; Alemrajabi, A.A. Solar energy potentials in Iran: A review. Renew. Sustain. Energy Rev. 2013, 21, 778–788. [Google Scholar] [CrossRef]
- Khare, V.; Nema, S.; Baredar, P. Solar–wind hybrid renewable energy system: A review. Renew. Sustain. Energy Rev. 2016, 58, 23–33. [Google Scholar] [CrossRef]
- Makkiabadi, M.; Hoseinzadeh, S.; Taghavirashidizadeh, A.; Soleimaninezhad, M.; Kamyabi, M.; Hajabdollahi, H.; Nezhad, M.M.; Piras, G. Performance Evaluation of Solar Power Plants: A review and a case study. Processes 2021, 9, 2253. [Google Scholar] [CrossRef]
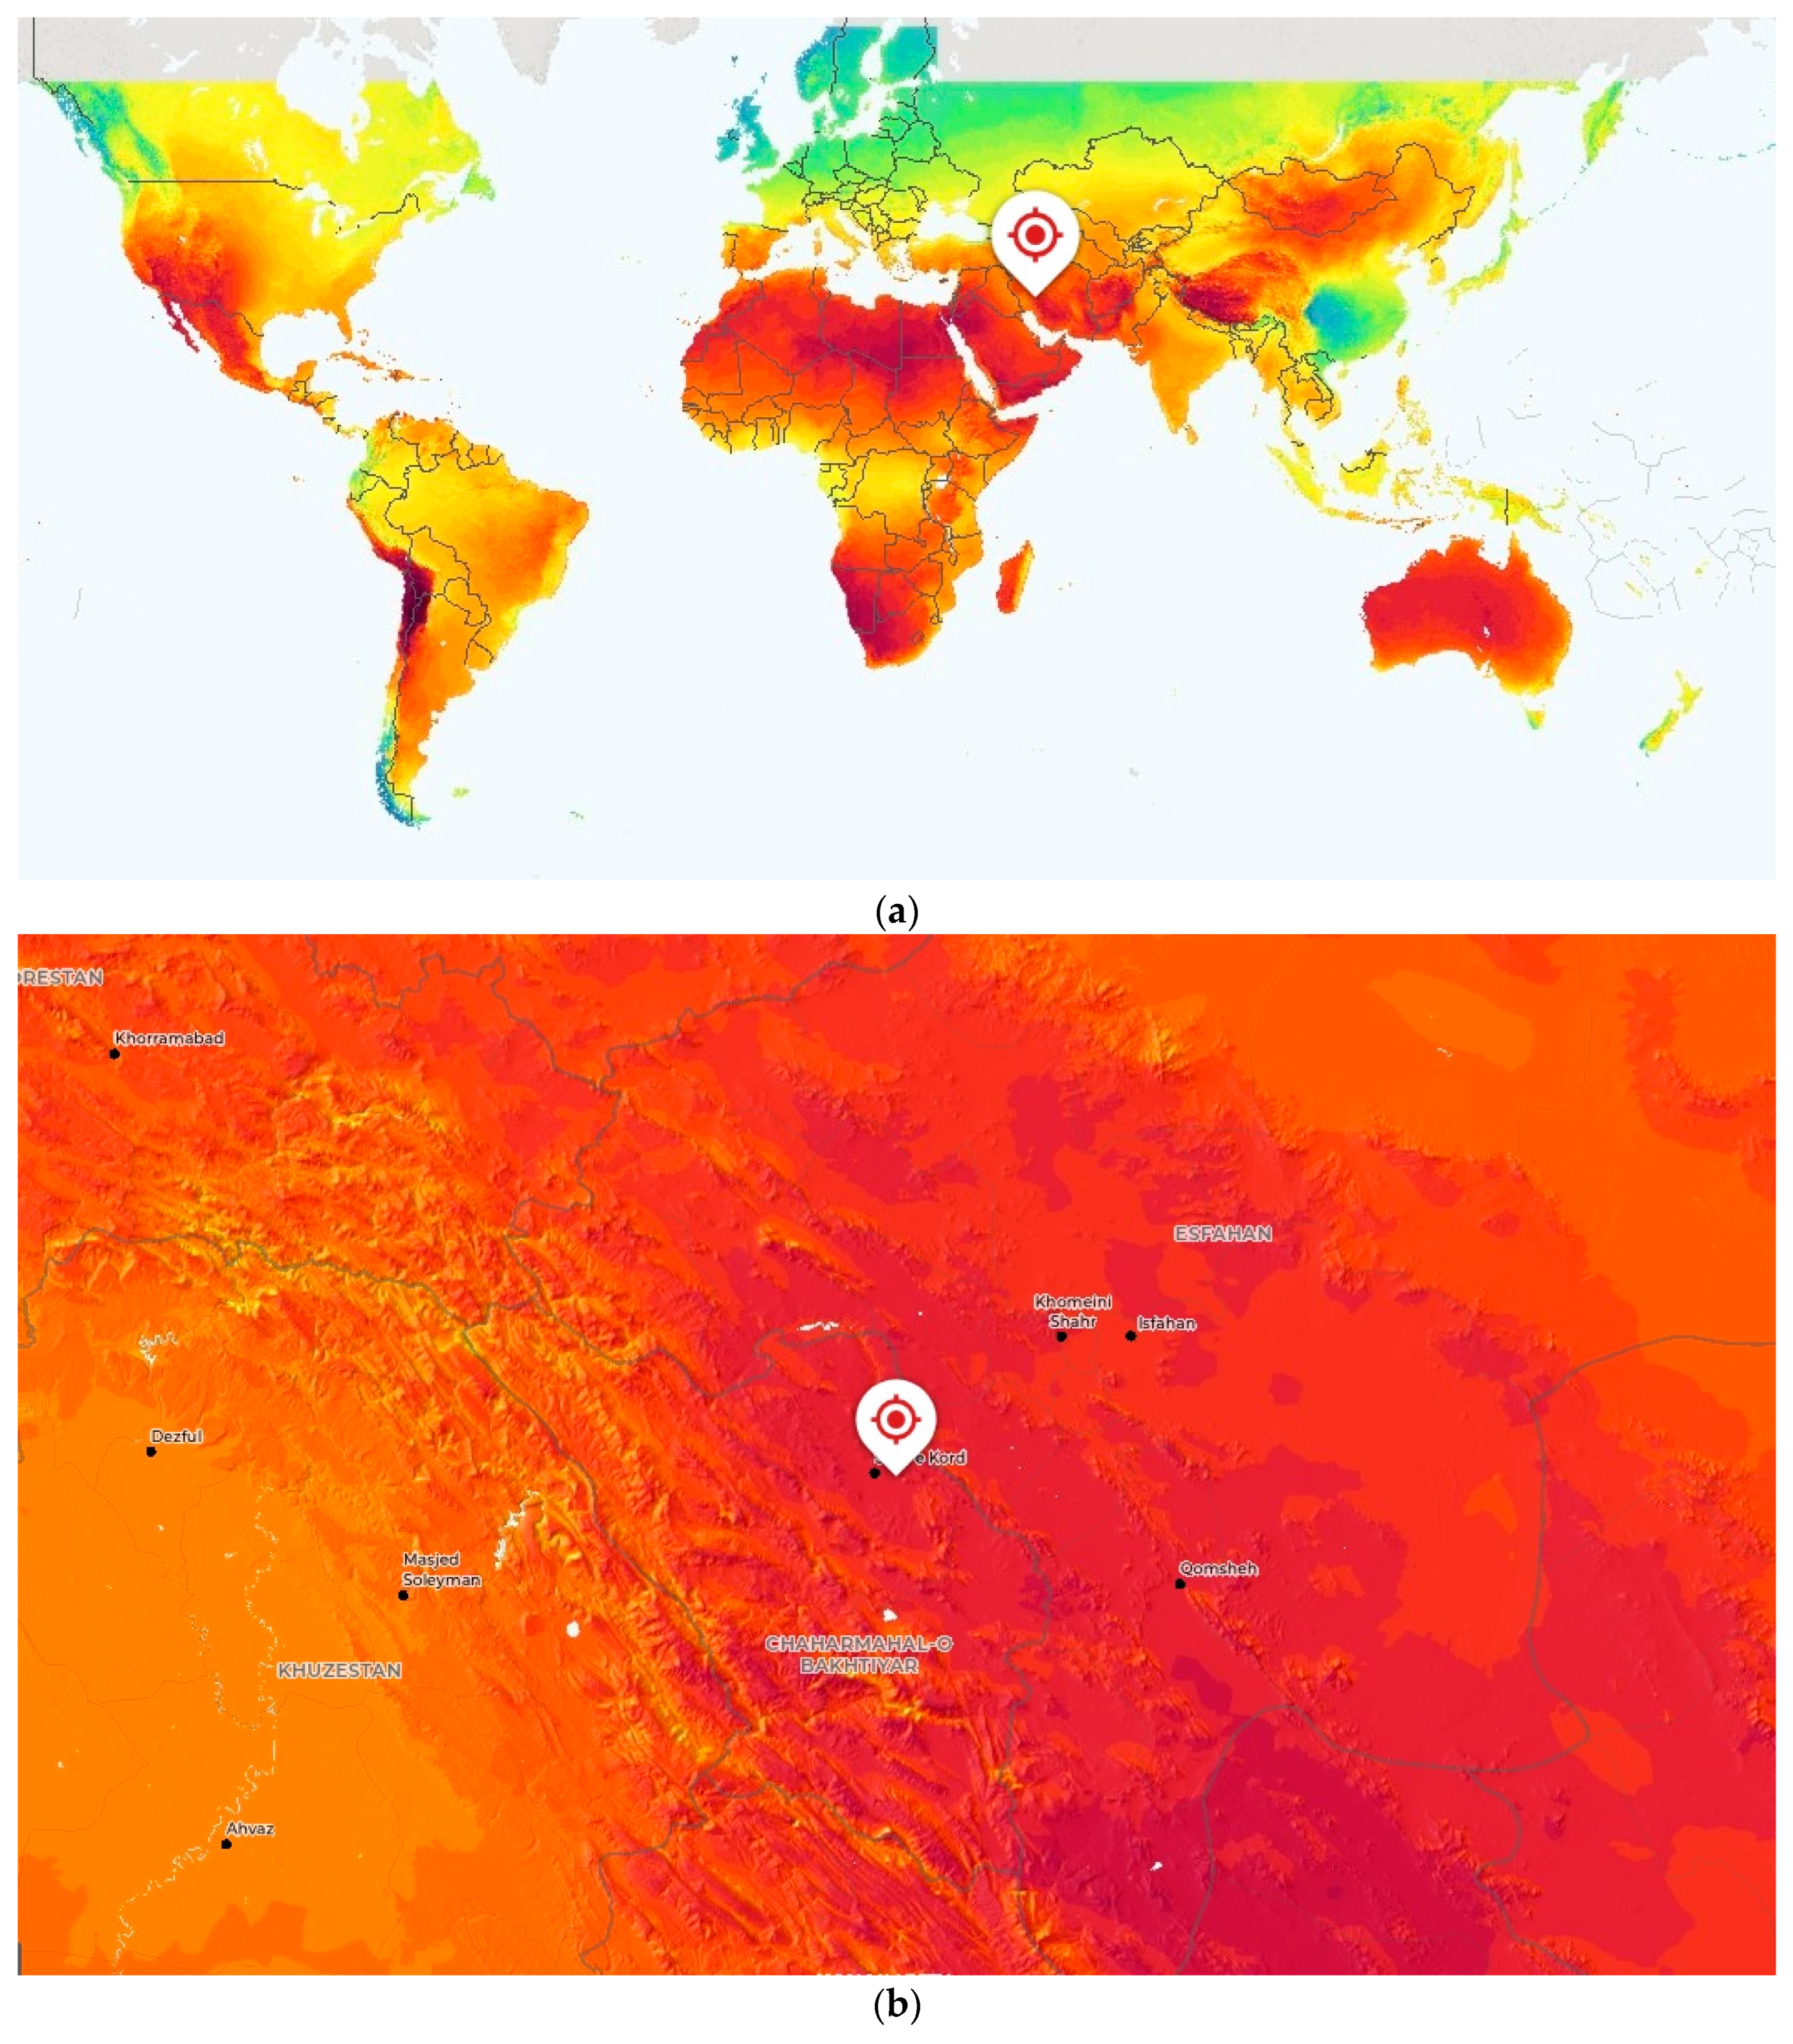
- Global Solar Atlas. Available online: https://globalsolaratlas.info/map?s=32.311556 (accessed on 24 April 2005).
- EIA. Iran. Available online: https://www.eia.gov/international/analysis/country/IRN (accessed on 24 April 2005).
- GlobalPetrolPrices.com. Iran Natural Gas Prices. Available online: https://www.globalpetrolprices.com/Iran/natural_gas_prices/ (accessed on 24 April 2005).
- Trading Economics. Iran Gasoline Prices. Available online: https://tradingeconomics.com/iran/gasoline-prices (accessed on 24 April 2005).
- Selina Wamucii. Iran Ethyl Alcohol Prices. Available online: https://www.selinawamucii.com/insights/prices/iran/ethyl-alcohol/ (accessed on 24 April 2005).
- Coal-Price.com. Coal Price Today. Available online: https://coal-price.com/ (accessed on 24 April 2005).
- Firouzjah, K.G. Assessment of Small-Scale Solar PV Systems in Iran: Regions Priority, Potentials and Financial Feasibility. Renew. Sustain. Energy Rev. 2018, 94, 267–274. [Google Scholar] [CrossRef]
- IRENA. Geopolitics of the Energy Transformation. Available online: https://www.irena.org/Digital-Report/Geopolitics-of-the-Energy-Transformation (accessed on 24 April 2005).
- Stangarone, T. South Korean Efforts to Transition to a Hydrogen Economy. Clean Technol. Environ. Policy 2020, 23, 509–516. [Google Scholar] [CrossRef]
- Turner, J.; Sverdrup, G.; Mann, M.K.; Maness, P.-C.; Kroposki, B.; Ghirardi, M.; Evans, R.J.; Blake, D. Renewable hydrogen production. Int. J. Energy Res. 2007, 32, 379–407. [Google Scholar] [CrossRef]
- Kharel, S.; Shabani, B. Hydrogen as a Long-Term Large-Scale energy storage solution to support renewables. Energies 2018, 11, 2825. [Google Scholar] [CrossRef]
- Ishaq, H.; Dincer, I.; Crawford, C. A review on hydrogen production and utilization: Challenges and opportunities. Int. J. Hydrogen Energy 2021, 47, 26238–26264. [Google Scholar] [CrossRef]
- Aza, K.; Erazo-Rondinel, A.A.; Li-Albrizzio, L.J.; Melgar, M.A.; Paucar-Espinoza, A.F. Choosing by advantages (CBA) to select the best location for a solar photovoltaic plant in the Pre-Feasibility stage. In Proceedings of the 31st Annual Conference of the International Group for Lean Construction, Lille, France, 26 June–2 July 2023; pp. 498–508. [Google Scholar] [CrossRef]
- Lopes, C.; Martino, D.; Bandeira, N.; Almeida, F. Decision support system for solar energy adoption. Renew. Energy Sustain. Dev. 2020, 6, 34. [Google Scholar] [CrossRef]
- Almutairi, K.; Mostafaeipour, A.; Jahanshahi, E.; Jooyandeh, E.; Himri, Y.; Jahangiri, M.; Issakhov, A.; Chowdhury, S.; Hosseini Dehshiri, S.J.; Hosseini Dehshiri, S.S.; et al. Ranking Locations for Hydrogen Production Using Hybrid Wind-Solar: A Case Study. Sustainability 2021, 13, 4524. [Google Scholar] [CrossRef]
- Brewer, J.; Ames, D.P.; Solan, D.; Lee, R.; Carlisle, J. Using GIS analytics and social preference data to evaluate utility-scale solar power site suitability. Renew. Energy 2015, 81, 825–836. [Google Scholar] [CrossRef]
- KalliOğlu, M.A. A regression model for finding optimal solar panel inclination angles. Int. J. Innov. Eng. Appl. 2023, 7, 182–187. [Google Scholar] [CrossRef]
- Al Garni, H.Z.; Awasthi, A. Solar PV Power Plants Site Selection. In Advances in Renewable Energies and Power Technologies; Yahyaoui, I., Ed.; Elsevier: Amsterdam, The Netherlands, 2018; pp. 57–75. ISBN 9780128129593. [Google Scholar]
- Carrasco, J.M.; Franquelo, L.G.; Bialasiewicz, J.T.; Galvan, E.; PortilloGuisado, R.C.; Prats, M.A.M.; Leon, J.I.; Moreno-Alfonso, N. Power-Electronic Systems for the grid Integration of renewable energy Sources: A survey. IEEE 2006, 53, 1002–1016. [Google Scholar] [CrossRef]
- Kaur, D.; Cheema, P.S. Software tools for analyzing the hybrid renewable energy sources: A review. In Proceedings of the 2017 International Conference on Inventive Systems and Control (ICISC), Coimbatore, India, 19–20 January 2017; pp. 1–4. [Google Scholar] [CrossRef]
- HOMER Energy Home Page. Available online: https://homerenergy.com/ (accessed on 25 September 2024).
- Sureshkumar, U.; Manoharan, P.S.; Ramalakshmi, A.P.S. Economic cost analysis of hybrid renewable energy system using HOMER. In Proceedings of the IEEE-International Conference on Advances in Engineering, Science and Management (ICAESM-2012), Nagapattinam, Tamil Nadu, India, 30–31 March 2012; pp. 94–99. [Google Scholar]
- Ch, S.B.; Satya Prasad, G.R.K.D.; Vijaya Kumar Reddy, K.; Saibabu, C. Integration of renewable energy sources in Zero energy buildings with economical and environmental aspects by using HOMER. Int. J. Adv. Eng. Sci. Technol. 2011, 9, 212–217. [Google Scholar]
- HOMER Grid. Available online: https://homerenergy.com/products/grid/index.html (accessed on 25 September 2024).
- Soukeyna, M.; Ramdhane, I.B.; Ndiaye, D.; Elmamy, M.; Menou, M.M.; Yahya, A.M.; Mahmoud, A.K.; Youm, I. Feasibility analysis of hybrid electricity generation system by HOMER for Mauritanian northern coast. Int. J. Phys. Sci. 2018, 13, 120–131. [Google Scholar] [CrossRef]
- Raji, L.; Zhigilla, Y.I.; Wadai, J. Using Homer software for cost analysis of Stand-Alone Power Generation for small scale industry in Nigeria: A case study Lumatec Aluminium Products. Int. J. Appl. Technol. Res. (IJATR) 2021, 2, 90–102. [Google Scholar] [CrossRef]
- Riayatsyah, T.M.I.; Geumpana, T.A.; Fattah, I.M.R.; Rizal, S.; Mahlia, T.M.I. Techno-Economic analysis and optimisation of Campus Grid-Connected hybrid renewable energy System using HOMER Grid. Sustainability 2022, 14, 7735. [Google Scholar] [CrossRef]
- Mostafaeipour, A.; Rezaei, M.; Jahangiri, M.; Qolipour, M. Feasibility analysis of a new tree-shaped wind turbine for urban application: A case study. Energy Environ. 2020, 31, 1230–1256. [Google Scholar] [CrossRef]
- Farzaneh, F.; Golmohammad, M. Iranian hydrogen production insight: Research trends and outlook. Hydrog. Fuel Cell Energy Storage 2021, 8, 23–33. [Google Scholar] [CrossRef]
- Jahangiri, M.; Soulouknga, M.H.; Bardei, F.K.; Shamsabadi, A.A.; Akinlabi, E.T.; Sichilalu, S.M.; Mostafaeipour, A. Techno-econo-environmental optimal operation of grid-wind-solar electricity generation with hydrogen storage system for domestic scale, case study in Chad. Int. J. Hydrogen Energy 2019, 44, 2861328628. [Google Scholar] [CrossRef]
- Yadav, B.K.; Yadav, R.; Jahangiri, M.; Priya, S.S.; Bajracharya, T.R.; Sudhakar, K. Decarbonizing airport using solar and wind farm: A case of Biratnagar, Nepal. E-Prime-Adv. Electr. Eng. Electron. Energy 2024, 8, 100583. [Google Scholar] [CrossRef]
- Jahangiri, M.; Abolhasani, M.; Noorbakhsh, S.M. The Potential of Renewable Energy Sources in Providing Sustainable Power for Natural Disaster Zones: TOPSIS Method for Gaziantep, Turkey. J. Sol. Energy Res. 2024, 9, 1887–1901. [Google Scholar]
- Hoarcă, I.C.; Bizon, N.; Șorlei, I.S.; Thounthong, P. Sizing design for a hybrid renewable power system using HOMER and iHOGA simulators. Energies 2023, 16, 1926. [Google Scholar] [CrossRef]
- Jahangiri, M.; Mostafaeipour, A.; Ghalishooyan, M.; Bakhtdehkordi, M. Evaluation of residential scale wind-solar electricity and hydrogen in Pakistan: Production capacity assessment. Sustain. Energy Technol. Assess. 2024, 71, 103971. [Google Scholar] [CrossRef]
- Keshavarzi, R.; Jahangiri, M. Synergizing Wind, Solar, and Biomass Power: Ranking Analysis of Off-Grid System for Different Weather Conditions of Iran. Energy Eng. 2024, 121, 1381–1401. [Google Scholar] [CrossRef]
- Mostafaeipour, A.; Jahangiri, M.; Haghani, A.; Dehshiri, S.J.H.; Dehshiri, S.S.H.; Issakhov, A.; Sedaghat, A.; Saghaei, H.; Akinlabi, E.T.; Sichilalu, S.M.; et al. Statistical evaluation of using the new generation of wind turbines in South Africa. Energy Rep. 2020, 6, 2816–2827. [Google Scholar] [CrossRef]
- Suryawan, I.W.K.; Sarwono, A.; Septiariva, I.Y.; Lee, C.H. Evaluating marine debris trends and the potential of incineration in the context of the COVID-19 pandemic in Southern Bali, Indonesia. J. Ilm. Perikan. Dan Kelaut. 2021, 13, 70–78. [Google Scholar] [CrossRef]
- Jahangiri, M.; Nematollahi, O.; Haghani, A.; Raiesi, H.A.; Alidadi Shamsabadi, A. An optimization of energy cost of clean hybrid solar-wind power plants in Iran. Int. J. Green Energy 2019, 16, 1422–1435. [Google Scholar] [CrossRef]
- Ribó-Pérez, D.; Herraiz-Cañete, Á.; Alfonso-Solar, D.; Vargas-Salgado, C.; Gómez-Navarro, T. Modelling biomass gasifiers in hybrid renewable energy microgrids; a complete procedure for enabling gasifiers simulation in HOMER. Renew. Energy 2021, 174, 501–512. [Google Scholar] [CrossRef]
- Yjc.ir. 13.9% Growth in Gasoline Consumption in Chaharmahal and Bakhtiari Region. Available online: https://www.yjc.ir/fa/news/8544169 (accessed on 25 September 2024).
- Rassafi, A.A.; Vaziri, M.; Azadani, A.N. Strategies for utilizing alternative fuels by Iranian passenger cars. Int. J. Environ. Sci. Technol. 2006, 3, 59–68. [Google Scholar] [CrossRef]
- Züttel, A. Hydrogen storage methods. Sci. Nat. 2004, 91, 157–172. [Google Scholar] [CrossRef]
- Yjc.ir. 15% Increase in Electricity Consumption in Chaharmahal and Bakhtiari. Available online: https://www.yjc.ir/fa/news/8461586 (accessed on 7 August 2024).
- Atash, F. The deterioration of urban environments in developing countries: Mitigating the air pollution crisis in Tehran, Iran. Cities 2007, 24, 399–409. [Google Scholar] [CrossRef]
- Alibaba.com. Big Capacity On Grid Solar Panel 1mw Solar Power Plant Panel System. Available online: https://www.alibaba.com/product-detail/Solar-Panel-Big-Capacity-On-Grid_60803692388.html?spm=a2700.galleryofferlist.p_offer.d_title.6a3a5339yneKr8&s=p (accessed on 7 August 2024).
- IRENA. Renewable Power Generation Costs in 2022. Available online: https://www.irena.org/Publications/2023/Aug/Renewable-Power-Generation-Costs-in-2022 (accessed on 7 August 2024).
- Kennedy, R. How long Do Residential Solar Inverters Last? Available online: https://www.pv-magazine.com/2021/09/16/how-long-do-residential-solar-inverters-last/ (accessed on 7 August 2024).
- Tan, V.; Dias, P.R.; Chang, N.; Deng, R. Estimating the lifetime of solar photovoltaic modules in Australia. Sustainability 2022, 14, 5336. [Google Scholar] [CrossRef]
- Alibaba.com. 1000kW Voltage And Frequency Converter 50hz To 60hz Three Phase Converter Pure Sine Wave Output. Available online: https://www.alibaba.com/product-detail/1000KW-Voltage-and-Frequency-Converter-50HZ_1600844717417.html?spm=a2700.galleryofferlist.normal_offer.d_title.7f2b7f3bsPgAIz (accessed on 7 August 2024).
- Alibaba.com. CE High Voltage Dc Power Supply 400v 2500a 1000k Igbt Type Rectiifer with Rs-485 For Hydrogen Generation. Available online: https://www.alibaba.com/product-detail/High-Voltage-DC-Power-Supply-400V_1601014204545.html?spm=a2700.galleryofferlist.p_offer.d_title.22bb6752sPXTkN&s=p (accessed on 7 August 2024).
- Feldman, D.; Ramasamy, V.; Fu, R.; Ramdas, A.; Desai, J.; Margolis, R. U.S. Solar Photovoltaic System and Energy Storage Cost Benchmark: Q1 2020. Nrel.gov. Available online: https://www.nrel.gov/docs/fy21osti/77324.pdf (accessed on 7 August 2024).
- Alibaba.com. High Quality Hydrogen Generators. Available online: https://www.alibaba.com/product-detail/High-quality-hydrogen-generators_60575074083.html?spm=a2700.galleryofferlist.normal_offer.d_title.797a60d6TrzbkF (accessed on 7 August 2024).
- Isa, N.M.; Das, H.S.; Tan, C.W.; Yatim, A.H.M.; Lau, K.Y. A techno-economic assessment of a combined heat and power photovoltaic/fuel cell/battery energy system in Malaysia hospital. Energy 2016, 112, 75–90. [Google Scholar] [CrossRef]
- Komarov, I.I.; Rogalev, A.N.; Kharlamova, D.M.; Naumov, V.Y.; Shabalova, S.I. Comparative analysis of the efficiency of using hydrogen and steam methane reforming storage at combined cycle gas turbine for cogeneration. J. Phys. Conf. Ser. 2021, 2053, 012007. [Google Scholar] [CrossRef]
- Spath, P.L.; Mann, M.K. Life Cycle Assessment of Hydrogen Production via Natural Gas Steam Reforming. Nrel.gov. Available online: https://www.nrel.gov/docs/fy01osti/27637.pdf (accessed on 7 August 2024).
- Statista. Iran: Inflation Rate from 1987 to 2029. Available online: https://www.statista.com/statistics/294320/iran-inflation-rate/ (accessed on 7 August 2024).
- Liao, G.; Wu, M. Photoreforming of lignocellulose into hydrogen. Innovation 2024, 1, 100047. [Google Scholar] [CrossRef]
- Zhu, H.; Gou, L.; Li, C.; Fu, X.; Weng, Y.; Chen, L.; Fang, B.; Shuai, L.; Liao, G. Dual interfacial electric fields in black phosphorus/MXene/MBene enhance broad-spectrum carrier migration efficiency of photocatalytic devices. Device 2024, 2, 100283. [Google Scholar] [CrossRef]
- Li, C.; Lu, H.; Ding, G.; Ma, T.; Liu, S.; Zhang, L.; Liao, G. Interfacial coordination bonds accelerate charge separation for unprecedented hydrogen evolution over S-scheme heterojunction. Chin. J. Catal. 2024, 65, 174–184. [Google Scholar] [CrossRef]
- Wan, C.; Liu, X.; Wang, J.; Chen, F.; Cheng, D.G. Heterostructuring 2D Co2P nanosheets with 0D CoP via a salt-assisted strategy for boosting hydrogen evolution from ammonia borane hydrolysis. Nano Res. 2023, 16, 6260–6269. [Google Scholar] [CrossRef]
- Li, R.C.; Zhang, X.Y.; Qu, Z.Y.; Liu, F.Y.; Xu, Q.Q.; Hu, Z.X.; Li, J.W.; Ghazzal, M.N.; Yu, J.L. One-step controlled electrodeposition nickel sulfides heterointerfaces favoring the desorption of hydroxyl groups for efficient hydrogen generation. Rare Met. 2024, 43, 4377–4386. [Google Scholar] [CrossRef]


| Equipment | Cost | Size | Other Information | ||
|---|---|---|---|---|---|
| Capital | Replacement | O&M | |||
| PV [91] | USD 440,000.00 | USD 440,000.00 | USD 7.70 per kW [92] | 1000 (kW) | Lifetime: 27.5 years [93] Derating factor: 80% [94] |
| Converter Inverter Rectifier | USD 15,000.00 [95] USD 45,000.00 [96] | USD 15,000.00 USD 45,000 | USD 0.05 per WDC [97] | 1000 (kW) | Efficiency: 98%, 90% Lifetime: 12.5 years [93] |
| Reformer [98] | USD 1,000,000.00 | USD 1,000,000.00 | 10,800 USD/year [99] | 1350 kg | Yield efficiency: 79.5% [100] Lifetime: 20 years [101] |
Disclaimer/Publisher’s Note: The statements, opinions and data contained in all publications are solely those of the individual author(s) and contributor(s) and not of MDPI and/or the editor(s). MDPI and/or the editor(s) disclaim responsibility for any injury to people or property resulting from any ideas, methods, instructions or products referred to in the content. |
© 2025 by the authors. Licensee MDPI, Basel, Switzerland. This article is an open access article distributed under the terms and conditions of the Creative Commons Attribution (CC BY) license (https://creativecommons.org/licenses/by/4.0/).
Share and Cite
Beigi Kheradmand, A.; Heidari Soureshjani, M.; Jahangiri, M.; Hamawandi, B. Comparative Techno-Economic Analysis of Gray Hydrogen Production Costs: A Case Study. Sustainability 2025, 17, 547. https://doi.org/10.3390/su17020547
Beigi Kheradmand A, Heidari Soureshjani M, Jahangiri M, Hamawandi B. Comparative Techno-Economic Analysis of Gray Hydrogen Production Costs: A Case Study. Sustainability. 2025; 17(2):547. https://doi.org/10.3390/su17020547
Chicago/Turabian StyleBeigi Kheradmand, Azam, Mahdi Heidari Soureshjani, Mehdi Jahangiri, and Bejan Hamawandi. 2025. "Comparative Techno-Economic Analysis of Gray Hydrogen Production Costs: A Case Study" Sustainability 17, no. 2: 547. https://doi.org/10.3390/su17020547
APA StyleBeigi Kheradmand, A., Heidari Soureshjani, M., Jahangiri, M., & Hamawandi, B. (2025). Comparative Techno-Economic Analysis of Gray Hydrogen Production Costs: A Case Study. Sustainability, 17(2), 547. https://doi.org/10.3390/su17020547