Article

Impact of Venture Capital on Urban Carbon Emissions: Evidence from the Yangtze River Delta Urban Agglomeration in China

1
College of Geography and Environment, Shandong Normal University, Jinan 250358, China
2
College of National Park and Tourism, Central South University of Forestry and Technology, Changsha 410004, China
*
Author to whom correspondence should be addressed.
Sustainability 2025, 17(2), 546; https://doi.org/10.3390/su17020546
Submission received: 17 December 2024 / Revised: 8 January 2025 / Accepted: 9 January 2025 / Published: 12 January 2025
(This article belongs to the Section Sustainable Urban and Rural Development)

Abstract

:
Venture capital is vital for developing capital markets and the low-carbon transformation of the economy. We used panel data from 27 cities in the Yangtze River Delta urban agglomeration from 2011 to 2022 to investigate how the scale and structure of venture capital influence the intensity of urban carbon emissions using spatial econometric models. We show that an increase in the scale of venture capital can inhibit the increase in the intensity of urban carbon emissions, and the effect is more pronounced in cities with higher pollution and better geographical location. Heterogeneity exists in the carbon-reduction effects of venture capital across industries. The direct carbon reduction effect of venture capital flowing to mid- and low-end industries is stronger and more prominent in cities with higher pollution and less favourable geographical locations. The long-term carbon reduction effect of venture capital flowing to high-end industries is stronger. The mediating effect of technological innovation is prominent, while the effect of industrial structure upgrade is not prominent. The enterprises’ willingness and ability to engage in green transformation acts as a positive moderator, whereas the positive moderating effect of the government in that respect is insufficient. This study clarifies the mechanism of venture capital on urban carbon emissions and offers valuable insights for optimising the structure and system of venture capital.

1. Introduction

In light of the challenges posed by global climate change, carbon emission reduction and neutrality have emerged as a universal consensus, with the control of carbon emissions recognised as critical for nations worldwide [1]. As one of the largest emitters of carbon dioxide globally [2], China faces challenges, including economic development, enhancement of public welfare, pollution mitigation, and ecological conservation. The country is committed to achieving peak carbon emissions by 2030 and carbon neutrality by 2060 [3]. Realising the “dual carbon” goals is China’s solemn commitment to the international community and a requirement to promote the transformation and upgrade of the economic structure, addressing issues related to resource, ecological, environmental, and climate constraints, and achieving high-quality development. To this end, China has actively driven the adjustment of industrial and energy structures, accelerated the promotion of green technological innovation and the application of advanced green technologies, established and improved an economic system for green, low-carbon, and circular development, and achieved remarkable results in terms of energy conservation and carbon reduction [4].
Realising China’s “dual carbon” targets necessitate a systemic transformation of its economic and social structures, influenced by multiple objectives and constraints. This endeavour encounters challenges, including the slow pace of energy substitution and structural adjustment, significant industrial inertia during transition processes, deficiencies in core technologies coupled with inadequate investment in technological innovation, and the need to balance carbon emission reductions with economic growth and fiscal stability, while reconciling overarching national interests with local priorities [5,6]. Achieving these goals requires robust policy support, institutional framework, and financial assurance. In August 2024, the Central Committee of the Communist Party of China, along with the State Council, issued the “Opinions on Accelerating Comprehensive Green Transformation in Economic and Social Development”, which explicitly stated that “based on forecasts from various research institutions, achieving carbon neutrality will require investments amounting to trillions of yuan”. Such an immense capital requirement underscores the necessity for innovative financial instruments and services to effectively mobilise societal funds. This is crucial for alleviating the financing constraints associated with carbon reduction initiatives, particularly green projects that demand higher risk tolerance and long-term funding commitments. Venture capital, which primarily targets start-ups with high growth potential for long-term equity investment, is a rapidly emerging financial instrument characterised by high risk tolerance, long-term investment horizons, and effective incentive mechanisms. These attributes align closely with the financing needs of the dual-carbon domain, thereby presenting significant potential. In a broader context, venture capital activity in China encompasses not only traditional venture capital events but also extends to high-risk and high-potential-return investment forms such as angel investment and private equity investment. Venture capital provides not only financial support to enterprises but also offer comprehensive assistance in management, market strategy, and technology development to the invested enterprises [7,8]. Analysing both the magnitude of the impact of venture capital on carbon emissions and its operational mechanisms provides valuable insights into its structural characteristics and environmental implications in China.
The Yangtze River Delta urban agglomeration is among the most dynamic regions for venture capital in China [9]. Characterised by a high concentration of energy consumption and carbon emissions [10], the region is critical for promoting green development while facilitating regional economic transformation and upgrade, thereby playing a key role in achieving the “dual carbon” objective. Consequently, this study focuses on the Yangtze River Delta urban agglomeration to investigate whether venture capital reduces urban carbon emissions. If such an effect exists, what are the mechanisms that facilitate the effect? Is there a spatial spillover effect and regional heterogeneity among cities?
To address these questions, this study employs panel data from 27 cities within the Yangtze River Delta urban agglomeration from 2011 to 2022 to assess both the influence and mechanisms through which venture capital scale and structure affect urban carbon emissions intensity. First, we elucidate the impacts of venture capital on urban carbon emissions theoretically and conduct an empirical analysis of its role in reducing a city’s local carbon emissions and its spillover effect on neighbouring cities. Second, we explore the pathways through which venture capital influences urban carbon emissions. Utilising a mediating effect model verifies technological innovation and industrial structural upgrade as mediators while examining how these mediating effects may vary over time. Furthermore, employing a moderating effect model facilitates an investigation into how enterprise and government entities’ intentions and capabilities regarding green development moderate the relationship between venture capital and carbon emissions intensity. Finally, we examine regional heterogeneity in capital’s impact on carbon emissions across different cities due to variations in geographic location, resource endowments, economic structures, and administrative hierarchies. Thus, this study enriches the environmental effect research of venture capital and provides empirical evidence for policymakers to optimise the venture capital system, improve the venture capital environment, and adjust the venture capital structure to effectively reduce carbon emissions.
The remainder of this paper is organised as follows. Section 2 presents a literature review and formulates the research hypotheses. Section 3 provides a detailed exposition of model construction, variable selection, and data sources. Section 4 presents the main findings, which include benchmark regression, robustness checks, heterogeneity analysis, and mechanism assessments. Section 5 concludes with policy suggestions.

2. Literature Review and Research Hypotheses

2.1. Research on the Effects of Venture Capital

In the context of the dynamic global economic environment and investment landscape, venture capital plays a significant role in fostering economic growth, technological innovation, industrial upgrade, and environmental sustainability. Consequently, research on the effects of venture capital has increased. Scholars have analysed the impact of venture capital on operational performance [11,12,13,14,15,16,17,18,19], technological advancement [20,21,22,23], industrial structure [24,25,26], and the green economy [27,28,29,30,31,32].
The relationships between venture capital and operational performance, industrial structure, and technological innovation have attracted significant scholarly attention. Studies on the influence of venture capital on operational performance have long been conducted. On the one hand, Barry et al. put forward the supervision theory in 1990 [11], and subsequently, Megginson and Weiss proposed the “certification hypothesis” in 1991 based on the theory of information asymmetry [12]. They contend that venture capital offers guidance and value-added services in multiple domains such as strategy, operations, and finance and that its participation can assist enterprises in establishing a favourable reputation during the initial public offering (IPO) process, thereby promoting corporate performance and reducing the underpricing rate of IPO. Numerous scholars have affirmed this theory from diverse perspectives. For instance, Kato and Tsoka demonstrated from the perspective of local small- and medium-sized enterprises that venture capital has supportive effects on multiple aspects, such as income growth, profitability, and return on assets [13]. Jiang et al. also verified the certification and supervision hypotheses from the perspective of small- and medium-sized enterprises [14].
Additionally, Otchere and Vong separately discussed the short- and long-term financial performance of enterprises, and both attested to the supervisory role of venture capital [15]. On the other hand, Amit et al. proposed the concept of “adverse selection” in 1990, maintaining that the principal–agent relationship between enterprises and venture capital institutions gives rise to information asymmetry issues [16]. When the listing or operational experience provided by a venture capital institution is incongruent with the actual situation of the company, it can trigger unreasonable listing prices and suboptimal long-term performance. An early report by Ber and Yafeh regarding the Israeli market proved that there was no significant difference in post-IPO performance between companies with and without venture capital backgrounds [17]. Tan et al. also discovered that the infusion of venture capital during the IPO process failed to effectively enhance enterprise value, and their research results support the adverse selection hypothesis [18]. Huang et al. focused on the growth management process of unlisted companies and found that the investment of a single venture capital institution can expedite the rapid growth of the company; however, when multiple venture capital institutions jointly invest in the same company, a decline in performance may occur [19].
As an innovative form of capital infusion, venture capitalists are highly correlated with innovation. Many studies on the relationship between venture capital and technological innovation have emerged, and scholars hold diverse conclusions that can be roughly categorised into three viewpoints: promotion, inhibition, and nonlinearity. Most scholars assert that venture capital can positively support innovation in enterprises or regions through multiple channels and mechanisms. Kortum and Lerner discovered in their early research in the United States that venture capital significantly enhanced the level of innovation [20]. Yi et al. demonstrated in their recent study in China that venture capital drives open innovation [21]. Conversely, some researchers contend that venture capitalists may be detrimental to innovation. For instance, Arvanitis and Stucki found that, regardless of the short- or long-term impact, venture capital failed to promote technological innovation [22].
Additionally, some scholars have proposed that a nonlinear relationship exists between venture capital and innovation levels. Through empirical analysis conducted on various provinces in China, Wen et al. found that as the investment scale expands, venture capital transforms from being initially disadvantageous for enterprise innovation to positively influencing it [23]. Considering that innovation is an essential condition and core driving force for industrial upgrade, the research on how venture capital affects innovation has further extended to its impact on industrial structure upgrade. In the early 21st century, Chary indicated that the development of venture capital was conducive to addressing industrial issues and played a significant role in industrial transformation and upgrading [24]. In recent years, an increasing number of scholars have verified the crucial contribution of venture capital to the sound development of high-tech industrial clusters [25]. Simultaneously, owing to features such as signal and resource allocation effects, venture capital can further facilitate the flow and distribution of financial resources, thereby promoting industrial upgrade. However, the promotion of venture capital to industrial upgrade is susceptible to factors such as the institutional environment, funding sources, and value-added services of venture capital. Hence, under the interaction of multiple factors, venture capital may negatively affect upgrading industrial structure. The empirical study conducted by Cao and Cao demonstrated that China’s current venture capital structure is not conducive to achieving effective industrial transformation and upgrade, and this phenomenon might be related to the government-led venture capital model in China [26].
In recent years, studies on the effects of venture capital have increasingly focused on green economic benefits and green innovation. In the realm of the influence of venture capital on green economic benefits, no academic consensus has yet been reached. Empirical studies by most researchers support the existence of a positive driving force. For instance, Romain and van Pottelsberghe contend that venture capital can facilitate the development of a green economy through two pathways: introducing new products and technologies and enhancing the capacity for knowledge absorption [27]. Nevertheless, scholars assert that this relationship is heterogeneous and should not be simply defined as linear. From the perspective of clean technology enterprises, Cha and Song conducted research indicating that different timings of venture capital intervention have a considerable influence on green economic growth [28]. Similarly, existing research on the relationship between venture capital and green innovation presents inconsistent findings. Through empirical analyses of 150 cities, Yang et al. demonstrated that high-quality human capital brought about by venture capital has a positive impact on green innovation within the region [29]. By contrast, Gaddy et al., who focused on venture capital in the clean technology industry, revealed that because of the difficulty of green technology innovation in this field and the low rate of return, relying solely on venture capital is insufficient to drive sound development [30]. From the perspective of institutional background, Dong et al. proved that venture capital led by the Chinese government may have a negative impact on green innovation due to factors such as poor control and erroneous choices; conversely, venture capital institutions from developed countries possess mature investment experience and can contribute to improving China’s green comprehensive system in this domain [31].

2.2. Research on the Influencing Factors of Carbon Emissions

Carbon emission is a broad and complex area of research. With the steady advancement of global carbon reduction efforts, existing research on the factors influencing carbon emissions is becoming increasingly abundant. These studies encompass a diverse range of financial elements, including, but not limited to, two-way foreign direct investment (FDI) [32,33,34,35,36], green finance [37,38,39,40], carbon finance [41,42], and digital finance [43], as well as non-financial elements, such as energy intensity [44], industrial structure [45], technological innovation [46], low-carbon policies [47], and human capital [48], which have an impact on carbon emissions.
The earliest research concerning the correlation between two-way FDI and carbon emissions was primarily founded on the viewpoints of the “pollution haven hypothesis” and the “pollution halo hypothesis”, exploring whether the investing regions transfer pollutants to the financing regions via the FDI route and whether FDI would bring about spillovers of knowledge and technology. With the advancement of carbon efficiency measurement methodologies, numerous scholars have conducted dual research on carbon emissions and carbon emission efficiency and probed the influence of inward FDI and outward FDI on carbon emissions through multiple mediating channels. Discourse on this subject has been continuous, and the empirical outcomes derived from distinct research perspectives and samples have exhibited marked disparities. Certain scholars contend that FDI can indirectly enhance carbon emission efficiency or curb the growth of carbon emissions through multiple pathways, such as facilitating industrial structure upgrading, promoting green technological innovation, and alleviating distortions in the factor market. Lee investigated the influence of FDI in G20 countries and discovered that FDI could constrain the increase in carbon emissions within the economy [32], and Zhu et al. utilised five ASEAN countries as their research sample, and their study indicated that FDI effectively restrained carbon emissions and supported the pollution halo hypothesis [33]. However, some scholars opine that the injection of FDI might lead to the expansion of the regional economic scale and escalation of energy intensity, thereby negatively impacting the local environment. Grimes and Kentor conducted a study on 66 less-developed countries and demonstrated a positive correlation between FDI and carbon emissions [34]. Nie et al. focused on countries along the Belt and Road, and their research likewise showed that the inflow of FDI exacerbated carbon emissions in the region, but this promotional effect abated as the economic conditions of the countries matured [35]. Additionally, Apergis et al. revealed that the impact of capital inflows from different regions on the environment of the same region varies [36].
With the emergence and ascendance of novel concepts such as green and carbon finance, along with the ratification of the Paris Agreement, global environmental consciousness is incrementally escalating. An increasing number of scholars have focused on the role of financial elements, such as the development of green finance in low-carbon transformations. As a crucial force propelling a comprehensive green and low-carbon transition, green finance steers capital towards domains such as energy conservation, environmental protection, low-carbon emissions reduction, clean energy, and green transportation, offering risk guarantees and financial support for the transformation of the energy structure and upgrading of the industrial structure, thereby indirectly facilitating sustainable green and low-carbon development. In research on the influence of green finance on carbon emissions, scholars such as Baştürk [37], Khan et al. [38], and Zhao et al. [39] explored the influence of diverse tools such as green bonds and green loans. Their research findings unanimously indicated that green finance can significantly mitigate carbon emissions and pointed out a certain degree of lag and feedback effect on the carbon emission effect. Scholars have asserted notable disparities in emission reduction efficacy among the types of green financial tools. Wang et al. contend that compared to green bonds, green loans are more capable of stimulating market vitality, thereby leading to a more pronounced carbon emission reduction effect [40].
Conversely, the concept of carbon finance is relatively narrow. It primarily concentrates on financial activities related to greenhouse gas emissions. Research on its impact on carbon emissions remains relatively scarce, mainly focusing on analysing the current development status of the carbon finance market and its influence on the industrial low-carbonisation process, specifically on low-carbon pilot areas [41,42].
Research on the influence of venture capital, an essential component of financial resources, on carbon emissions is scarce. In a 2022 study, Maiti regarded venture capital as a factor influencing carbon dioxide productivity, and the results indicated that it could enhance carbon dioxide productivity in both the early and late stages of venture capital [8]. Other than Maiti, Cappellari and Gucciardi selected carbon dioxide intensity as the explained variable, and their research findings demonstrated a significant negative correlation between venture capital and carbon dioxide emissions intensity [49].
Based on the synthesis of the aforementioned literature, it is evident that current research on the economic effects, innovation impacts, and industrial upgrading outcomes of venture capital is relatively abundant. However, investigations of its green effects remain insufficient, particularly regarding its impact on carbon emissions. Conversely, research concerning the financial factors influencing carbon emissions was initiated relatively early. FDI is focused on in early studies, while in recent years, other financial factors such as green investments and green bonds have gradually attracted scholarly attention. Nevertheless, as an important financial factor, venture capital has been addressed in limited studies regarding its influence on carbon emissions, with a notable lack of in-depth exploration of specific functional mechanisms. Therefore, this study adopts a venture capital perspective to investigate its action mechanism on carbon emissions reduction and regional heterogeneity (Figure 1). Simultaneously, we analyse the mediating roles of industrial structure upgrade and technological innovation in this process, as well as the moderating effects exerted by government and enterprise willingness and capabilities regarding green transformation.

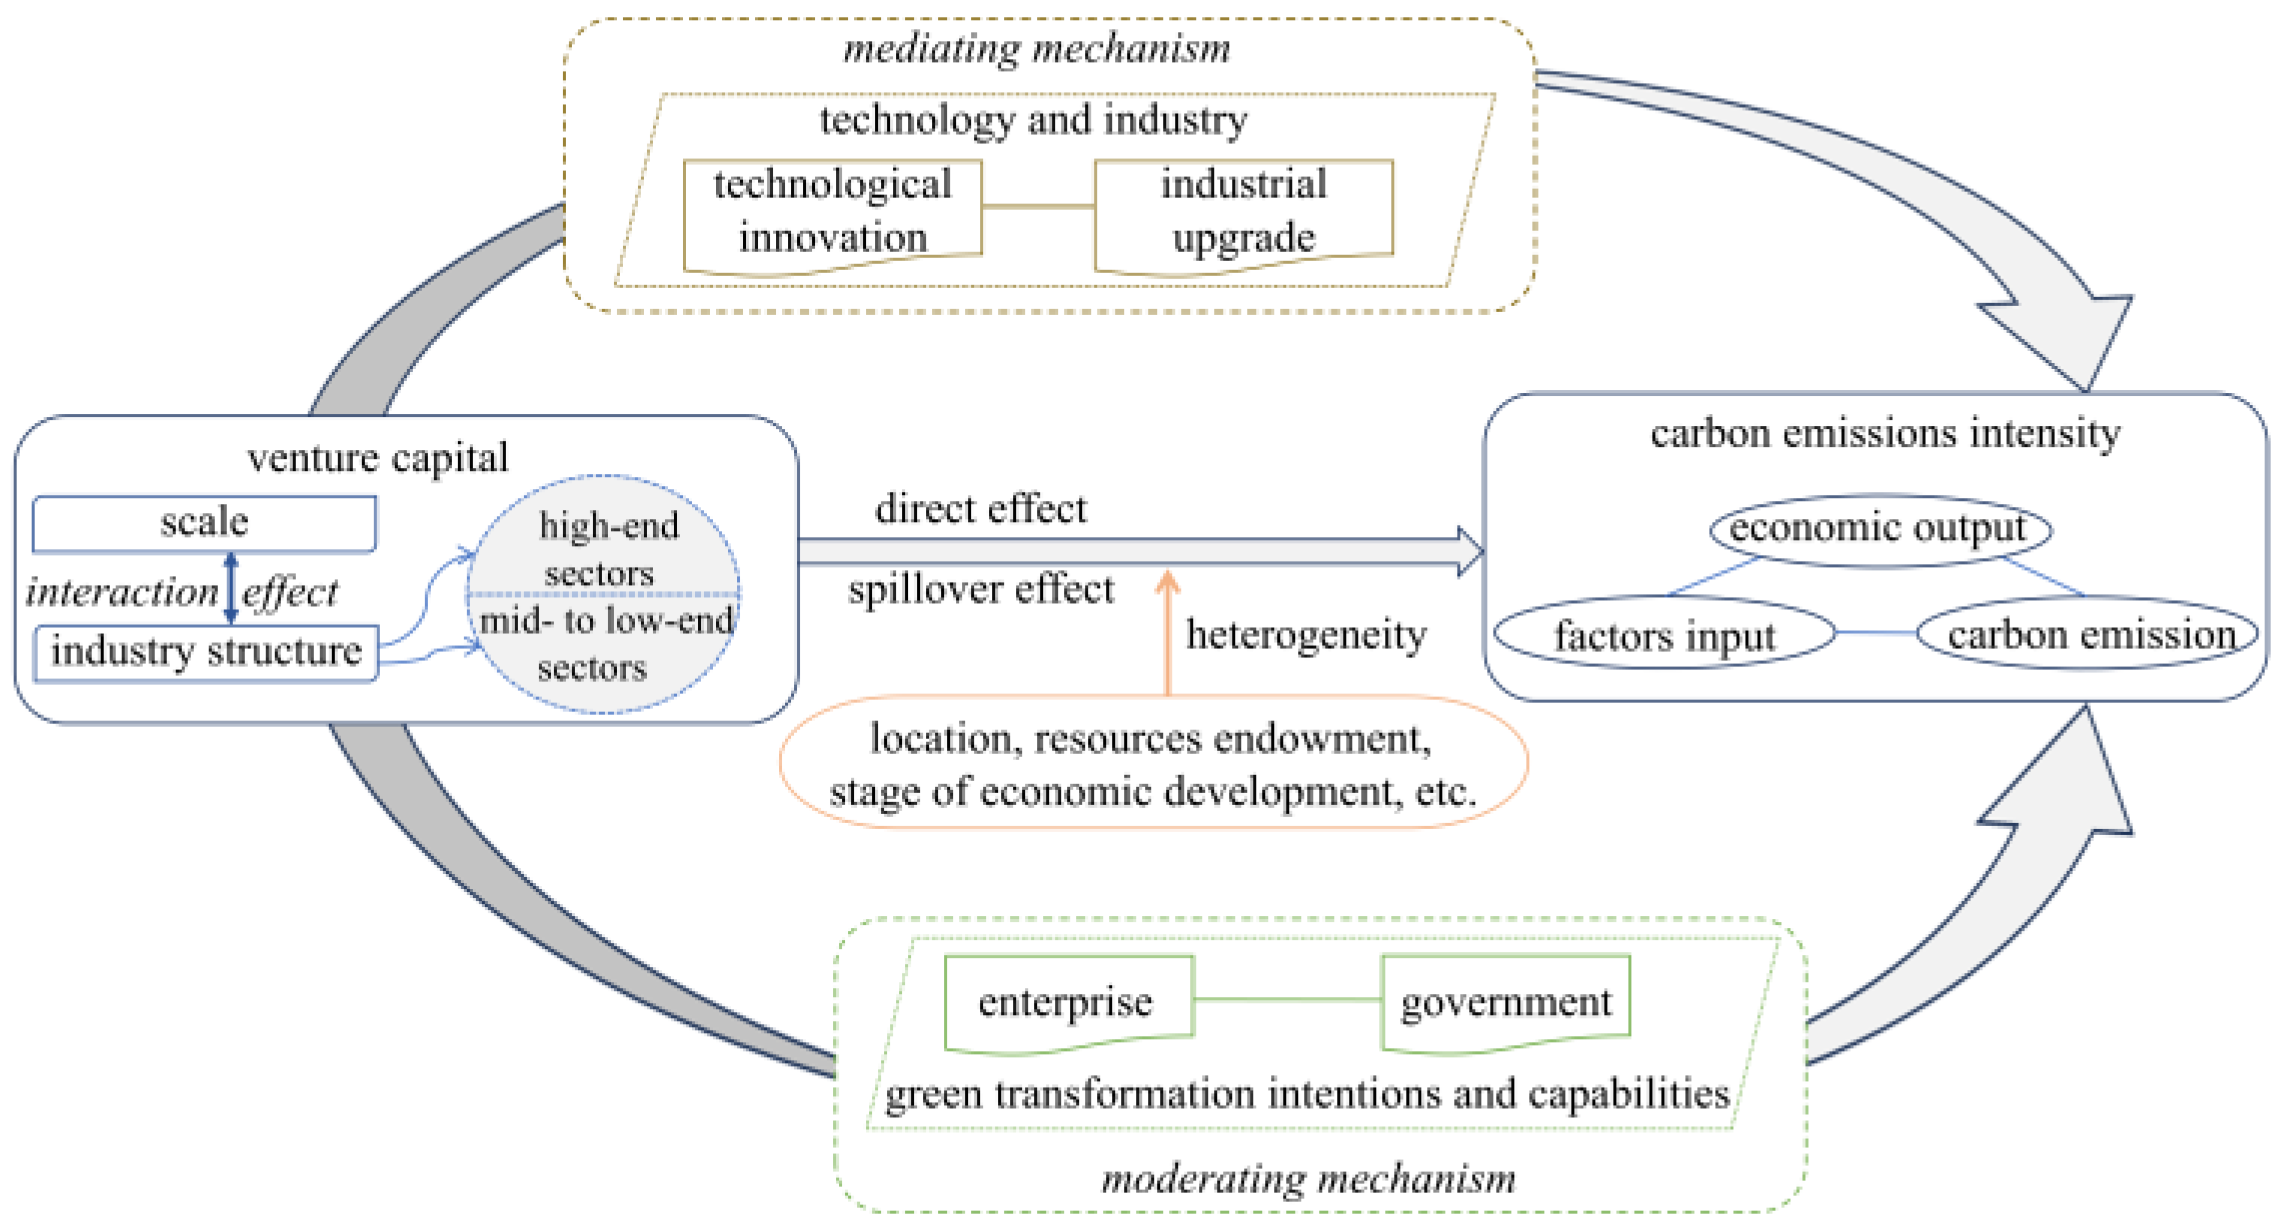
2.3. Research Hypotheses

2.3.1. Venture Capital and Urban Carbon Emissions

Venture capital plays a pivotal role in alleviating the financing constraints faced by enterprises, particularly small- and medium-sized enterprises [50]. Additionally, it facilitates the introduction of professional talent and advanced management practices that enhance production efficiency and organisational capabilities, thereby reducing both technological and managerial emissions. Thereby improving urban economic performance and carbon emission efficiency through mechanisms such as demonstration effects, industrial chain synergies, and economies of scale. Furthermore, venture capital is characterised by its value discovery and wealth demonstration effects. Its flexible financial products and services compel traditional financial institutions to improve their service quality and operational efficiency while enhancing their capacity to support the real economy. This optimisation of financial resource allocation ultimately leads to increased urban economic efficiency and reduced carbon emissions intensity. Moreover, owing to technological spillover effects, industrial linkages, and gradient transfers within industries, venture capital exhibits spatial spillover effects contributing to carbon emission reduction.
Additionally, considerable heterogeneity exists in the carbon emissions reduction effects and spatial spillover impacts of venture capital across various industries. Compared with traditional sectors, venture capital investments in high-end industries possess a greater capacity to drive industrial transformation and upgrade and instigate a chain reaction of changes within traditional industries through the integration of advanced technologies; thus, indirectly facilitating carbon emission reductions. Moreover, enhancements in the city’s local industrial structures occur alongside the relocation of low-end industries to lower-gradient cities—potentially leading to the emergence of “pollution havens”. Traditional sectors, such as resource- or labour-intensive industries, exhibit heightened sensitivity to carbon emissions. Thus, the direct impact of venture capital investments in these fields on carbon emissions reduction is more pronounced. They can further reduce the carbon emission intensity of adjacent economy-gradient cities through industrial linkages and technological spillover effects.
In summary, we propose Hypothesis H1 and H2:
H1. 
Venture capital can reduce urban carbon emissions intensity and presents spatial spillover effects.
H2. 
Venture capital investments in mid- to low-end sectors have a more pronounced direct impact on reducing carbon emissions.

2.3.2. The Mechanism of Venture Capital on Urban Carbon Emissions

As a distinct form of capital infusion, venture capital strongly correlates with innovation. As previously discussed, the existing literature articulates three perspectives on the relationship between these two entities: promotion, inhibition, and nonlinearity. Most scholars acknowledge the positive influence of venture capital in fostering innovation through mechanisms such as capital augmentation, resource aggregation, non-capital value-added services, industrial linkages, and knowledge spillovers. However, an increasing number of studies have recognised that the facilitative effect of venture capital on innovation is not unconditional. Factors such as the funding background, investment stage, organisational governance structure, exit strategies and venture capital timing may modulate the precise relationship between venture capital and technological innovation [51]. For example, Belloc’s empirical research demonstrates that state-owned risk capital tends to have a relatively limited impact on supporting technological innovation compared to its private counterparts [52].
On the one hand, venture capital drives industrial innovation by supporting technological innovation and utilising the Schumpeterian creative destruction effect as a medium to facilitate industrial transformation and upgrade. However, the process of industrial upgrade instigated by this creative destruction is contingent on the high efficiency of capital allocation processes and a competitive environment characterised by the survival of the fittest. Factors such as the funding background, pre-investment screening mechanisms, incentive structures, value-added services, and profit-seeking behaviours of venture capital significantly influence this industrial upgrading trajectory [53]. On the other hand, venture capital directs market financial resources towards increased allocations in high-tech manufacturing, green low-carbon economies, and digital economies, thereby continuously spawning emerging industries, novel business models, and innovative formats, which, in turn, promote structural adjustment along with transformation and upgrading within industries. Concurrently, technological innovation coupled with industrial upgrade mitigates carbon emissions intensity through mechanisms such as technological progress, resource conservation, agglomeration, and Kuznets-style structural optimisation effects, which are critical driving factors for achieving “dual-carbon” objectives [54]. In summary, we propose Hypothesis H3:
H3. 
Venture capital can reduce urban carbon emissions intensity through technological innovation and industrial upgrade.
Achieving the “dual carbon” objective requires a more effective engagement of the government in guiding the low-carbon behaviours of stakeholders through a constantly developing policy system covering finance, fiscal and taxation, investment and price, and also gives full play to the decisive role of market mechanisms in resource allocation to stimulate enterprises’ initiatives. As a public resource allocator, the government’s guidance and support in promoting low-carbon development can significantly influence the intensity of green investment implementation by venture capital institutions and enhance the willingness and internal motivation of investee enterprises to pursue green transformation. Ultimately, these policy measures, through effective incentive and constraint mechanisms, fully unlock the carbon emission reduction potential of venture capital. Enterprises, as market participants and microeconomic entities, are key players in energy consumption and major contributors to carbon dioxide emissions. Strengthening their capacity for green innovation will not only reduce their own carbon intensity but also promote structural optimisation within their industries alongside a transition towards greener energy systems. Therefore, reinforcing government guidance, coupled with active enterprise participation, will amplify the Schumpeterian creative destruction and Kuznetsian structural optimisation effects associated with venture capital, thereby positively influencing its efficacy in reducing carbon emissions. In summary, we propose Hypothesis H4:
H4. 
The willingness and capacity of both the government and enterprises to engage in green transformation significantly influence the effectiveness of venture capital in facilitating urban carbon emissions reduction.

2.3.3. The Regional Heterogeneity in the Effects of Venture Capital on Urban Carbon Emissions

Significant disparities exist among cities across various dimensions, including economic level, geographical location, resource endowment, energy production and demand, and population size. These differences may lead to multidimensional heterogeneity in the effects of reduced carbon emissions on venture capital. The intensity of pollutant emissions serves as an indicator of the environmental burden associated with each unit of newly created economic value. Variations in pollutant emission intensities among cities are influenced by differences in their stages of economic development, industrial structures, resource endowment, technological capabilities, and pollution-control capacities [55]. In high-emission-intensity cities, under a total quantity control system and the synergistic effects of pollution reduction and carbon mitigation efforts, capital investment, technology transfer, and management support provided by venture capital significantly enhance local production efficiency and technological advancement. However, these cities often face challenges, such as relatively outdated industrial structures and pronounced industrial lock-in effects. In addition, their institutional frameworks for energy pollution control and management capabilities tend to be insufficient. Consequently, the indirect impact of venture capital on carbon emissions reduction in high-tech industries is limited. Distance from the central city reflects the location of the city. The closer the distance, the more it can enjoy radiating effects such as scale economic benefits, technology spillover effects, and financial agglomeration spillover effects brought about by the central city. This facilitates a more thorough utilisation of the value-added services provided by venture capital. Therefore, we put forward hypothesis H5:
H5. 
The impact of venture capital on urban carbon emissions intensity reveals significant regional heterogeneity.

3. Data and Methods

3.1. Model Construction

To analyse the influence of venture capital on the intensity of urban carbon emissions and consider the interaction among various variables, a spatial econometric model was established. After a series of LR, LM and Wald test, we chose the Spatial Durbin Model (SDM) to surmount the constraints of the traditional ordinary least squares (OLS) regression model in spatial effect analysis. The econometric model is structured as follows:
C I i t = ρ W i t C I i t + a 1 V C S i t + β 1 W i t V C S i t + a 2 V C R i t + β 2 W i t V C R i t + a 3 V C S i t V C R i t + β 3 W i t V C S i t V C R i t + c N t = 1 N W i t C O N i t + μ i + γ i + ε i t
In this model, CIit represents the carbon emissions intensity of city i in period t, VCSit denotes the venture capital investment scale of city i in period t, and VCRit reflects the venture capital investment structure of city i in period t. Wit is an economic distance spatial weight matrix, ρ represents the spatial autocorrelation coefficient of the explained variable; a 1 , a 2 , and a 3 are the regression coefficients of the core explanatory variables and their interaction terms, while β 1 , β 2 , and β 3 are the spatial regression coefficients of the core explanatory variables and their interaction terms. cN is the regression coefficient of the control variable, and CONit represents the control variables of city i in period t. Furthermore, μ i represents city fixed effects, γ i represents time fixed effects, and ε i t represents the random disturbance term.
To further assess the mediating role of technological innovation (TECH) and industrial upgrade (IU), we developed a mediation effect model. The mediation effect model is as follows:
M E D i t = ρ W i t M E D i t + a 1 V C S i t + β 1 W i t V C S i t + a 2 V C R i t + β 2 W i t V C R i t + a 3 V C S i t V C R i t + β 3 W i t V C S i t V C R i t + c N t = 1 N W i t C O N i t + μ i + γ i + ε i t
  C I i t = ρ W i t C I i t + a 1 V C S i t + β 1 W i t V C S i t + a 2 V C R i t + β 2 W i t V C R i t + a 3 V C S i t V C R i t + β 3 W i t V C S i t V C R i t + a 4 M E D i t + β 4 W i t M E D i t + c N t = 1 N W i t C O N i t + μ i + γ i + ε i t
In the above equations, MED represents the mediating variable, which is TECH or IU.
Furthermore, to comprehensively examine the moderating effects of government green transformation willingness and capacity (GTI) as well as enterprise green transformation willingness and capacity (ETI), we constructed a moderation effect model. The moderation effect model is as follows:
C I i t = ρ W i t C I i t + a 1 V C S i t + β 1 W i t V C S i t + a 2 V C R i t + β 2 W i t V C R i t + a 3 V C S i t V C R i t + β 3 W i t V C S i t V C R i t + a 4 M O D i t + β 4 W i t M O D i t + a 5 V C S i t M O D i t + β 5 W i t V C S i t M O D i t + c N t = 1 N W i t C O N i t + μ i + γ i + ε i t
C I i t = ρ W i t C I i t + a 1 V C S i t + β 1 W i t V C S i t + a 2 V C R i t + β 2 W i t V C R i t + a 3 V C S i t V C R i t + β 3 W i t V C S i t V C R i t + a 4 M O D i t + β 4 W i t M O D i t + a 5 V C R i t M O D i t + β 5 W i t V C R i t M O D i t + c N t = 1 N W i t C O N i t + μ i + γ i + ε i t
In the above equations, MOD represents the moderating variable, which is GTI or ETI.

3.2. Variable Selection
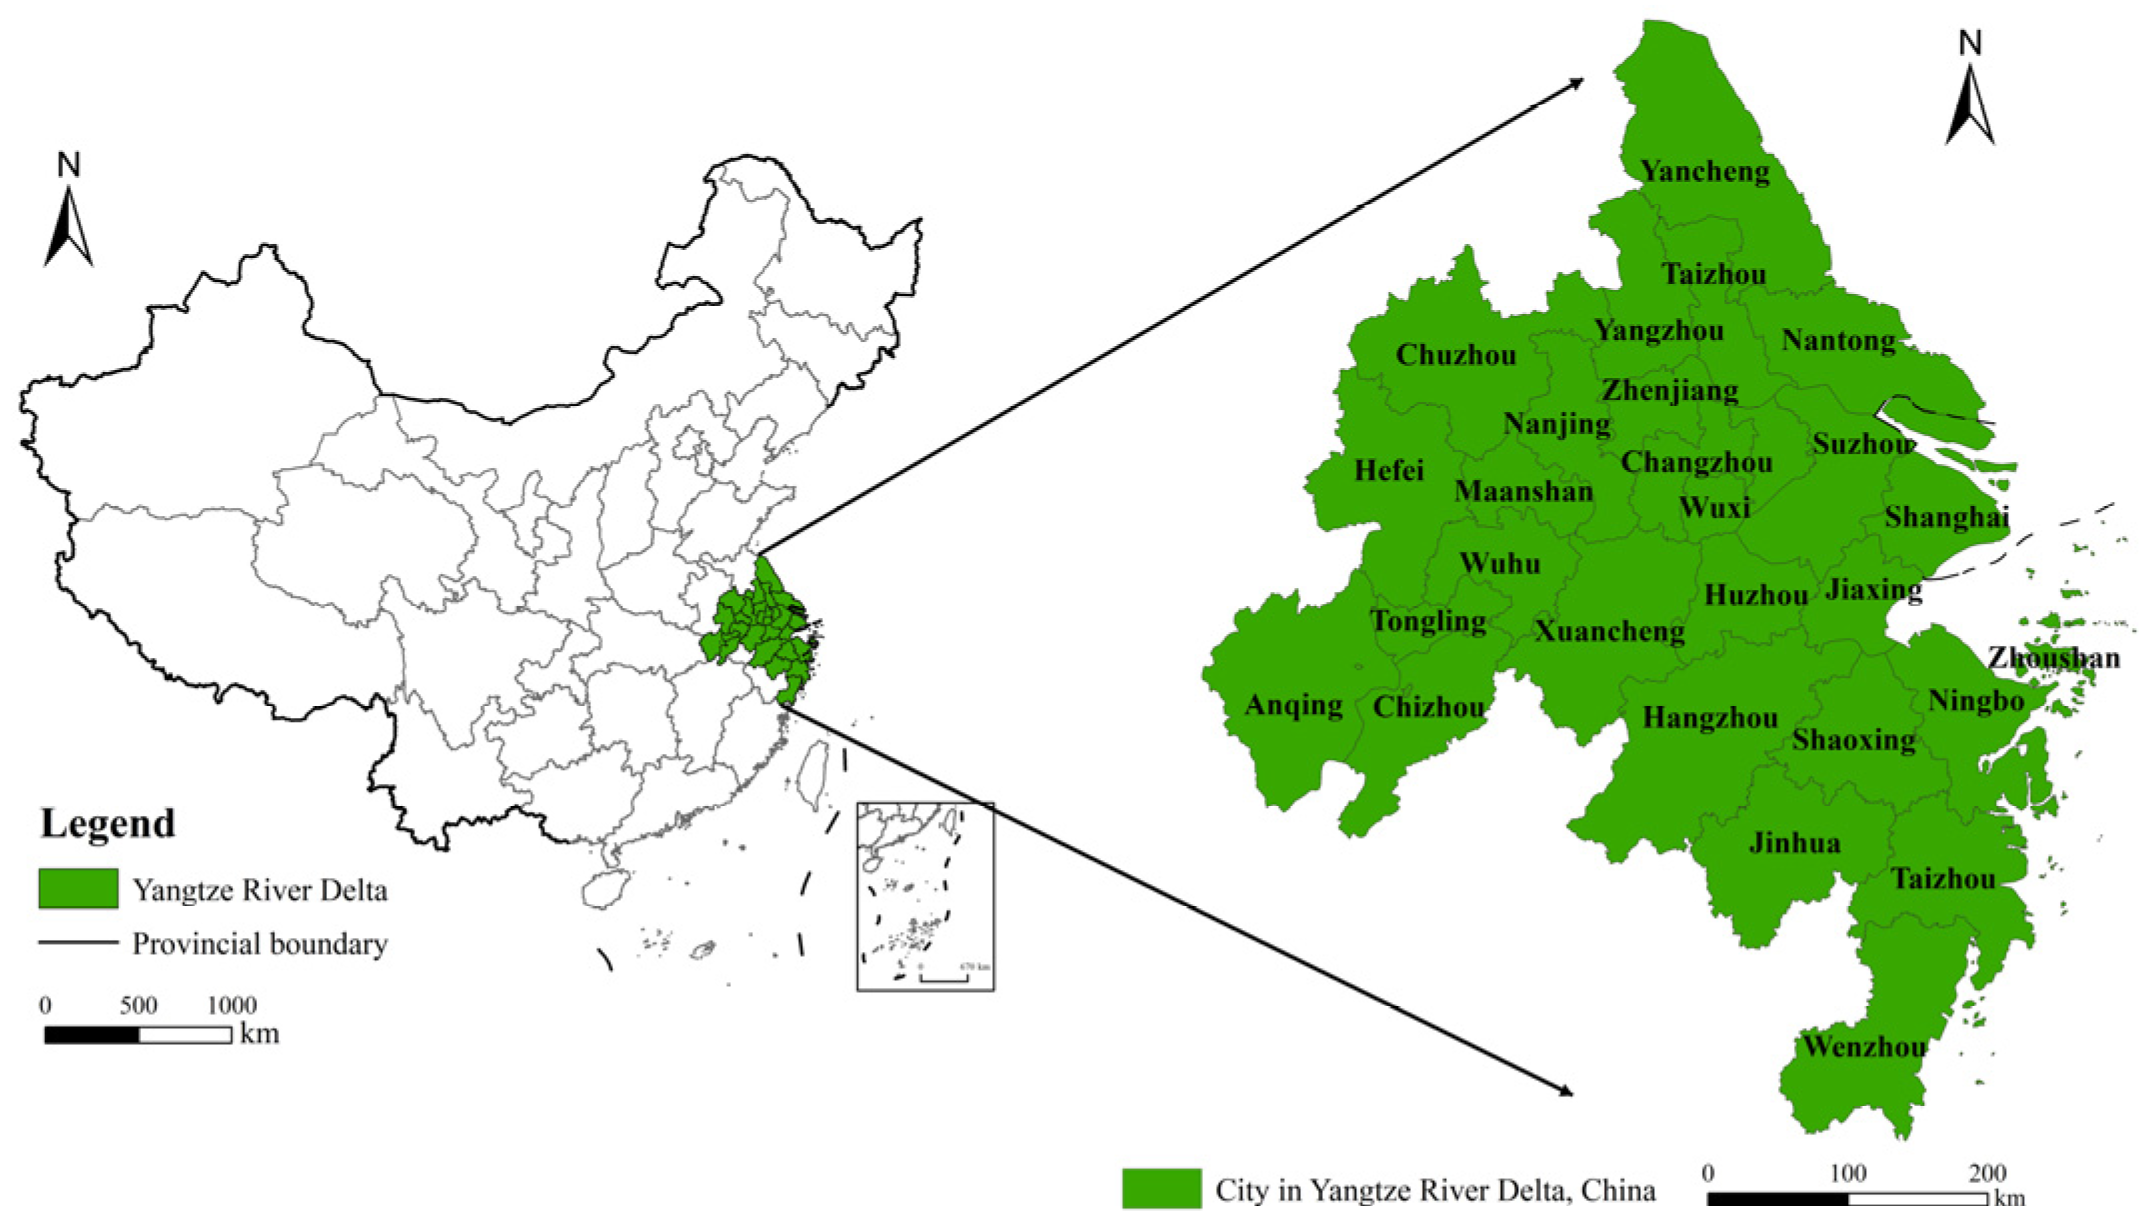
Dependent variable: Carbon emissions intensity (CI) is the amount of carbon dioxide emissions generated per unit of GDP growth. As a vital indicator for evaluating the progress of low-carbon development within a region, carbon emissions intensity provides a more nuanced understanding of the relationship between economic growth and carbon emissions than total carbon emissions.
Independent variables: This study evaluates the developmental status of venture capital across various cities from two perspectives: scale and structure. Specifically, it includes the scale of venture capital funds (VCS) and the internal industry structure of venture capital (VCR). VCS is quantified by the amount of venture capital financing. In addition, in categorising the industry structure, VCR1 denotes the proportion of venture capital investment in high-end sectors, such as advanced services and high-tech manufacturing, while VCR2 denotes the proportion invested in mid- to low-end sectors, including general manufacturing and services. The specific sectors within each category, classified according to the Zdatabase industry classification standard, are presented in Table 1.
Control variables: Government fiscal pressure, transportation resource allocation, urbanisation level, foreign direct investment, environmental regulation, and human capital were identified as control variables. Specifically, government fiscal pressure (FP) is represented by the ratio of general public budget expenditures to city revenues; transportation resource allocation (ROAD) is quantified by the per capita road area in square metres; urbanisation level (URBAN) is defined as the proportion of the permanent urban population relative to the total permanent population; foreign direct investment (FDI) is expressed as the ratio of foreign direct investment to GDP; environmental regulation (ER) is assessed through the frequency of terms related to “environmental protection” appearing in annual government work report of the 27 prefecture-level cities; and human capital (EDU) is indicated by the number of college students per hundred individuals. The rationales for selecting the aforementioned control variables are as follows. FP and ER influence the willingness and motivation of various entities within the city to pursue low-carbon transformation, which in turn affects the city’s energy consumption and carbon emissions. ROAD impacts urban transportation efficiency, thereby influencing carbon emissions. URBAN, FDI, and EDU significantly affect the development of industries within the city, thereby leading to the variations in energy consumption and carbon emissions.
Heterogeneity variables: The pollution emission intensity and geographical location were identified as heterogeneous variables. Specifically, the pollution emission intensity (PEI) was quantified by the emissions of industrial wastewater, sulphur dioxide, and particulate matter per unit of industrial added value. Geographical location (GL) is defined as the distance to the nearest central city, which refers to provincial capital cities or sub-provincial cities.
Mediating variables: The level of technological innovation and upgrading of the industrial structure were identified as mediating variables. Specifically, the technological innovation level (TECH) is represented by the number of newly granted invention patents, whereas industrial structure upgrade (IU) is assessed by the ratio of added value in the tertiary industry to that in the secondary industry.
Moderating variables: The green transformation intentions and capabilities of both the government and enterprises were identified as moderating variables. Specifically, the government’s transformation intentions and capabilities (GTI) are represented by the government’s green fiscal expenditures, whereas the green transformation intentions and capabilities of enterprises (ETI) are measured by the number of green patents held by them.

3.3. Study Area

The Yangtze River Delta urban agglomeration, one of China’s most vibrant, open and innovative zones, is centred on Shanghai and consists of the neighbouring provinces of Jiangsu, Zhejiang, and Anhui (Figure 2). It covers 27 cities with a resident population of nearly 200 million and generates over a fifth of the nation’s economic aggregates.
The venture capital market within the Yangtze River Delta urban agglomeration is notably vibrant, significantly enhancing regional innovation and fostering high-quality industrial development. However, the region also confronts substantial challenges in achieving low-carbon economic growth and addressing ecological environmental issues. Therefore, it is imperative to investigate the mechanisms through which venture capital affects carbon emissions in order to facilitate the achievement of carbon neutrality objectives in the region.

3.4. Data Description

The urban venture capital data were primarily sourced from the Zdatabase, which covers financing events in the broad spectrum of venture capital in China. The data collection period spans from 1 January 2011 to 31 December 2022, extracting all financing events within the Yangtze River Delta urban agglomeration. After excluding events with undisclosed financing entities or amounts, the venture capital scale and structure were analysed and calculated based on detailed information from each financing event, including the financing amount, time, and the sector of the financing entity.
The urban socioeconomic and environmental statistical data were primarily obtained from the statistical yearbooks of Shanghai, Jiangsu, Zhejiang, and Anhui provinces, as well as statistical bulletins of 27 prefecture-level cities. Additional sources include the China City Statistical Yearbook, China Energy Statistical Yearbook, China Industrial Statistical Yearbook, and China Environmental Statistical Yearbook. Missing statistical data were filled using linear interpolation.
Based on the acquired energy statistical data, provincial carbon emissions were estimated using the carbon emission accounting method outlined in the “2006 IPCC Guidelines for National Greenhouse Gas Inventories” by the Intergovernmental Panel on Climate Change (IPCC). Furthermore, urban carbon emissions were estimated by integrating DMSP-OLS and NPP-VIIRS nighttime light data [56,57]. DMSP-OLS data were obtained from the National Geophysical Data Center (NGDC) of the National Oceanic and Atmospheric Administration (NOAA), available at https://www.ngdc.noaa.gov/ (accessed on 19 March 2024). NPP-VIIRS data were acquired from the Earth Observation Group (EOG) of the Colorado School of Mines, accessible at https://eogdata.mines.edu/ (accessed on 19 March 2024).
The descriptive statistical characteristics of each variable are presented in Table 2. Given the non-stationarity of venture capital data, all variables were averaged using a three-year moving time window to address potential temporal fluctuations. Subsequently, all variables were subjected to logarithmic transformation, and continuous variables were winsorised at the 1st and 99th percentiles to mitigate the influence of extreme values on the empirical results.

4. Empirical Results

4.1. Benchmark Regression

Prior to conducting the basic regression analysis, unit root tests, multicollinearity tests were performed on each variable, and global spatial autocorrelation tests were performed on the dependent variable. Firstly, both the LLC and IPS methods were simultaneously adopted for the unit root tests to ensure the stationarity in the time series. The results are presented in columns (1)–(4) of Table 3, where the vast majority of variables remain stationary at the 1% significance level. Secondly, the VIF tests were utilised to evaluate the multicollinearity problem in the model. The specific results are shown in columns (5) and (6) of Table 3, with the VIF values of all variables being less than 10, indicating that there is no severe multicollinearity issue in the model.
Finally, a more practical economic geographical distance matrix for regional development was employed to conduct a global spatial autocorrelation test on the dependent variable. The results indicate (as shown in Table 4) that CI presents significant spatial autocorrelation in each time window.
To ensure the robustness of the model results, we selected the optimal model for analysis through relevant tests, and the findings are presented in Table 5. The LM and R-LM tests indicated that the LM error, LM lag, R-LM error, and R-LM lag all passed the 1% significance level. Consequently, it is preliminarily determined that the spatial Durbin model is appropriate for use. Further LR and Wald tests were conducted to assess whether the spatial Durbin model could degenerate into a spatial error model or a spatial lag model. Based on the test results, each p-value significantly rejects the null hypothesis; thus, the selection of the spatial Durbin model is warranted. Subsequently, a Hausman test was performed, which also significantly rejected the null hypothesis; therefore, a fixed effects model was adopted. To determine the type of fixed effects to be employed, LR test results concerning time and individual effects suggest that a two-way fixed effects model should be utilised. In summary, this study selects a two-way fixed spatial Durbin model to quantitatively analyse the impact of venture capital on carbon emissions intensity.
Based on the benchmark regression results (Table 6), the influence coefficient of VCS in Column (1) is significantly negative at the 1% significance level, indicating that a 1 percentage point increase in VCS corresponds to a 0.023 percentage point decrease in carbon emissions intensity. This is primarily attributed to the capital support and a range of value-added services brought by venture capital, which have effectively improved the production efficiency of enterprises and their associated industrial clusters. Its influence coefficient remains negative although not statistically significant in Column (2). However, its spatial spillover effect coefficient is positive but not significant. This suggests that an increase in venture capital funding shows mixed spillover effects on economically adjacent cities. This complexity may arise from the fact that the technological spillover effects and industrial linkage spillover effects resulting from venture capital activities differ significantly across cities at varying stages of economic development. For cities at a relatively lower economic development level in the growth stage, the homogeneous industrial competition among them is more fierce, leading to predominantly negative spillover effects. Hence, Hypothesis H1 is confirmed.
With respect to the structure of venture capital, both the influence coefficient and spatial spillover effect coefficient for VCR1 are significantly positive at the 10% significance level, whereas VCR2’s influence coefficient is significantly negative at the 5% significance level, and its spatial spillover effect is also negative. This indicates that investments directed towards middle- and low-end industries, such as general manufacturing and services, are more conducive to carbon emissions reduction. The higher potential for carbon emissions reduction in these sectors, such as raw materials and resource processing, renders the direct effects from venture capital inflows into these industries through enhanced production efficiency and energy utilisation, which is particularly pronounced. Furthermore, this investment improves carbon emissions efficiency across adjacent economy-gradient regions through industrial linkages and technological spillovers. Conversely, venture capital allocated to high-end services and high-tech manufacturing tends to promote carbon emissions reduction primarily through indirect mechanisms such as industrial transformation and upgrading, along with technological spillovers; however, these pathways typically exhibit longer timeframes to achieve measurable impacts on emissions reduction.
Additionally, investments in subdivided fields, such as green cleaning and low-carbon technologies, remain relatively limited and further reduce the effectiveness of high-end industry venture capital in reducing emissions (Figure 3). Moreover, the upgrade of the venture capital structure will facilitate improvements in industrial composition, along with heightened environmental awareness among stakeholders. Consequently, under the influence of industrial gradient transfers coupled with competitive environmental regulations, there may be an increase in carbon emissions intensity within neighbouring economies. Therefore, this study substantiates Hypothesis H2.
Analysis of the interaction terms revealed that the interaction term between VCS and VCR1 is significantly negative at the 5% significance level, whereas the interaction term between VCS and VCR2 is positive. The findings indicate that there is a certain synergy between the increase in VCR1 and the expansion of VCS. Conversely, there is a substitution effect between the increase in VCR2 and VCS expansion, which is particularly pronounced in city groups with the highest financing scales. These results suggest that, from a long-term development perspective, achieving synchronised development of scale expansion and structure upgrade of venture capital yields greater benefits for carbon emissions reduction. Specifically, for cities with favourable financing conditions, it is essential to actively guide venture capital funds towards high-end sectors, such as low-carbon environmental protection, electronic information technology, and the digital economy.

4.2. Robustness Test

The robustness of the research findings was validated through the use of alternative spatial lag terms, model specifications, and weights. Table 7 presents the results of the robustness tests. Specifically, we employed the following three approaches: (1) incorporating all relevant variables with a one-period lag; (2) substituting the core explanatory variable VCS with the number of venture capital events; (3) replacing the original economic distance matrix with a geographical-economic nested distance matrix. The results indicate that the signs of the coefficients for VCS, VCR1, and VCR2 remain consistent with those from the benchmark regression, and the magnitude of these coefficients is similar. Additionally, the synergy effect between VCS and VCR1, as well as the substitution effect between VCS and VCR2, remains significant. This suggests that after accounting for alternative spatial lags, model specifications, and weights, the signs of the primary explanatory variables do not change, and the overall results align with those of the benchmark model, thereby confirming the robustness of our empirical findings.

4.3. Heterogeneity Analysis

4.3.1. Urban Pollution Emission Intensity Heterogeneity

This study investigated whether the PEI across different cities has differential impacts on the carbon reduction effects of venture capital. The pollution emission intensity for each city in the Yangtze River Delta region was calculated using the following equation:
P E I i t = ( i = 1 n I W i t n + i = 1 n I S O 2 i t n + i = 1 n I F i t n ) / i = 1 n I G D P i t n  
In Equation (6), PEIit indicates the pollution emission intensity for city i in period t, IW refers to industrial wastewater discharge, ISO2 signifies industrial sulphur dioxide emissions, IF represents industrial particulate emissions, and IGDP reflects industrial added value.
We categorised the 27 cities into three groups based on their numerical values of PEI: low, medium, and high. Table 8 presents the results of the econometric models for each category.
The research findings indicate that in cities with higher PEI, the expansion of VCS exerts a more significant inhibitory effect on the increase in carbon emissions intensity. This phenomenon may be attributed to the substantial pressure and potential for carbon reduction faced by governments, enterprises, and other stakeholders in highly polluted cities. Consequently, the fundraising capabilities, benefit generation, and facilitation of the high-tech achievement transformation associated with venture capital are perceived as effective strategies for carbon mitigation, thereby amplifying their overall impact on emission reduction. Furthermore, in cities characterised by relatively elevated PEI levels, the carbon reduction effect of VCR2 was also pronounced. This can be explained by the lower industrial structural tiers of these cities, where traditional industries, particularly those that are heavily polluting and energy-intensive, constitute a larger share. Thus, an increased proportion of venture capital directed towards traditional sectors enhances its efficacy in reducing carbon emissions intensity. However, VCR1 demonstrated a significant carbon reduction effect solely within the medium-pollution city groups. This may stem from low-pollution cities experiencing diminished pressure and potential for emission reductions alongside typically more advanced industrial structures, leading to an underutilisation of the benefits derived from optimising and upgrading venture capital structures. To address this, low-pollution cities can initiate pilot programs to broaden the scope of enterprises subject to emission controls within the carbon market. Additionally, by establishing venture capital guidance funds and other supportive measures, these cities can encourage greater venture capital investment in innovative and high-growth green enterprises, thereby fostering the development of a zero-carbon economy. Moreover, high-pollution cities must prioritise addressing the challenges associated with the green transformation of traditional industries. In view of this, local governments in cities with high PEI should enhance their environmental governance capabilities and enforcement power to fully unlock the potential of venture capital for carbon reduction. Concurrently, higher-level governments should increase green fiscal support for these cities and bolster support for enterprise technological transformation, thereby promoting green transitions and sustainable development.

4.3.2. Urban Geographical Location Heterogeneity

This study investigated whether the GL of different cities has a differential impact on the effects of reduced carbon emissions on venture capital. To this end, we calculated the distances between each city and its nearest central city and subsequently categorised the 27 cities into three groups based on these distances: short, medium, and far. The results of the heterogeneity tests are presented in Table 9.
The research findings indicate that as the distance from a central city increases, the inhibitory effect of VCS on carbon emissions intensity diminishes, along with a corresponding decrease in statistical significance. This phenomenon may be attributed to the fact that greater distances reduce the radiation and spillover effects experienced by cities, thereby diminishing the overall efficiency of venture capital utilisation. It is recommended that peripheral cities actively collaborate with central cities to establish regional cooperation platforms, promote joint efforts in the research, development, and application of low-carbon technologies, and enhance the utilisation efficiency of venture capital and the technology spillover effects in peripheral regions. Moreover, the reduction in carbon emissions by VCR2 is more pronounced in medium- to long-distance cities but is not evident in nearby cities. This observation likely arises from the enduring prominence of general manufacturing industries within the economic systems of cities with less favourable locational conditions, particularly concerning regional division and positioning. Consequently, these regions face heightened pressure and motivation for green transformation in their general manufacturing sectors. Therefore, these cities should, based on their resource endowments, industrial foundations, and market demands, actively guide venture capital towards manufacturing enterprises that exhibit a strong willingness to transform, possess significant potential, demonstrate excellent performance, and align with industrial positioning.

4.4. Analysis of Impact Mechanisms

4.4.1. Mediating Effect Test

This study examined the influence of venture capital on carbon emissions through the mediating effects of TECH and IU. The regression results are presented in Table 10.
In Column (1), the coefficient representing the impact of VCS on TECH is positive and statistically significant at the 5% level. In Column (5), both VCS and TECH significantly mitigate the increase in carbon emissions intensity, indicating that VCS can effectively reduce urban carbon emissions intensity through the mediating channel. Economically speaking, a 1-unit increase in VCS corresponds to a 0.0678-unit rise in TECH; conversely, a 1-unit increase in TECH results in a reduction in carbon emissions intensity by 0.0574 units. Thus, each unit increment in VCS led to a decrease of 0.0039 units in the carbon emissions intensity via TECH, with this mediating effect accounting for 16.99%. In Column (2), VCR2’s influence on TECH is positive and significant at the 1% level.
Furthermore, as shown in Column (6), both VCR2 and TECH suppress the growth in carbon emissions intensity across various significance levels. However, because of the substitution effect between VCS and VCR2, the effect of VCS on enhancing TECH is not statistically significant, as shown in Column (2). Nonetheless, its Sobel statistic value stands at −9.331 and is significant at the 1% level. Moreover, the indirect effect of VCS is statistically significant at the 1% level under the Bootstrap test, with a confidence interval that excludes 0, confirming that this mediating effect is robust. Both VCS and VCR2 contribute to reducing the intensity of urban carbon emissions through the mediating channel of TECH.
In Columns (3) and (4), only VCR1 exhibits a significant positive effect on IU. However, in Column (7), neither VCR1 nor IU demonstrated a statistically significant inhibitory effect on carbon emissions intensity. This suggests that, at present, venture capital has not effectively reduced carbon emissions through the mediating channel of IU. This situation is linked to the prevailing government-led model of venture capital development, which engenders challenges such as budgetary soft constraints, principal-agent dilemmas, performance evaluation issues, and decision-making inefficiencies. Consequently, the effect of venture capital on facilitating industrial transformation and upgrading remains insignificant.
However, over time, the venture capital market has undergone continuous development and maturation, as Table 11 illustrates. The mediating effect of VCR1 on facilitating carbon emissions reduction through promoting IU has become increasingly pronounced.

4.4.2. Moderating Effect Test

This study investigated the moderating role of GTI and ETI in the inhibitory effect of venture capital on carbon emissions intensity. Prior to conducting the moderating effect analysis, GTI and ETI were discretised into three categories using the quantile method. The regression results are presented in Table 12.
The results in Columns (1), (3), and (4) indicate that the coefficients of VCS×ETI and VCR2×ETI are significantly negative. In contrast, although the coefficient of VCR1×ETI is not statistically significant, it remains negative, as presented in column (2). These findings suggest that ETI has a significant positive moderating effect on the relationship between venture capital and carbon emissions reduction. Furthermore, the results in Columns (5), (6), and (7) reveal that the coefficients of VCS×GTI and VCR1×GTI are negative; however, the coefficient of VCR2×GTI are significantly positive presented in column (8). This implies that GTI exerts a moderate positive influence on the relationship between venture capital and carbon emissions reduction but does not effectively enhance the impact of venture capital directed towards mid- and low-end industry sectors on industrial green transformation. This suggests that the government needs to further refine the incentive and regulatory policies for the green transformation of enterprises in mid- and low-end industries. Meanwhile, through measures such as financial incentives and tax adjustments, it should enhance the motivation of venture capital institutions to take proactive steps to improve the green performance of the invested enterprises.

5. Conclusions and Recommendations

5.1. Conclusions

This study utilised panel data of 27 prefecture-level cities in the Yangtze River Delta urban agglomeration from 2011 to 2022 to conduct a comprehensive analysis of the influence and mechanisms by which venture capital scale and structure affect urban carbon emissions intensity. The findings indicate the following:
(1)
Increasing the VCS significantly mitigates the rise in urban carbon emissions intensity, as confirmed by robustness tests.
(2)
There is heterogeneity in the carbon emissions reduction effects of venture capital across different industries, with more pronounced direct effects observed for investments directed towards mid- and low-end industries.
(3)
TECH serves as a key mechanism through which venture capital promotes carbon emissions reduction, although the mediating effect of IU has yet to become prominent.
(4)
ETI positively moderates the relationship between both venture capital scale and structure and carbon emissions reduction, while GTI exerts a significant positive moderating effect solely on the relationship between VCS and carbon emissions reduction.
(5)
The effectiveness of venture capital in curbing urban carbon emissions intensity demonstrates notable regional heterogeneity. The effects of VCS and VCR2 on carbon emissions reduction are particularly significant in cities with higher pollution levels, whereas VCR1 exhibits stronger effects in moderately polluted cities. Proximity to central cities enhances the carbon emissions reduction effect of VCS; however, VCR2 shows an initial increase followed by a decline in its impact.

5.2. Policy Implications

Based on the above findings, this paper has the following policy implications:
(1)
There is still a great potential for venture capital in urban carbon emissions reduction, which can be tapped through strengthening venture capital oversight and management and promoting the development of diversified venture capital entities. The inherent advantages of private venture capital, namely flexibility, sensitivity, and streamlined decision-making, should be fully leveraged. Concurrently, the management model for state-owned capital in venture investments should transition towards marketisation to maximise its incentive effects, corrective functions, and reputational benefits. However, it is important to note that the market-oriented transformation of state-owned venture capital may encounter multiple constraints, including institutional and mechanistic limitations, as well as the conflict between the requirement for stable preservation of state-owned assets and the high-risk nature of investment projects. As a key hub for domestic venture capital, the Yangtze River Delta Urban Agglomeration should take the lead in exploring reforms and improvements in assessment mechanisms, fault-tolerance and liability exemption frameworks, and performance evaluation systems of state-owned venture capital, thereby serving as a model and leader in this domain. This approach will facilitate the synergistic integration of the policy advantages associated with state-owned capital and the market strengths inherent in private venture capital, thereby enhancing the overall efficiency of the venture capital ecosystem, fostering a conducive innovation environment, and advancing industrial upgrading and economic transformation.
(2)
Implement context-specific strategies to direct venture capital towards industries with significant demand. In the long term, an increase in VCR1 can create beneficial synergy with the growth of VCS, thereby substantially enhancing carbon emissions reduction outcomes. However, for cities with smaller venture capital markets, higher pollution emission intensities, or greater distances from central urban areas, it is imperative to pay more attention to the financing needs of the general manufacturing and service sectors. It is essential to encourage venture capital investments in mid- and low-end industries to fully leverage their roles in screening, monitoring, and certification processes while accelerating the transition of traditional industries toward green and low-carbon development. Nevertheless, an information asymmetry between venture capital institutions and financing enterprises leads to capital misallocation and reduced efficiency. To address this issue, measures such as enhancing the quality and transparency of information disclosure and establishing a digital financing service platform should be implemented to improve the allocation efficiency of venture capital.
(3)
As micro-level entities, ETI plays a significant positive moderating role in the relationship between venture capital and carbon emissions reductions. Therefore, it is essential to strengthen the policy framework that supports green development for enterprises further and establish and enhance mechanisms for environmental, social, and governance (ESG) information disclosure as well as pricing strategies for green development. Additionally, leveraging the exemplary influence of leading firms and industry benchmarks is crucial for advancing green transformation across the entire industrial chain. Concurrently, GTI has not effectively influenced carbon emissions reduction in mid- and low-end industrial venture capital. It is necessary to develop a comprehensive fiscal and tax incentive mechanism aimed at promoting green innovation effect of mid- and low-end industrial venture capital to mitigate incentives for venture capital institutions to pursue superficial gains or financial exploitation, guiding invested enterprises in implementing green initiatives. To achieve this objective, local governments must establish a robust and scientific assessment framework for the transformation of manufacturing enterprises. Through systematic and regular evaluations, enterprises demonstrating strong transformation willingness, significant potential, and outstanding performance can be identified. Subsequently, through policy guidance, financial support, and information services, venture capital can be strategically directed towards these high-quality manufacturing enterprises.

5.3. Limitations

There are several limitations to this study. First, we did not investigate the effect of venture capital on carbon emissions in regions other than the Yangtze River Delta, which may introduce a certain degree of bias in the results. We will try to expand the geographical scope in the subsequent research. Secondly, while we analysed the heterogeneity contributed by pollution levels and geographical location across cities, future studies will delve deeper into the impact of cultural, administrative, and industrial variations on heterogeneity by employing befitting methods such as geographically weighted regression to provide more comprehensive insights.

Author Contributions

Conceptualisation, J.Z. and L.H.; methodology, L.H., X.W. and Y.S.; software, Y.S.; validation, L.H. and X.W.; formal analysis, L.H. and X.W.; investigation, L.H., X.W. and J.Z.; resources, J.Z.; data curation, L.H.; writing—original draft preparation, L.H. and X.W.; writing—review and editing, J.Z. and Y.S.; visualisation, L.H.; supervision, J.Z.; project administration, J.Z.; funding acquisition, J.Z. All authors have read and agreed to the published version of the manuscript.

Funding

This study was supported by the National Natural Science Foundation of China (grant number 42101163), and the Natural Science Foundation of Shandong Province (grant number ZR2020QD007).

Institutional Review Board Statement

Not applicable.

Informed Consent Statement

Not applicable.

Data Availability Statement

Data will be available from the corresponding author upon reasonable request.

Conflicts of Interest

The authors declare no conflicts of interest.

References

  1. Fekete, H.; Kuramochi, T.; Roelfsema, M.; den Elzen, M.; Forsell, N.; Höhne, N.; Luna, L.; Hans, F.; Sterl, S.; Olivier, J.; et al. A review of successful climate change mitigation policies in major emitting economies and the potential of global replication. Renew. Sustain. Energy Rev. 2021, 137, 110602. [Google Scholar] [CrossRef]
  2. Gao, X.; Liu, N.; Hua, Y. Environmental Protection Tax Law on the Synergy of Pollution Reduction and Carbon Reduction in China: Evidence from a Panel Data of 107 Cities. Sustain. Prod. Consum. 2022, 33, 425–437. [Google Scholar] [CrossRef]
  3. Chen, Y.; Zhu, Z.; Cheng, S. Industrial Agglomeration and Haze Pollution: Evidence from China. Sci. Total Environ. 2022, 845, 157392. [Google Scholar] [CrossRef]
  4. Xu, L.X. Towards Green Innovation by China’s Industrial Policy: Evidence from Made in China 2025. Front. Environ. Sci. 2022, 10, 924250. [Google Scholar] [CrossRef]
  5. Wang, W.Z.; Hu, Y.; Lu, Y. Driving forces of China’s provincial bilateral carbon emissions and the redefinition of corresponding responsibilities. Sci. Total Environ. 2023, 857, 159404. [Google Scholar] [CrossRef]
  6. Kong, H.; Shi, L.; Da, D.; Li, Z.; Tang, D.; Xing, W. Simulation of China’s Carbon Emission based on Influencing Factors. Energies 2022, 15, 3272. [Google Scholar] [CrossRef]
  7. Chemmanur, T.J.; Loutskina, E.; Tian, X. Corporate venture capital, value creation, and innovation. Rev. Financ. Stud. 2014, 27, 2434–2473. [Google Scholar] [CrossRef]
  8. Maiti, M. Does development in venture capital investments influence green growth? Technol. Forecast. Soc. Chang. 2022, 182, 121878. [Google Scholar] [CrossRef]
  9. Yao, L.; Singleton, A.; Sun, P.; Dong, G. The Evolution Characteristics and Influence Mechanism of Chinese Venture Capital Spatial Agglomeration. Int. J. Environ. Res. Public Health 2021, 18, 2974. [Google Scholar] [CrossRef]
  10. Li, C.; Li, H.; Qin, X. Spatial Heterogeneity of Carbon Emissions and Its Influencing Factors in China: Evidence from 286 Prefecture-Level Cities. Int. J. Environ. Res. Public Health 2022, 19, 1226. [Google Scholar] [CrossRef]
  11. Barry, C.B.; Muscarella, C.J.; Peavy Iii, J.W.; Vetsuypens, M.R. The role of venture capital in the creation of public companies: Evidence from the going-public process. J. Financ. Econ. 1990, 27, 447–471. [Google Scholar] [CrossRef]
  12. Megginson, W.L.; Weiss, K.A. Venture capitalist certification in initial public offerings. J. Financ. 1991, 46, 879–903. [Google Scholar] [CrossRef]
  13. Kato, A.I.; Tsoka, G.E. Impact of venture capital financing on small-and medium-sized enterprises’ performance in Uganda. S. Afr. J. Entrep. Small Bus. Manag. 2020, 12, 11. [Google Scholar] [CrossRef]
  14. Jiang, P.; Cai, C.X.; Keasey, K.; Wright, M.; Zhang, Q. The role of venture capitalists in small and medium-sized enterprise initial public offerings: Evidence from China. Int. Small Bus. J. 2014, 32, 619–643. [Google Scholar] [CrossRef]
  15. Otchere, I.; Vong, A.P.I. Venture capitalist participation and the performance of Chinese IPOs. Emerg. Mark. Rev. 2016, 29, 226–245. [Google Scholar] [CrossRef]
  16. Amit, R.; Glosten, L.; Muller, E. Does venture capital foster the most promising entrepreneurial firms? Calif. Manag. Rev. 1990, 32, 102–111. [Google Scholar] [CrossRef]
  17. Ber, H.; Yafeh, Y. Can venture capital funds pick winners? Evidence from pre-IPO survival rates and post-IPO performance. Isr. Econ. Rev. 2007, 5, 23–46. [Google Scholar]
  18. Tan, Y.; Huang, H.; Lu, H. The Effect of Venture Capital Investment—Evidence from China’s Small and Medium-Sized Enterprises Board. J. Small Bus. Manag. 2013, 51, 138–157. [Google Scholar] [CrossRef]
  19. Huang, F.; Zhang, X.; Peng, T. Chinese Venture Capital, Management Support and Firms’ Growth: Survey on Private SMEs. China J. Manag. 2015, 12, 207–214. (In Chinese) [Google Scholar]
  20. Kortum, S.S.; Lerner, J. Assessing the contribution of venture capital to Innovation. RAND J. Econ. 2000, 31, 674–692. [Google Scholar] [CrossRef]
  21. Yi, R.; Wang, H.; Lyu, B.; Xia, Q. Does venture capital help to promote open innovation practice?. Evidence from China. Eur. J. Innov. Manag. 2023, 26, 0161. [Google Scholar] [CrossRef]
  22. Arvanitis, S.; Stucki, T. The impact of venture capital on the persistence of innovation activities of start-ups. Small Bus. Econ. 2014, 42, 849–870. [Google Scholar] [CrossRef]
  23. Wen, J.; Yang, D.; Feng, G.F.; Dong, M.; Chang, C.P. Venture capital and innovation in China: The non-linear evidence. Struct. Chang. Econ. Dyn. 2018, 46, 148–162. [Google Scholar] [CrossRef]
  24. Chary, T.S. Role of Venture Capital in Promotion of New Enterprises1. Financ. India 2005, 19, 1003–1011. [Google Scholar]
  25. Yao, L.; Lu, J.; Sun, P. Venture capital and industrial structure upgrading from the perspective of spatial spillover. Sustainability 2019, 11, 6698. [Google Scholar] [CrossRef]
  26. Cao, Y.; Cao, Y. Venture Capital, Non-performing Loans and Industrial Upgrading—Empirical Research based on Chinese Provincial Panel Data. J. Beijing Inst. Technol. (Soc. Sci. Ed.) 2020, 22, 76–87. (In Chinese) [Google Scholar]
  27. Romain, A.; Van Pottelsberghe, B. The economic impact of venture capital. In Discussion Paper Series 1; Deutsche Bundesbank: Frankfurt am Main, Germany, 2004; Volume 18. [Google Scholar]
  28. Cha, B.; Song, G. Influence of Venture Capital to Clean Technology on Economic Green Growth: Dynamic Analysis Based on Chinese Data. Sci. Technol. Manag. Res. 2023, 43, 223–234. (In Chinese) [Google Scholar]
  29. Yang, S.; Feng, D.; Lu, J.; Wang, C. The effect of venture capital on green innovation: Is environmental regulation an institutional guarantee? J. Environ. Manage. 2022, 318, 115641. [Google Scholar] [CrossRef] [PubMed]
  30. Gaddy, B.E.; Sivaram, V.; Jones, T.B.; Wayman, L. Venture capital and cleantech: The wrong model for energy innovation. Energy Policy 2017, 102, 385–395. [Google Scholar] [CrossRef]
  31. Dong, W.; Li, Y.; Lv, X.; Yu, C. How does venture capital spur the innovation of environmentally friendly firms?. Evidence from China. Energy Econ. 2021, 103, 105582. [Google Scholar] [CrossRef]
  32. Lee, J.W. The contribution of foreign direct investment to clean energy use, carbon emissions and economic growth. Energy Policy 2023, 55, 483–489. [Google Scholar] [CrossRef]
  33. Zhu, H.; Duan, L.; Guo, Y.; Yu, K. The effects of FDI, economic growth and energy consumption on carbon emissions in ASEAN-5: Evidence from panel quantile regression. Econ. Model. 2016, 58, 237–248. [Google Scholar] [CrossRef]
  34. Grimes, P.; Kentor, J. Exporting the greenhouse: Foreign capital penetration and CO2 Emissions 1980–1996. J. World Syst. Res. 2003, 9, 261–275. [Google Scholar] [CrossRef]
  35. Nie, Y.; Liu, Q.; Ren, D. Does the FDI Inflows in Countries along “the Belt and Road” Aggravate Carbon Emissions?. Does the FDI Inflows in Countries along “the Belt and Road” Aggravate Carbon Emissions? Ecol. Econ. 2022, 38, 29–37. [Google Scholar]
  36. Apergis, N.; Pinar, M.; Unlu, E. How do foreign direct investment flows affect carbon emissions in BRICS countries?. Revisiting the pollution haven hypothesis using bilateral FDI flows from OECD to BRICS countries. Environ. Sci. Pollut. Res. 2023, 30, 14680–14692. [Google Scholar] [CrossRef]
  37. Baştürk, M.F. Does Green Finance Reduce Carbon Emissions?. Global Evidence Based on System Generalized Method of Moments. Sustainability 2024, 16, 8210. [Google Scholar] [CrossRef]
  38. Khan, M.A.; Riaz, H.; Ahmed, M.; Saeed, A. Does green finance really deliver what is expected?. An empirical perspective. Borsa Istanb. Rev. 2022, 22, 586–593. [Google Scholar] [CrossRef]
  39. Zhao, X.; Zhang, S.; Ahmad, N.; Wang, S.; Zhao, J. Unlocking Sustainable Growth: The Transformative Impact of Green Finance on Industrial Carbon Emissions in China. Sustainability 2024, 16, 8253. [Google Scholar] [CrossRef]
  40. Wang, J.; Tian, J.; Kang, Y.; Guo, K. Can green finance development abate carbon emissions: Evidence from China. Int. Rev. Econ. Financ. 2023, 88, 73–91. [Google Scholar] [CrossRef]
  41. Lu, Z. A Study on the Influence on the Carbon Finance to the Low-Carbon in Resources Industries: An Empirical Analysis Based on CDM. Financ. Pract. Theory 2020, 11, 57–62. (In Chinese) [Google Scholar]
  42. Zhou, K.; Li, Y. Carbon finance and carbon market in China: Progress and challenges. J. Clean. Prod. 2019, 214, 536–549. [Google Scholar] [CrossRef]
  43. Khan, K.; Luo, T.; Ullah, S.; Rasheed, H.M.W.; Li, P.H. Does digital financial inclusion affect CO2 emissions?. Evidence from 76 emerging markets and developing economies (EMDE’s). J. Clean. Prod. 2023, 420, 138313. [Google Scholar] [CrossRef]
  44. Schmitz, A.; Kamiński, J.; Scalet, B.M.; Soria, A. Energy consumption and CO2 emissions of the European glass industry. Energy Policy 2011, 39, 142–155. [Google Scholar] [CrossRef]
  45. Alves, M.R.; Moutinho, V. Decomposition analysis and Innovative Accounting Approach for energy-related CO2 (carbon dioxide) emissions intensity over 1996–2009 in Portugal. Energy 2013, 57, 775–787. [Google Scholar] [CrossRef]
  46. Fisher-Vanden, K.; Jefferson, G.H.; Ma, J.; Xu, J. Technology development and energy productivity in China. Energ Econ. 2006, 28, 690–705. [Google Scholar] [CrossRef]
  47. Zhang, H.; Feng, C.; Zhou, X. Going carbon-neutral in China: Does the low-carbon city pilot policy improve carbon emission efficiency? Sustain. Prod. Consum. 2022, 33, 312–329. [Google Scholar] [CrossRef]
  48. Bano, S.; Zhao, Y.; Ahmad, A.; Wang, S.; Liu, Y. Identifying the impacts of human capital on carbon emissions in Pakistan. J. Clean. Prod. 2018, 183, 1082–1092. [Google Scholar] [CrossRef]
  49. Cappellari, T.; Gucciardi, G. Equity Investments and Environmental Pressure: The Role of Venture Capital. Sustainability 2023, 16, 241. [Google Scholar] [CrossRef]
  50. Hochberg, Y.V.; Ljungqvist, A.; Lu, Y. Whom you know matters: Venture capital networks and investment performance. J. Financ. 2007, 62, 251–301. [Google Scholar] [CrossRef]
  51. Lin, B.; Xie, Y. Driving green technology innovation in renewable energy: Does venture capital matter? IEEE Trans. Eng. Manag. 2023, 71, 6784–6795. [Google Scholar] [CrossRef]
  52. Belloc, F. Innovation in state-owned enterprises: Reconsidering the conventional wisdom. J. Econ. Issues. 2014, 48, 821–848. [Google Scholar] [CrossRef]
  53. Yang, Y.; Wei, X.; Wei, J.; Gao, X. Industrial structure upgrading, green total factor productivity and carbon emissions. Sustainability 2022, 14, 1009. [Google Scholar] [CrossRef]
  54. Caselli, S.; Gatti, S.; Perrini, F. Are venture capitalists a catalyst for innovation? Eur. Financ. Manage. 2009, 15, 92–111. [Google Scholar] [CrossRef]
  55. Adewuyi, A.O. Effects of public and private expenditures on environmental pollution: A dynamic heterogeneous panel data analysis. Renew. Sustain. Energy. Rev. 2016, 65, 489–506. [Google Scholar] [CrossRef]
  56. Matloob, A.; Sarif, M.O.; Um, J.S. Exploring correlation between OCO-2 XCO2 and DMSP/OLS nightlight imagery signature in four selected locations in India. Spat. Inf. Res. 2021, 29, 123–135. [Google Scholar] [CrossRef]
  57. Zhang, B.; Wan, K. The Effect of Energy Rights Trading Pilot Policies on Urban Carbon Emissions: Empirical Analysis Based on PSM-DID. Sustainability 2024, 16, 8357. [Google Scholar] [CrossRef]
Figure 1. The framework of the paper.
Sustainability 17 00546 g001
Figure 2. Overview map of the study area.
Sustainability 17 00546 g002
Figure 3. The financing amount proportion of the clean technology sector in the high-end sectors.
Sustainability 17 00546 g003
Table 1. Industry classification description.
Industry CategorySpecific Sector
high-end sectorsautomobile manufacturing, machinery manufacturing, semiconductor and electronic equipment manufacturing, biotechnology, clean technology, information technology, finance, Internet
mid- to low-end sectorsagriculture, energy and mining, paper and printing, food and beverage manufacturing, chemical process, textile and garment manufacturing, construction, chain and retail, education and training, radio and television, logistic, real estate, telecommunications and value-added services, entertainment and media
Table 2. Descriptive statistics of main variables.
VariableMean Standard DeviationMINMAX
CI1.2851.0380.2165.709
VCS2264.3996696.2610.34345,764.993
VCR10.62430.2550.02451.000
VCR20.3760.2550.0000.975
FP1.5050.4870.9133.316
ROAD9.6783.5824.03221.752
EDU2.2571.8770.2259.888
ER5464.833712.0913281.0007685.000
URBAN0.6710.1020.3960.894
FDI0.5010.3800.0602.390
TECH3313.3444637.63756.00028,534.000
IU1.0390.3890.3342.802
ETI77.143131.9570.000666.667
GTI22.69529.5262.204214.063
PEI43.62028.86918.586127.651
GL102.05668.5740258.8
Table 3. The results of unit root test and VIF test.
Variable(1)(2)(3)(4)(5)(6)
LLCp-ValueIPSp-ValueVIFVIF
CI−10.32520.0000−1.50880.0657--
VCS−10.84550.0000−3.33520.00044.587.45
VCR1−11.03990.0000−2.79050.00268.11-
VCR2−12.44090.0000−4.32670.0000-4
VCS×VCR1−8.53520.0000−1.25430.10497.11-
VCS×VCR2−9.08990.0000−2.84520.0022-5.59
URBAN−14.42820.0000−2.94730.00163.94.01
FDI−3.44030.0003−5.13630.00001.351.3
FP−18.71700.0000−4.95620.00002.582.58
ROAD−7.59970.0000−0.18250.42761.731.73
ER−13.97710.0000−2.85940.00211.341.34
EDU−8.77090.0000−0.82170.20562.212.21
Table 4. The results of Moran’s I.
Sequence of
Window Periods
Time WindowMoran’s IZp-Value
12011–2013−0.121−2.9080.002
22012–2014−0.120−2.8580.002
32013–2015−0.117−2.7370.003
42014–2016−0.116−2.7060.003
52015–2017−0.120−2.8410.002
62016–2018−0.120−2.8570.002
72017–2019−0.108−2.4380.007
82018–2020−0.096−2.0040.023
92019–2021−0.086−1.6800.046
102020–2022−0.086−1.6550.049
Table 5. The results of spatial panel model identification.
TestStatisticp-Value
LM error244.02 ***0.000
R-LM error133.05 ***0.000
LM lag93.97 ***0.000
R-LM lag3.01 ***0.083
LR-SDM/SAR31.62 ***0.000
LR-SDM/SEM28.24 ***0.001
Wald-SDM/SAR34.95 ***0.000
Wald-SDM/SEM27.30 ***0.001
Hausman824.3 ***0.000
Lrtest both ind39.61 ***0.006
Lrtest both time1147.27 ***0.000
Note: *** indicate significance at the 1% levels, respectively.
Table 6. Benchmark regressions results.
VariableSDMSARSEM
(1)(2)(3)(4)(5)(6)
VCS−0.0229 ***
(0.0075)
−0.0104
(0.0081)
−0.0109
(0.0071)
−0.0049
(0.0077)
−0.0159 **
(0.0074)
−0.0063
(0.0078)
VCR10.0324 *
(0.0186)
0.0170
(0.0178)
0.0243
(0.0184)
VCS×VCR1−0.0244 **
(0.0098)
−0.0151
(0.0092)
−0.0205 **
(0.0097)
VCR2 −0.0128 **
(0.0057)
−0.0080
(0.0054)
−0.0103 *
(0.0056)
VCS×VCR2 0.0057
(0.0038)
0.0023
(0.0036)
0.0043
(0.0038)
W×VCS0.0096
(0.1146)
0.0083
(0.1254)
W×VCR10.3050 *
(0.1811)
W×VCS×VCR1−0.0389
(0.0946)
W×VCR2 −0.1005
(0.0625)
W×VCS×VCR2 0.0433
(0.0450)
ControlsYESYESYESYESYESYES
City fixed effectYESYESYESYESYESYES
Time fixed effectYESYESYESYESYESYES
Observations270270270270270270
R-squared0.76660.74600.19920.19240.13600.1376
Note: ***, **, and * indicate significance at the 1%, 5%, and 10% levels, respectively.
Table 7. Robustness tests.
All Variables Are One-Period Lagged Replace the Measure
of the VCS
Transform Weight Matrix
Variable(1)
L.CI
(2)
L.CI
Variable(3)
CI
(4)
CI
(5)
CI
(6)
CI
L.VCS−0.0213 ***
(0.0076)
−0.0105
(0.0083)
VCS−0.0351 **
(0.0139)
−0.0317 **
(0.0146)
−0.0137 *
(0.0073)
−0.0054
(0.0076)
L.VCR10.0279
(0.0189)
VCR10.0205
(0.0180)
0.0229
(0.0204)
L.VCS×L.VCR1−0.0204 **
(0.0101)
VCS*VCR1−0.0174 *
(0.0095)
−0.0186 *
(0.0103)
L.VCR2 −0.0115 **
(0.0058)
VCR2 −0.0134 **
(0.0053)
−0.0105 *
(0.0054)
L.VCS×L.VCR2 0.0050
(0.0039)
VCS*VCR2 0.0059 *
(0.0036)
0.0023
(0.0036)
L.ControlsYESYESControlsYESYESYESYES
City fixed effectYESYESCity fixed effectYESYESYESYES
Time fixed effectYESYESTime fixed effectYESYESYESYES
Observations189189Observations270270270270
R-squared0.58220.5906R-squared0.75210.62540.69260.4314
Note: ***, **, and * indicate significance at the 1%, 5%, and 10% levels, respectively.
Table 8. Heterogeneity test results based on PEI.
VariableLow Level in PEIMedium Level in PEIHigh Level in PEI
(1)(2)(3)(4)(5)(6)
VCS0.0294 ***
(0.0109)
0.0461 ***
(0.0125)
0.0087
(0.0139)
−0.0153
(0.0131)
−0.0147
(0.0112)
−0.0134
(0.0092)
VCR10.0436
(0.0711)
−0.1933 ***
(0.0749)
0.0238
(0.0165)
VCS×VCR1−0.0309
(0.0294)
0.0749 **
(0.0306)
−0.0163
(0.0102)
VCR2 −0.0391
(0.0322)
−0.0119
(0.0672)
−0.0138 **
(0.0058)
VCS×VCR2 0.0191
(0.0119)
−0.0057
(0.0224)
0.0050
(0.0049)
ControlsYESYESYESYESYESYES
City fixed effectYESYESYESYESYESYES
Time fixed effectYESYESYESYESYESYES
Observations909090909090
R-squared0.43210.47990.86530.87270.69440.5009
Note: ***, ** indicate significance at the 1% and 5% levels, respectively.
Table 9. Heterogeneity test results based on GL.
VariableShort DistanceMedium DistanceFar Distance
(1)(2)(3)(4)(5)(6)
VCS0.0294 ***
(0.0109)
0.0461 ***
(0.0125)
0.0087
(0.0139)
−0.0153
(0.0131)
−0.0147
(0.0112)
−0.0134
(0.0092)
VCR10.0436
(0.0711)
−0.1933 ***
(0.0749)
0.0238
(0.0165)
VCS×VCR1−0.0309
(0.0294)
0.0749 **
(0.0306)
−0.0163
(0.0102)
VCR2 −0.0391
(0.0322)
−0.0119
(0.0672)
−0.0138 **
(0.0058)
VCS×VCR2 0.0191
(0.0119)
−0.0057
(0.0224)
0.0050
(0.0049)
ControlsYESYESYESYESYESYES
City fixed effectYESYESYESYESYESYES
Time fixed effectYESYESYESYESYESYES
Observations909090909090
R-squared0.43210.47990.86530.87270.69440.5009
Note: ***, ** indicate significance at the 1% and 5% levels, respectively.
Table 10. Mediating effect tests.
Variable(1)
TECH
(2)
TECH
(3)
IU
(4)
IU
(5)
CI
(6)
CI
(7)
CI
(8)
CI
VCS0.0678 **
(0.0285)
0.0015
(0.0310)
−0.0421 ***
(0.0100)
−0.0321 ***
(0.0105)
−0.0189 **
(0.0074)
−0.0101
(0.0079)
−0.0215 ***
(0.0079)
−0.0093
(0.0081)
VCR1−0.3384 ***
(0.0704)
0.0497 **
(0.0246)
0.0129
(0.0189)
0.0311 *
(0.0187)
VCS×VCR10.1544 ***
(0.0373)
−0.0250 *
(0.0130)
−0.0156
(0.0099)
−0.0238 **
(0.0099)
VCR2 0.0586 ***
(0.0218)
−0.0131 *
(0.0074)
−0.0095 *
(0.0056)
−0.0127 **
(0.0057)
VCS×VCR2 −0.0248 *
(0.0147)
0.0008
(0.0050)
0.0043
(0.0038)
0.0066 *
(0.0038)
TECH −0.0574 ***
(0.0164)
−0.0571 ***
(0.0161)
IU 0.0599
(0.0477)
0.0571
(0.0481)
ControlsYESYESYESYESYESYESYESYES
City fixed effectYESYESYESYESYESYESYESYES
Time fixed effectYESYESYESYESYESYESYESYES
Observations270270270270270270270270
R-squared0.76660.82910.82720.43490.46860.76150.72380.7635
Note: ***, **, and * indicate significance at the 1%, 5%, and 10% levels, respectively.
Table 11. Regressions results in different time periods.
VariableEarlier Development Stage
(2011–2016)
Later Development Stage
(2017–2022)
(1)
IU
(2)
CI
(3)
IU
(4)
CI
VCS−0.0031
(0.0076)
−0.0049
(0.0076)
−0.0208
(0.0168)
0.0006
(0.0140)
VCR1−0.0064
(0.0163)
0.0305 *
(0.0156)
0.1307 **
(0.0549)
−0.0155
(0.0463)
VCS×VCR1−0.0105
(0.0093)
−0.0160 *
(0.0090)
−0.0510 *
(0.0260)
0.0024
(0.0219)
IU 0.4058 ***
(0.0857)
−0.2073 ***
(0.0768)
ControlsYESYESYESYES
City fixed effectYESYESYESYES
Time fixed effectYESYESYESYES
Observations135135135135
R-squared0.66760.60610.26270.5200
Note: ***, **, and * indicate significance at the 1%, 5%, and 10% levels, respectively.
Table 12. Moderating effect tests.
Variable(1)(2)(3)(4)(5)(6)(7)(8)
VCS−0.0126
(0.0087)
−0.0213 ***
(0.0078)
−0.0014
(0.0088)
−0.0081
(0.0081)
−0.0139
(0.0092)
−0.0228 ***
(0.0075)
0.0018
(0.0097)
−0.0161 **
(0.0082)
VCR10.0259
(0.0187)
0.0310 *
(0.0186)
0.0343 *
(0.0184)
0.0353 *
(0.0185)
VCS×VCR1−0.0190 *
(0.0100)
−0.0188 *
(0.0111)
−0.0242 **
(0.0098)
−0.0227 **
(0.0105)
VCR2 −0.0121 **
(0.0057)
−0.0153 ***
(0.0058)
−0.0145 ***
(0.0056)
−0.0083
(0.0060)
VCS×VCR2 0.0053
(0.0038)
0.0115 **
(0.0049)
0.0065 *
(0.0038)
−0.0017
(0.0047)
ETI0.0379 ***
(0.0142)
0.0026
(0.0059)
0.0416 ***
(0.0140)
−0.0003
(0.0066)
VCS×ETI−0.0146 **
(0.0061)
−0.0157 ***
(0.0061)
VCR1×ETI −0.0166
(0.0152)
VCR2×ETI −0.0129 *
(0.0074)
GTI 0.0319 **
(0.0147)
0.0045
(0.0055)
0.0375 **
(0.0147)
0.0183 ***
(0.0053)
VCS×GTI −0.0104 *
(0.0061)
−0.0127 **
(0.0061)
VCR1×GTI −0.0084
(0.0109)
VCR2×GTI 0.0231 ***
(0.0078)
ControlsYESYESYESYESYESYESYESYES
City fixed effectYESYESYESYESYESYESYESYES
Time fixed effectYESYESYESYESYESYESYESYES
Observations270270270270270270270270
R-squared0.76660.82910.82720.43490.46860.76150.72380.7635
Note: ***, **, and * indicate significance at the 1%, 5%, and 10% levels, respectively.
Disclaimer/Publisher’s Note: The statements, opinions and data contained in all publications are solely those of the individual author(s) and contributor(s) and not of MDPI and/or the editor(s). MDPI and/or the editor(s) disclaim responsibility for any injury to people or property resulting from any ideas, methods, instructions or products referred to in the content.

