Article

The Yield Estimation of Apple Trees Based on the Best Combination of Hyperspectral Sensitive Wavelengths Algorithm

1
College of Resources and Environment, Shandong Agricultural University, Tai’an 271018, China
2
National Engineering Research Center for Efficient Utilization of Soil and Fertilizer Resources, Tai’an 271018, China
3
College of Horticulture Science and Engineering, Shandong Agricultural University, National Apple Engineering and Technology Research Center, Tai’an 271018, China
*
Author to whom correspondence should be addressed.
Sustainability 2025, 17(2), 518; https://doi.org/10.3390/su17020518
Submission received: 2 December 2024 / Revised: 6 January 2025 / Accepted: 7 January 2025 / Published: 10 January 2025

Abstract

:
Agriculture’s sustainable growth necessitates the application of advanced science and technology to ensure the sensible use of resources and improve the agricultural economy’s long-term stability. In this study, apple trees were employed as research objects throughout the spring (NSS) and autumn shoot stop-growing stage (ASS), and the data source was canopy hyperspectral data of fruit trees collected using ASD near-earth sensors, which was then combined with multiple sensitive wavelength screening algorithms and machine learning models to create an efficient and accurate apple yield estimation system. This is critical for guiding fruit farmers’ production, maintaining market supply and demand balances, fostering stable agricultural economy development, and providing a scientific basis and technical support for agricultural sustainability. Firstly, the fruit tree canopy hyperspectral data and apple tree yield data were collected, and the Savitsky–Golay convolution smoothing method (SG) was used to preprocess the canopy hyperspectral data. Secondly, six algorithms—Competitive Adaptive Re-weighting Sampling (CARS), Genetic Algorithm (GA), Successive Projections Algorithm (SPA), Uninformative Variable Elimination Algorithm (UVE), Variable Iteration Spatial Shrinking Algorithm (VISSA), and Variable Combination Population Algorithm (VCPA)—were employed to screen for the sensitive wavelengths related to apple tree yield, then preferring three methods for two-by-two combinations to determine the optimal algorithm combinations. Finally, using the best algorithm combinations, we built the apple yield linear model partial least squares regression (PLSR) and three machine learning models, Random Forest (RF), Cubist, and XGBoost, to screen for the best estimation model. The results demonstrated that ASS was the best fertility period for estimating yield; the validation set of the model constructed using each algorithm in ASS had a higher R2 of 0.05–0.51 and a lower RMSE of 0.21–5.33 than those in NSS. The three algorithms preferred were CARS, GA, and VISSA. After combining the three algorithms in two combinations, the best combination of VISSA-CARS was found. The RF model established based on the best VISSA-CARS combination algorithm is the best model for apple yield estimation, with a validation set R2 = 0.78 and RMSE = 6.03. The findings of this study may provide a new concept for accurately and quickly estimating apple yield, allowing fruit growers to improve production efficiency and promote agricultural sustainability.

1. Introduction

Apple is a major agricultural cash crop in China, accounting for more than half of global plantings and production, with significant economic and social implications [1]. Shandong Province, a traditionally beneficial producing area for apple planting in China, accounts for one-quarter of total apple production [2]. The estimation of apple yield prior to the harvest season can assist fruit farmers in developing a fair production plan and sales direction, which is critical in directing the healthy development of China’s apple planting sector [3]. Accurate apple yield estimation can assist farmers and agricultural managers in better planning resource utilization, adjusting planting strategies in a timely manner, and developing reasonable marketing strategies, all of which improve economic efficiency and ensure the agricultural economy’s sustainability. Traditional apple yield estimation is based mostly on manual surveys, which are time-consuming and arduous and cannot match the demand for quick and accurate crop production estimates [4,5]. As a result, there is an urgent need for a novel technology that allows for the non-destructive, rapid, and precise calculation of apple yield.
Remote sensing technology, with its real-time, accurate, and efficient advantages, has become increasingly popular in crop growth monitoring, nutritional diagnosis, and yield evaluation. Among them, hyperspectral remote sensing, with its great spectral resolution, has a significant benefit in yield estimation [6]. Hyperspectral remote sensing technology can be utilized to build an inversion model based on the relationship between spectral information and a limited quantity of collected yield data without having to touch the fruit trees, resulting in an efficient estimation of yield. Early crop yield estimates used the link between hyperspectral full-band reflectance data and real crop yields or yield-forming factors to build estimation models [7]. Previous research used full-band spectral information to estimate rice yield based on crown height data at differentiation and heading stages. The results showed that the Bayesian ridge regression (BRR) model based on the differentiation stage had the best effect on yield estimates, with R2 up to 0.90 [8]. Although this method achieved high model estimation accuracy, there are more bands in the hyperspectral data, and the absorption peaks in the near-infrared hyperspectrum of the canopy hyperspectral data obtained with near-earth sensors overlap significantly, resulting in information redundancy. The overlap is significant, resulting in information redundancy and decreasing the efficiency and accuracy of yield estimation with hyperspectral data. Based on this, previous scholars have examined how to minimize redundant variables and screen the fewest amount of effective spectral variables, i.e., by downscaling hyperspectral data with sensitive wavelength screening algorithms [9]. Traditional sensitive wavelength screening algorithms primarily include the correlation coefficient method (CA) [10], principal component analysis (PCA) [11], and partial least squares (PLS) [12]. Some studies employed the correlation coefficient method to extract the characteristic wavelength of corn seed ear rot, which was then used as an input variable in the discrimination model of corn seed ear rot. The discrimination model’s training and test sets have a modeling accuracy of more than 90% [13]. In previous research, correlation analysis and the Gaussian process regression bands analysis tool (GPR-BAT) were used to screen the sensitive wavelength of potato canopy spectra and build above-ground biomass estimating models at each development stage, respectively. The Gaussian process regression bands analysis tool, combined with the partial least squares regression (GPR-BAT-PLSR) model, achieved the highest accuracy, with R2 of 0.73 [14].
While such methods work well in some applications, they struggle with spectrum data that contain nonlinearities and significant correlations, restricting their usage in complicated data processing.
Currently, Genetic Algorithm (GA) [15], Successive Projections Algorithm (SPA) [16], Variable Iterative Space Shrinkage Algorithm (VISSA) [17], and others that have strong global search ability and are suitable for the analysis of nonlinear problems, are widely used to solve the sensitive wavelength screening problem [18]. These algorithms may greatly reduce the number of feature bands and increase the prediction accuracy of yield prediction models due to their excellent global searching ability and parameter adaptability [19,20].
However, most of these studies have used a single algorithm for screening sensitive wavelengths, and while it can eliminate some of the invalid information and interfering bands, the use of a single algorithm still has too many retained variables, making it difficult to thoroughly search for all possible combinations of variables [21].
To solve the above problems, this study, based on near-earth hyperspectral data on the basis of a single screening algorithm, uses the combination form of the preferred algorithm to carry out the secondary dimensionality reduction of the spectral data and further remove redundant variables. It then builds an apple tree yield estimation model based on the sensitive wavelength screened by the best combination algorithm. This study attempts to explore a new, non-destructive, rapid, and accurate method for estimating apple yield so as to assist farmers in managing fruit tree resources effectively and achieving sustainable agricultural development. At the same time, it introduces a new concept for modern agriculture that is resource-efficient, environmentally benign, and economically sustainable. This accomplishment will not only assist farmers in dealing with an increasingly complex growing environment but will also establish the groundwork for the global promotion of sustainable farming techniques.

2. Materials and Methods
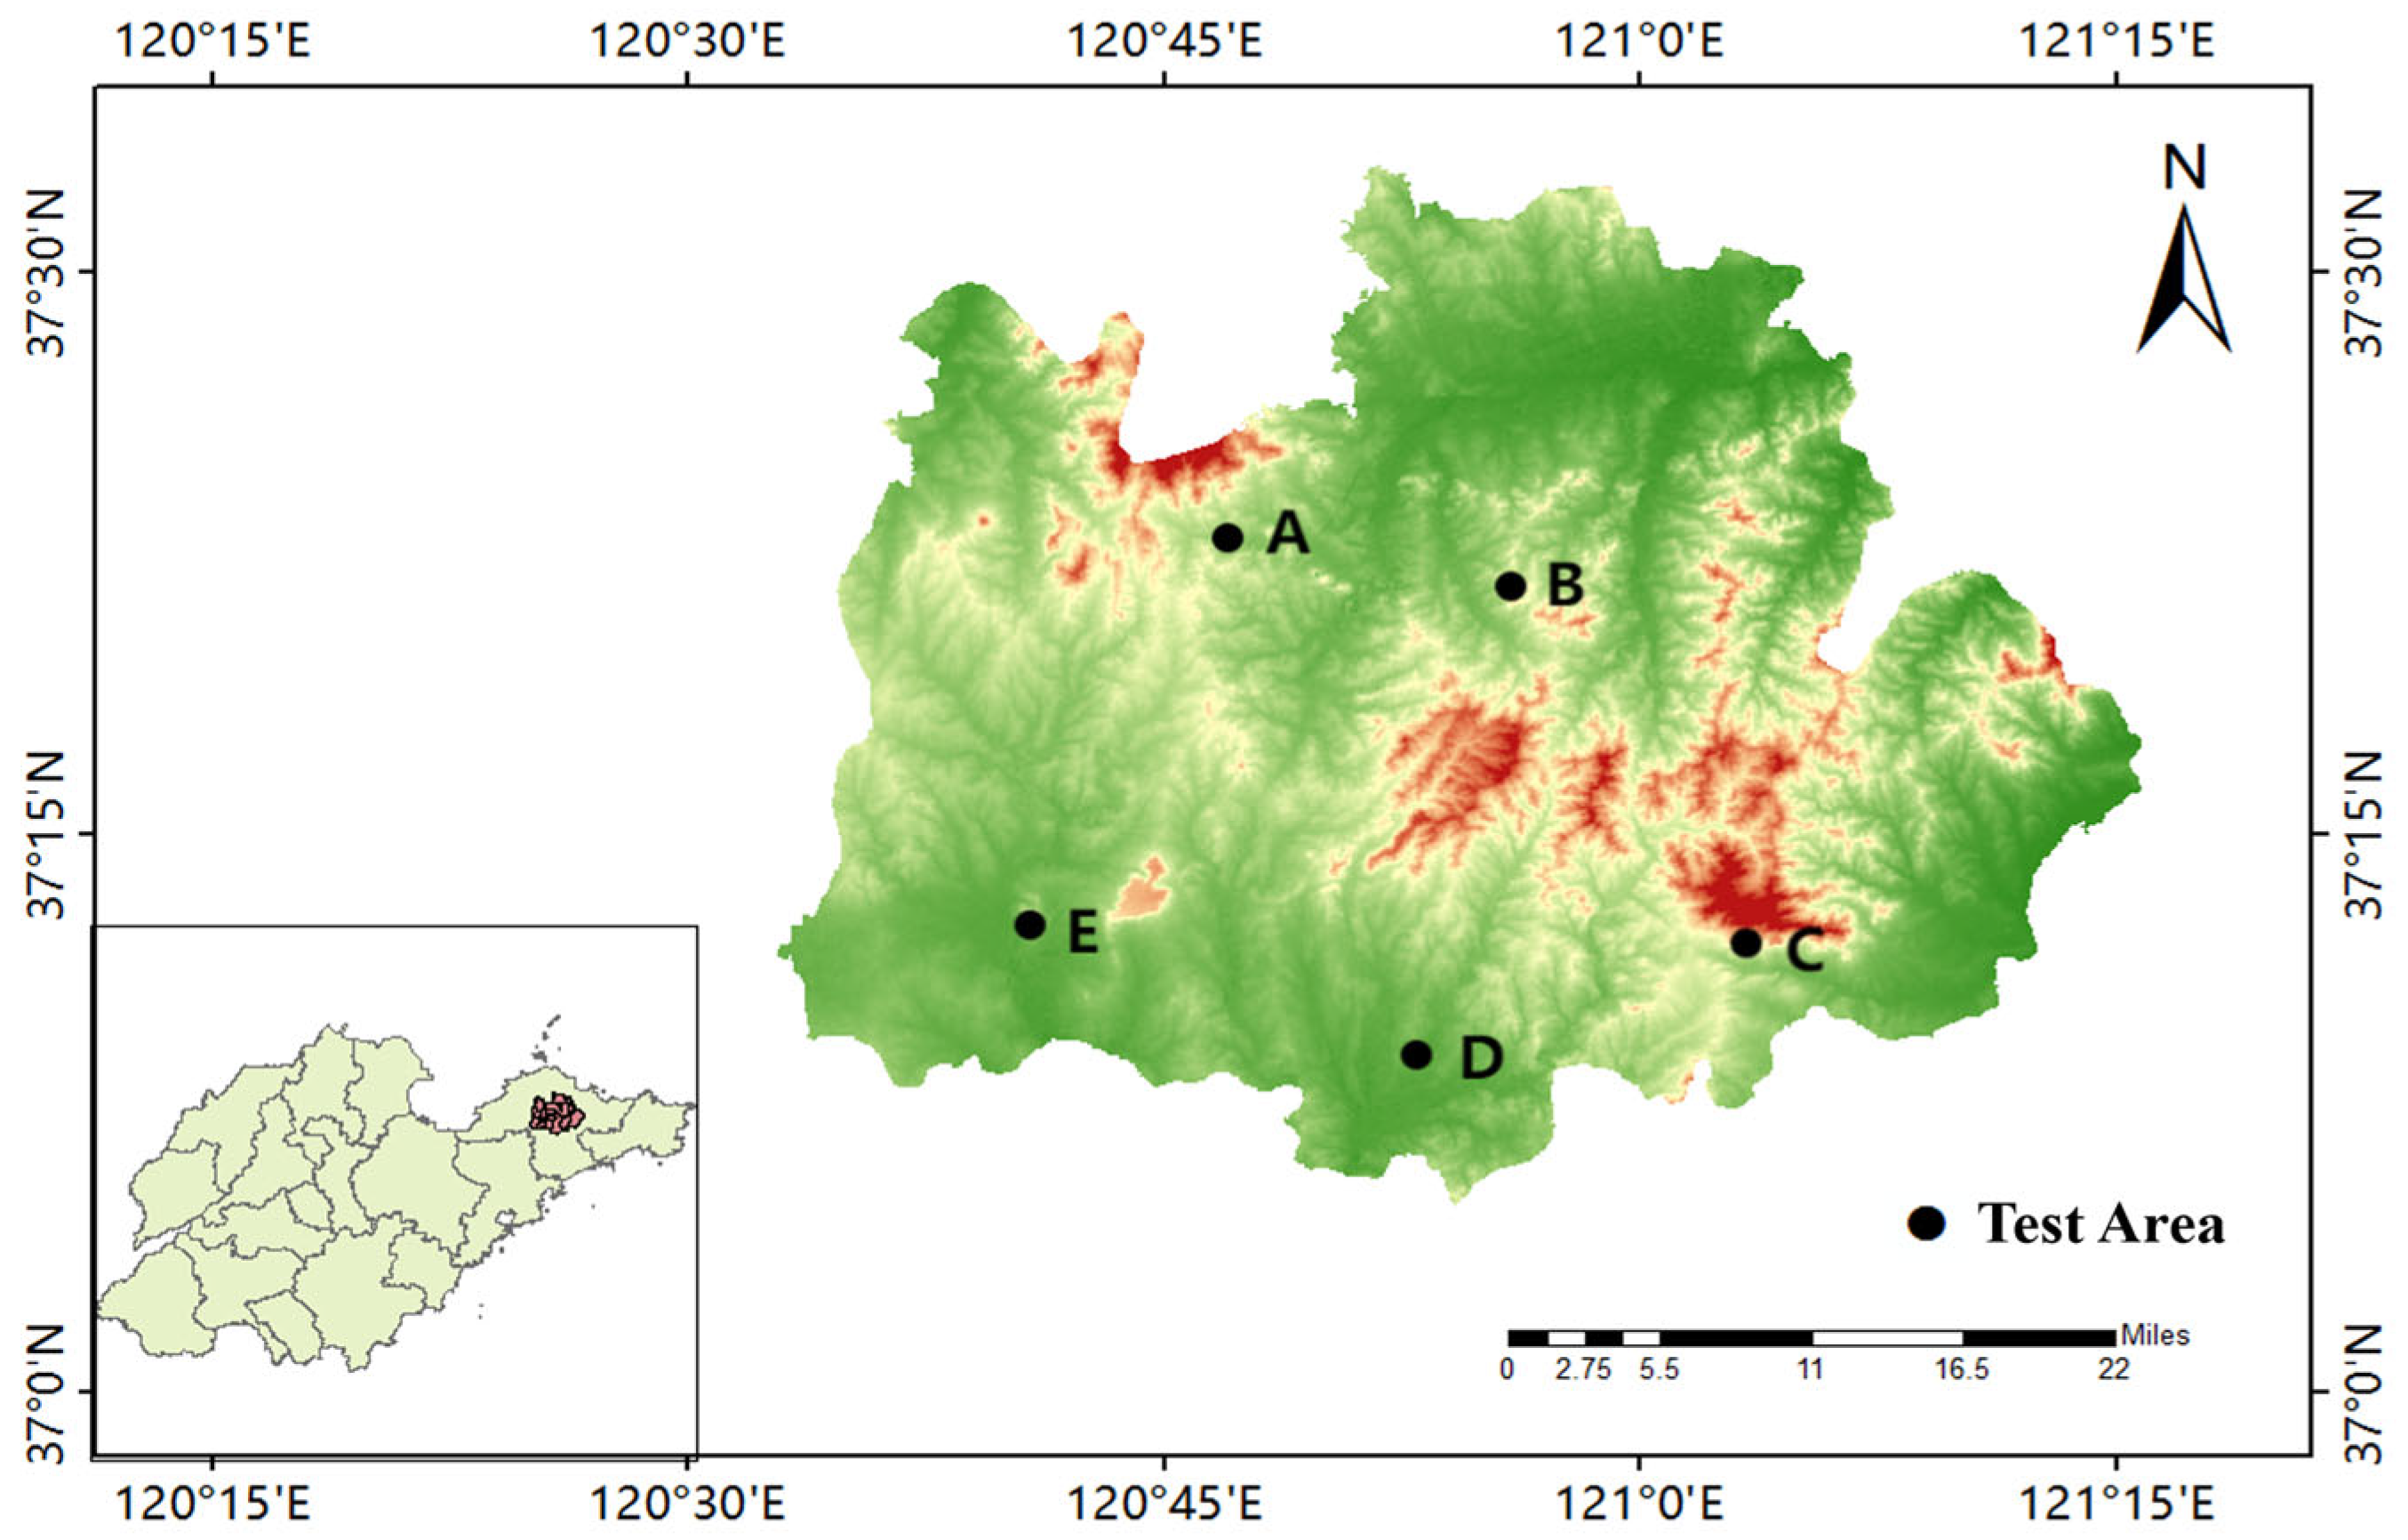
2.1. Study Area

The research area is located in Qixia City, Yantai City, Shandong Province (37°05′ N–37°32′ N, 120°33′ E–121°15′ E), one of the most important apple-producing areas on the Jiaodong Peninsula (Figure 1). The city, located in the hinterland of the Jiaodong Peninsula, has a warm-temperate monsoon semi-humid climate with an average annual temperature of 11.3 °C, moderate rainfall throughout the year, adequate light, a large temperature difference between day and night in autumn, and predominantly brown loamy soil with a loose and permeable texture and a high nutrient content, which provide unique conditions for apple growth. At the same time, Qixia City has a large area of apple planting and a somewhat concentrated distribution, providing ideal conditions for yield estimation with remote sensing technologies.
In the study area, five orchards were chosen as test plots to collect canopy spectrum and apple yield information.

2.2. Data Collection and Preprocessing

2.2.1. Hyperspectral Data Acquisition

The canopy spectra of dwarf Fuji apple trees were obtained on 10 June 2023 (NSS) and 10 September 2023 (ASS). The orchard’s management procedures were consistent, and the fruit trees had similar crown shape and nutritional state, with tree heights ranging from 1.8 to 2.5 m. The crowns were pruned to an ellipsoidal shape, with an average diameter of 1.7 m.
Spectral measurements of the apple tree canopy were taken using a ground spectrometer, ASD Field Spec 4. The spectrometer band values ranged from 350 to 2500 nm, with a spectral resolution of 3 nm with a sample interval of 1.4 nm in the 350–1050 nm spectral range and 10 nm with a sampling interval of 2 nm in the 1000–2500 nm region. Clear, windless, cloudless weather was chosen for spectral measurement; the measurement time was 10:00–14:00; when the light conditions are good, the sun is almost directly overhead during the time period for spectral measurement; and the sun’s elevation angle is greater than 45° to reduce the error caused by changes in light. The device must be warmed up for 15 min before usage, and dark current acquisition occurs every 5 min. The standard white plate was tuned and corrected before each spectrum collection, and it was also optimized every 15 min. During optimization, the standard white plate was set horizontally with no direct shadow light, and the white plate’s reflectivity after optimization was one. During the measurement process, the surveyor faces the sunshine to prevent casting shadows and interfering with the results. During the measurement, the spectrometer probe is positioned vertically downward, directly above the central tree trunk and 1.5–3 m away from the canopy’s vertical height. The exact height is adjusted based on the diameter and height of the apple tree crown, ensuring that the entire tree crown is within the detecting field of vision, limiting interference from the tree crown structure and preventing shadows. Spectral data from each tree canopy were gathered and recorded ten times, and the average value was used to calculate the spectral reflection value of the apple canopy at the sampling site. When detecting, the detector frame is employed, and the spectrometer is connected by a 5 m optical cable.

2.2.2. Apple Yield Data Acquisition

The yield of the apple trees whose spectra were determined was monitored at harvest in 2023 and 2024. In this study, a counter was used to count the number of fruits on each test fruit tree, and the yield per plant was estimated using the weight of each fruit. Two apple fruits of medium size and regular shape and were healthy were picked from each fruit tree in each of the four directions of southeast, northwest, and the inner chamber of the tree for a total of ten fruits per tree. These fruits were weighed on-site using an electronic scale, and the average single-fruit weight was used as the single-fruit weight of the test trees. The apple yield of a fruit tree is calculated by multiplying the number of fruits by the weight of a single fruit.
A total of 107 samples were gathered, and 93 valid samples were obtained after deleting 14 spectral anomaly samples using the Mahalanobis distance method. These samples were divided into a training set of 62 and a validation set of 31 using the joint x-y distances (SPXY) algorithm, as shown in Table 1.

2.2.3. Preprocessing of Spectral Data

Use ViewSpec Pro 5.0 to process and analyze the collected apple tree canopy spectrum data. To link the spectrum file, click the setup button and select Input Directory, then Output Directory to specify the file output location. The original spectrum file obtained from the ASD spectrometer is imported into the ViewSpec Pro program, the average value is calculated, and the result is recorded. The canopy reflectance of fruit trees is calculated, as shown in Formula (1):
R j = R j 0 × L j L j 0 ,   j = 1 , 2 , n
where n is the number of band, j is band number, R j   is the reflectance of the target object, in the j band, R j 0 is the reflectance of the white plate in the j band, L j is the DN value of the target object, and L j 0 is the DN value of the white plate.
During hyperspectral data acquisition, the spectral signal is affected by the hyperspectral camera’s performance and the measuring environment, as well as light scattering, noise, baseline drift, and human operation [22]. To reduce interference and create a stable and dependable model, the spectral data must be preprocessed. In this investigation, we selected the S-G convolution smoothing method (SG) to preprocess raw spectral data from the fruit tree canopy.

2.3. Sensitive Wavelength Screening Algorithm

Although hyperspectral remote sensing offers a high spectral resolution, the problem of strong covariance in surrounding bands and high spectral data redundancy reduces computing efficiency and model accuracy [23]. As a result, sensitive wavelength screening of spectral data is required to identify the wavelength variables having the highest correlation with the target variables, thereby simplifying model complexity.
Sensitive wavelengths were screened using six algorithms: Competitive Adaptive Re-weighting Sampling (CARS), Genetic Algorithm (GA), Successive Projection Algorithm (SPA), Uninformative Variable Elimination Algorithm (UVE), Variable Iterative Space Shrinkage Algorithm (VISSA), and Variable Combinatorial Population Algorithm (VCPA).
The CARS algorithm uses the absolute value of the regression coefficients to determine the importance of the variables, introduces an exponential decay function to control the number of variables retained, and limits the number of Monte Carlo iterations to 100 and cross-validation groups to ten [24]. The GA algorithm uses the genetics principle to combine individual crossing and mutation to create a population representing a new set of solutions, and the optimal individuals in the final population can be decoded as the problem’s near-optimal solution. To ensure the durability of the screening results, the best GA algorithm settings are chosen after numerous runs: the crossover probability is set to 0.5, the mutation probability is 0.01, and the initial population size is 30. The SPA algorithm is based on vector projection analysis, and by comparing the size of the projection vectors, the wavelength with the largest projection vector is chosen as the wavelength to be chosen, and then the calibration model is used to select the combination of variables with the least redundant information and covariance [25]. The UVE technique is based on partial least squares (PLS) regression coefficients, which quantify the importance of wavelengths and filter out the wavelength variables with the highest correlation, with a threshold of 0.99. The VISSA technique is based on a weighted regression coefficient, with an initial population size of 30 [26]. The VISSA algorithm is based on the weighted binary matrix sampling method to generate sub-models across the variable subspaces by continuously decreasing the root mean square error of cross-validation (RMSECV). The optimal parameters of VISSA are determined through multiple runs: the number of samples (Nbms) is set to 1000, the initial weights of the variables are set to 0.5, the maximum number of principal component factors is set to 10, and the sensitive wavelengths are screened through 5-fold cross-validation [27]. The VCPA method iteratively constructs a subset of sensitive wavelength variables using the exponential decay function and binary matrix sampling, and the best parameters are identified after numerous runs. The sample number Nbms is set to 1000, the number of runs of the exponential f-decreasing function (EDF) is set to 50, and the sensitive wavelengths are found using a 5-fold cross-validation. The proportion of the optimal subset is set to 0.1 [28].
Since the single sensitive wavelength screening algorithm has flaws, such as the presence of redundant variables after screening the spectral data, the model operation’s efficiency cannot be effectively improved. Therefore, in this study, rather than using a single technique, we use a combination of preferred algorithms to perform secondary dimensionality reduction on spectral data in order to increase the model’s prediction efficiency and accuracy.

2.4. Establishment and Verification of Apple Yield Model

In this study, four models were chosen to develop the apple yield estimation model: partial least squares regression (PLSR), Random Forest (RF), Cubist, and XGBoost. Among them, the PLSR model integrates the functions and benefits of multiple linear regression analysis, traditional correlation analysis, and principal component analysis, and it can effectively deal with the problem of multicollinearity among independent variables [29,30]. The RF model is a Bagging class integrated learning model based on decision trees that can still achieve respectable prediction accuracy with fewer input variables. It is one of the most often used models in quantitative remote sensing research in agriculture [31]. The Cubist model can reduce the influence of noise and the error between measured and anticipated values by integrating the findings of numerous models, hence improving the model’s prediction accuracy [32]. The XGBoost model is an innovative and efficient decision tree-boosting approach that can reduce processing time while enhancing accuracy via multi-threaded parallel operation [33].
Using the SPXY algorithm [34], 93 samples were divided in a 2:1 ratio, yielding 62 training and 31 validation samples. The SPXY algorithm calculates the distance between samples using both apple yield and spectral variables at the same time to ensure maximum characterization of the sample distribution. This method effectively covers the multidimensional vector space, increases sample variability and representativeness, and improves model stability. The inverse model’s accuracy was evaluated and tested using the Determination Coefficient (R2) and root mean square error (RMSE). R2 represents the degree of model fitting, while RMSE measures the difference between predicted and measured values. The model’s prediction ability and stability improve with higher R2 and lower RMSE [35]. The calculation formula for each accuracy evaluation index is presented in Equations (2) and (3).
R 2 = i = 1 n y i ^ y ¯ 2 i = 1 n y i y ¯ 2
R M S E = 1 N i = 1 n y i y i ^ 2
where n is the number of samples, i is the sample serial number, y i   is the actual value of apple yield, y ¯ is the mean value of apple yield, and y i ^ is the predicted value of apple yield.

3. Results

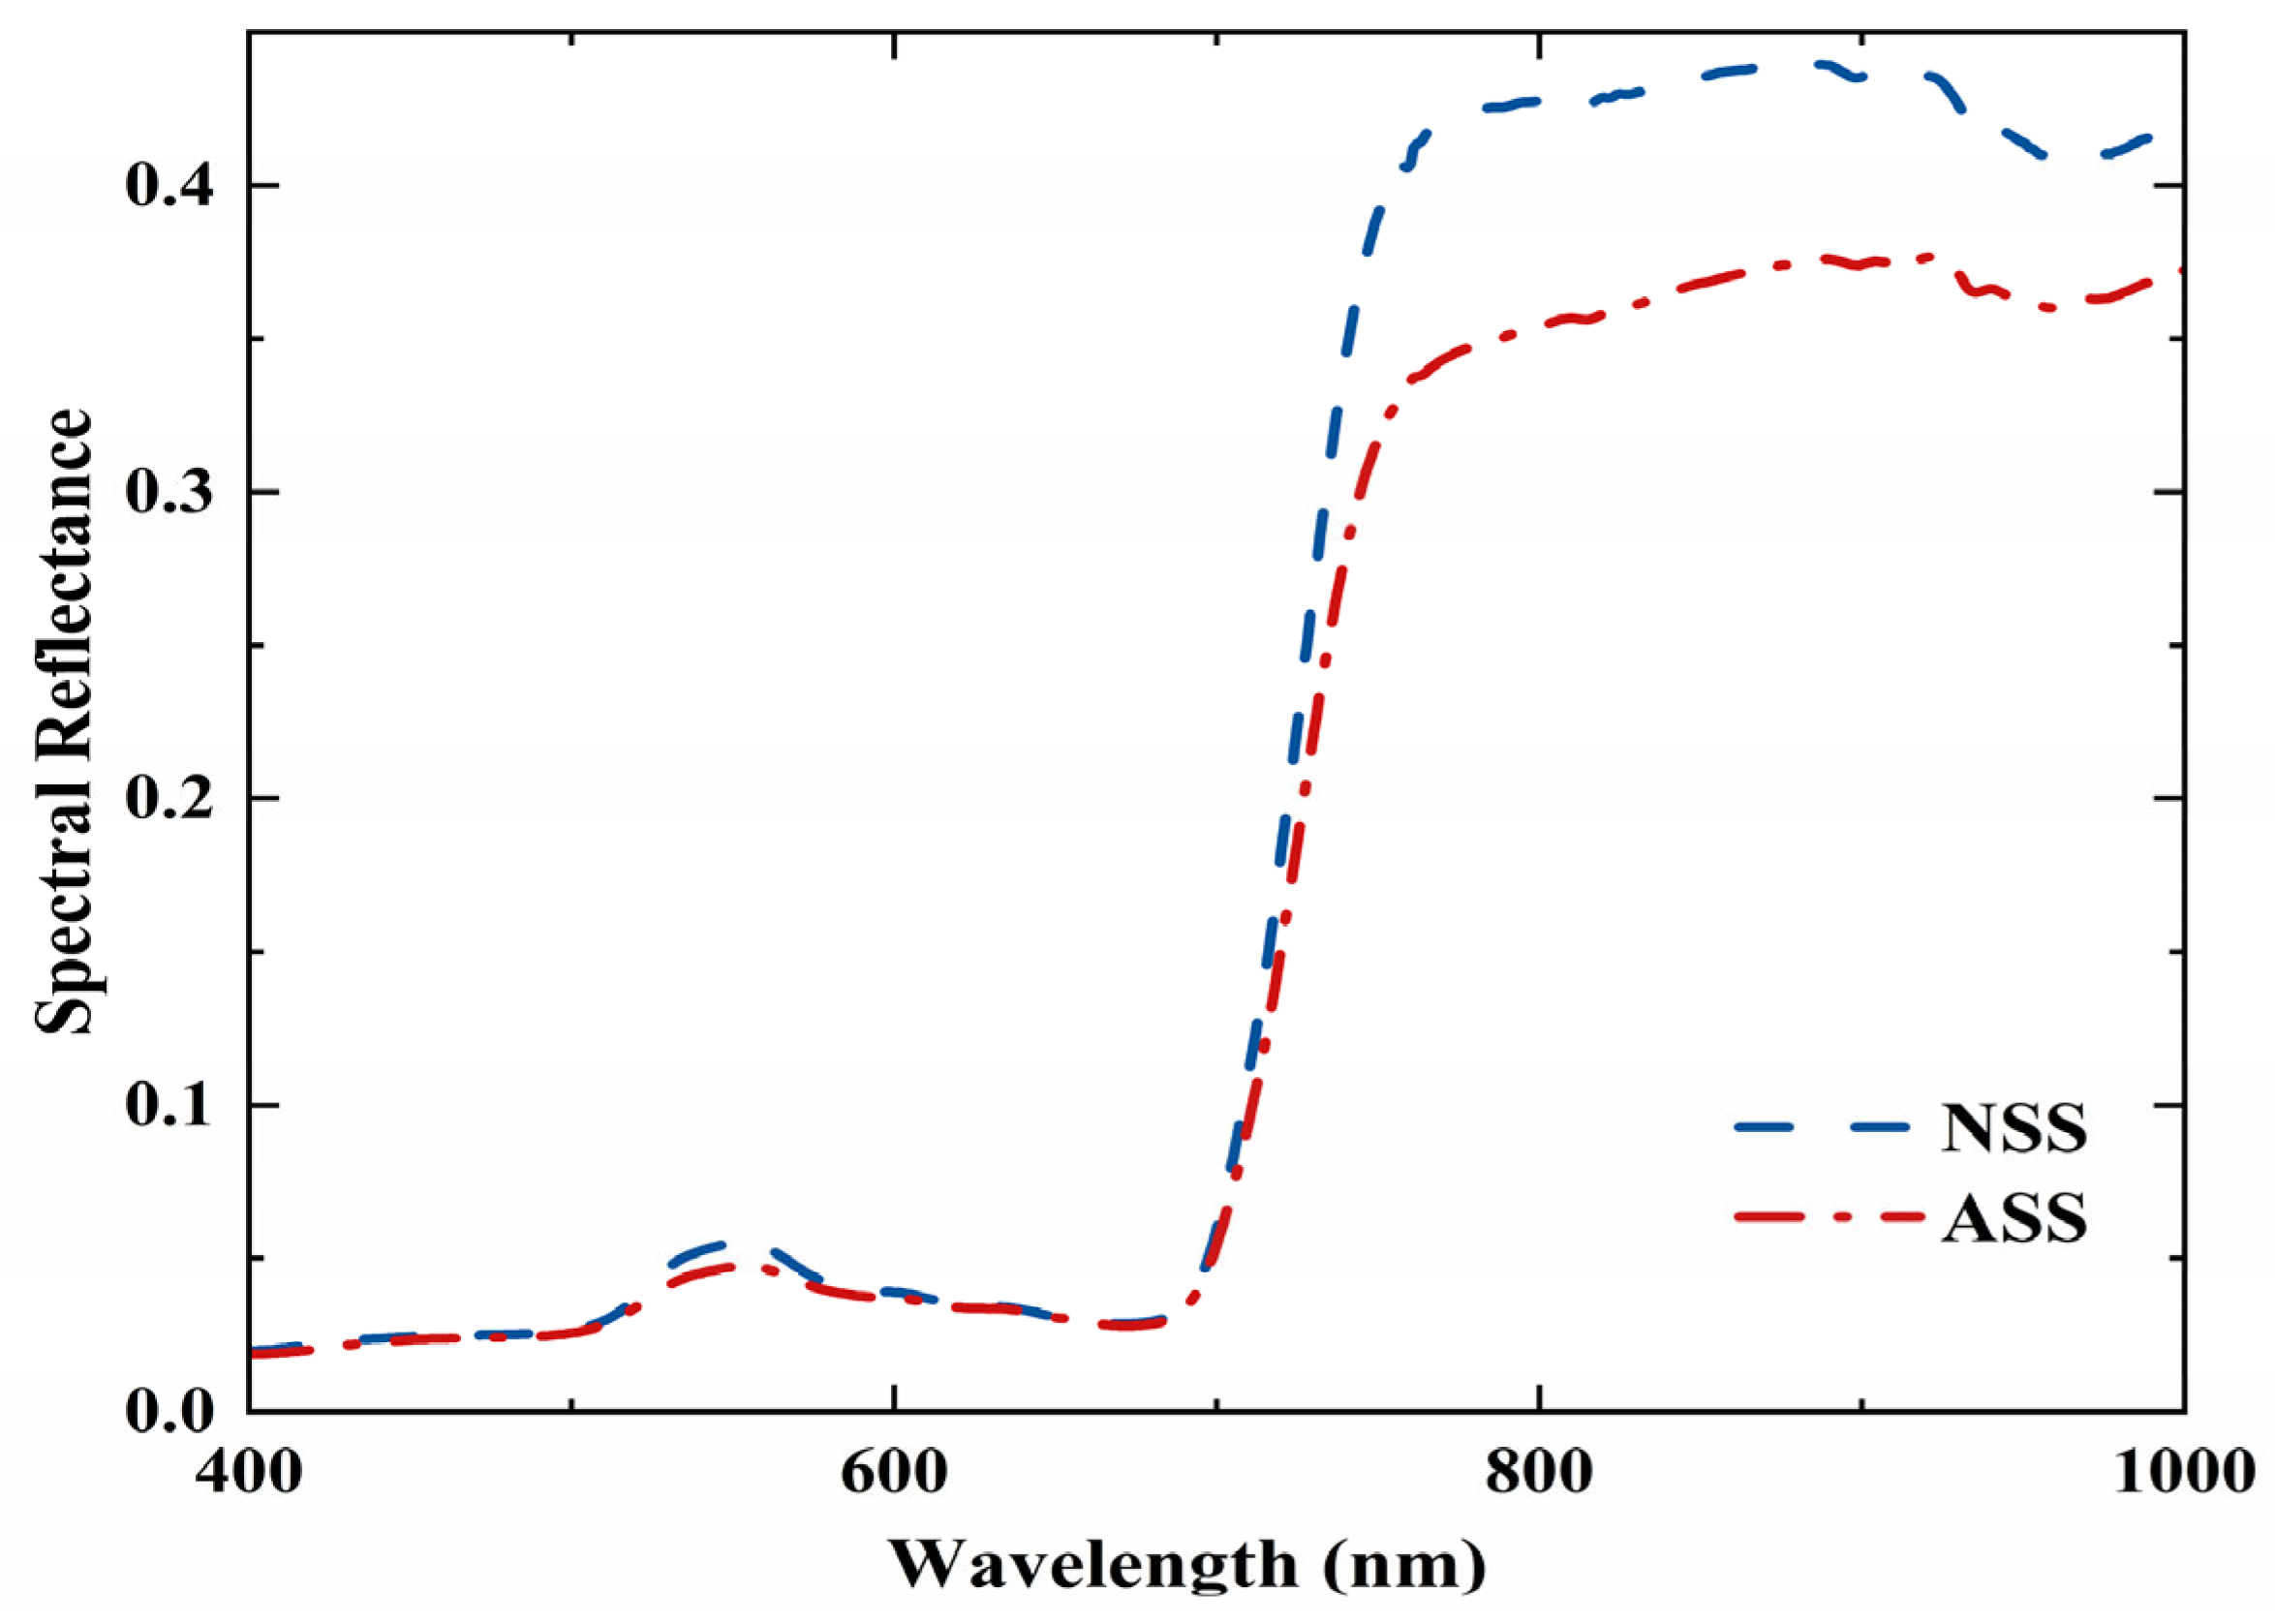
3.1. Analysis of Canopy Spectral Characteristics of Apple Tree During Key Fertility Period

Figure 2 shows the average values of canopy spectral reflectance for apple trees at the key fertility stages. The spectral reflectance curves of the NSS and ASS followed the same overall trend and shape; however, there were local variations. Specifically, in the 400–750 nm region, there is no discernible variation between the spectral curves of the NSS and ASS. In the 750–1000 nm range, the spectral reflectance of the NSS is clearly higher than that of the ASS, with the reflectance reaching about 0.45, whereas the reflectance of the ASS is only about 0.37, and the different fertility periods of apple trees can be clearly distinguished in this range. This is because, during the NSS, the apple tree canopy is dense, the leaves continue to grow and develop, the color continues to deepen, and the leaf area continues to increase, resulting in a certain degree of reflectance increase, whereas during the ASS, the apple leaves begin to age, and the near-infrared reflectance gradually decreases. Simultaneously, the substantial depression phenomena in the apple tree canopy during the NSS resulted in a drop in spectral reflectance.

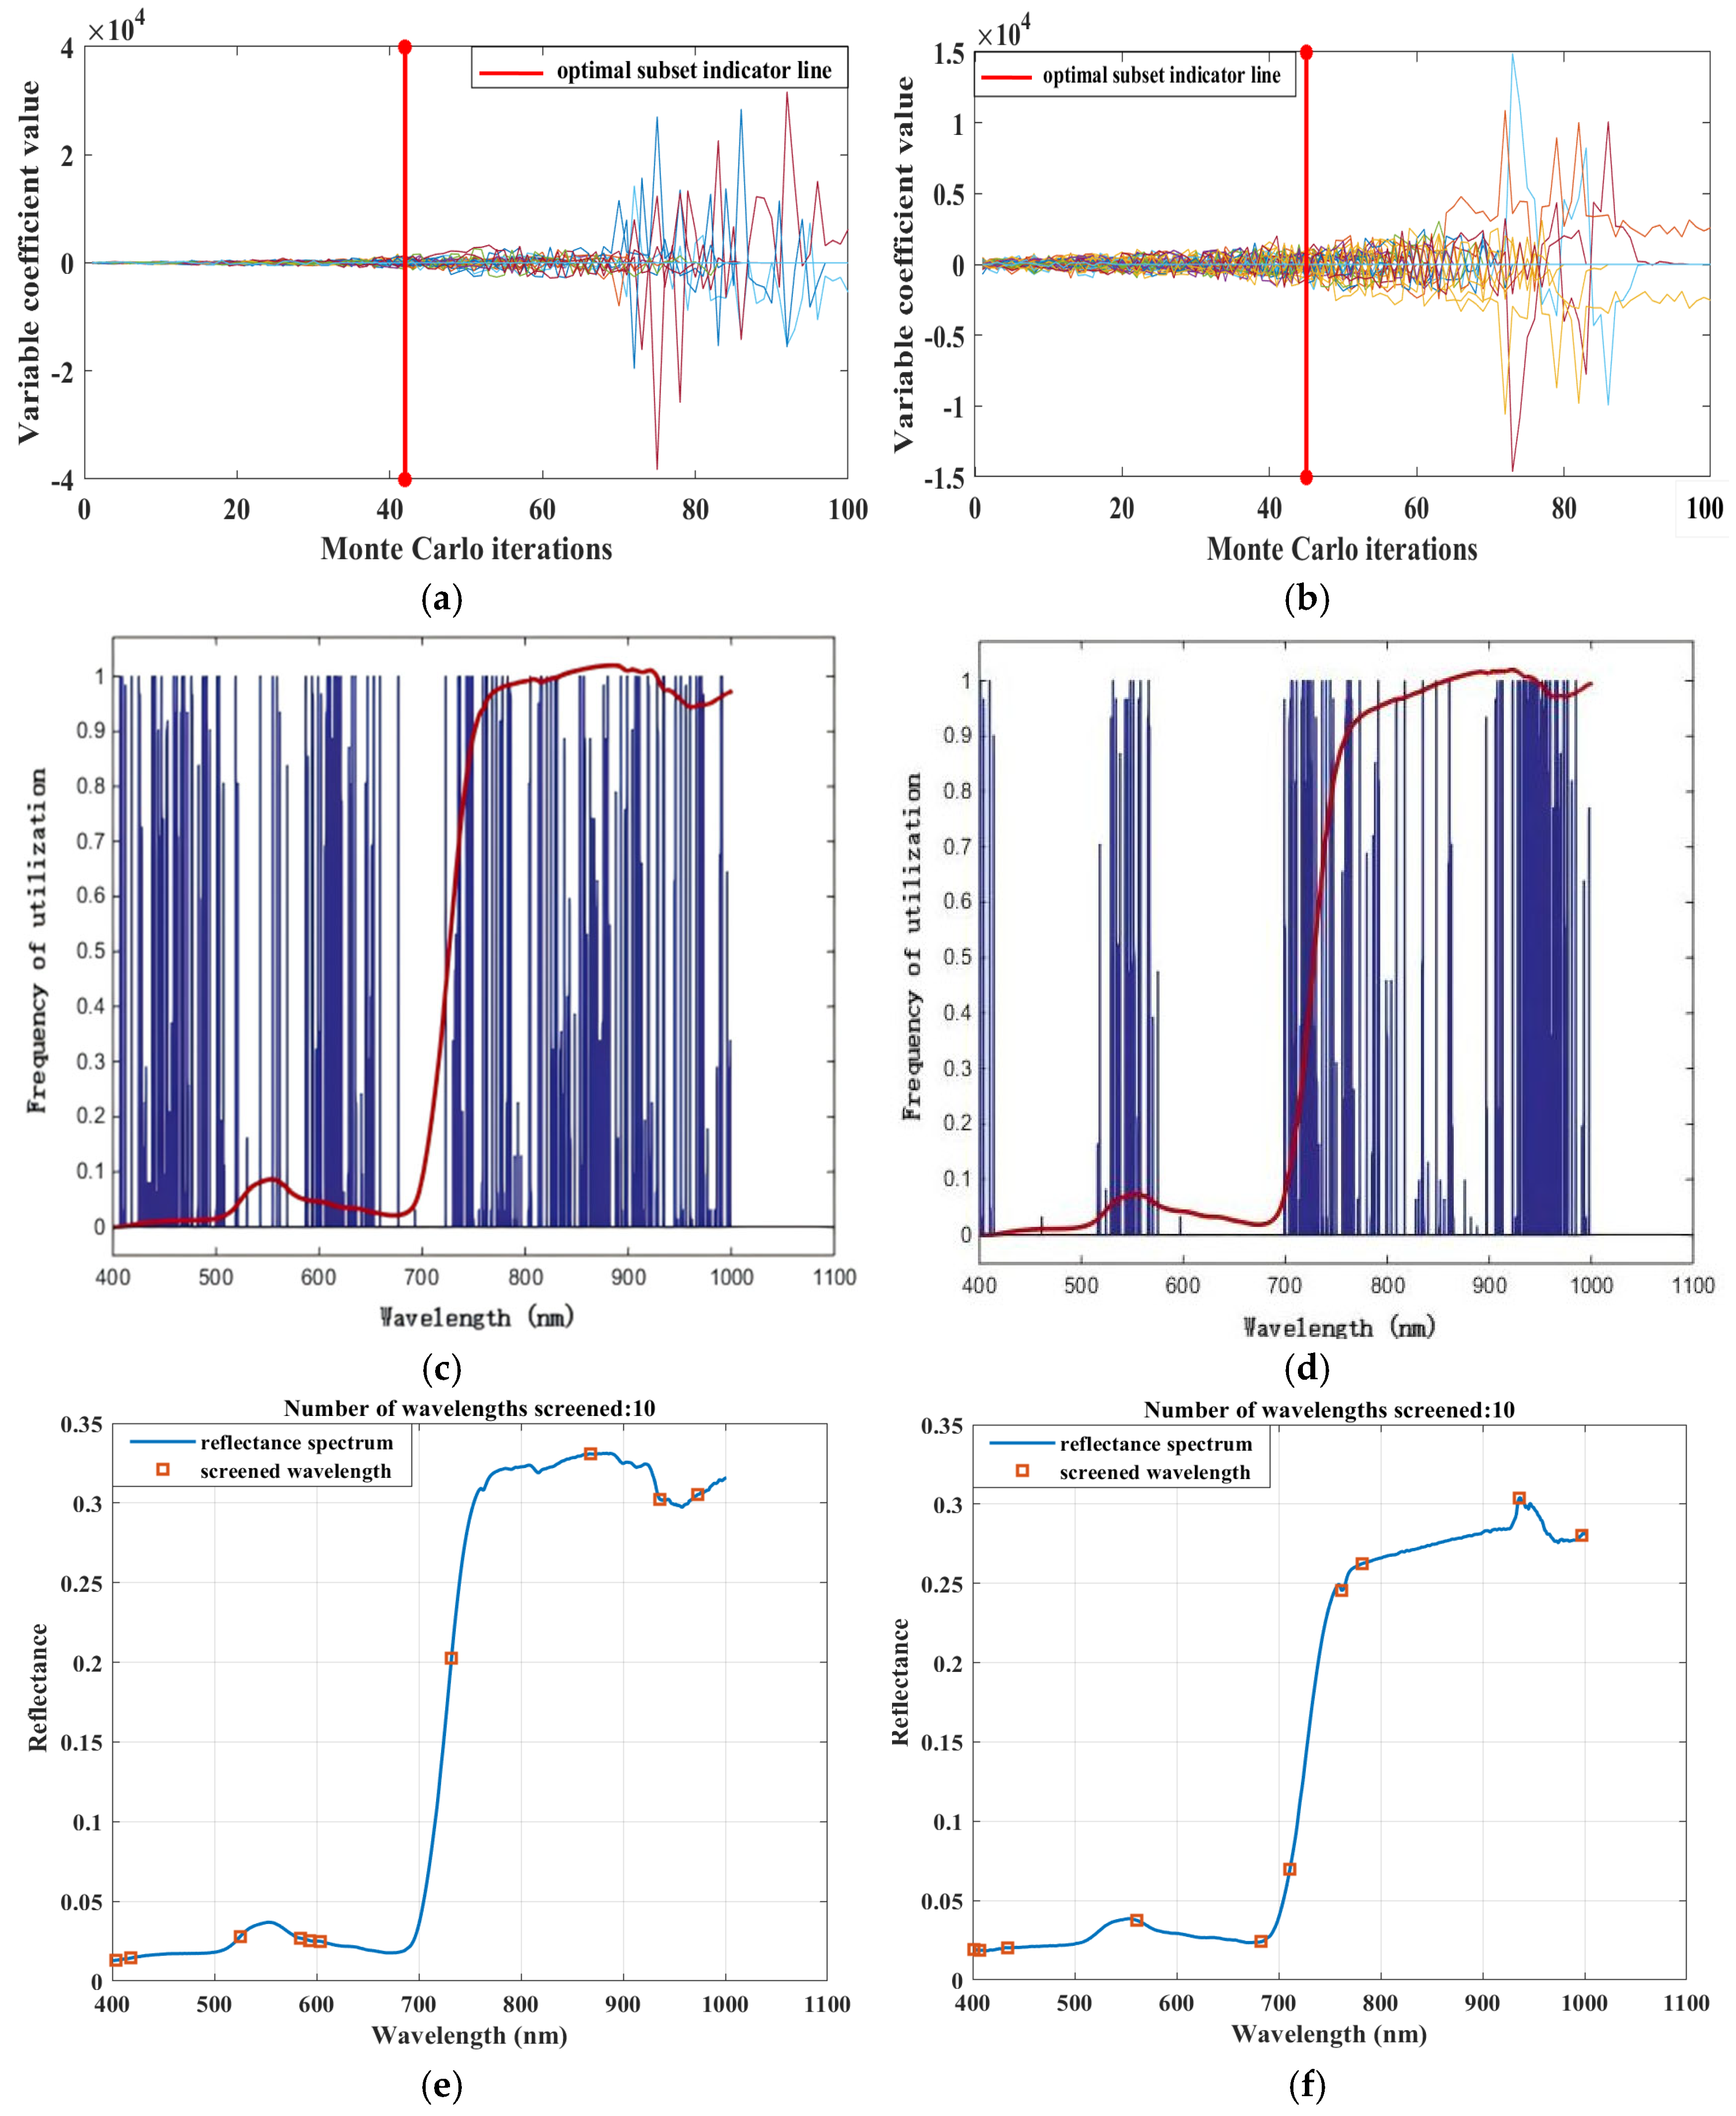
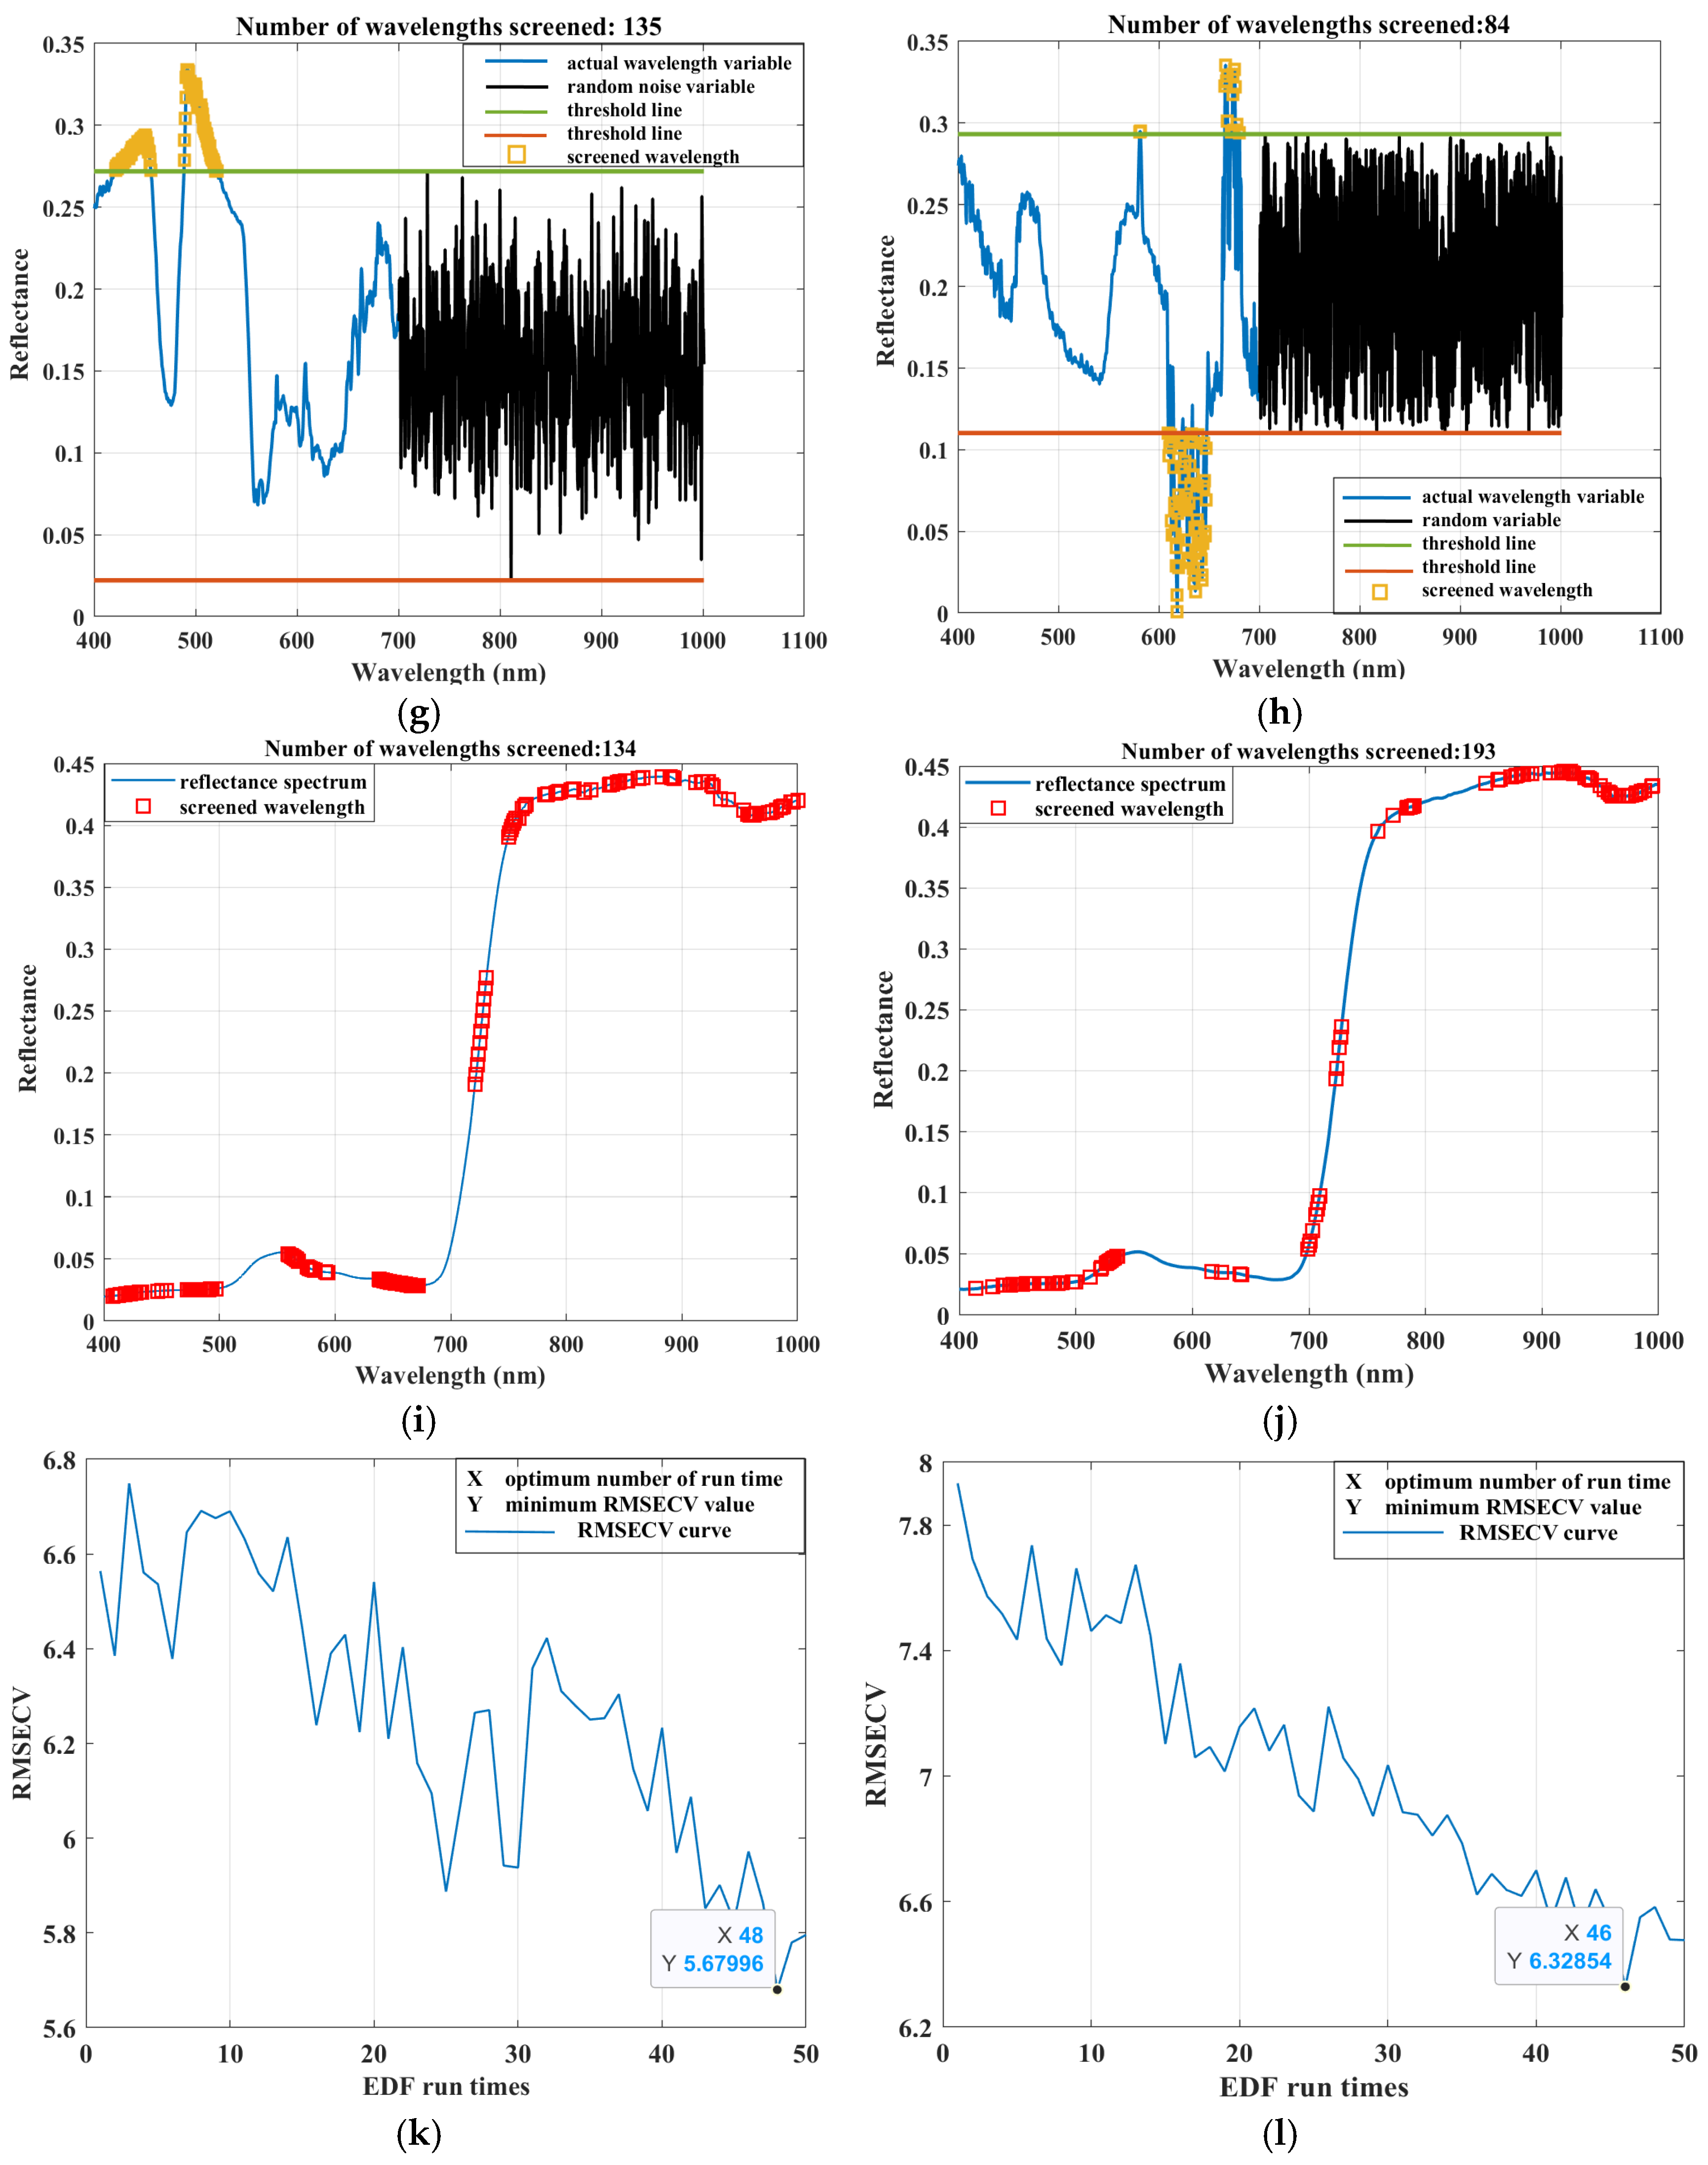
3.2. Analysis of the Results of Different Sensitive Wavelength Screening Algorithms

Figure 3a,b show the link between regression coefficient value and Monte Carlo iteration number when using the CARS algorithm to screen sensitive wavelengths. The red vertical line in the figure shows the smallest RMSECV value. As the number of Monte Carlo iterations increased, the number of wavelength variables decreased rapidly before stabilizing, and a large number of redundant variables unrelated to apple yield estimation were eliminated during the iteration process. During NSS and ASS, 42 and 45 sensitive wavelengths were screened, respectively.
Figure 3c,d show the result plots of sensitive wavelengths extracted by the GA algorithm; the left horizontal coordinate represents the spectral measurement range of 400–1000 nm, and the vertical coordinate indicates the frequency of use of each wavelength variable; the higher the peak value of the blue vertical line, the more frequently the wavelength variable is used. In NSS, 111 sensitive wavelengths were screened, accounting for 18.47% of the original number of wavelengths; in ASS, 150 sensitive wavelengths were screened, resulting in a 75.04% drop in the number of wavelengths.
Figure 3e,f show the results of the SPA algorithm’s screening of sensitive wavelengths. When the number of variables is 10, the RMSE value is minimized, and the red rectangle in the figure represents the chosen sensitive wavelength. The ten sensitive wavelengths chosen for NSS were 404, 418, 525, 584, 593, 604, 732, 868, 936, and 973 nm, whereas those for ASS were 401, 407, 434, 561, 683, 711, 762, 782, 936, and 997 nm.
Figure 3g,h show the running results of the UVE algorithm, with the blue curve on the left representing the actual wavelength variable and the black curve on the right representing the added random noise variable. The upper and lower horizontal lines represent the variable’s selected threshold, the variable between the threshold lines represents the deleted useless variable, and the variable marked in the yellow box outside the threshold line represents the selected sensitive wavelength. A total of 135 sensitive wavelengths were chosen during NSS and 84 during ASS.
The results of the VISSA algorithm are shown in Figure 3i,j, which show that the number of wavelengths screened is 134 for the NSS and 193 for the ASS.
Figure 3k,l are RMSECV curve variations observed during sensitive wavelength screening using the VCPA algorithm. As EDF operating times grow, the feature space shrinks, and RMSECV displays an overall declining trend, while the model’s prediction effect gradually improves. During NSS, eight sensitive wavelengths are screened out, including 411, 416, 425, 429, 464, 471, 651, and 653 nm. For the ASS, nine sensitive wavelengths were chosen, including 705, 917, 926, 938, 950, 957, 963, 974, and 995 nm.

3.3. Determination of Sensitive Wavelength Screening Algorithm

Table 2 shows the prediction results of PLSR models built with six single-sensitive wavelength screening methods during the apple crucial fertility period. When six single-screening algorithms were compared for the two key reproductive periods, the ASS had significantly higher R2 and RMSE indexes in the validation set of the PLSR model. This could be due to the fact that ASS is later in the growth and development phase of apples and contains more information about yield. Overall, ASS was more sensitive to apple yield; hence, it was chosen as the optimal fertility period for apple yield estimation.
In the apple yield estimation models for the ASS, the performance of the models constructed based on the CARS, GA, and VISSA algorithms was better than the models constructed by the other algorithms. The CARS-PLSR model had the highest accuracy, with R2 = 0.66 and RMSE = 7.97. The GA-PLSR and VISSA-PLSR models were somewhat less accurate, with R2 = 0.65, 8.19, and 8.72, respectively. Although the SPA, UVE, and VCPA algorithms downscaled the variables, they had poorer overall model accuracy than the other techniques. This shows that the CARS, GA, and VISSA algorithms are appropriate for undertaking apple yield-sensitive wavelength screening. However, the number of wavelength variables based on the three preferred algorithms were 45, 150, and 193, with compression rates of 92.51%, 75.04%, and 67.89%, respectively. The number of wavelengths remains high, and additional compression of the modeling data volume is required to improve the model’s computational efficiency and stability.

3.4. Determination of the Optimal Combination of Sensitive Wavelength Screening Algorithms

In order to further improve the calculation accuracy and efficiency of the model, the three selected algorithms are combined two by two. The VISSA algorithm is unstable when faced with a large number of complicated wavelength variables, the random generation of the sub-dataset, which results in the algorithm selecting a considerably larger number of sensitive wavelengths after a dimensionality reduction than the GA and CARS algorithms. The GA algorithm is sensitive to the size of the search space; when the search space is small, the algorithm is relatively stable and easy to search for the optimal solution; however, when the search space is large, the algorithm’s poor convergence makes it difficult to find the optimal solution. The CARS algorithm is influenced by the operation of the EDF, and the selection of sensitive wavelengths can be realized during the model operation to further eliminate redundant variables, so we designed a combination of three types of algorithms, namely VISSA-GA, VISSA-CARS, and GA-CARS, to perform secondary dimensionality reduction of the data.
Table 3 shows the results of apple yield estimation using the combined sensitive wavelength screening algorithms. As shown in Table 3, 32, 29, and 21 sensitive wavelength variables were extracted for VISSA-GA, VISSA-CARS, and GA-CARS combined algorithms, with variable compression rates all reaching around 95%, greatly simplifying the model parameters and optimizing the model structure. Reconstruction of the PLSR model revealed that the overall accuracy of the yield estimation model established based on the combination algorithms was improved to some extent compared to that of a single algorithm. The model based on the VISSA-CARS algorithm had the highest accuracy, with a coefficient of determination of the training set of R2 = 0.90 and root mean square error (RMSE) = 3.60, and a validation set of R2 = 0.71 and RMSE = 7.07. As a result, it was concluded that the VISSA-CARS was the best sensitive wavelength combination screening algorithm for further apple yield estimation modeling.

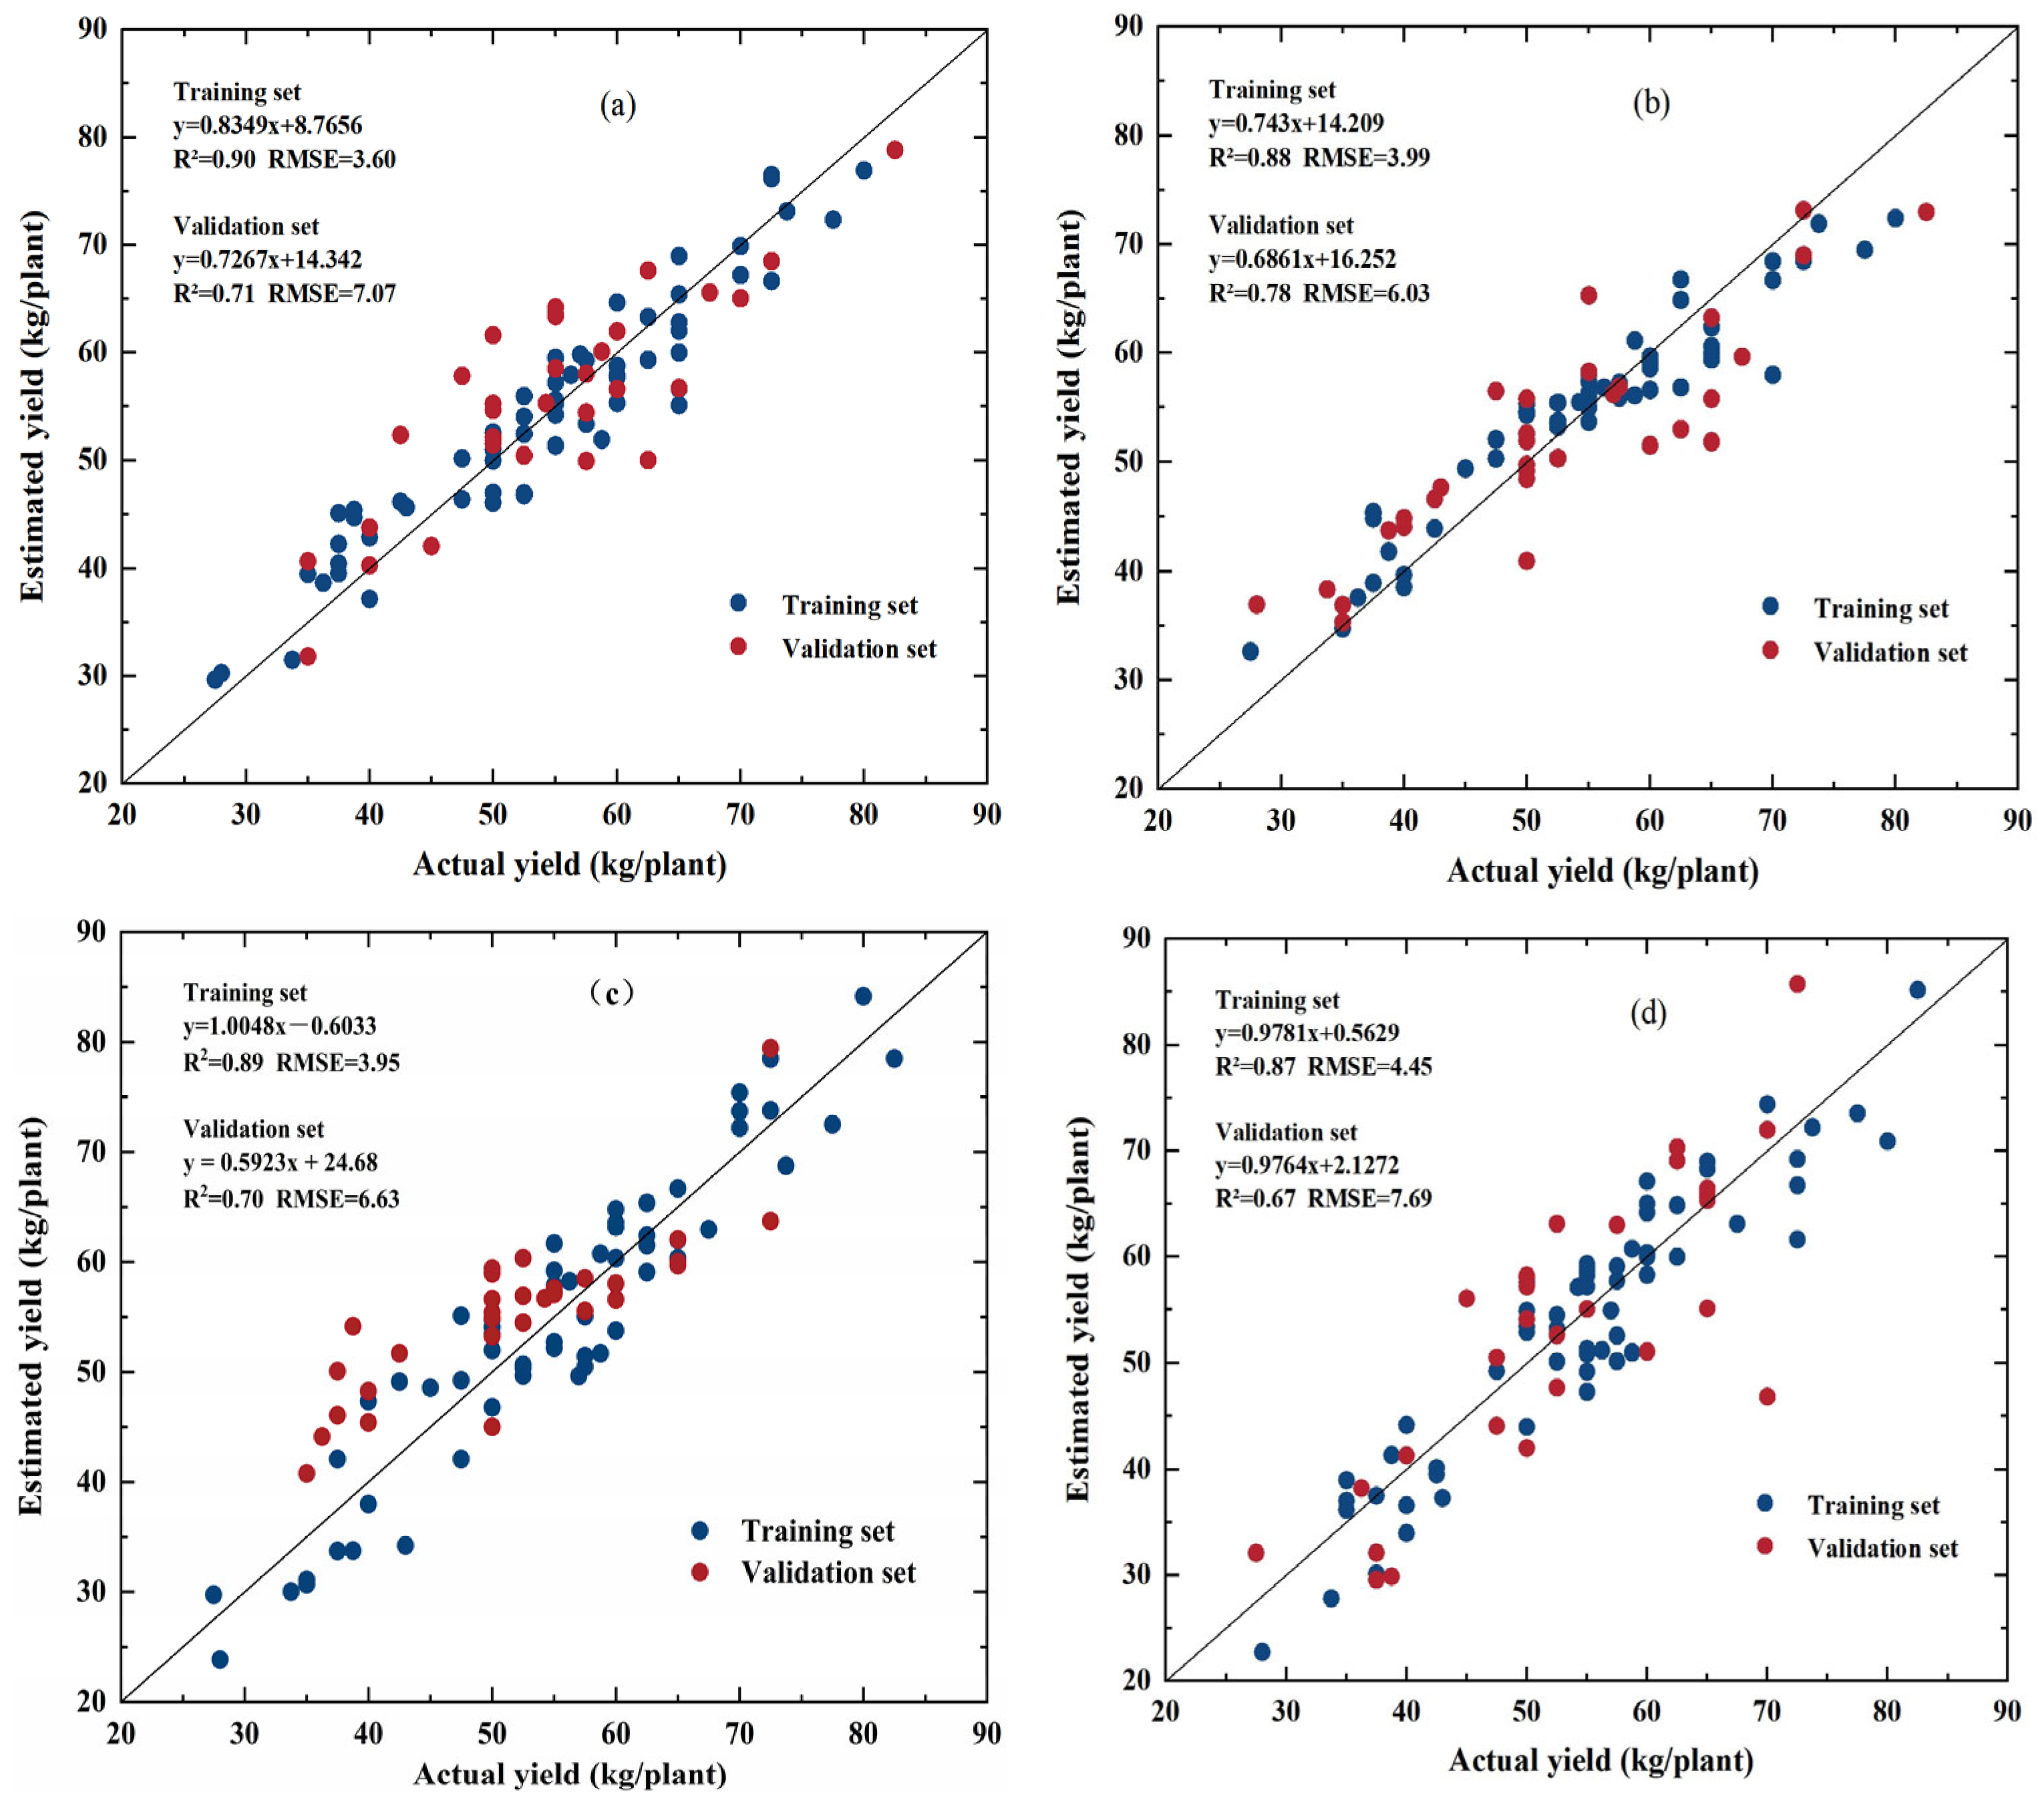
3.5. Construction and Validation of Apple Yield Estimation Models

The sensitive wavelengths screened by the VISSA-CARS algorithm served as input variables, and four methods, PLSR, RF, Cubist, and XGBoost, were used to build apple yield estimating models, as shown in Figure 4 and Table 4. The established apple yield estimation exhibited generally good results, with R2 of PLSR, RF, Cubist, and XGBoost validation sets being 0.71, 0.78, 0.70, and 0.67, respectively, while RMSE values were 7.07, 6.03, 6.63, and 7.69. The RF model provides the highest R2 and lowest RMSE for yield estimation. According to the model accuracy evaluation index, the higher the R2 and the lower the RMSE, the higher the estimating model’s accuracy and stability. As a result, the VISSA-CARS-RF model was selected as the most appropriate yield-estimating model for this study.
The results prove that the combined sensitive wavelength screening method has a positive influence on effective wavelength variable extraction, reduces spectral data dimensionality while shortening modeling time, and enhances modeling efficiency and robustness.

4. Discussion

For crop yield estimation by remote sensing, accurate selection of the best fertility period is an important link. In this study, the accuracy of the apple yield estimation model was higher based on the sensitive wavelength screened for the ASS. According to the findings of relevant studies on fruit tree yield estimation using remote sensing data, there is a strong association between fruit tree yield and remote sensing data or vegetation index in the late growth stage of fruit trees [36,37]. It has been discovered that jujube yield had the strongest correlation with the vegetation index at the late growth stage (red ripening stage), which could be due to the fact that at the late fruit growth stage, the fruit tree branches and leaves are fully developed, and the vegetation information reflected in the fruit tree canopy is more abundant [38]. Although this study determined that the autumn shoot stop-growing stage was the optimal fertility period for estimating fruit tree yield, due to the short time between the autumn shoot stop-growing stage and the apple harvest season, there is insufficient practical guidance for fruit farmers to plan various aspects of orchard harvest. As a result, whether the research findings on the ideal development time for estimating fruit tree yield can be used to practical production planning requires further investigation.
Hyperspectral data are characterized by their high data volume and redundant information. Therefore, when using hyperspectral data for model construction, most researchers have prioritized the screening of sensitive wavelengths to minimize redundant variables and increase model calculation efficiency and accuracy. Previous research has demonstrated that a single sensitive wavelength screening method performs better in identifying wavelengths with significant association with the target variables and can reduce the dimensionality of the spectral data [39,40]. Comparing the number of sensitive wavelengths screened and the results of the inversion model established using the single algorithm and the combined algorithm, it can be found that the most effective sensitive wavelengths can be extracted to the maximum extent by using the combined algorithm, and the accuracy of the inversion model established by the screened sensitive wavelengths has been significantly improved [41,42]. VISSA-GA improved R2 by 0.03 and reduced RMSE by 0.36 and 0.89 over the single algorithm, while VISSA-CARS improved R2 by 0.06 and reduced RMSE by 0.92 and 1.63. GA-CARS also improved R2 by 0.03 and reduced RMSE by 0.51 and 0.29 over the single algorithm. The fundamental reason is that the combined method can compensate for the fact that a single algorithm screens for a greater concentration of sensitive wavelength variables, solves the problem of missing spectral information to some extent, and increases the diversity of sensitive wavelengths, resulting in the superior performance of sensitive wavelength extraction. This new yield estimation method, which is suitable for complex data processing, can effectively address the challenges posed by nonlinear factors and highly correlated data during crop growth, serve as a reference for future crop yield estimation, and promote the development of intelligent and digital agriculture.
In this study, apple yield estimation was carried out based on hyperspectral data, and although a good inversion accuracy was achieved, given that the experiment only used ASD non-imaging hyperspectral data and could not visualize apple yield data, the combination of near-earth hyperspectral with unmanned aerial vehicle (UAV) and satellite remote sensing data is considered in future research to visualize the fruit yield estimation data while meeting the accuracy. Second, this study uses Fuji fruit trees from the apple orchard in Qixia City, Shandong Province, as the research sample. Many provinces in China, such as Shaanxi, Hebei, and Henan, currently have their own distinct variations; therefore, whether the study method described in this paper is applicable to fruit tree samples from other places requires additional investigation and verification. As a result, in the following study, we will attempt to broaden the scope of the study area by selecting multiple major producing areas and apple cultivation varieties to conduct the study in order to provide richer and more mature experimental data and research ideas for future apple yield estimation. Furthermore, this study used the linear model (PLSR) and machine learning models (RF, Cubist, XGBoost) to achieve good inversion results, but it did not investigate whether other models are better suited for modeling and analyzing hyperspectral data. In future research, attempts will be made to use more algorithms, such as SVM, CNN machine learning algorithms, and deep learning algorithms such as convolutional neural networks, as well as more metrics to evaluate the accuracy of the models, such as AIC, in order to further the research on apple yield estimation.

5. Conclusions

This study employed hyperspectral data from the apple canopy during the spring and autumn shoot stop-growing stages. Based on six sensitive wavelength screening algorithms, CARS, GA, SPA, UVE, VISSA, and VCPA, a pairwise combination of the three algorithms was chosen to screen the sensitive wavelengths in the canopy spectrum using the best combination algorithm, and the apple tree yield estimation model was built. The autumn shoot stop-growing stage is the best fertility period for yield estimation. CARS, GA, and VISSA algorithms performed better among all the sensitive wavelength screening algorithms. After combining the three algorithms two by two, the VISSA-CARS algorithm combination was the best. The optimal model constructed by using this combination for apple yield estimation was VISSA-CARS-RF, with the validation set reaching R2 and RMSE of 0.78 and 6.03.

Author Contributions

Conceptualization, A.Q., J.S. and X.Z.; methodology, A.Q., M.L. and C.L.; formal analysis, A.Q., J.S. and L.W.; writing—original draft preparation, A.Q.; writing—review and editing, A.Q., J.S. and X.Z.; visualization, A.Q., C.L., L.W. and X.Y.; supervision, Y.J. All authors have read and agreed to the published version of the manuscript.

Funding

This research was supported by the National Natural Science Foundation of China (42171378) and the Shandong Taishan Scholars Climbing Program.

Data Availability Statement

Data are contained within the article.

Acknowledgments

We would like to thank the kind help of the editor and the reviewers for improving the manuscript.

Conflicts of Interest

The authors declare no conflicts of interest.

References

  1. Chen, R.W.; Wang, J.; Li, Y.; Bai, R.; Huang, M.X.; Zhang, Z.Z.; Zhao, L.X.; Qu, Z.J.; Liu, L. Higher risk of spring frost under future climate change across China’s apple planting regions. Eur. J. Agron. 2024, 159, 127288. [Google Scholar] [CrossRef]
  2. Shi, J.; Li, B.Y.; Wang, S.L.; Zhang, W.; Shang, M.Q.; Wang, Y.Z.; Liu, B.Y. Occurrence of Neopestalotiopsis clavispora Causing Apple Leaf Spot in China. Agronomy 2024, 14, 1658. [Google Scholar] [CrossRef]
  3. Zhang, X.X.; Song, Z.P.; Liang, Q.Y.; Gao, S.M. Yield and maturity estimation of apples in orchards using a 3-step deep learning-based method. Qual. Assur. Saf. Crop. Foods 2022, 14, 101–111. [Google Scholar] [CrossRef]
  4. Robson, A.; Rahman, M.M.; Muir, J. Using WorldView satellite imagery to map yield in Avocado: A Case Study in Bundaberg, Australia. Remote Sens. 2017, 9, 1223. [Google Scholar] [CrossRef]
  5. Xia, X.; Chai, X.J.; Zhang, N.; Zhang, Z.; Sun, Q.X.; Sun, T. Culling double counting in sequence images for fruit yield estimation. Agronomy 2022, 12, 440. [Google Scholar] [CrossRef]
  6. Feng, H.K.; Tao, H.L.; Fan, Y.G.; Liu, Y.; Li, Z.H.; Yang, G.J.; Zhao, C.J. Comparison of winter wheat yield estimation based on near-surface hyperspectral and UAV hyperspectral remote sensing data. Remote Sens. 2022, 14, 4158. [Google Scholar] [CrossRef]
  7. Lu, J.S.; Chen, S.M.; Huang, W.M. Estimation of aboveground biomass and leaf area index of summer maize using SE-(PLS)-ELM model. Trans. Chin. Soc. Agric. Eng. (Trans. CSAE) 2021, 37, 128–135. [Google Scholar]
  8. Jing, X.; Zhang, J.; Wang, J.J.; Ming, S.K.; Fu, Y.Q.; Feng, H.K.; Song, X.Y. Comparison of Machine Learning Algorithms for Remote Sensing Monitoring of Rice Yields. Spectrosc. Spectr. Anal. 2022, 42, 1620–1627. [Google Scholar]
  9. An, L.L.; Liu, Y.; Liu, G.H.; Zhao, R.M.; Tang, W.J.; Liu, M.J.; Li, J.M.; Li, Z.; Sun, H.; Li, M.Z.; et al. Estimation on powdery mildew of wheat canopy based on in-situ hyperspectral responses and characteristic wavelengths optimization. Crop Prot. 2024, 184, 106804. [Google Scholar] [CrossRef]
  10. Hou, Y.N.; Zhu, W.Z.; Wang, E.L. Hyperspectral mineral target detection based on density peak. Intell. Autom. Soft Comput. 2019, 25, 805–814. [Google Scholar] [CrossRef]
  11. Guo, F.; Xu, Z.; Ma, H.H.; Liu, X.J.; Yang, Z.; Tang, S.Q. A comparative study of the hyperspectral inversion models based on the PCA for retrieving the Cd content in the soil. Spectrosc. Spectr. Anal. 2021, 41, 1625–1630. [Google Scholar]
  12. Santos-Rufo, A.; Mesas-Carrascosa, F.J.; García-Ferrer, A.; Meroño-Larriva, J.E. Wavelength Selection Method Based on Partial Least Square from Hyperspectral Unmanned Aerial Vehicle Orthomosaic of Irrigated Olive Orchards. Remote Sens. 2020, 12, 3426. [Google Scholar] [CrossRef]
  13. Meng, F.J.; Luo, S.; Wu, Y.F.; Sun, H.; Liu, F.; Li, M.Z.; Huang, W.; Li, M. Characteristic extraction method and discriminant model of ear rot of maize seed base on NIR spectra. Spectrosc. Spectr. Anal. 2022, 42, 1716–1720. [Google Scholar]
  14. Liu, Y.; Zhang, H.; Feng, H.K.; Sun, Q.; Huang, J.; Wang, J.J.; Yang, G.J. Estimation of potato above ground biomass based on hyperspectral images of UAV. Spectrosc. Spectr. Anal. 2021, 41, 2657–2664. [Google Scholar]
  15. Zhang, D.F.; Zhang, J.; Peng, B. Hyperspectral model based on genetic algorithm and SA-1DCNN for predicting Chinese cabbage chlorophyll content. Sci. Hortic. 2023, 321, 112334. [Google Scholar] [CrossRef]
  16. Han, J.; Li, Y.Z.; Cao, Z.M.; Liu, Q.; Mou, H.W. Water content prediction for high water-cut crude oil based on SPA-PLS using near infrared spectroscopy. Spectrosc. Spectr. Anal. 2019, 39, 3452–3458. [Google Scholar]
  17. Zhou, X.; Sun, J.; Tian, Y.; Wu, X.; Dai, C.; Li, B. Spectral classification of lettuce cadmium stress based on information fusion and VISSA-GOA-SVM algorithm. J. Food Process Eng. 2019, 10, 1111. [Google Scholar] [CrossRef]
  18. Ali Hameed, A.; Jamil, A.; Seyyedabbasi, A. An optimized feature selection approach using sand Cat Swarm optimization for hyperspectral image classification. Infrared Phys. Technol. 2024, 141, 105449. [Google Scholar] [CrossRef]
  19. Li, X.; Liu, J.P.; Huang, Q.; Hu, P.W. Optimization of prediction model for milk fat content based on improved whale optimization algorithm. Spectrosc. Spectr. Anal. 2023, 43, 2779–2784. [Google Scholar]
  20. Shen, Y.; Zhan, X.X.; Huang, C.H.; Xie, Y.P.; Guo, C.X.; Huang, F. Rapid determination of chlorella sorokiniana lutein production based on snapshot multispectral feature wavelengths. Spectrosc. Spectr. Anal. 2024, 44, 2216–2223. [Google Scholar]
  21. Yu, L.; Zhang, T.; Zhu, Y.X.; Zhou, Y.; Xia, T.; Nie, Y. Determination of soybean leaf SPAD value using characteristic wavelength variables preferably selected by IRIV algorithm. Trans. Chin. Soc. Agric. Eng. (Trans. CSAE) 2018, 34, 148–154. [Google Scholar]
  22. Li, W.; Zhu, X.C.; Yu, X.Y.; Li, M.X.; Tang, X.Y.; Zhang, J.; Xue, Y.L.; Zhang, C.T.; Jiang, Y.M. Inversion of nitrogen concentration in apple canopy based on UAV hyperspectral images. Sensors 2022, 22, 3503. [Google Scholar] [CrossRef] [PubMed]
  23. Wei, L.F.; Pu, H.C.; Wang, Z.X.; Yuan, Z.R.; Yan, X.R.; Cao, L.Q. Estimation of soil arsenic content with hyperspectral remote sensing. Sensors 2020, 20, 4056. [Google Scholar] [CrossRef]
  24. Ji, H.; Wang, W.Z.; Chong, D.; Zhang, B.Y. CARS algorithm-based detection of wheat moisture content before harvest. Symmetry 2020, 12, 115. [Google Scholar] [CrossRef]
  25. Pang, L.; Wang, J.; Men, S.; Yan, L.; Xiao, J. Hyperspectral imaging coupled with multivariate methods for seed vitality estimation and forecast for quercus variabilis. Spectrochim. Acta Part A-Mol. Biomol. Spectrosc. 2020, 245, 118888. [Google Scholar] [CrossRef]
  26. Xu, L.J.; Zheng, L.N.; Huang, P.; Chen, H.; Kang, Z.L. Detection of kiwifruit dry matter content based on hyperspectral technology using uninformed variable elimination coupled with successive projection algorithm. Dyna 2020, 95, 654–660. [Google Scholar] [CrossRef] [PubMed]
  27. Tian, Y.; Sun, J.; Zhou, X.; Wu, X.H.; Lu, B.; Dai, C.X. Research on apple origin classification based on variable iterative space shrinkage approach with stepwise regression-support vector machine algorithm and visible-near infrared hyperspectral imaging. J. Food Process Eng. 2020, 43, 8. [Google Scholar] [CrossRef]
  28. Chen, T.; Guo, H.; Yuan, M.; Tan, F.Y.; Li, Y.Z.; Li, M.L. Recognition of different parts of wild cordyceps sinensis based on infrared spectrum. Spectrosc. Spectr. Anal. 2021, 41, 3727–3732. [Google Scholar]
  29. Jiang, H.; Lu, J.G. Using an optimal CC-PLSR-RBFNN model and NIR spectroscopy for the starch content determination in corn. Spectrochim. Acta Part A-Mol. Biomol. Spectrosc. 2018, 196, 131–140. [Google Scholar] [CrossRef] [PubMed]
  30. Liland, K.H.; Stefansson, P.; Indahl, U.G. Much faster cross-validation in PLSR-modelling by avoiding redundant calculations. J. Chemom. 2020, 34, 3. [Google Scholar] [CrossRef]
  31. Chen, X.; Li, F.; Shi, B.; Chang, Q. Estimation of winter wheat plant nitrogen concentration from UAV hyperspectral remote sensing combined with machine learning methods. Remote Sens. 2023, 15, 2831. [Google Scholar] [CrossRef]
  32. John, K.; Kebonye, N.M.; Agyeman, P.C.; Ahado, S.K. Comparison of cubist models for soil organic carbon prediction via portable XRF measured data. Environ. Monit. Assess. 2021, 193, 1–15. [Google Scholar] [CrossRef] [PubMed]
  33. Zhang, Q.; Liu, M.; Zhang, Y.; Mao, D.; Li, F.; Wu, F.; Song, J.; Li, X.; Kou, C.; Li, C. Comparison of Machine Learning Methods for Predicting Soil Total Nitrogen Content UsingLandsat-8, Sentinel-1 and Sentinel-2 Images. Remote Sens. 2023, 15, 2907. [Google Scholar] [CrossRef]
  34. Zheng, K.Y.; Feng, T.; Zhang, W.; Huang, X.W.; Li, Z.H.; Zhang, D.; Shi, J.Y.; Marunaka, Y.; Zou, X.B. Weighted SPXYE (WSPXYE) and its application to transfer set selection in near infrared spectra. Spectrosc. Spectr. Anal. 2021, 41, 984–989. [Google Scholar]
  35. Wang, Y.; Li, M.; Ji, R.; Wang, M.; Zheng, L. A deep learning-based method for screening soil total nitrogen characteristic wavelengths. Comput. Electron. Agric. 2021, 10, 1016. [Google Scholar] [CrossRef]
  36. Rahman, M.M.; Robson, A.; Bristow, M. Exploring the potential of high resolution WorldView-3 imagery for estimating yield of mango. Remote Sens. 2018, 10, 1866. [Google Scholar] [CrossRef]
  37. Van Beek, J.; Tits, L.; Somers, B.; Deckers, T.; Verjans, W.; Bylemans, D.; Janssens, P.; Coppin, P. Temporal dependency of yield and quality estimation through spectral vegetation indices in pear orchards. Remote Sens. 2015, 7, 9886–9903. [Google Scholar] [CrossRef]
  38. Bai, T.; Wang, S.; Meng, W.; Zhang, N.; Wang, T.; Chen, Y.; Mercatoris, B. Assimilation of remotely-sensed LAI into WOFOST model with the SUBPLEX algorithm for improving the field-scale jujube yield forecasts. Remote Sens. 2019, 11, 1945. [Google Scholar] [CrossRef]
  39. Zhao, M.S.; Wang, T.; Lu, Y.; Wang, S.; Wu, Y. Improved multivariate modeling for soil organic matter content estimation using hyperspectral indexes and characteristic bands. PLoS ONE 2023, 10, 1371. [Google Scholar] [CrossRef]
  40. Chen, X.Y.; Lv, X.; Ma, L.L.; Chen, A.Q.; Zhang, Q.; Zhang, Z. Optimization and Validation of Hyperspectral Estimation Capability of Cotton Leaf Nitrogen Based on SPA and RF. Remote Sens. 2022, 14, 5201. [Google Scholar] [CrossRef]
  41. Li, Y.; Li, C.L.; Wang, X.; Fan, P.F.; Li, Y.K.; Zhai, C.Y. Identification of cucumber disease and insect pest based on hyperspectral imaging. Spectrosc. Spectr. Anal. 2024, 44, 301–309. [Google Scholar]
  42. Liu, X.B.; Su, T.; Lei, B.; Zhu, F.; Di, J.N.; Meng, C.; Xu, L.Q.; Wang, R.Y. Inverse model for the photosynthetic pigment content of peanut leaves using coupling algorithm. Trans. Chin. Soc. Agric. Eng. (Trans. CSAE) 2023, 39, 198–207. [Google Scholar]
Figure 1. Location of the study area and the test area. A–E in the figure represents the five test areas.
Sustainability 17 00518 g001
Figure 2. Spectral curves of apple tree canopy during the NSS and ASS.
Sustainability 17 00518 g002
Figure 3. The process of screening sensitive wavelengths for different algorithms during the NSS and ASS: (a) CARS (NSS); (b) CARS (ASS); (c) GA (NSS); (d) GA (ASS); (e) SPA (NSS); (f) SPA (ASS); (g) UVE (NSS); (h) UVE (ASS); (i) VISSA (NSS); (j) VISSA (ASS); (k) VCPA (NSS); (l) VCPA (ASS).
Sustainability 17 00518 g003aSustainability 17 00518 g003b
Figure 4. Prediction results of apple yield based on different inversion models: (a) PLSR; (b) RF; (c) Cubist; (d) XGBoost.
Sustainability 17 00518 g004
Table 1. Statistical indices of apple tree yield.
DatasetSamplesMax (kg/Plant)Min (kg/Plant)Avg (kg/Plant)SD
(kg/Plant)
CV (%)
Total9382.527.554.2211.7521.67
Training Set6277.527.553.1010.9120.55
Validation Set3182.528.056.4513.1823.35
Note: Max, Min, Avg, SD, and CV represent the maximum, minimum, average, standard deviation, and coefficient of variations in apple yield, respectively.
Table 2. Accuracy evaluation results of apple orchard ground feature classification.
Key Fertility StageScreening AlgorithmNumber of Wavelength VariablesValidation Set
R2RMSE
Spring Shoot
Stop-Growing
Stage
(NSS)
CARS420.549.88
GA1110.3710.72
SPA100.1513.22
UVE1350.2212.43
VISSA1340.2512.34
VCPA80.4210.52
Autumn Shoot
Stop-Growing
Stage
(ASS)
CARS450.667.97
GA1500.658.19
SPA100.638.63
UVE840.609.67
VISSA1930.658.72
VCPA90.647.89
Table 3. Results of apple yield estimation based on coupled sensitive wavelength screening algorithm.
Screening AlgorithmNumber of Wavelength VariablesVariable Compression RatioValidation Set
R2RMSE
VISSA-GA3294.68%0.687.83
VISSA-CARS2995.17%0.717.07
GA-CARS2196.15%0.687.68
Table 4. Comparison of the accuracy of different estimation models.
Modeling MethodologyValidation Set
R2RMSE
PLSR0.717.07
RF0.786.03
Cubist0.706.63
XGboost0.677.69
Disclaimer/Publisher’s Note: The statements, opinions and data contained in all publications are solely those of the individual author(s) and contributor(s) and not of MDPI and/or the editor(s). MDPI and/or the editor(s) disclaim responsibility for any injury to people or property resulting from any ideas, methods, instructions or products referred to in the content.

