Article

Enhancing Soil Health in Rice Cultivation: Optimized Zn Application and Crop Residue Management in Calcareous Soils

1
Department of Soil Science, Dr. Rajendra Prasad Central Agricultural University, Pusa, Samastipur 848125, Bihar, India
2
Department of Agronomy, Dr. Rajendra Prasad Central Agricultural University, Pusa, Samastipur 848125, Bihar, India
3
Department of Statistics and Computer Application, Dr. Rajendra Prasad Central Agricultural University, Pusa, Samastipur 848125, Bihar, India
4
Department of Soil Science, Pandit Deen Dayal Upadhyay College of Horticulture and Forestry, Piprakothi 845429, Bihar, India
5
Section of Soil and Crop Sciences, School of Integrative Plant Science, Cornell University, Ithaca, NY 14853, USA
*
Author to whom correspondence should be addressed.
Sustainability 2025, 17(2), 489; https://doi.org/10.3390/su17020489
Submission received: 21 December 2024 / Revised: 4 January 2025 / Accepted: 8 January 2025 / Published: 10 January 2025

Abstract

:
Crop residue, a readily available biomass, is the largest source of organic matter in soil, and zinc (Zn) significantly influences microbial activity. Understanding the optimal Zn rates for enhanced biological activity in crop residue-amended soils is crucial. A study at RPCAU, Pusa, examined the combined effects of Zn applications and long-term crop residue amendments on soil biological properties in a rice–wheat cropping system. Conducted on Zn-deficient calcareous soil, the experiment used a split-plot design with four crop residue levels (0, 25, 50, and 100%) and four Zn rates (0, 2.5, 5, and 10 kg ha−1). Crop residues were incorporated each season, while Zn was applied initially in 1994 and again in 2018. The results showed significant improvements in soil organic carbon, organic C-stock, and reductions in soil bulk density. A linear–plateau regression model revealed that Zn application at 10 kg ha−1 increased soil active carbon and soil respiration by 35% and 53%, respectively, with the required crop residue levels at 73.73% and 90.28%. ACE protein increased by 9.6% with Zn application at 5 kg ha−1, with a required crop residue level of 91.06%. The highest values of soil available nutrients and grain yield of rice were observed with 100% residue incorporation and 10 kg ha−1 Zn application. Thus, applying 10 kg ha−1 Zn along with 100% crop residue incorporation significantly improves soil biological properties and soil organic carbon levels in calcareous soil under a rice–wheat cropping system.

1. Introduction

Regular addition of organic amendments is crucial for increasing and maintaining soil organic matter content, thereby enhancing soil health [1]. In South Asia, soil quality degradation due to resource scarcity poses a significant challenge for sustaining conventional rice–wheat systems [2]. Organic materials, readily available locally, not only provide multiple nutrients but also improve soil characteristics [3]. In Asia, nutrient imbalances, excessive fertilization, soil pollution, and erosion are major threats to soil health and quality [3]. Crop residues, the biomass remaining after harvest, are considered the primary source of organic matter for agricultural soils [4]. Incorporating or retaining crop residues on the soil surface offers numerous benefits for soil quality [5,6]. Despite the common practice of burning crop residues in fields, which leads to air pollution and loss of organic carbon and nutrients, recycling these residues into the soil is essential in maintaining soil health.
Transitioning from traditional crop residue management practices—such as using residues for biofuel, livestock feed, or burning them to clear fields for tillage—is increasingly influenced by the long-term environmental and economic benefits of retaining crop residues [7]. In many cultivated soils in India, soil organic carbon concentrations are typically less than 5 g kg−1, whereas in uncultivated virgin soils, these concentrations range from 1.5 to 20 g kg−1 [8]. Over the years, India has observed a continuous decline in the response ratio (kg of grain produced per kg of nutrients applied) [9], highlighting the need to prioritize soil health conservation to sustainably feed a growing population. Soil health is intricately linked to the physical, chemical, and biological properties of soil [10], emphasizing the importance of integrated management approaches.
Rice–wheat rotation is a predominant agricultural system in South Asia, covering approximately 30% of the region’s rice and wheat cultivation areas [11,12]. These systems are crucial for food production in Asia, yielding significant grain output and generating substantial crop residues. However, due to limited alternative uses and inadequate mechanization for handling residues, farmers often resort to burning them in fields [13]. This practice results in the emission of greenhouse gases and atmospheric pollution.
Conservation agriculture (CA), which promotes retaining crop residues on the soil surface from preceding crops, is significantly underutilized in the Indo-Gangetic Plains (IGP) despite the vast area (approximately 13 million ha) under rice–wheat cropping systems [14]. CA-based practices cover only about 2 million ha, primarily concentrated in Punjab and Haryana. Stakeholder consultations indicate some adoption in the Eastern Gangetic Plains (Bihar, West Bengal, Eastern Uttar Pradesh, and Odisha) and parts of Southern India, albeit on a smaller scale. However, these practices have not gained traction in rainfed, semi-arid, arid, and mountainous agro-ecosystems. Consequently, residue incorporation into the soil remains the predominant alternative for managing crop residues in these regions.
Micronutrient deficiencies, particularly zinc (Zn) deficiency, pose a significant global challenge to sustainable crop production and food security. According to Alloway [15], countries reliant on cereal-based staple foods from Zn-deficient soils often experience widespread Zn deficiency among their populations. Approximately half of the world’s cereal-growing soils are believed to lack sufficient plant-available Zn, necessitating external Zn application through fertilizers [16]. Khaira disease is primarily caused by Zn deficiency in rice plants. It is common in calcareous soils with high pH and low organic matter. Khaira disease in rice is characterized by yellowing and bronzing of young leaves, stunted growth, poor root development, delayed maturity, and reduced yield potential. Zn application rates typically range from 1.0 to 35.0 kg Zn ha−1, depending on soil type and crop characteristics. Zinc fertilizer application not only enhances crop production and nutritional quality but also potentially influences soil microbial properties, although the precise effects are not fully understood. Optimal Zn application is crucial for achieving high yields and grain quality while promoting soil microbial activity and enhancing bacterial communities, thereby sustaining agroecological environments [17]. As soil organic matter (SOM) residues are incorporated into the soil, microbial activity increases, facilitating the breakdown of SOM into humus and the release of CO2 [18]. This microbial activity plays a pivotal role in soil organic matter decomposition and nutrient mineralization. Therefore, understanding the combined impact of Zn application and crop residue management on microbial activity and soil health in rice–wheat cropping systems is essential for optimizing agricultural sustainability.
Long-term agricultural experiments offer valuable insights into the dynamics of crop yields, nutrient balances, and factors influencing sustainable crop production [11]. Maintaining soil quality under intensive land use and rapid economic development poses a significant challenge in developing countries [19]. While individual soil health indicators provide useful information, a comprehensive assessment of soil productivity requires analyzing multiple soil properties simultaneously [20]. Methods like soil tests have been developed to achieve this, evaluating 15 biological, physical, and chemical properties that collectively define soil health [21]. During the rice growth period, three biological indicators—soil respiration, soil protein, and active carbon—were monitored to assess soil biological activity and nutrient availability to crops. Active carbon serves as an energy source for soil microbes and is indicative of labile carbon pools in the soil, crucial for microbial functions [22].
The availability of nutrients, particularly zinc (Zn), which is often limiting in calcareous soils, influences crop growth significantly [23]. Calcareous soils, rich in calcium carbonate (CaCO3), affect various soil properties and nutrient availability, posing challenges such as low phosphorus (P) and micronutrient availability [13]. The addition of P and micronutrient fertilizers to these soils triggers immobilization reactions involving surface adsorption and mineral precipitation [23].
In the context of Zn-deficient calcareous soils in sub-tropical climates, understanding the fate of soil organic matter and biological properties following long-term crop residue management and immediate Zn application in rice–wheat cropping systems is critical. To this end, changes in soil biological properties during the decomposition of crop residues were monitored throughout the rice growth stages. The present study thus aimed to determine the optimal Zn application rate to enhance biological parameters, soil organic carbon stocks, and nutrient availability in such systems.

2. Materials and Methods

2.1. Field Site and Experimental Design

The field study took place during the rainy season of 2018 in a rice–wheat cropping system at the research farm of Dr. Rajendra Prasad Central Agricultural University, located in Pusa, Bihar, India (25°94’ N, 85°67’ E; elevation 52 m above mean sea level). The climate of the site is sub-tropical, characterized by distinct rainy (June to September), winter (October to February), and summer (March to May) seasons. The mean annual rainfall is 1300 mm, with monthly maximum temperatures ranging from 23.8 °C to 36.8 °C in summer and minimum temperatures from 9.1 °C to 27.2 °C in winter. The soil is classified as upland calcareous, identified as calcareous/Typic Ustifluvents under the U.S. soil taxonomy. It is inherently deficient in zinc (Zn). Chemical analysis of the surface soil (0–15 cm depth) revealed the following properties: pH—8.52; electrical conductivity (EC)—0.98 dSm−1; soil organic carbon (SOC)—5.4 g kg−1; available phosphorus (P2O5)—10.3 mg kg−1; available potassium (K2O)—82.3 mg kg−1; sulfur (S)—12.6 mg kg−1; boron (B)—0.52 mg kg−1. The soil contained DTPA-extractable micronutrients measuring 0.67 mg kg−1 of Zn, 2.47 mg kg−1 of Cu, 16.3 mg kg−1 of Fe, and 4.67 mg kg−1 of Mn, along with 34.3% free calcium carbonate (CaCO3).
The long-term experiment, initiated in 1994, employed a split-plot design within a rice–wheat cropping system with three replications. The main plots involved varying levels of crop residue incorporation (0%, 25%, 50%, and 100%), while sub-plots tested four levels of zinc (Zn) application (0, 2.5, 5, and 10 kg ha−1). Crop residues were harvested just above ground level and incorporated into the soil before each crop sowing. Zinc sulfate heptahydrate (ZnSO4·7H₂O) was applied as basal fertilizer to rice in July 1994 and again in 2018, with two application frequencies over the 25-year study period. Each sub-plot measured 10 m2 (5 m × 2 m). The study was conducted during the 25th year (2018) with rice crops. Chemical fertilizers—urea (211 kg ha−1), di-ammonium phosphate (130 kg ha−1), and muriate of potash (100 kg ha−1)—were applied uniformly across all plots following recommended doses. Optimum agronomic practices were employed for crop management, and rice yields were recorded at 14% moisture content upon study completion, as detailed in the manuscript.

2.2. Soil Sampling and Processing

Surface soil samples (0–15 cm depth) were collected at five different times throughout the study, namely before transplanting; at 30, 60, and 90 days after transplanting (DAT); as well as after harvesting the rice crop, to assess soil biological properties. Another set of soil samples was collected post rice harvest for analysis of soil chemical properties. Each soil sample underwent drying in the shade, followed by crushing with a wooden roller and sieving through 8 mm for soil protein and respiration estimation and 2 mm for active carbon, soil respiration rate, microbial biomass carbon, and autoclave citrate extractable protein analysis. Processed soil samples were stored in polythene bags in a refrigerator until an analysis of soil biological properties could be conducted.

2.3. Bulk Density

Soil samples were collected using a core sampler pressed into the soil to a depth of 0–15 cm. The sampler retrieved soil from the center of this depth range. After collection, the soil samples were dried in an oven at 105 °C for 24 h. Bulk density (Mg m−3) was then calculated using the formula derived from Blake and Hart [24], where the weight of the oven-dried soil was divided by the volume of the core sampler. The volume of soil was determined using the formula Πr2h, where r represents the radius, and h is the height of the core sampler, providing the inner volume of the core.
Bulk density = (Weight of the oven dry soil (Mg))/(The volume of soil (m3))

2.4. Organic Carbon and Organic Carbon Stock

Soil organic carbon (SOC) was determined by the rapid titration method as described by Walkley and Black [25], while the SOC stock was estimated using the following equation:
Soil organic carbon stock = Organic carbon (g kg−1 soil) × Bulk Density (Mg m−3) × depth of soil (15 cm)

2.5. Active Carbon

To measure active carbon, a protocol adapted from Weil et al. [26] was followed. A 2.5 g air-dried and 2 mm sieved soil sample was placed into a 50 mL centrifuge tube. To oxidize the active carbon in the sample, 18 mL of distilled water and 2 mL of 0.02 M potassium permanganate (KMnO4) solution were added, and the tube was shaken vigorously for exactly 2 min. The tube was then allowed to settle for the remaining 8 min of the total 10 min reaction time. After settling, 0.2 mL of the supernatant was transferred into 20 mL of distilled water. The absorbance of the solution was measured at 550 nm (B). Additionally, absorbance measurements were taken for a standard dilution series of KMnO4 to create a calibration curve for interpreting absorbance data from the samples. Using a straightforward formula, the absorbance value of the sample was converted into active carbon content, expressed in mg kg−1 of soil.

2.6. Soil Respiration Basic Protocol (Adapted from Zibilske [27])

To assess CO2 respiration from soil samples, a method involving a mason jar setup was used. Initially, 20 g of air-dried soil, sieved to 8 mm, was placed in an aluminum-weighted boat perforated with nine pinholes. This boat was positioned on staggered filter papers inside the jar. A trap assembly consisting of a 10 mL glass beaker on a plastic tripod was placed in the jar and filled with an alkaline CO2-trapping solution (0.5 M KOH, 9 mL). Additionally, 7 mL of distilled, deionized water was added to the jar to slowly moisten the soil through the filter papers. The jar was tightly sealed and incubated for 4 days without disturbance. During this period, CO2 respired from the soil was absorbed by the KOH solution in the trap, resulting in a decrease in electrical conductivity due to declining OH⁻ concentration and increasing CO2 concentration. After incubation, the jar was opened, and the conductivity of the trap solution was measured. The amount of CO2 respired by the soil was calculated by comparing its conductivity with a reference solution saturated with CO2 (0.25 M K2CO3), representing the maximum possible conductivity. This method provided a quantitative assessment of soil microbial activity and carbon release dynamics.

2.7. Autoclave Citrate Extractable Protein (Adapted from Wright et al. [28])

To estimate the amount of protein in soil organic matter, the autoclave-citrate extractable protein method was employed. Initially, 3 g of soil was weighed into a heat- and pressure-resistant glass screw-top tube, and 24 mL of sodium citrate buffer (20 mm, pH 7.0) was added. The mixture was shaken for 5 min at 180 rpm to disperse aggregates and ensure uniform mixing. The tubes were then autoclaved at 121 °C and 15 psi for 35 min, followed by cooling to room temperature. The soil was re-suspended, and 2 mL of the slurry was transferred to a smaller 2 mL microcentrifuge tube and centrifuged at 10,000× g for 3 min. Next, 10 µL of the supernatant from each sample was transferred to a 96-well microplate, followed by adding 200 µL of a reagent mixture (BCA Reagent A and B in a 50:1 ratio). Two columns of BSA standard (ranging from 0 to 2000 micrograms mL−1 BSA) were included on each plate for calibration. The microplate was incubated at 60 °C for 1 h to ensure uniform color development before measuring absorbance at 562 nm using a spectrophotometer. The concentration of extractable protein in the soil was calculated by multiplying the protein concentration obtained from the absorbance readings by the volume of extractant used and dividing by the mass of soil initially used in the process. This method provided a quantitative assessment of protein content in soil organic matter, essential for understanding soil fertility and nutrient cycling dynamics.

2.8. Statistical Analysis

All the experimental data were subjected to two-way analysis of variance (ANOVA) as per the procedure of Gomez and Gomez [29]. The least significant difference (LSD) at a 5% level of probability was determined for comparison of the significant differences between the two mean values. All the graphs of this manuscript were drawn using the software SigmaPlot v.9.0.

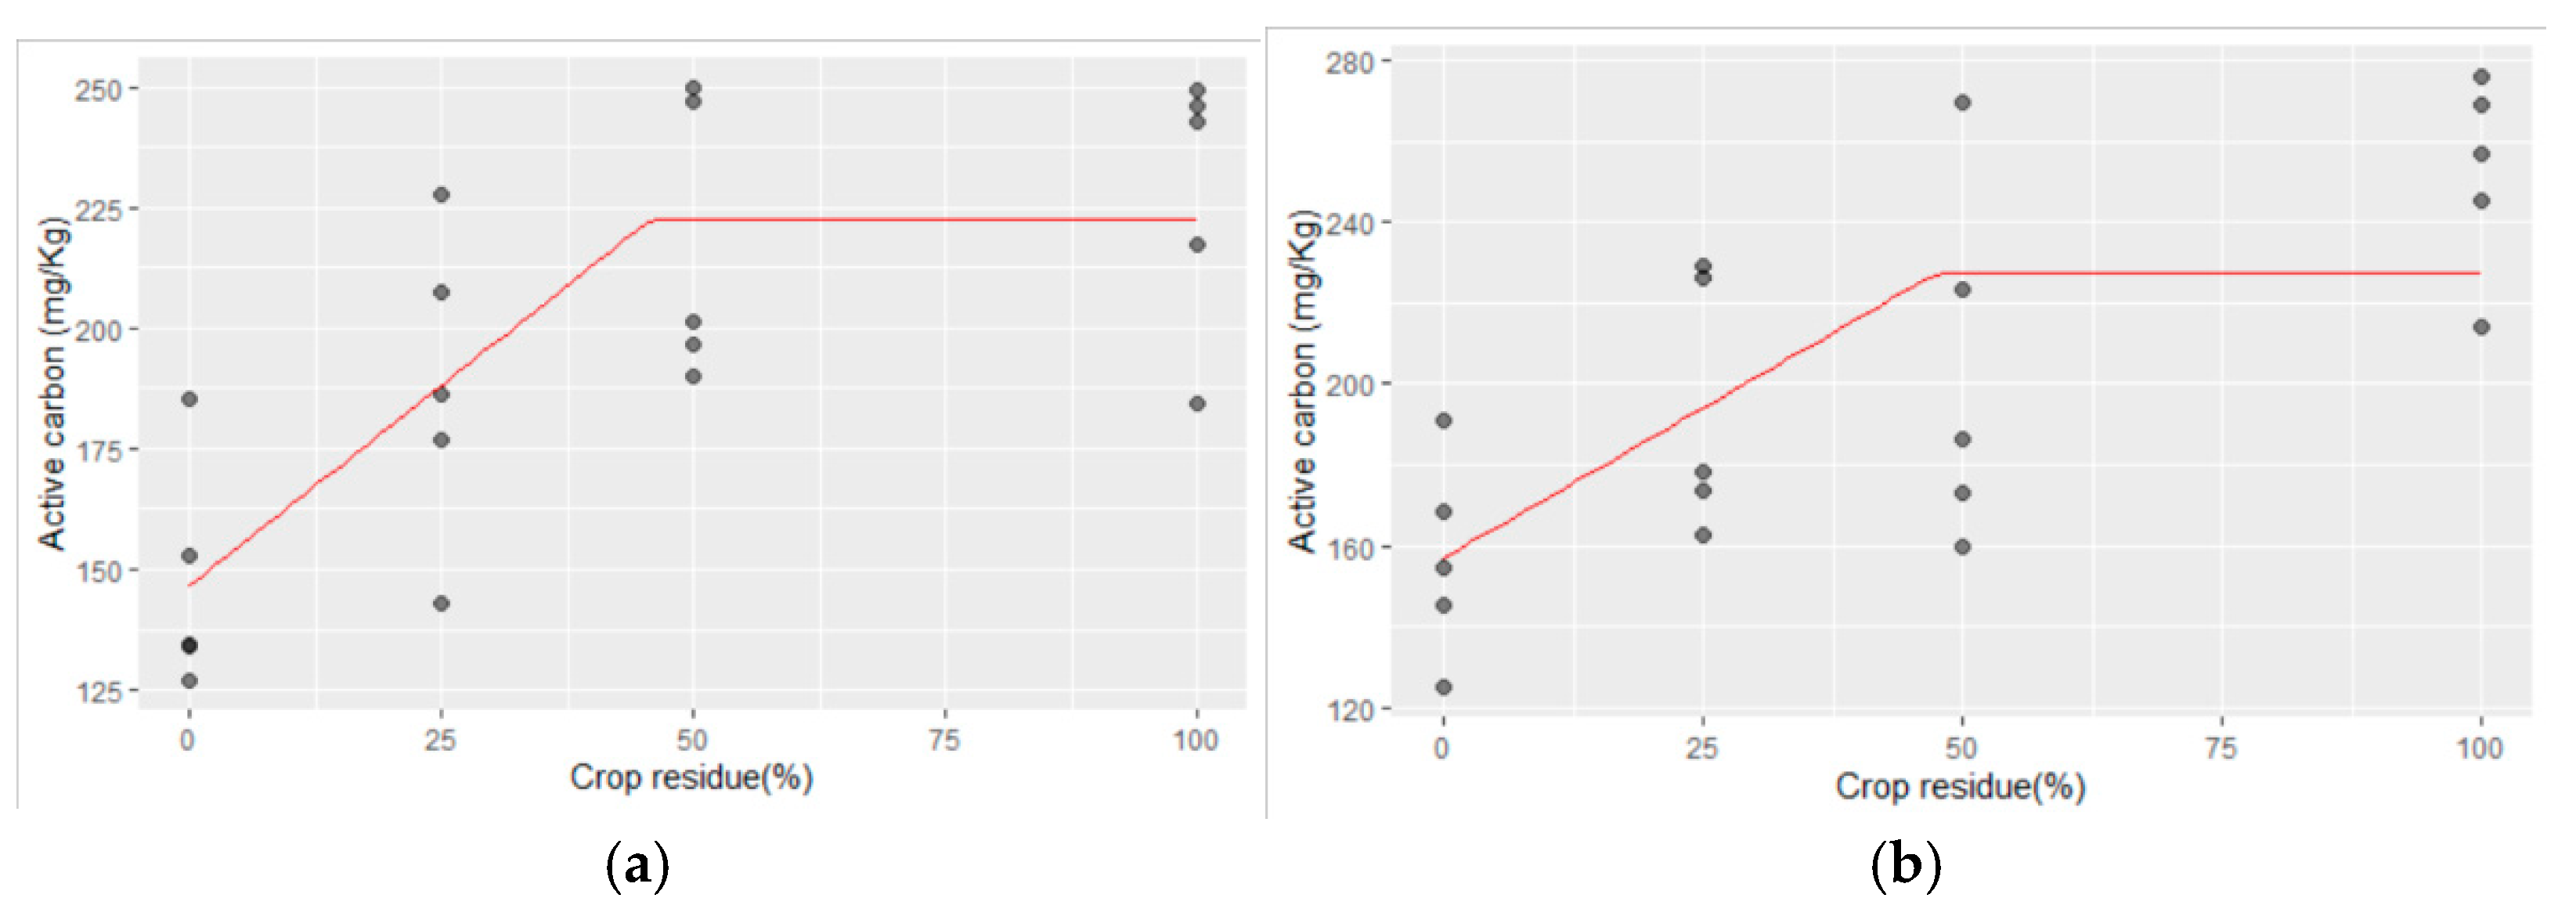
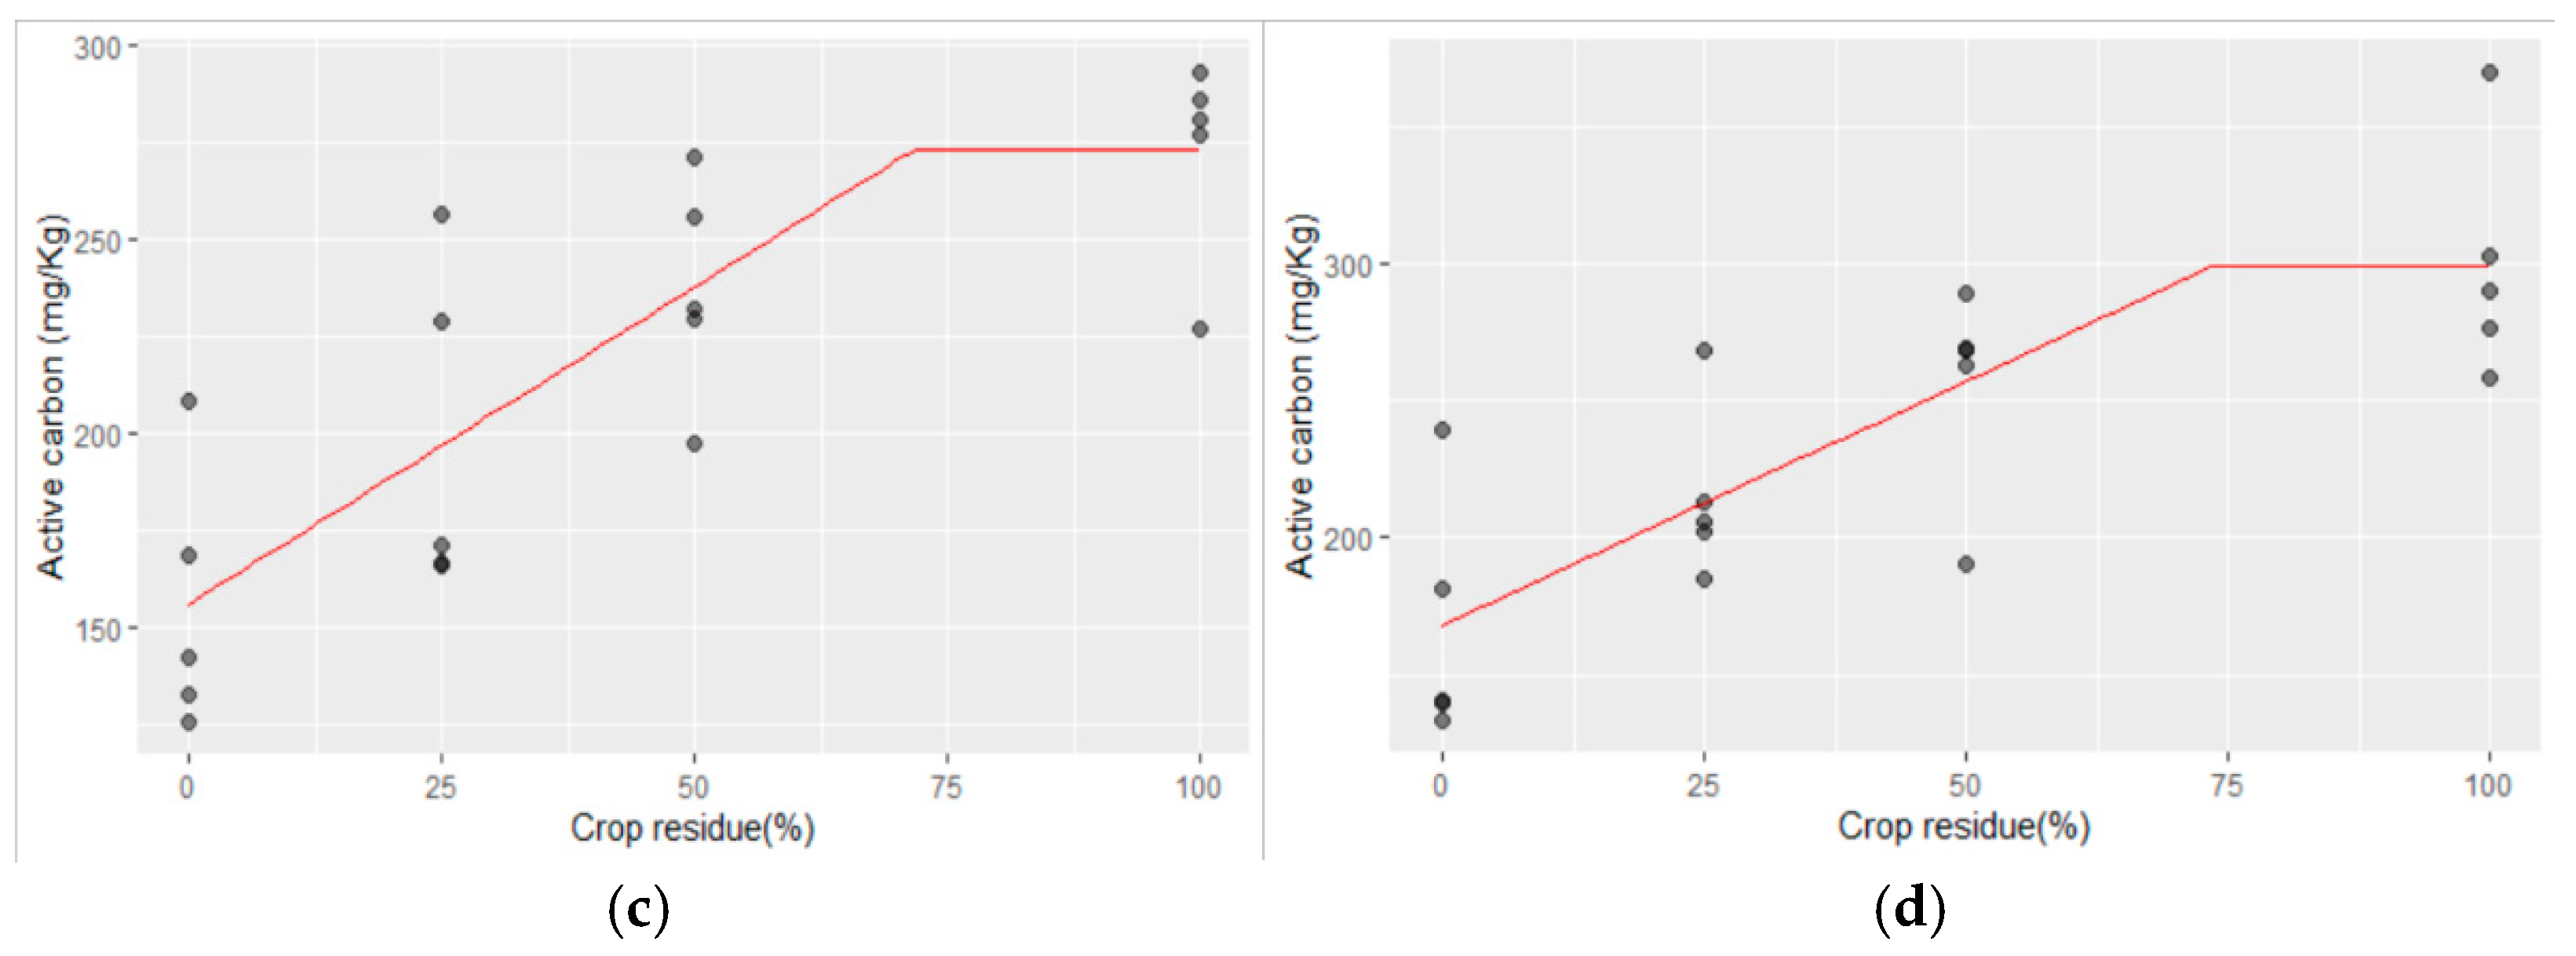
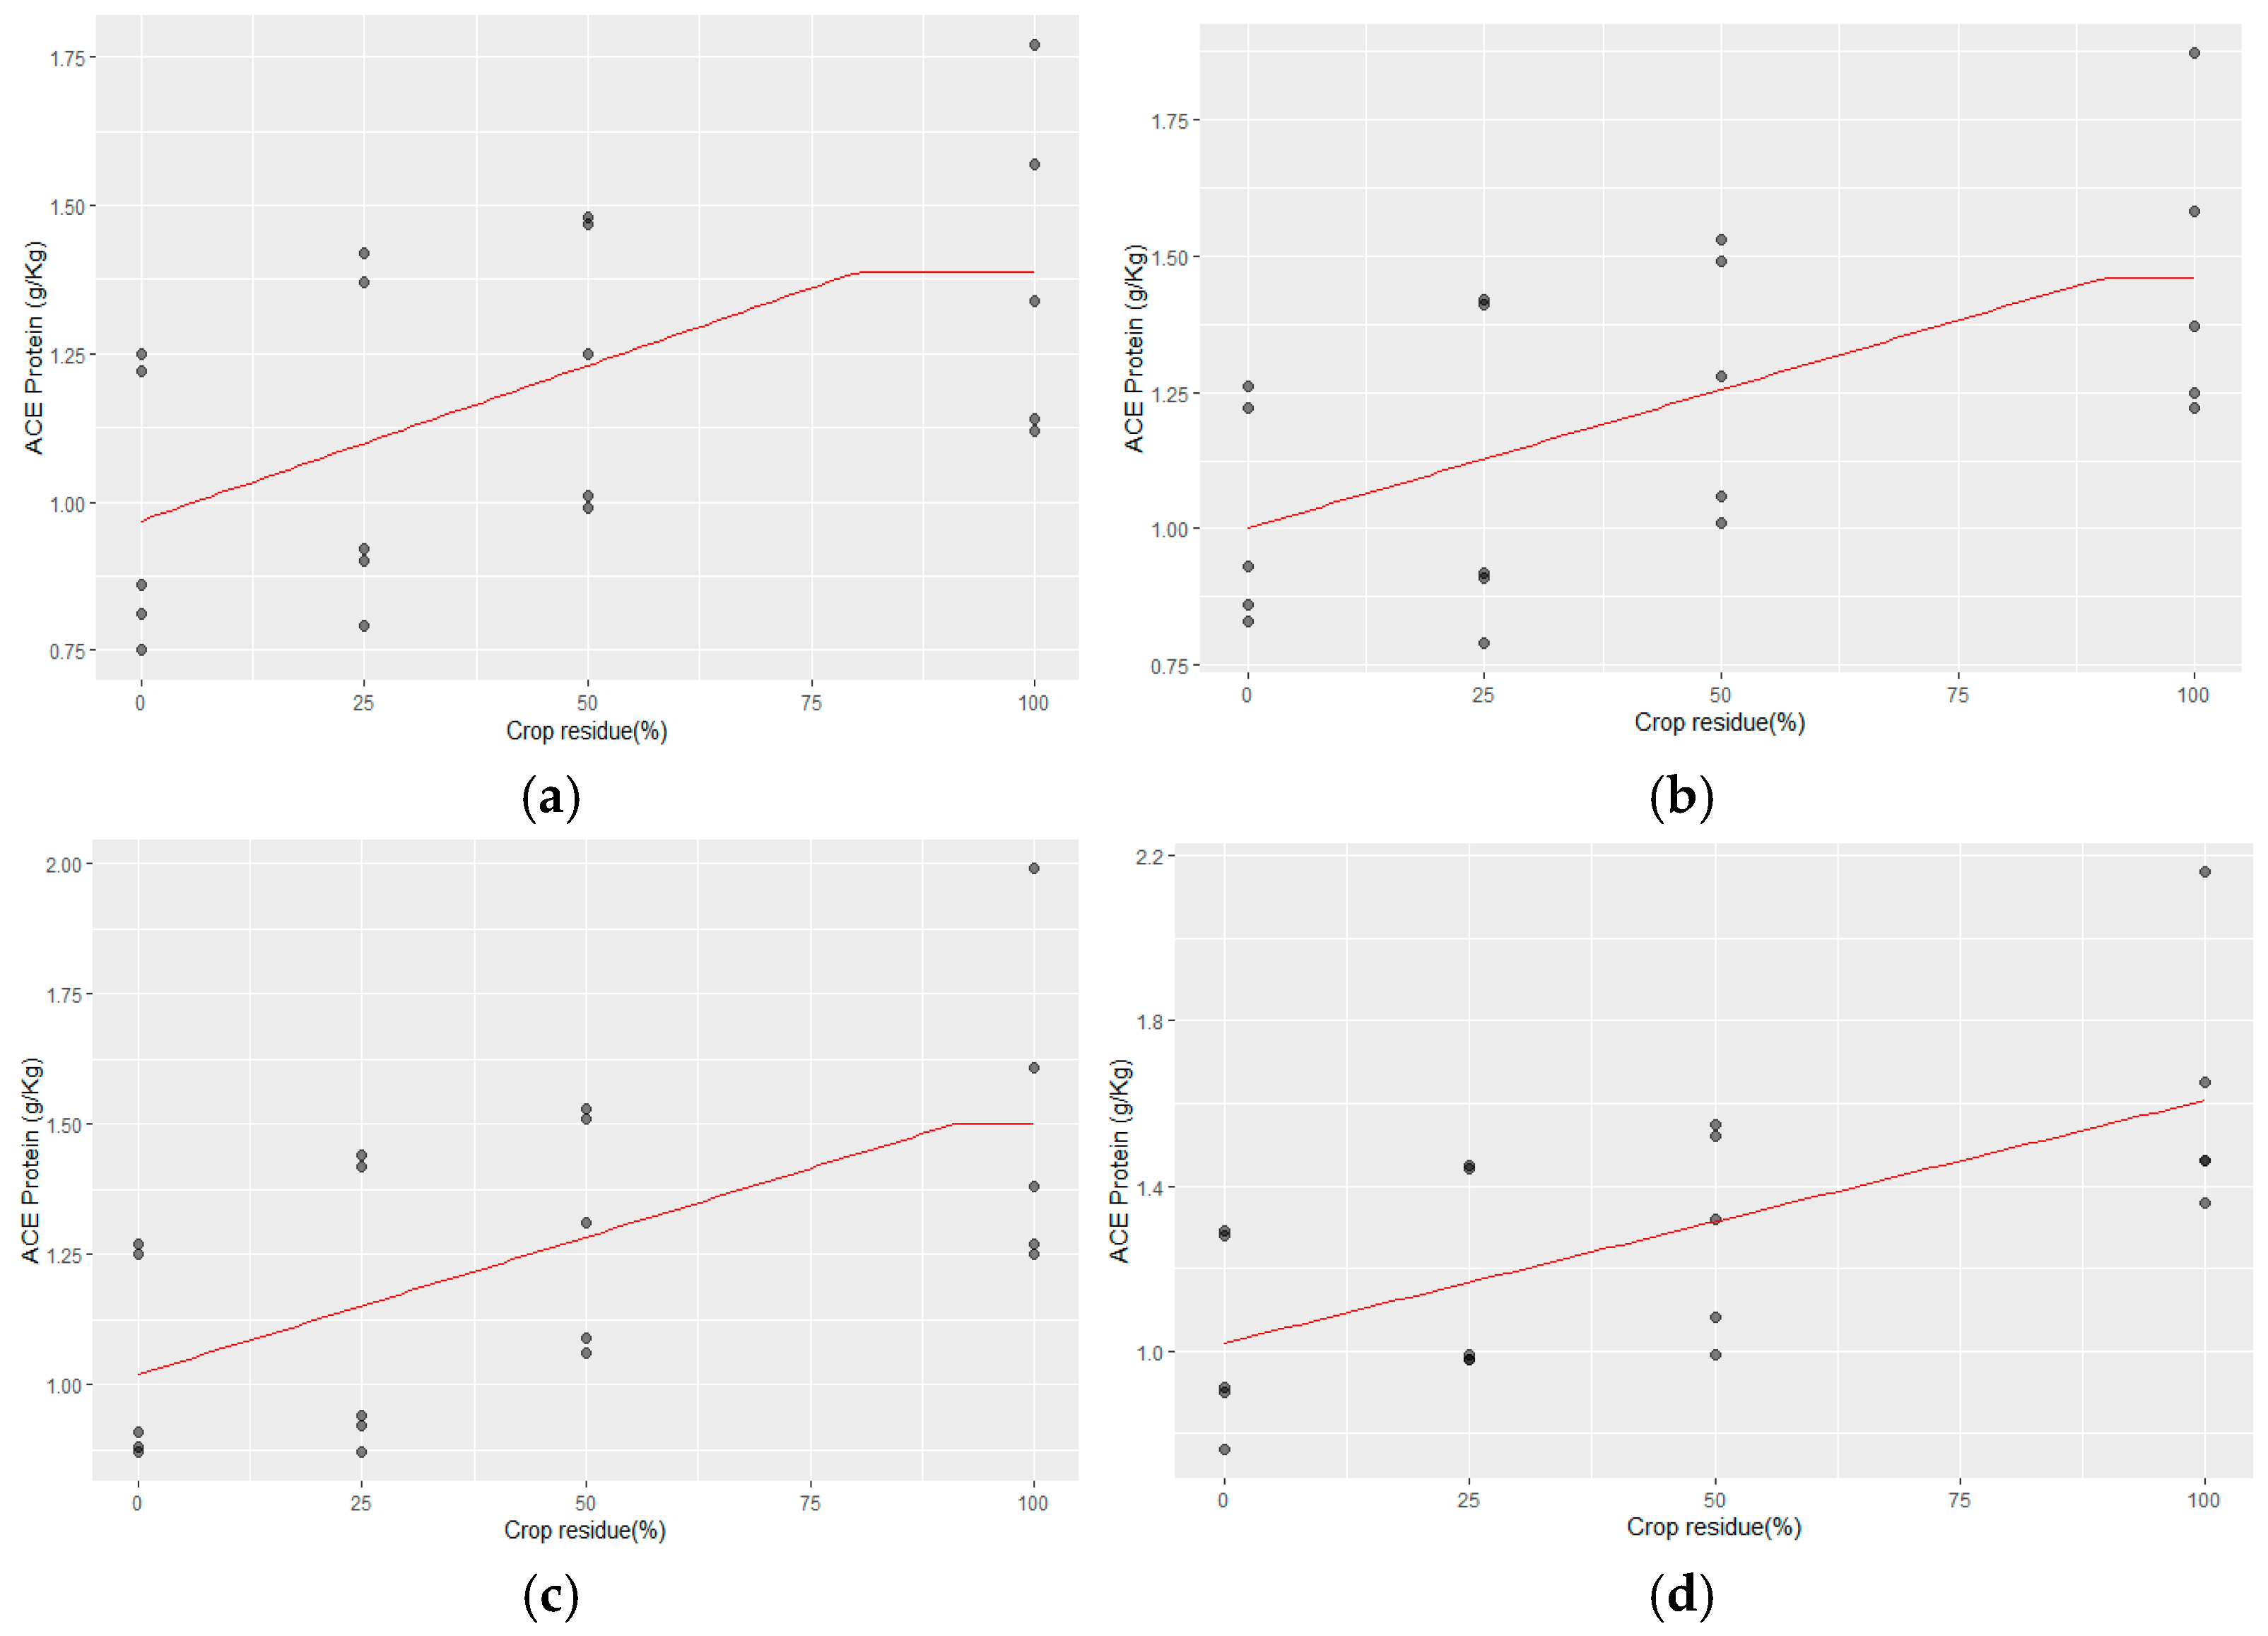
Statistical Evaluation of the Regression Model

To explore the relationship between crop residue levels and various biological parameters—specifically active carbon, protein, and soil respiration—two types of regression models were employed: linear and linear-plus-plateau models. In the linear model, the concentration of crop residues (X) served as the independent variable, while active carbon, protein, and soil respiration (Y) were dependent variables that increased linearly with increasing X. In contrast, the linear-plus-plateau model divided the data into two segments. Initially, Y increased linearly with increasing X until it reached a maximum value at a critical X value. Beyond this critical point, additional increases in X did not result in further increases in Y. This model was used to better represent the potential shapes of the relationships between crop residue levels and the biological parameters studied, providing insights into how these parameters respond to varying levels of crop residues in the soil.
Regression analyses produced coefficients of determination (R2), F values, and p-values used to interpret the biological parameters–crop residue concentration relationship. In addition, root mean square error (RMSE) values were analyzed to assess the performance of the regression models calculated from differences between predicted and observed yields.
The linear model was computed as Equation (1):
Y = a + bX
where a is the coefficient of the linear function, and b is the linear intercept.
The linear-plus-plateau model was computed as Equations (2) and (3):
Y = a + bX; if X < Xopt
Y = Ymax; if X ≥ Xopt
where b is the coefficient of the linear function, a is the linear intercept, and Xopt is the critical crop residue concentration that occurs at the intersection of the linear response and the plateau line that indicates the maximum value of the dependent variable (Ymax).
The RMSE was computed using the following formula:
R M S E % = 100 O ¯ × i = 1 n O i P i 2 n
where n is the number of observed and simulated data pairs; Oi and Pi are observed and predicted values, respectively; and O ¯ is the average observed value. Smaller RMSE values indicate better agreement between predicted and observed values.
Higher R2 and smaller RMSE values were the criteria used for selecting a reasonable regression model.

3. Results

3.1. Soil Organic Carbon

Among the different treatment combinations, soil organic carbon (SOC) varied from 5.10 g kg−1 in the control plot to 7.19 g kg−1 in the plot where 100% crop residue was incorporated along with 10 kg ha−1 of Zn application (Table 1). Both the main effects of crop residue and Zn application, as well as their interaction, were found to be significant concerning SOC. Specifically, combinations involving 100% crop residue and 2.5, 5.0, or 10.0 kg Zn ha−1 were statistically comparable and showed superior SOC levels compared to all other treatments. The incorporation of crop residues in both rice and wheat significantly enhanced SOC compared to plots without crop residue at each Zn application level. Furthermore, higher levels of crop residue incorporation at each Zn application level led to a significant increase in SOC. Similarly, significant improvements in SOC were observed with Zn application at all three rates compared to plots without Zn application at each crop residue level. These findings underscore the combined benefits of crop residue management and Zn application in enhancing soil organic carbon content, crucial for soil health and fertility.

3.2. Bulk Density

Incorporating crop residues from both rice and wheat at varying levels resulted in a notable reduction in soil bulk density (Table 2). Soil bulk density ranged from 1.48 Mg m⁻3 in the control plots without crop residue management or Zn application to 1.33 Mg m⁻3 in plots where 100% crop residue was incorporated along with 10 kg ha−1 of Zn (Table 2). Across most treatments, different levels of crop residue led to a significant decrease in bulk density at each Zn application rate. Similarly, applying Zn at 10.0 kg ha−1 resulted in a significant reduction in bulk density compared to plots without Zn application at each crop residue level. These results highlight the beneficial impact of crop residue incorporation and Zn application in mitigating soil bulk density, thereby enhancing soil structure and potentially improving root growth and nutrient availability.

3.3. Organic Carbon Stock (SOC Stock)

The organic carbon (SOC) stock of the experimental soil exhibited significant variations due to varying levels of crop residue incorporation and Zn application (Table 3). Increasing levels of crop residue significantly enhanced SOC stock at each Zn application level. Specifically, the application of Zn at 5 and 10 kg ha−1 showed significant increases in SOC stock compared to the Zn control plots, particularly at 25% and 50% crop residue levels. At the highest crop residue level (100%), all treatments showed comparable effects on SOC stock regardless of the Zn application rate. SOC stock ranged from 74.95 Mg C ha−1 in plots without crop residue and Zn application to 96.26 Mg C ha−1 in plots with 100% crop residue incorporation and 10 kg Zn ha−1.

3.4. Soil Biological Properties

Long-term crop residue management at varying levels over 25 years, along with zinc application at different rates, significantly impacted soil biological properties, including active carbon levels, soil respiration, and ACE protein (Figure 1a–c). Crop residue management at levels of 25%, 50%, and 100% improved soil active carbon by 26%, 42%, and 68%, respectively, compared to the control plot without crop residue incorporation. Similarly, zinc (Zn) application at different rates significantly enhanced soil active carbon relative to the Zn control plot. Specifically, Zn application at 5.0 and 10 kg ha−1 increased soil active carbon by approximately 8% and 20%, respectively, compared to the Zn control. In terms of soil respiration, crop residue management at 25%, 50%, and 100% levels increased this biological parameter by 15%, 26%, and 38%, respectively, compared to the control plot. Soil respiration values ranged from 0.473 mg g−1 soil in the 0% crop residue + 0 kg ha−1 Zn treatment to 0.772 mg g−1 soil in the 100% crop residue + 10 kg ha−1 Zn treatment. Zn application at rates between 2.5 and 10 kg ha−1 significantly boosted soil respiration compared to no Zn application (Zn control). Specifically, Zn application at 2.5, 5.0, and 10 kg ha−1 resulted in increases of 3.1%, 5.26%, and 10.9%, respectively, in soil respiration compared to the Zn control. Autoclaved citrate-extractable (ACE) protein levels ranged from 0.98 mg g−1 soil in the control plots (no Zn or residue application) to 1.62 mg g−1 soil in plots with 100% crop residue + 10 kg ha−1 Zn. Crop residue management significantly influenced ACE protein levels, with 25%, 50%, and 100% residue levels leading to increases of approximately 8%, 24%, and 43%, respectively, compared to the control plot. Zn application at rates of 2.5 to 10 kg ha−1 also significantly improved ACE protein levels compared to the Zn control. The increase in ACE protein ranged from 3% to 9% for Zn application rates of 2.5 to 10 kg ha−1, respectively.
Statistical evaluation of the two different regression models, namely linear and linear-plus-plateau regression models, from the three biological properties, namely active carbon, ACE protein, and soil respiration, is shown in Table 4a, Table 4b, and Table 4c, respectively.
The R2 value of the linear-plus-plateau model is higher than that of the linear model in the case of active carbon. In addition, the linear-plus-plateau model has a smaller RMSE value than the linear model. However, the performances of both models were similar for ACE protein and soil respiration.

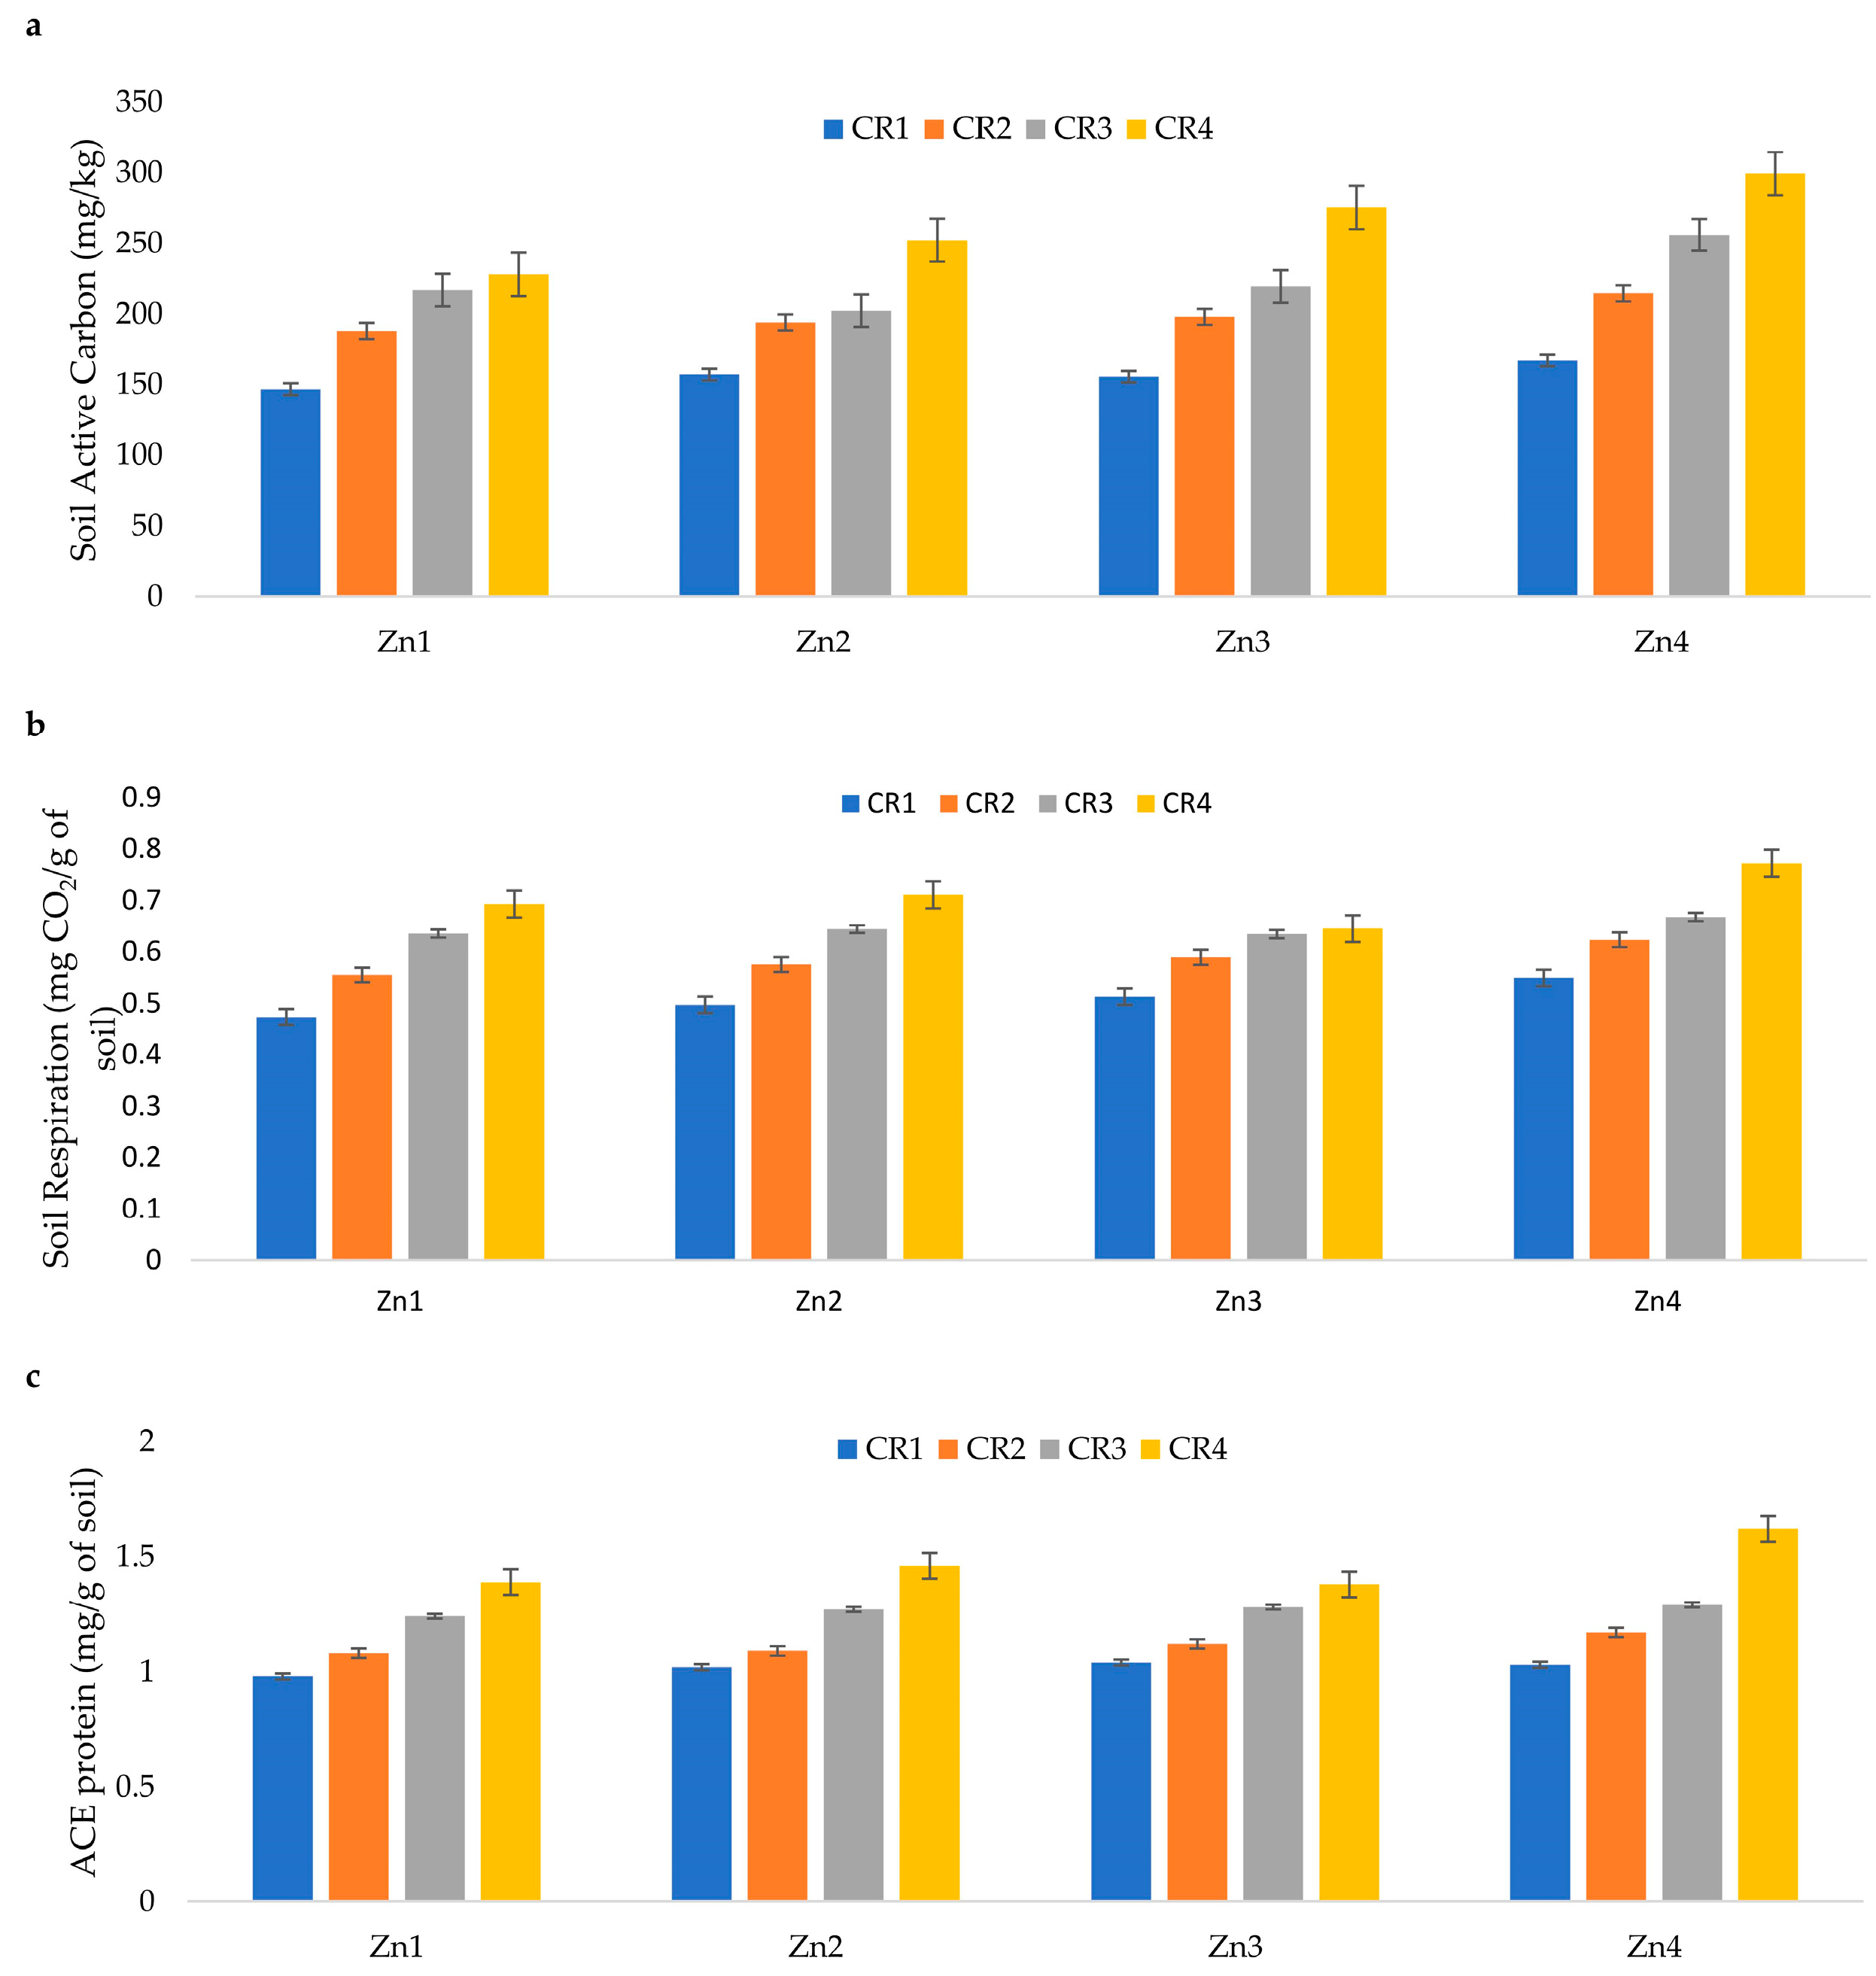
3.4.1. Active Carbon

The linear–plateau model regressions of active carbon and the crop residue levels applied for 25 years and the maximum concentration of active carbon obtained at different Zn rates and the corresponding required crop residue levels are presented below in Figure 2a–d:
  • No Zn application:
Active carbon = 146.67 + 1.658 CR for CR ≤ 45.72%
Active carbon = 222.47 mg kg−1 for CR > 45.72%;
ii.
At 2.5 kg Zn ha−1 application:
Active carbon = 156.97 + 1.484 CR for CR ≤ 47.4%
Active carbon = 227.31 mg kg−1 for CR > 47.4%;
iii.
5.0 kg Zn ha−1 application:
Active carbon = 156.09 + 1.63 CR for CR ≤ 71.53%
Active carbon = 272.68 mg kg−1 for CR > 71.53%;
iv.
10 kg ha−1 Zn application:
Active carbon = 167.99 + 1.78 CR for CR ≤ 73.73%
Active carbon = 299.23 mg kg−1 for CR > 73.73%.
The relationship between active carbon and crop residue levels adheres to a linear–plateau model, as depicted in the predicted curve (Figure 2) and Equation (4). The model shows that active carbon increased with higher crop residue levels up to 46% in the Zn control plot, reaching a maximum of 222.5 mg kg−1. Beyond this point, no further increase in active carbon was observed. At the Zn application level of 2.5 kg ha−1, the peak concentration of active carbon reached 227.3 mg kg−1 at a crop residue level of 47%. Similarly, the critical crop residue values of 72% and 74% corresponded to peak active carbon values of 272.68 mg kg−1 and 299.23 mg kg−1, respectively, at Zn application rates of 5 and 10 kg ha−1. Active carbon levels plateau once these critical crop residue levels are reached, indicating that additional increases in crop residue beyond these thresholds do not lead to further enhancements in active carbon content. These findings highlight the optimal levels of crop residue incorporation needed to maximize active carbon in the soil, crucial for soil health and nutrient cycling in agricultural ecosystems.

3.4.2. Soil Respiration

Crop residue management at different levels for 25 years had a significant effect on the increase in soil respiration. The linear–plateau model regression between CR and soil respiration at different Zn rates is as follows (Figure 3a–d).
  • No Zn application:
Soil Respiration = 0.474 + 0.003 CR for CR ≤ 67.38%
Soil Respiration = 0.495 mg CO2 g−1 for CR > 67.38%;
ii.
2.5 kg ha−1 Zn rate:
Soil Respiration = 0.498 + 0.0003 CR for CR ≤ 72.11%
Soil Respiration = 0.519 mg CO2 g−1 for CR > 72.11%;
iii.
5 kg ha−1 Zn rate:
Soil Respiration = 0.513 + 0.002 CR for CR ≤ 81.19%
Soil Respiration = 0.675 mg CO2 g−1 for CR > 81.19%;
iv.
10 kg ha−1 Zn rate:
Soil Respiration = 0.055 + 0.0002 CR for CR ≤ 90.28%
Soil Respiration = 0.76 mg CO2 g−1 for CR > 90.28%.
From the derived regression equations, it became evident that higher levels of Zn application correlated with increased soil respiration but only when accompanied by higher crop residue levels (Figure 3). In plots without Zn application, soil respiration measured 0.676 mg g−1 soil, requiring a crop residue level of 67.38% to achieve maximum respiration. As Zn application increased from 2.5 to 10 kg ha−1, the optimal crop residue levels for maximizing soil respiration also rose from 72.11% to 90.28%. Correspondingly, soil respiration levels increased from 0.519 mg g−1 to 0.73 mg g−1 at these higher Zn application rates and crop residue levels. These results underscore the synergistic effect of Zn application and crop residue management in enhancing soil microbial activity, which is crucial for nutrient cycling and overall soil health in agricultural systems.

3.4.3. Autoclaved Citrate Extractable (ACE) Protein

ACE protein was also influenced by both crop residue and Zn rates. The linear–plateau model regressions between CR and ACE protein at different Zn rates are as follows (Figure 4a–d).
  • No Zn application
ACE protein = 0.968 + 0.005 CR for CR ≤ 80.04%
ACE Protein= 1.368 g kg−1 for CR > 80.04%;
ii.
2.5 kg ha−1 Zn rate:
ACE protein = 1.001 + 0.005 CR for CR ≤ 89.96%
ACE = 1.451 g kg−1 for CR > 89.96%;
iii.
5 kg ha−1 Zn rate:
ACE = 1.019 + 0.0053 CR for CR ≤ 91.04%
ACE = 1.50 g kg−1 for CR > 91.04%;
iv.
10 kg ha−1 Zn rate:
ACE protein= 1.019 g kg−1 + 5.89 × 10⁻³ CR for CR ≤ 100.
It was observed that without any Zn application, the ACE protein content in the soil was 1.368 g kg−1, requiring a crop residue level of 80.04% to achieve this level (Figure 4). As Zn application increased incrementally from 2.5 to 5 kg ha−1, the ACE protein content also increased from 1.451 g kg−1 to 1.5 g kg−1, with corresponding increases in the required crop residue levels from 89.96% to 91.04%. However, with a further increase in Zn application to 10 kg ha−1, a plateau effect was not observed, and the relationship between Zn application and ACE protein content remained linear. This suggests that while moderate levels of Zn application enhance ACE protein accumulation in the soil, higher Zn application rates do not lead to additional benefits beyond a certain point, indicating a threshold effect. These findings highlight the complex interaction between Zn application, crop residue management, and soil protein dynamics, emphasizing the importance of balanced nutrient management practices for optimizing soil biological health in agricultural systems.

3.5. Soil Available Nutrient After Rice Harvest

3.5.1. Micro and Secondary Nutrients

It was observed that significant improvements occurred in the soil availability of zinc (Zn), manganese (Mn), and iron (Fe) with long-term crop residue incorporation at 50% and 100% levels compared to the control plot (Table 5). Specifically, compared to the control, Zn availability increased by 41% and 94% at these respective crop residue levels, Mn availability increased by 60% and 91%, and Fe availability increased by 4% and 14%. Additionally, applying Zn at a rate of 10 kg ha−1 also enhanced the availability of these micronutrients: Zn availability increased by 67%, Mn availability by 19.9%, and Fe availability by 3.1%. These results highlight the positive impact of crop residue incorporation and Zn application on enhancing the availability of essential micronutrients in soil, which is crucial for sustaining crop productivity and overall soil fertility in agricultural systems.

3.5.2. Available Nitrogen, Phosphorus, and Potassium

Crop residue management at 50% and 100% levels for both rice and wheat showed significant improvements in soil available nitrogen compared to the control plot (Table 6). Specifically, soil available nitrogen increased by 44% and 51% at these respective residue levels compared to the control. Similarly, crop residue management at these levels also significantly enhanced soil available potassium status (Table 6). The improvements in soil available potassium were notable, with increases observed at 50% and 100% residue levels compared to the control plot. Additionally, applying zinc at rates of 5.0, 7.5, and 10 kg ha−1 further increased soil available potassium by 6%, 15%, and 25%,, respectively compared to the control plot with no zinc application. These findings underscore the beneficial effects of crop residue management and zinc application on enhancing soil nutrient availability, crucial for sustaining optimal crop growth and productivity.

3.6. Yield

Crop residue management and zinc application significantly influenced rice grain yield across the experimental plots. Rice grain yield ranged from 3.22 t ha−1 in plots without crop residue management or zinc application to 3.98 t ha−1 in plots where 100% crop residue was incorporated along with 10 kg Zn ha−1. Increasing levels of crop residue incorporation from none to 100% consistently improved rice yield across different zinc application rates (Table 7). Specifically, rice yields were significantly higher at zinc rates of 5.0 and 10.0 kg ha−1 compared to plots without zinc application regardless of the crop residue level. These findings underscore the synergistic effects of crop residue management and zinc application in enhancing rice grain yield, highlighting their importance in sustainable agricultural practices aimed at improving crop productivity.

4. Discussion

The residual effects of zinc (Zn) application have been observed to enhance biomass production, particularly by increasing the quantity of roots and stubbles. This phenomenon contributes significantly to the accumulation of soil organic carbon (SOC). The higher SOC levels associated with crop residue incorporation can be attributed to the continuous input of organic matter, which supports a larger microbial population. This increased microbial activity facilitates the decomposition of crop residues, thereby enriching the soil with organic carbon. This observation aligns with findings by Bellakki and Badanur [30], highlighting that the addition of organic matter through crop residues fosters microbial processes that enhance SOC content. Furthermore, the incorporation of higher amounts of organic matter enhances pore space and promotes better soil aggregation, which in turn reduces bulk density. Studies by Shaver et al. [31] showed that each ton per hectare of crop residue added over a prolonged period can reduce bulk density and increase soil porosity, thus improving soil structure and water infiltration. Additionally, each gram per kilogram of organic carbon in macroaggregates increases their proportion in the soil, indicating a positive correlation between SOC and soil aggregation.
SOC is a critical indicator of soil fertility and productivity due to its profound influence on soil physical, chemical, and biological properties [3]. Agricultural practices that enhance carbon input to the soil while minimizing carbon loss contribute to the improvement of SOC levels. Fresh organic carbon inputs, including labile components from crop residues and rhizodeposition, support active decomposer communities that drive energy transformation within the soil ecosystem [32]. As organic residues decompose further, they contribute to ecosystem functions such as carbon sequestration, highlighting the dynamic nature of SOC dynamics over time. The balance between carbon inputs from plant residues and outputs via microbial decomposition of soil organic matter (SOM) determines SOC levels [33]. Studies specific to rice–wheat cropping systems in semi-arid subtropical conditions underscore the need for a more comprehensive understanding of how management practices influence chemical and biological SOC pools. Compared to other land-use types, SOC pools in rice–wheat systems are known for their stability [12], suggesting unique sensitivities to management practices that warrant further investigation to optimize soil carbon management strategies.
In this experiment, we observed distinct stages of crop residue decomposition influenced by zinc (Zn) application levels. Initially, Zn application at optimal doses significantly enhanced biological properties such as active carbon, soil respiration, and autoclave citrate extractable protein (ACE protein). These enhancements reflect the ability of Zn to support microbial activities during the intensive early decomposition stages of crop residues, where microbial communities are robust and efficiently decompose organic matter without additional energy inputs [34]. However, as decomposition progresses into later stages, microorganisms may become energy-limited due to the depletion of readily available substrates from the decaying residues [35,36].
In our study, increasing Zn application from zero to 10 kg ha−1 resulted in elevated levels of active carbon, soil respiration, and ACE protein, up to critical crop residue levels. Specifically, active carbon increased from 227.30 to 299.23 mg kg−1 as the crop residue levels required for optimal biological activity rose from 45.72% to 73.73%. Similarly, soil respiration increased from 0.676 mg kg−1 to 0.73 mg kg−1 at corresponding crop residue levels of 67.38% and 90.28%, respectively. ACE protein also showed an increase from 1.368 to 1.5 g kg−1 with crop residue levels rising from 80.04% to 91.04%. This suggests that under optimal Zn conditions, biological processes in the soil are enhanced, but further increases in Zn did not lead to additional improvements, indicating a plateau effect. Zinc stimulates soil microbial activity, promoting the decomposition of organic matter, which boosts active carbon levels crucial for soil fertility. This enhanced microbial activity also intensifies soil respiration, leading to greater carbon dioxide release as a measure of biological processes. Additionally, zinc serves as a cofactor for various enzymes and proteins, potentially increasing ACE-like protein activity in specific bioengineered soil systems. These combined effects improve soil ecosystem functionality and nutrient availability, supporting healthier plant growth and agricultural productivity. Moreover, residue incorporation provides organic matter, serving as a substrate for microbes. At the same time, Zn boosts microbial enzyme activity, accelerating organic matter decomposition and increasing active carbon, soil respiration, and ACE protein, essential for soil fertility. This study highlighted the optimal levels of residue incorporation in conjunction with the rate of Zn application. Research by Yu-Min Liu et al. [17] supports these findings, emphasizing the role of optimal Zn application in enhancing enzymatic activity and maintaining sustainability in agroecological environments.
Organic matter, including labile carbon substrates, plays a crucial role in modulating biological activity by providing carbon, energy, and nutrients that support microbial processes leading to mineralization [3]. Proteins, constituting a significant portion of soil organic matter, are particularly crucial, as they represent a major reservoir of organic nitrogen in soil. The depolymerization of proteins serves as a key step in soil nitrogen cycling, influencing the availability of nitrogen for plant uptake and ecosystem functioning [37,38]. Thus, soil proteins are pivotal indicators of soil health, reflecting bioavailable nitrogen levels and contributing to overall soil fertility and productivity. While the impacts of organic inputs like manure and crop residues on carbon sequestration in rice–wheat systems are well documented, their effects on labile soil organic carbon pools remain an area requiring further exploration [12].
Studies by Johnson and Hoyt [39] and Mondal et al. [40] have indicated limited or insignificant impacts of cereal crop residue application on soil organic carbon (SOC) retention. However, in our study, long-term management practices involving crop residue incorporation and zinc (Zn) application have demonstrated positive effects on labile carbon concentrations in soil. This suggests that increased inputs of carbon, including from decaying crop residues and rhizodeposits under these management regimes, enhance the availability of labile carbon pools. Franzluebbers et al. [41] further highlighted that changes in carbon inputs can lead to concurrent shifts in both total SOC and microbial pools, emphasizing the dynamic nature of soil carbon under different management practices. Monitoring these dynamics over time is crucial for understanding the long-term implications of such practices on soil carbon cycling and fertility.
Decaying crop residues play a fundamental role in nutrient cycling, enriching soils with organic carbon, nitrogen, available phosphorus, and potassium [42]. Our observations also revealed improvements in available nitrogen and potassium levels in soils managed with long-term crop residue incorporation at 50% and 100% levels. The availability of phosphorus, however, remains a challenge in alkaline and calcareous soils due to the formation of insoluble calcium phosphate minerals, limiting its uptake by plants. The widespread occurrence of zinc deficiency in calcareous soils is primarily attributed to low zinc availability rather than zinc content per se. Factors such as high calcium carbonate content, alkaline pH, and low organic matter exacerbate zinc deficiency by limiting its mobility and availability to plant roots [23,43]. Organic matter plays a critical role in buffering soil pH and forming organo–zinc complexes, which enhance zinc availability for plant uptake [44,45]. This study also found that applying higher Zn levels along with residue incorporation enhanced soil organic carbon, which could be the potential reason for the increased availability of soil Zn at the 10 kg ha−1 Zn application and 100% crop residue incorporation levels. The long-term incorporation of crop residues has also positively influenced the availability of micronutrients like iron and manganese, mediated by organic matter’s ability to chelate and mobilize these nutrients in the soil solution [46]. This interaction underscores the complex interplay between organic matter dynamics and soil nutrient availability in agricultural ecosystems.

5. Conclusions

From our long-term study on crop residue management and zinc application in a rice–wheat cropping system, we found significant improvements in soil organic carbon, reduced bulk density, and enhanced soil biological properties. Crop residue incorporation up to 80% increased soil active carbon, soil respiration, and ACE protein levels, while zinc application at 10 kg ha−1 further boosted active carbon and soil respiration by 35% and 53%, respectively, requiring higher crop residue levels for maximum impact. Long-term residue incorporation also improved the soil’s available nitrogen, potassium, zinc, iron, and manganese, especially at 50% and 100% residue levels, contributing to a 17.1% increase in rice grain yield when combined with 10 kg ha−1 zinc. These results highlight the synergistic benefits of integrating crop residue management and zinc application for enhancing soil fertility and crop productivity in semi-arid subtropical agricultural systems. Future research will incorporate longitudinal studies to evaluate the long-term impacts of zinc application and crop residue management on soil health, crop yield, and sustainability metrics.

Author Contributions

Conceptualization, R.L., S.K.S., and B.P.; methodology, E.B.A.E., S.K.S., and N.; software, N., B.P., and S.K.S.; validation, E.B.A.E., H.v.E., and R.L.; formal analysis, E.B.A.E., S.K.S., and B.P.; investigation, E.B.A.E., R.L., and S.K.S.; resources, R.L., H.v.E., and S.K.S.; data curation, R.L., B.P., N., and S.K.S.; writing—original draft preparation, B.P. and S.K.S.; writing—review and editing, R.L., H.v.E., and N.; visualization, R.L., E.B.A.E., S.K.S., and N.; supervision, R.L.; project administration, R.L., S.K.S., and B.P.; funding acquisition, R.L. and H.v.E. All authors have read and agreed to the published version of the manuscript.

Funding

This research received no external funding.

Institutional Review Board Statement

Not applicable.

Informed Consent Statement

Not applicable.

Data Availability Statement

All data recorded and analyzed during this study are available in the tables and figures.

Acknowledgments

All authors are thankful to Cornell University, Ithaca, USA, for funding the Soil Health Project under which the present work was conducted. The authors are also thankful to the ICAR–Indian Institute of Soil Science for technical guidance concerning this research work.

Conflicts of Interest

The authors declare no conflicts of interest.

References

  1. Naik, B.S.S.S.; Sharma, S.K.; Pramanick, B.; Chaudhary, R.; Yadav, S.K.; Tirunagari, R.; Gaber, A.; Hossain, A. Silicon in combination with farmyard manure improves the productivity, quality and nitrogen use efficiency of sweet corn in an organic farming system. Silicon 2022, 14, 5733–5743. [Google Scholar] [CrossRef]
  2. Kar, S.; Pramanick, B.; Brahmachari, K.; Saha, G.; Mahapatra, B.S.; Saha, A.; Kumar, A. Exploring the best tillage option in rice based diversified cropping systems in alluvial soil of eastern India. Soil Tillage Res. 2021, 205, 104761. [Google Scholar] [CrossRef]
  3. Laik, R.; Kumara, B.H.; Pramanick, B.; Singh, S.K.; Nidhi Alhomrani, M.; Gaber, A.; Hossain, A. Labile soil organic matter pools are influenced by 45 years of applied farmyard manure and mineral nitrogen in the wheat—Pearl millet cropping system in the sub-tropical condition. Agronomy 2021, 11, 2190. [Google Scholar] [CrossRef]
  4. Smil, V. Crop Residues: Agriculture’s Largest Harvest: Crop residues incorporate more than half of the world’s agricultural phytomass. BioScience 1999, 49, 299–308. [Google Scholar] [CrossRef]
  5. Wilhelm, W.W.; Johnson, J.M.F.; Douglas, K.L.; Lightle, D.T. Corn stover to sustain soil organic carbon further constrains biomass supply. Agron. J. 2007, 99, 1665–1667. [Google Scholar] [CrossRef]
  6. Blanco-Canqui, H.; Lal, R. Crop residue removal impacts on soil productivity and environmental quality. CRC Crit. Rev. Plant Sci. 2009, 28, 139–163. [Google Scholar] [CrossRef]
  7. Turmel, S.; Speratti, A.; Baudron, F.; Verhulst, N.; Govaerts, B. Crop residue management and soil health: A systems analysis. Agric. Syst. 2015, 134, 6–16. [Google Scholar] [CrossRef]
  8. Bhattacharyya, T.; Pal, D.K.; Mandal, C.; Velayutham, M. Organic carbon stock in Indian soils and their geographical distribution. Curr. Sci. 2000, 79, 655–660. [Google Scholar]
  9. Biswas, P.P.; Sharma, P.D. A New approach for Estimating Fertiliser response ratio-the Indian Scenario. Indian J. Fertil. 2008, 4, 59–62. [Google Scholar]
  10. Jat, H.S.; Datta, A.; Choudhary, M.; Sharmaa, P.C.; Jat, M.L. Conservation Agriculture: Factors and drivers of adoption and scalable innovative practices in Indo-Gangetic plains of India—A review. Int. J. Agric. Sustain. 2021, 19, 40–55. [Google Scholar] [CrossRef]
  11. Ladha, J.K.; Dawe, D.; Pathak, H.; Padre, A.T.; Yadav, R.L.; Bijay-Singh Singh, Y.; Singh, Y.; Singh, P.; Kundu, A.L.; Sakal, R.; et al. How extensive are yield declines in long-term rice–wheat experiments in Asia? Field Crops Res. 2003, 81, 159–180. [Google Scholar] [CrossRef]
  12. Timsina, J.; Cornor, D.J. Productivity and management of rice-wheat cropping systems: Issues and challenges. Field Crops Res. 2001, 69, 93–132. [Google Scholar] [CrossRef]
  13. Pramanick, B.; Kumar, M.; Naik, B.M.; Singh, S.K.; Kumar, M.; Singh, S. Soil carbon-nutrient cycling, energetics, and carbon footprint in calcareous soils with adoption of long-term conservation tillage practices and cropping systems diversification. Sci. Total Environ. 2024, 912, 169421. [Google Scholar] [CrossRef] [PubMed]
  14. Chauhan, B.S.; Singh, R.G.; Mahajan, G. Ecology and management of weeds under conservation agriculture: A review. Crop Prot. 2012, 38, 57–65. [Google Scholar] [CrossRef]
  15. Alloway, B.J. Micronutrients and crop production. In Micronutrient Deficiencies in Global Crop Production; Alloway, B.J., Ed.; Springer: Dordrecht, The Netherlands, 2008; pp. 1–40. [Google Scholar]
  16. Alloway, B.J. Zinc in Soils and Crop Nutrition, 2nd ed.; International Zinc Association: Brussels, Belgium; International Fertilizer Industry Association: Paris, France, 2008. [Google Scholar]
  17. Liu, Y.-M.; Cao, W.-Q.; Chen, X.-X.; Yu, B.-G.; Lang, M.; Chen, X.-P.; Zou, C.-Q. The responses of soil enzyme activities, microbial biomass and microbial community structure to nine years of varied zinc application rates. Sci. Total Environ. 2020, 737, 140245. [Google Scholar] [CrossRef] [PubMed]
  18. Smith, A.P.; Marín-Spiotta, E.; de Graaff, M.A.; Balser, T.C. Microbial community structure varies across soil organic matter aggregate pools during tropical land cover change. Soil Biol. Biochem. 2014, 77, 292–303. [Google Scholar] [CrossRef]
  19. Doran, J.W.; Sarrantonio, M.; Liebig, M. Soil health and sustainability. Adv. Agron. 1996, 56, 1–54. [Google Scholar]
  20. Miner, G.L.; Delgado, J.A.; Ippolito, J.A.; Stewart, C.E. Soil health management practices and crop productivity. Agric. Environ. Lett. 2020, 5, e20023. [Google Scholar] [CrossRef]
  21. Moebius-Clune, B.N.; Moebius-Clune, D.J.; Gugino, B.K.; Idowu, O.J.; Schindelbeck, R.R.; Ristow, A.J.; Van Es, H.M.; Thies, J.E.; Shayler, H.A.; McBride, M.B.; et al. Comprehensive Assessment of Soil Health the Cornell Framework Manual, 3rd ed.; Cornell University: Geneva, NY, USA, 2016. [Google Scholar]
  22. Benbi, D.K.; Brar, K.; Toor, A.S.; Sharma, S. Sensitivity of labile soil organic carbon pools to long-term fertilizer, straw and manure management in rice-wheat system. Pedosphere 2015, 25, 534–545. [Google Scholar] [CrossRef]
  23. Lakshmi, P.V.; Singh, S.K.; Pramanick, B.; Kumar, M.; Laik, R.; Kumari, A.; Shukla, A.K.; Abdel Latef, A.A.H.; Ali, O.M.; Hossain, A. Long term zinc fertilization in calcareous soils improves wheat (Triticum aestivum L.) productivity and soil zinc status in the rice-wheat cropping system. Agronomy 2021, 11, 1306. [Google Scholar] [CrossRef]
  24. Blake, G.R.; Hartge, K.H. Bulk density. In Methods of Soil Analysis, Part 1, 2nd ed.; Klute, A., Ed.; Agron Monogr 9; ASA and SSSA: Madison, WI, USA, 1986; pp. 363–375. [Google Scholar]
  25. Walkley, A.; Black, I.A. An examination of Degtjareff method for determining organic carbon in soils: Effect of variations in digestion conditions and of inorganic soil constituents. Soil Sci. 1934, 63, 251–263. [Google Scholar] [CrossRef]
  26. Weil, R.R.; Islam, K.R.; Stine, M.A.; Gruver, J.B.; Samson-Liebig, S.E. Estimating active carbon for soil quality assessment: A simplified method for laboratory and field use. Am. J. Altern. Agric. 2003, 18, 3–17. [Google Scholar]
  27. Zibilske, L.M. Carbon mineralization. In Methods of Soil Analyses Microbiological and Biochemical Properties; SSSA Book Series No 5; Wiley Publishing: Hoboken, NJ, USA, 1994; pp. 836–864. [Google Scholar]
  28. Wright, S.F.; Franke-Snyde, M.; Morton, J.B.; Upadhyaya, A. Time-course study and partial characterization of a protein on hyphae of arbuscular mycorrhizal fungi during active colonization of roots. Plant Soil 1996, 181, 193–203. [Google Scholar] [CrossRef]
  29. Gomez, K.A.; Gomez, A.A. Statistical Procedures for Agricultural Research; John Wiley & Sons Inc.: New York, NY, USA, 1984. [Google Scholar]
  30. Bellakki, A.K.; Badanur, V.P. Long-Term effect of integrated nutrient management on properties of Vertisol under dryland Agriculture. J. Indian Soc. Soil Sci. 1997, 45, 438–442. [Google Scholar]
  31. Shaver, T.M.; Peterson, G.A.; Sherrod, L.A. Cropping intensification in dryland systems improves soil physical properties: Regression relations. Geoderma 2003, 116, 149–164. [Google Scholar] [CrossRef]
  32. Hoffland, E.; Kuyper, T.W.; Comans, R.N.J.; Creamer, R.E. Eco-functionality of organic matter in soils. Plant Soil 2020, 455, 1–22. [Google Scholar] [CrossRef]
  33. Jastrow, J.D.; Amonette, J.E.; Bailey, V.L. Mechanisms controlling soil carbon turnover and their potential application for enhancing carbon sequestration. Clim. Chang. 2007, 80, 5–23. [Google Scholar] [CrossRef]
  34. Recena, R.; García-López, A.M.; Delgado, A. Zinc uptake by plants as affected by fertilization with Zn sulfate, phosphorus availability, and soil properties. Agronomy 2021, 11, 390. [Google Scholar] [CrossRef]
  35. Fontaine, S.; Barot, S.; Barré, P.; Bdioui, N.; Mary, B.; Rumpel, C. Stability of organic carbon in deep soil layers controlled by fresh carbon supply. Nature 2007, 450, 277–280. [Google Scholar] [CrossRef]
  36. Wutzler, T.; Reichstein, M. Priming and substrate quality interactions in soil organic matter models. Biogeosciences 2013, 10, 2089–2103. [Google Scholar] [CrossRef]
  37. Weintraub, M.N.; Schimel, J.P. Seasonal protein dynamics in Alaskan arctic tundra soils. Soil Biol. Biochem. 2005, 37, 1469–1475. [Google Scholar] [CrossRef]
  38. Mooshammer, M.; Wanek, W.; Schnecker, J.; Wild, B.; Leitner, S.; Hofhansl, F.; Blöchl, A.; Hämmerle, I.; Frank, A.H.; Fuchslueger, L.; et al. Stoichiometric controls of nitrogen and phosphorus cycling in decomposing beech leaf litter. Ecology 2012, 93, 770–782. [Google Scholar] [CrossRef] [PubMed]
  39. Johnson, A.M.; Hoyt, G.D. Changes to the soil environment under conservation tillage. HortTechnology 1999, 9, 380–393. [Google Scholar] [CrossRef]
  40. Mondal, S.; Chakraborty, D.; Bandyopadhyay, K.; Aggarwal, P.; Rana, D.S. A global analysis of the impact of zero-tillage on soil physical condition, organic carbon content, and plant root response. Land Degrad. Dev. 2020, 31, 557–567. [Google Scholar] [CrossRef]
  41. Franzluebbers, A.J. Soil organic carbon sequestration calculated from depth distribution. Soil Sci. Soc. Am. J. 2021, 85, 158–171. [Google Scholar] [CrossRef]
  42. Zhao, X.; Yuan, G.; Wang, H.; Lu, D.; Chen, X.; Zhou, J. Effects of full straw incorporation on soil fertility and crop yield in rice-wheat rotation for silty clay loamy cropland. Agronomy 2019, 9, 133. [Google Scholar] [CrossRef]
  43. Agboola, A.A.; Corey, R.B. The relationship between soil pH, organic matter, available P, exchangeable K Ca, Mg and nine elements in the maize tissue. Soil Sci. 1973, 115, 367–375. [Google Scholar] [CrossRef]
  44. Dvorak, P.; Tlustos, P.; Szakova, J.; Cerny, J.; Balik, J. Distribution of soil fractions of zinc and its uptake by potatoes, maize, wheat and barley after soil amendment by sludge and inorganic zinc salt. Plant Soil Environ. 2003, 49, 203–212. [Google Scholar] [CrossRef]
  45. Udom, B.E.; Mbagwu, J.S.C.; Adesodun, J.K.; Agbin, N.N. Distribution of Zn, Cd, Cu and Pb in a tropical Ultisol after long term disposal of sewage sludge. Environ. Int. 2004, 30, 467–470. [Google Scholar] [CrossRef]
  46. Stevenson, F.J. Organic Matter-Micronutrient Reactions in Soil. Chapter 6. In Micronutrients in Agriculture; Mortvedt, J.J., Ed.; Wiley Publishing: Hoboken, NJ, USA, 1991. [Google Scholar] [CrossRef]
Figure 1. Effect of crop residue management and Zn application on (a) soil active carbon, (b) soil respiration, and (c) ACE protein in upland calcareous soils [CR1, CR2, CR3, and CR4 are 0%, 25%, 50%, and 100% crop residue levels, respectively, and Zn1, Zn2, Zn3, and Zn4 are 0, 2.5, 5.0, and 10 kg ha−1 zinc application rates, respectively; line above the bar represents standard error].
Sustainability 17 00489 g001
Figure 2. (ad) The linear–plateau regression model for CR and active carbon with (a) no Zn application, (b) Zn @ 2.5 kg ha−1, (c) Zn @ 5 kg ha−1, and (d) Zn @ 10 kg ha−1.
Sustainability 17 00489 g002aSustainability 17 00489 g002b
Figure 3. (ad) The linear–plateau regression model for CR and soil respiration with (a) no Zn application, (b) Zn @ 2.5 kg ha−1, (c) Zn @ 5 kg ha−1, and (d) Zn @ 10 kg ha−1.
Sustainability 17 00489 g003
Figure 4. (ad) The linear–plateau regression model for CR and ACE protein with (a) no Zn application, (b) Zn @ 2.5 kg ha−1, (c) Zn @ 5 kg ha−1, and (d) Zn @ 10 kg ha−1.
Sustainability 17 00489 g004
Table 1. Effect of crop residue management and Zn application on soil organic carbon (SOC) in upland calcareous soils.
TreatmentOrganic Carbon (g kg−1)
CR1CR2CR3CR4Mean
Zn15.105.286.096.885.59
Zn25.155.456.337.056.00
Zn35.275.596.477.136.12
Zn45.325.616.587.196.18
CD (p = 0.05)CR: 0.12Zn: 0.06CR × Zn: 0.12
CR1, CR2, CR3, and CR4 are 0%, 25%, 50%, and 100% crop residue levels, respectively, and Zn1, Zn2, Zn3, and Zn4 are 0, 2.5, 5.0, and 10 kg ha−1 zinc application rates, respectively.
Table 2. Effect of crop residue management and Zn application on bulk density in upland calcareous soils.
TreatmentBulk Density (Mg m−3)
CR1CR2CR3CR4Mean
Zn11.481.421.401.391.42
Zn21.461.421.391.361.41
Zn31.431.411.371.351.39
Zn41.421.391.371.331.38
Mean1.451.411.381.36
CD (p = 0.05)CR: 0.02Zn: 0.01CR × Zn: 0.02
CR1, CR2, CR3, and CR4 are 0%, 25%, 50%, and 100% crop residue levels, respectively, and Zn1, Zn2, Zn3, and Zn4 are 0, 2.5, 5.0, and 10 kg ha−1 zinc application rates, respectively.
Table 3. Effect of crop residue management and Zn application on organic carbon stock in upland calcareous soils.
TreatmentSOC Stock (Mg C ha−1)
CR1CR2CR3CR4Mean
Zn174.9575.4181.1595.4579.24
Zn275.4477.2287.8695.6684.13
Zn375.4278.5088.9996.0284.79
Zn475.4378.1990.1396.2684.85
Mean75.4277.2284.5395.85
CD (p = 0.05)CR: 2.13Zn: 0.99CR × Zn: 1.99
CR1, CR2, CR3, and CR4 are 0%, 25%, 50%, and 100% crop residue levels, respectively, and Zn1, Zn2, Zn3, and Zn4 are 0, 2.5, 5.0, and 10 kg ha−1 zinc application rates, respectively.
Table 4. Statistical Evaluation of Different Regression Models for Active Carbon, Protein and Soil Respiration.
Zinc LevelStatisticsLinear ModelLinear Plus Plateau Model
(a) Active Carbon
No ZincRMSE28.3725.54
R250.4759.85
p-value<0.001<0.05
Zinc @ 2.5 kg ha−1RMSE29.4033.78
R256.4242.45
p-value<0.01NS
Zinc @ 5 kg ha−1RMSE31.1929.67
R265.2268.53
p-value<0.001<0.001
Zinc @ 10 kg ha−1RMSE36.7535.45
R263.0965.66
p-value<0.001<0.01
(b) Protein
No ZincRMSE23.6823.58
R230.3329.75
p-valueNS<0.001
Zinc @ 2.5 kg ha−1RMSE23.0521.13
R234.8034.94
p-value<0.01NS
Zinc @ 5 kg ha−1RMSE23.3123.28
R236.6336.74
p-value<0.01NS
Zinc @ 10 kg ha−1RMSE24.0924.08
R244.9944.18
p-valueNS<0.01
(c) Soil Respiration
No ZincRMSE37.6837.62
R24.274.59
p-valueNSNS
Zinc @ 2.5 kg ha−1RMSE37.9337.89
R24.174.37
p-valueNSNS
Zinc @ 5 kg ha−1RMSE38.2538.27
R24.554.62
p-valueNSNS
Zinc @ 10 kg ha−1RMSE38.7738.76
R24.074.08
p-valueNSNS
RMSE: root mean square error; R: coefficient of determination; p-value: significance of the regression; NS: non significant.
Table 5. Effect of crop residue management and Zn application on soil micronutrients after harvest under rice–wheat cropping system in upland calcareous soil.
TreatmentsSoil Micro and Secondary Nutrients (mg kg−1)
ZnCuMnFeBS
CR10.531.981.4216.880.6716.24
CR20.681.881.8917.180.6816.26
CR30.751.862.2817.660.6916.34
CR41.031.952.7219.260.6817.15
CD (p < 0.05)0.15NS0.090.67NSNS
Zn10.581.931.9117.360.7016.01
Zn20.681.901.9817.830.6616.87
Zn30.761.922.1417.880.6817.07
Zn40.971.922.2917.900.6716.03
CD (p < 0.05) 0.22NS0.100.40NSNS
CR1, CR2, CR3, and CR4 are 0%, 25%, 50%, and 100% crop residue levels, respectively, and Zn1, Zn2, Zn3, and Zn4 are 0, 2.5, 5.0, and 10 kg ha−1 zinc application rates, respectively; NS: non significant.
Table 6. Effect of crop residue management and Zn application on soil available N, P2O5, and K2O after rice harvest under rice–wheat cropping system in upland calcareous soil.
TreatmentsAvailable N (kg ha−1)Available P2O5 (kg ha−1)Available K2O
(kg ha−1)
CR1197.1818.4197.39
CR2223.4320.28110.53
CR3285.2620.56117.85
CR4297.8323.87156.81
CD (p < 0.05) 30.8NS18.38
Zn1240.4218.42107.59
Zn2240.6421.46115.05
Zn3255.0322.63124.52
Zn4267.6020.61135.12
CD (p < 0.05) NS2.624.75
CR1, CR2, CR3, and CR4 are 0%, 25%, 50%, and 100% crop residue levels, respectively, and Zn1, Zn2, Zn3, and Zn4 are 0, 2.5, 5.0, and 10 kg ha−1 zinc application rates, respectively; NS: non significant.
Table 7. Effect of different treatments on grain yield of rice.
TreatmentsYield (t ha−1)
CR1CR2CR3CR4Mean
Zn13.223.593.443.563.45
Zn23.203.383.553.733.46
Zn33.333.533.653.833.58
Zn43.433.723.753.983.72
Mean3.303.563.603.77
CD (p = 0.05)CR: 0.12Zn: 0.07CR × Zn: 0.13
CR1, CR2, CR3, and CR4 are 0%, 25%, 50%, and 100% crop residue levels, respectively, and Zn1, Zn2, Zn3, and Zn4 are 0, 2.5, 5.0, and 10 kg ha−1 zinc application rates, respectively.
Disclaimer/Publisher’s Note: The statements, opinions and data contained in all publications are solely those of the individual author(s) and contributor(s) and not of MDPI and/or the editor(s). MDPI and/or the editor(s) disclaim responsibility for any injury to people or property resulting from any ideas, methods, instructions or products referred to in the content.

