Article

Adaptive Thermal Comfort in the Different Buildings of Temperate Climates—Comparison Between High-Latitude Europe and Mountainous Himalayas in India

by
Samar Thapa
1,* and
Giovanni Pernigotto
1,2
1
Competence Centre for Mountain Innovation Ecosystems, Free University of Bozen-Bolzano, 39100 Bolzano, Italy
2
Faculty of Engineering, Free University of Bozen-Bolzano, 39100 Bolzano, Italy
*
Author to whom correspondence should be addressed.
Sustainability 2025, 17(2), 404; https://doi.org/10.3390/su17020404
Submission received: 28 October 2024 / Revised: 15 December 2024 / Accepted: 30 December 2024 / Published: 7 January 2025

Abstract

:
Thermal comfort in buildings is essential for occupant well-being and energy efficiency, particularly in naturally ventilated environments where indoor conditions are closely influenced by outdoor climates. Current studies have not fully explored how thermal comfort varies across regions with similar climatic classifications but distinct geographic and cultural contexts. Addressing this gap, we analyzed and compared the adaptive thermal comfort responses in different naturally ventilated buildings located in temperate oceanic regions arising due to the high latitude in Europe and the elevated Himalayan region of Darjeeling, India. A mixed-methods approach was used with data from classrooms, offices, and residential buildings with adaptive thermal comfort modeling. The results show that European buildings exhibit narrower thermal comfort ranges compared to Darjeeling, for example, 21.2~24.8 °C versus 16.0~21.6 °C for 80% comfortability in classroom settings, respectively. Statistical analysis revealed significant differences in clothing insulation levels, with occupants in Darjeeling buildings demonstrating higher variability (mean rank 2103.31) compared to their European counterparts (mean rank 1207.30, p < 0.001). Additionally, a stronger correlation between indoor and outdoor air temperature was observed in Darjeeling (R: 0.785, p < 0.001), reflecting limited thermal buffering compared to European buildings (R: 0.372, p < 0.001). The paper advances adaptive thermal comfort models that account for regional differences and links these finding to sustainable building practices. The findings provide actionable insights for energy-efficient, climate-responsive building practices while supporting global sustainable development goals.

1. Introduction

The building sector possesses significant potential for energy conservation, accounting for 48% of global energy consumption for construction, operation, and maintenance [1]. In India, nearly half of the energy within this sector is dedicated to maintaining indoor thermal comfort. Consequently, even a modest reduction in energy usage within this sector could result in substantial savings, particularly considering the country’s large population. Thus, by optimizing thermal comfort, architects and engineers can reduce the environmental impact of buildings, directly supporting United Nations Sustainable Development Goal (UNSDG) 11, “Sustainable Cities and Communities”, through the promotion of resilient and sustainable urban infrastructure.
Comparatively, naturally ventilated (NV) buildings, in contrast to air-conditioned (AC) types, exhibit lower energy consumption throughout their lifespan. This is attributed to their reliance on fans, windows, and other natural methods without the need for mechanical ventilation to provide thermal comfort to the occupants. Achieving thermal comfort in NV buildings not only reduces reliance on energy-intensive systems but also aligns with the global push for energy efficiency and environmental sustainability, contributing to the UNSDG 7, “Affordable and Clean Energy”, by fostering energy-efficient practices. Moreover, providing comfortable indoor environments contributes to UNSDG 3, “Good Health and Well-being”, as thermal comfort directly impacts occupants’ productivity, health, and overall satisfaction. However, the achievement of desired (thermal) comfort conditions is a challenge to engineers or architects and becomes even more difficult with the impending global warming. Thermal comfort as defined by the ASHRAE Standard 55 [2] refers to a state of mind expressing satisfaction with the thermal environment, which is crucial in this context. Nevertheless, despite this straightforward definition of thermal comfort and over several decades of research, discomfort due to thermal conditions remains the most frequently reported dissatisfaction in building environments [3].
Two methods are commonly employed to assess the thermal comfort of the indoor environment in buildings. The first is Fanger’s predicted mean vote– predicted percentage of dissatisfaction (PMV–PPD) model [4], which consolidates four environmental variables, i.e., air temperature (Ta), mean radiant temperature (Tmr), air velocity (Va), and relative humidity (RH), and two personal factors, i.e., clothing insulation (Icl) and activity level (MET), into a single value on a 7-point scale ranging from −3 (cold) to +3 (hot), representing the physiological impact on humans of these variables. International standards like ISO 7730 [5] and ASHRAE Standard 55 [2] employ this method to estimate the thermal comfort of indoor occupied spaces. However, this climate-chamber-based approach has been criticized for its lack of realism in actual indoor environments, often resulting in an under-estimation or an over-estimation of the thermal sensation in cool or warm conditions [6]. This often leads to estimation of the “setpoint” temperature being higher or lower than what would be suitable as per the comfort requirements of the occupants. This not only causes concern about the indoor environmental quality, but is also a waste of energy. Therefore, studies have subsequently reported discomfort in the AC buildings, too [7].
The discrepancy arises because, in real-world settings, occupants often adapt to their dynamic surroundings. Nicol and Humphreys [6] introduced the adaptive principle, suggesting that people tend to respond in ways that alleviate their discomfort. According to it, “if a change occurs that produces discomfort, people react in ways that restore their comfort”. Occupants utilize various adaptive strategies, which can be categorized as (i) behavioral, including personal, like adjustments in clothing, eating or drinking habits, posture, etc., technological, like opening and closing of windows, blinds, fans, etc., and cultural, like taking a siesta after lunch; (ii) physiological, which could be generic like the rate of perspiration in tropical people or habituation like acclimatization to environmental conditions; and (iii) psychological, reflecting thermal and visual expectations from the indoor environment. Subsequently, the adaptive model of thermal comfort emerged, linking subjective responses gathered through field investigation on occupants’ perceptions of thermal sensation, comfort, preference, and acceptability with the objective monitoring of environmental parameters to determine a comfortable or neutral temperature or conditions [7]. Nicol [8] highlighted that occupants employ adaptive measures to reduce their discomfort, and numerous interactions occur between the occupant and the environment. However, despite the significance of these feedback loops, they are considered less important than the ultimate outcome—the adaptation itself [7]. The adaptive thermal comfort model provides a link between the indoor comfort conditions and outdoor environmental variables, thus offering a framework to design sustainable indoor spaces for a climate-responsive building in the face of climate change. This directly supports UNSDG 13, “Climate Action”, emphasizing the need for mitigation and adaptation strategies to combat the effects of climate change.

2. Review of the Literature

Recognizing such adaptive occupant behavior in real-world settings, numerous field surveys on thermal comfort were conducted globally. These studies prompted revisions (Equation (1)) proposed by de Dear and Brager [9] in the ASHRAE model, based on 21,000 datasets from 160 buildings across 4 continents with diverse climatic conditions. Additionally, it was observed that the comfort temperature (Tcomf) exhibits a robust positive correlation with the outdoor mean temperature (Tout) to which subjects are exposed [7].
T c o m f = 0.31 T o u t + 17.8
However, thermal comfort is a rather subjective phenomenon that varies not only with climatic conditions but also on a variety of other factors like culture, tradition, ethnicity, past exposure, etc. Shen and Yu [10] found a comfort temperature of 17.4 °C and 16.3 °C for summer and winter in Western Sichuan, China. Ning et al. [11] found a comfort temperature of 21.5 °C, 20.9 °C, 21.8 °C, 21.2 °C, and 22.5 °C during late autumn, early heating, mid heating, late heating, and early spring seasons in dormitories of a university campus in Harbin, China. In tropical climates in India, Mishra and Ramgopal [12] found a comfort temperature of 27.6 °C (in NV mode) and 28.1 °C (in AC mode) in Chennai, 26.4 °C (for both the modes) in Hyderabad, and 26.5 °C in Kharagpur, respectively. Representing the comfort conditions with a single equation for everyone is thus not possible. Pertinent to mention here is that the above Equation (1) excludes data from the Indian subcontinent, which is diverse in geography, culture, tradition, ethnicity, climate, etc., all of which affect the subjectivity of thermal comfort.
Recognizing this variability in thermal comfort across different criteria, questionnaire studies, more commonly known as “right-here-right-now” surveys, are conducted globally by different researchers. The ASHRAE Global Thermal Comfort Database II possesses around 100,000 data containing both the objective monitoring of the indoor environment and the subjective response of thermal comfort in a harmonized manner, coming from different field studies around the globe, which are available in an open-source manner [13].
Comparative thermal comfort studies with data from around the globe have caught attention recently. Using 141 participants, Yang et al. [14] found the range of acceptable operative temperature (Top) as 20.9~28.0 °C, 17.7~23.3 °C, and 15.1~21.6 °C for the residences in the city, town, and rural areas of Bayannur City. Using the ASHRAE Database, Wang et al. [15] reported that the neutral comfort temperature was most affected by the local climate followed by country, HVAC mode, and building type. They also found that in comparison to the occupants of office and educational buildings, residents in a dry climate zone would accept a 2.5 °C wider temperature range. Comparing the thermal comfort from residential buildings across different climates in China, Lai et al. [16] found that respondents reported the highest percentage, i.e., 18% of “cold” responses during winter in the hot summer and cold winter (HSCW) region, and 18% of “hot” responses during summer in cold climate (CC) region, respectively. With the responses of university students from the Mediterranean climate, Romero et al. [17] found that the natural ventilation strategies were more maintained in Spain than in Portugal. Further, they reported a preferable temperature of 24.7 °C and 26.4 °C for the students of the two countries, respectively. Comparing the thermal comfort studies in severe cold zones, cold zones, and hot summer and cold winter zone cities of Harbin, Beijing, and Shanghai, Cao et al. [18] reported a clothing insulation (Icl) of 0.96 clo, 1.1 clo, and 0.99 clo, while the neutral temperatures (Tn) were 21.95 °C, 22.01 °C, and 22.74 °C, respectively. While analyzing the data of the outdoor thermal comfort surveys from the RUROS (Rediscovering the Urban Realm and Open Spaces) database, Chen et al. [19] found that European women generally considered thermal conditions as neutral under slightly warmer temperatures than men, particularly for the lower thresholds of the neutral PET (physiological effective temperature) zone, indicating their heightened sensitivity to environmental changes, as reflected in the narrower neutral PET zone and a stronger correlation between their sun preference and actual solar radiation values. A comparative study [20] with the database chosen for 10 cities from ASHRAE RP-884, SCATs (Smart Controls and Thermal Comfort), and the Chinese Thermal Comfort Database reported the winter Tn as 23.4 °C, 22.7 °C, and 21.7 °C for Europe, North America, and China, respectively. Jeong et al. [21] compared the thermal comfort data from the residents of two cities in different climatic zones of Australia: Sydney in warm temperate climate and Brisbane in warm humid summer and mild winter conditions. They reported an acceptable temperature range of 16.3~27.2 °C and 14.6~26.2 °C in the two regions, respectively. Comparing the indoor thermal comfort data from the ASHRAE RP-884 and the Chinese database, Yang et al. [22] reported that the Chinese population showed a greater adaptability, with acceptable ranges of temperatures of 19.4~29.2 °C, 16.0~27.3 °C, and 15.7~30.8 °C in cooled, heated, and NV buildings, respectively. Pistore et al. [23] evaluated the European Thermal Comfort Database of SCATs and reported that, during summer, the thermal comfort responses in Greece (Mediterranean climate) notably deviate from other countries, marked by users’ reduced inclination to vote for the “warm” side, while Sweden (sub-Arctic climate) exhibits a higher tendency for “warm” preferences. A previous study in temperate climates using a different database in Australia was conducted by Williamson and Daniel [24], who reported an 80% acceptable range between 16.0 and 24.9 °C. Using the ASHRAE Global Thermal Comfort Database I and II [13], Jebaei and Aryal [25] found that personal comfort systems (PCSs) increased satisfaction from 68% to 77.8% with fans in summers and heaters in winters and to 86.6% with fans and heaters in both summers and winters, respectively.
Equation (1) from the study [9] excludes the dataset from the Indian subcontinent, which has several different climatic regions. Thapa and Indraganti [26] compared the thermal comfort based on field studies in two neighboring climatic regions and reported the range of Tcomf as 18.4~36.1 °C and 11.1~30.1 °C in the hot and humid and cold climatic regions of northeast India. Singh et al. [27] reported a preferred temperature of 24.0 °C, 23.5 °C, and 22.0 °C in the office buildings located in the warm and humid, cool and humid, and cold and cloudy climates of Tezpur, Imphal, and Shillong in northeast India. A recent study [28] used the thermal comfort database for Indian buildings available in the ASHRAE Global Thermal Comfort Database II [13] and reported the comfort temperature (Tcomf) in residential buildings to be around 2.5 °C and 1.4 °C higher than that in the offices and universities, respectively. Kaushal et al. [29] conducted a review of the literature regarding the NV buildings in India and reported a comfort range of 12.5~32.0 °C, 15.3~33.8 °C, and 18.4~33.5 °C for cold, composite, and hot and humid climates, respectively. Sharma et al. [30] reviewed the literature for NV built environments in Indian sub-continent to report that barring the CEN standards, the other international thermal comfort standards either over-estimate or under-estimate the thermal comfort of Indian buildings. Despite the above effort, comparisons of thermal comfort studies having similar climatic condition but different geographies are scarce to find, although this could bring newer insights, as differences in thermal comfort conditions at present are primarily set only as per the climatic variations.

3. Research Gaps and Objectives of the Study

The comfort temperature (Tcomf) in adaptive thermal comfort model is expressed as a function of outdoor air temperature [31]. However, thermal comfort is a subjective phenomenon, and adaptation depends upon diverse set of factors in addition to climate. For example, the temperate oceanic climatic conditions are found in both Europe and the sub-Himalayan regions (Figure 1 [32]). The former is mostly due to its location in higher latitude, while the latter is due to altitude. These types of climates are marked by warm summer and cool winters and designated as “Cfb” and “Cfc” as per Köppen climate classification. Further, modern buildings in Europe are much different than those in the developing regions of south Asia, with that in the former often being more energy-efficient and comfortable due to the incorporation of (wall and roof) insulation, with the wall U-value 0.168~0.312 W/m2-K [33], whereas that in the sub-Himalayan regions of the Indian sub-continent lack them, with wall U-value about 1.5~3.0 W/m2-K for solid brick wall [34]. Thus, this study seeks to address critical gaps in understanding thermal comfort under temperate oceanic climates, focusing on naturally ventilated (NV) buildings in high-latitude European regions and the mountainous Himalayan region in India. Although comparative thermal comfort studies are available in the literature, comparisons between temperate climates, influenced by high latitudes (Europe) and high altitudes (Himalayas) are rarely conducted directly. Table 1 illustrates the differences in latitude and altitude between the two studied locations.
Given the significant role of thermal comfort in advancing sustainable building practices, the following objectives guide this research:
Main objective:
  • To compare and analyze the adaptive thermal comfort responses of occupants in NV buildings across two distinct temperate oceanic climatic regions, separated by high latitudes (European) and high altitudes (Himalayan), identifying key differences and similarities to inform sustainable and energy-efficient building designs.
More specifically, these include:
  • To evaluate the thermal comfort ranges and adaptive behaviors of building occupants in European and Indian temperate climates;
  • To assess the impact of environmental variables, such as air temperature and relative humidity on indoor thermal comfort in different building types;
  • To identify limitations in existing datasets and propose recommendations for future research to improve the reliability of thermal comfort models under varying climatic conditions and the applicability of the adaptive thermal comfort model in the different locations.
Global Relevance:
This research provides insights into the role of geographic and climatic differences in shaping thermal comfort experiences. The findings have implications for global building design standards and energy policies, particularly in addressing the challenges posed by climate change and urbanization. By emphasizing adaptive thermal comfort and its comparison in different geographic settings, this study contributes to the development of sustainable, resilient, and health-promoting building environments worldwide.

4. Methodology

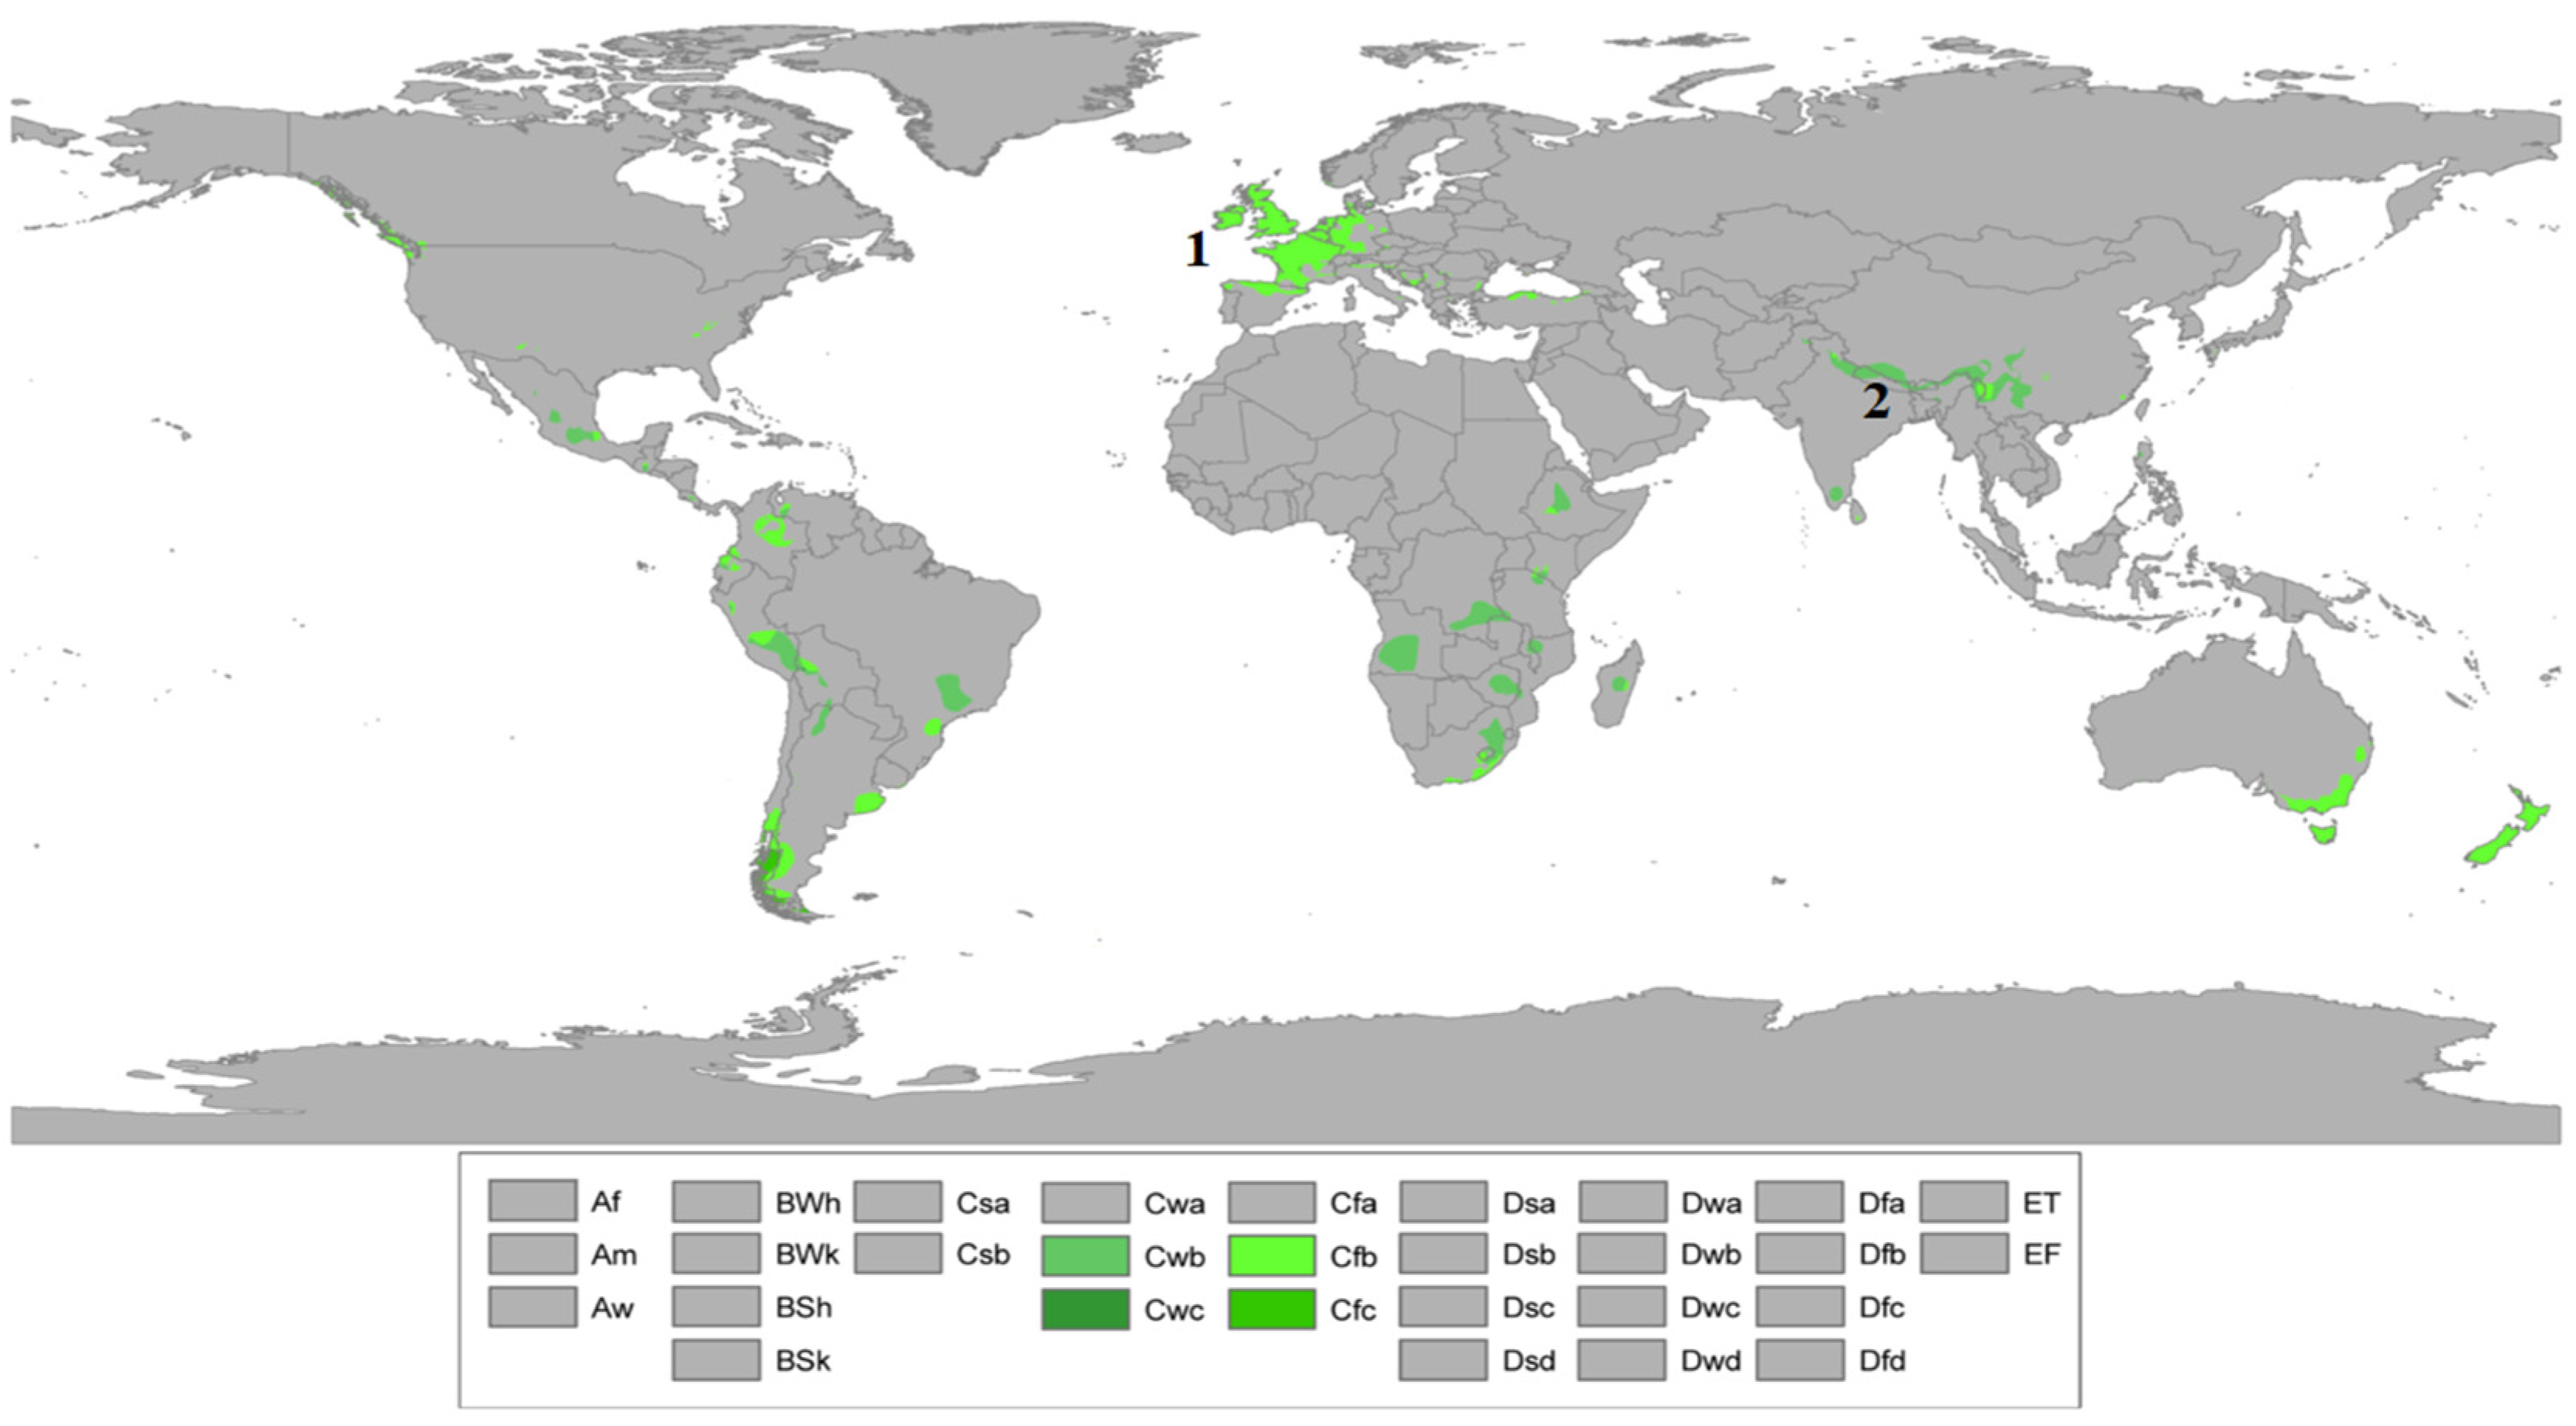
4.1. Analyzed Datasets

Two different thermal comfort databases are used in the study. We began with the “right-now-right-here” survey database in the ASHRAE Global Thermal Comfort Database II [13], which contains around 100,000 rows of values for both the monitoring of indoor environmental variables and subjective responses of thermal comfort from field studies around the globe. Using the filter commands (in MS Excel) in the metadata of the ASHRAE Database II, we chose the following: Europe (region)→naturally ventilated (cooling_type)→temperate oceanic (climate). A total of 1652 valid responses (638 female, 651 male, 363 no response) from 12 (twelve) buildings (building_id) were found after the removal of rows with missing values. Two buildings bearing building_id 775 and 778 were designated as “others” in the BuildingType, which were excluded from the study. Thus, we analyzed the data for BuildingType as classrooms, offices, and multifamily housing (MFH). Sample size from each building along with other details for the two geographical regions are shown in Table 1.
The second dataset we used is based on a year-long thermal comfort study conducted in 2015 in different buildings at 4 locations (Table 1) in the Darjeeling Himalayan region [35]. A total of 2038 responses (818 female and 1220 male) were received. The ASHRAE Standard 55 [2] class II protocol, which recommends the measurement of air temperature (Ta or Ti), globe temperature (Tg), relative humidity (RH %), and air velocity (Va) at a height of 1.1 m above the floor level, was followed during the study along with the simultaneous filling out of a paper-based questionnaire [35]. In addition to the above four measured indoor environmental parameters, values regarding the personal parameters of clothing insulation, Icl (clo) and activity level, M (MET) were collected via the questionnaire response and referred from their respective tables in ASHRAE Standard 55 [2,36]. The questionnaire constituted three different sections. First were the personal identifiers, like name (which was removed after codification in order to protect privacy), gender, age, weight, and height. The second section collected data on thermal sensation votes (TSVs) on the ASHRAE 7-point scale, thermal preference votes (TPV) on the Nicol 5-point scale, thermal acceptance on a 2-point scale, and overall comfort on a 6-point scale. For details regarding the survey, the reader is referred to the previous publication [35].
The dataset from the Darjeeling Himalayan region, collected over one year, is representative and sufficient for the study’s objectives as it captures all four seasons, encompassing the region’s climatic variability. With over 2000 responses from diverse building types, the dataset provides statistically robust insights into occupant thermal comfort. Furthermore, the temperate oceanic climate of the region exhibits stable seasonal patterns, reducing the likelihood of significant inter-annual variation. While longer-term data could enhance the analysis, the current dataset aligns with standard practices in thermal comfort research and reliably supports the study’s findings. The data are available in the online repository at [36].

4.2. Assumptions and Calculated Comfort Indicators

In this section, we present a discussion on air velocity and its effect on air temperature [37]. This is followed by the calculation of mean radiant temperature [2] and the PMV [4] and SET temperature. Since fans were not present in any of the locations, the air movement was only attributed due to the natural convection and bodily movements. Humphreys [37] had, however, previously elaborated that the effect of air movement on the comfort temperature as
T n = 7 50 ( 4 + 10 V a 0.5 )
where ΔTn is the change in neutral (comfort) temperature and Va is the air velocity, which returns a negligible value (of change in comfort temperature) until Va is 0.1 m/s. Therefore, in order to accommodate the air movement due to body movement and natural convection, the value of Va was taken as 0.1 m/s.
The ASHRAE Standard 55 [2] also illustrates the method to calculate the mean radiant temperature (Tmr) as
T m r = ( T g + 273.15 ) 4 + 1.335 10 8 V a 0.71 ( T g T i ) ( D 0.4 ) 1 / 4 273.15
where D and є are the diameter and emissivity of the black globe thermometer provided by the manufacturer. However, we used the air temperature (Ta) to make various correlations in the present study, as there were only 1147 rows in the ASHRAE Database II with the values for Tmr or Tg, necessary to calculate the indoor operative temperature (Top), recommended by the ASHRAE Standard 55 [2] to describe the indoor environment.
The predicted mean vote–predicted percentage of dissatisfaction (PMV–PPD) [4] was calculated as
P M V = 0.303 e 0.036 M + 0.028 L
where M and L represent the metabolic rate and thermal load between the internal rate of heat production and the actual heat lost to the environment. The latter is found in an iterative manner with the six factors of thermal comfort above. PPD is derived from the PMV and ranges between 5 and 100%. This signifies that even at the (thermally) neutral conditions, 5% of the occupants still remain dissatisfied, and it is impossible to satisfy everyone with one condition [4].
P P D % = 100 95 e ( 0.3353 P M V 4 0.2179 P M V 2 ) ,   w h e r e   5 P P D 100
Differently from the PMV–PPD model incorporated in several international standards, like the ASHRAE Standard 55 [2] and ISO 7730 [5,38], the adaptive thermal comfort [6] advocates that “if a discomforting change occurs people react in ways that lead to restore their comfort back”. Thus, revisions to the ASHRAE model were proposed by de Dear and Brager [9], as illustrated in Equation (1), which correlates thermal comfort of an individual with meteorological conditions, more appropriately the mean outdoor temperature (Tout) [6]. More importantly, the thermal history, i.e., the effect of the past conditions (often referred as “habituation”) shows a strong influence on the thermal comfort of individuals [6]. This is represented in the running mean of outdoor air temperature, Trm(t) for the time “t” which elaborates a stronger effect, α (0 < α ≤ 1) of the immediate past over a distant one.
T r m ( t ) = 1 α { T t 1 + α T t 2 + α 2 T t 3 }
A previous study [7] reported a non-significant effect of the value of “α” on the correlation between Tcomf and Tout until α < 0.90. A 30-day Trm was calculated taking α as 0.80, as recommended.
Since the objective of the study is to compare the thermal comfort data coming from diverse datasets (in different geography), we also used the standard effective temperature (SET) as a thermal comfort indicator to increase the robustness and reliability of the paper. SET is a measure of thermal comfort that represents the temperature of a hypothetical environment where the occupant experiences the same thermal sensation as in the actual environment. In this hypothetical environment, the RH is 50% and air velocity is less than 0.1 m/s, and the mean radiant temperature equals the air temperature. The occupant is assumed to be in a seated position (1.0 MET) and under light clothing insulation (0.6 clo), respectively.
SET, which is based on the effective temperature (ET), was originally proposed by Gagge, Nishi, and Gonzalez [39]. The SET model accurately represents the physiological regulation mechanisms of the human body and its heat exchange with the environment in a more precise and reasonable manner. Unlike the adaptive thermal comfort model, which only considers the relationship between neutral temperature and outdoor temperature, the SET model encompasses the comprehensive effects of multiple parameters. SET represents an analogous temperature derived from skin heat transfer and physiological parameters obtained through the two-node model [40]. This classic thermo-physiological regulation model simplifies the human body into two layers: the core and the skin. According to this model, the body’s heat generation occurs in the core layer and is subsequently transferred to the skin layer through blood flow. While the PMV model primarily uses environmental variables and assumes steady-state conditions, SET goes further by simulating the body’s physiological mechanisms, making it more accurate in complex environments [41]. For illustration, consider a NV office building on a warm summer day with Ta and RH as 28 °C and 60%, respectively, with a minimal air movement. Traditional models like the PMV might predict discomfort based only on air temperature and humidity, the SET considers how the body responds physiologically. For example, the body may increase sweating or adjust blood flow to the skin. Therefore, SET helps in determining whether the environment feels warmer or cooler than the actual air temperature, providing a more realistic assessment of comfort. In this paper, we used the online tool of Center for Built Environment (CBE) to calculate the values of SET [42] for both the dataset.

4.3. Statistical Analysis

For the analysis of the 7-point TSV ordinal scale, the probit regression method was chosen. Probit analysis is often used for analyzing ordinal data when there are more than two ordered categories [43]. In this case, a cumulative probit model was employed, which is explained as follows. Considering a scenario where the ordinal outcome variable Y has K ordered categories (e.g., 1, 2 …K), the cumulative probability P (Y ≤ k) for the kth category can be modeled using the probit function [44]:
P Y k = Φ ( β 0 + β 1 X 1 + β 2 X 2 + + β p X p )
where
Φ is the cumulative distribution function of the standard normal distribution
β0, β1 … βp are the coefficients to be estimated
X1, X2 … Xp are the predictor variables
For the ordinal case, we get (K − 1) different equations for different categories, and the probability for the category k is given as
P Y = k = P Y k P ( Y k 1 )
The model was estimated using maximum likelihood estimation (MLE). The likelihood function is constructed based on the assumption that the observed responses Y follow a multinomial distribution [44]. The log-likelihood function was then maximized to obtain estimates of the coefficients. Statistical tool SPSS v.27 was used to perform the probit regression, where the ordinal variable, TSV, was taken as dependent, and the covariate, Ta, as the independent variable. The temperature corresponding to the median response for each ordinal category was calculated by dividing the location estimate by the threshold estimate, with the standard deviation (s.d.) as the reciprocal of the location estimate. Transforming the probits into the proportion for each value, x (representing the independent variable, Ta) is the cumulative distribution function (CDF) of the standard normal distribution [43]:
P Φ = C D F . N O R M A L ( x , m e a n , s . d . )
Though the thermal sensation votes were assessed on the ASHRAE 7-point scale, i.e., cold, cool, slightly cool, neutral, slightly warm, warm, and hot, in both the datasets used in the study, the thermal preference (TPV) was assessed on a 3-point scale, i.e., “warmer”, “no change”, and “cooler” for the European dataset in the ASHRAE Database II, whereas it was measured on a 5-point Nicol scale, i.e., much warmer, a bit warmer, no change, a bit cooler, and much cooler in the Darjeeling dataset. For uniformity, we combined the responses in Darjeeling dataset, for below no change to yield “prefer warmer” and above no change to yield “per cooler”, respectively. The data was converted into binary form by allotting “no change” as 0 and “preferring warmer/cooler” as 1, separately. Thus, state “1” represents the preference for the change while state “0” no change. A logistic regression was performed as follows.
L o g i t p = l o g p ( 1 p ) = b T + c
p = e ( b T + c ) 1 + e ( b T + c ) = 1 1 + e ( b T + c )
where p is the probability for the preference for the change, while “b” and “c” are constants determined by performing a probit regression for the logit function, for the condition that there is a preference to change [45].
In addition to the SPSS v.27, we used python v3.0, Statistica V10.0 and MS Excel for data analysis and representation.

5. Results

This section presents the results of the comparison in thermal comfort between the two geographic regions of European and Indian temperate climates. We begin with the findings regarding outdoor environmental conditions, followed by the factors of thermal comfort, i.e., indoor environmental conditions and clothing insulation. Thereafter we present the thermal comfort indexes of thermal sensation votes, preference votes, SET, PMV–PPD, and finally the assessment on indoor comfort and thermal neutrality.

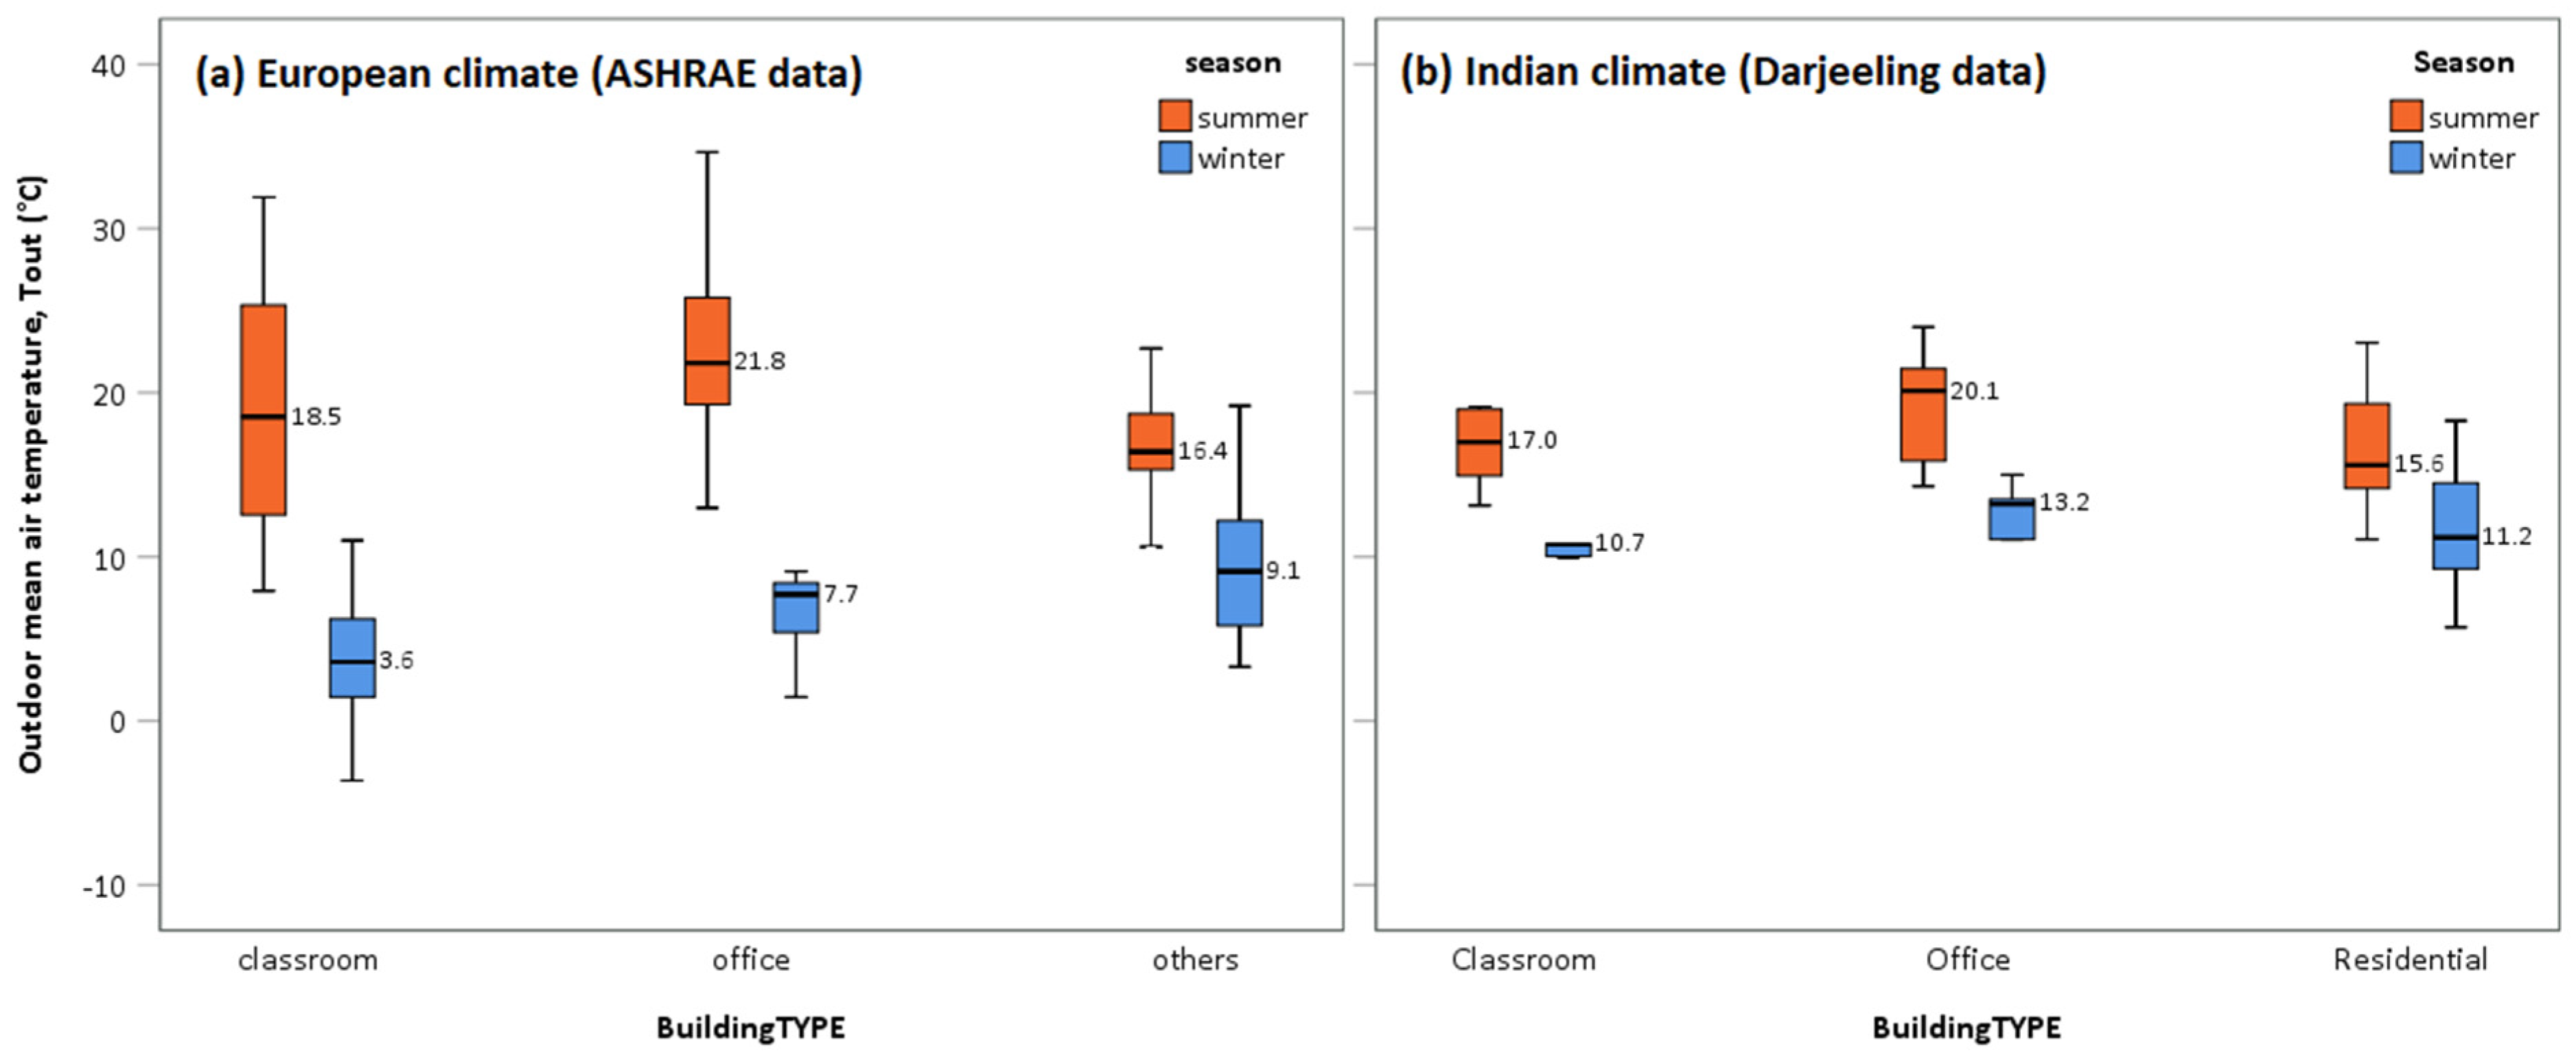
5.1. Outdoor Environmental Conditions

The ASHRAE database for European type of temperate climate contains data from the year 1998 to 2014, whereas the survey in the Indian temperate climate of Darjeeling was conducted from January to December 2015. The meteorological data from the two climates could not be compared directly, thus. However, to make an understanding of how the climatic conditions affect thermal comfort, we conducted basic statistics of the outdoor air temperature and relative humidity (RHout).
The outdoor mean air temperature (Tout) varied between 7.9 and 39.5 °C (mean 22.4 °C, s.d. 5.72 °C, N 782) during the summer and between −3.6 and 15.6 °C (mean 5.4 °C, s.d. 4.88 °C, N 158) during the winter in the temperate oceanic climate of Europe, henceforth known as European climate type. However, as regards the MFH (residential) category, the ASHRAE Database II did not contain the outdoor air temperature. On the contrary, air temperature varied between 11.1 and 24.0 °C (mean 17.4 °C, s.d. 3.54 °C, N 1354) during the summer and between 5.7 and 18.3 °C (mean 11.6 °C, s.d. 2.68 °C, N 684) during the winter in the Indian (sub-Himalayan) temperate oceanic climate, henceforth known as Darjeeling type. As can be observed, a much wider variation in outdoor mean air temperature is noticed in the European climate, especially during the summer months compared to the Darjeeling climate. This is also illustrated in the 5-point summary shown in the box plot of Figure 2, where the central box shows the central two quartiles of data with the horizontal line as the mean value. The whiskers below and above the box represent the lower and upper quartiles, respectively.
The mean outdoor relative humidity (RHout) showed an interesting variation. We analyzed the RHout as per different months extracted from the timestamp column of the ASHRAE database (Figure 3). It was interesting to note that, while the RHout increased with the onset of summer months in the Darjeeling climate-probably due to the arrival of monsoon winds (carrying water vapor) in the Indian sub-continent, the same was higher during the winter period in the European type of climate. The RHout varied between 56% and 89% (mean 77.3%, s.d. 8.93%, N 1354) during the summer and between 47% and 81% (mean 66.9%, s.d. 8.21%, N 684) during the winter in Darjeeling, while it varied between 49% and 85% (mean 65.6%, s.d. 8.62%, N 782) during the summer and between 65% and 95% (mean 79.8%, s.d. 7.73%, N 158) during the winter in the EU, respectively. The lower RH in the European type of climate explains the higher variation in Tout during the summer as water vapor in air acts an attenuating factor.

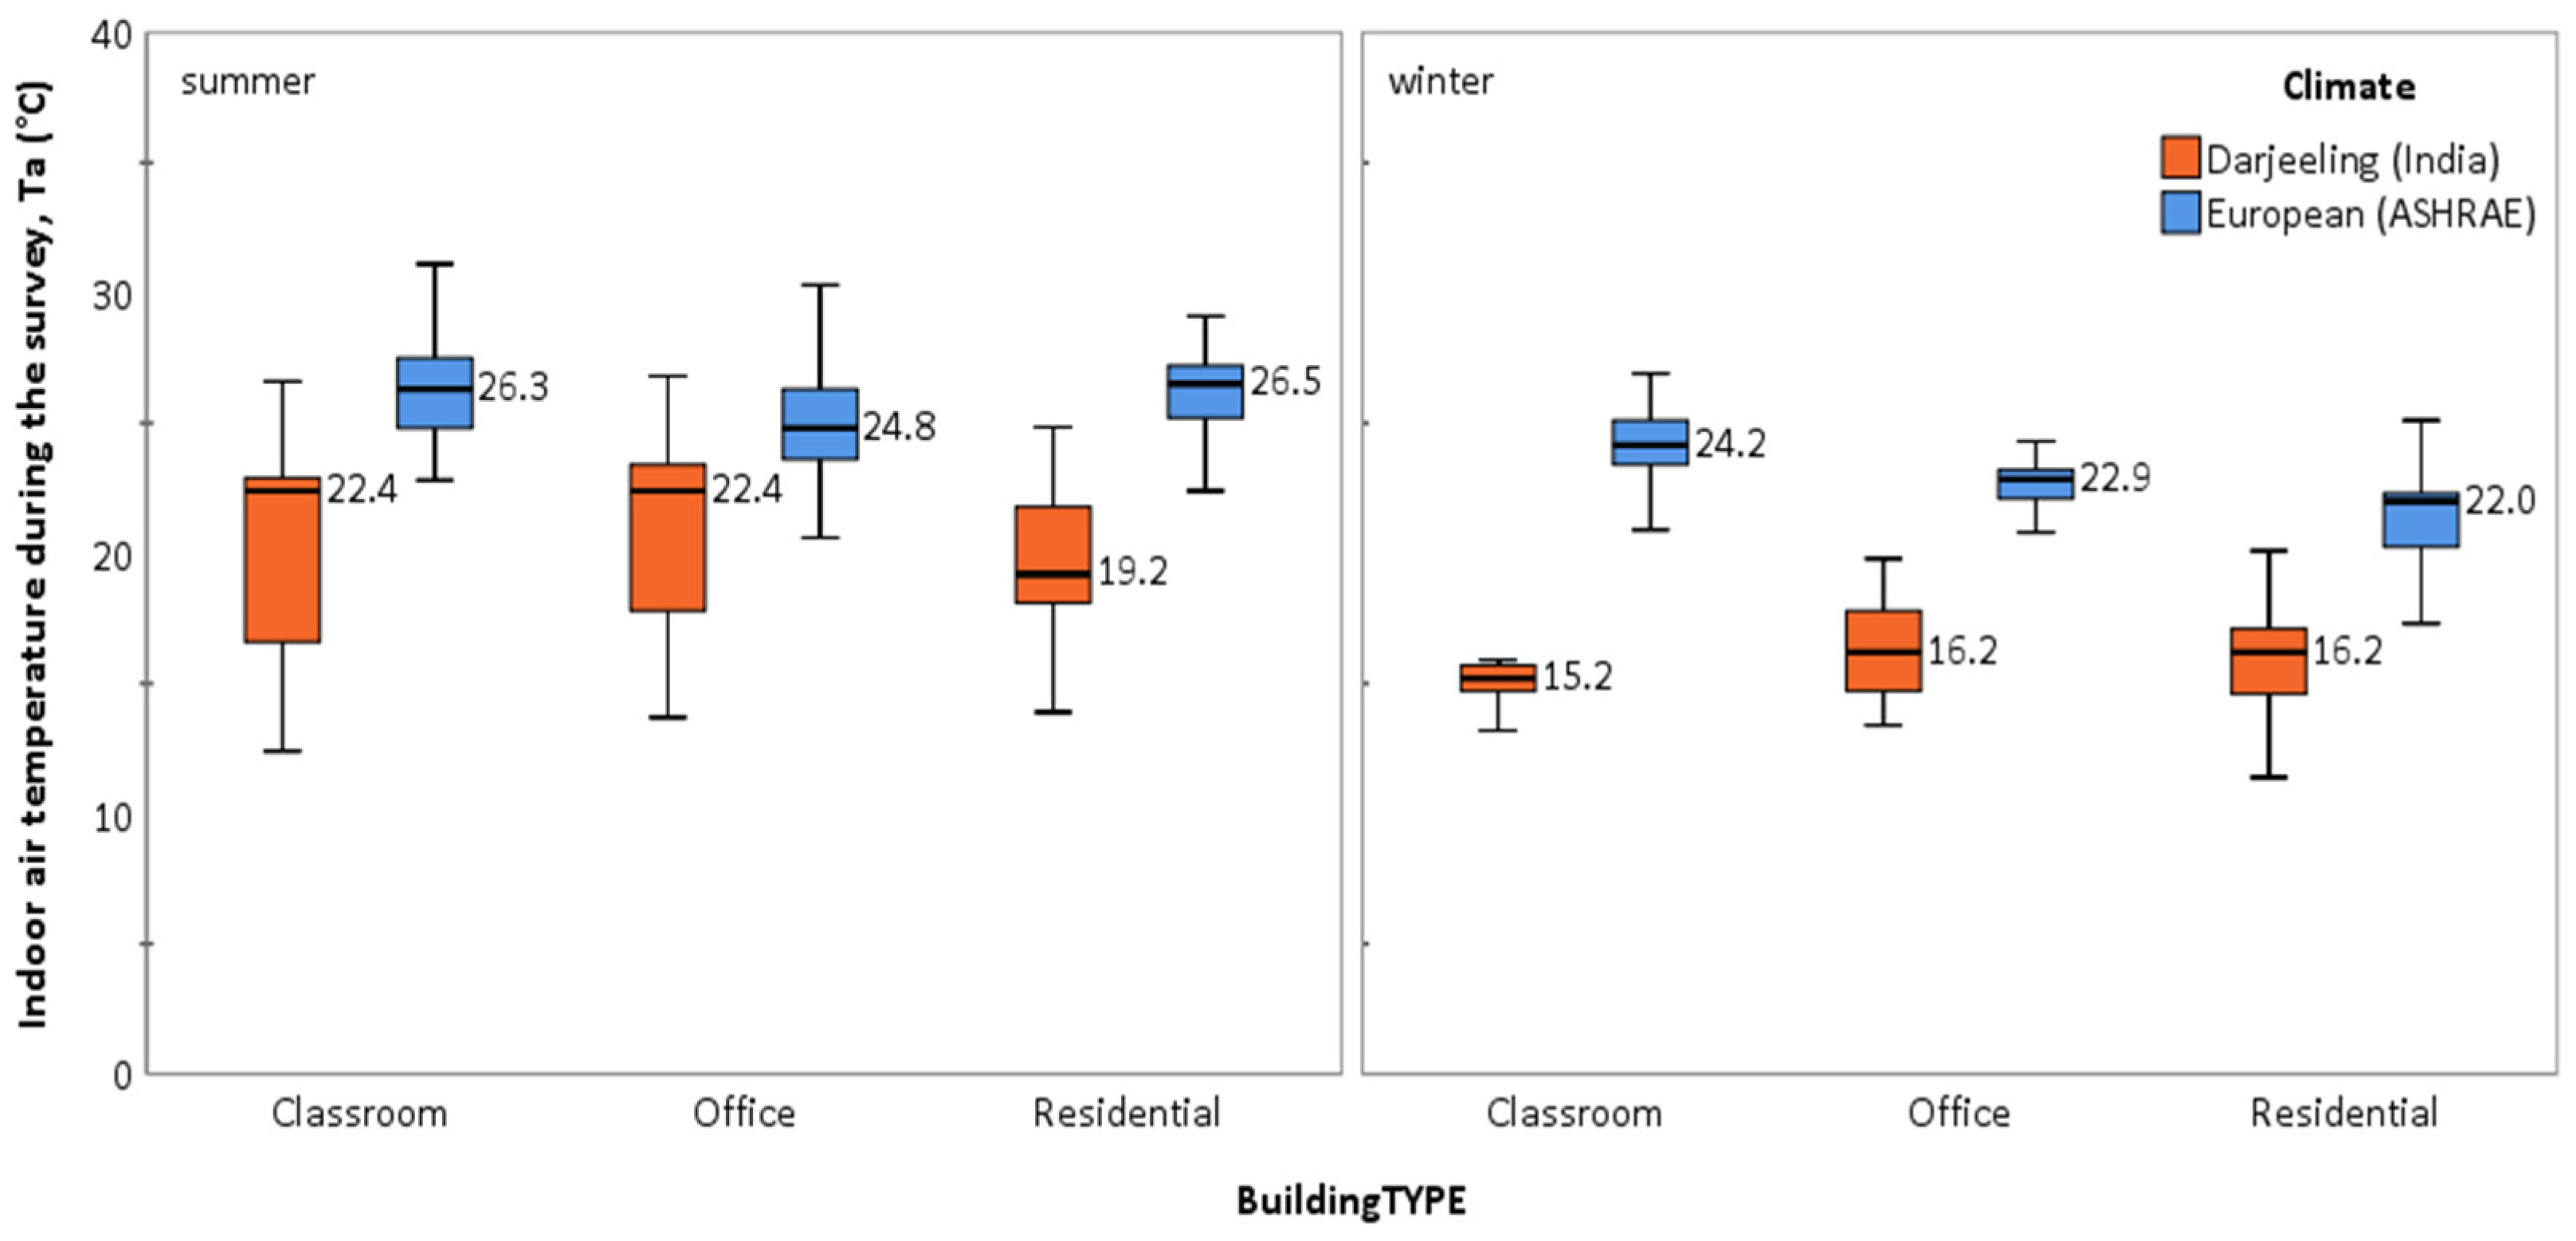
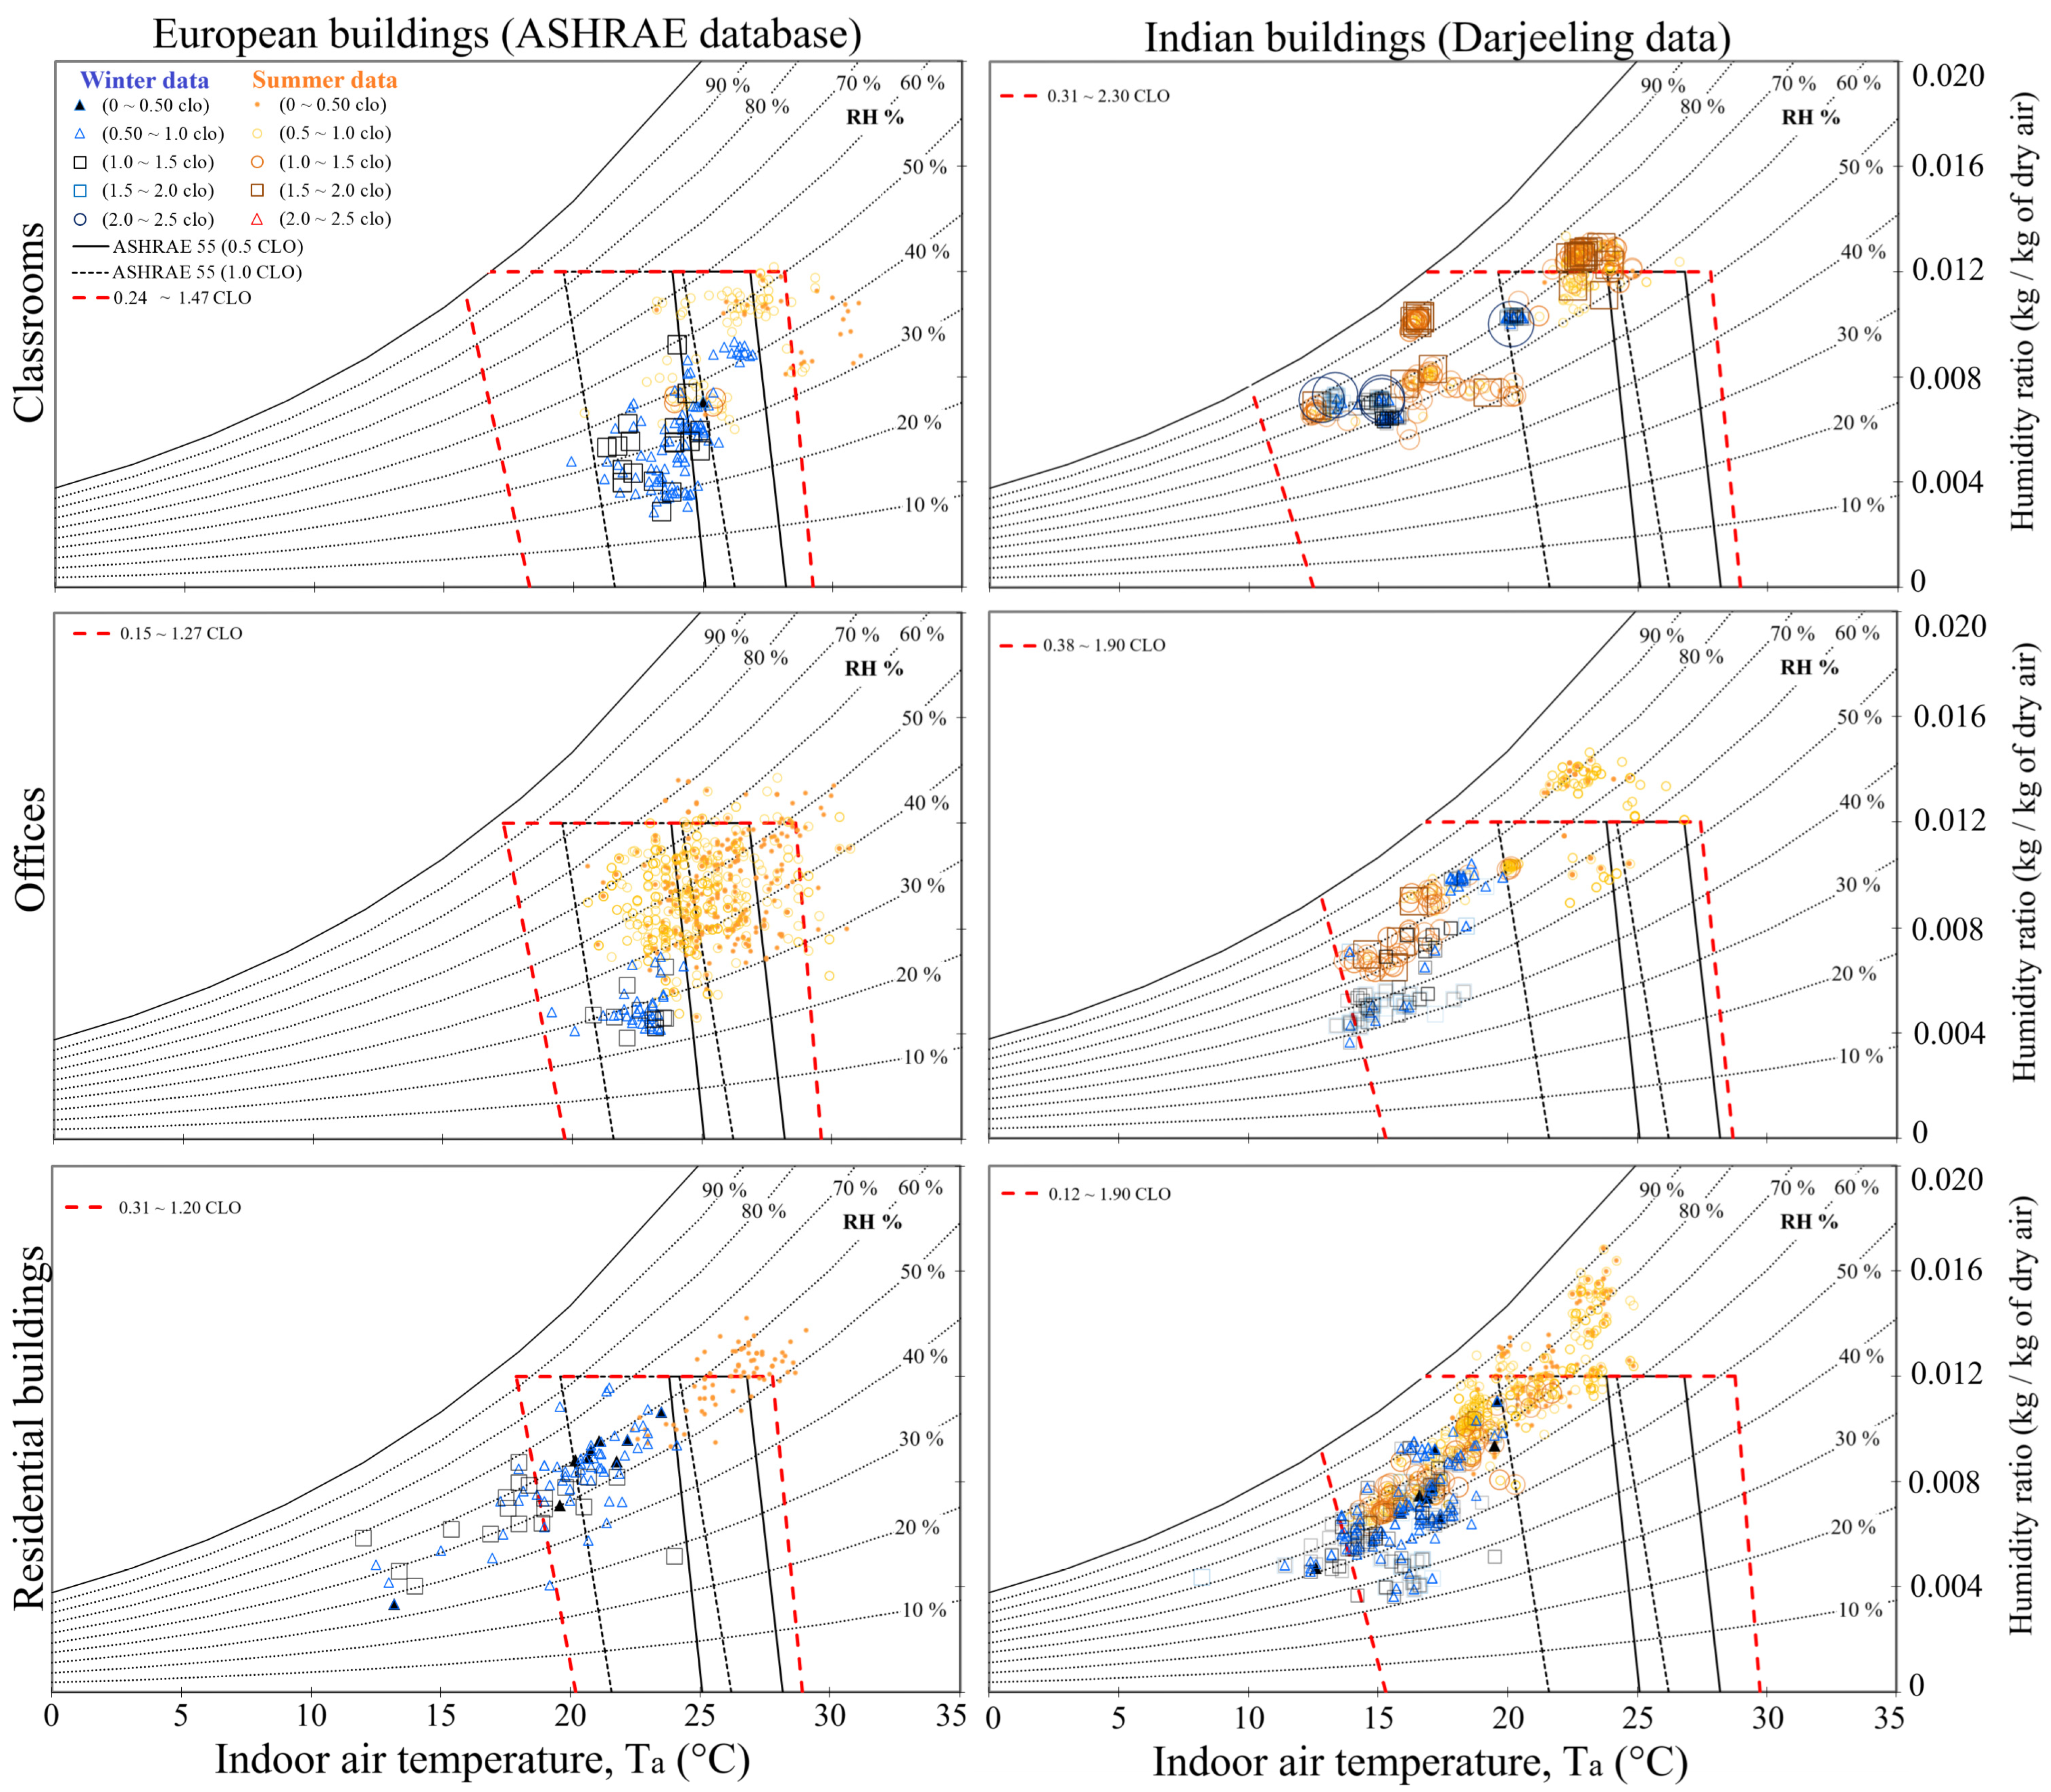
5.2. Indoor Environmental Condition

The indoor air temperature (Ta) contrastingly varied between 20.4 and 31.1 °C (mean 25.3 °C, s.d. 2.06 °C, N 856) during the summer and between 12.0 and 27.0 °C (mean 22.7 °C, s.d. 2.19 °C, N 796) during the winter in the European climate. Differently, it varied between 12.4 and 26.8 °C (mean 20.1 °C, s.d. 3.12 °C, N 1354) during the summer and between 8.2 and 20.6 °C (mean 16.0 °C, s.d. 1.95 °C, N 684) during the winter in the Darjeeling climate (Figure 4). The differences in the mean Ta between the two locations were statistically significant, t (df 2203.803): 47.365, p < 0.001 and t (df 1476.449): 62.076, p < 0.001, highlighting the mean difference in Ta as 5.22 °C and 6.68 °C during summer and winter, respectively. Also, a slightly wider variation in Ta was noticed during the summer months (over winters) in the buildings of the Darjeeling region.
Also, the indoor environmental conditions in the Darjeeling buildings were much lower than those in the European climate. The higher variation in Ta in the Darjeeling region suggests that these buildings are loosely built having a poor insulation compared to their European counterparts, which results in the indoor environmental conditions to follow the outdoor conditions more strongly. This is further validated by the strong correlation of Ta with Tout in the Darjeeling buildings, (R: 0.785, N: 2038, p < 0.001) compared to that in the European buildings (R: 0.480, N 940, p < 0.001).
We analyzed the difference in the indoor environmental conditions in the different building types. The differences were found significant. A Kruskal-Wallis (KW) test χ2 (df 2): 268.207, p < 0.001 with a mean rank of 574.89, 396.97, and 292.37 for classrooms, offices, and residential buildings during the winters and KW χ2 (df 2): 54.478 with a mean rank of 550.38, 544.64, and 395.99 for classrooms, residential, and offices during the summers was seen in European buildings. Contrastingly, KW χ2 (df 2): 14.789 with a mean rank of 379.64, 349.37, and 300.60 for offices, residential buildings, and classrooms during the winters and KW χ2 (df 2): 47.732 with a mean rank of 790.56, 714.52, and 610.01 for offices, classrooms, and residential buildings during the summer in Darjeeling.
It was thus seen that the indoor environmental conditions in residential buildings are inferior in both the type of climates, particularly during the winters. Possible reason for this could be that, in majority of cases, the occupants of residential buildings pay the utility bill (like that for heating) more directly (themselves), differently from the other buildings (like institutional and office). This causes the occupants in a residential building to consciously reduce external heating. Overall, classrooms in Europe and offices in Darjeeling generally perform better than the others in terms of maintaining favorable indoor climatic conditions.
Figure 5 illustrates the variation in indoor RH (%) in the different buildings during the survey in the two databases. The indoor RH % varied between 49.1% and 94.0% (mean 72.2%, s.d. 8.36%, N 1354) during summer and 33.1% and 82.1% (mean 60.4%, s.d. 11.03%, N 684) during winter in the Darjeeling buildings, and between 23.8% and 72.2% (mean 47.4%, s.d. 9.22%, N 855) during summer and 16.1% and 76.1% (mean 41.4%, s.d. 11.44%, N 507) during winter in the European buildings, respectively. The indoor RH % in the European buildings was significantly lower than that in the Darjeeling buildings, as shown by the Kolmogorov–Smirnov test: Z (p < 0.001): −42.787 with a mean rank of 819.37 and 2289.36 for the former and the latter, respectively. This is an expected result due to the higher humidity in the Darjeeling regions [46].

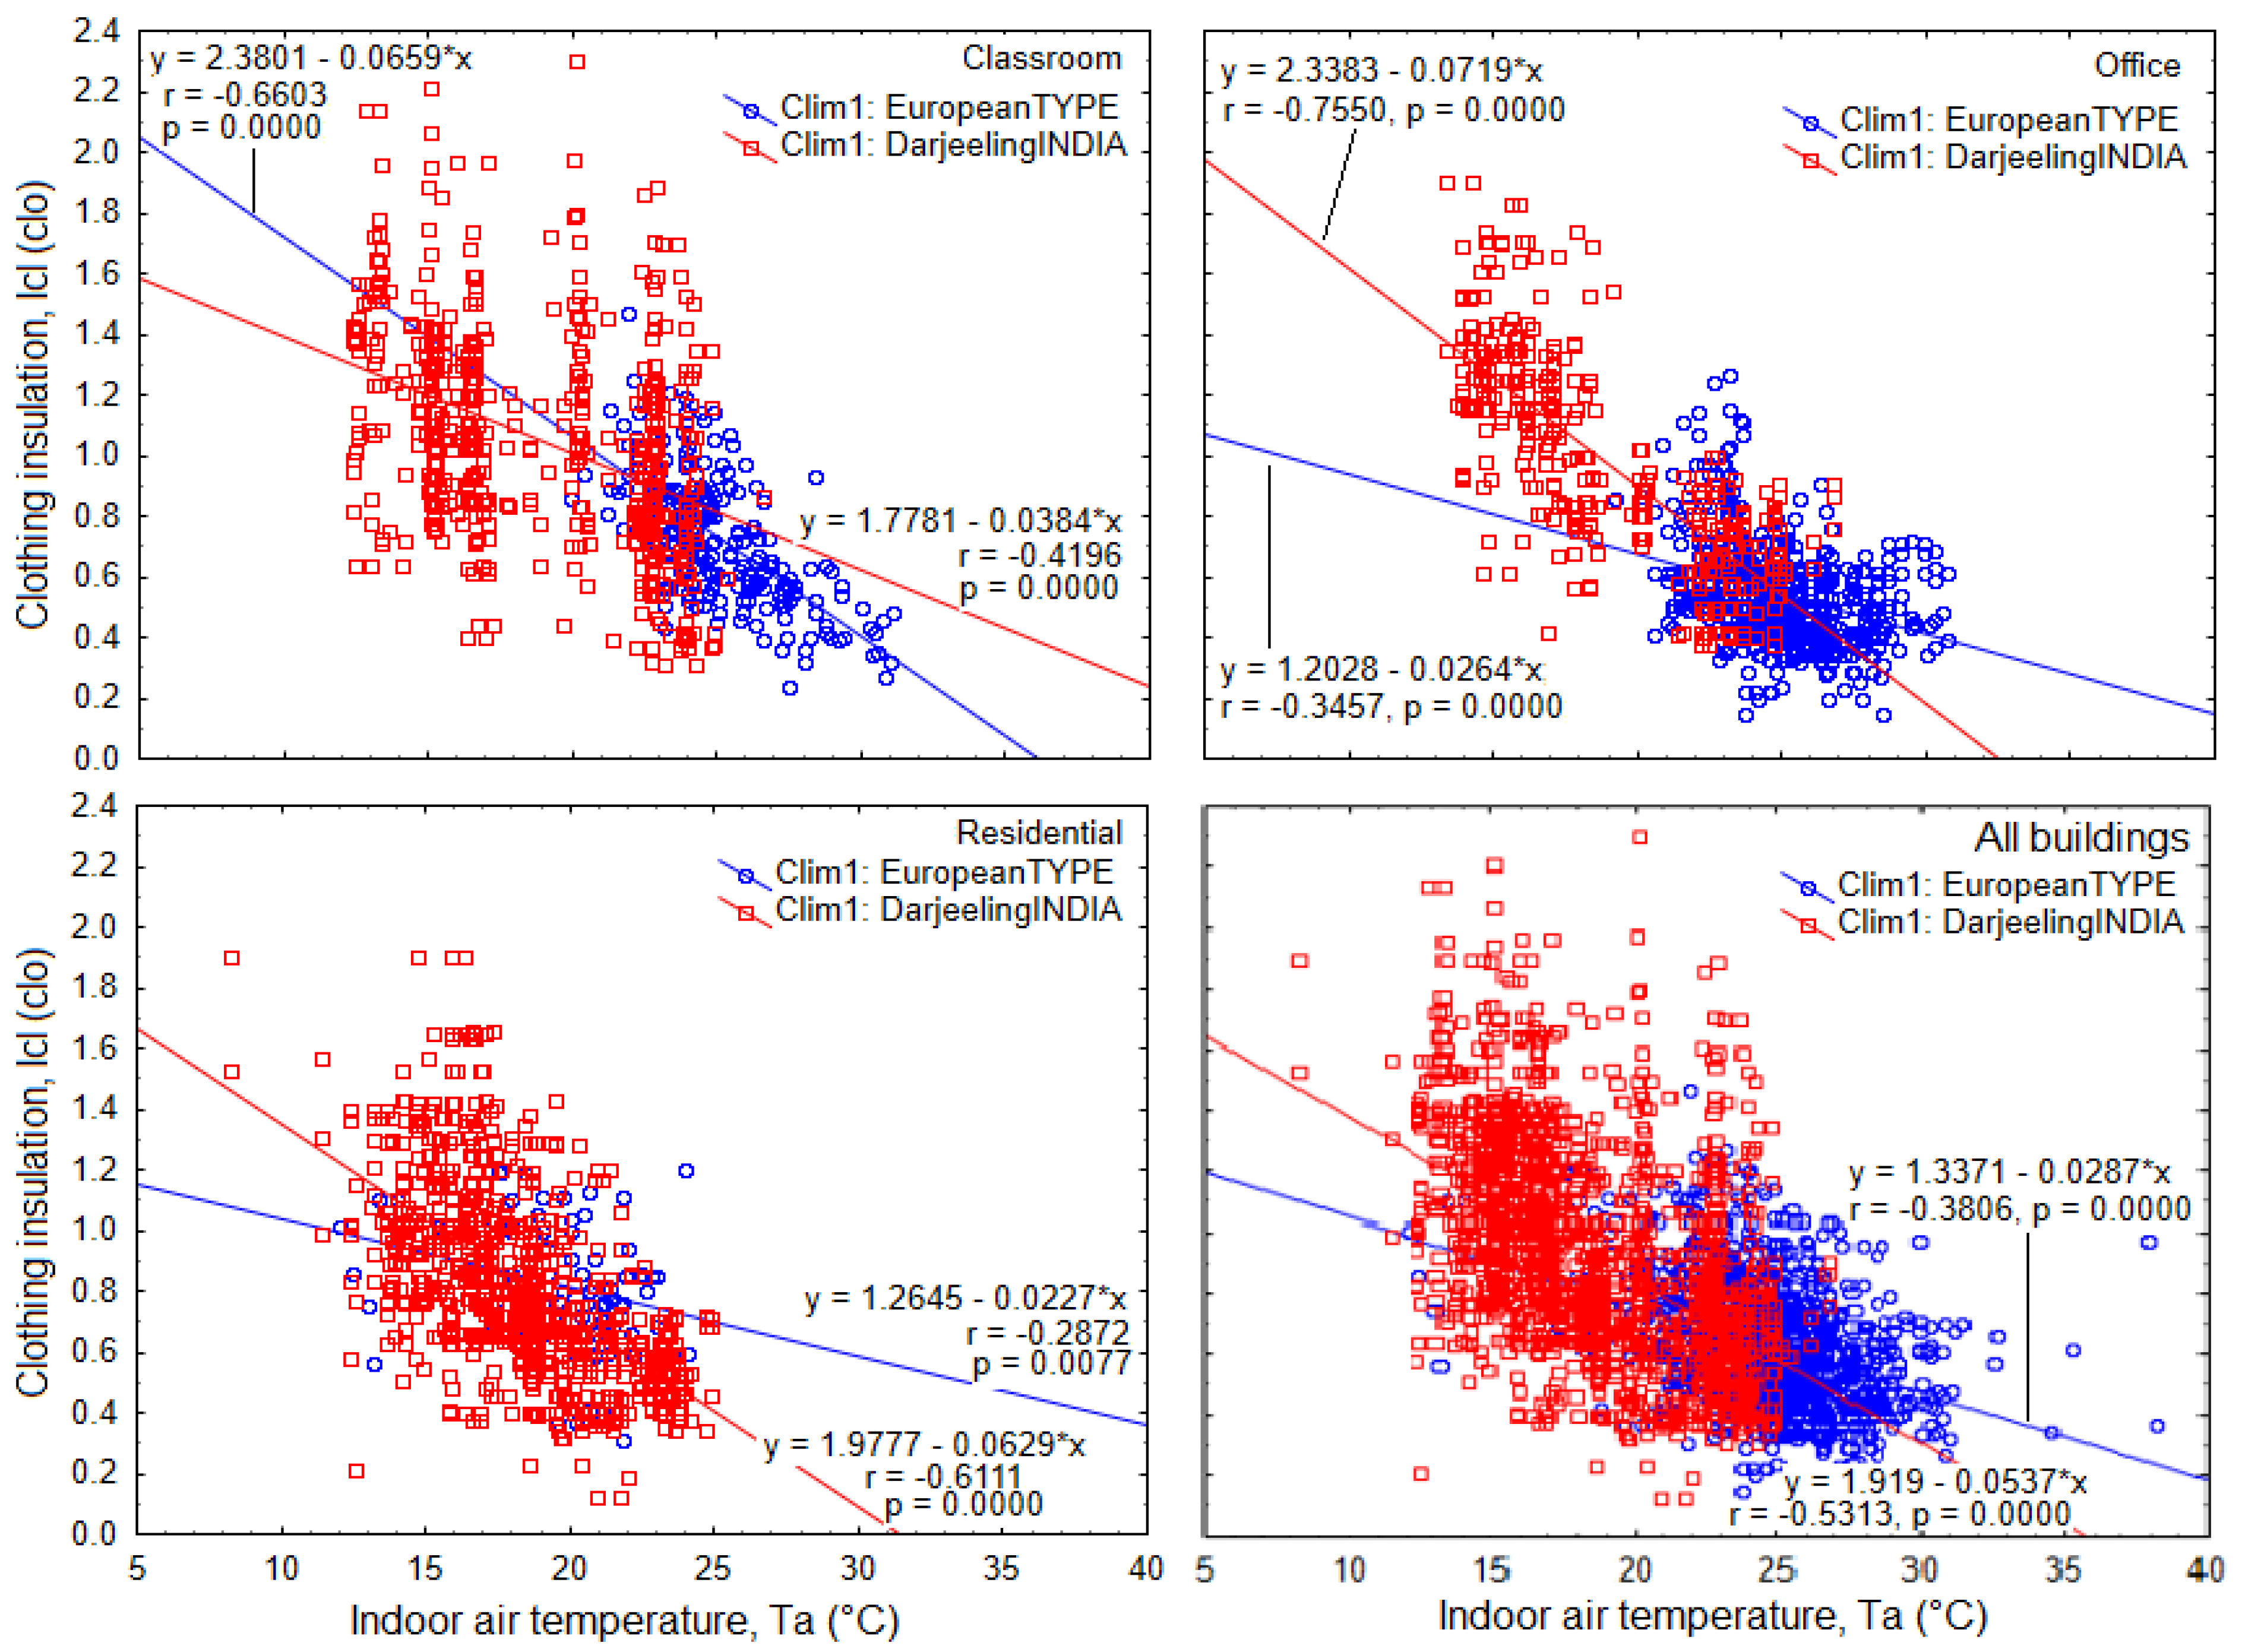
5.3. Clothing Insulation, Icl

Adjustment in clothing level is used as a first mechanism of adaptation by the occupants of a building in a changing thermal environment [6]. Clothing insulation (Icl) varied between 0.12 and 1.97 clo (mean 0.81 clo, s.d. 0.301 clo, N 1354) and between 0.21 and 2.30 clo (mean 1.13 clo, s.d. 0.320 clo, N 684) in Darjeeling buildings, while between 0.15 and 1.19 clo (mean 0.53 clo, s.d. 0.135 clo, N 765) and between 0.31 and 1.47 clo (mean 0.84 clo, s.d. 0.188 clo, N 243) in European buildings during the summer and winter, respectively (Table 2). The lower Icl in the European buildings than in the Darjeeling buildings was statistically significant, t-test: −25.945 (p < 0.001) with a mean rank of 1207.30 and 2103.31 for the former and the latter, respectively.
Further, among the different types of buildings, the non-parametric KW, χ2 (df 2) gave the following results: 207.318 with a mean rank of 788.56, 664.49 and 419.74 in residential, classrooms, and offices for the European buildings, and 184.713 with a mean rank of 1265.37, 1077.27, and 854.78 in the classrooms, offices, and residential buildings in the Darjeeling region. This reveals that in the European climate, the Icl were the highest in the residential buildings while lowest in the offices, in contrast to the Darjeeling climate, where the Icl was highest in the classrooms and lowest in the residential buildings, respectively. This lower Icl in the residential buildings in Darjeeling region corresponds to the higher activity level in residential settings compared to the other building types.
It was observed that the subjects effectively increased clothing level with plummeting temperature as seen from the following regression having negative correlation coefficient with the air temperature (Figure 6) in both the locations.
D a r j e e l i n g   B u i l d i n g s :   I c l = 0.05 T a + 1.92 ,   R 2 = 0.282 ,   p < 0.001
E u r o p e a n   B u i l d i n g s :   I c l = 0.03 T a + 1.34 ,   R 2 = 0.145 ,   p < 0.001
A previous study in north-east India by Singh et al. [47] gave similar results, although with a determination index of 0.63 but starting from a smaller sample size. The lower R2 in the present case could also be due to the use of air temperature (Ta) instead of globe temperature (Tg).
N o r t h   E a s t   I n d i a :   I c l = 0.05 T g + 2.22 ,   N   460 ,   R 2 = 0.63 ,   p < 0.001
Comparatively, the stronger coefficient of correlation of Icl with Ta as seen in Darjeeling buildings than that in its European counterparts suggests that the subjects in these buildings used clothing as a stronger measure of adaptation to the changing temperature. It is further noticed from Figure 6 that, except classrooms, both in office and residential buildings, Icl showed a higher regression coefficient with Ta in the Darjeeling buildings, implying that the subjects strongly used clothing as a measure to adapt with the changing temperature. In case of classrooms, this trend was opposite, which could be due to a stricter dress code maintained in the Indian educational institutions as against their European counterparts, which limits the ability of the students to change their level of clothing. Thus, several factors potentially contribute to the relatively low R-value in Figure 6. This includes:
(i).
Complex Adaptive Behavior: Adaptive thermal comfort involves multiple factors, including physiological, behavioral and psychological adaptation. Clothing adjustment is just one of these mechanisms, and its influence may vary depending on cultural norms, building design or on occupants’ preference.
(ii).
Uniform clothing norms: Dress code in specific environments, like classrooms or offices, limit the variability of clothing insulation, thereby reducing the correlation with temperature.
(iii).
Insulation and Energy Efficiency: Compared to the buildings in India, those in Europe could have better insulation and heating systems, which minimize the temperature fluctuation of the indoor environment. This reduces the necessity for frequent clothing adjustments, and thereby weakening the correlation.

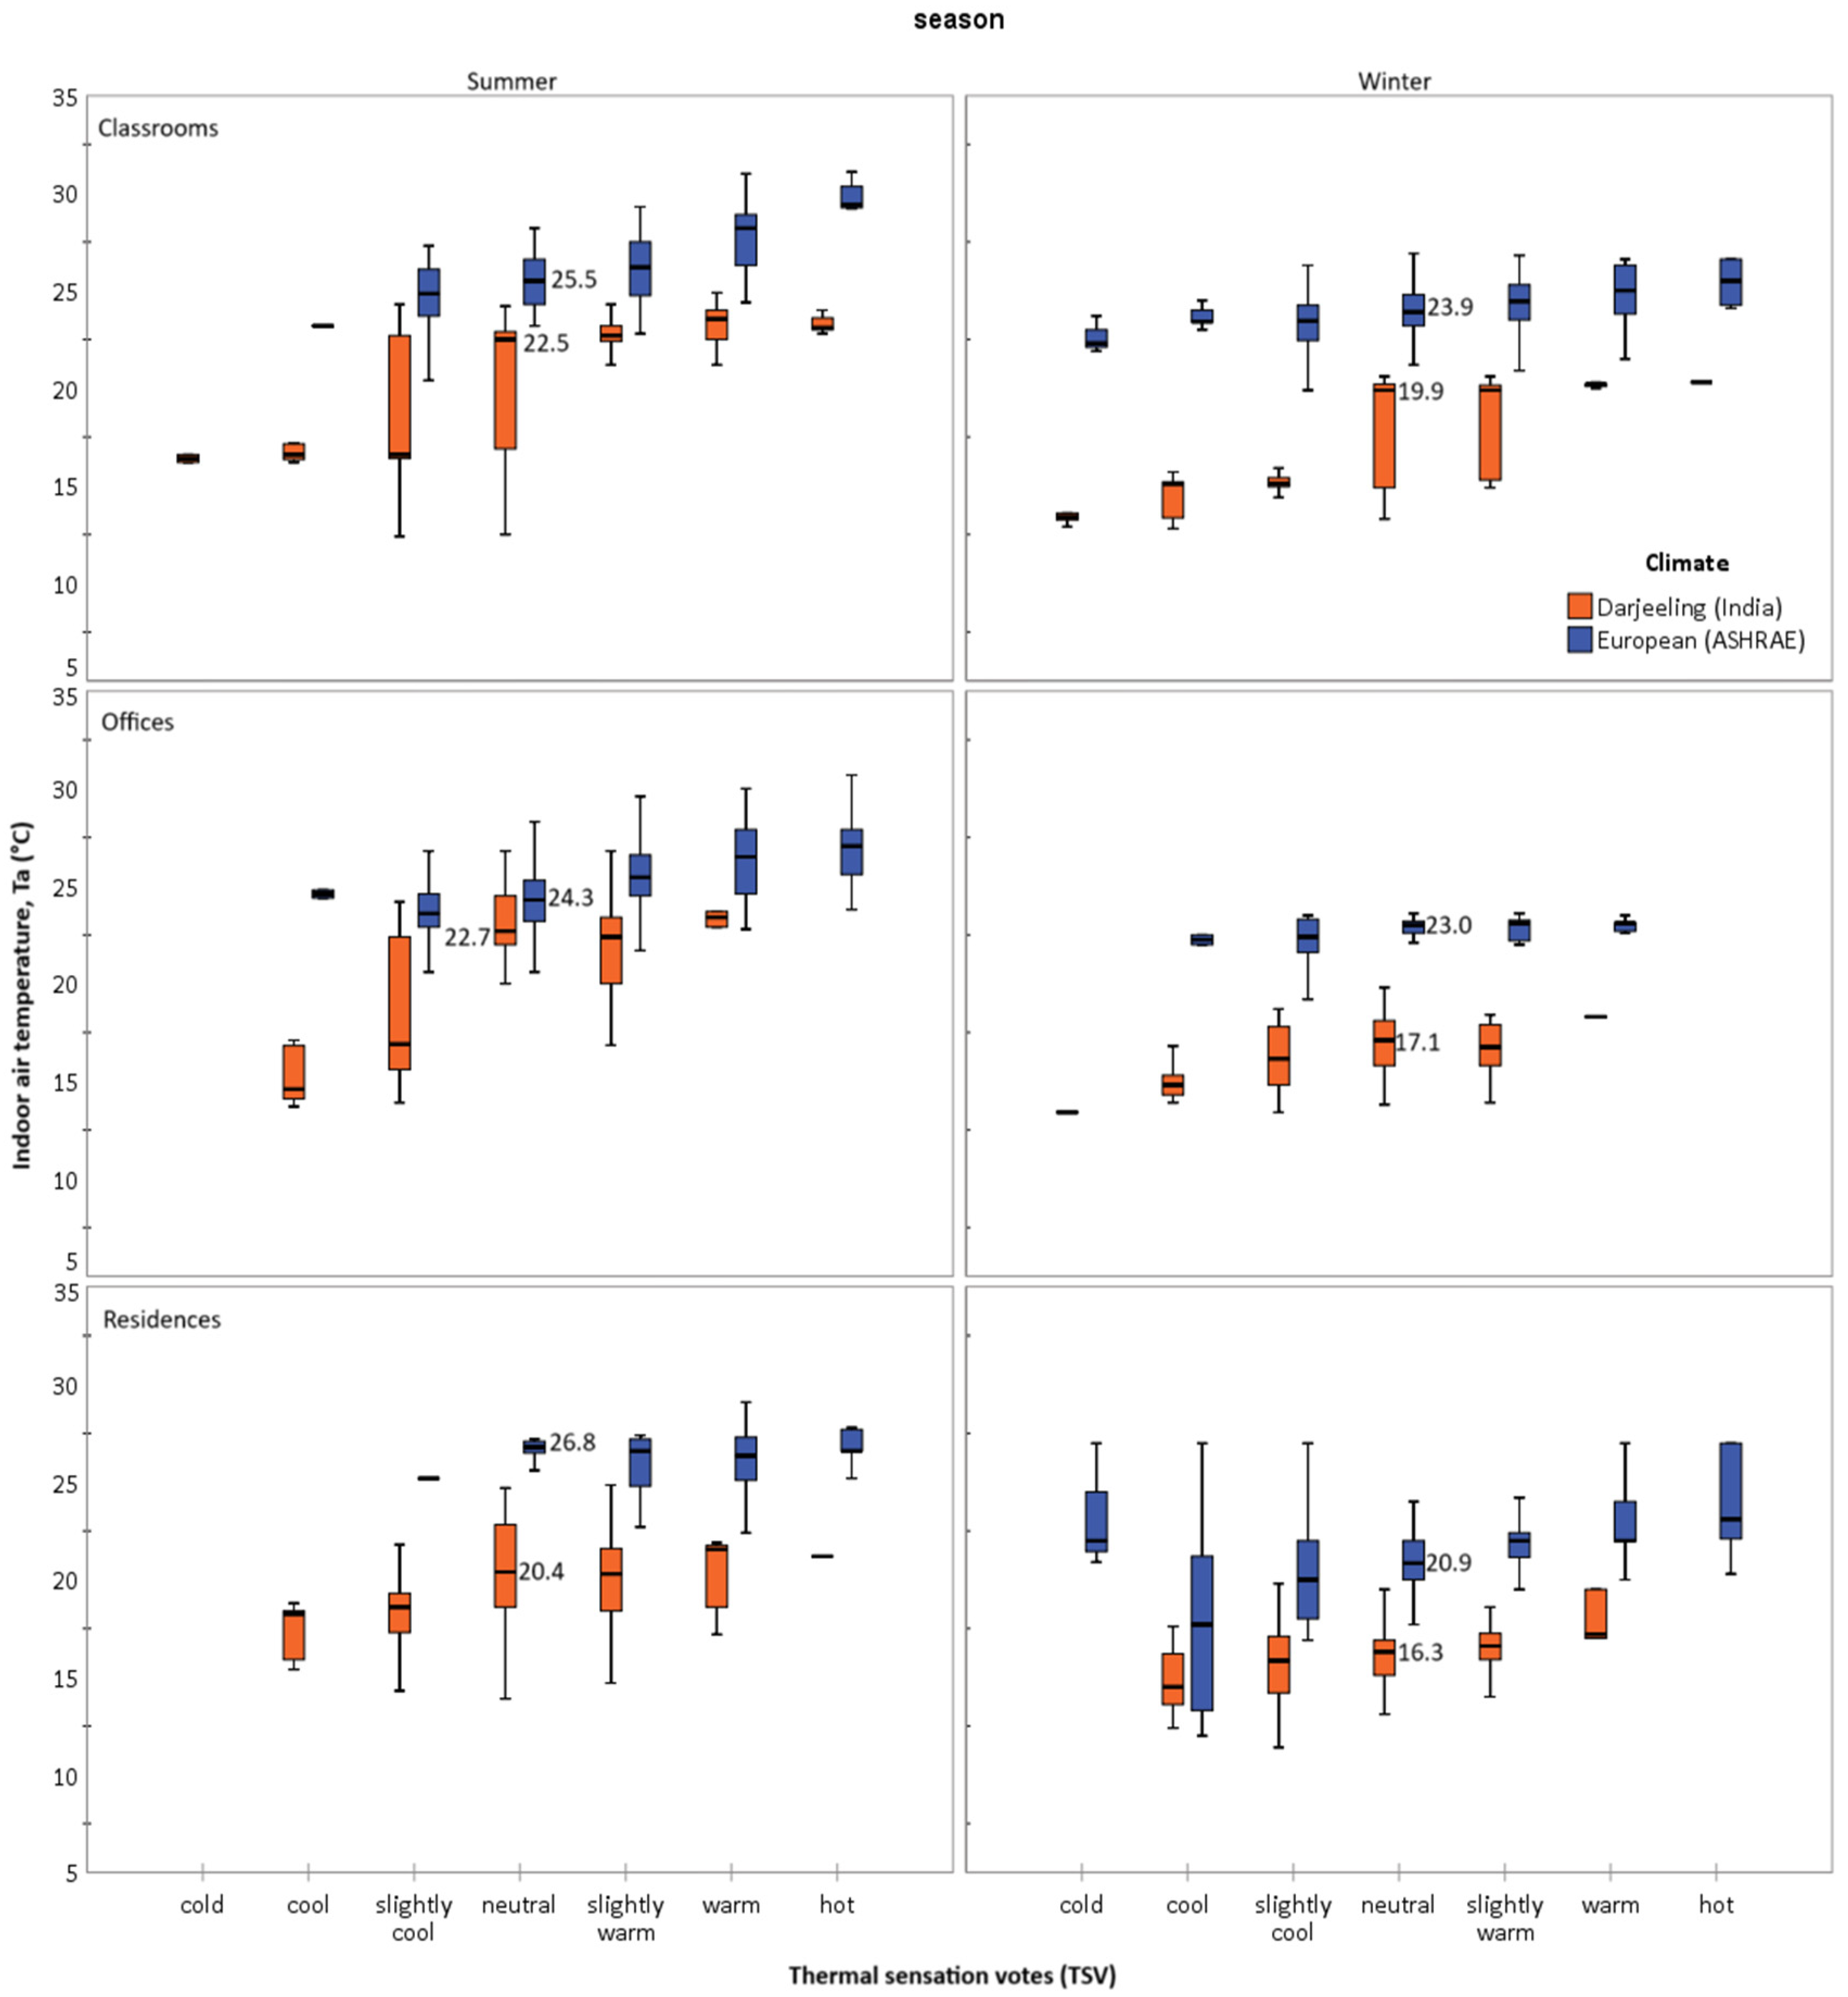
5.4. Thermal Sensation Votes (TSVs)

Figure 7 illustrates the season-wise distribution of TSV in different building types in the two locations. Table 3 shows the statistics of TSV in the two climates for different seasons. A 3-way ANOVA was performed in SPSS to understand the effect of difference in climate (i.e., European and Indian), type of buildings (i.e., offices, classrooms, and residences) and seasons (winter and summer) and their interaction on the thermal sensation votes of the respondents. The results reveal significant variations in TSV across different climates, building types and seasons, underscoring the interplay of these factors in these NV buildings. A significant main effect due to the difference in climate (F(1, 3673): 563.300, p < 0.001) highlights the stark contrast between European and Indian (Darjeeling) climates. European buildings, probably characterized by better insulation, exhibit higher TSV, while Darjeeling’s cooler high-altitude climate resulted in comparatively lower TSV.
The type of buildings also significantly influenced TSV (F(2, 3673): 62.866, p < 0.001), with offices showing the highest TSV due to perhaps better thermal regulation, followed by residence, while classrooms had the lowest TSV, likely due to intermittent use and limited thermal control of the environment. As expected, seasonal effects (1, 3673): 149.486, p < 0.001) demonstrated lower TSV in winter, indicating thermal challenges in colder months, while summer showed elevated TSV.
Notable interaction effects, such as climate × building type (F(2, 3673): 23.884, p < 0.001) and climate × building type × season (F(2, 3673): 8.977, p < 0.001), suggest complex dynamics. For example, classrooms in Darjeeling during winter experienced the lowest TSV due to colder indoor environments (or due to limited opportunity to control the adaptive mechanism), while the residences in European summer exhibited more stable TSV. Further, the model accounts for 22.1% (R2 0.221) of the overall variation in TSV.
Next, we conducted the probit regression of the ordinal TSV for the two climatic regions using SPSS as discussed in above sections, Equations (7)–(9). Figure 8 illustrates the estimated proportion of TSV with the change in temperature as obtained from conducting the probit regression. The estimates and other details of the probit regression of the ordinal TSV are shown in Table 4.

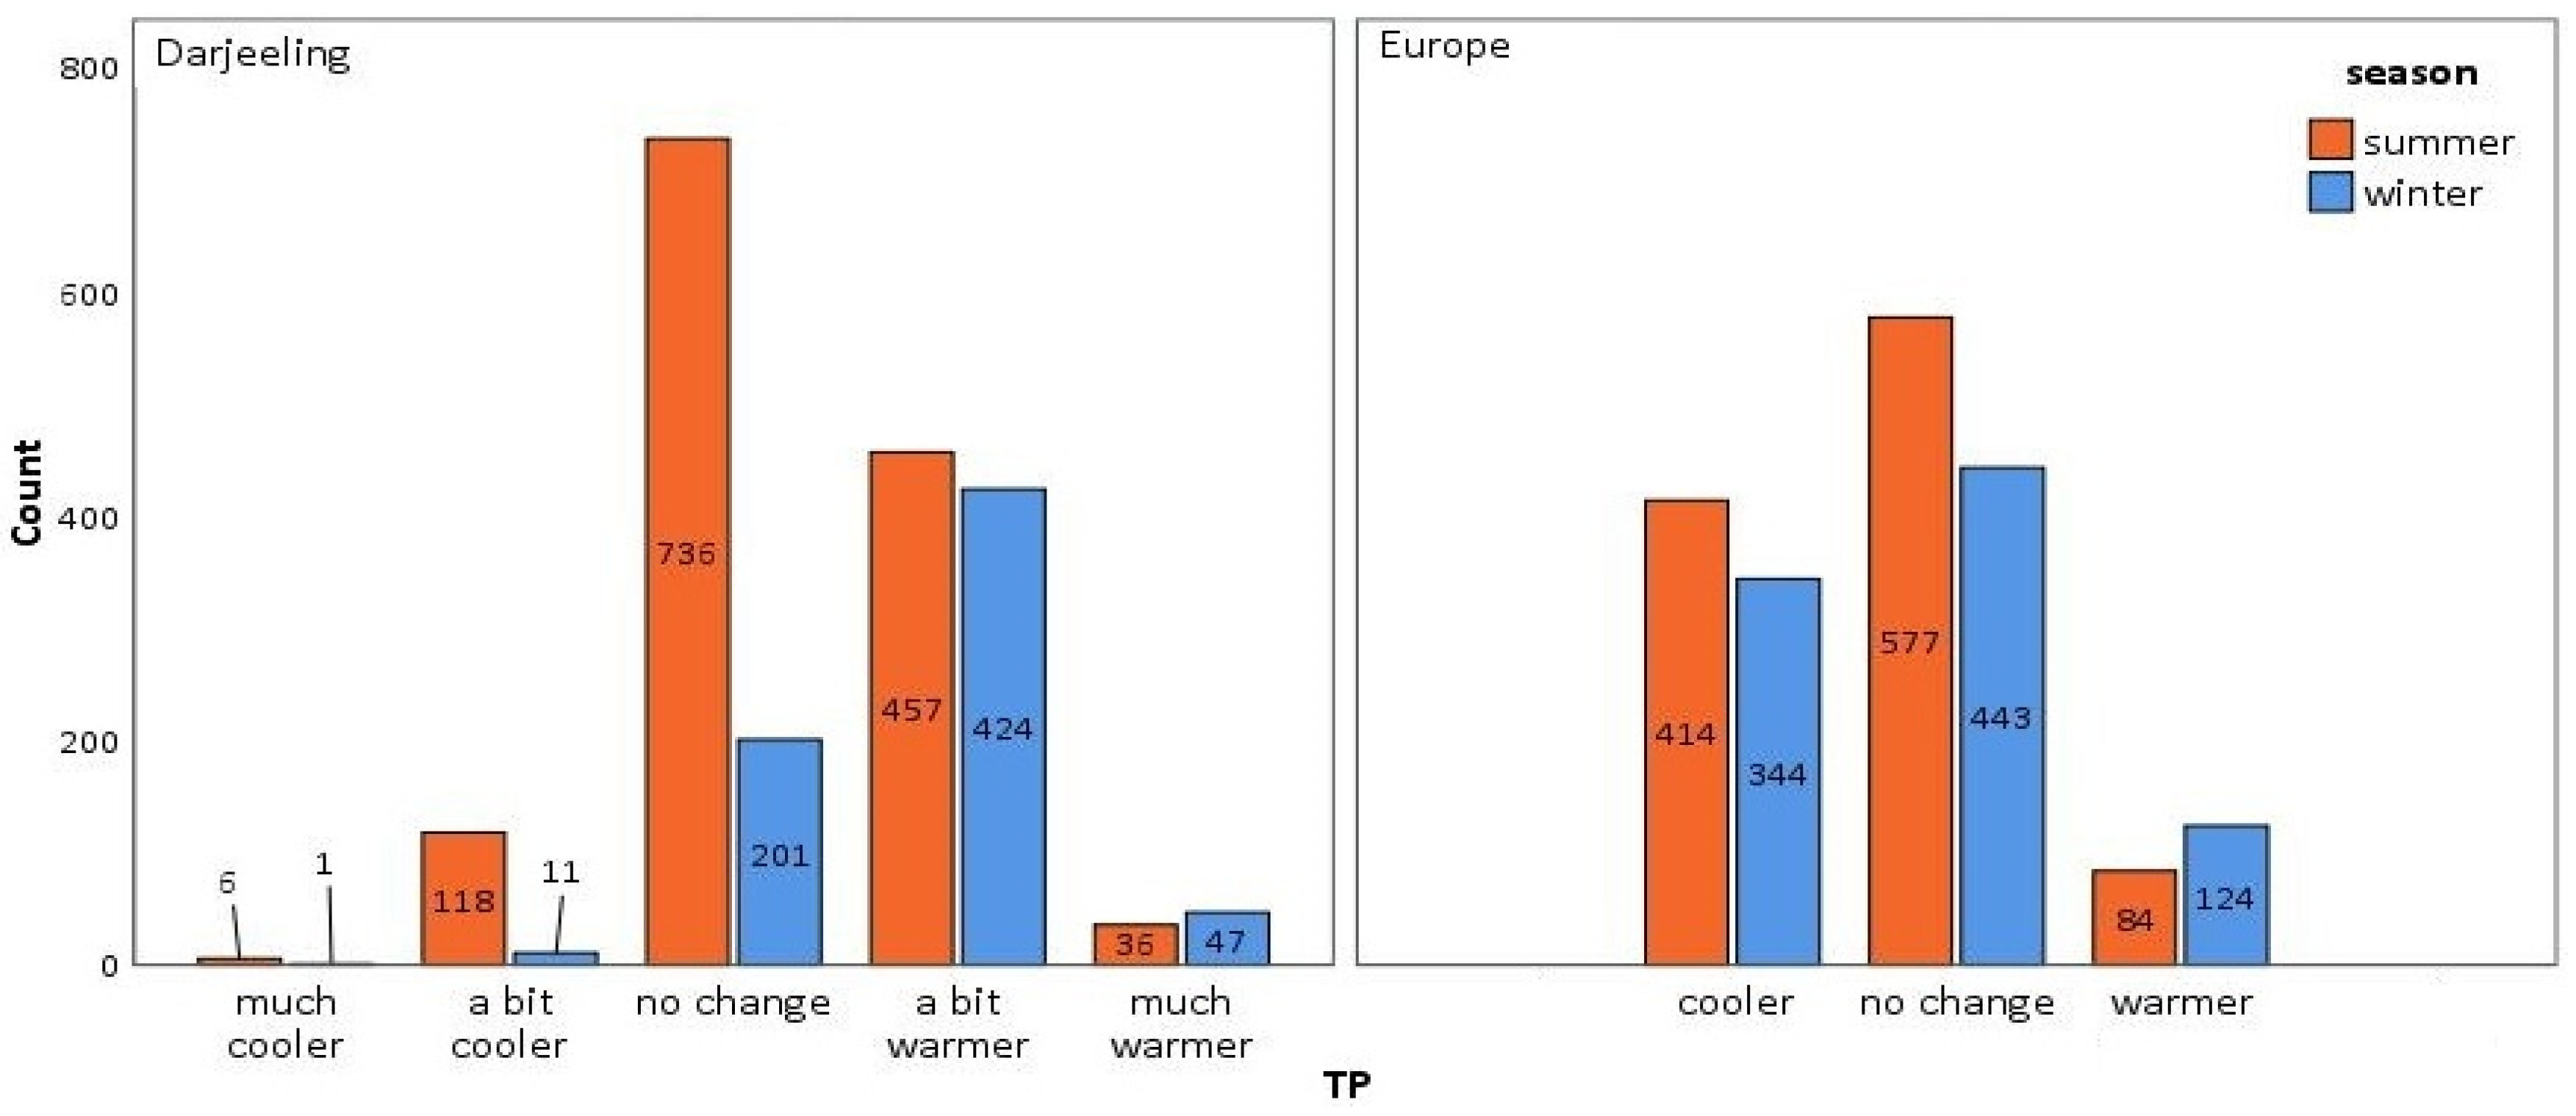
5.5. Thermal Preference (TPV)

TPV was assessed in different scales in the two studies. For the European data in the ASHRAE database, it is available on a three-point scale, i.e., cooler, no change, and warmer, whereas in the Darjeeling dataset it was assessed on a five-point Nicol scale, i.e., much cooler, a bit cooler, no change, a bit warmer, and much warmer, respectively. The distribution of thermal preference (TP) votes in the two climates is illustrated in Figure 9. We combined the responses below no change and above no change in the Darjeeling dataset to get “prefer warmer”, “no change” and “prefer cooler” in both datasets. Then, binarization was done with “no change” represented by “0”, while preference for change (warmer or cooler) represented by “1”, respectively. Logistic regression was performed as per eq. (10)–(11) which are shown in Figure 10 below. The preferred temperature with the intersection of “preference for warmer” and “preference for cooler” [45] was seen as 21.2 °C, 21.7 °C, and 22.8 °C in European climate, while 23.3 °C, 24.6 °C, and 23.2 °C in Darjeeling climate for offices, classrooms and residences, respectively.

5.6. Standard Effective Temperature (SET)

In this section, SET values for both the ASHRAE dataset for the European temperate climates and Darjeeling dataset for temperate oceanic involving NV buildings are evaluated. In case of the ASHRAE dataset, the globe (or mean radiant) temperature was not available for the summer season in Residential buildings. For the Darjeeling data, we used the Thermal comfort tool provided by the Center for Built Environment, University of California, Berkeley [URL: https://comfort.cbe.berkeley.edu/ (accessed on 28 October 2024)] to calculate the SET values. Figure 11 shows the box plot of SET values for the different buildings in the two climatic regions and reveals lower values in Darjeeling buildings especially for residences. A two-way ANOVA revealed, that the variation due to difference in climate (European versus Indian temperate), seasons (summer versus winter) and their interaction was statistically significant, F (d.f. 1): 1512.812 (p < 0.001), F (d.f. 1): 21.367 (p < 0.001) and F (d.f. 1): 215.040 (p < 0.001) and the model accounting for 30.6% (R2 0.306) of the overall variation in SET.

5.7. Predicted Mean Vote–Predicted Percentage of Dissatisfaction (PMV–PPD)

Though we used the air temperature (Ta) as an indicator of indoor environment, since it was present in all the rows of ASHRAE dataset, the calculation of PMV (and SET above) require the radiant temperature (or the globe temperature), which was however absent for residential buildings as reported in the above paragraph. Thus, PMV values for the European Type climate were assessed for office and classrooms only. A total of 1100 and 2038 PMV values (equal number of SET values above) were thus calculated for the European and Darjeeling data using the online tool of Center for Built Environment (CBE) [42]. Table 3 also illustrates the statistics of PMV values for the different buildings in the two climatic regions. The variation in PMV due to difference in climate (European versus Indian temperate) and its interaction with season (climate × seasons) were statistically significant, F (d.f. 1): 1365.231 (p < 0.001) and F (d.f. 1): 206.640 (p < 0.001) and the model accounting for 31.5% (R2 0.314) of the overall variation in PMV.
The mean PPD (%) were 8.53% (s.d. 5.26%, summer) and 11.43% (s.d. 9.29%, winter) in classroom and 16.20% (s.d. 16.76 %, summer) and 10.89% (s.d. 6.96%, winter) in office buildings of the European temperate climate. Contrastingly, they were 23.78% (s.d. 24.94 %, summer) and 41.09% (s.d. 27.33%, winter) in classrooms, 17.46% (s.d. 17.96%, summer) and 34.39% (s.d. 20.47%, winter) in office and 33.14% (s.d. 24.72%, summer) and 46.11% (s.d. 27.08%, winter) in residential buildings, respectively, in the Darjeeling temperate region. Interestingly, the lower PPD (%) during winter in the office buildings of European climate and higher during the same period in Darjeeling climate was statistically significant. To test the impact of (i) climatic regions (i.e., European and Darjeeling) and (ii) seasonal (i.e., winter and summer) differences on the variation in PPD %, a two-way ANOVA was performed, which revealed a highly significant overall model, with F (df 3): 307.671, p < 0.001, indicating a substantial combined impact of both on the PPD %. Individually, both climatic differences with F (df 1): 826.969, p < 0.001 and seasonal difference with F (df 1): 64.309, p < 0.001 also had significant influence on the variation in PPD %. The model explained for 20.6% of the variance in PPD % (R2 = 0.207).

5.8. Thermal Sensation Votes (TSVs) Versus Predicted Mean Vote (PMV)

Previous studies have repeatedly reported that the PMV under-estimates the thermal sensation at cold condition while it over-estimates during warm condition, resulting into what is called “scissor difference” between the two ([8,26]). However, contrasting to this, we saw the TSV to be more sensitive than PMV in the European climate. This is illustrated in Figure 12, which shows the variation in TSV and PMV with indoor air temperature (Ta). In the European type of climate, we notice a higher regression coefficient of Ta for TSV compared to that for PMV, where the indoor temperature was higher, while vice-versa for Darjeeling climate, where the indoor temperatures were lower. Thus, results reflect that the occupants of these NV buildings in the Darjeeling region are better adapted to the plummeting indoor temperature.

5.9. Indoor Comfort Assessment

The ASHRAE Standard 55 [2] recommends the Graphic Comfort Zone illustrating the permissible combination of temperature and humidity in the psychometric chart for activity level 1.0~1.3 met for 0.5 clo and 1.0 clo of clothing insulation. The standard further allows the other clothing insulation values with following interpolation.
T m i n , I c l = [ I c l 0.5   c l o T m i n , 1.0   c l o + 1.0   c l o I c l T m i n , 0.5   c l o ] / 0.5   c l o
T m a x , I c l = [ I c l 0.5   c l o T m a x , 1.0   c l o + 1.0   c l o I c l T m a x , 0.5   c l o ] / 0.5   c l o
where T m a x , I c l and T m i n , I c l are the upper and lower limit for the clothing insulation, Icl, respectively. The clothing insulation was found to vary between 0.24 and 1.97 clo, 0.15 and 1.27 clo, and 0.31 and 1.20 clo in the European temperate climate, and 0.31 and 2.30 clo, 0.38 and 1.90 clo, and 0.12 and 1.90 clo in the Darjeeling temperate climate for classrooms, offices, and residences, respectively. We grouped the data of indoor air temperature and RH (%) into bins with range, 0~0.50 clo, 0.50~1.0 clo, 1.0~1.5 clo, 1.5~2.0 clo and 2.0~2.5 clo, respectively. Figure 13 illustrates the distribution of these points in the ASHRAE recommended comfort band. For European climates: in classrooms, 4.87% of the data exceeded and the remaining were within the ASHRAE specified limit; in offices, 6.40% of the condition exceeded the allowed humidity ratio of 0.012 kg per kg of dry air and from the remaining 4.70% was over while the rest were within the ASHRAE specified limit; and in residences, 7.38% of the overall data exceeded the allowed humidity ratio of 0.012 kg per kg of dry air and from the remaining 5.26% and 2.34% were below and over the ASHRAE specified limit for the given clothing insulation. For Darjeeling climate: in classrooms, 29.64% of the all data exceeded the allowed humidity ratio of 0.012 kg per kg of dry air and the remaining were within the ASHRAE specified limit; 29.73% of the all data exceeded the allowed humidity ratio of 0.012 kg per kg of dry air and from the remaining 3.53% were below while the rest within the ASHRAE specified limit; and in residences 17.31% of the all data exceeded the allowed humidity ratio of 0.012 kg per kg of dry air and from the remaining 4.40% were below while the rest within the ASHRAE specified limit for the given clothing insulation, respectively.

5.10. The Thermal Neutrality (Comfort)

The comfort temperature is seen as that indoor temperature at which an average respondent will return neutral vote on the thermal sensation scale. Two methods are commonly used to calculate the comfort temperature. First, the regression neutral temperature (Tn) is the temperature for a neutral value of TSV in the linear regression between the thermal sensation votes (TSVs) and the air temperature (Ta). Table 5 illustrates the regression equation along with its R-value, level of significance (p-value) along with the neutral temperature (Tn) for the different buildings in the two climatic regions for summer and winter. It is, however, noticed that the regression method sometimes returns an “extraneous” value, when the p-value is high or the R-value is low. Further, in Table 5, it is also noted that the winter neutral temperature in the office buildings is higher than that in the summer. For these discrepancies, researchers in the field of thermal comfort use Griffiths’ method to calculate Griffiths’ neutral temperature as under [15].
T n G = T a + ( P o s i t i o n   o f   N e u t r a l   v a l u e   o n   t h e   s c a l e   u s e d T S V ) R
where the position of the neutral value on the scale is “0” and “4” for a scale with a range −3~+3 and 1~7, respectively, while R is called Griffiths’ constant. Table 5 also illustrates the mean Griffiths’ neutral temperature (TnG), the number of sample size and the range for the different buildings in the two climatic regions for summer and winter. The mean TnG was 24.0 °C (s.d. 2.12 °C) and 21.3 °C (s.d. 2.75 °C) in European climates and 20.3 °C (s.d. 2.95 °C) and 17.1 °C (s.d. 2.22 °C) in Darjeeling climate during summer and winter, respectively. A two-way ANOVA revealed climatic difference (European and Darjeeling), seasonal difference (summer and winter), and their interaction had a significant influence on the variation in TnG, with F (d.f. 1): 2332.916 (p < 0.001), F (d.f. 1): 943.461 (p < 0.001), F (d.f. 1): 43.086 (p < 0.001) and the model accounting for 41.4% (R2: 0.414) of the variance in TnG, respectively.

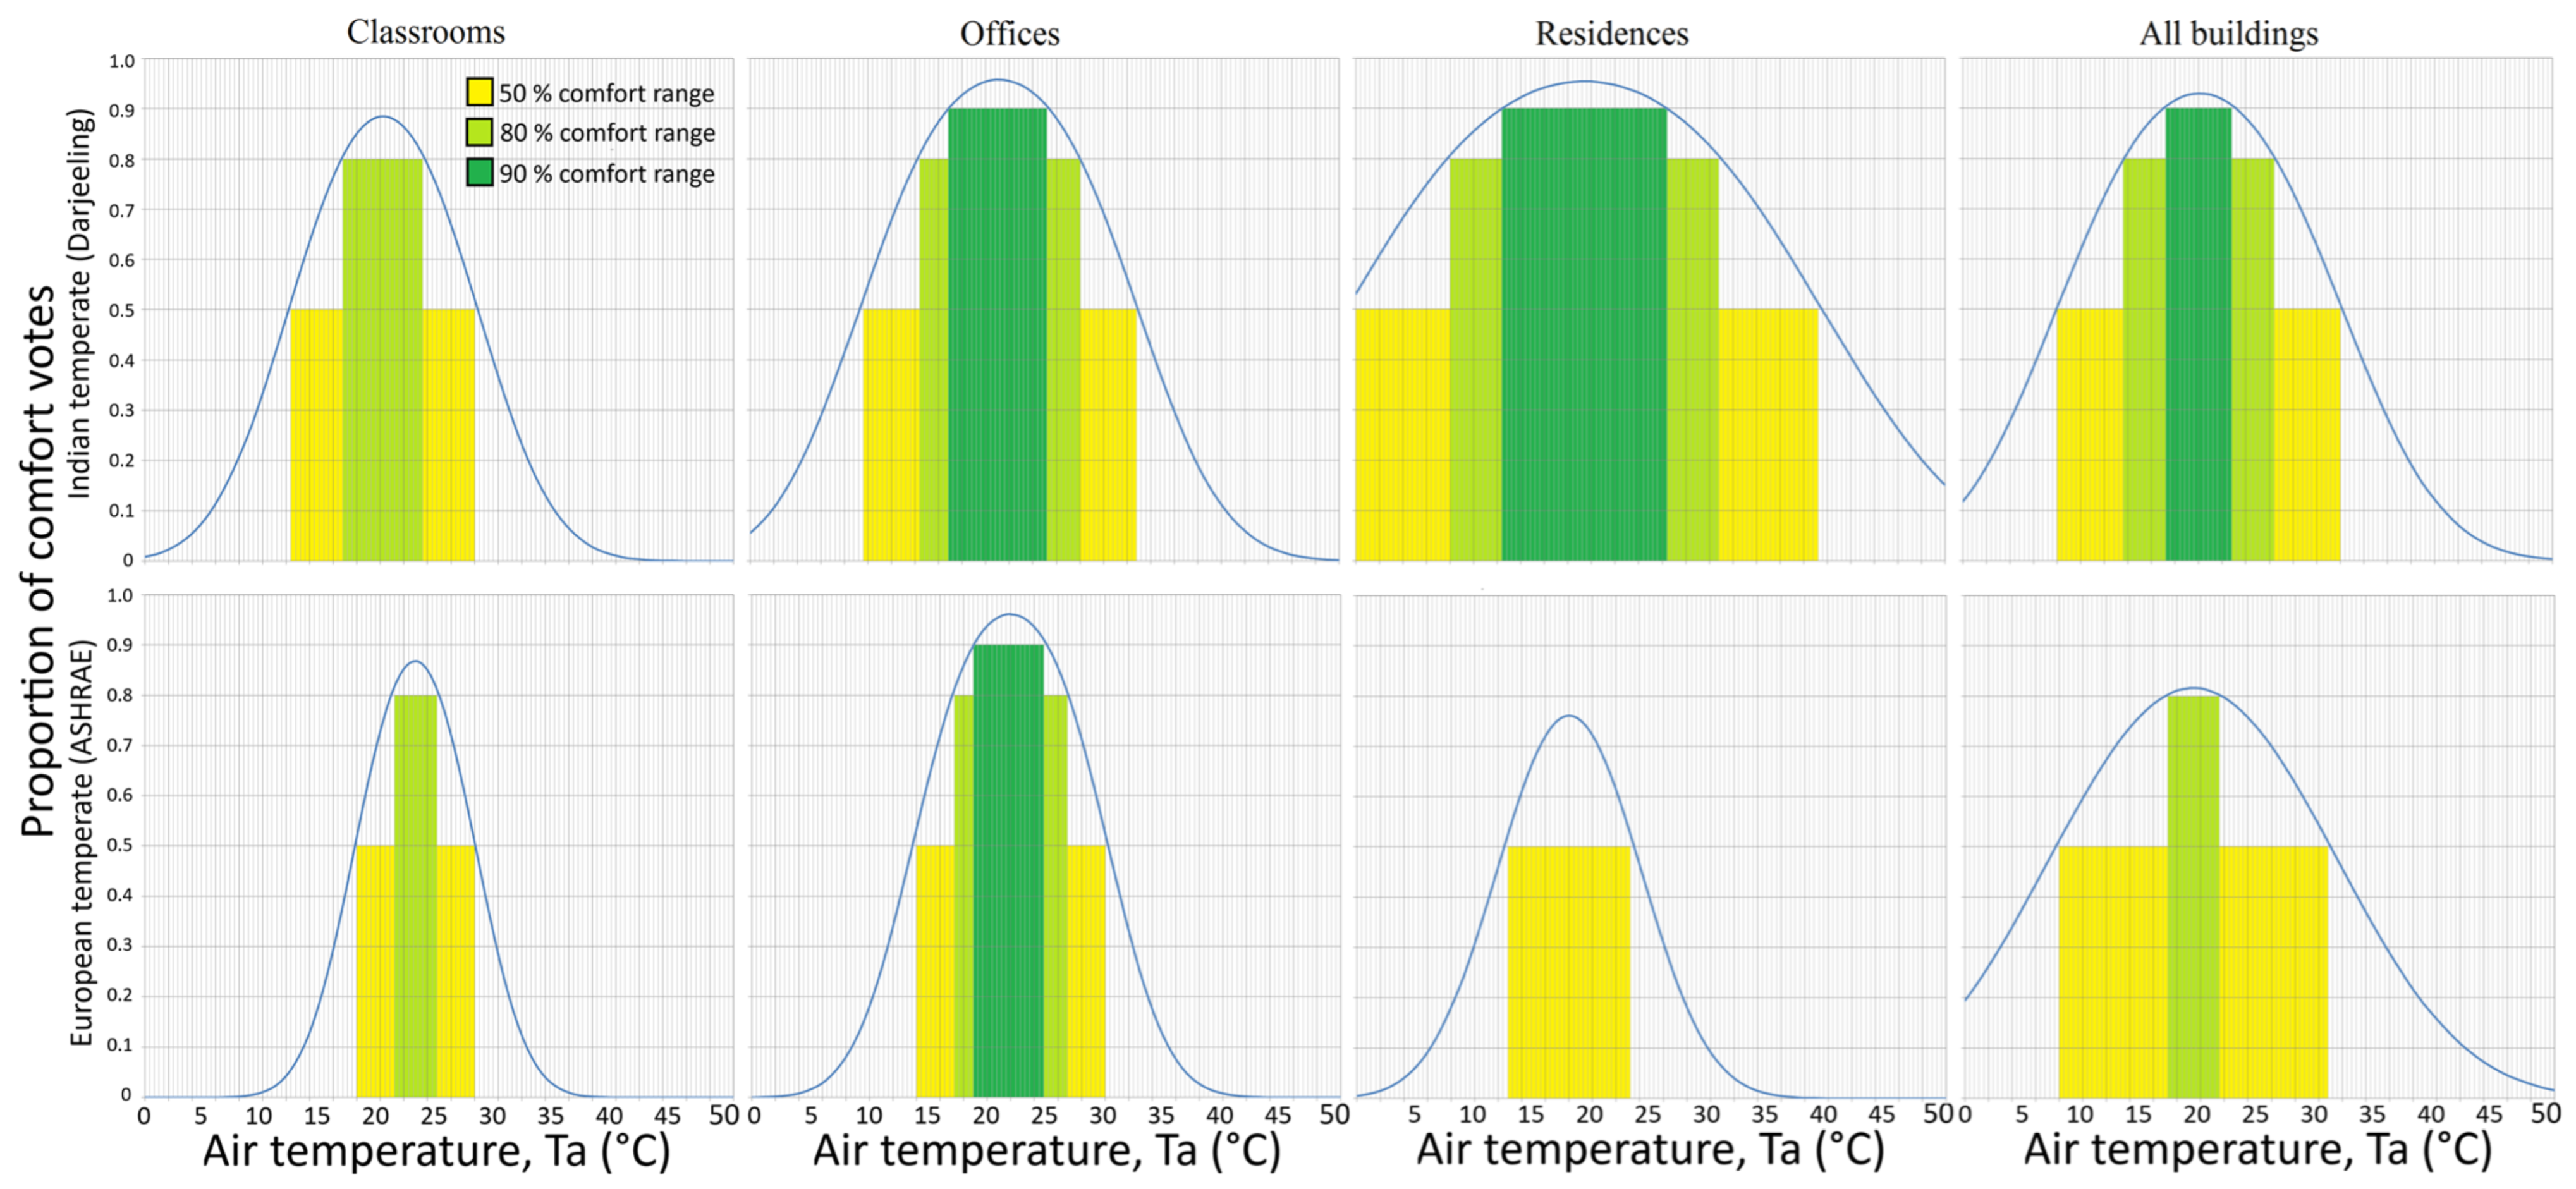
5.11. The Comfort Range

While the Table 5 illustrates the regression method of calculating the comfort (neutral) temperature, which is prone to extraneous treatment, the Griffiths’ neutral temperature (TnG) discussed above is sensitive to the value of Griffiths’ constant (R). In this section, we present the comfort range derived from the probit lines obtained from the TSV discussed in the above sections. The ASHRAE Standard 55 [2] states the central three categories of TSV, i.e., slightly cool, neutral, and slightly warm as comfortable. Transformation of the probits calculated for each category of TSV into proportions were done using Equation (9), whose mean and standard deviation values are provided in Table 4. The proportion(s) for the bell curve for each temperature is obtained by subtracting the probit derived proportion of the curve separating slightly warm and warm from the curve separating cool and slightly cool [48] in Figure 8. Figure 14 shows the comfortable range of indoor air temperature for the different buildings in the two climatic regions. The indoor air temperature (Ta) of 21.2 °C~24.8 °C and 17.2 °C~26.8 °C was comfortable to 80% of the occupants in classrooms and offices of the European climate compared to that of 16.0 °C~21.6 °C, 14.4 °C~28.0 °C, and 8.0 °C~30.8 °C in the classrooms, offices, and residential buildings of the Darjeeling climate. The Ta in the range of 18.8 °C~24.8 °C in the offices of the European climate compared to 16.8 °C~25.2 °C and 12.4 °C~26.4 °C in the offices and residences of the Darjeeling climate were comfortable to 90% of the occupants. Thus, a wider comfort range and lower comfort temperatures were noticed for the buildings in the Darjeeling than those in the European climate, respectively.

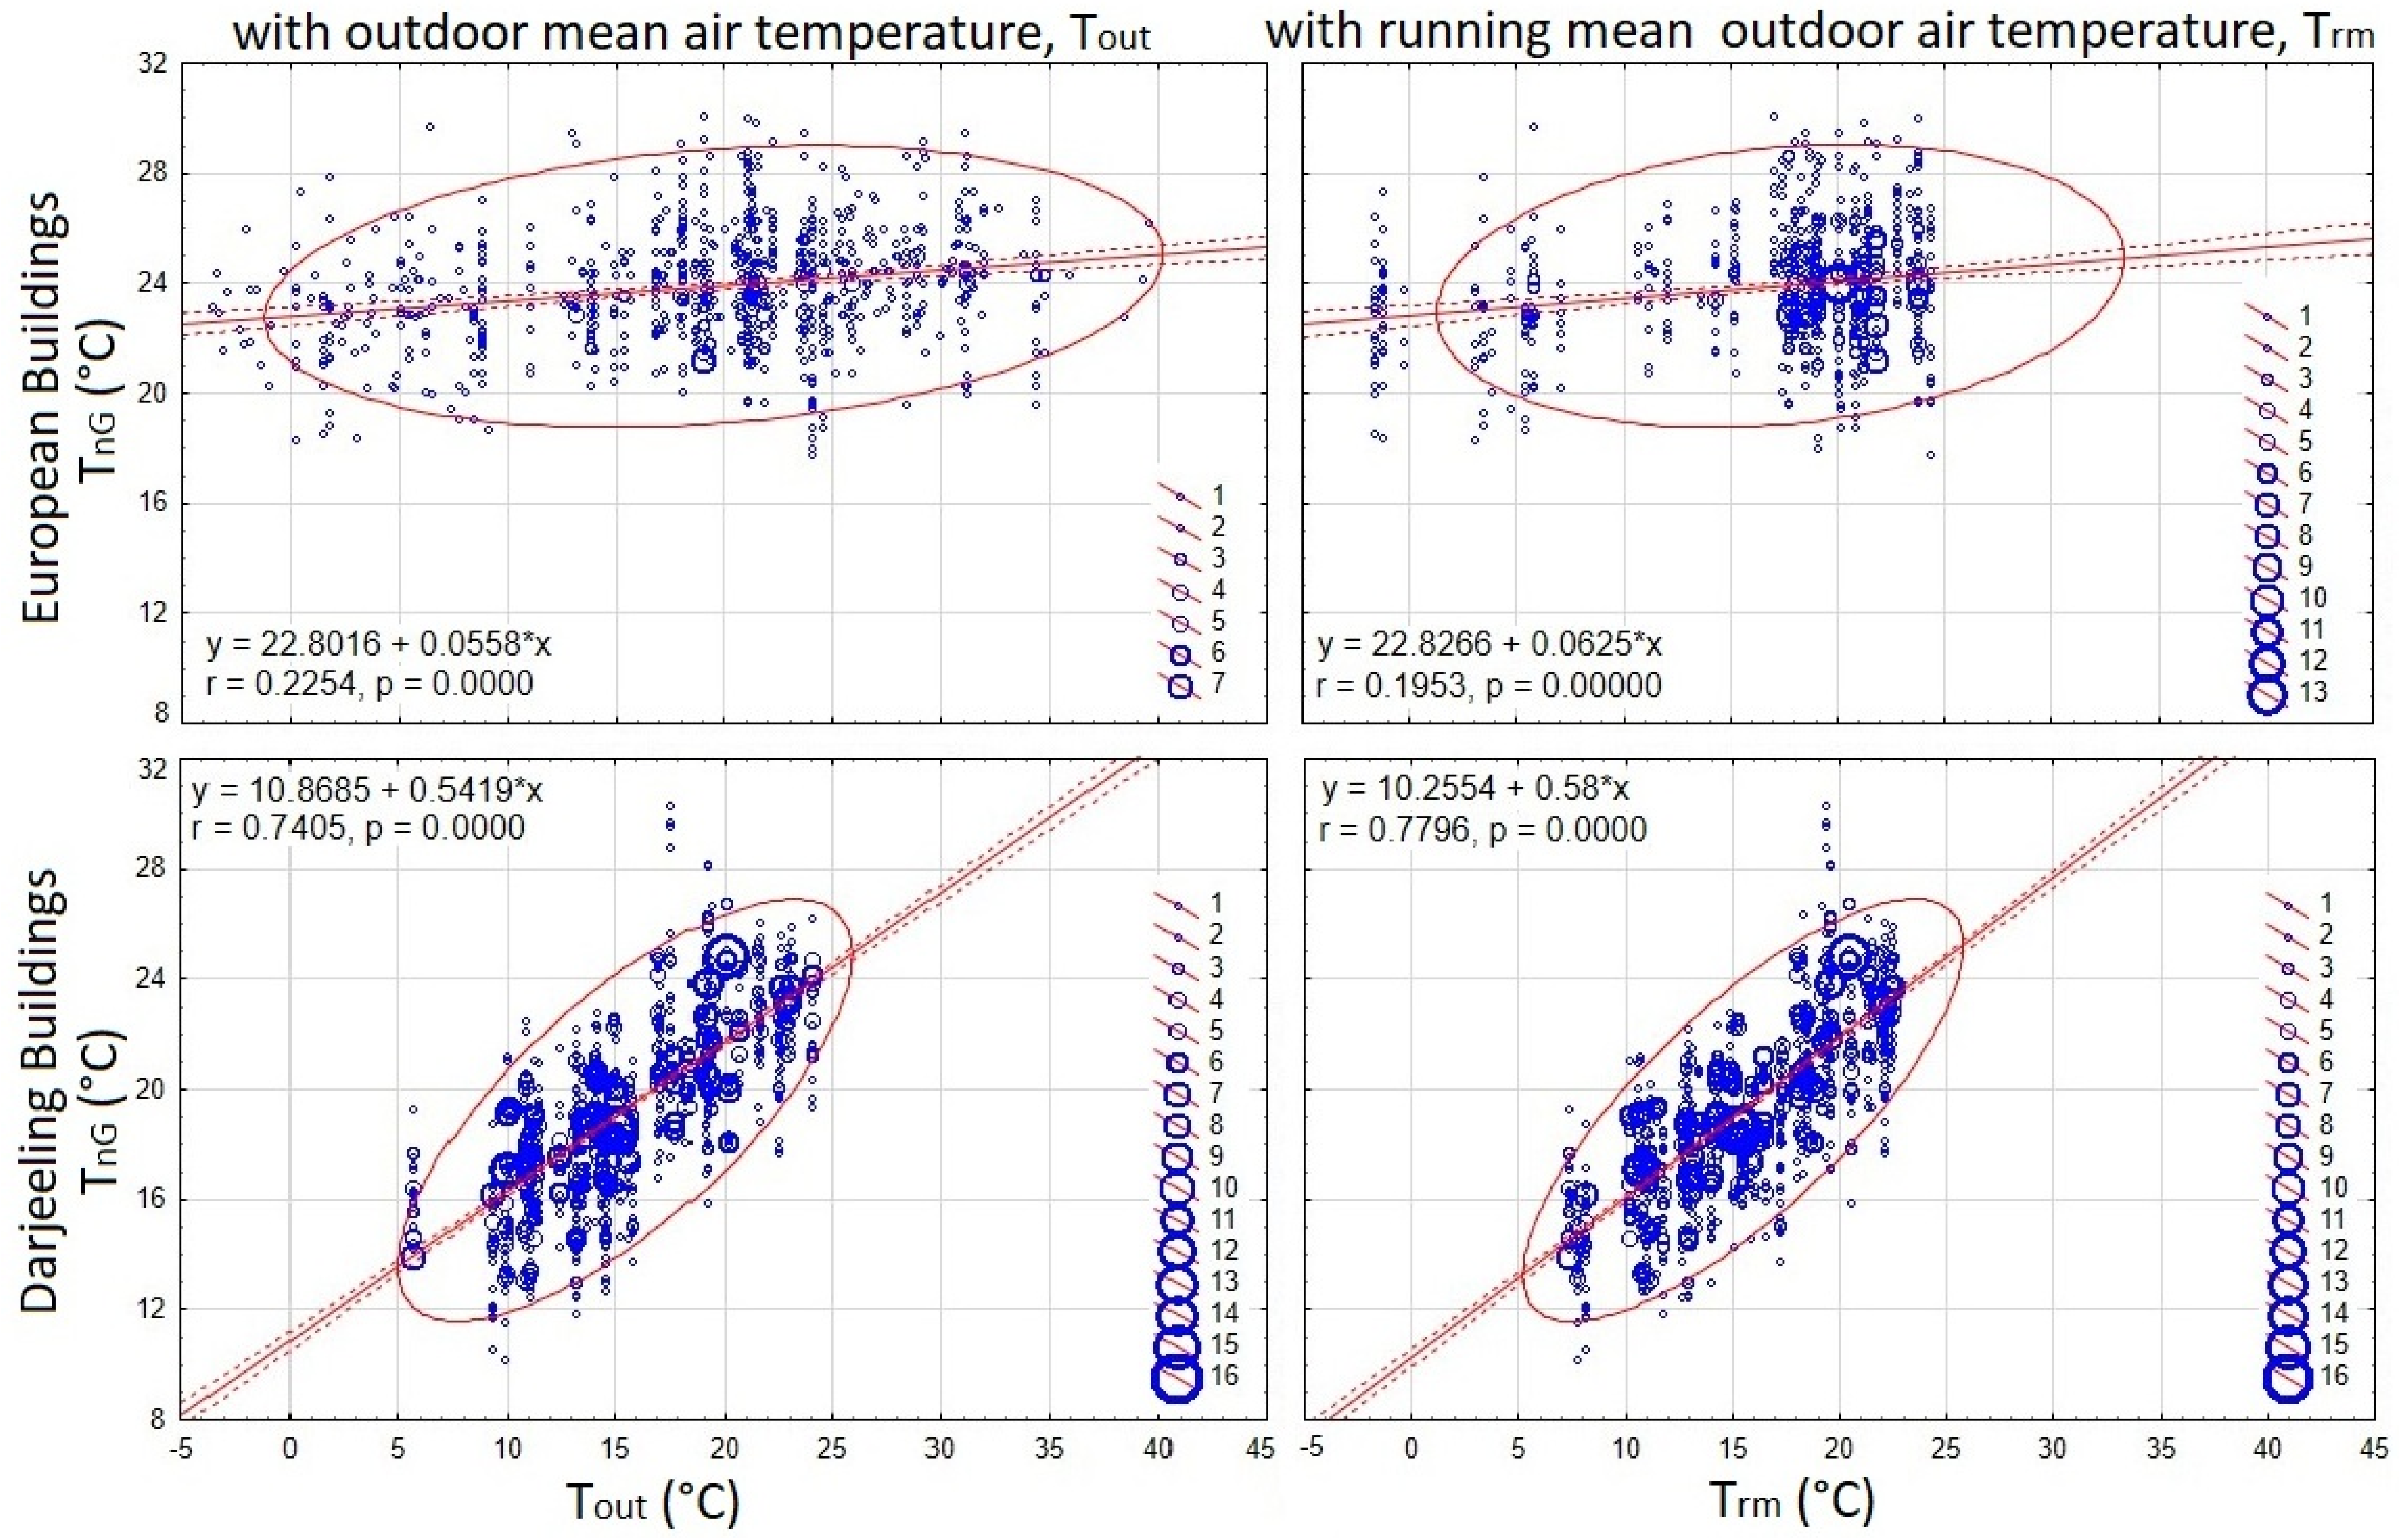
5.12. Variation in Comfort Temperature with Outdoor Condition

The adaptive model of thermal comfort states that the comfort temperature of the indoor occupants is a function of outdoor air temperature (Equation (1)). The Griffiths neutral temperature (TnG) showed a positive significant correlation with the outdoor mean air temperature (Tout) of the survey day, R: 0.1692 (p = 0.00001) and 0.4990 (p < 0.001) for office and classrooms of European climate versus R: 0.7719 (p < 0.001), 0.6548 (p < 0.001), and 0.7929 (p < 0.001) for office, classrooms and residential buildings of Darjeeling climate, respectively. The Griffiths neutral temperature (TnG) also showed a positive significant correlation with the running mean of outdoor air temperature (Trm) on the survey day, R: 0.1076 (p = 0.0040) and 0.4989 (p < 0.001) for office and classrooms of European climate versus R: 0.7980 (p < 0.001), 0.6961 (p < 0.001), and 0.8285 (p < 0.001) for office, classrooms and residential buildings of Darjeeling climate, respectively. This stronger correlation coefficient of the comfort temperature with outdoor air and running mean temperature in Darjeeling buildings as illustrated in Figure 15 indicates a wider comfort range of the indoor occupants as seen in the previous section. The reason for this is the stronger coupling of the indoor and outdoor environmental conditions in the Darjeeling buildings as seen in previous sections. Thus, the indoor occupants of Darjeeling buildings show a stronger adaptation with the outdoor meteorological conditions.

6. Discussion

In this study, we conducted a comprehensive analysis of thermal conditions in different building types across the temperate oceanic regions of two distinct geographies, Europe (represented by high latitude) and Darjeeling, sub-Himalayan India. The examination encompassed different aspects: thermal sensation votes, clothing insulation, and comfort temperature. The findings provide valuable insights into the nuanced differences in thermal experiences between the two regions.
There is a noticeable difference in mean outdoor temperatures between summer and winter in both locations. Generally, Darjeeling tends to have lower standard deviations compared to Europe data as seen by smaller box plots in Figure 2, indicating less variability in outdoor temperatures. Though a higher RH % could be a factor in this result, it could be largely interpreted wrongly as the duration for monitoring in Darjeeling was for a single year, while that in the European region was representative for several years. Regarding the indoor environmental parameters, European buildings tend to have higher indoor air temperatures (as seen in Figure 4), both in summer and winter. However, European buildings generally exhibit lower RH (%) levels compared to Darjeeling buildings (Figure 5), especially during winter. The stronger correlations between the indoor air temperature and outdoor mean temperature on the survey day in Darjeeling buildings suggest a high degree of sensitivity to outdoor temperature variations, likely due to factors like building design and insulation. Contrastingly, in European buildings, these correlations while significant are weaker, indicating a lesser degree of dependency on outdoor temperatures for indoor thermal conditions.
In both Europe and Darjeeling, there is a notable increase in mean clothing insulation values from summer to winter, indicating a universal trend of individuals wearing warmer clothing in colder seasons to maintain thermal comfort (Table 2). While European buildings exhibit slight gender differences in clothing insulation, with males often having slightly higher values, this difference was more pronounced in Darjeeling buildings: 0.01 clo versus 0.04 clo between the former and the latter; annually in all buildings.
Table 3 presents the thermal sensation votes and predicted mean votes for different building types in Europe and Darjeeling. Notably, the Darjeeling region displayed higher thermal sensation votes during summer, emphasizing the impact of local climate on occupants’ comfort perceptions. Table 4 provides the results of the probit regression of the TSV. The coefficients and estimates reveal the significance of air temperature (Ta) in predicting thermal comfort. In both regions, as thermal conditions become warmer (increase in Ta), there is a consistent increase in the estimated thresholds for transitioning between different thermal categories, reflecting a shift towards warmer sensations. The comfort range indicated by the bell curve obtained from the difference in the probits for warm–slightly warm and slightly cool–cool, representing the region for slightly cool, neutral, and slightly warm (as per the ASHRAE’s comfort zone description), suggests a wider comfort range at lower comfort temperatures in the buildings of the Darjeeling region compared to those in Europe. The findings of the study suggest that there is a significant difference in TSV, emphasizing the need for regionalized thermal comfort strategies, as climate has a dominant role in determining occupant comfort. For example, adaptive measures such as the increased use of thermal mass and passive solar heating may benefit the buildings in Darjeeling, while those in Europe might need to focus on ventilation optimization.
Table 5 delves into the regression of TSV with Ta. The regression showed neutral temperatures (Tn) of 22.0 °C versus 22.7 °C, 23.7 °C versus 22.5 °C, and an extraneous value versus 18.1 °C in the offices, classrooms, and residential buildings of Europe, and 22.0 °C versus 20.4 °C, 20.8 °C versus 18.0 °C, and 21.1 °C versus 18.4 °C in the corresponding buildings of Darjeeling during the summer versus winter seasons, respectively. In contrast, Griffiths’ neutral temperature (TnG) was 24.0 °C (s.d. 2.07 °C) versus 22.7 °C (2.03 °C), 24.7 °C (1.92 °C) versus 23.3 °C (2.02 °C), and 22.8 °C (2.32 °C) versus 20.0 °C (2.41 °C) in the offices, classrooms, and residential buildings of Europe, and 21.3 °C (3.01 °C) versus 17.8 °C (1.97 °C), 20.5 °C (3.12 °C) versus 17.5 °C (2.06 °C), and 19.9 °C (2.72 °C) versus 16.5 °C (2.29 °C) in the corresponding buildings of Darjeeling during the summer versus winter seasons, respectively. This higher variation in comfort range, especially in the summer months in the Darjeeling region, is validated by the wider comfort range obtained from the bell curve derived from the probit regressions of the TSV.
Lastly, stronger correlations between the indoor comfort temperature and the outdoor environmental conditions (both mean outdoor air temperature and running mean of outdoor air temperature) in the Darjeeling buildings compared to those in the European ones indicate that the occupants’ comfort is more influenced by the outdoor conditions. This could be due to a strong coupling of indoor and outdoor environmental conditions in these buildings lacking insulation, as validated by the stronger correlation between the indoor and outdoor environmental conditions.
The differences in energy efficiency and insulation performance between buildings in the European and Darjeeling regions could be the prominent factor for the significant difference in thermal comfort. European buildings, which often adhere to stricter energy efficiency standards and feature superior insulation, maintain more stable indoor temperatures across the seasons, as seen from the lesser variation in Figure 4. This minimizes the influence of outdoor climatic variations and reduces the reliance on adaptive behaviors, such as clothing adjustments (shown by a lower R-value in Figure 6), to achieve comfort. In contrast, buildings in the Darjeeling region, which generally lack insulation and energy-efficient design (as these buildings are loosely built), experience greater indoor temperature fluctuations that closely mirror outdoor conditions. This is evident from the stronger correlation between outdoor and indoor air temperatures in Darjeeling buildings (R: 0.785, p < 0.001) compared to European buildings (R: 0.372, p < 0.001). As a result, occupants in free-running buildings of Darjeeling need to rely more heavily on adaptive strategies, such as adjusting clothing insulation, as reflected in the wider variation in Icl values (Figure 6). These findings highlight the critical role of building characteristics in shaping thermal comfort and underscore the importance of incorporating energy-efficient designs and insulation in mountainous regions like Darjeeling. Improving insulation and adopting passive design strategies could help stabilize indoor conditions, enhance occupant comfort, and reduce energy consumption.
There were, however, some limitations of the present study. First was the lack of globe temperature or mean radiant temperature (Tg or Tmr) data for the residential building in the ASHRAE Global Thermal Comfort Database II. As a result, Ta was used as the primary indicator of indoor environmental conditions. While Ta provides useful approximation, it does not fully account for the radiant heat exchange, which can significantly influence occupants’ thermal sensation, leading to the under- or over-estimation of the thermal comfort range, especially in settings with high radiative asymmetry caused by large windows, uninsulated walls, radiators used in the heating season in European buildings (whose information in not provided in ASHRAE database) or other architectural features. However, the data used in the study for both the regions did not have sufficient air movement to cause a significant difference between Tmr and Ta. Nevertheless, future studies should incorporate black globe thermometers or infrared thermometers to measure Tg, or even use advanced sensor networks such as wireless or IoT-enabled devices to record multiple environmental parameters. Collaborations with building-monitoring programs or occupants’ surveys could fill gaps in residential building data, ensuring a more representative sample across diverse geographic and climatic regions. Secondly, the European dataset present in the ASHRAE Global Thermal Comfort Database II spans 1998~2014, while the Darjeeling dataset is from 2015. Although these datasets provide valuable insights into thermal comfort across diverse climatic and geographic contexts, their age must be acknowledged as a limitation. Changes in global climate, advancements in building technologies, and evolving occupant behaviors in the past decade may impact the applicability of the findings in the current situations. Nevertheless, the ASHRAE Database II remains one of the most comprehensive resources for NV buildings, offering robust datasets to reflect current climatic and societal shifts, allowing for a more accurate understanding of thermal comfort dynamics and strengthening the relevance of adaptive comfort models. Future research should prioritize the collection of updated datasets to reflect current climatic and societal shifts. Additionally, longitudinal studies spanning multiple decades would provide insights into trends and variations in thermal comfort responses over time, which would enhance the applicability of adaptive comfort models and their relevance in addressing the challenges posed by climate change and sustainable building design.

7. Conclusions

In conclusion, our investigation involved the analysis of thermal conditions of different building types across similar temperate oceanic climates, one in the high-latitudinal European buildings (using ASHRAE Database II) and the other in the high-elevational (Himalayan) Darjeeling, India. The results provide comprehensive insights into regional variations in occupant comfort. The analysis of clothing insulation, thermal sensation votes, and regression analyses reveal nuanced differences that hold significant implications for design, energy, and policy-making. The following are the main takeaways from the research:
  • The comfort temperature ranges varied significantly between the two regions. European buildings exhibited narrower comfort ranges due to likely inclusion of superior insulation and energy-efficient designs, while Darjeeling buildings showed broader comfort ranges, reflecting higher occupant adaptability to fluctuating indoor conditions, e.g., the 80% comfort range for classrooms in Europe was narrower (21.2~24.8 °C) than that in Darjeeling (16.0~21.6 °C), indicating greater reliance on adaptive strategies in the latter.
  • Further, European buildings maintained more stable indoor conditions, which reduces reliance on adaptive behaviors like clothing adjustment, while Darjeeling buildings were more influenced by outdoor variations. These differences could be explained by a generally higher insulation level and by more energy-efficient designs of European buildings.
  • Cultural and environmental factors influence adaptive behaviors. For instance, clothing insulation (Icl) was a more prominent adaptive measure in Darjeeling buildings, while strict dress codes in educational institutions limited this adaptation in classrooms.
  • Comfort temperature showed significant variations between climates and seasons. The comfort range derived from probit lines showed wider ranges and lower comfort temperatures for Darjeeling buildings compared to that in European buildings.
  • The adaptive model of thermal comfort revealed a stronger positive correlation between comfort temperature and the outdoor conditions. Darjeeling buildings exhibited a stronger coupling of indoor and outdoor environmental conditions.
While the datasets used in the study provide valuable insights, the age of the European dataset (1998~2014) and the limited temporal scope of the Darjeeling dataset (one year) are acknowledged as limitations. Additionally, the absence of radiant temperature data in some buildings may affect the precision of the thermal comfort assessments. Overall, the study underscores the complexity of thermal comfort assessment and the necessity for nuanced, context-specific solutions to ensure occupant satisfaction and well-being across diverse environmental conditions. By addressing the interplay of climatic, geographic, and cultural factors, the study provides actionable insights for architects, engineers and policy-makers aiming to design energy-efficient and climate-resilient buildings worldwide.

Author Contributions

Conceptualization, S.T. and G.P.; methodology, S.T.; software, S.T.; resources, G.P.; writing—original draft preparation, S.T.; writing—review and editing, S.T. and G.P.; supervision, G.P.; funding acquisition, G.P. All authors have read and agreed to the published version of the manuscript.

Funding

This research has been carried out within the PNRR research activities of the consortium iNEST (Interconnected North-East Innovation Ecosystem) funded by the European Union Next-GenerationEU (Piano Nazionale di Ripresa e Resilienza (PNRR) Missione 4 Componente 2, Investimento 1.5 D.D. 1058 23/06/2022, ECS_00000043–Spoke1, RT1A, CUP I43C22000250006). This manuscript reflects only the Authors views and opinions, neither the European Union nor the European Commission can be considered responsible for them.

Institutional Review Board Statement

Not applicable.

Informed Consent Statement

Not applicable.

Data Availability Statement

The original data presented in the study are openly available in (1) ASHRAE Global thermal comfort database II at https://cbe-berkeley.shinyapps.io/comfortdatabase/ (accessed on 15 December 2024)and in (2) Thapa, Samar (2018), “Thermal Comfort Dataset—Darjeeling, 2015”, Mendeley Data, V2, https://doi.org/10.17632/55rddfmfsz.2.

Conflicts of Interest

The authors declare no conflict of interest.

References

  1. Bureau of Energy Efficiency. Energy Conservation Building Code; Bureau of Energy Efficiency, Government of India: New Delhi, India, 2007.
  2. ASHRAE. ANSI/ASHRAE Standard 55—Thermal Environmental Conditions for Human Occupancy. 2023. Available online: https://www.ashrae.org/technical-resources/bookstore/standard-55-thermal-environmental-conditions-for-human-occupancy (accessed on 28 October 2024).
  3. Thapa, S. Revisiting thermal comfort in the cold climate of Darjeeling, India—Effect of assumptions in comfort scales. Build. Environ. 2021, 203, 108095. [Google Scholar] [CrossRef]
  4. Fanger, P.O. Thermal Comfort, Analysis and Applications in Environmental Engineering; McGraw Hill: New York, NY, USA, 1972. [Google Scholar]
  5. ISO 7730:2005; Ergonomics of the Thermal Environment—Analytical Determination and Interpretation of Thermal Comfort Using Calculation of the PMV and PPD Indices and Local Thermal Comfort Criteria. International Organization for Standardization: Geneva, Switzerland, 2005.
  6. Nicol, J.F.; Humphreys, M.A. Adaptive thermal comfort and sustainable standards for buildings. Energy Build. 2002, 34, 563–572. [Google Scholar] [CrossRef]
  7. McCartney, K.J.; Nicol, J.F. Developing an adaptive control algorithm for Europe: Results of the SCATs project. Energy Build. 2002, 34, 623–635. [Google Scholar] [CrossRef]
  8. Nicol, J.F. Adaptive thermal comfort standards in the hot-humid tropics. Energy Build. 2004, 36, 620–637. [Google Scholar] [CrossRef]
  9. de Dear, R.J.; Brager, G.S. Thermal comfort in naturally ventilated buildings: Revisions to ASHRAE 55. Energy Build. 2002, 34, 549–561. [Google Scholar] [CrossRef]
  10. Shen, C.; Yu, N. Study of thermal comfort in free-running buildings based on Adaptive Predicted Mean Vote. In Proceedings of the 2010 International Conference on E-Product E-Service and E-Entertainment, Henan, China, 7–9 November 2010. [Google Scholar]
  11. Ning, H.; Wang, Z.; Zhang, X.; Ji, Y. Adaptive thermal comfort in university dormitories in the severe cold area of China. Build. Environ. 2016, 99, 161–169. [Google Scholar] [CrossRef]
  12. Mishra, A.K.; Ramgopal, M. An adaptive thermal comfort model for the tropical climatic regions of India (Koppen climate type A). Build. Environ. 2015, 85, 134–143. [Google Scholar] [CrossRef]
  13. Veronika, F.; Cheung, T.; Zhang, H.; de Dear, R.; Parkinson, T.; Arens, E.; Chun, C.; Schiavon, S.; Luo, M.; Brager, G.; et al. Development of the ASHRAE Global Thermal Comfort Database II. Build. Environ. 2018, 142, 502–512. [Google Scholar]
  14. Yang, Z.; Zhang, W.; Qin, M.; Liu, H. Comparative study of indoor thermal environment and human thermal comfort in residential buildings among cities. towns and rural areas in arid regions of China. Energy Build. 2022, 273, 112373. [Google Scholar] [CrossRef]
  15. Wang, Z.; Zhang, H.; He, Y.; Luo, M.; Li, Z.; Hong, T.; Lin, B. Revisiting individual and group differences in thermal comfort based on ASHRAE database. Energy Build. 2020, 219, 110017. [Google Scholar] [CrossRef]
  16. Lai, D.; Liu, J.; Wu, Z.; Pei, J.; Qi, Y.; Zhang, H.; Yoshino, H. Thermal comfort diversity in Chinese urban residential buildings across various climates. Energy Build. 2021, 231, 110632. [Google Scholar] [CrossRef]
  17. Romero, P.; Valero-Amaro, V.; Isidoro, R.; Miranda, M.T. Analysis of determining factors in the thermal comfort of university students. A comparative study between Spain and Portugal. Energy Build. 2024, 308, 114022. [Google Scholar] [CrossRef]
  18. Cao, B.; Luo, M.; Li, M.; Zhu, Y. Too cold or too warm? A winter thermal comfort study in different climate zones in China. Energy Build. 2016, 133, 469–477. [Google Scholar] [CrossRef]
  19. Chen, L.; Kantor, N.; Nikolopoulou, M. Meta-analysis of outdoor thermal comfort surveys in different European cities using the RUROS database: The role of background climate and gender. Energy Build. 2022, 256, 111757. [Google Scholar] [CrossRef]
  20. Zhang, N.; Cao, B.; Wang, Z.; Zhu, Y.; Lin, B. A comparison of winter indoor thermal environment and thermal comfort between regions in Europe, North America and Asia. Build. Environ. 2017, 117, 208–217. [Google Scholar] [CrossRef]
  21. Jeong, B.; Kim, J.; Chen, D.; de Dear, R. Comparison of residential thermal comfort in two different climates in Australia. Build. Environ. 2022, 211, 108706. [Google Scholar] [CrossRef]
  22. Yang, L.; Wang, F.; Zhao, S.; Gao, S.; Yan, H.; Sun, Z.; Lian, Z.; Duanmu, L.; Zhang, Y.; Zhou, X.; et al. Comparative analysis of indoor thermal environment characteristics and occupants’ adaptability: Insights from ASHRAE RP-884 and the Chinese thermal comfort database. Energy Build. 2024, 309, 114033. [Google Scholar] [CrossRef]
  23. Pistore, L.; Varin, C.; Pasut, W. Development of climate-based thermal comfort ranges from existing data: Analysis of Smart Controls and thermal comfort (SCATs) database. Energy Build. 2023, 298, 113509. [Google Scholar] [CrossRef]
  24. Williamson, T.; Daniel, L. A new adaptive thermal comfort model for homes in temperate climates of Australia. Energy Build. 2020, 210, 109728. [Google Scholar] [CrossRef]
  25. Jebaei, H.A.; Aryal, A. Quantifying the impact of personal comfort systems on thermal satisfaction and energy consumption in office buildings under different U.S. climates. Energy Build. 2022, 274, 112448. [Google Scholar] [CrossRef]
  26. Thapa, S.; Indraganti, M. Evaluation of thermal comfort in two neighboring climatic zones in Eastern India—An adaptive approach. Energy Build. 2020, 213, 109767. [Google Scholar] [CrossRef]
  27. Singh, M.K.; Ooka, R.; Rijal, H.B.; Kumar, S.; de Dear, R. Adaptive thermal comfort in the offices of three climates of North-East India. J. Build. Eng. 2023, 75, 106843. [Google Scholar] [CrossRef]
  28. Kumar, S. Subject’s thermal adaptation in different built environments: An analysis of updated metadata-base of thermal comfort data in India. J. Build. Eng. 2022, 46, 103844. [Google Scholar] [CrossRef]
  29. Kaushal, A.A.; Anand, P.; Aithal, B.H.; Sen, J. Thermal comfort in Indian naturally ventilated buildings: A comprehensive review. Energy Build. 2024, 306, 113923. [Google Scholar] [CrossRef]
  30. Sharma, A.; Kumar, A.; Kulkarni, K.S. Thermal comfort studies for the naturally ventilated built environments in Indian subcontinent: A review. J. Build. Eng. 2021, 44, 103242. [Google Scholar] [CrossRef]
  31. Halawa, E.; van Hoof, J. The adaptive approach to thermal comfort: A critical overview. Energy Build. 2012, 51, 101–110. [Google Scholar] [CrossRef]
  32. Peel, M.C.; Finlayson, B.L.; McMahon, T.A. Updated world map of the Koppen-Geiger climate classification. Hydrol. Earth Syst. Sci. 2007, 11, 1633–1644. Available online: www.hydrol-earth-syst-sci.net/11/1633/2007/ (accessed on 28 October 2024). [CrossRef]
  33. Ahmed, K.; Carlier, M.; Feldmann, C.; Kurnitski, J. A new method for Contrasting Energy Performance and Near-Zero Energy Building Requirements in Different Climates and Countries. Energies 2018, 11, 1344. [Google Scholar] [CrossRef]
  34. Bureau of Indian Standard (BIS). National Building Code of India; Bureau of Indian Standard: New Delhi, India, 2017.
  35. Thapa, S.; Bansal, A.K.; Panda, G.K.; Indraganti, M. Adaptive thermal comfort in the different buildings of Darjeeling Hills in eastern India—Effect of difference in elevation. Energy Build. 2018, 173, 649–677. [Google Scholar] [CrossRef]
  36. Thapa, S. Thermal Comfort Dataset—Darjeeling, 2015, Version 2; Mendeley Data. 2018. Available online: https://data.mendeley.com/datasets/55rddfmfsz/2 (accessed on 28 October 2024).
  37. Humphreys, M. A simple theoretical derivation of thermal comfort conditions. J. Inst. Heat. Vent. Eng. 1970, 33, 95–98. [Google Scholar]
  38. Humphreys, M.A.; Nicol, J.F. The validity of ISO-PMV for predicting comfort votes in every day thermal environment. Energy Build. 2002, 34, 667–684. [Google Scholar] [CrossRef]
  39. Gagge, A.P.; Nishi, Y.; Gonzalez, R.R. Standard Effective Temperature—A single temperature index of temperature sensation and thermal discomfort. In Thermal Comfort and Moderate Heat Stress: Proceedings of the CIB Commission W45 (Human Requirements) Symposium Held at the Building Research Station 13–15 September 1972; Her Majesty’s Stationery Office: London, UK, 1973; pp. 229–250. [Google Scholar]
  40. Gagge, A.P.; Fobelets, A.P.; Berglund, L.G. A Standard Predictive Index of Human Response to the Thermal Environment. ASHRAE Trans. 1986, 92, 709–731. [Google Scholar]
  41. Ji, W.; Zhu, Y.; Du, H.; Cao, B.; Lian, Z.; Geng, Y.; Liu, S.; Xiong, J.; Yang, C. Interpretation of standard effective temperature (SET) and explorations on its modification and development. Build. Environ. 2022, 210, 108714. [Google Scholar] [CrossRef]
  42. Tartarini, F.; Schiavon, S.; Cheung, T.; Hoyt, T. CBE Thermal Comfort Tool: Online tool for thermal comfort calculations and visualizations. SoftwareX 2020, 12, 100563. Available online: https://www.sciencedirect.com/science/article/pii/S2352711020302454?via%3Dihub (accessed on 28 October 2024). [CrossRef]
  43. Rijal, H.B.; Humphreys, M.A.; Nicol, J.F. Towards an adaptive model for thermal comfort in Japanese offices. Build. Res. Inf. 2017, 45, 717–729. [Google Scholar] [CrossRef]
  44. Finney, D.J. Probit Analysis: A Statistical Treatment of the Sigmoid Response Curve; Cambridge University Press: Cambridge, UK, 1971; pp. 1–331. [Google Scholar]
  45. Nicol, J.F.; Humphreys, M.A. A stochastic approach to thermal comfort—Occupant Behavior and energy use in buildings. ASHRAE Trans. 2004, 110, 554–568. [Google Scholar]
  46. Thapa, S.; Bansal, A.K.; Panda, G.K. Adaptive thermal comfort in the residential buildings of north east India—An effect of difference in elevation. Build. Simul. 2018, 11, 245–267. [Google Scholar] [CrossRef]
  47. Singh, M.K.; Ooka, R.; Rijal, H.B.; Takasu, M. Adaptive thermal comfort in the offices of North-East India in autumn season. Build. Environ. 2017, 124, 14–30. [Google Scholar] [CrossRef]
  48. Humphreys, M.A.; Nicol, J.F.; Roaf, S. Adaptive Thermal Comfort: Foundations and Analysis, 1st ed.; Routledge: London, UK, 2015; Volume 2, pp. 259–269. [Google Scholar]
Figure 1. Regions showing temperate oceanic climate with markings for the locations regarding the present study (1: European temperate climate; 2: Indian (sub-Himalayan) temperate climate) [32].
Sustainability 17 00404 g001
Figure 2. Variation in outdoor mean air temperature (Tout) in the two climatic regions, showing the wider variation in outdoor air temperature in European climate.
Sustainability 17 00404 g002
Figure 3. Month-wise outdoor mean RH (RHout) on the survey day for the two climates.
Sustainability 17 00404 g003
Figure 4. Variation in indoor air temperature (Ta) in the two climatic regions.
Sustainability 17 00404 g004
Figure 5. Seasonal variation in indoor RH (%) in different climates.
Sustainability 17 00404 g005
Figure 6. Variation in clothing insulation with air temperature in the different buildings of the two climatic regions.
Sustainability 17 00404 g006
Figure 7. Seasonal distribution of thermal sensation votes (TSVs) regarding the indoor air temperature for the different buildings in the two climatic locations.
Sustainability 17 00404 g007
Figure 8. Predicted proportion of the thermal sensation votes (TSVs) with air temperature (Ta) obtained using the probit regression method for the different buildings in the two regions.
Sustainability 17 00404 g008
Figure 9. Seasonal distribution of thermal preference (TP) votes in the two climatic regions.
Sustainability 17 00404 g009
Figure 10. Building-wise difference in proportion of “prefer warmer” and “prefer cooler” with air temperature, Ta in the two climatic regions. Non-significant variation for “prefer warmer” in the residential buildings of European climate was noted.
Sustainability 17 00404 g010
Figure 11. Box plot showing the distribution of SET values in the different buildings of the two climates under two different seasons [Note: Due to the unavailability of Tg/Tmr for summer season in residential buildings in European dataset, SET were not calculated].
Sustainability 17 00404 g011
Figure 12. Variation in thermal sensation votes (TSVs) and predicted mean vote (PMV) with indoor air temperature (Ta) in the two different climates.
Sustainability 17 00404 g012
Figure 13. Points representing the indoor air temperature (Ta) and RH % illustrated in ASHRAE comfort band for the different buildings in the two climatic regions.
Sustainability 17 00404 g013
Figure 14. Bell-shaped curve showing the proportion of comfortable region for the different buildings in the two climatic regions.
Sustainability 17 00404 g014
Figure 15. Variation in comfort temperature (TnG) with outdoor mean temperature (Tout) and running mean of outdoor air temperature (Trm) in the two climates. The red dashed lines represents the confidence limit (95%) to the regression line at the center. The ellipse in the scatter plots represent confidence or prediction intervals around the datapoints.
Sustainability 17 00404 g015
Table 1. Sample size and other details of the data from the two temperate regions in the study (MFH: multifamily housing; Cl: classroom; NA: not available (in ASHRAE dataset for European buildings)).
LocationBuilding_idBuilding_typeLocationLatitude
(° N)
Longitude
(° E)
Elevation (m Above Mean Sea Level)Sample SizeMean Tout (°C)Mean RH (%)
Europe (ASHRAE db-II)557OfficeKarlsruhe49.008.4311842122.664.4
621MFHBratislava48.1517.1114074NANA
622MFHBratislava48.1517.1114094NANA
629OfficeKarlsruhe49.018.4011813225.864.2
632OfficeStuttgart48.789.1824510520.866.7
652ClElsinore56.0312.59395170NANA
704MFHBratislava48.1517.11140289NANA
727MFHLiege50.635.577085NANA
740ClLyon45.764.8423710918.870.1
742OfficeLyon45.764.842371522.157.1
744ClLyon45.764.842371124.777.7
746OfficeLyon45.764.84237467.485.0
Total 165219.567.5
India (Darjeeling database)K1420MFHKurseong26.8888.27142048918.474.5
M1650OfficeMirik26.8888.18164044417.371.8
S1950ClSonada26.9588.28195057714.573.4
T2565MFHTiger Hills26.9988.28256552812.275.1
Total 203815.571.6
Table 2. Statistics of seasonal distribution clothing insulation, Icl (in clo) for the different buildings in the two studied regions. S.D.: standard deviation; NA: not available.
Building TYPESeasonGenderEuropean Temperate (ASHRAE)Indian Temperate (Darjeeling)
Mean (clo)S.D. (clo)Min (clo)Max (clo)NMean (clo)S.D. (clo)Min (clo)Max (clo)N
classroomSummerFemale0.590.200.241.07470.930.340.371.98170
Male0.610.160.321.19621.010.320.321.90212
Total0.600.180.241.191090.980.330.321.98382
WinterFemale0.880.180.561.47431.180.330.582.3190
Male0.810.170.451.25691.280.320.642.22105
Total0.840.180.451.471121.240.330.512.31195
TotalFemale0.730.240.241.47901.020.360.372.31260
Male0.720.200.321.251311.100.340.322.22317
Total0.720.220.241.472211.070.350.322.31577
officeSummerFemale0.560.110.280.971920.950.260.471.88127
Male0.560.090.370.842320.790.280.411.71158
NA0.450.130.150.82230NANANANANA
Total0.520.120.150.976540.860.290.411.88285
WinterFemale0.820.150.551.24301.260.270.611.7671
Male1.030.110.861.27161.240.300.731.9588
Total0.900.170.551.27461.250.290.611.95159
TotalFemale0.600.150.281.242221.060.300.471.88198
Male0.590.150.371.272480.950.360.411.95246
NA0.450.130.150.82230NANANANANA
Total0.550.160.151.277001.000.340.411.95444
ResidentialSummerFemaleNANANANANA0.710.200.192.36240
MaleNANANANANA0.840.310.172.72446
TotalNANANANANA0.790.280.172.72686
WinterFemale0.820.220.371.20351.010.190.511.66120
Male0.820.200.311.19501.160.350.212.27210
Total0.820.200.311.20851.100.310.212.27330
TotalFemale0.820.220.371.20350.810.240.192.36360
Male0.820.200.311.19500.940.350.212.27656
Total0.820.200.311.20850.900.320.172.361016
All BuildingsSummerFemale0.570.140.241.072390.840.290.192.36537
Male0.570.110.321.192940.870.320.172.72816
NA0.450.130.150.82230NANANANANA
Total0.530.130.151.197630.860.310.172.721353
WinterFemale0.840.190.371.471081.130.280.512.31281
Male0.840.190.311.271351.210.330.212.27403
Total0.840.190.311.472431.180.320.212.31684
TotalFemale0.650.200.241.473470.940.320.172.36818
Male0.650.190.311.274290.990.360.172.721219
NA0.450.130.150.82230NANANANANA
Total0.610.200.151.4710060.970.340.172.722037
Table 3. Statistics of thermal sensation votes (TSVs) and predicted mean vote (PMV) for the different buildings under the two climatic regions (s.d.: standard deviation; N: sample size; NA: not available; S: summer; W: winter; Y: yearly).
Building TYPEStatisticsEuropean BuildingsDarjeeling Buildings
TSVPMVTSVPMV
SWYSWYSWYSWY
OfficeMean0.56−0.020.52−0.130.34−0.10−0.10−0.75−0.33−0.49−1.12−0.72
s.d.0.891.040.910.740.410.740.820.890.900.640.510.67
Min−2.0−2.0−2.0−3.12−0.51−3.12−2.0−3.0−3.0−2.93−2.77−2.93
Max3.02.03.01.811.321.812.02.02.00.760.130.76
N6704671666646712285159444285159444
ClassroomsMean0.860.420.54−0.070.220.14−0.09−0.79−0.33−0.50−1.19−0.73
s.d.1.101.091.110.410.510.501.261.331.320.930.780.94
Min−2.0−3.0−3.0−1.12−1.19−1.19−3.0−3.0−3.0−3.79−3.40−3.79
Max2.02.02.00.761.971.972.02.02.01.191.041.19
N109280389109279388382195577382195577
Residential
Buildings
Mean1.660.880.98NANANA−0.11−0.32−0.18−1.05−1.38−1.16
s.d.0.831.181.17NANANA0.820.960.870.650.680.68
Min−1.0−3.0−3.0NANANA−2.0−2.0−2.0−3.93−4.37−4.37
Max2.02.02.0NANANA2.02.03.00.540.270.54
N74468542NANANA68733010176873301017
All BuildingsMean0.690.660.68−0.120.24−0.01−0.11−0.55−0.26−0.78−1.26−0.94
s.d.0.9631.181.070.710.500.670.961.091.030.790.680.79
Min−2.0−3.0−3.0−3.12−1.19−3.12−3.0−3.0−3.0−3.93−4.37−4.37
Max2.02.02.01.811.971.972.02.02.01.191.041.19
N853794164777532511001354684203813546842038
Table 4. Results of probit regression of TSV for the different buildings in the two climates (coefficient, Ta: location estimate; Estimate: y-intercept; p-value: level of significance; SD: standard deviation).
Building TYPEStatisticsEuropean Buildings (ASHRAE)Darjeeling Buildings (India)
<Cool<sl. Cool<Neutral<sl. Warm<Warm<Hot<Cool<sl. Cool<Neutral<sl. Warm<Warm<Hot
OfficeCoefficient, Ta0.2490.172
Estimate 3.394.576.387.548.14−0.041.593.214.435.66
p-valueNot sig.0.0000.0000.0000.0000.0000.9360.0000.0000.0000.000Not sig.
Median 13.618.325.630.332.7−0.29.318.725.832.9
SD4.025.82
ClassroomsCoefficient, Ta0.2940.196
Estimate4.595.236.117.238.259.541.852.383.594.395.546.49
p-value0.0000.0000.0000.0000.0000.0000.0000.0000.0000.0000.0000.000
Median15.617.820.824.628.132.59.512.218.422.428.333.2
SD3.415.11
ResidentialCoefficient, Ta0.2090.099
Estimate1.762.583.204.174.946.60 −0.081.552.623.925.01
p-value0.0000.0000.0000.0000.0000.000Not sig.0.7220.0000.0000.0000.000
Median8.412.415.319.923.731.6 −0.815.626.539.650.5
SD4.7910.09
AllCoefficient, Ta0.1130.149
Estimate0.140.861.512.683.524.550.491.192.613.634.815.77
p-value0.5640.0000.0000.0000.0000.0000.0010.0000.0000.0000.0000.000
Median1.27.613.323.731.140.23.37.917.524.332.238.6
SD8.846.69
Table 5. Regression of thermal sensation votes (TSVs) with indoor air temperature (Ta) inside the different buildings in the two climatic regions during summer and winter along with their coefficient of correlation (R), level of significance (p-value), mean Griffiths’ neutral temperature (TnG), sample size (N), and Range (Min~Max).
Building TYPEParameterEuropean Temperate (ASHRAE) ClimateIndian Temperate (Darjeeling) Climate
SummerWinterSummerWinter
OfficeRegressionTSV = 0.18Ta − 3.91TSV = 0.35Ta − 8.02TSV = 0.10Ta − 2.31TSV = 0.18Ta − 3.72
R0.400.280.420.33
p-valuep < 0.001p = 0.055p < 0.001p < 0.0001
Tn (°C)22.022.922.020.4
Mean TnG (°C)24.022.721.317.8
N67046285159
Range (°C)17.8~30.118.6~26.513.8~26.811.9~21.8
ClassroomsRegressionTSV = 0.31Ta − 7.45TSV = 0.28Ta − 6.34TSV = 0.18Ta − 3.82TSV = 0.37Ta − 6.71
R0.610.370.530.67
p-valuep < 0.001p < 0.001p < 0.001p < 0.001
Tn (°C)23.722.520.818.0
Mean TnG (°C)24.723.320.517.5
N109280382195
Range (°C)20.4~29.317.5~29.712.5~30.312.9~22.5
ResidentialRegressionTSV = 0.003Ta − 1.58TSV = 0.24Ta − 4.41TSV = 0.08Ta − 1.64TSV = 0.13Ta − 2.33
R0.0060.440.250.24
p-valueNot significantp < 0.001p < 0.001p < 0.0001
Tn (°C)* (extraneous value)18.421.118.4
Mean TnG (°C)22.820.019.916.5
N74468687330
Range (°C)18.4~28.114.3~33.012.7~26.710.2~21.8
All BuildingsRegressionTSV = 0.20Ta − 4.5TSV = 0.129Ta − 2.25TSV = 0.12Ta − 2.55TSV = 0.24Ta − 4.32
R0.440.260.390.42
p-valuep < 0.001p < 0.001p < 0.001p < 0.001
Tn (°C)22.517.421.018.3
Mean TnG (°C)24.021.320.317.1
N8537941354684
Range (°C)17.8~30.114.3~33.012.5~30.310.2~22.5
* extraneous value: 526.7 °C.
Disclaimer/Publisher’s Note: The statements, opinions and data contained in all publications are solely those of the individual author(s) and contributor(s) and not of MDPI and/or the editor(s). MDPI and/or the editor(s) disclaim responsibility for any injury to people or property resulting from any ideas, methods, instructions or products referred to in the content.

