Article

An Environmental–Economic Benefit for Sustainability Assessment of Highly Mineralized Mine Water Reuse

1
State Key Laboratory of Water Resources Protection and Utilization in Coal Mining, National Institute of Clean-and-Low-Carbon Energy, No. 9 Binhe Avenue, Future Science City, Changping District, Beijing 102209, China
2
State Key Laboratory of Simulation and Regulation of Water Cycle in River Basin, China Institute of Water Resources and Hydropower Research, A1 Fuxing Road, Haidian District, Beijing 100038, China
*
Author to whom correspondence should be addressed.
These authors contributed equally to this work.
Sustainability 2025, 17(19), 8965; https://doi.org/10.3390/su17198965
Submission received: 19 August 2025 / Revised: 14 September 2025 / Accepted: 25 September 2025 / Published: 9 October 2025

Abstract

With the rapid economic and social development and the increasingly severe water shortage situation, the sustainable utilization of unconventional water resources is of great significance. As one of the “second water sources”, the full utilization of highly mineralized mine water (HMMW) is a key strategy for promoting sustainable development in water-scarce regions. It has obvious resource, environmental, and economic benefits that are central to sustainability. However, the mechanism of the impact of HMMW utilization on water utilization, the environment, and the economy is still unclear, making it difficult to evaluate its overall sustainability performance and to provide scientific data support to promote HMMW utilization. Therefore, this paper develops a novel sustainability-oriented accounting framework to assess the environmental–economic sustainability of HMMW utilization. Firstly, this paper proposes the method of calculating the HMMW utilization environmental benefits, proposes a novel integrated environmental–economic input–output accounting framework, which refines the HMMW sector from the traditional water industry and integrates the environmental benefits into a balanced input–output table. Secondly, taking Ningdong Energy Chemical Industry Base (NECI Base) as an example, this paper conducts applied research on the integrated environmental–economic accounting of HMMW utilization: (I) The HMMW environmental benefits of NECI Base are calculated, the utilization of 22.69 million m3 of HMMW generated environmental benefits, valued at 233.69 million CNY, demonstrating its substantial contribution to environmental sustainability. The compiled environmental–economic input–output table passed the balance verification, confirming the robustness and practicality of the accounting method.

1. Introduction

With rapid economic and social development, extreme events such as global climate change, droughts, and floods occur frequently, and the contradiction between the supply and demand of global water resources is becoming increasingly severe [1]. As the “second water source”, unconventional water resources are useful to alleviate water scarcity and reduce environmental pollution [2,3]. Unconventional water resources refer to seawater, wastewater, brackish or saline water, and mine water, which can be reused after treatment or used directly under certain conditions, it also includes rainwater and floods that are difficult to utilize. Highly mineralized mine water (HMMW) belongs to unconventional water resources, which refers to mine water with a total dissolved solids (TDS) content of more than 1000 mg/L [4]. The HMMW contains large amounts of TDS and suspended solids (SS), as well as small amounts of chemical oxygen demand (COD), phosphorus (P), bacteria, and other pollutants, whose large discharges will lead to environmental problems such as soil salinization, siltation of rivers, and destruction of biodiversity [5].
In 2024, China’s raw coal output reached 4.78 billion metric tons. As approximately 2 metric tons of mine water are generated for each ton of coal mined, it is estimated that at least 9.56 billion metric tons of mine water are produced annually in China [6]. Coal mines in China are predominantly located in the arid northwest region, where HMMW constitutes a significant portion of the total mine water. According to incomplete statistics, such water accounts for about 30% of the total inflow in key coal mining areas of Northwest China, yet its average utilization rate remains below 40% [7].
At present, China strongly encourages the development and utilization of HMMW. In 2021, the State Council issued the “Outline of the Yellow River Basin Ecological Protection and High-Quality Development Plan” [8], which emphasizes the necessity to improve the development and utilization of mine water in mining areas. However, the mechanism of the impact of HMMW utilization on water utilization, the economy, and the environment is still unclear. Therefore, it is difficult to reveal the environmental, resource, and economic values of HMMW utilization. Based on this, this paper does research on integrated environmental–economic input–output accounting of HMMW utilization, explores the mechanism of the impact of HMMW utilization on water utilization, environment, and economy, and provides scientific data support to promote HMMW utilization.
Research on the environmental benefits of HMMW utilization focuses on qualitative analysis, less on environmental benefits quantitative analysis.
As for the qualitative analysis of the environmental benefits of HMMW utilization. Many scholars at home and abroad have studied the pollution effects, treatment processes, and usage of mine water [9,10]. Wright et al. conducted research on an abandoned mine in Australia, and found that its drainage was acidic mine water with high concentrations of heavy metals, which polluted a river supplying domestic water and led to a 63% reduction in invertebrate populations [11]. Taking Pingdingshan Coal Industry Group as a case, Shao et al. demonstrated that the utilization of mine water yield significant social, economic, and environmental benefits [12]. Taking a coal mine in Fuxin as an example, Lixin et al. analyzed the cost of mine water treatment, calculated the economic benefits of mine water utilization, and analyzed the social and environmental benefits of mine water utilization [13].
There are relatively few studies on the quantitative assessment of the HMMW utilization environmental benefits, many studies focus on the reclaimed water utilization environmental benefits [14,15]. Taking mine water in the Daliuta Coal Mine as an example, Asushe et al. calculate the emission reduction in pollutants owing to mine water utilization [16]. Fan Yupeng and Chen Weiping constructed an evaluation system of reclaimed water benefits, and adopted the opportunity cost method to calculate the environmental benefits of reclaimed water [17]. Taking irrigated citrus in southern Spain as an example, Alcon et al. include the environmental benefits of reclaimed water in their cost–benefit analysis and evaluate it by the willingness to pay method [18].
The environmental input–output model can analyze externalities and economic development problems caused by production and consumption activities [19,20,21,22], which is widely used in enterprises, CO2 emissions, and environmental pollution [23,24,25]. The environmental input–output model can well analyze the environmental and economic benefits of HMMW utilization, but its application in HMMW utilization has not been seen. Based on the input–output model and using Spain as a case study, Butnar analyzed the impact of carbon emissions from the service industry on the economy and environment from 2000 to 2005 [24]. M. A. Tarancon reviews sensitivity analysis of environmental input–output modeling in the area of carbon emissions and energy [26]. At home, Liao Mingqiu incorporates the energy input–output model and the pollutant reduction input–output model into the overall input–output framework system, and develops the environmental input–output model based on “energy conservation and emission reduction” [27]. Based on the input–output table of three provinces along the Yangtze River Delta, Li Jing and Fang Wei analyze the impact of import and export trade on energy consumption and the environment [28].
Regarding the research on integrated environmental and economic input–output accounting of HMMW utilization, many studies only qualitatively analyze the environmental and economic benefits of HMMW utilization, without achieving quantitative analysis. Although there is relevant literature quantifying the environmental benefits of reclaimed water utilization, there is also no integrated environmental and economic input–output accounting of reclaimed water utilization.
In comparison with previously published studies, the novelty of this paper is threefold:(I) This paper proposes the method of calculating the HMMW utilization environmental benefits. (II) This paper proposes a novel integrated environmental–economic input–output accounting framework, which for the first time refines the HMMW sector from the traditional water industry and integrates the environmental benefits into a balanced input–output table. (III) This paper provides the first comprehensive case study applying this framework to a major energy chemical base (NECI Base) in China, offering a quantifiable model for assessing the triple benefits (economic, resource, environmental) of HMMW utilization in arid regions.

2. Materials and Methods

2.1. Impact Mechanism of HWW Utilization

HMMW cannot be used for production and domestic water without treatment. The treatment process of HMMW includes pretreatment and desalination, in which pretreatment mainly removes SS and a small amount of pollutants such as TP, COD, and bacteria, and desalination removes TDS [29,30]. The different treatment processes for HMMW and the water quality requirements for water users lead to different directions for HMMW utilization. The treatment process and comprehensive utilization after treatment of HMMW are shown in Figure 1.
HMMW utilization can replace conventional water resources, save the amount of conventional water resources, and alleviate the gap between the supply and demand of water resources. In this way, it can be used to promote local economic development. On the other hand, HMMW contains large amounts of pollutants, which will pollute the local environment if discharged in large quantities [31,32]. The HMMW utilization will reduce the discharge of pollutants, reduce damage to the local environment, and protect the local environment. The impact of HWW utilization on local water utilization, the environment, and the economy are shown in Figure 2.

2.2. Theoretical Foundation and Analysis

2.2.1. Externality Theory

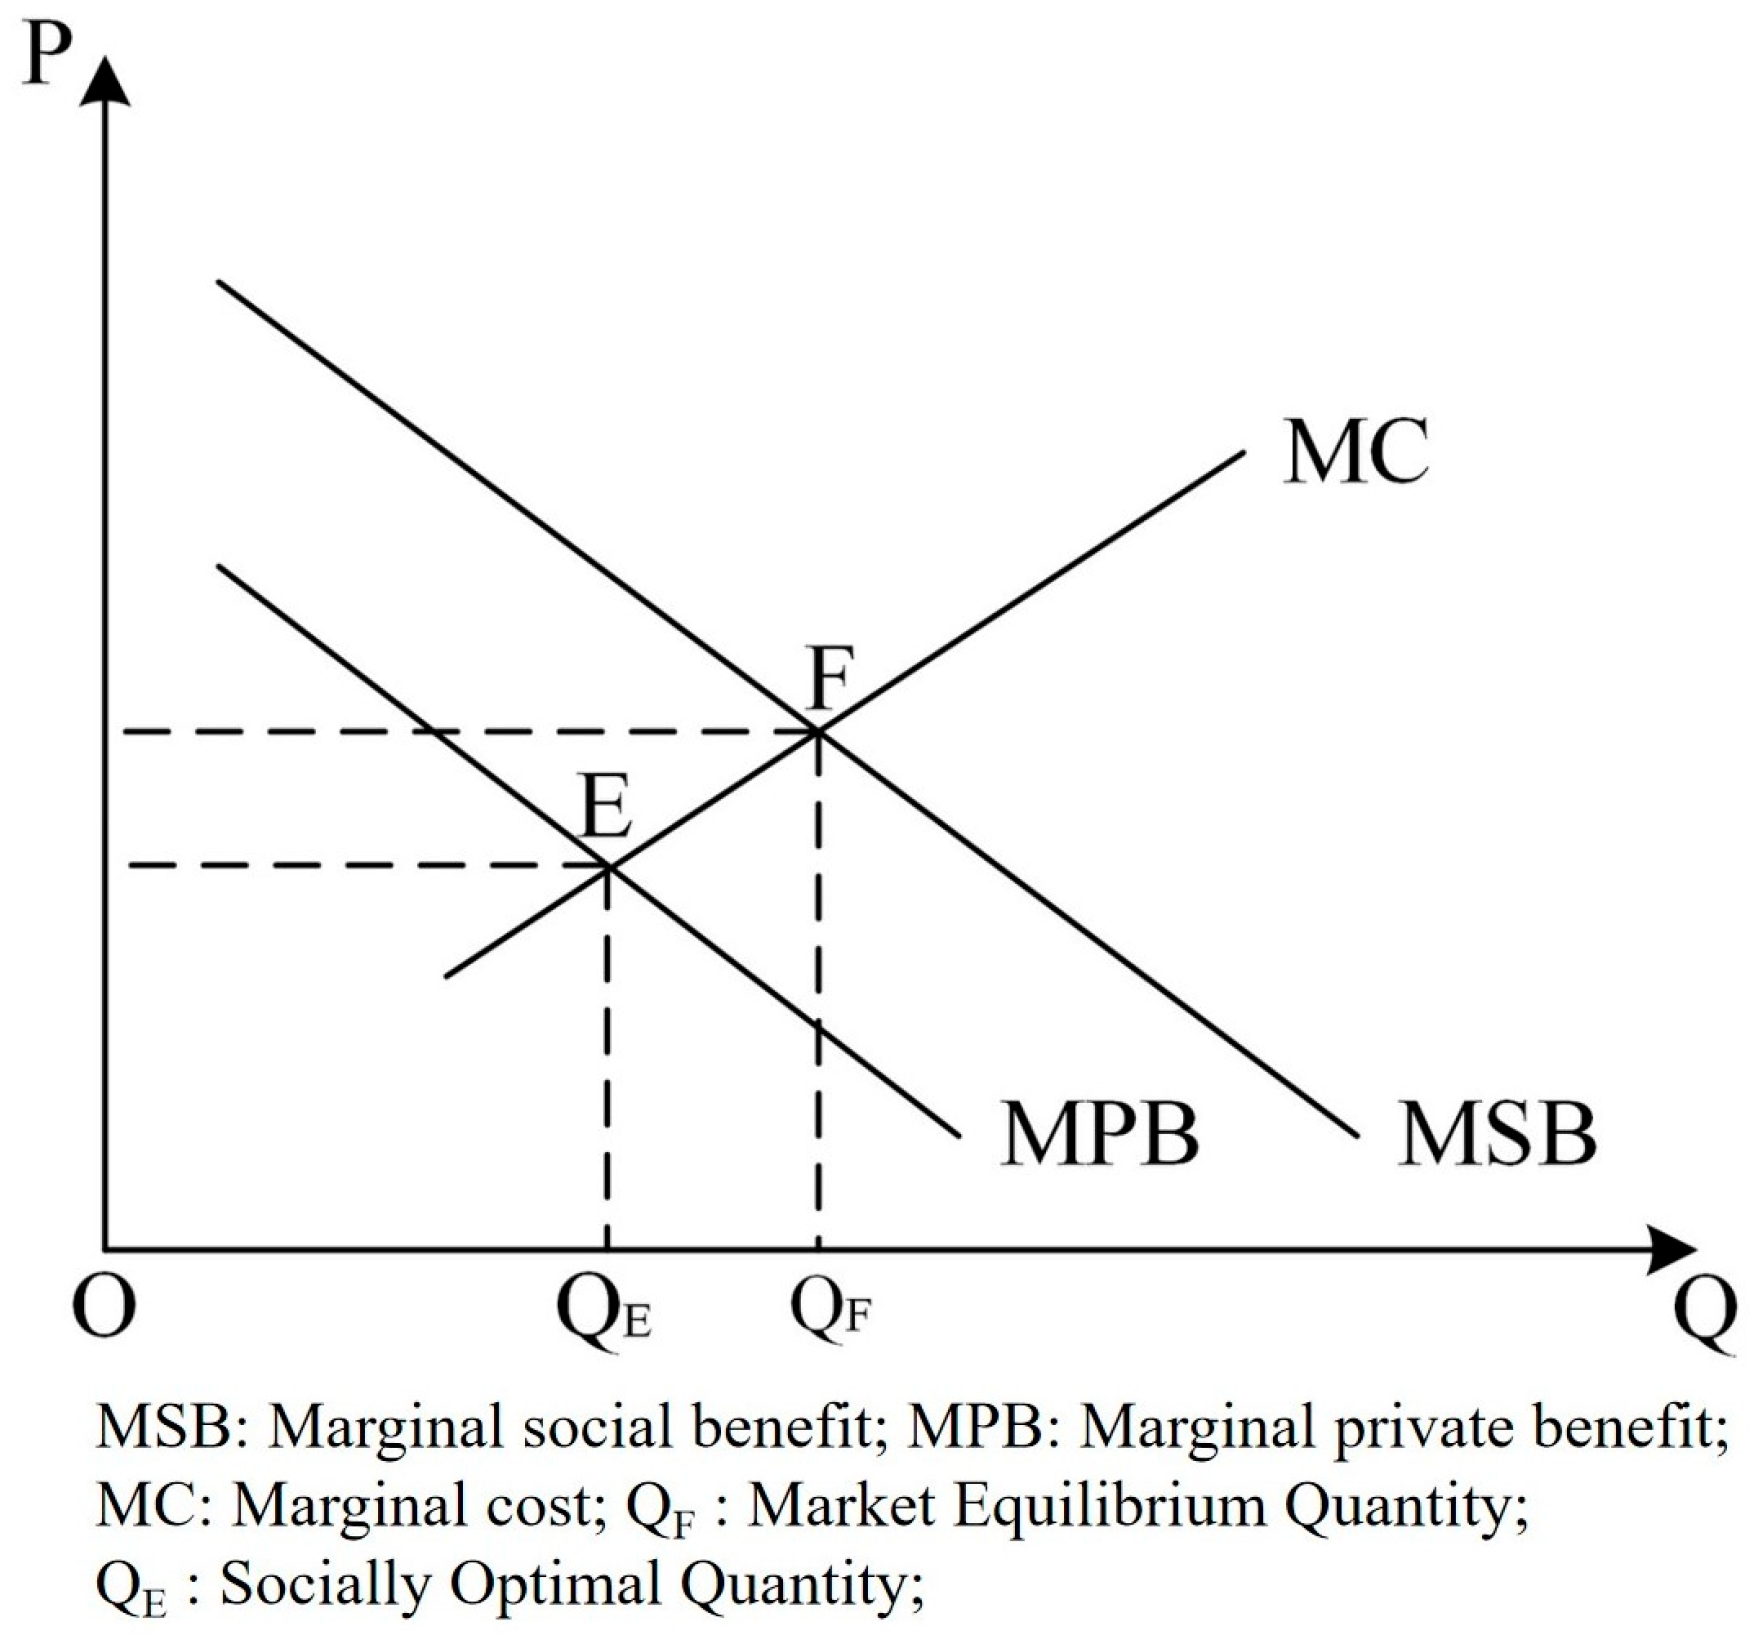
Externalities refer to the impact of economic behavior generated by one microeconomic entity on other microeconomic entities, but this impact is not reflected in market price mechanisms [33,34]. Externalities can be classified as positive or negative according to whether the impact is beneficial or detrimental. HWW water utilization is the typical positive externality behavior, with environmental impacts such as reducing soil-borne salinization and protecting biodiversity. However, this impact is not reflected in the market price mechanism. As shown in Figure 3, owing to the positive externalities of HMMW utilization, MSB is greater than MPB. Based on the principle of MC = MPB, the QE is significantly lower than QF. As a result, the enthusiasm for HMMW utilization will decrease, which will make it difficult to achieve maximum social welfare and Pareto optimality.

2.2.2. System of Integrated Environmental and Economic Accounting

System of national economic accounting (SNA) is a systematic national economic accounting based on the theoretical methods of mathematics, statistics, and accounting, and is a sophisticated theoretical system for portraying economic activities. The system of environmental–economic accounting (SEEA) is an extension of SNA to include environmental and resource accounts [30,35]. The environmental protection activities in the SEEA refer to the protection of all resources and the environment [36,37]. Pollution reduction, environmental protection industry, and environmental expenditure constitute the accounting scope of environmental protection activities in China [38]. Pollution reduction is the basis for analyzing the environmental benefits of environmental protection activities and an important component of environmental benefits accounting. Therefore, the environmental benefits of HMMW utilization can be achieved through pollution reduction.

2.2.3. Green GDP Accounting

The concept of Green GDP was formally introduced in SEEA1993, it has roughly gone through two phases: the Green GDP 1.0 and the Green GDP 2.0 [39]. The Green GDP 1.0 is characterized by the deduction of GDP, that is, to deduct the cost of environmental pollution and ecological losses caused by economic activities from GDP [40,41]. The representative view of Green GDP 1.0 is to extend SNA and account for protective expenditures, resource depletion, and environmental degradation. As people pay more attention to the ecological environment and invest more in environmental protection, many scholars believe that GDP should be additive, thus entering the green GDP 2.0 stage, thus entering the green GDP 2.0 stage [42]. Miankun Yang proposes the formula for green GDP, which is equal to GDP plus exogenous economic factors, minus exogenous diseconomies.

2.2.4. Input–Output Method

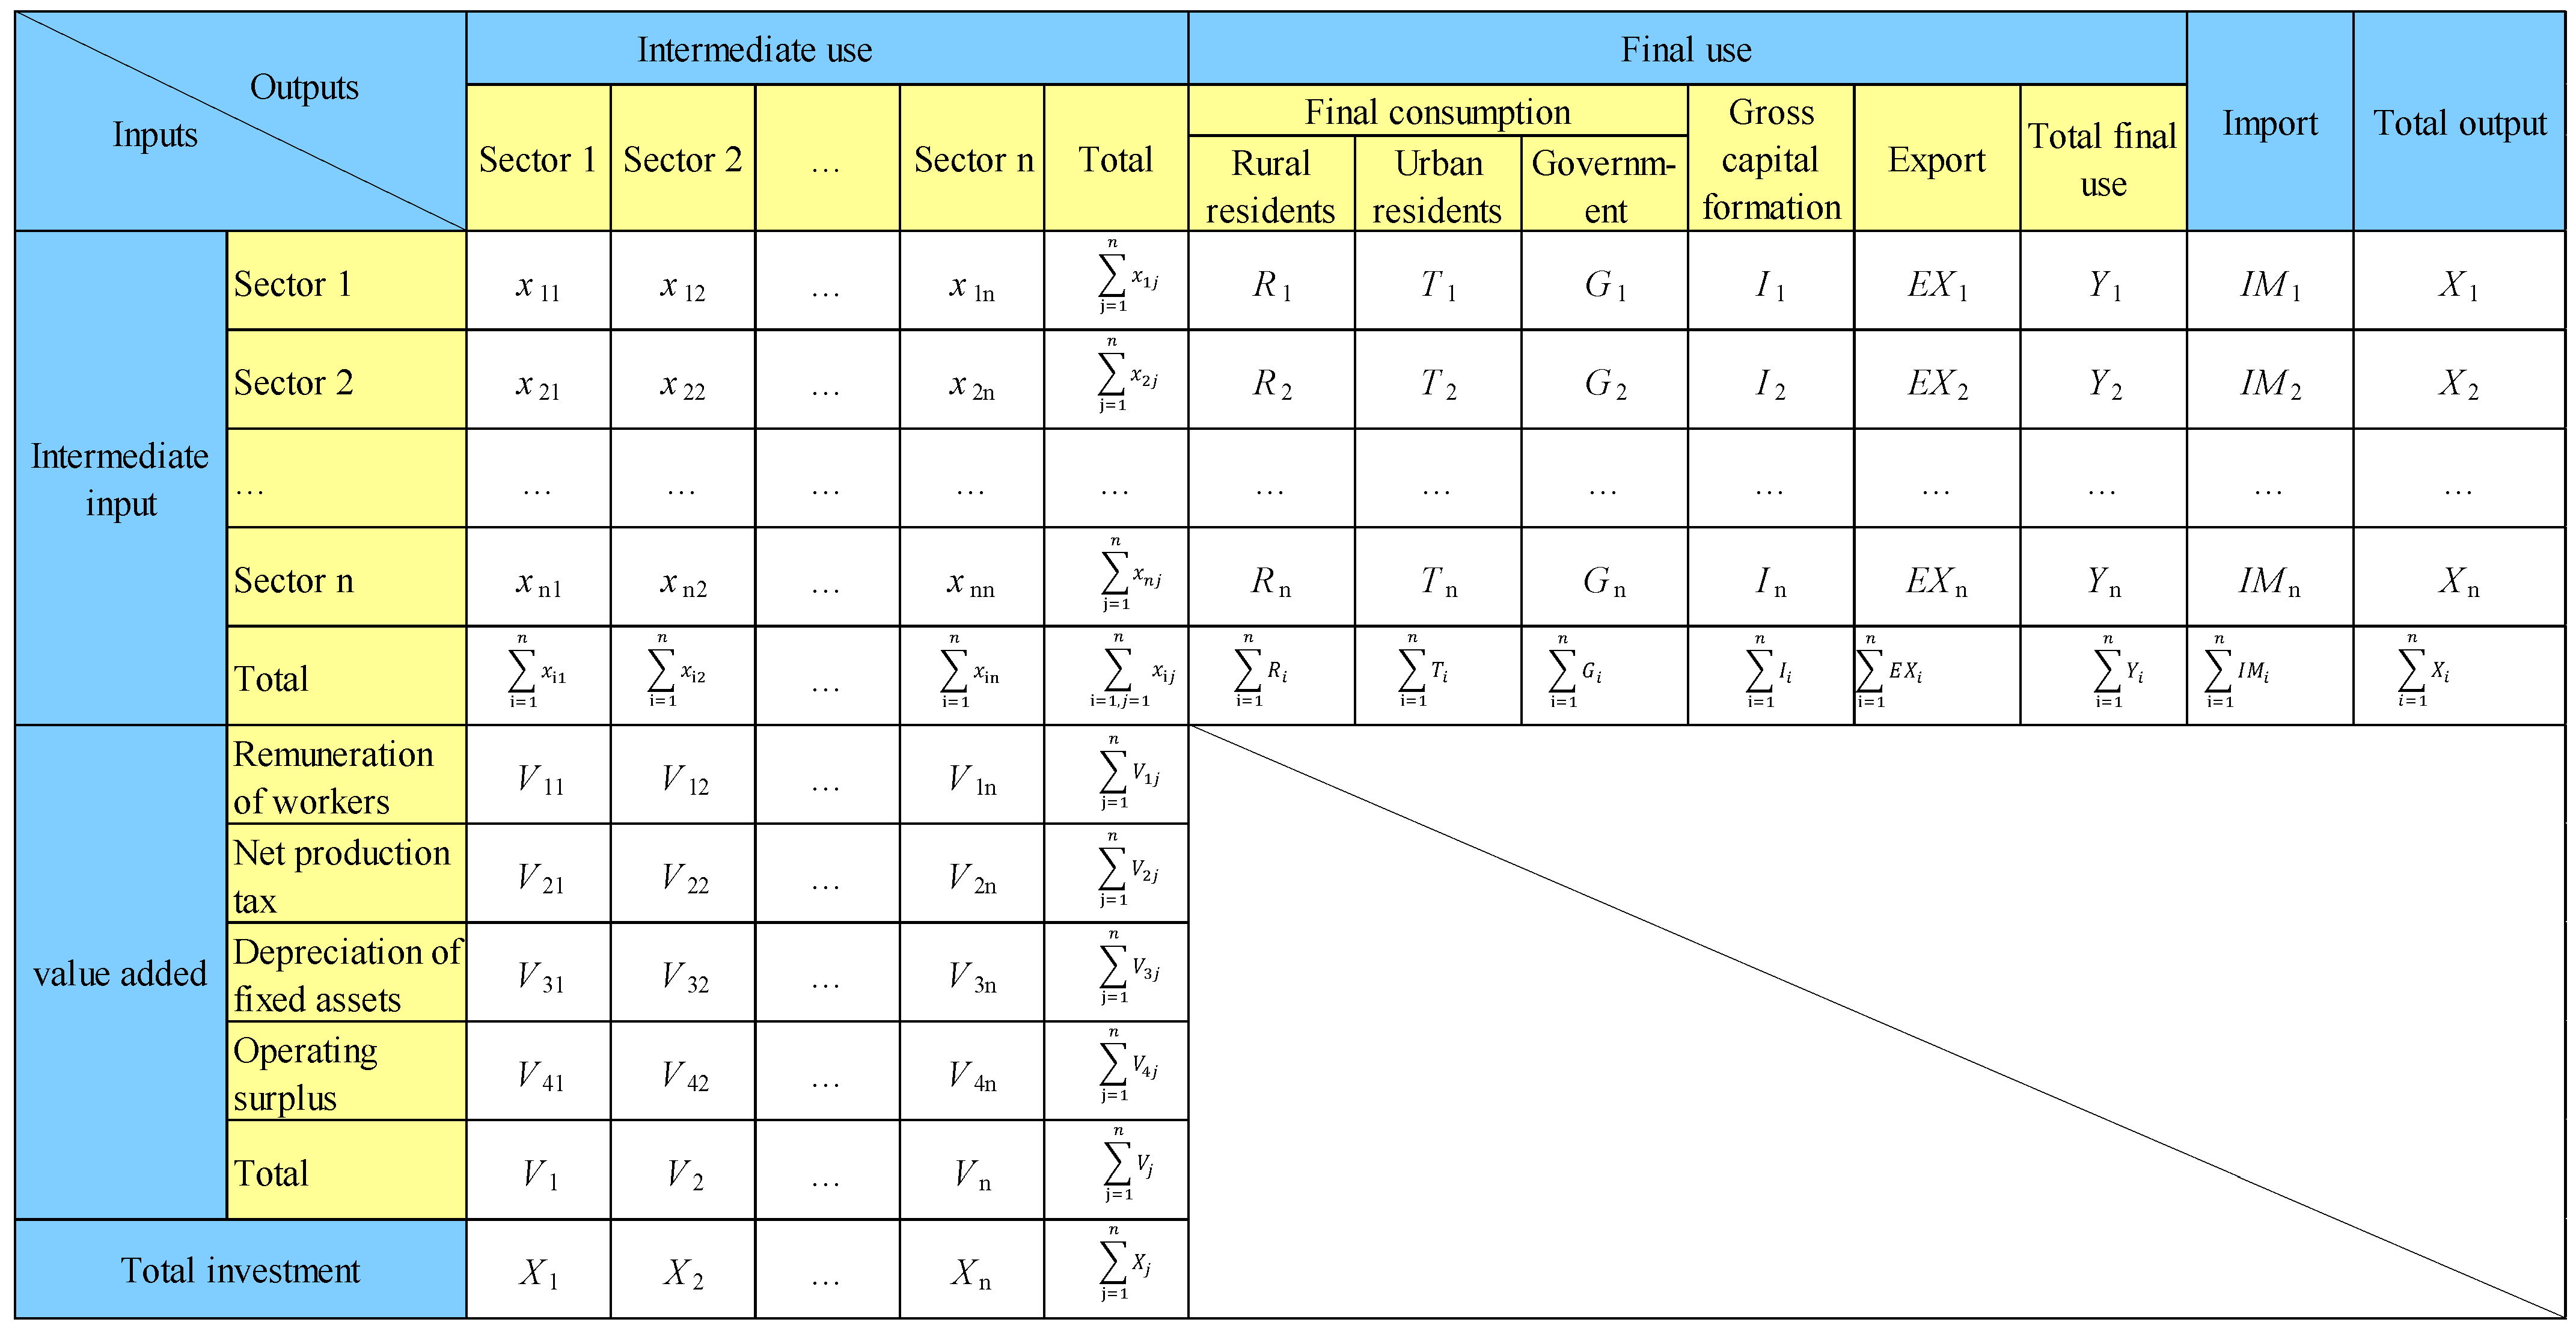
The input–output analysis includes three parts: the preparation of the input–output table, the establishment of the input–output model, and the economic forecasting analysis [43,44]. The input–output table is the core of conducting input–output analysis and is the basis of the input–output model [45]. The vertical direction represents various inputs required by each sector of the national economy in its production process, referring to the “inputs” in the input–output table, which include initial and intermediate inputs. The horizontal direction represents the direction of the products or services produced by the various sectors of the national economy, referring to the “outputs” in the input–output table, which include both intermediate and final use. The crisscrossing of inputs and outputs culminates in a checkerboard table, the input–output table, as shown in Figure 4.
Based on input–output data of various national economy industries and balance formulas, an input–output analysis model can be constructed. It can reflect the exchange relationship between the production of products and production materials, and explain the interdependence in the various national economy industries. The input–output model abstractly describes the economic system, which includes three equilibrium relationships: row equilibrium relationship, column equilibrium relationship, and total equilibrium relationship. It also includes three correlation coefficients: direct consumption coefficient, complete consumption coefficient, and complete demand coefficient.

2.3. Integrated Environmental–Economic Accounting of HMMW Utilization

2.3.1. Refinement of Water Production and Supply Industry

The industry classification in China’s input–output table is based on the <Industrial Classification of the National Economy>. The national economic industries in the input–output table generally include 42 industries, without HMMW industries, only water production and supply industry. According to the industrial classification, the water production and supply industry is divided into the following water sources: tap water, reclaimed water, desalinated seawater, and other water. Therefore, based on the local water supply structure and different water supply costs, this paper will subdivide the water production and supply industry into tap water, HMMW, and other water.
On the one hand, based on the water structure of different industries in the study area, the water production and supply industry in the input–output table row is split. This paper takes the splitting of the HMMW industry as an example. Although there are different ways to utilize HMMW, it is used for production, living, and ecological water in the mining plant and industrial water around the mining area. Therefore, the HMMW after resource utilization is used in industry, while the use in agriculture and services is zero. Collect the HMMW input quantities in different industries and split the HMMW industry from the water production and supply. Following the split methodology for the HMMW industry, the water production and supply industry in the input–output table row is divided into the tap water industry, HMMW industry, and other water industries.
On the other hand, based on the investment of different industries in different water production industries in the study area, the water production and supply industry in the input–output table column is split. This paper takes the HMMW industry as an example. The HMMW production and supply requires civil structures, electromechanical equipment, and gold junction equipment, as well as investment in operating costs such as pharmaceuticals, electricity, and maintenance. Therefore, collect relevant data on the investment of various industries in the HMMW industry, and split the HMMW industry from the water production and supply industry. Following the split methodology for the HMMW industry, the water production and supply industry in the input–output table column is divided into the tap water industry, HMMW industry, and other water industries.
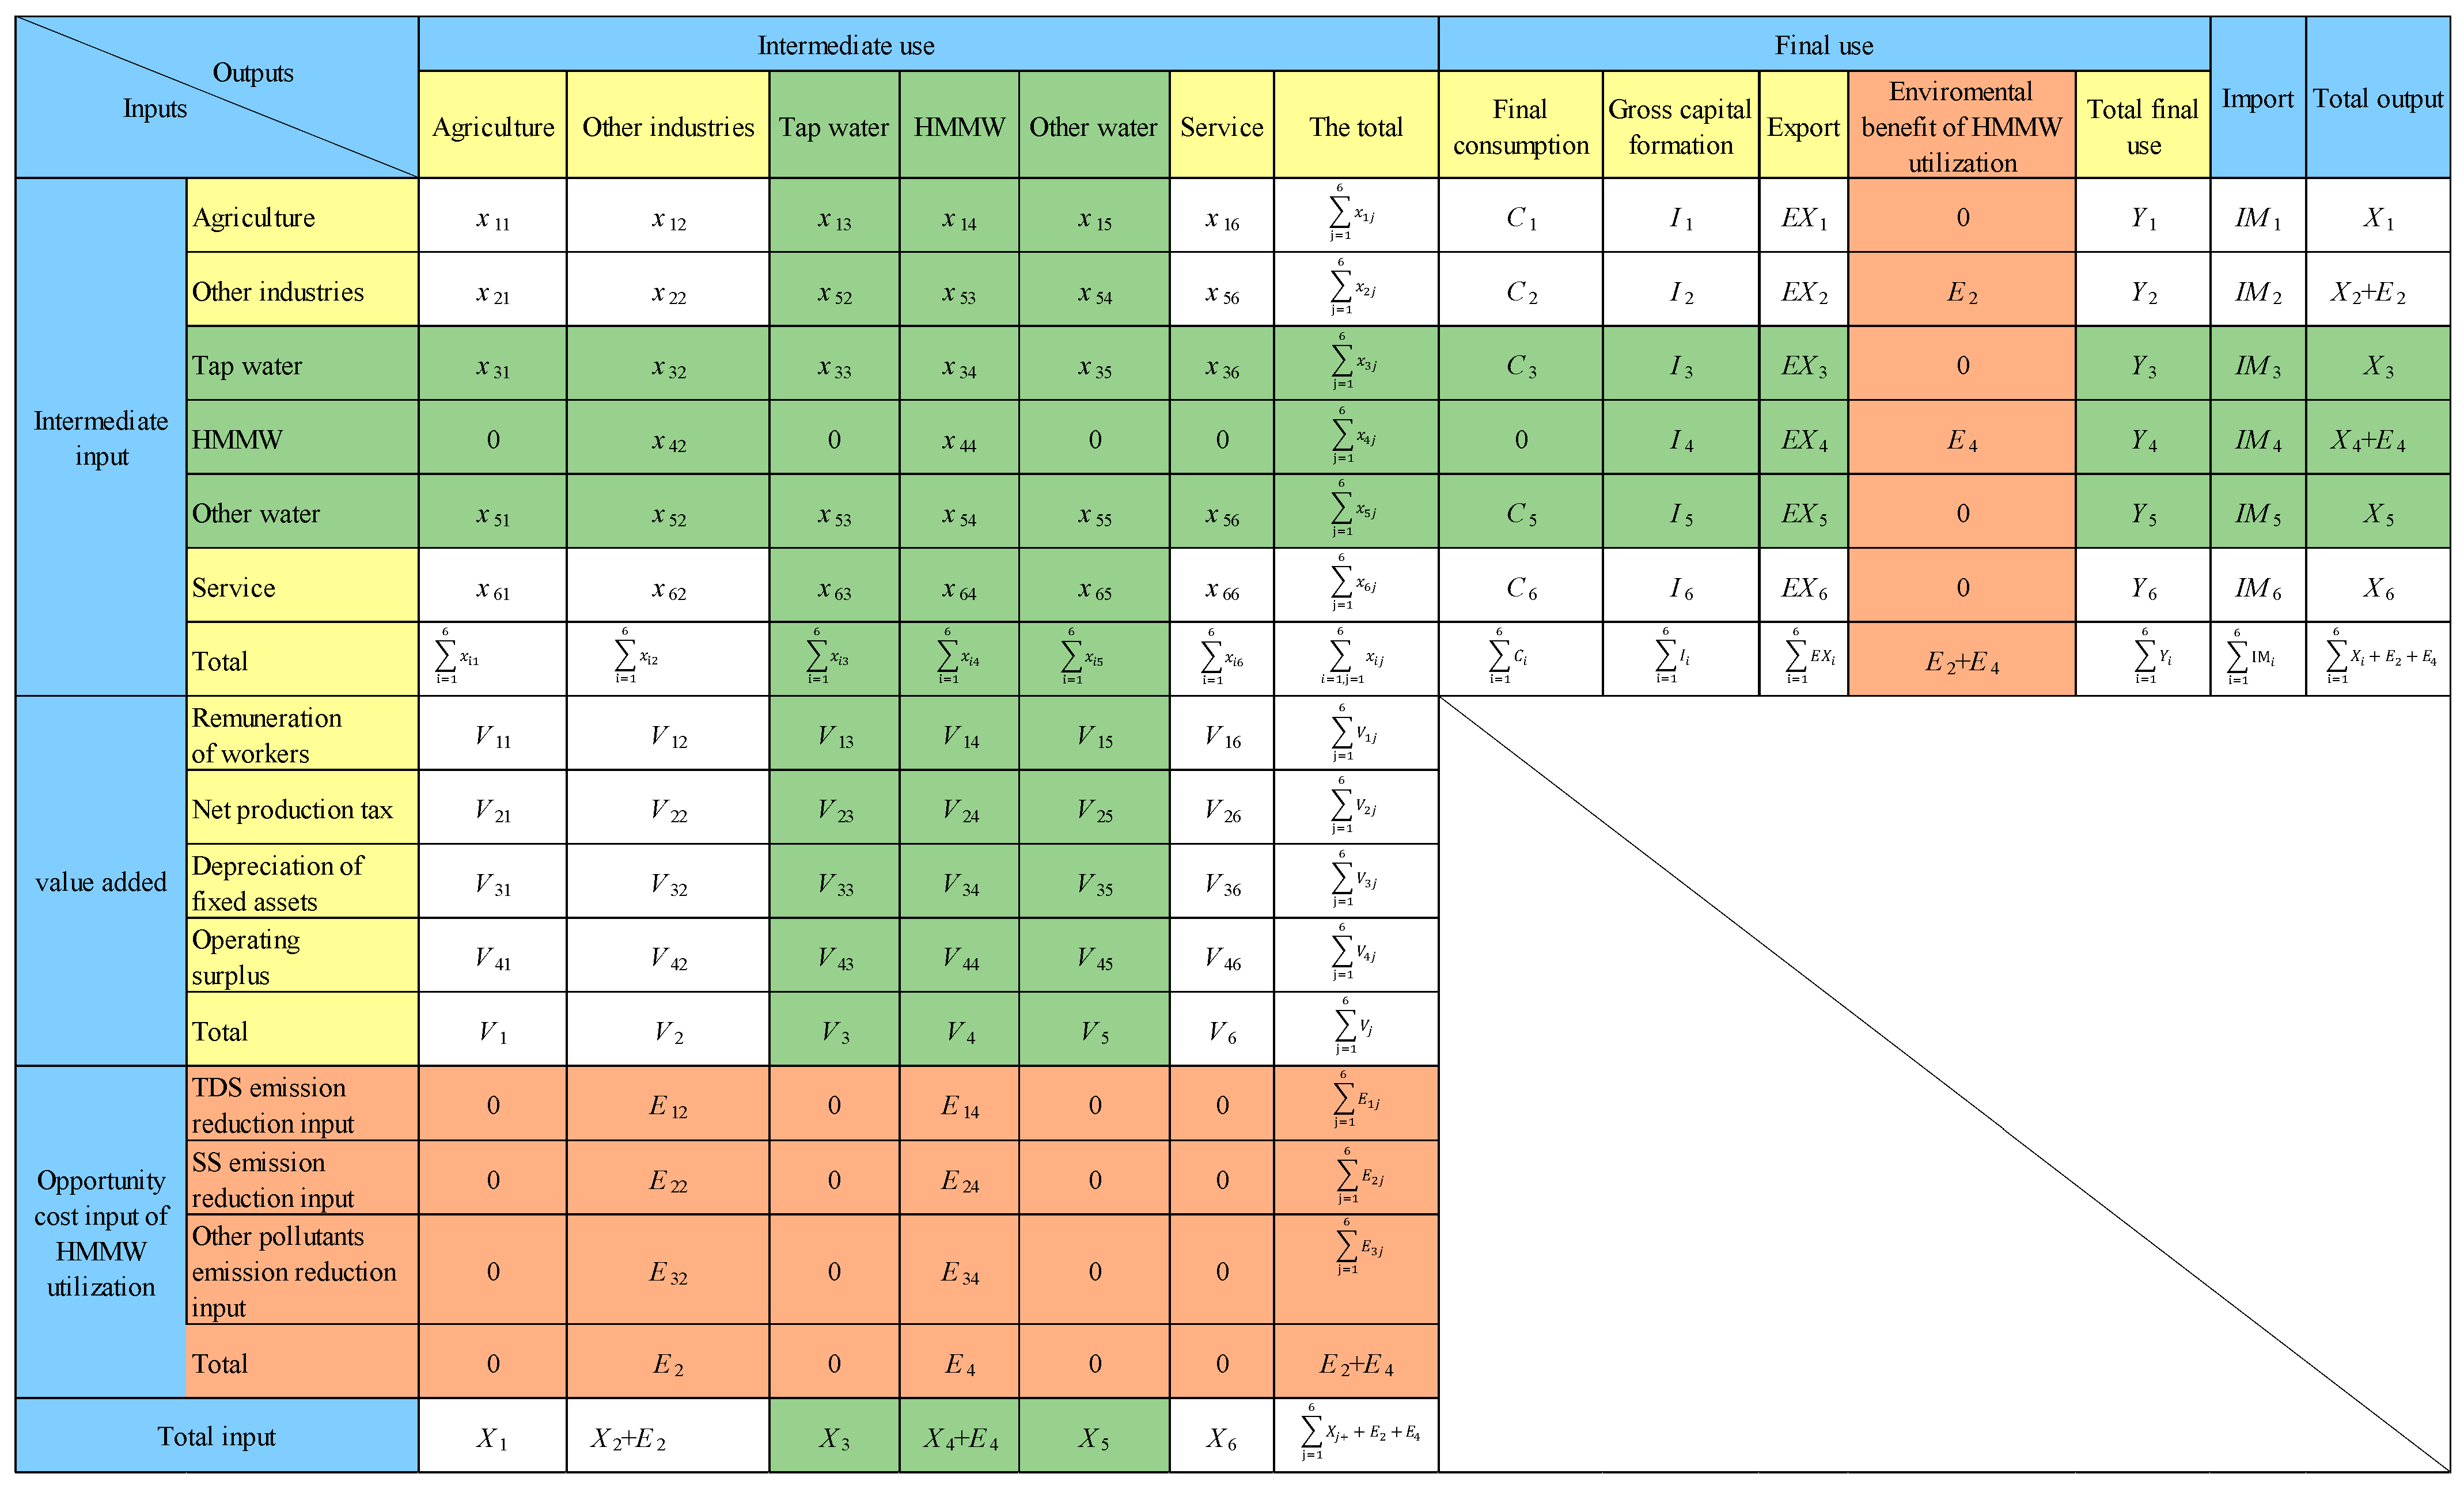
Based on the above splitting steps, the water production and supply industry in the input–output table can be split, as shown in Figure 5.

2.3.2. Environmental Benefits Calculation of HMMW Utilization

HMMW utilization has significant environmental benefits and positive externalities [46]. There are three methods to internalize the externalities of HMMW utilization: direct market method, alternative market method, and survey evaluation method [47,48]. The direct market method includes the productivity change method, the opportunity cost method, the reset cost method, the disease cost method, and the preventive expenditure method. The alternative market methods include the wage differential method, the travel expense method, and the asset value method. The direct market method is relatively objective, but it needs sufficient physical quantity or price information as the basis. The data and information required for alternative market methods are influenced by various complex and diverse factors, resulting in low credibility. The credibility of the alternative market method is relatively low since the data it requires are influenced by various complex and diverse factors. The credibility of the survey evaluation method is the worst because it is based on the respondent’s declared willingness, it does not reflect their true intentions.
The environmental benefits generated by the utilization of HMMW can be broadly categorized as follows: ① Alleviating the possibility of soil salinization. ② Mitigating the risk of damaging biodiversity. ③ Reducing the possibility of destructing natural landscape. At present, it is very difficult to directly calculate each environmental benefit generated by the utilization of HMMW, mainly for the following three reasons: ① Obtaining data is very difficult. ② There is a possibility of duplicate calculations. ③ It is difficult to list all the environmental benefits that the utilization of HMMW has on the surrounding environment. Therefore, it is feasible to evaluate the overall environmental benefits as a whole, equating them to the environmental pollution that would occur if the pollutants of HMMW are not treated and directly discharge. The cost of removing these pollutants can be assessed through the opportunity cost method under the direct market approach. The pollutants of HMMW are TDS, SS, and a few other pollutants such as COD, TP, and bacteria. According to the opportunity cost method, the environmental benefits of HMMW utilization are equal to the cost of removing TDS, SS, and other pollutants in the HMMW, as shown in Equation (1).
B e = C T D S + C S S + C O T H C T D S = c T D S × ρ T D S × Q C S S = c S S × ρ S S × Q C O T H = c O T H × ρ O T H × Q
In the formula: B e is the environmental benefits of the HMMW utilization; C T D S , C S S and C O T H are the costs of removing TDS, SS, and other pollutants, respectively; c T D S , c S S and c O T H are the cost of removing per unit mass of pollutants TDS, SS, and other pollutants, respectively; Q is the amount of HMMW used.

2.3.3. Integrated Environmental–Economic Accounting

In the SEEA system, environmental benefits accounting is based on pollutant emission reduction. Regarding the accounting of pollutant emission reduction, most domestic and foreign research reflects it by adding quadrants to the original input–output table. It belongs to the physical value input–output table, in which the pollution emission reduction adopts the physical quantity. Unlike SEEA’s accounting for pollutant reductions, environmental benefits accounting of the HMMW utilization in this paper belongs to value accounting. Therefore, the integrated environmental–economic accounting adopts the value input–output table, rather than the physical value input–output table. The SEEA system can be used as a reference for the integrated environmental–economic accounting of the HMMW utilization. The environmental benefits of HMMW utilization are based on externality theory, which can solve the problem of externalities of HMMW utilization. It can make the economic operation as far as possible to achieve Pareto optimality and realize the maximization of social welfare.
Based on the design of the input–output model of energy conservation and emission reduction in China [30,37], this paper adds the column of “environmental benefits of the HMMW utilization” in the second quadrant of the original input–output table, reflecting the environmental benefits generated by the HMMW users. The environmental benefits of HMMW utilization are mainly generated by the HMMW users; therefore, it is only economically relevant to the HMMW users. At present, HMMW is used in industry but rarely used in agriculture and services. Therefore, the environmental benefits of HMMW utilization are generated by industry. In this way, GDP becomes green GDP, or EDP, with the addition of accounting for environmental benefits.
To balance the above environmental–economic input–output table of the HMMW Utilization, the opportunity cost input quadrant of HMMW utilization is inserted into the third quadrant of the table. The opportunity cost input quadrant of HMMW utilization is mainly to balance the environmental benefits of HMMW utilization in the input–output table, which contains three parts of inputs: TDS emission reduction inputs, SS emission reduction inputs, as well as other pollutant emission reduction inputs. From this, the environmental economic input–output table of HMMW utilization can be obtained, as shown in Figure 5.

2.4. Study Area

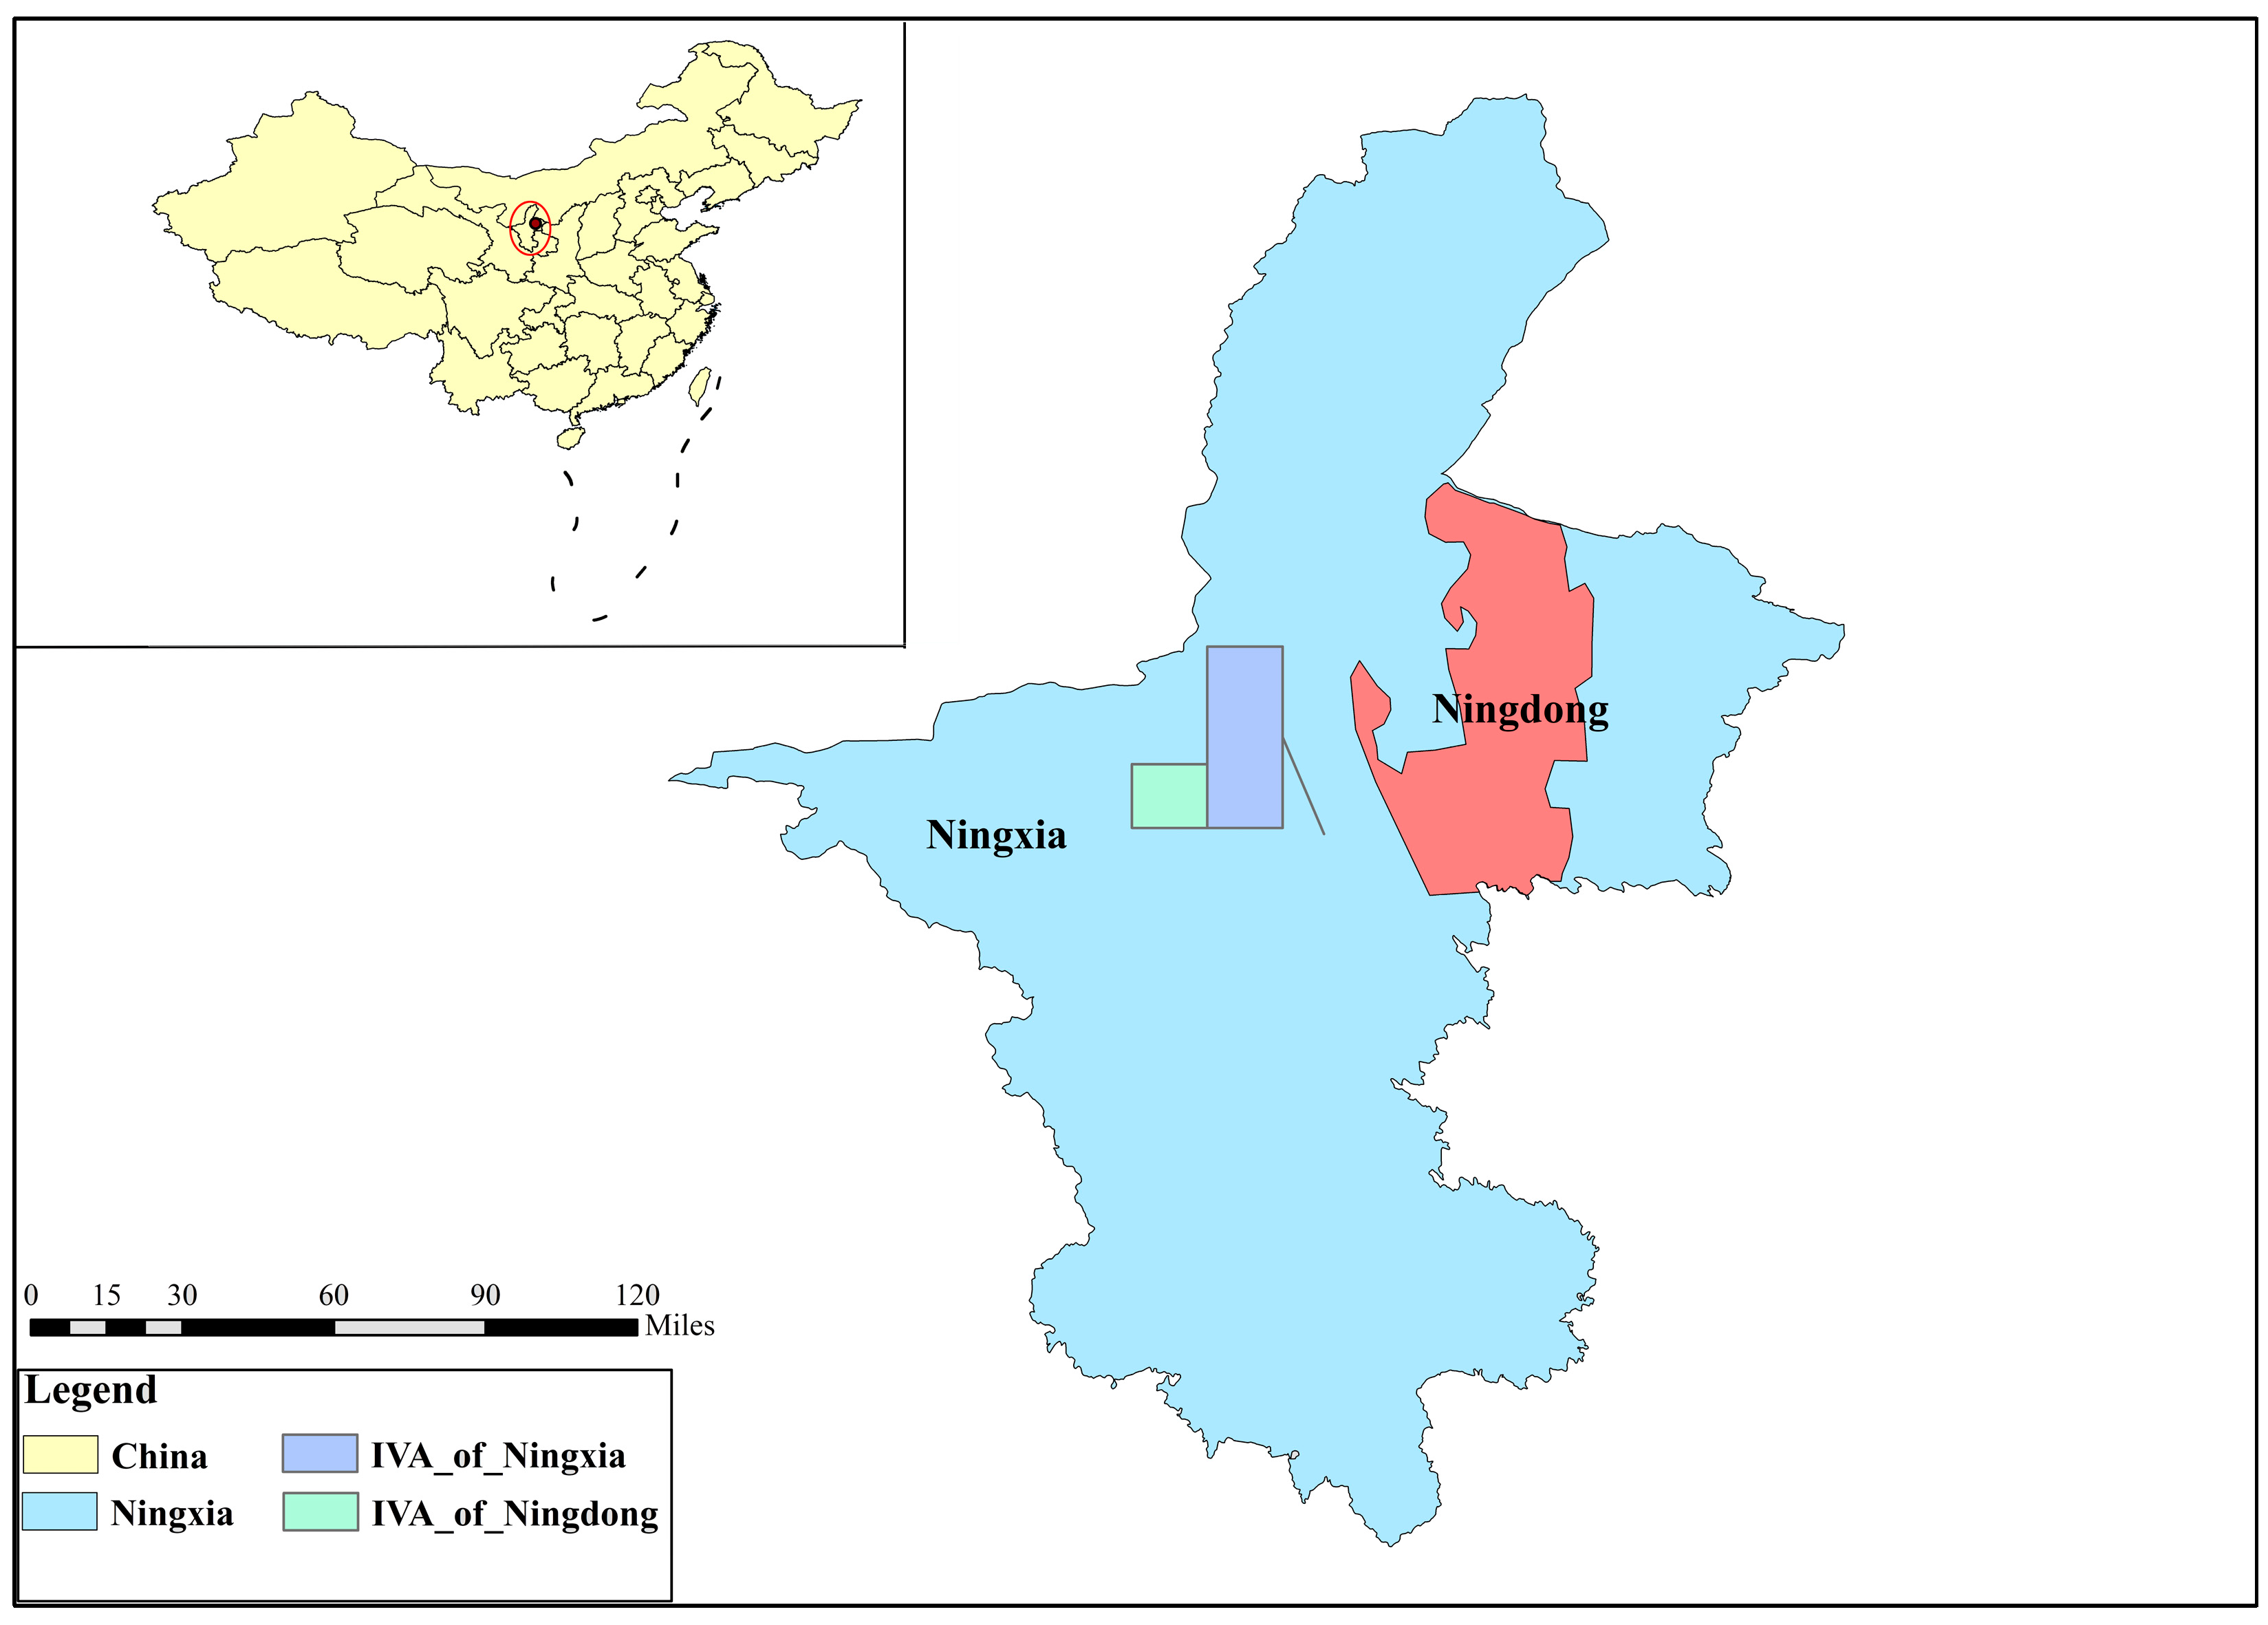
Located in the arid region of northwest China -Lingwu City, Ningxia, Ningdong Energy Chemical Industry Base (NECI Base) is an important energy base. It acts as a primary catalyst driving the economic and social growth of Ningxia., and its total industrial output value and industrial added value account for about 1/3 of Ningxia, as shown in Figure 6.

2.4.1. Water Consumption

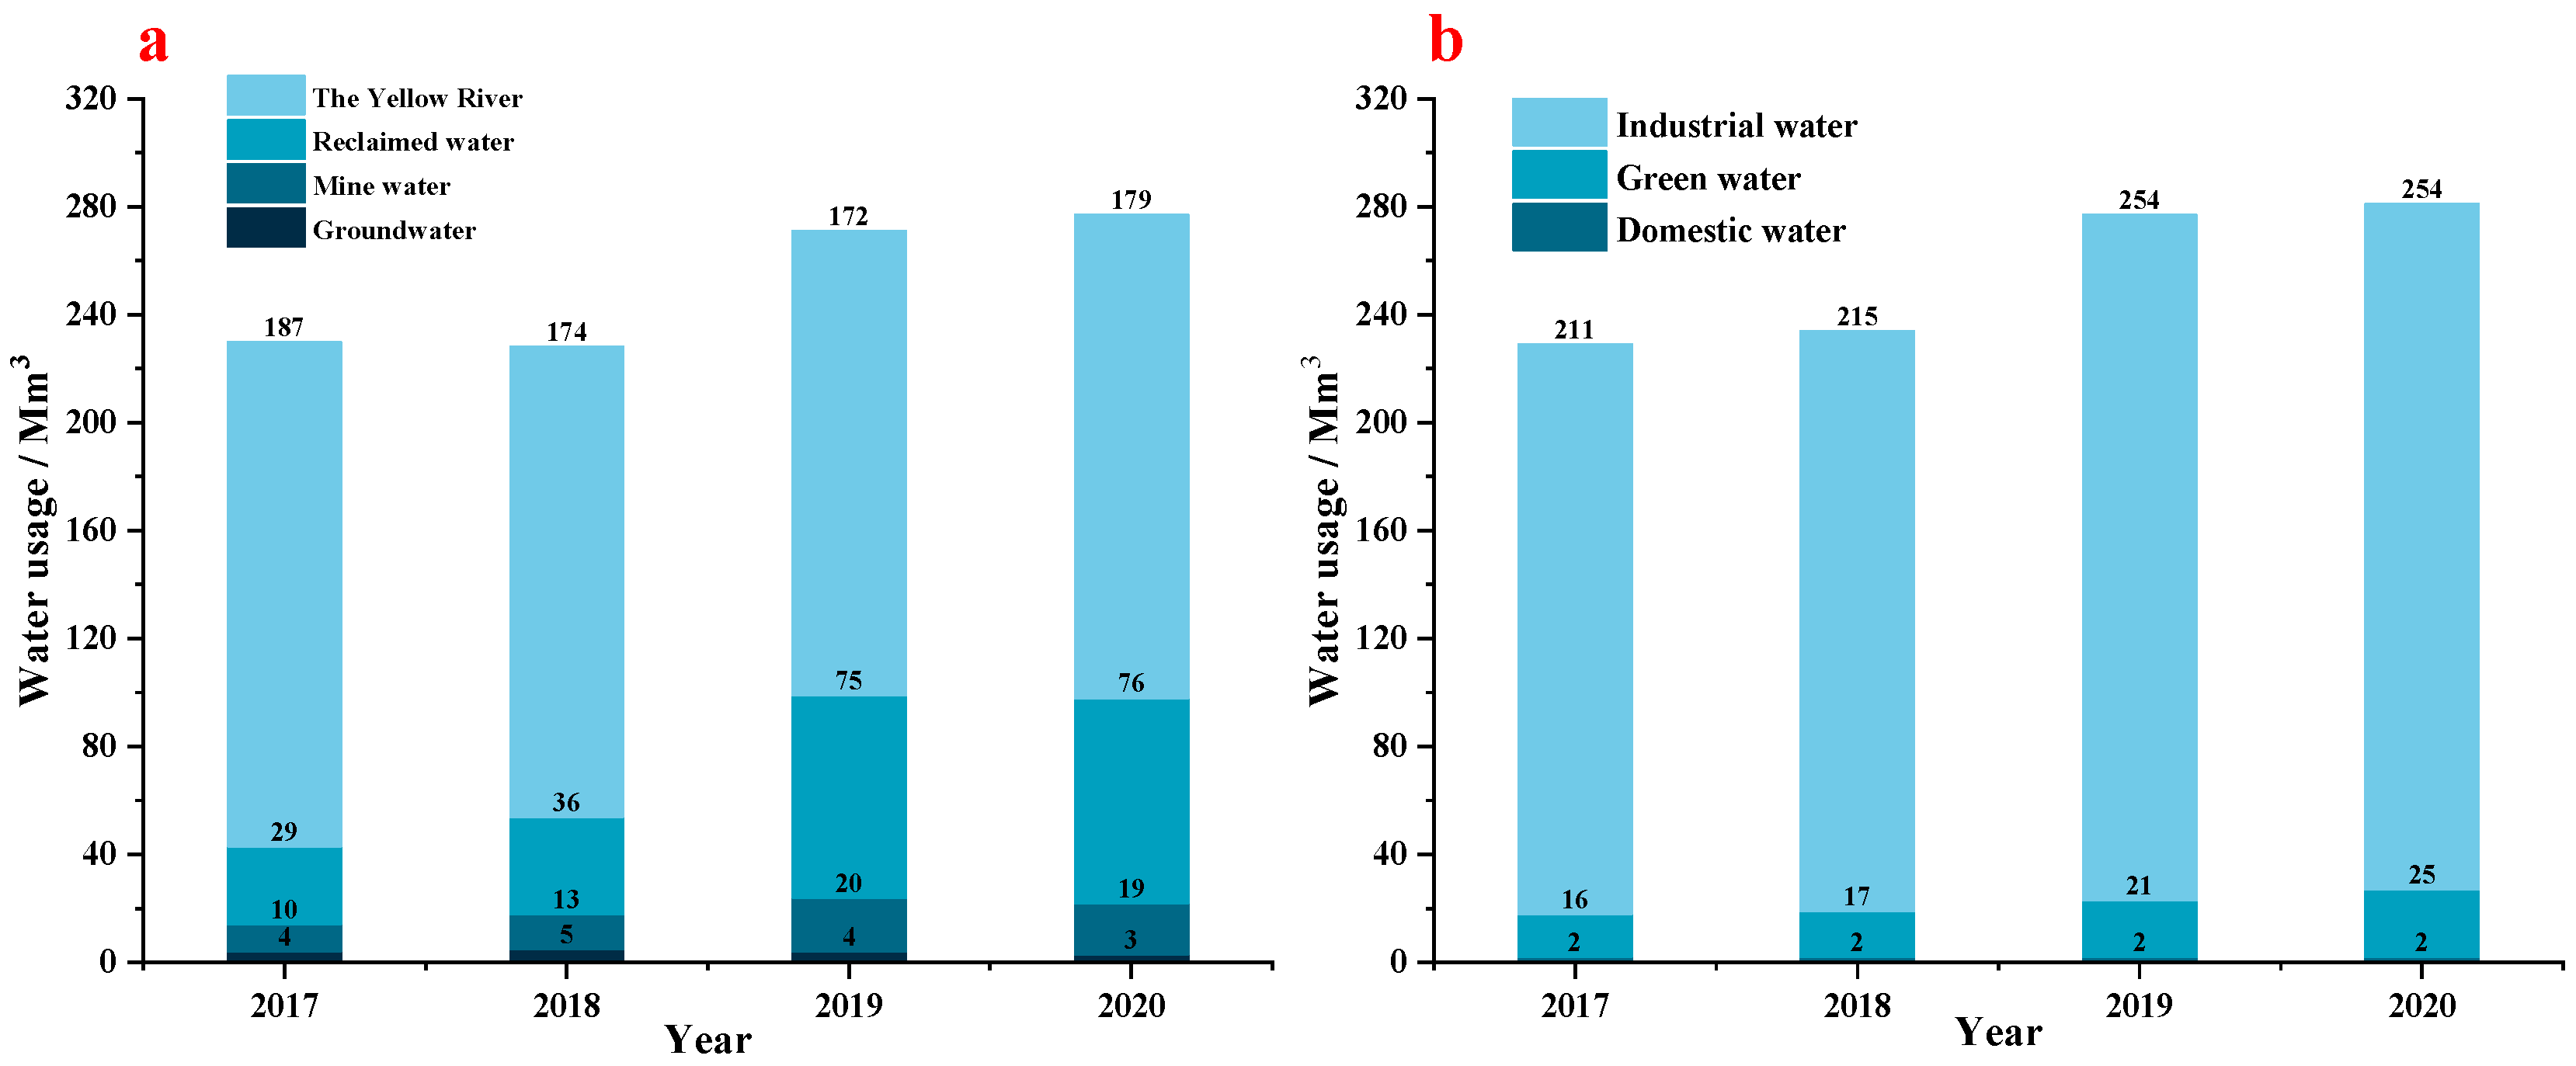
The water consumption structure in the NECI Base consists of four types: Yellow River water, recycled water, high mineral water, and groundwater. The total water consumption of these four sources is increasing, as shown in Figure 7a. The Yellow River water consumption is the largest, about 180 Mm3 per year. The recycled water consumption has doubled since 2018, about 76 Mm3, and the utilization rate reaches 100%. The HMMW consumption changes little, with a utilization of about 20 Mm3, and a utilization rate of about 30%. The HMMW is reused in power plants, coal mining, and the coal chemical industry, and the untreated part is discharged into ecological rivers and lakes. Groundwater has the lowest water consumption and is mainly used for domestic purposes. Industrial water consumption represents the dominant water use in NECI Base, exceeding 90% of the total. In contrast, domestic and greening uses represent a minor share, comprising less than 10% (Figure 7b).

2.4.2. Water Cost

There are three major Yellow River water supply projects in NECI Base, and the water supply price of each project is different, as shown in Table 1. At present, the Ning Coal HMMW Zero Discharge Project constructed by China Energy has achieved zero discharge of the HMMW, but its processing cost data is lacking. Therefore, this paper refers to Xiao Yan’s survey data on the cost of the zero discharge treatment process for the HMMW, which is similar to that of the Ning Coal project. The direct operating cost of HMMW treatment is 8.2 CNY/m3, and the comprehensive operating cost of 10.3 CNY/m3. Recycled water comes from two parts: domestic sewage and industrial wastewater. The cost of treating domestic wastewater is 3.0 CNY/m3, and the cost of treating industrial wastewater is 15.0 CNY/m3.

2.4.3. HMMW Quality

The unutilized HMMW in NECI Base is discharged into South Lake for storage. The TDS is about 7658.40 mg/L, the SS is about 22.33 mg/L, and other main pollutants: COD is about 33.43 mg/L and TP content of 0.12 mg/L in Nanhu Lake.

3. Results

3.1. Economic Data Sources and Processing

According to the Ningxia’s input–output table in 2017, and the current industrial structure and planning in the NECI base, this paper consolidates the industries in Table 2 and forms the Ningxia’s 12–industry input–output table.
The industrial gross output value and value-added in NECI Base are obtained, as shown in Table 3. According to the data in Table 3 and the ratio of the NECI Base to the corresponding industries in the Ningxia, the coal mining and chemicals, thermal power generation, new materials and other industries in the Ningxia’s 12-industry input–output table are scaled. For the economic data of other industries in NECI Base, such as agriculture, construction et al., this paper will take the statistics in the Lingwu city as the basis. The Ningxia’s 12-industry input–output table are scaled according to the ratio of the NECI Base to the corresponding industries in the Ningxia. In addition, the inflow mainly comes from areas outside of the Ningdong base in China. Therefore, this paper combines “imports” and “inflow from areas outside of the Ningdong base” into one sector.

3.2. Water Production and Supply Industry Split

On the input side. Firstly, most of the HMMW in NECI Base is input to the Coal industry and Coal-fired power industry, a small part of it is self-used in the HMMW industry, and the input to the rest of the industry is 0. Secondly, all recycled water processed by enterprises is input to coal mining and chemical industries. Recycled water processed by the public plant is input to greening. A small amount of recycled water is used for the production of recycled water, and the input to other industries is 0. Finally, the input of the Yellow River water to the Coal industry, Coal-fired power industry, Fine chemical industry, and other industries is based on its actual usage value. The input of the Yellow River water to other industries can be obtained by deducting the input of recycled water and HMMW from the water production and supply industry. Therefore, the water production and supply industry in the horizontal input–output table can be divided into Yellow River water, HMMW, and recycled water. The input of different water sources to the industry of NECI Base is shown in Table 4.
On the demand side, The Yellow River water, HMMW, and recycled water industries need inputs from various industries. Due to the lack of relevant data on the inputs, this paper will split the water production and supply industry according to the input coefficients of the water production and supply industry in Ningxia’s input–output table. Based on the total output value of the Yellow River water, HMMW, and recycled water, combined with input coefficients, the water production and supply industry is split.
From this, the input–output table of 14 industries in NECI Base can be obtained, but the table is not in an equilibrium state. Therefore, this paper uses the RAS method to balance the table based on ensuring the accuracy of the economic and water use data of industries.

3.3. Environmental Benefits Accounting

The environmental benefits of HMMW utilization includes three parts: TDS emission reduction input, SS emission reduction input, and other pollutants emission reduction input. The calculation formula is adopted as Equation (1). Where the cost of removing a unit mass of pollutants is taken from Li Junqi’s research [49], and the concentrations of various pollutants are taken from the HMMW quality discharged into Nanhu Lake, as shown in Table 5. Based on the parameters in Table 5, combined with the amount of HMMW utilization by different industries in NECI Base, the environmental benefits are calculated as shown in Table 6.
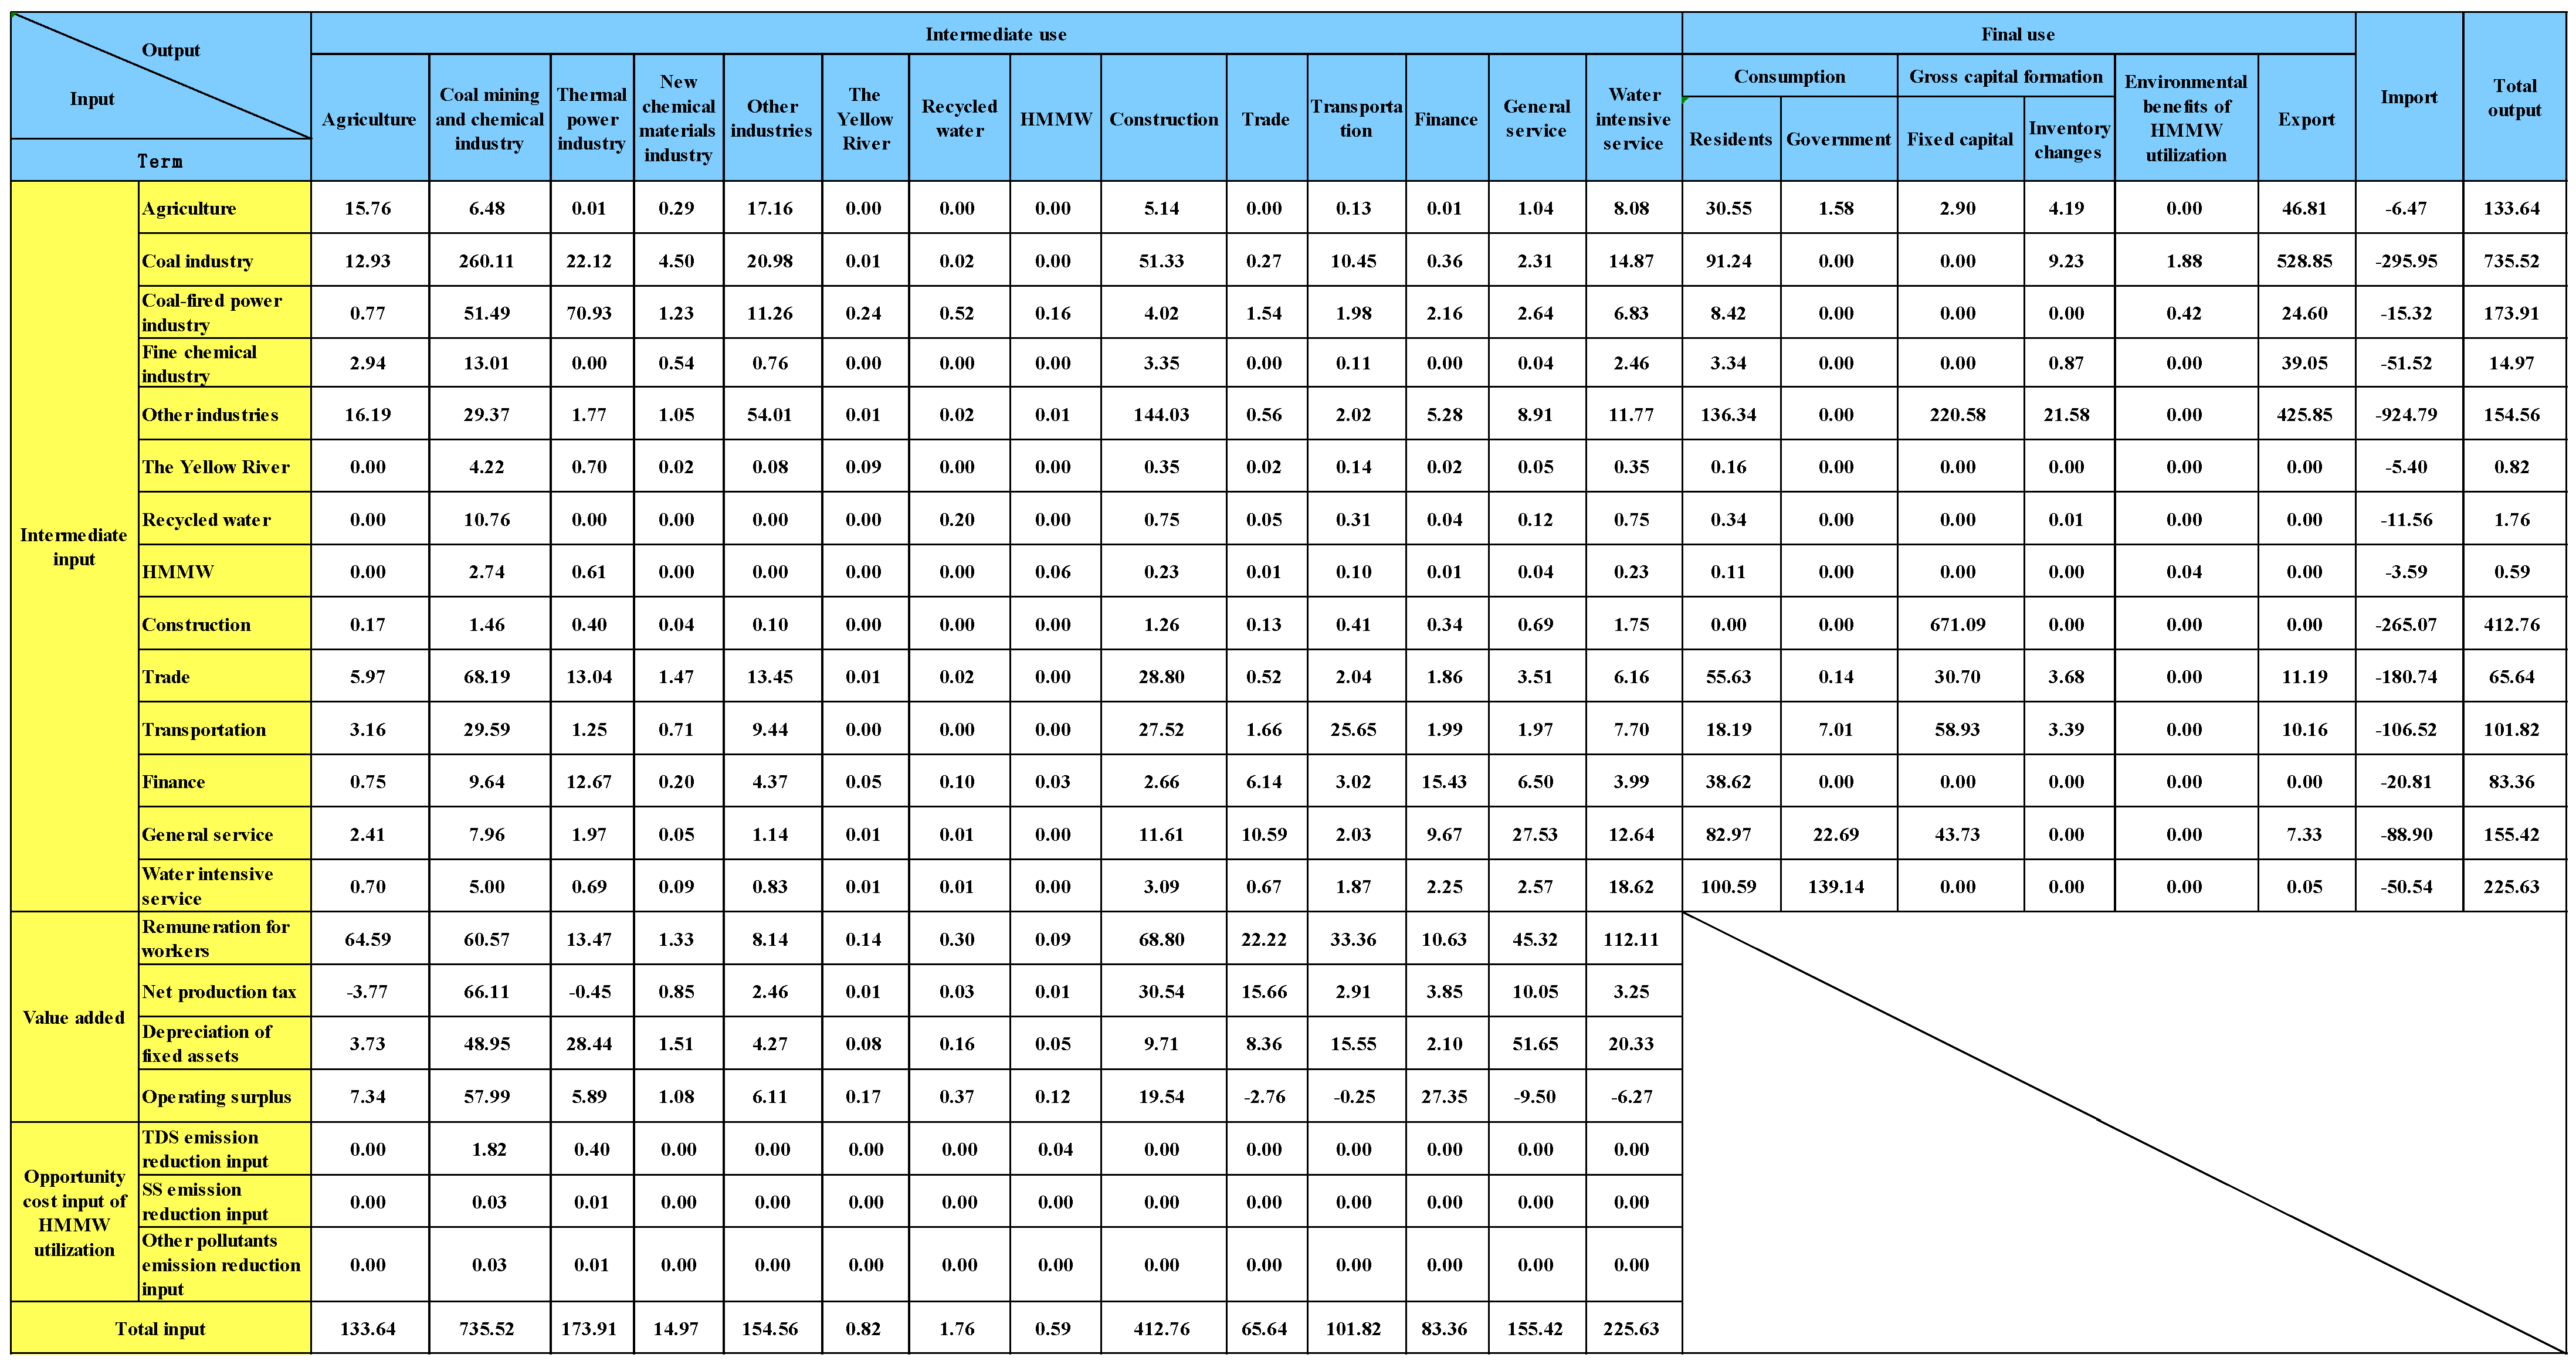
The column “Environmental benefits of HMMW utilization” is added in the second quadrant, the GDP adds the accounting of environmental benefits and becomes green GDP, which is referred to as EDP in this paper. To ensure the balance of the environmental economic input–output table of HMMW utilization, the opportunity cost input of HMMW utilization is inserted into the third quadrant. The environmental benefits of HMMW utilization are equal to the opportunity cost input of HMMW utilization; therefore, the input–output table remains balanced. Finally, the environmental economic input–output table of HMMW utilization in NECI Base is shown in Figure 8.

4. Discussion

There are two main verifications on the environmental economic input–output table of HMMW utilization in NECI Base: the input–output balance verification and the verification of environmental benefits of HMMW utilization.

4.1. Input–Output Balance Verification

According to the input–output theory, the final environmental–economic input–output table of HMMW utilization in NECI Base needs to satisfy row balance, column balance, and total balance. The balancing process in this study follows established methodologies for the establishment of input–output table [38]. It can be calculated that the environmental economic input–output table of HMMW utilization in NECI Base satisfies row balance, column balance, and total balance.

4.2. Verification of Environmental Benefits of HMMW Utilization

The balance verification of the environmental benefits of HMMW utilization is an important basis for checking whether the environmental benefits of HMMW utilization are integrated into the environmental economic input–output table of HMMW utilization. Firstly, the environmental benefits of HMMW utilization are 234 M CNY, which is equal to the opportunity cost input of HMMW utilization, meeting the overall input–output balance. This approach aligns with the opportunity cost method applied in environmental accounting studies [14,17]. Secondly, the TDS emission reduction input (226 M CNY) + SS emission reduction input (4 M CNY) + other pollutants emission reduction input (4 M CNY) is equal to the opportunity cost input of HMMW utilization (234 M CNY). It means that the verification of environmental benefits of HMMW utilization passes, and the environmental economic input–output table of HMMW utilization in NECI Base finishes the integrated environmental–economic accounting of HMMW utilization. This outcome is consistent with the principles of input–output modeling where balance is a fundamental criterion for validating the structure of the economic system [22,27].

4.3. Limitations and Considerations for Future Applications

Although the integrated environmental–economic accounting framework established in this study yielded balanced and reasonable results for the case of the NECI Base, several limitations should be acknowledged to guide future applications and studies:
(I) Data Availability and Representativeness: Key parameters in this study are partially sourced from literature rather than local measured data, such as unit cost of pollutant removal. This may introduce uncertainties due to regional differences in technological levels and cost structures. Future studies should prioritize using localized, project-specific data to enhance accuracy.
(II) Methodological Assumptions: The opportunity cost approach, which equates environmental benefits to pollutant removal costs, is a simplification. It inherently assumes that the “avoided pollution damage” equals the “abatement cost,” while in reality, the long-term value of ecological damage and treatment costs might differ. Future research could incorporate methods like the Contingent Valuation Method (CVM) for cross-validation.
(III) Regional Applicability: This study is based on a coal chemical base in the arid northwest of China. For regions with different water resource endowments, economic structures, and environmental policies, key coefficients in the model need to be adjusted according to local conditions and should not be directly transferred.

5. Conclusions and Implications

5.1. Conclusions

This study successfully establishes an integrated environmental–economic accounting framework for HMMW utilization, addressing a critical research gap in evaluating its sustainability. The principal outcomes are summarized as follows:
(I) A novel approach was developed to refine the HMMW production and supply sector from the traditional water industry in the input–output table. Furthermore, an accounting method for quantifying the environmental benefits of HMMW utilization was proposed based on the opportunity cost method, effectively internalizing its positive externalities. This method was integrated into a comprehensive environmental–economic input–output framework, enabling a systematic assessment of the economic and environmental impacts of HMMW utilization.
(II) The proposed framework was applied to the NECI Base. The results demonstrated that the utilization of 22.69 Mm3 of HMMW generated substantial environmental benefits, valued at 233.69 M CNY, primarily by avoiding the discharge of pollutants such as TDS, SS, COD, and TP. The compiled environmental–economic input–output table passed the balance verification, confirming the robustness and practicality of the accounting method.
(III) This research provides a scientifically robust tool for policymakers and enterprise managers to quantify the hidden value of HMMW. The framework can support: (a) cost–benefit analysis for investing in HMMW treatment facilities, (b) formulating economic incentives and regulatory policies for unconventional water resource utilization, and (c) advancing towards green GDP accounting that incorporates environmental externalities. Future efforts should focus on collecting localized cost data and expanding the system boundary to include the life-cycle environmental impacts of the treatment processes themselves.

5.2. Policy and Management Implications

The quantified environmental benefits demonstrate the significant hidden value of HMMW utilization. Water resource authorities should consider integrating such environmental externalities into the pricing framework for unconventional water resources. This could involve providing subsidies or incentives to enterprises that utilize HMMW, making it more economically competitive compared to conventional water sources like Yellow River water.
Given the low utilization rate and high environmental benefits identified, policymakers in water-scarce regions like Northwest China should prioritize strategic investments in HMMW treatment and distribution networks. The integrated accounting framework developed here can serve as a tool for conducting cost–benefit analyses to justify such investments and optimize their allocation.

Author Contributions

Methodology, C.M.; software, J.L. and H.N.; validation, C.M., Z.Z. and H.W.; formal analysis, J.L.; investigation, H.N.; resources, H.N.; data curation, C.M.; writing—original draft preparation, C.M.; writing—review and editing, J.L.; funding acquisition, Z.Z. All authors have read and agreed to the published version of the manuscript.

Funding

This research was funded by National Major Science and Technology Special Project, grant No. 2024ZD1700105, Science and Technology Project of CHN ENERGY, grant No. GJNY-23-85, and Research on Pathways and Policy Support Systems for the Protection and Utilization of Mine Water, grant No. S930025069.

Institutional Review Board Statement

Not applicable.

Informed Consent Statement

Not applicable.

Data Availability Statement

Data will be made available on request.

Conflicts of Interest

The authors declare that they have no known competing financial interests or personal relationships that could have appeared to influence the work reported in this paper.

References

  1. Chen, E. Global freshwater crisis intensifies. Ecol. Econ. 2022, 38, 4. Available online: https://kns.cnki.net/kcms2/article/abstract?v=IMWkopLkOPXfzbl4RMGpERW8BqfBefKt6A2M6HJIqGmjF-DOq1F3oBqzNBjFaQxJh50Rm9LZNu5nDcuvS2y55fUkgcQBgGg0780CCkjdmHgrJYZCS3WQANTB8k1zQ9DLSXZtE5mhP6zRlJ8pCvuokvZtlgTSxNqH4p_8WSII42bgO4AnLFR-jw==&uniplatform=NZKPT&language=CHS (accessed on 24 September 2025).
  2. Kranz, K.; Dillenardt, J. Mine Water Utilization for Geothermal Purposes in Freiberg, Germany: Determination of Hydrogeological and Thermophysical Rock Parameters. Mine Water Environ. 2010, 29, 68–76. [Google Scholar]
  3. Wang, H.; Dong, S.; Shang, H.; Wang, T.; Yang, J.; Zhao, C.; Zhang, Q.; Zhou, Z.; Liu, J.; Hou, Y. Domestic and foreign progress of mine water treatment and resource utilization. Coal Geo. Explor. 2023, 51, 15. [Google Scholar]
  4. Wang, X.; Zou, Y.; Zhao, R.; Yang, X.; Jia, B.; Huang, Y. Advanced treatment and reuse of highly mineralized mine wastewater. China Water Wastewater 2009, 25, 56–58. [Google Scholar]
  5. Pang, Z. Research on Water Resources Utilization in Coal Mines’Taking Huainan Mining Area As an Example. Master′s Thesis, Degree-Anhui University of Science and Technology Anhui, Huainan, China, 2005. [Google Scholar]
  6. Gu, D.; Li, J.; Cao, Z.; Wu, B.; Jiang, B.; Yang, Y.; Yang, J.; Chen, Y. Technology and engineering development strategy of water protection and utilization of coal mine in China. J. China Coal Soc. 2021, 46, 3079–3089. [Google Scholar]
  7. Gu, D.; Li, T.; Li, J.; Guo, Q.; Jiang, B.; Bian, W.; Bao, Y. Current status and prospects of coal mine water treatment technology in China. Coal Sci. Tech. 2021, 49, 11–18. [Google Scholar]
  8. Sun, Z. The Ministry of Water Resources further promotes the special rectification action for soil and water conservation in the Yellow River Basin and the “Implementation of the Outline of the Yellow River Basin Ecological Protection and High quality Development Plan”. Soi. Water Con. Chi. 2021, 6, 1. [Google Scholar] [CrossRef]
  9. Zhang, S.; Wang, H.; He, X.; Guo, S.; Xia, Y.; Zhou, Y.; Liu, K.; Yang, S. Research progress, problems and prospects of mine water treatment technology and resource utilization in China. Crit. Rev. Environ. Sci. Technol. 2019, 50, 1–53. [Google Scholar] [CrossRef]
  10. Itskos, G.; Koutsianos, A.; Koukouzas, N.; Vasilatos, C. Zeolite development from fly ash and utilization in lignite mine-water treatment. Int. J. Miner. Process. 2015, 139, 43–50. [Google Scholar] [CrossRef]
  11. Wright, I.; Paciuszkiewicz, K.; Belmer, N. Increased Water Pollution After Closure of Australia’s Longest Operating Underground Coal Mine: A 13-Month Study of Mine Drainage, Water Chemistry and River Ecology. Water Air Soil Pollut. 2018, 229, 55. [Google Scholar]
  12. Shao, A.; Li, Z. New Technologies of Purification and Utilization on Mine Water. Appl. Mech. Mater. 2012, 178-181, 543–548. [Google Scholar] [CrossRef]
  13. Ma, L.; Wang, Y.; Wu, L.; Wang, X.; Zhang, T. Coal mine water treatment technology and benefit analysis. Chin. J. Environ. Eng. 2017, 39, 61–65. [Google Scholar]
  14. Gao, X. Research on Value’s Evaluation of Urban Reclaimed Water. Ph.D. Thesis, Xi’an University of Architecture and Technology, Xi’an, China, 2011. [Google Scholar]
  15. Wan, Y.; Zhang, P.; Wang, W. Analysis on the comprehensive benefits of wastewater reclamation. J. Anhui Agric. Sci. 2010, 38, 6477–6478. [Google Scholar]
  16. Chen, S.; Ju, J. Utilization technology of mine water resources in Daliuta Mine. Coal Sci. Technol. 2011, 39, 125–128. [Google Scholar]
  17. Fan, Y.; Chen, W. Assessment of ecological environment benefits of reclaimed water reuse in Beijing. Environ. Sci. 2014, 35, 4003–4008. [Google Scholar] [CrossRef]
  18. Alcon, F.; Martin-Ortega, J.; Pedrero, F. Incorporating Non-market Benefits of Reclaimed Water into Cost-Benefit Analysis: A Case Study of Irrigated Mandarin Crops in southern Spain. Water Resour. Manag. 2013, 27, 1809–1820. [Google Scholar]
  19. Fontes, L.; Bontemps, J.-D.; Bugmann, H.; Van, O.M.; Skovsgaard, J.-P. Models for supporting forest management in a changing environment. For. Syst. 2010, 19, 8–29. [Google Scholar] [CrossRef]
  20. Wang, Y.; Li, J.; Lee, L.C.; Wang, M.; Du, H. A review of input–output model application hot spots in the energy and environment fields based on co-words network analysis. Environ. Rev. 2019, 27, 567–574. [Google Scholar]
  21. Feng, J.; Tian, C. Empirical study on environmental and economic benefits of tannery enterprises based on input-output accounting. Commun. Financ. Account. 2012, 2, 54–55. [Google Scholar] [CrossRef]
  22. Xu, X.; Yang, Z.; Wang, H.; Yu, S.; Liu, H. Review on water resources and environmental input-output analysis and its key study issues. Arid Land Geogr. 2013, 36, 13. [Google Scholar]
  23. Peng, S.; Liu, A. The environmental impact of China’s foreign trade: An empirical study based on the environmental input-output model. J. World Econ. 2010, 5, 140–160. [Google Scholar]
  24. Isabela, B.; Maria, L. Structural decomposition analysis and input–output subsystems: Changes in CO2 emissions of Spanish service sectors (2000–2005). Ecol. Econ. 2011, 70, 2012–2019. [Google Scholar] [CrossRef]
  25. Wu, C.C.; Chang, N.B. Grey input–output analysis and its application for environmental cost allocation. Eur. J. Oper. Res. 2003, 145, 175–201. [Google Scholar] [CrossRef]
  26. Tarancon, M.A.; Rio, P.D. Assessing energy-related CO2 emissions with sensitivity analysis and input-output techniques. Energy 2012, 37, 161–170. [Google Scholar]
  27. Liao, M. Research on the input-output model based on “energy saving”. Chin. Ind. Econ. 2011, 7, 26–34. [Google Scholar] [CrossRef]
  28. Li, J.; Fang, W. Research on the Energy and Environmental Costs of the Growth of Foreign Trade in the Yangtze River Delta. Financ. Trade Econ. 2011, 5, 80–85. [Google Scholar]
  29. Mao, W.; Zhou, R.; Guo, Z. Zero liquid discharge treatment technology and application for coal mine drainage water. Coal Sci. Tech. 2017, 45, 6. [Google Scholar]
  30. Li, F.; Zhao, G.; Zhu, Y.; Jiao, Y. Research on zero discharge process of highly-mineralized mine water. Coal Sci. Tech. 2018, 46, 6. [Google Scholar]
  31. Wang, L.; Zhang, M.; Zhou, X.; Zhou, S. Water Pollution of Mine and the Disposing Techniques. Clean. Coal Tech. 2007, 13, 4. [Google Scholar] [CrossRef]
  32. Li, H. The impact of highly mineralized mine water on the ecological environment and its control measures. Coal Mine Environ. Prot. 2000, 1, 16. [Google Scholar]
  33. Randall, A. Market Solutions to Externality Problems: Theory and Practice. Am. J. Agric. Econ. 1972, 54, 175–183. [Google Scholar] [CrossRef]
  34. Chambouleyron, A. An Incentive Mechanism for Decentralized Water Metering Decisions. Ind. Organ. 2002, 17, 89–111. [Google Scholar]
  35. Gao, L. The Model Study of China’s Energy-Saving and Emission Reduction. Master’s Thesis, Capital University of Economics and Business, Beijing, China, 2012. [Google Scholar]
  36. United Nations. Handbook of National Accounting—Integrated Environmental and Economic Accounting: An Operational Manual. NY, USA. 2000. Available online: https://unstats.un.org/unsd/publication/SeriesF/SeriesF_78E.pdf (accessed on 24 September 2025).
  37. Gundimeda, H.; Sukhdev, P.; Sinha, R.K.; Sanyal, S. Natural resource accounting for Indian states—Illustrating the case of forest resources. Ecol. Econ. 2007, 61, 635–649. [Google Scholar] [CrossRef]
  38. Fan, Y. Construction of Environmental Protection Activities Input-Output Table and Economic Environment Benefits Analysis. Ph.D. Thesis, Degree-Harbin Institute of Technology, Harbin, China, 2019. Available online: https://kns.cnki.net/kcms2/article/abstract?v=bJ89lKU86K8DUTLZx6UCrAuO4vqWKd59cjqF8zDnxaTSU1uSMVBDKXhjvahWM8hL-jEz7g-ir0T5OVCBZYsC3v_oDhas26iW0jdYe15Zhr_YDva7uHydVcMiP4F88-ohvsgxK0Kn9xYRE3KYfLalje_qTE9zWJDD7qqva64ctQMsrqzSVEfXAWVA4yTFJY5J&uniplatform=NZKPT&language=CHS (accessed on 24 September 2025).
  39. Tong, C. Reconstruction of the Theory and Method of Green GDP Accounting. Ph.D. Thesis, Shanxi University of Finance and Economics, Taiyuan, China, 2021. [Google Scholar] [CrossRef]
  40. Lin, W.; Yang, J.; Chen, B. Temporal and Spatial Analysis of Integrated Energy and Environment Efficiency in China Based on a Green GDP Index. Energies 2011, 4, 1376–1390. [Google Scholar] [CrossRef]
  41. Wang, J. Revive China’s green GDP programme. Nature 2016, 534, 37. [Google Scholar] [CrossRef] [PubMed]
  42. Jin, X.; Yan, J. The Crux and Breakthrough Path of the Predicament of Green GDP Accounting in China: Based on Negative Value. J. Lanzhou Acad. 2019, 9, 136–148. [Google Scholar]
  43. Hubacek, K.; Giljum, S. Applying physical input-output analysis to estimate land appropriation (ecological footprints) of international trade activities. Ecol. Econ. 2003, 44, 137–151. [Google Scholar] [CrossRef]
  44. Lave, L.B.; Cobas-Flores, E.; Hendrickson, C.T.; McMichael, F.C. Using input-output analysis to estimate economy-wide discharges. Environ. Sci. Technol. 1995, 29, 420A–426A. [Google Scholar] [CrossRef]
  45. Casler, S.D.; Hadlock, D. Contributions to Change in the Input-Output Model: The Search for Inverse Important Coefficients. J. Regi. Sci. 2010, 37, 175–193. [Google Scholar] [CrossRef]
  46. Hilbert, H.; Jiang, M. Environmental Economics; China Forestry Publishing House: Beijing, China, 2002; pp. 150–156. [Google Scholar]
  47. Zhang, C. A Study on Compensation Mechanism for Water Resources Restoration. Ph.D. Thesis, China Institute of Water Resources and Hydropower Research, Beijing, China, 2003. [Google Scholar]
  48. Ni, H. A Study on Water Resources Value and Price of Environment and Economy Coordinating Development. Ph.D. Thesis, China Institute of Water Resources and Hydropower Research, Beijing, China, 2004. [Google Scholar]
  49. Qi, J.; Zhang, Y.; Xiang, L.; Liu, D.; Zheng, Q. Technical and economic investigation and analysis of the middle/small scale wastewater treatment plants. China Water Wastewater 2006, 22, 4. [Google Scholar]
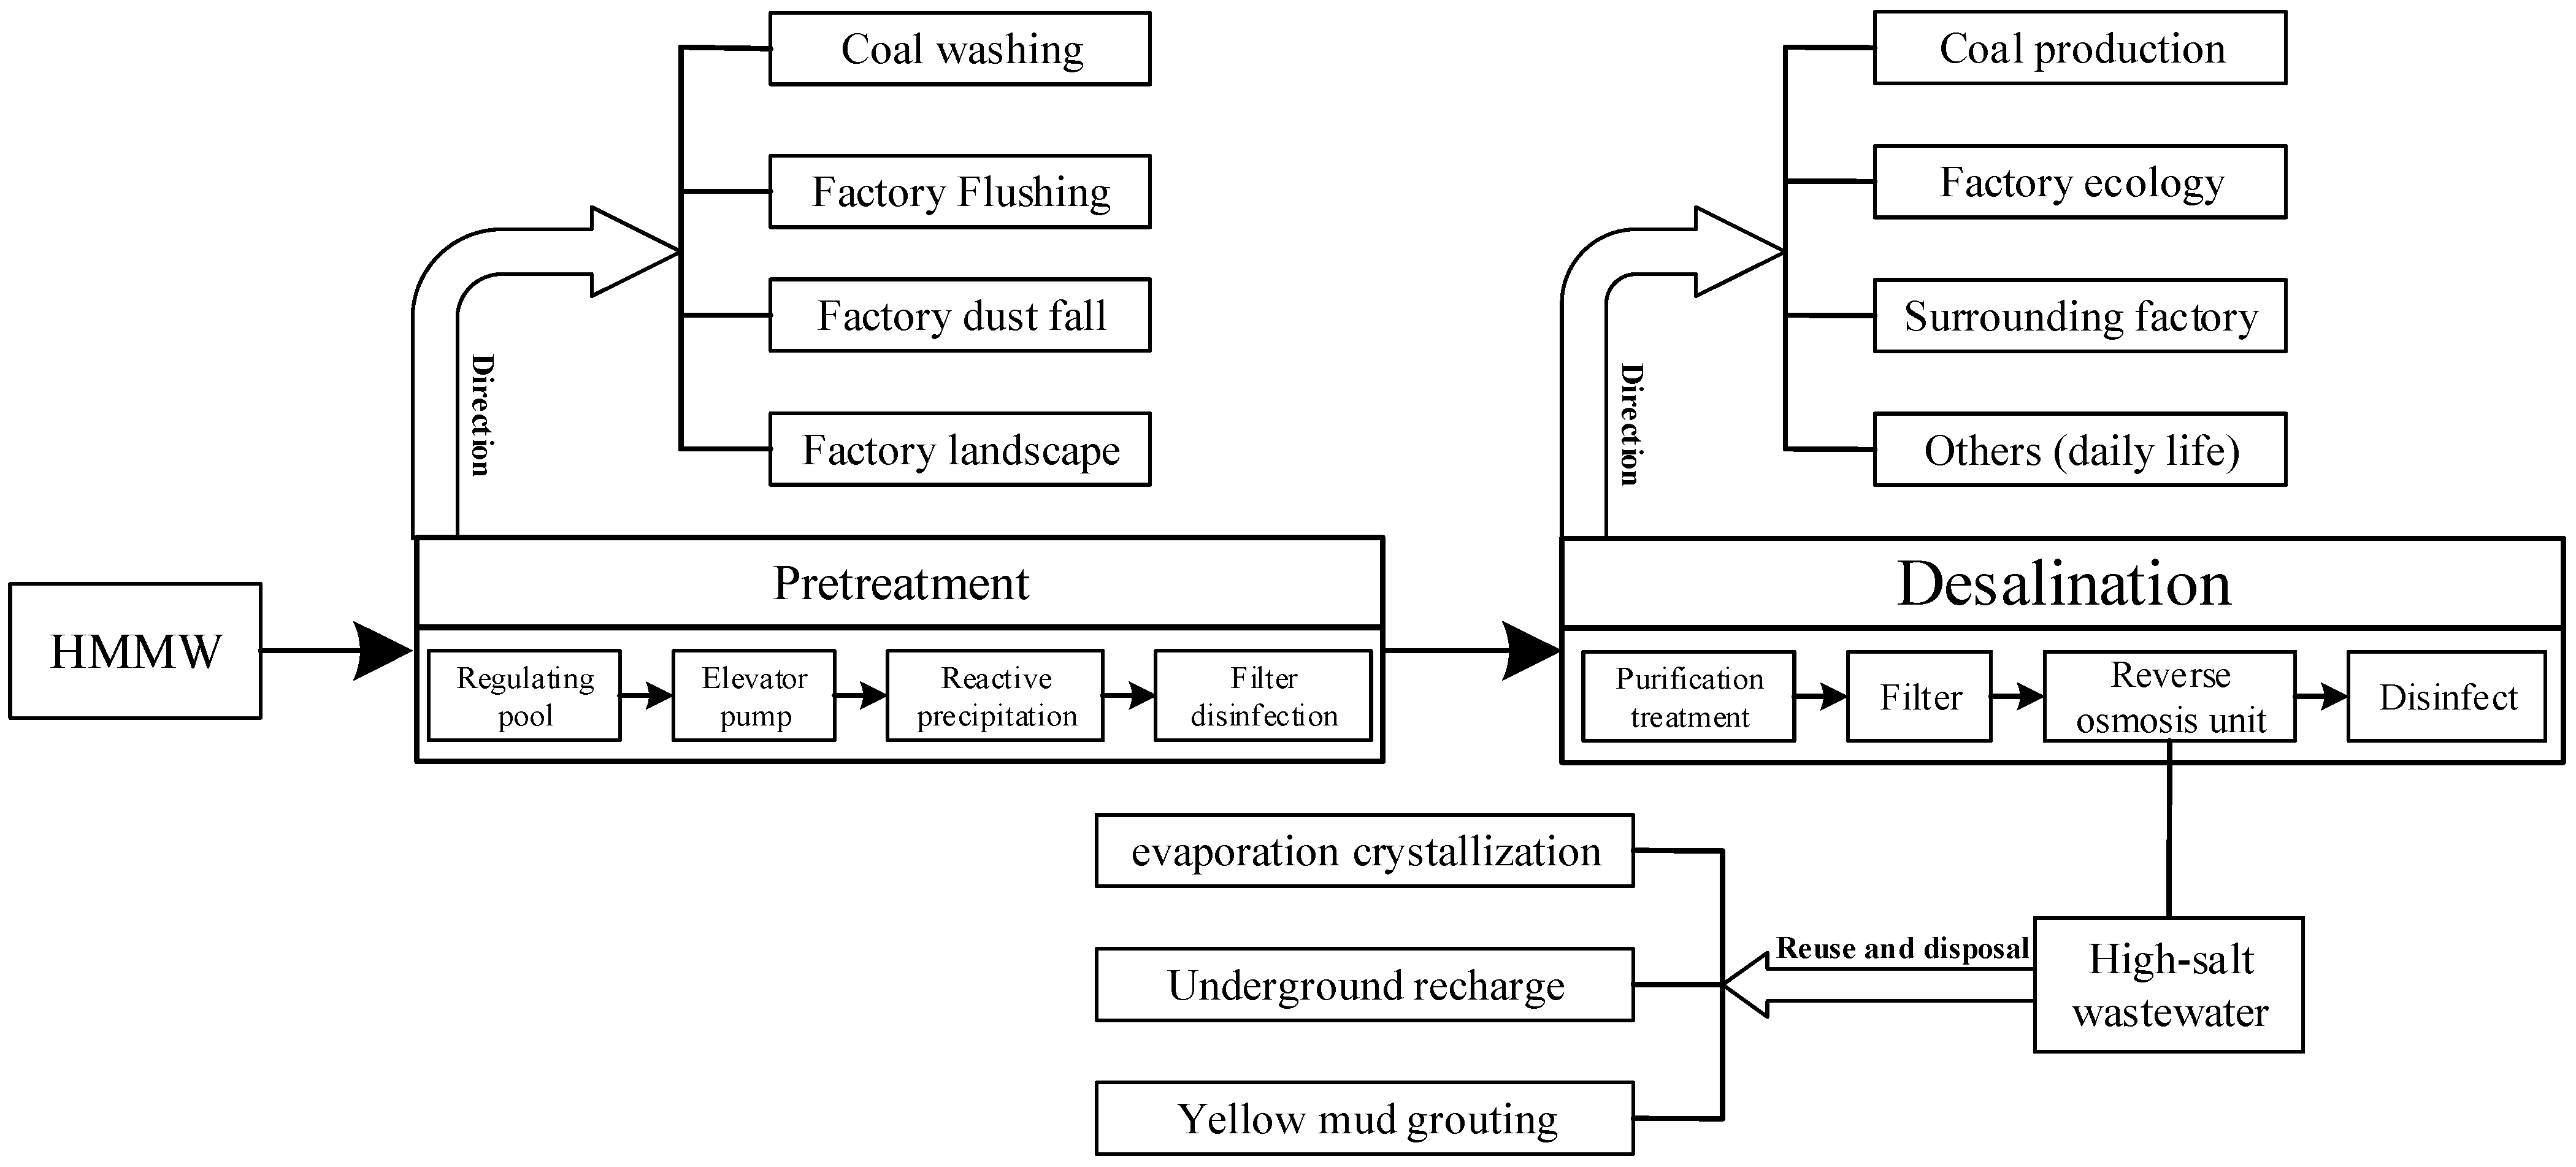
Figure 1. HMMW treatment process and comprehensive utilization pathway.
Sustainability 17 08965 g001
Figure 2. Impact Structure of HMMW Utilization.
Sustainability 17 08965 g002
Figure 3. Schematic illustration of the positive externalities on HMMW utilization.
Sustainability 17 08965 g003
Figure 4. Input–output table structure.
Sustainability 17 08965 g004
Figure 5. Structure of environmental–economic input–output table of HMMW utilization.
Sustainability 17 08965 g005
Figure 6. Geographical location map of NECI Base.
Sustainability 17 08965 g006
Figure 7. Water Consumption by Source and Industry in NECI Base: (a) type and amount of water-using; (b) water-using structure in NECI Base.
Sustainability 17 08965 g007
Figure 8. The environmental economic input–output table of HMMW utilization in NECI Base.
Sustainability 17 08965 g008
Table 1. The Yellow River water supply price in NECI base (Chinese Yuan (CNY)/m3).
Water Supply ProjectWater Supply ProjectWater Price
Ningdong water supply projectIndustrial water2.8
Domestic water2.8
Greening water1.3
Changcheng water supply projectIndustrial water2.8
Sun Mountain water supply projectIndustrial water3.5
Domestic water7.0
Table 2. Industry consolidation details.
Sector ClassificationConsolidated SectorsDetailed Sector Composition
Primary SectorAgricultureForestry, Agro-, Livestock and Fisheries
Secondary SectorCoal industryCoal mining products; Oil & gas extraction products; Metal ore mining products; Non-metallic and other ore mining products; Petroleum, coking products and processed nuclear fuel products; Chemical products; Gas production and supply
Coal-fired power industryProduction and supply of electricity and heat
Fine chemical industryChemical products
Other industriesFood and tobacco industry; Textiles; Textile, clothing, shoes, hats, leather and down and its products industry; Wood processing products and furniture; Paper printing and stationery and sporting goods; Non-metallic mineral products; Metal Smelting and Rolling Products; Metal Products; General Purpose Equipment; Specialized equipment; Transportation facilities; Electrical machinery and instruments; Telecommunications devices, computers and other electrical devices; Instrumentation; Other manufacturing products and waste scrap; Metal goods, machinery and equipment repair services;
Water production and supply industryWater production and supply industry
Tertiary SectorBuilding IndustryBuilding Industry
DealRetail & Wholesale
TransportationTransportation, warehousing and mail
FinanceFinance;
Common ServicesInformation transmission, software and IT business; Finance; Real Estate; Hydraulic, environmental and public infrastructure management; Renting and Commercial Services; Real estate; Research and test development; Comprehensive technical services
Water intensive serviceHousehold services, maintenance and other services; Education Healthcare and community Work; Culture, Physical Education and Recreation; Public Management, Social Security and Social Groups
Table 3. The total industrial output value and added value of NECI Base in 2020 (million (M) CNY).
IndustryIndustrial Output ValueIndustrial Added Value
Coal industry748.6238.4
Coal-fired power industry173.547.3
Fine chemical industry14.62.6
Other industries139.918.4
Table 4. Input of Different Water Sources to the Industry in NECI Base (M CNY).
IndustryYellow River WaterRecycled WaterHMMW
Coal industry422.01076.1188.0
Coal-fired power industry69.60.0041.6
Fine chemical industry2.50.000.00
Other industries8.50.000.00
Table 5. Parameters of pollutant reduction from HMMW utilization.
TermTDSSSOther Pollutants
CODTP
Cost/CNY·kg−11.307.813.64292.45
Concentration/mg·L−17658.4022.3333.430.12
Table 6. Environmental benefits accounting of HMMW utilization.
IndustryConsumptionm m3Environmental Benefits/M CNY
TDSSSCODTPTotal
Coal industry18.25181.913.182.220.64187.95
Coal-fired power industry4.0440.270.710.490.1441.61
HMMW industry0.403.990.070.050.014.12
Total22.69226.173.962.760.80233.69
Disclaimer/Publisher’s Note: The statements, opinions and data contained in all publications are solely those of the individual author(s) and contributor(s) and not of MDPI and/or the editor(s). MDPI and/or the editor(s) disclaim responsibility for any injury to people or property resulting from any ideas, methods, instructions or products referred to in the content.