Abstract
This study investigates the use of wheat straw ash (WSA) as a sustainable supplementary cementitious material, focusing on its mechanical performance optimization and environmental implications. WSA (ASTM C618, Class F), produced via controlled calcination at 700 °C, was used to replace cement at 2.5, 5, 7.5, 10% by mass. The optimal performance was observed at 5% substitution, achieving a 90-day compressive strength of 48.42 MPa (+4.7%) and a 28-day flexural strength of 7.93 MPa (+6.6%). To contextualize these findings, a multi-technique analytical approach was employed, including scanning electron microscopy (SEM), X-ray diffraction (XRD), thermogravimetric analysis (TGA), Fourier-transform infrared spectroscopy (FT-IR), and ultrasonic pulse velocity (UPV). These methods confirmed that WSA enhances portlandite consumption through pozzolanic reactivity and improves matrix densification via secondary C-S-H gel formation. Additionally, satellite (Sentinel-5P) and ground-based measurements during a severe stubble fire event in Diyarbakir (20–24 June 2024) documented a fourfold increase in PM10 concentrations (157 μg/m3 compared to the June average of ≈35 μg/m3), alongside 23% and 41% rises in NO2 and SO2 levels, respectively. These findings demonstrate that wheat straw ash utilization can mitigate agricultural waste burning, improve air quality, and reduce the carbon footprint of cement production. The study highlights WSA’s potential as a high-performance, eco-efficient construction material aligned with circular economy principles.
1. Introduction
Wheat is one of the most widely cultivated crops globally, with total production reaching 803 million tonnes in 2023. Leading producers include China, the European Union, and India, as detailed in Table 1. Türkiye ranks tenth globally, contributing 3% of global production with an annual yield of 22 million tonnes, primarily harvested in the Central Anatolia, Southeastern Anatolia, and Thrace regions [1,2]. Following the harvest, farmers often burn the remaining wheat stubble to prepare fields for the next planting cycle. However, stubble burning poses severe environmental threats, including soil degradation and the release of hazardous gases (CO, SO2, NO2) and particulate matter (PM10 and PM2.5). These pollutants deteriorate air quality and endanger public health, especially in countries such as India and Türkiye where the practice remains prevalent despite regulatory restrictions [3,4].

Table 1.
Major countries in world wheat production in 2023 [1,2].
Diyarbakir province in southeastern Türkiye, which contributes approximately 4% of the country’s wheat production (981 thousand tonnes annually), serves as a significant case study. On 20 June 2024, an uncontrolled stubble fire in the region rapidly spread across 8100 decares of farmland due to insufficient containment measures. As shown in Figure 1, the fire extended into nearby settlements, tragically resulting in 15 fatalities and severe property damage, including the loss of numerous livestock facilities [5,6]. This incident highlights the vulnerability of agricultural regions to such disasters and underscores the urgent need for improved fire prevention strategies.
Concurrently, the global demand for cement continues to grow, with China, India, and Türkiye among the top producers (Table 2). Cement manufacturing is a resource-intensive process, contributing significantly to carbon emissions approximately 0.7634 kg CO2-equivalent per kg of cement produced [7,8]. These environmental concerns have intensified the search for sustainable alternatives that can partially replace Portland cement (OPC) in construction.
Table 2.
Major countries in worldwide cement production in 2023 [9].
As one of the world’s leading cement producers, Türkiye faces a significant challenge in reducing the environmental burden of cement production. Therefore, the utilization of supplementary cementitious materials (SCMs) such as wheat straw ash (WSA) represents a promising strategy to lower the carbon footprint of the construction sector. In this context, the high cement production data presented in Table 2 highlights both the urgency and the opportunity for employing WSA as a sustainable binder.

Figure 1.
Uncontrolled wheat stalk fire in Diyarbakir [10].
Among agricultural residues, WSA is notable for its high silica content, rendering it a viable pozzolanic material. Prior studies have shown that WSA can improve the mechanical properties and durability of cement-based composites while reducing their permeability and enhancing resistance to sulphate and acidic environments [11,12]. Utilizing WSA therefore offers a dual environmental benefit: it mitigates the negative effects of stubble burning and reduces the carbon footprint associated with cement production. Furthermore, previous studies have indicated that WSA, along with other agro-waste ashes such as rice husk ash (RHA) [13], pistachio shell ash (PSA) [14], and corncob ash (CCA) [15], can act as effective SCMs. For instance, Biricik et al. [16] and Ahmad et al. [17] reported that WSA improves strength and durability, though the optimal dosage depends on calcination and mix conditions, with similar benefits having been noted for other agro-wastes [14,18,19].
This study aims to evaluate the potential of WSA, produced through controlled calcination of agricultural residues, as a sustainable SCM in cement mortars. The research comprehensively assesses the effects of WSA on the mechanical properties, microstructure, and durability of cementitious composites through experimental analyses, including compressive and flexural strength tests at 7, 28, and 90 days, supported by advanced characterization techniques such as scanning electron microscopy (SEM), X-ray diffraction (XRD), thermogravimetric analysis (TGA), and Fourier-transform infrared spectroscopy (FT-IR). Furthermore, by integrating experimental performance results with air quality data from a large-scale stubble fire event in Diyarbakir, this study demonstrates a dual environmental benefit: it provides a productive alternative to uncontrolled stubble burning, thereby reducing adverse air pollution, while simultaneously lowering clinker demand in cement production and mitigating associated CO2 emissions. The findings offer an environmentally responsible solution to agricultural waste management and contribute to the development of eco-efficient construction materials, addressing two major sources of environmental pollution biomass burning and cement manufacturing.
2. Materials and Methods
2.1. Materials
The cement used in this study has a specific gravity of 3.13 and a Blaine fineness of 3323 cm2/g, conforming to EN 196-6 [20] and ASTM C204 [21] standards. The specific gravities of WSA and sand are 2.25 and 2.61, respectively.
Figure 2 presents the laser particle size distributions (PSD) of both OPC and WSA, highlighting the finer particle size of WSA [22]. This finer structure is expected to enhance reactivity when blended with cement. The chemical compositions of OPC and WSA were determined by X-ray fluorescence spectroscopy (XRF) at the Limak Kurtalan Cement Factory laboratory (Limak Holding A.Ş., Ankara, Türkiye) and are presented in Table 3. Table 4 displays the mineralogical composition of OPC.
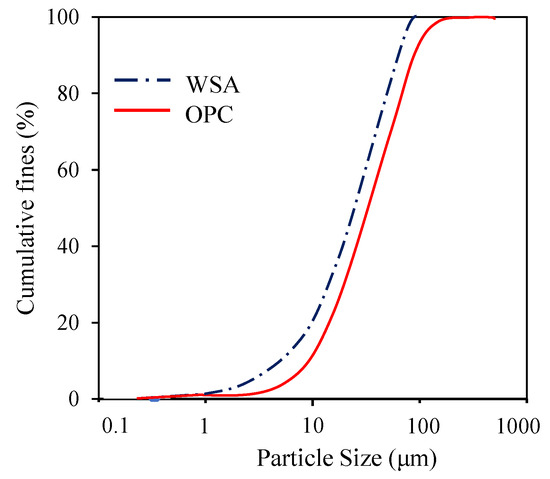
Figure 2.
PSD analysis of WSA and OPC.
Quantifying the mineral phases in OPC is critical for quality control in the cement industry [23]. OPC typically consists of 66.40% alite (C3S), with other phases including belite (C2S) at 1.87%, tricalcium aluminate (C3A) at 8.68%, and ferrite (C4AF) at 9.22% (Table 4). Minor constituents such as periclase (MgO) and gypsum (CaSO4.2H2O) may also be present [24,25,26]. The proportion of C3A is particularly important, as its reaction with gypsum during hydration leads to the formation of ettringite and thaumasite, which may cause expansion, cracking, and degradation [27,28,29].
According to Table 3, WSA exhibits a combined SiO2 + Al2O3 + Fe2O3 (S + A + F) content of 87.54%, which meets the ASTM C618 Class F pozzolanic requirements [30]. According to Bheel et al. [31] and Biricik et al. [16], the ash content is 8–11% and S + A + F content is 79–89%. The CaO/SiO2 ratio in WSA is particularly low, suggesting improved resistance to sulphate attack [32,33,34]. The loss on ignition (LOI) of WSA is 1.88%, indicating minimal unburned carbon. However, the high alkali content (Na2Oeq > 0.60%) necessitates caution when using WSA with reactive aggregates such as andesite, dacite, or rhyolite, to avoid alkali–silica reaction (ASR) [14,25,35].
In Figure 3a, XRD analysis confirms the presence of major cement phases (C3S, C2S, C3A, C4AF), with dominant alite peaks in OPC. In contrast, in Figure 3b, the WSA diffractogram exhibits a broad hump centred at 2θ ≈ 26.5°, indicating a substantial amorphous phase content [36,37,38].
Table 3.
Chemical composition by XRF of the materials (wt. %).
Table 3.
Chemical composition by XRF of the materials (wt. %).
| SiO2 | Al2O3 | Fe2O3 | CaO | MgO | SO3 | LOI 1 | Na2Oeq * | |
|---|---|---|---|---|---|---|---|---|
| OPC | 18.12 | 5.21 | 3.03 | 62.06 | 2.70 | 3.21 | 3.98 | 0.72 |
| WSA | 85.19 | 1.43 | 1.02 | 0.05 | 7.71 | 0.36 | 1.88 | 1.59 |
| WSA (at 670 °C for 5 h) [39] | 68.70 | 3.73 | 2.58 | 7.84 | 2.68 | 2.34 | 7.32 | 4.60 |
1 LOI: Loss on ignition; Na2Oeq * = Na2O + 0.658 K2O.
Table 4.
Mineralogical composition of OPC (wt. %).
Table 4.
Mineralogical composition of OPC (wt. %).
| 3CaO.SiO2 (C3S) | 2CaO.SiO2 (C2S) | 3CaO.Al2O3 (C3A) | 4CaO.Al2O3. Fe2O3 (C4AF) |
|---|---|---|---|
| 66.40 | 1.87 | 8.68 | 9.22 |

Figure 3.
XRD analysis of (a) OPC [25], (b) WSA.
2.2. Methods
2.2.1. Air Quality Measurements
In this study, the levels of air pollutants in Diyarbakir, Türkiye, were examined during a severe stubble burning event that took place between June 20 and 24, 2024. The analysis utilized open-access air quality monitoring data officially recorded by the Ministry of Environment, Urbanization and Climate Change of the Republic of Türkiye between 2018 and 2024 [40]. This dataset was obtained via the National Air Quality Monitoring Network and includes validated hourly measurements of particulate matter (PM10) and other criteria pollutants from reference-grade monitoring stations across Diyarbakir. The six-year continuous dataset enabled a comprehensive temporal analysis of pollution patterns, particularly focusing on the post-harvest burning season (June–October), when agricultural activity intensifies.
Sentinel-5P Level 2 data were processed using the Google Earth Engine (GEE) platform, applying quality assurance filtering, spatial regrinding (0.01°), and temporal averaging. Measurements from the baseline period (1–19 June 2024) and the fire event period (20–24 June 2024) were compared, and satellite data were validated by cross-referencing pollutant concentrations with hourly ground-based measurements from the National Air Quality Monitoring Network in Diyarbakir. Additionally, NO2, SO2, and CO concentrations measured during the stubble burning event were compared with baseline values derived from the 20-day pre-fire period. Leveraging its high spatial resolution, Sentinel-5P data enabled the detection of localized pollution variations across extensive geographical areas and provided more comprehensive air quality mapping compared to conventional ground-based methods. These capabilities underscore the value of satellite data in capturing spatiotemporal pollution patterns, particularly in regions with limited monitoring infrastructure.
2.2.2. Preparation of WSA
Wheat straw consists of water, protein, oils, extractable fibres, pentosans, cellulose, lignin, and ash, with high silica content concentrated in the leaves, stems, and stalks. When properly processed, WSA exhibits pozzolanic properties, making it a viable artificial SCM [16].
The WSA was produced through a two-stage thermal process. Initial combustion of the raw straw at 300 °C yielded a black ash, which was subsequently ground, sieved to a particle size below 0.25 mm, and then subjected to a second calcination in a muffle furnace at 700 °C for 2.5 h (Figure 4). The calcined product was rapidly cooled to ambient temperature to obtain a grey ash rich in amorphous silica [12,41,42]. This final calcination temperature of 700 °C was selected based on previous studies [16,39], which identified it as the optimum condition for maximizing amorphous silica content.
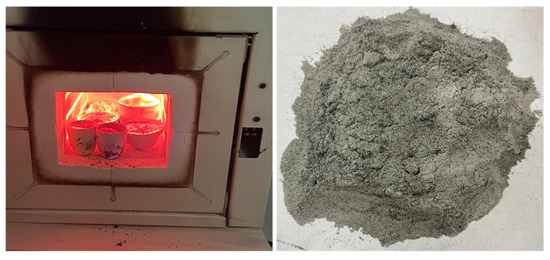
Figure 4.
Obtaining WSA by controlled combustion in a muffle furnace at 700 °C.
2.2.3. Specimen Preparation
The PL consists of 100% OPC, while other mixtures contain WSA replacing 2.5%, 5%, 7.5%, and 10% of cement by mass. In all mixtures, the sand content is fixed at 1350 kg/m3 and, water content at 225 kg/m3. The water-binder ratio (W/B) is maintained at 0.50, with the total binder comprising the combined mass of OPC and WSA. The prepared mortar mixture is homogenized in a mixer in accordance with ASTM C305 [43] shown in Figure 5 and then poured into rigid moulds. Table 5 presents the detailed mix proportions used in the experimental study.
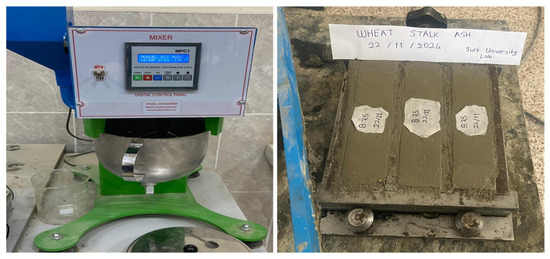
Figure 5.
Preparation of mortar.
Table 5.
Mix proportion of eco-friendly cement paste with WSA (g).
2.2.4. Experimental Procedure
Compressive and flexural strength tests are conducted using a YKM-CM106 model hydraulic universal testing machine (200 kN capacity) at the construction materials laboratory of Siirt University, Türkiye. For compressive strength testing, 40 mm × 40 mm × 40 mm cubic specimens are cast in rigid moulds. For the flexural strength test, prismatic specimens with dimensions of 40 mm × 40 mm × 160 mm are prepared in accordance with ASTM C490 [44]. Following a 24 h initial curing period in their moulds, all specimens were cured at 20 ± 2 °C and 95% relative humidity for designated periods of 7, 28, and 90 days.
The ultrasonic pulse velocity (UPV) method is an undamaged testing method and is used in internal structure behaviour and quality control applications in building materials. It is conducted to determine density, crack, void, and homogeneity properties by measuring the speed of ultrasonic waves generated by the device within the material. UPV determination is performed using a pundit laboratory device in accordance with ASTM C-597-02 [45] and TS EN 12504-4 [46]. The flat opposite surfaces of the cube specimens are employed for the UPV test application. The sensors should face the same direction and be parallel. The gel is implemented to fill the gaps between the sensor and the sample to obtain effective findings. Before the samples are tested, the surface on which they are prepared is thoroughly inspected to ensure that it is acceptable. Three measurements are taken from each design group and averaged to determine the UPV value.
For microstructural and thermal analyses, we collect samples from both ambient and high-temperature exposed specimens and prepare them according to respective analytical requirements.
Scanning Electron Microscopy (SEM): We prepare specimens for SEM analysis by rendering surfaces conductive through gold coating using a Au sputter coater. Surface morphology characterization occurs using a Hitachi SU3500 SEM at various magnifications.
X-ray Diffraction (XRD): Phase composition analysis uses an X-ray diffractometer operating with Cu-Kα radiation (λ = 1.5406 Å). The instrument performs scans from 10° to 90° (2θ) with a step size of 0.02° at a scan rate of 2°/min.
Fourier Transform Infrared Spectroscopy (FT-IR): Mineralogical characterization employs an Origin Jasco FT-IR spectrometer, which collects spectra in the 400–4000 cm−1 range. The instrument maintains a resolution of 0.001 cm−1 with an accuracy of ±74 cm−1.
Thermal Analysis: Thermogravimetric and differential thermal analyses (TGA/DTA) utilize Shimadzu DTG60 AH and DSC 60 (Japan) A systems. The procedure heats samples (19–22 mg) at 10 °C/min under a nitrogen atmosphere.
3. Results and Discussion
In comparison with previous studies on the utilization of agricultural ashes as supplementary cementitious materials [22,47], the present work provides a distinctive contribution by addressing not only the performance optimization of WSA in cement mortar but also its dual environmental impact. While earlier research primarily emphasized the pozzolanic activity and strength development, this study highlights the potential of controlled combustion of wheat straw residues as an alternative to uncontrolled field burning, which is a major source of air pollution in agricultural regions. Thus, the proposed approach simultaneously mitigates CO2 emissions associated with cement production and reduces pollutant release from straw burning, offering a broader sustainability perspective within construction materials engineering.
3.1. Devastating Effects of Uncontrolled Stubble Burning on Air Pollution
Stubble fires have a direct impact on air quality, as evidenced by PM10 monitoring data in Diyarbakir. According to Figure 6a, the lowest monthly average PM10 level in the region between 2018 and 2023 was recorded in May with 29.25 μg/m3. However, following the wheat harvest, PM10 concentrations increased sharply due to widespread stubble burning, rising by 81% to reach 53.08 μg/m3 in October the peak month for agricultural fires. A particularly severe case occurred on 20 June 2024, when a large stubble fire in Diyarbakir caused PM10 levels to surge to 157 μg/m3, exceeding the June monthly average by approximately 100 μg/m3 (see Figure 6b). Figure 6 summarizes PM10 trends and key air quality variables, demonstrating that during the burning season (summer and autumn), monthly PM10 levels rise significantly [48,49], far exceeding Türkiye’s air quality standards. Given these environmental and public health concerns, this study presents a series of analyses evaluating the potential use of controlled WSA as a binding material, offering a sustainable alternative to open burning while adding value to agricultural waste.
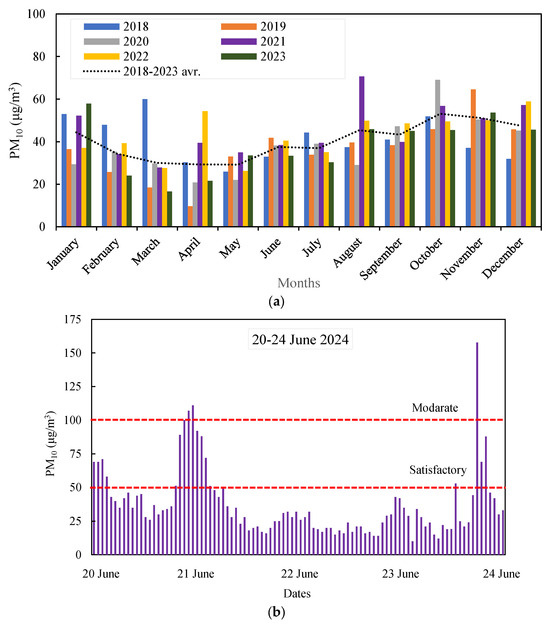
Figure 6.
Average change in PM10 air quality in Diyarbakir province (a) by years (b) on the dates of stubble fire disaster.
Maps showing the distribution of different pollutants and the locations of sampling points are presented in Figure 7 and Figure 8. Figure 7 shows the pollutant distribution plots at the sampling points during the fire (20–26 June 2024) and Figure 8 shows the pollutant distribution plots at the sampling points during the pre-fire period (1–19 June). Analysis of these graphs reveals that the average NO2 levels during the pre-fire period and the fire period) are 9.85 × 10⁻⁵ mol·m−2 and 1.21 × 10⁻⁴ mol·m−2, respectively. Similarly, the average CO levels for the same periods are 0.030 mol·m−2 and 0.031 mol·m−2. The average SO2 levels are recorded as 0.462 × 10⁻³ mol·m−2 before the fire and 0.653 × 10⁻³ mol·m−2 during the fire. Based on the analysis of these graphs, it is evident that the mean concentrations of NO2, CO, and SO2 increase during the fire period compared to the 20-day pre-fire baseline.
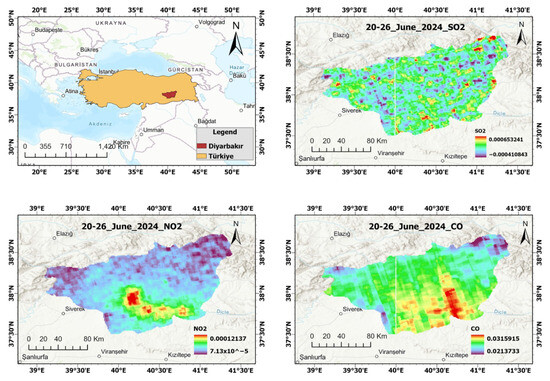
Figure 7.
Spatial air quality distribution in Diyarbakir during the fire (20–26 June 2024): SO2, NO2, CO concentrations.
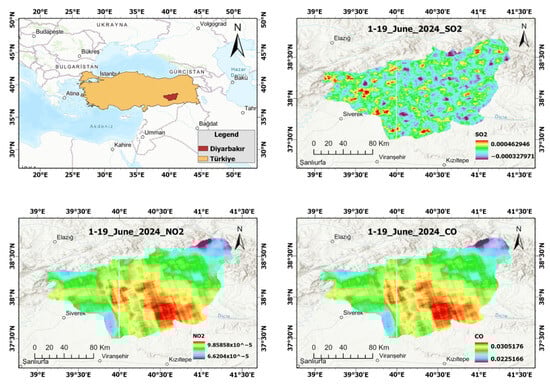
Figure 8.
Spatial air quality distribution in Diyarbakir during the Pre-Fire Period (1–19 June 2024): SO2, NO2, CO concentrations.
3.2. Mechanical Properties
The chemical composition and amorphous silica content of WSA vary depending on parameters such as combustion temperature and duration. WSA produced under controlled conditions at 700 °C exhibits high pozzolanic activity due to its high amorphous silica content. In contrast, ash produced in open-air environments or at different temperatures may contain crystalline phases, resulting in reduced reactivity. Furthermore, finely ground WSA contributes to a denser microstructure through pore-filling effects and accelerates C–S–H gel formation, while coarser particles may lead to decreased reactivity and limited strength development. The performance of WSA can be directly influenced by production conditions, fineness, mix design, and curing duration [50].
3.2.1. Compressive Strength Test
The enhancement in compressive strength is attributed to the pozzolanic activity of WSA [39,51]. Through its reaction with CH, WSA generates additional C–S–H gels, which densify the microstructure by refining the pore structure and improving strength development in blended cement systems [16,39,52].
The experimental results, as shown in Figure 9, demonstrate the time-dependent influence of WSA content on mortar compressive strength. At 7 days, all WSA-blended mixtures show a significant increase in strength compared to the PL, ranging from +15.1% to +18.6%, indicating that WSA contributes effectively to early-age hydration. Among all mixtures, WSA5 achieves the highest compressive strength values: 33.69 MPa at 7 days, 46.13 MPa at 28 days, and 48.42 MPa at 90 days.
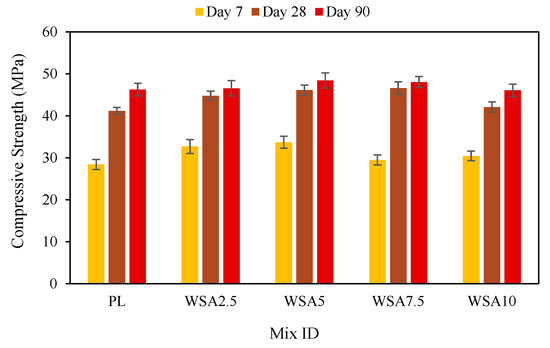
Figure 9.
Compressive strength results.
The WSA7.5 mixture also surpasses the PL at later ages, with +13.2% and +3.9% increases at 28 and 90 days, respectively. In contrast, the WSA10 mix shows diminished strength gain after 28 days, reaching a level around 46 MPa, suggesting that excessive WSA content may dilute the clinker and reduce pozzolanic reactivity over time. The low standard errors (≤±1.8 MPa) confirm the reliability of the test results.
These findings indicate that moderate WSA incorporation levels (5–7.5%) optimize both early and long-term compressive strength through enhanced binder formation and microstructural densification. However, higher substitution rates (≥10%) adversely affect long-term performance by limiting calcium availability for continuous hydration reactions [52]. The environmental urgency of adopting such sustainable alternatives is underscored by the fourfold increase in PM10 concentrations (from ≈35 to 157 μg/m3) measured during uncontrolled stubble burning events. Implementing the optimum WSA mixture (5%), which demonstrated a 4.7% increase in compressive strength while reducing clinker consumption, could effectively divert substantial agricultural waste from open burning and mitigate CO2 emissions by approximately 0.76 kg per kilogram of cement replaced [7,8].
3.2.2. Flexural Strength Test
Figure 10 illustrates the relationship between WSA content and the flexural strength of cement mortar over time. At early age (7 days), all mixes exhibit comparable flexural strength values, ranging from 6.17 MPa to 6.66 MPa. Notably, the WSA7.5 mixture achieves a 5.9% increase over the PL, indicating that WSA begins to exhibit pozzolanic reactivity even at early hydration stages.
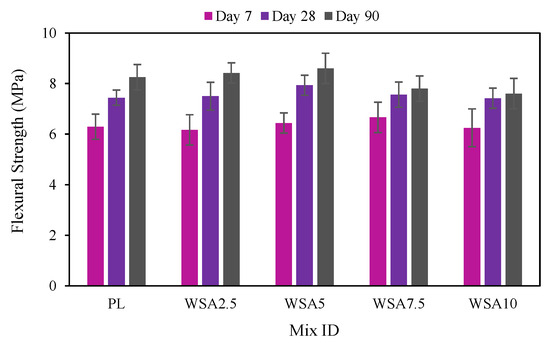
Figure 10.
Flexural strength results.
By 28 days, WSA5 reaches its peak flexural strength of 7.93 MPa, representing a 6.6% improvement compared to PL. This confirms that 5% WSA replacement promotes effective pozzolanic activation and contributes to improved matrix integrity.
However, higher WSA dosages (7.5–10%) show a slight decline in flexural strength after 28 days. At 90 days, WSA10 registers a 7.9% decrease compared to PL, while WSA7.5 and WSA2.5 exhibit relatively stable performance. These results suggest that beyond a certain threshold, increasing WSA content may reduce flexural strength due to clinker dilution and insufficient C–S–H formation.
Overall, the findings indicate that WSA replacement levels up to 5% enhance the flexural performance of cement mortar. Beyond this limit, mechanical performance may diminish due to disruptions in the cementitious matrix. The reliability of the data is supported by low standard errors (≤±0.75 MPa) across all measurements.
Ahmad et al. [53] reported the highest flexural strength at 14% WSA substitution in cement, while Bheel et al. [31] observed significant strength reduction in mixtures containing 20% WSA, further supporting the dose-dependent behaviour of slag-based admixtures.
3.3. TGA, FT-IR, XRD, and SEM-EDS Analysis
SEM-EDS analysis serves as a crucial tool for characterizing the microstructure and elemental composition of cementitious composites. In this study, the presence of key elements such as silicon (Si), aluminum (Al), and sodium (Na) in the WSA-modified mortars confirms the pozzolanic nature of WSA. Moderate quantities of elements like Al, Ca, and potassium K are likely derived from residual minerals present in the original biomass [54,55]. The high amorphous silica content of WSA reacts with CH to form additional C-S-H gel, thus improving the mechanical properties and densifying the matrix as described in Equation (1) [13,56,57].
This pozzolanic reaction follows the general form:
Figure 11 and Figure 12 show that the PL and WSA2.5 samples have non-uniform distributions of hydration products. In contrast, Figure 13, Figure 14 and Figure 15 reveal that as WSA content increases, particularly in WSA5 and WSA7.5 samples, the spatial distribution of Ca and Si becomes more homogeneous, indicating a denser and more continuous C–S–H gel formation [22,39,58]. Moreover, localized concentrations of Na, Al, and Si in the matrix suggest the formation of sodium aluminum silicate phases. These phases can be advantageous at early ages due to their alkaline nature, which accelerates early hydration, refines the pore structure, and thereby enhances strength development. However, this same alkaline nature is the source of a significant long-term risk: the reactive silica content, in combination with cement alkalis, may increase the susceptibility to ASR. The additional alkalis released by WSA can react with reactive silica phases in aggregates. If not properly controlled, such reactions could occur particularly in interfacial transition zones, leading to expansive gel formation and microcracking [25].
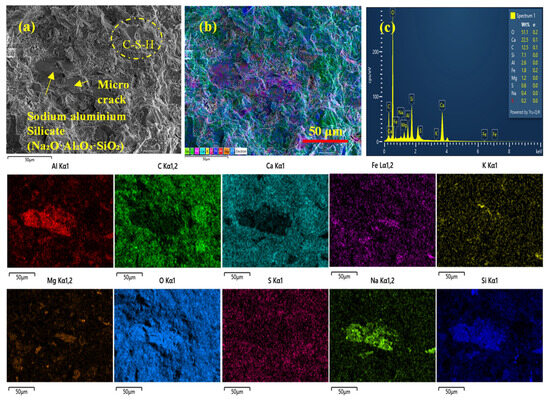
Figure 11.
Microstructural characterization of PL sample: (a) SEM image showing morphological features, (b) EDS elemental mapping displaying spatial distribution of components, (c) EDS spectrum with elemental composition analysis.
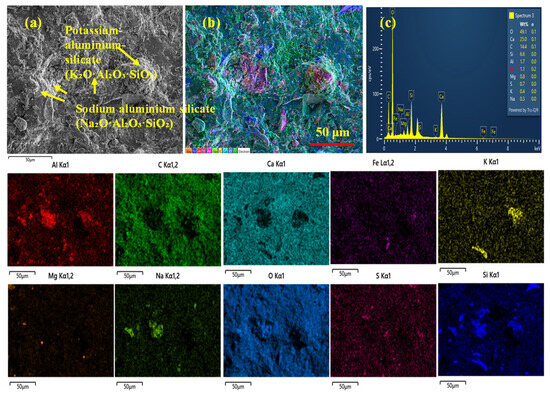
Figure 12.
Microstructural characterization of WSA2.5 sample: (a) SEM image showing morphological features, (b) EDS elemental mapping displaying spatial distribution of components, (c) EDS spectrum with elemental composition analysis.
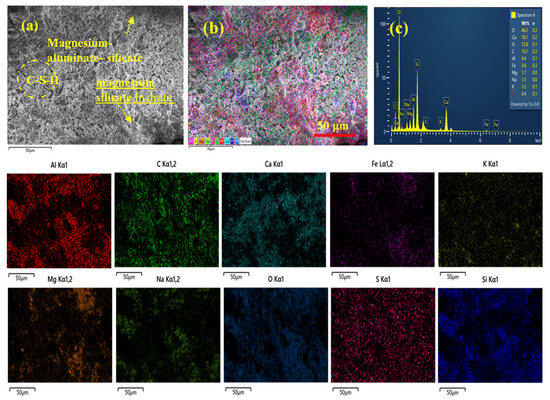
Figure 13.
Microstructural characterization of WSA5 sample: (a) SEM image showing morphological features, (b) EDS elemental mapping displaying spatial distribution of components, (c) EDS spectrum with elemental composition analysis.
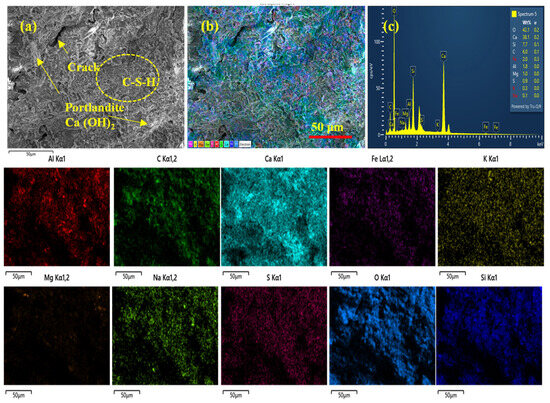
Figure 14.
Microstructural characterization of WSA7.5 sample: (a) SEM image showing morphological features, (b) EDS elemental mapping displaying spatial distribution of components, (c) EDS spectrum with elemental composition analysis.
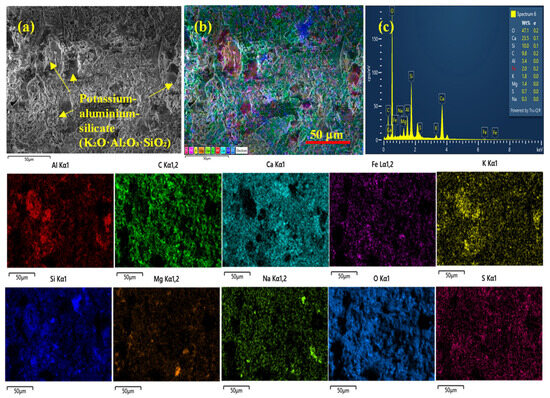
Figure 15.
Microstructural characterization of WSA10 sample: (a) SEM image showing morphological features, (b) EDS elemental mapping displaying spatial distribution of components, (c) EDS spectrum with elemental composition analysis.
In parallel, the results demonstrate the formation of other beneficial phases, including potassium aluminum silicate, magnesium aluminate (MgAl2O4), and magnesium silicate (Mg2SiO4) within the matrix [59]. These K and Mg containing compounds are reported to further refine the pore structure, reduce permeability, enhance resistance against aggressive agents such as sulphates and chlorides, and contribute to early strength development [60,61].
For this reason, the recommended WSA dosage of 5–7.5% reflects an optimal compromise: it secures the benefits of improved early strength and microstructural refinement contributed by both the sodium-based and the K/Mg-based phases while minimizing the potential risk of ASR-related deterioration.
The XRD patterns presented in Figure 16 provide important information on the phase analysis and pozzolanic reactivity of the cementitious composites. The characteristic CH reflections observed at 2θ ≈ 18° and ≈34° in Figure 16b,c exhibit significant peak intensity reduction in WSA-modified samples, quantitatively demonstrating that CH is consumed through pozzolanic reactions. In addition, the increase in the quartz peak at 2θ ≈ 21° in Figure 16d indicates the presence of reactive silica involved in secondary hydration reactions [62].
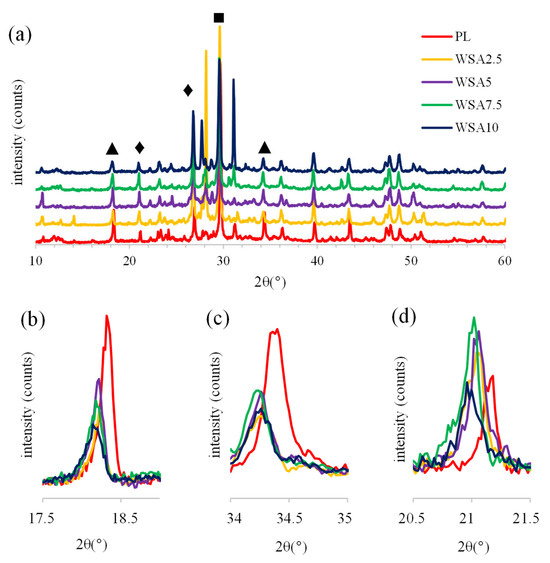
Figure 16.
XRD phase analysis of cementitious composites: (a) Comparative diffraction patterns of all mixtures, (b) Detailed view of CH peaks at 2θ ≈ 18°, (c) Detailed view of CH peaks at 2θ ≈ 34°, (d) Characteristic quartz reflections showing crystallinity changes at 2θ ≈ 21°. Marked as CH (▲), quartz (♦), calcite (■).
These structural changes are strongly correlated with mechanical performance increases and confirm the effectiveness of WSA as a complementary cementitious material. No new crystalline phases appear in the WSA-modified mortars, indicating that the primary reaction product is amorphous C–S–H gel. Small calcite peaks observed at 2θ ≈ 29.5° suggest limited carbonation on the sample surfaces. Collectively, these results confirm that WSA effectively promotes pozzolanic reactions, enhancing matrix densification and mechanical strength by facilitating the transformation of CH into additional C–S–H gel.
The TGA is employed to evaluate the thermal stability and hydration characteristics of the cementitious composites. As shown in Figure 17 and Table 6, distinct mass losses correspond to different phases: bound water (0–250 °C), CH decomposition (400–500 °C), and calcite decomposition (650–750 °C) [63].
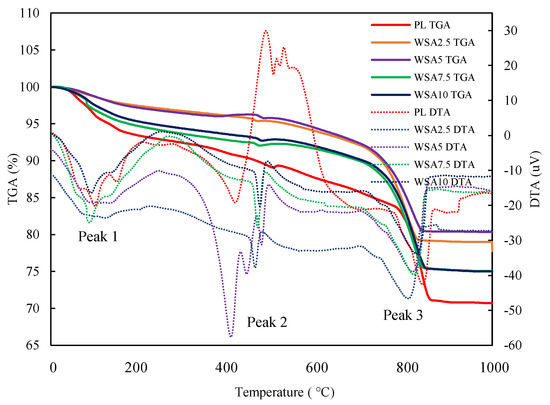
Figure 17.
Thermogravimetric-differential thermal analysis (TGA-DTA) of cement-based composites.
Among all mixtures, the WSA5 sample exhibits the lowest CH-related mass loss (0.26%), indicating the highest level of CH consumption due to pozzolanic activity. Furthermore, WSA-containing specimens show reduced bound water loss compared to the plain mixture (e.g., PL = 7.01%, WSA2.5 = 2.76%), which reflects the densification of the pore system and enhanced matrix compactness. This behaviour is attributed to the filler effect and reactive nature of the fine WSA particles [31,64,65].
The increased mass loss in the carbonate region (e.g., 8.27–9.11%) in WSA samples suggests the formation of secondary carbonate phases, likely due to the reaction of WSA-derived alkalis with atmospheric CO2 [66]. While moderate carbonation may contribute to surface passivation, excessive carbonation can affect long-term durability if not managed properly.
The CH content, expressed as CH %, is determined based on the dehydration of cement pastes occurring between 400 and 500 °C, following the calculation outlined in Equation (2). Figure 18 shows the change in CH content based on temperature-dependent mass losses from TGA, as calculated using Equation (2). Accordingly, a significant reduction in CH is observed with WSA substitution, which serves as a clear indicator of pozzolanic reaction [22,67].
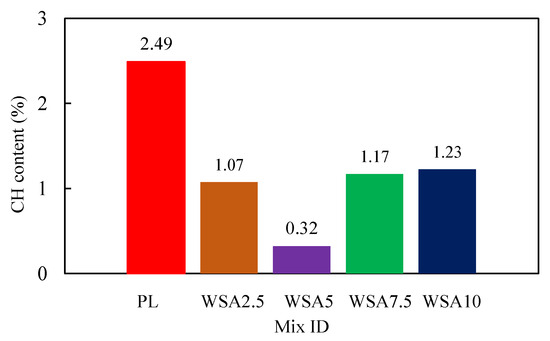
Figure 18.
CH content based on mass loss from TGA.
Table 6.
Thermogravimetric data.
Table 6.
Thermogravimetric data.
| Mix ID | Mass Loss (%) Temperature Range | ||
|---|---|---|---|
| 0–250 °C Bound H2O [68,69,70] | 400–500 °C Ca (OH)2 (Dehydration) [68,69,70] | 1000 °C Total Mass Loss | |
| PL | 7.01 | 1.76 | 29.34 |
| WSA2.5 | 2.76 | 0.85 | 21.00 |
| WSA5 | 3.07 | 0.26 | 19.65 |
| WSA7.5 | 5.60 | 0.88 | 24.94 |
| WSA10 | 5.04 | 0.92 | 25.00 |
FT-IR spectroscopy is used to detect the functional groups and molecular bonds within the cementitious matrix [71]. As shown in Figure 19, all WSA-modified mortars exhibit increased intensity in the 900–1100 cm−1 region, which corresponds to asymmetric Si–O stretching vibrations [47,54,72,73,74,75]. All cement blended samples showed a primary C−S−H gel band at 957, indicating Si−O stretching [47]. This rise in intensity indicates enhanced C–S–H gel formation due to the active pozzolanic reaction of WSA [67]. However, WSA mixtures also show increased carbonate-related bands at 1408 cm−1 and, 873 cm−1, reflecting the formation of CO32− groups [54,76,77]. While moderate carbonation is typical, excess may lower alkalinity and increase the risk of steel reinforcement corrosion over time [78]. The peaks observed in the regions of 3400–3200 cm−1 (O–H stretching) and 1650 cm−1 (H–O–H bending) in the FT-IR spectra indicate the presence of physically and chemically bound water in the system [73,79,80]. As the WSA replacement level increases, notable variations appear in the intensity of these bands. The WSA7.5 sample, in particular, exhibits the most pronounced peaks in these regions, suggesting a higher amount of physically bound water. Although the TGA results show that the PL contains the highest total amount of bound water, the WSA7.5 sample displays both a strong water-related signal in FT-IR and a moderate water content in TGA, indicating an optimal internal moisture balance. This observation becomes more meaningful when the FT-IR and TGA results are evaluated together. Therefore, despite having a slightly lower total bound water content than the PL sample, WSA7.5 appears to provide better resistance to shrinkage-induced cracking due to its enhanced water retention capacity and the formation of a denser C–S–H gel structure [81]. Together, TGA and FT-IR results reinforce the conclusion that 5–7.5% WSA substitution enhances hydration, densifies the microstructure, and improves thermal stability, while maintaining acceptable levels of carbonation-related transformation.
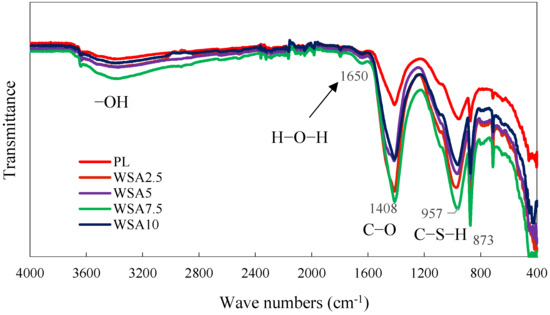
Figure 19.
FT-IR spectra of WSA-modified mortars at 28 days.
3.4. Ultrasonic Pulse Velocity Test (UPV)
UPV testing is employed to assess the internal quality and homogeneity of the hardened mortar [39,82,83]. Higher UPV values generally indicate a denser microstructure with fewer internal voids or defects [39]. The test is conducted in accordance with BIS 13311-92 standards [84] after 28 days of curing.
As presented in Table 7, all mortar mixtures, including the PL, fall within the “Good” concrete quality range (3500–4500 ms−1). The WSA7.5 mixture achieves the highest UPV value at 4355 ms−1, indicating the most refined internal structure among all samples. This suggests that 7.5% WSA incorporation enhances particle packing and matrix continuity.
Table 7.
UPV analysis results of mortars (day 28).
The WSA5 and WSA2.5 samples also show improved UPV values (4300 and 4250 ms−1, respectively) compared to PL (4150 ms−1), while the WSA10 mixture exhibits a slight reduction (4255 ms−1), likely due to excessive dilution of cement clinker.
These findings confirm that the inclusion of WSA contributes positively to the densification of the mortar matrix and enhances its internal structural integrity [22,39]. However, at WSA levels above 7.5%, efficacy appears to decrease and the importance of dosage optimization is emphasized.
4. Conclusions and Recommendations
This study investigates the potential of wheat straw ash (WSA) as a sustainable supplementary cementitious material (SCM) for partial cement replacement in mortar. The experimental findings confirm that WSA exhibits strong pozzolanic reactivity due to its high amorphous silica content (85.19 wt.%) and optimal calcination at 700 °C.
Key conclusions are as follows:
- A 5% WSA replacement (WSA5) achieves the highest compressive strength (48.42 MPa at 90 days) and flexural strength (7.93 MPa at 28 days), outperforming the control mix. Replacements above 7.5% result in diminished strength gains due to clinker dilution.
- SEM-EDS, XRD, and TGA analyses confirm that WSA enhances the formation of C–S–H gel and leads to almost complete consumption of CH.
- UPV testing shows improved internal matrix quality with WSA incorporation, especially at 7.5%. Thermal analysis reveals reduced bound water and CH content, indicating denser and more stable microstructures. However, care must be taken to avoid excessive carbonation and ASR risks, particularly at higher WSA dosages.
- The use of WSA supports circular economy principles by reducing clinker demand, offering a productive solution to agricultural waste management. The study associates the use of WSA with reduced uncontrolled stubble burning and reduced pollution levels in provinces such as Diyarbakir.
- This study quantitatively reveals the devastating impacts of the severe stubble fire on air quality in Diyarbakir between 20 and 24 June 2024. Ground-based measurements show that PM10 concentrations during the fire period reach 157 μg/m3, four times higher than the June average (≈35 μg/m3). Similarly, satellite (Sentinel-5P) measurements confirm the critical threat of agricultural burning on regional air quality and public health, with NO2 and SO2 levels increasing by 23% and 41%, respectively.
In conclusion, WSA proves to be a viable and eco-efficient SCM. An optimal replacement range of 5–7.5% is recommended to balance mechanical performance, durability, and environmental benefits. These results support the integration of WSA in sustainable construction practices and contribute to global efforts toward decarbonizing the cement industry. Future studies are recommended to assess long-term durability aspects, such as alkali–silica reaction and sulphate resistance, as well as to conduct a comprehensive life-cycle assessment to fully quantify the environmental benefits of WSA incorporation.
Author Contributions
Conceptualization, M.D. and S.Y.Ç.; methodology M.D. and S.Y.Ç.; validation M.D. and S.Y.Ç.; formal analysis, M.D. and S.Y.Ç.; investigation M.D.; resources, M.D. and S.Y.Ç.; data curation, M.D.; writing—original draft preparation, M.D. and S.Y.Ç.; writing—review and editing, M.D. and S.Y.Ç.; visualization, M.D. and S.Y.Ç. All authors have read and agreed to the published version of the manuscript.
Funding
This research received no external funding.
Data Availability Statement
Data sharing not applicable.
Conflicts of Interest
The authors declare no conflicts of interest.
References
- Bakanlığı, T.V.O. Bitkisel Üretim Verileri. 2024. Available online: https://arastirma.tarimorman.gov.tr/ (accessed on 3 March 2025).
- USDA Foreign Agricultural Service. Global Wheat Production. 2024. Available online: https://fas.usda.gov/data/production/commodity/0410000 (accessed on 3 March 2025).
- Montero, G.; Coronado, M.A.; García, C.; Campbell, H.E.; Montes, D.G.; Torres, R.; Pérez, L.; León, J.A.; Ayala, J.R. Wheat straw open burning: Emissions and impact on climate change. In Global Wheat Production; IntechOpen: London, UK, 2018. [Google Scholar]
- Mohite, J.; Sawant, S.; Pandit, A.; Pappula, S. Impact of lockdown and crop stubble burning on air quality of India: A case study from wheat-growing region. Environ. Monit. Assess 2022, 194, 77. [Google Scholar] [CrossRef]
- Ajansı, A. Diyarbakır ve Mardin’de 15 Kişinin Hayatını Kaybettiği Yangına Ilişkin yeni Bilirkişi Raporu Hazırlandı. 2024. Available online: https://www.aa.com.tr/tr/gundem/diyarbakir-ve-mardinde-15-kisinin-hayatini-kaybettigi-yangina-iliskin-yeni-bilirkisi-raporu-hazirlandi/3428728 (accessed on 21 May 2025).
- Bbc.com. Diyarbakır ve Mardin’de Yangın: 15 kişi Hayatını Kaybetti. 2024. Available online: https://www.bbc.com/turkce/articles/cx88zyz8nz5o (accessed on 21 May 2025).
- Gursel, A.P. Life-Cycle Assessment of Concrete: Decision-Support Tool and Case Study Application. Ph.D. Thesis, University of California, Berkeley, CA, USA, 2014. [Google Scholar]
- Dadd, L.; Bennett, B.; Xie, T.; Visintin, P. Shear behaviour and environmental impact of single and multi-generation recycled aggregate concrete beams. Eng. Struct. 2025, 322, 119200. [Google Scholar] [CrossRef]
- Turkish Cement Sector. 2023. Available online: https://turkcimento.org.tr/ (accessed on 3 March 2025).
- Karar.com. 2024. Available online: https://www.karar.com/guncel-haberler/diyarbakir-ve-mardindeki-yanginin-zarari-700-milyon-lira-aileler-maddi-1873191 (accessed on 21 May 2025).
- Al-Akhras, N.M. Durability of wheat straw ash concrete exposed to freeze–thaw damage. Proc. Inst. Civ. Eng. Constr. Mater. 2011, 164, 79–86. [Google Scholar] [CrossRef]
- Binici, H.; Yucegok, F.; Aksogan, O.; Kaplan, H. Effect of Corncob, Wheat Straw, and Plane Leaf Ashes as Mineral Admixtures on Concrete Durability. J. Mater. Civ. Eng. 2008, 20, 478–483. [Google Scholar] [CrossRef]
- Doğruyol, M. Characterization of historic mortars and the effect of rice husk ash (RHA) on quicklime. Case Stud. Constr. Mater. 2024, 21, e03542. [Google Scholar] [CrossRef]
- Durmaz, M.; Doğruyol, M. Pistachio Shell Ash in Agro-Waste Cement Composites: A Pathway to Low-Carbon Binders. Sustainability 2025, 17, 4003. [Google Scholar] [CrossRef]
- Kamau, J.; Ahmed, A.; Hirst, P.; Kangwa, J. Suitability of Corncob Ash as a Supplementary Cementitious Material. Int. J. Mater. Sci. Eng. 2016, 4, 215–228. [Google Scholar]
- Biricik, H.; Aköz, F.; Berktay, I.; Tulgar, A.N. Study of pozzolanic properties of wheat straw ash. Cem. Concr. Res. 1999, 29, 637–643. [Google Scholar] [CrossRef]
- Ahmad, J.; Arbili, M.M.; Alabduljabbar, H.; Deifalla, A.F. Concrete made with partially substitution corn cob ash: A review. Case Stud. Constr. Mater. 2023, 18, e02100. [Google Scholar] [CrossRef]
- Chopra, D.; Siddique, R. Strength, permeability and microstructure of self-compacting concrete containing rice husk ash. Biosyst. Eng. 2015, 130, 72–80. [Google Scholar] [CrossRef]
- Șerbănoiu, A.A.; Grădinaru, C.M.; Muntean, R.; Cimpoeșu, N.; Șerbănoiu, B.V. Corn Cob Ash versus Sunflower Stalk Ash, Two Sustainable Raw Materials in an Analysis of Their Effects on the Concrete Properties. Materials 2022, 15, 868. [Google Scholar] [CrossRef]
- BS EN 196-6:2018; Methods of Testing Cement Is Classified in These ICS Categories: 91.100.10 Cement. Gypsum. Lime. Mortar. European Standards: Plzen, Czech Republic, 2018.
- ASTM 204; Standard Test Methods for Fineness of Hydraulic Cement by Air-Permeability Apparatus. ASTM International: West Conshohocken, PA, USA, 2023.
- Qudoos, A.; Kakar, E.; Rehman, A.U.; Jeon, I.K.; Kim, H.G. Influence of Milling Techniques on the Performance of Wheat Straw Ash in Cement Composites. Appl. Sci. 2020, 10, 3511. [Google Scholar] [CrossRef]
- Taylor, J.C.; Aldridge, L.P. Full-profile Rietveld quantitative XRD analysis of Portland cement: Standard XRD profiles for the major phase tricalcium silicate (C3S: 3CaO.SiO2). Powder Diffr. 1993, 8, 138–144. [Google Scholar] [CrossRef]
- Quennoz, A.; Scrivener, K.L. Hydration of C3A–gypsum systems. Cem. Concr. Res. 2012, 42, 1032–1041. [Google Scholar] [CrossRef]
- Doğruyol, M. Determination of ASR in Concrete Using Characterization Methods. Buildings 2024, 14, 657. [Google Scholar] [CrossRef]
- Gulmez, N. Roles of aluminum shavings and calcite on engineering properties of cement-based composites. J. Clean. Prod. 2020, 277, 124104. [Google Scholar] [CrossRef]
- Doğruyol, M.; Karaşin, A. Sülfatın beton ve betonarme elemanlara olumsuz etkisi. Dicle Üniversitesi Mühendislik Fakültesi Mühendislik Derg. 2011, 2, 79–85. [Google Scholar]
- Karasin, A.; Hadzima-Nyarko, M.; Işık, E.; Doğruyol, M.; Karasin, I.B.; Czarnecki, S. The Effect of Basalt Aggregates and Mineral Admixtures on the Mechanical Properties of Concrete Exposed to Sulphate Attacks. Materials 2022, 15, 1581. [Google Scholar] [CrossRef]
- Collepardi, M. Thaumasite formation and deterioration in historic buildings. Cem. Concr. Compos. 1999, 21, 147–154. [Google Scholar] [CrossRef]
- ASTM C618-22; Methods of Testing Cement—Part 6: Determination of Fineness. iTeh standards: Toronto, AB, Canada, 2010.
- Bheel, N.; Sohu, S.; Awoyera, P.; Kumar, A.; Abbasi, S.A.; Olalusi, O.B. Effect of Wheat Straw Ash on Fresh and Hardened Concrete Reinforced with Jute Fiber. Adv. Civ. Eng. 2021, 2021, 6659125. [Google Scholar] [CrossRef]
- Elahi, M.A.; Shearer, C.R.; Reza, A.N.R.; Saha, A.K.; Khan, N.N.; Hossain, M.; Sarker, P.K. Improving the sulfate attack resistance of concrete by using supplementary cementitious materials (SCMs): A review. Constr. Build. Mater. 2021, 281, 122628. [Google Scholar] [CrossRef]
- Liu, K.; Sun, D.; Wang, A.; Zhang, G.; Tang, J. Long-Term Performance of Blended Cement Paste Containing Fly Ash against Sodium Sulfate Attack. J. Mater. Civ. Eng. 2018, 30, 04018309. [Google Scholar] [CrossRef]
- Shakouri, M.; Exstrom, C.L.; Ramanathan, S.; Suraneni, P. Hydration, strength, and durability of cementitious materials incorporating untreated corn cob ash. Constr. Build. Mater. 2020, 243, 118171. [Google Scholar] [CrossRef]
- Doğruyol, M.; Durmaz, M. The Effect Of Pistachio Vera Shell Ash (PSA) on Concrete Performance. Bitlis Eren Üniversitesi Fen Bilim. Derg. 2025, 14, 513–528. [Google Scholar] [CrossRef]
- Chancey, R.T.; Stutzman, P.; Juenger, M.C.; Fowler, D.W. Comprehensive phase characterization of crystalline and amorphous phases of a Class F fly ash. Cem. Concr. Res. 2010, 40, 146–156. [Google Scholar] [CrossRef]
- Yan, K.; Guo, Y.; Ma, Z.; Zhao, Z.; Cheng, F. Quantitative analysis of crystalline and amorphous phases in pulverized coal fly ash based on the Rietveld method. J. Non-Crystalline Solids 2018, 483, 37–42. [Google Scholar] [CrossRef]
- Šupić, S.; Malešev, M.; Radonjanin, V.; Bulatović, V.; Milović, T. Reactivity and Pozzolanic Properties of Biomass Ashes Generated by Wheat and Soybean Straw Combustion. Materials 2021, 14, 1004. [Google Scholar] [CrossRef] [PubMed]
- Qudoos, A.; Kim, H.G.; Rehman, A.U.; Ryou, J.-S. Effect of mechanical processing on the pozzolanic efficiency and the microstructure development of wheat straw ash blended cement composites. Constr. Build. Mater. 2018, 193, 481–490. [Google Scholar] [CrossRef]
- Hava kalitesi Çevre Şehircilik ve İklim Değişikliği Bakanlığı. 2024. Available online: https://sim.csb.gov.tr/STN/STN_Report/DataBank (accessed on 5 January 2025).
- Moon, J.; Bae, S.; Celik, K.; Yoon, S.; Kim, K.-H.; Kim, K.S.; Monteiro, P.J. Characterization of natural pozzolan-based geopolymeric binders. Cem. Concr. Compos. 2014, 53, 97–104. [Google Scholar] [CrossRef]
- Aksoğan, O.; Binici, H.; Ortlek, E. Durability of concrete made by partial replacement of fine aggregate by colemanite and barite and cement by ashes of corn stalk, wheat straw and sunflower stalk ashes. Constr. Build. Mater. 2016, 106, 253–263. [Google Scholar] [CrossRef]
- ASTM C305-20; Standard Practice for Mechanical Mixing of Hydraulic Cement Pastes and Mortars of Plastic Consistency. ASTM International: West Conshohocken, PA, USA, 2020.
- ASTM C 490; Practice for Use of Apparatus for the Determination of Length Change of Hardened Cement Paste, Mortar, and Concrete. ASTM International: West Conshohocken, PA, USA, 2011.
- ASTM C 597-02; Pulse Velocity Through Concrete. American Society for Testing and Material: West Conshohocken, PA, USA, 2003.
- EN 12504-4; Testing Concrete–Part 4: Determination of Ultrasonic Pulse Velocity. ASTM International: West Conshohocken, PA, USA, 2004; Volume 18.
- Amin, M.N.; Siffat, M.A.; Shahzada, K.; Khan, K. Influence of Fineness of Wheat Straw Ash on Autogenous Shrinkage and Mechanical Properties of Green Concrete. Crystals 2022, 12, 588. [Google Scholar] [CrossRef]
- Liu, T.; He, G.; Lau, A.K.H. Statistical evidence on the impact of agricultural straw burning on urban air quality in China. Sci. Total Environ. 2020, 711, 134633. [Google Scholar] [CrossRef]
- Yildirim, A. The Stubble Burning Problem in Sustainable Agriculture. Int. J. Innov. Eng. Appl. 2023, 7, 1–6. [Google Scholar] [CrossRef]
- Çetin, S.Y. An experimental study of basalt aggregate concrete according to different size effect laws. Alex. Eng. J. 2025, 120, 358–370. [Google Scholar] [CrossRef]
- Memon, S.A.; Wahid, I.; Khan, M.K.; Tanoli, M.A.; Bimaganbetova, M. Environmentally friendly utilization of wheat straw ash in cement-based composites. Sustainability 2018, 10, 1322. [Google Scholar] [CrossRef]
- Al-Akhras, N.M.; Abu-Alfoul, B.A. Effect of wheat straw ash on mechanical properties of autoclaved mortar. Cem. Concr. Res. 2002, 32, 859–863. [Google Scholar] [CrossRef]
- Ahmad, M.R.; Sharif, M.B.; Ali, H.A.; Hussain, M.; Chen, B. Experimental investigation of pozzolanic concrete containing wheat straw ash. Can. J. Civ. Eng. 2019, 46, 941–951. [Google Scholar] [CrossRef]
- Chaturvedi, K.; Srivastava, A.K.; Verma, S. Comparative study on the thermal insulating potential of rice and wheat straw ash-based composite using marble waste. Mater. Sci. Eng. B 2025, 322, 118670. [Google Scholar] [CrossRef]
- Wu, S.; Chen, J.; Peng, D.; Wu, Z.; Li, Q.; Huang, T. Effects of Water Leaching on the Ash Sintering Problems of Wheat Straw. Energies 2019, 12, 387. [Google Scholar] [CrossRef]
- Wang, B.; Yao, W.; Stephan, D. Preparation of calcium silicate hydrate seeds by means of mechanochemical method and its effect on the early hydration of cement. Adv. Mech. Eng. 2019, 11. [Google Scholar] [CrossRef]
- Mehta, P.K.; Monteiro, P.J.M. Concrete: Microstructure, Properties, and Materials, 4th ed.; McGraw Hill: New York, NY, USA, 2014. [Google Scholar]
- Strandberg, A.; Skoglund, N.; Thyrel, M. Morphological characterisation of ash particles from co-combustion of sewage sludge and wheat straw with X-ray microtomography. Waste Manag. 2021, 135, 30–39. [Google Scholar] [CrossRef]
- Chen, C.; Peng, F.; Zhang, R.; Jiu, S.; Chen, Y. Enhancement of interfacial corrosion resistance between aluminum powder–modified zinc silicate–potassium silicate coating and steel bars for sand-based autoclaved aerated concrete. Colloids Surfaces A Physicochem. Eng. Asp. 2024, 698, 134533. [Google Scholar] [CrossRef]
- Mohsen, A.; Ramadan, M.; Habib, A.; Abdel-Gawwad, H.A. Evaluating the role of magnesium aluminate nano spinel in phase composition, meso-porosity, compressive strength, and drying shrinkage of alkali-activated slag. Constr. Build. Mater. 2023, 409, 133857. [Google Scholar] [CrossRef]
- Chen, J.; Yang, J.; Xiao, G.; Ding, D.; Yin, C.; Wang, Q.; Li, X.; Zang, Y.; Dong, B.; Xiong, F. The effect of pre-dehydrated magnesium-silicate-hydrate on the properties of the castables bonded with hydrable magnesium carboxylate. Ceram. Int. 2024, 50, 53502–53510. [Google Scholar] [CrossRef]
- Doğruyol, M.; Gönül, A.; Tunçel, O.; Altun, B.; Yılmaz, A.; Durmaz, M.; Hansu, F. Integrated assessment of mechanical, microstructural, and thermal behaviour of a fly ash-stabilized earthen building material. J. Build. Eng. 2025, 113, 113871. [Google Scholar] [CrossRef]
- Doğruyol, M.; Ayhan, E.; Karaşin, A. Effect of waste steel fiber use on concrete behavior at high temperature. Case Stud. Constr. Mater. 2024, 20, e03051. [Google Scholar] [CrossRef]
- Kioumarsi, M.; Azarhomayun, F.; Haji, M.; Shekarchi, M. Effect of Shrinkage Reducing Admixture on Drying Shrinkage of Concrete with Different w/c Ratios. Materials 2020, 13, 5721. [Google Scholar] [CrossRef]
- Zhou, B.; Ma, Y.; Sha, S.; Wang, Y.; Liu, Y.; Xiao, Y.; Shi, C. Synthesis, performance and mechanism of shrinkage-reducing agents with water-reducing function for cement-based materials. Constr. Build. Mater. 2024, 425, 135994. [Google Scholar] [CrossRef]
- Demirbas, A. Carbon dioxide disposal via carbonation, Energy Sources, Part A: Recovery. Util. Environ. Eff. 2007, 29, 59–65. [Google Scholar] [CrossRef]
- Khan, K.; Ishfaq, M.; Amin, M.N.; Shahzada, K.; Wahab, N.; Faraz, M.I. Evaluation of Mechanical and Microstructural Properties and Global Warming Potential of Green Concrete with Wheat Straw Ash and Silica Fume. Materials 2022, 15, 3177. [Google Scholar] [CrossRef]
- Bažant, Z.P.; Kaplan, M.F.; Bazant, Z.P. Concrete at High Temperatures: Material Properties and Mathematical Models; Longman Group Limited: London, UK, 1996. [Google Scholar]
- Noumowe, A. Effet de Hautes Températures (20–600 °C) Sur le Béton: Cas Particulier du Béton a Hautes Performances. Ph.D. Thesis, University of Lyon, Lyon, France, 1995. [Google Scholar]
- Platret, G. Suivi de l’hydratation du ciment et de l’évolution des phases solides dans les bétons par analyse thermique, caractéristiques microstructurales et propriétés relativesa la durabilité des bétons. 2002; 58. [Google Scholar]
- Nari, V.; Praneeth, P.H.; Manchana, V. A comparative study on the thermal behaviour of PPC and OPC cement. Mater. Today: Proc. 2020, 39, 1588–1593. [Google Scholar] [CrossRef]
- Malathy, R.; Shanmugam, R.; Chung, I.-M.; Kim, S.-H.; Prabakaran, M. Mechanical and Microstructural Properties of Composite Mortars with Lime, Silica Fume and Rice Husk Ash. Processes 2022, 10, 1424. [Google Scholar] [CrossRef]
- Horgnies, M.; Chen, J.J.; Bouillon, C. Overview about the use of Fourier transform infrared spectroscopy to study cementitious materials. In WIT Transactions on Engineering Sciences; WIT Press: Billerica, MA, USA, 2013; Volume 77. [Google Scholar]
- Doğruyol, M. Characterisation of acrylic copolymer treated concretes and concretes of reinforced concrete buildings collapsed in the 6 February 2023 Mw = 7.8 Kahramanmaraş (Türkiye) earthquake. Eng. Fail. Anal. 2024, 161, 108249. [Google Scholar] [CrossRef]
- Doğruyol, M.; Gönül, A.; Başboğa, M. Comparative analysis of cement-based and historic gypsum-based mortars for historical Restoration: Implications on mechanical and thermal compatibility. J. Build. Eng. 2025, 109, 112982. [Google Scholar] [CrossRef]
- Ahmed, D.; Abdallah, S.H.; Ragai, S.M. Hydration Characteristics and Leaching Behavior of Different Mixes of Slag Based—Geopolymer Cement in Presence of Heavy Metals. Egypt. J. Chem. 2023, 66, 37–48. [Google Scholar] [CrossRef]
- Li, Z.; Dong, H.; Wang, Y.; Men, J.; Wang, J.; Zhao, X.; Zou, S. Valorization of Alkali–Thermal Activated Red Mud for High-Performance Geopolymer: Performance Evaluation and Environmental Effects. Buildings 2025, 15, 2471. [Google Scholar] [CrossRef]
- Isgor, O.B.; Razaqpur, A. Finite element modeling of coupled heat transfer, moisture transport and carbonation processes in concrete structures. Cem. Concr. Compos. 2004, 26, 57–73. [Google Scholar] [CrossRef]
- Chollet, M.; Horgnies, M. Analyses of the surfaces of concrete by Raman and FT-IR spectroscopies: Comparative study of hardened samples after demoulding and after organic post-treatment. Surf. Interface Anal. 2011, 43, 714–725. [Google Scholar] [CrossRef]
- Li, Z.; Dong, H.; Zhao, X.; Wang, K.; Gao, X. Utilisation of Bayer red mud for high-performance geopolymer: Competitive roles of different activators. Case Stud. Constr. Mater. 2025, 23, e05047. [Google Scholar] [CrossRef]
- Dumoulin, Y.; Alex, S.; Szabo, P.; Cartilier, L.; Mateescu, M.A. Cross-linked amylose as matrix for drug-controlled release. X-ray and FT-IR structural analysis. Carbohydr. Polym. 1998, 37, 361–370. [Google Scholar] [CrossRef]
- Koksal, F.; Gencel, O.; Kaya, M. Combined effect of silica fume and expanded vermiculite on properties of lightweight mortars at ambient and elevated temperatures. Constr. Build. Mater. 2015, 88, 175–187. [Google Scholar] [CrossRef]
- Zebari, Z.; Bedirhanoğlu, İ.; Aydın, E. Beton basınç dayanımının ultrasonik ses dalgası yayılma hızı ile tahmin edilmesi. Dicle Üniversitesi Mühendislik Fakültesi Mühendislik Dergisi 2016, 8, 43–52. [Google Scholar]
- IS 1331; Non-Destructive Testing of Concrete Methods of Test, Part 1. Bureau of Indian Standards: New Delhi, India, 1992; 110002.
Disclaimer/Publisher’s Note: The statements, opinions and data contained in all publications are solely those of the individual author(s) and contributor(s) and not of MDPI and/or the editor(s). MDPI and/or the editor(s) disclaim responsibility for any injury to people or property resulting from any ideas, methods, instructions or products referred to in the content. |
© 2025 by the authors. Licensee MDPI, Basel, Switzerland. This article is an open access article distributed under the terms and conditions of the Creative Commons Attribution (CC BY) license (https://creativecommons.org/licenses/by/4.0/).