Article

Electronics Shops in Saint-Louis: A Participative Mapping of Value, Quality, and Prices Within the Market Hierarchy in a Secondary Senegalese City

by
Pablo De Roulet
1,*,
Jérôme Chenal
1,2,
Jean-Claude Baraka Munyaka
1,
Moussa Diallo
3,
Derguene Mbaye
3,
Mamadou Lamine Ndiaye
3,
Madoune Robert Seye
3,
Dimitri Samuel Adjanohoun
4,
Tatiana Mbengue
4,
Djiby Sow
4 and
Cheikh Samba Wade
4
1
Urban and Regional Planning Community (CEAT), École Polytechnique Fédérale de Lausanne (EPFL), CH-1015 Lausanne, Switzerland
2
Center of Urban Systems, Mohammed VI Polytechnic University (UM6P), Ben Guerir 43150, Morocco
3
Département de Génie Informatique, École Supérieure Polytechnique de Dakar (ESP), Dakar 10700, Senegal
4
Unité de Formation et de Recherche Lettres et Sciences Humaines, Université Gaston Berger de Saint-Louis-du-Sénégal (UGB), Saint-Louis 32000, Senegal
*
Author to whom correspondence should be addressed.
Sustainability 2025, 17(19), 8959; https://doi.org/10.3390/su17198959
Submission received: 21 July 2025 / Revised: 17 September 2025 / Accepted: 28 September 2025 / Published: 9 October 2025

Abstract

Digital connectivity depends not only on infrastructure, but also on the material devices used to access networks. This study examines electronic devices’ availability and prices in Saint-Louis, a mid-sized Senegalese city, to address the lack of empirical research on African digital markets. With data on material connectivity being scarce, this paper provides a baseline description as grounds for future research. Using a participatory mapping approach over three weeks in September 2024, the research assessed the range, condition, and distribution of smartphones across central and neighborhood markets. Descriptive statistics and spatial analysis illustrate key trends. Results show a market heavily structured around second-hand smartphones, where device quality and prices adjust to economic power. Imported second-hand devices are often high-end, with prices above many new items of cheaper brands, while locally used items have much depreciated prices compared to either new or imported second-hand ones. Market locations are widespread for common items and clustered for specialized devices, consistent with central place theory. By documenting the material foundations of digital communication, this study provides new empirical evidence on African urban device markets and highlights the need to consider material access alongside infrastructure in digital connectivity debates.

1. Introduction

This study presents an exploratory approach of the commerce of electronic devices in a Senegalese city. The city of Saint-Louis is a secondary city in Senegal and a local economic hub with a population largely connected to digital networks. Whether for economic, social, and cultural activities, politics, or studies, digital technologies are pervasive. As such, the city constitutes a reference point for the penetration of electronics, as neither the most nor the least connected.
The question of electronic devices in the African context is often envisioned through the lens of their usage and in the case of devices as part of a chain of waste materials [1,2,3]. This paper proposes an assessment of digital markets within a mid-sized Senegalese city—Saint-Louis in Senegal. This study considers both how second-hand products are a key part of the supply to electronic goods customers and how digital device markets are distributed in the city following a specific socio-spatial structure. The second-hand product market presents insights into modes of sustainability through re-use and refit that are not included in general conceptions of sustainable and circular manufacturing [4,5]. The importance of the cost of digital technologies, whether for hardware, software, or connection, constitutes a major driving force in the use and restriction of customers in Saint-Louis [6,7,8].
In the “cyberspace”, social capital is key in the structure of social relations and the contestation of the reproduction of inequalities in the digital world [9,10]. This study takes into account the material base of the cyberspace in the context of an African city, where access to electronic devices used to connect to the internet and its services is tailored to a relatively low income.
As argued by Hargittai [11], digital devices and their quality are an essential part of the “Autonomy of use” to navigate digital media, and a prerequisite and key influence on the social outcomes of digital technologies. Digital devices constitute the interface between the youth and social media, as well as digital services [12,13]. They also convey a direct meaning in social interactions, participating in the shaping of the social status of the youth not only in the digital media sphere, but in direct interactions, as the qualities, prices, and designs of the devices are themselves key mediators in presenting themselves to others in real-world interactions as well [14].
Saint-Louis du Sénégal lies at the delta of the Senegal River, where it flows into the Atlantic Ocean. As the capital of a region of over a million inhabitants, the city itself has a population estimated at around a quarter of a million [15]. This gives the city a particular morphology, common with other estuarine cities. The Senegal river divides the city into multiple sections, creating a series of islands, peninsulas, and narrow land corridors. This includes the historic core of the city, as well as other islands connected to the mainland by bridges. The effect of the islands on the structure of the city has been discussed largely from an ecological perspective, as well as their effects on the city itself, including the environment [16], heritage [17], transport [18], and urban resilience [19]. This particular physical morphology produces a city of multiple centralities and clear-cut transitions from one part of the city to another. The predicted impact of this spatial structure includes the high population density and a clustered distribution of amenities [20,21].
The case of the high density in the angler’s neighborhood of Guet Ndar is, for instance, deeply influenced by the fishing activities and the social and economic characteristics of the area. Fishermen’s activities require access to the sea for fishing and the river delta for boat storage and repair, limiting the possibilities of relocation for families. With the demographic growth, the local density has increased to record levels [22,23]. Wholesale and retail fish markets, as well as specialized shops in fishing materials, are predictably well established in the area, but more generally, the types of products and their standing are adapted to the local population. Other islands and neighborhoods similarly have businesses adapted to the general activities and local social conditions, reinforcing clustered local economic dynamics.
In Saint-Louis, as in most Senegalese cities, a multiplicity of commercial activities take place in market areas with no clear limits, with a number of central clusters irradiating outwards [24]. Unlike Dakar, Senegal’s capital, malls have not yet been implanted in Saint-Louis, and the city is marked by the mix of shops and street traders. The city markets support the local population and partly the local hinterland and beyond, in particular through the important fish markets [25]. Digital businesses follow a similar spatial spread to other shops and range at every step, from the formal to the informal. They share space with a multiplicity of small businesses spread all over the city, combined with a number of market areas with fuzzy borders and a level of continuity between the formal and the informal, between the brick-and-mortar stores and the street vendors, and the officially designed market areas and their surroundings.
This social, economic, and spatial structure, common in many secondary Senegalese and African cities, is the central object of this research. This paper presents exploratory approaches to this phenomenon. With limited baseline data on the granularity of businesses, the researchers have applied an exploratory approach to digital commerce through Participatory GIS and data analysis that aims to propose the basis for building further theories and avenues for research on the dynamics of digital, social, and economic sustainability.
This paper proposes to study the commerce of electronic devices through a combination of prices and quality analysis. A specific method of participatory GIS combining qualitative and quantitative approaches has been developed for this study to collect and understand how social and economic conditions shape the electronics market in a mid-sized African city.
This article is organized starting with the presentation of the Section 2 used, which describes the originality of the data and methodology used for data collection. The Section 3 presents the categories of digital products sold in the city of Saint-Louis, as well as the spatial hierarchy of markets in the urban envelope. The Section 4 ponders the findings, potential, and limitations of the research for future avenues. Finally, the Section 5 summarizes the main arguments, proposing potential for further research and digital development.

2. Materials and Methods

This study is based on statistical and spatial analysis of the electronics market based on a PGIS survey of the city of Saint-Louis. Conducted in September 2024 over a period of three weeks, the PGIS exercise allowed for the collection of product information in 991 shops and informal businesses involved in digital services. This includes businesses either repairing and/or selling electronic devices or accessories as well as digital services, such as e-banking and selling phone credits.
The dataset is a comprehensive sample of the digital businesses in the urban area around Saint-Louis, beyond the communal limits of the city. It does not comprise all digital businesses, but a very large portion of them, with particular attention paid to including neighborhood businesses, rather than focusing solely on the main market areas. The data focuses on shops that either sell services, devices, or both. The geographic spread of the dataset covers all areas of the city and its surroundings (Figure 1).
The overview of the city businesses illustrates how the overall distribution of shops is spread across the city, and its immediate conurbation. Some areas within the city itself are not covered as they are used for public and private land, such as the airport, military area, preservation area, and tourism resorts.

2.1. Data Description

The collected data presents a broad picture of digital commerce, while this paper concentrates on material devices, highlighting the specific dynamics of the quality and prices of goods (devices). This paper is thus using a subset of the 991 shops that sell electronic goods or services. The 408 shops that only sell electronic services are not included in the analysis, which focuses on the 583 shops that sell or repair electronics devices (Table 1).

2.2. Data Collection with PGIS and Territorial Sampling Method

The collection method, using the knowledge of the local youth to gather information about their environment, has proven an effective and valuable process of gaining knowledge of a territory based on numerous themes of social and economic relevance [26,27,28]. Participatory GIS (PGIS) takes a bottom-up perspective on knowledge production by integrating local perceptions and knowledge into the construction and organization of the research, allowing tools and questionnaires to be tailored to the local knowledge.
Participants were all selected from the youth of the different neighborhoods and represented different social strata, from working class to middle class, and were contacted through the local representatives of neighborhoods and associations. The PGIS data collection process took place over a period of three weeks, including the training of participants and enumerators. Over the course of a PGIS exercise, researchers do not come with an entirely blank sheet for data collection, but draft in advance the broad categories of interest and discuss them with the participants to refine, correct, and, if necessary, redefine the questions and the objectives of the research.
The PGIS approach used for this research allows for data emphasizing local relevance to be collected, rather than being attached to a predefined characterization based on digital studies in the Global North. This particular PGIS exercise includes open discussions on the use of technologies by the youth, with all participants and enumerators, as well as breaking groups, to facilitate the inclusion of ideas and individuals less accustomed to or less comfortable speaking before large groups. In this process, for instance, the distinction between two subsets of second-hand products (local and imported) was discussed and defined by the participants.
Second-hand products are popular in Senegal, and more largely in Africa. This popularity is largely explained by the reduced purchasing power of the population, which often struggles financially and is content to benefit from cheaper alternatives [29]. It is also linked with the cultural significance of Western products being refashioned to local tastes by a commercial sector, an artisanal and small industrial base dedicated to adapting and repairing second-hand products [30]. With the importance of the second-hand sector in Senegal, it is not surprising that there would be a particular distinction between these categories. With no domestic electronics industry, all digital devices, whether new or used, are ultimately imported.
The participants highlighted the important distinction between imported and local second-hand devices and presented the reasons why these two qualifications are distinguished. Imported second-hand products, also called “venant” (which translates as “coming” or “arriving”), are electronic devices that have been used outside Senegal (and Africa more broadly), and local second-hand devices are those that have been used inside Senegal before being offered for sale. The literature on this distinction relating to electronic goods is limited, although researchers in distinct fields have noted a number of symbolic and practical values attached to foreign and local goods [3,31,32]. The discussion highlighted that imported second-hand goods are generally perceived to be in better-maintained conditions than local second-hand ones (Table 2).
The table above (Table 2) summarizes the opinions discussed during the focus groups, which highlight the perceived differences between the quality of the products. Although these distinctions are not absolute, they are a general guide of the standing of a second-hand item when buying it. In sum, a standard Senegalese consumer would trust that a Westerner would change their equipment over a simple whim to get a newer item, but would expect an African user to only get rid of its equipment when it was completely out of order, thus being less trustful of the quality of item. This general rule is often associated with an exception, when the local second-hand items are sold by someone close and trusted.
This discussion allows for a general picture of the items sold on the streets and shops of Saint-Louis that highlight local specificities. The origin of imported items, for instance, is generally Europe or Canada, which is related to the large Senegalese communities in these regions. The social perceptions of the better quality of imported items are based on participants’ experiences in handling these categories of devices, and are seen as justifying part of the price differences. However, participants also highlight the question of import taxes on second-hand material, which influences the prices, as the state is keen to control these types of valuable imports.
The territorial aspect of the community’s cartography is two-fold. First, the spatializing of the question of electronic devices facilitates the inventory of items, as envisioning the territory of urban markets in its totality ensures that all social strata present in the city are included in the study. Second, the approach of spatializing the research allows us to see how space catalyzes specific dynamics of concentration, clustering, or spread. In this case, it allows us to identify how specific qualities and categories of electronic devices are presented to customers, and to respond to customers’ aspirations for and interests in specific qualities.
For the practical aspect of the data collection in the field, the research team used KoboToolbox questionnaires. KoboToolbox allows for the collection of spatialized data points in the local shops using smartphones or tablets. Its questionnaire builder design allows for the easy adding and editing (and removal) of questions, which can also be managed collaboratively with participants with the help of a large TV screen (or a battery-powered projector if needed).
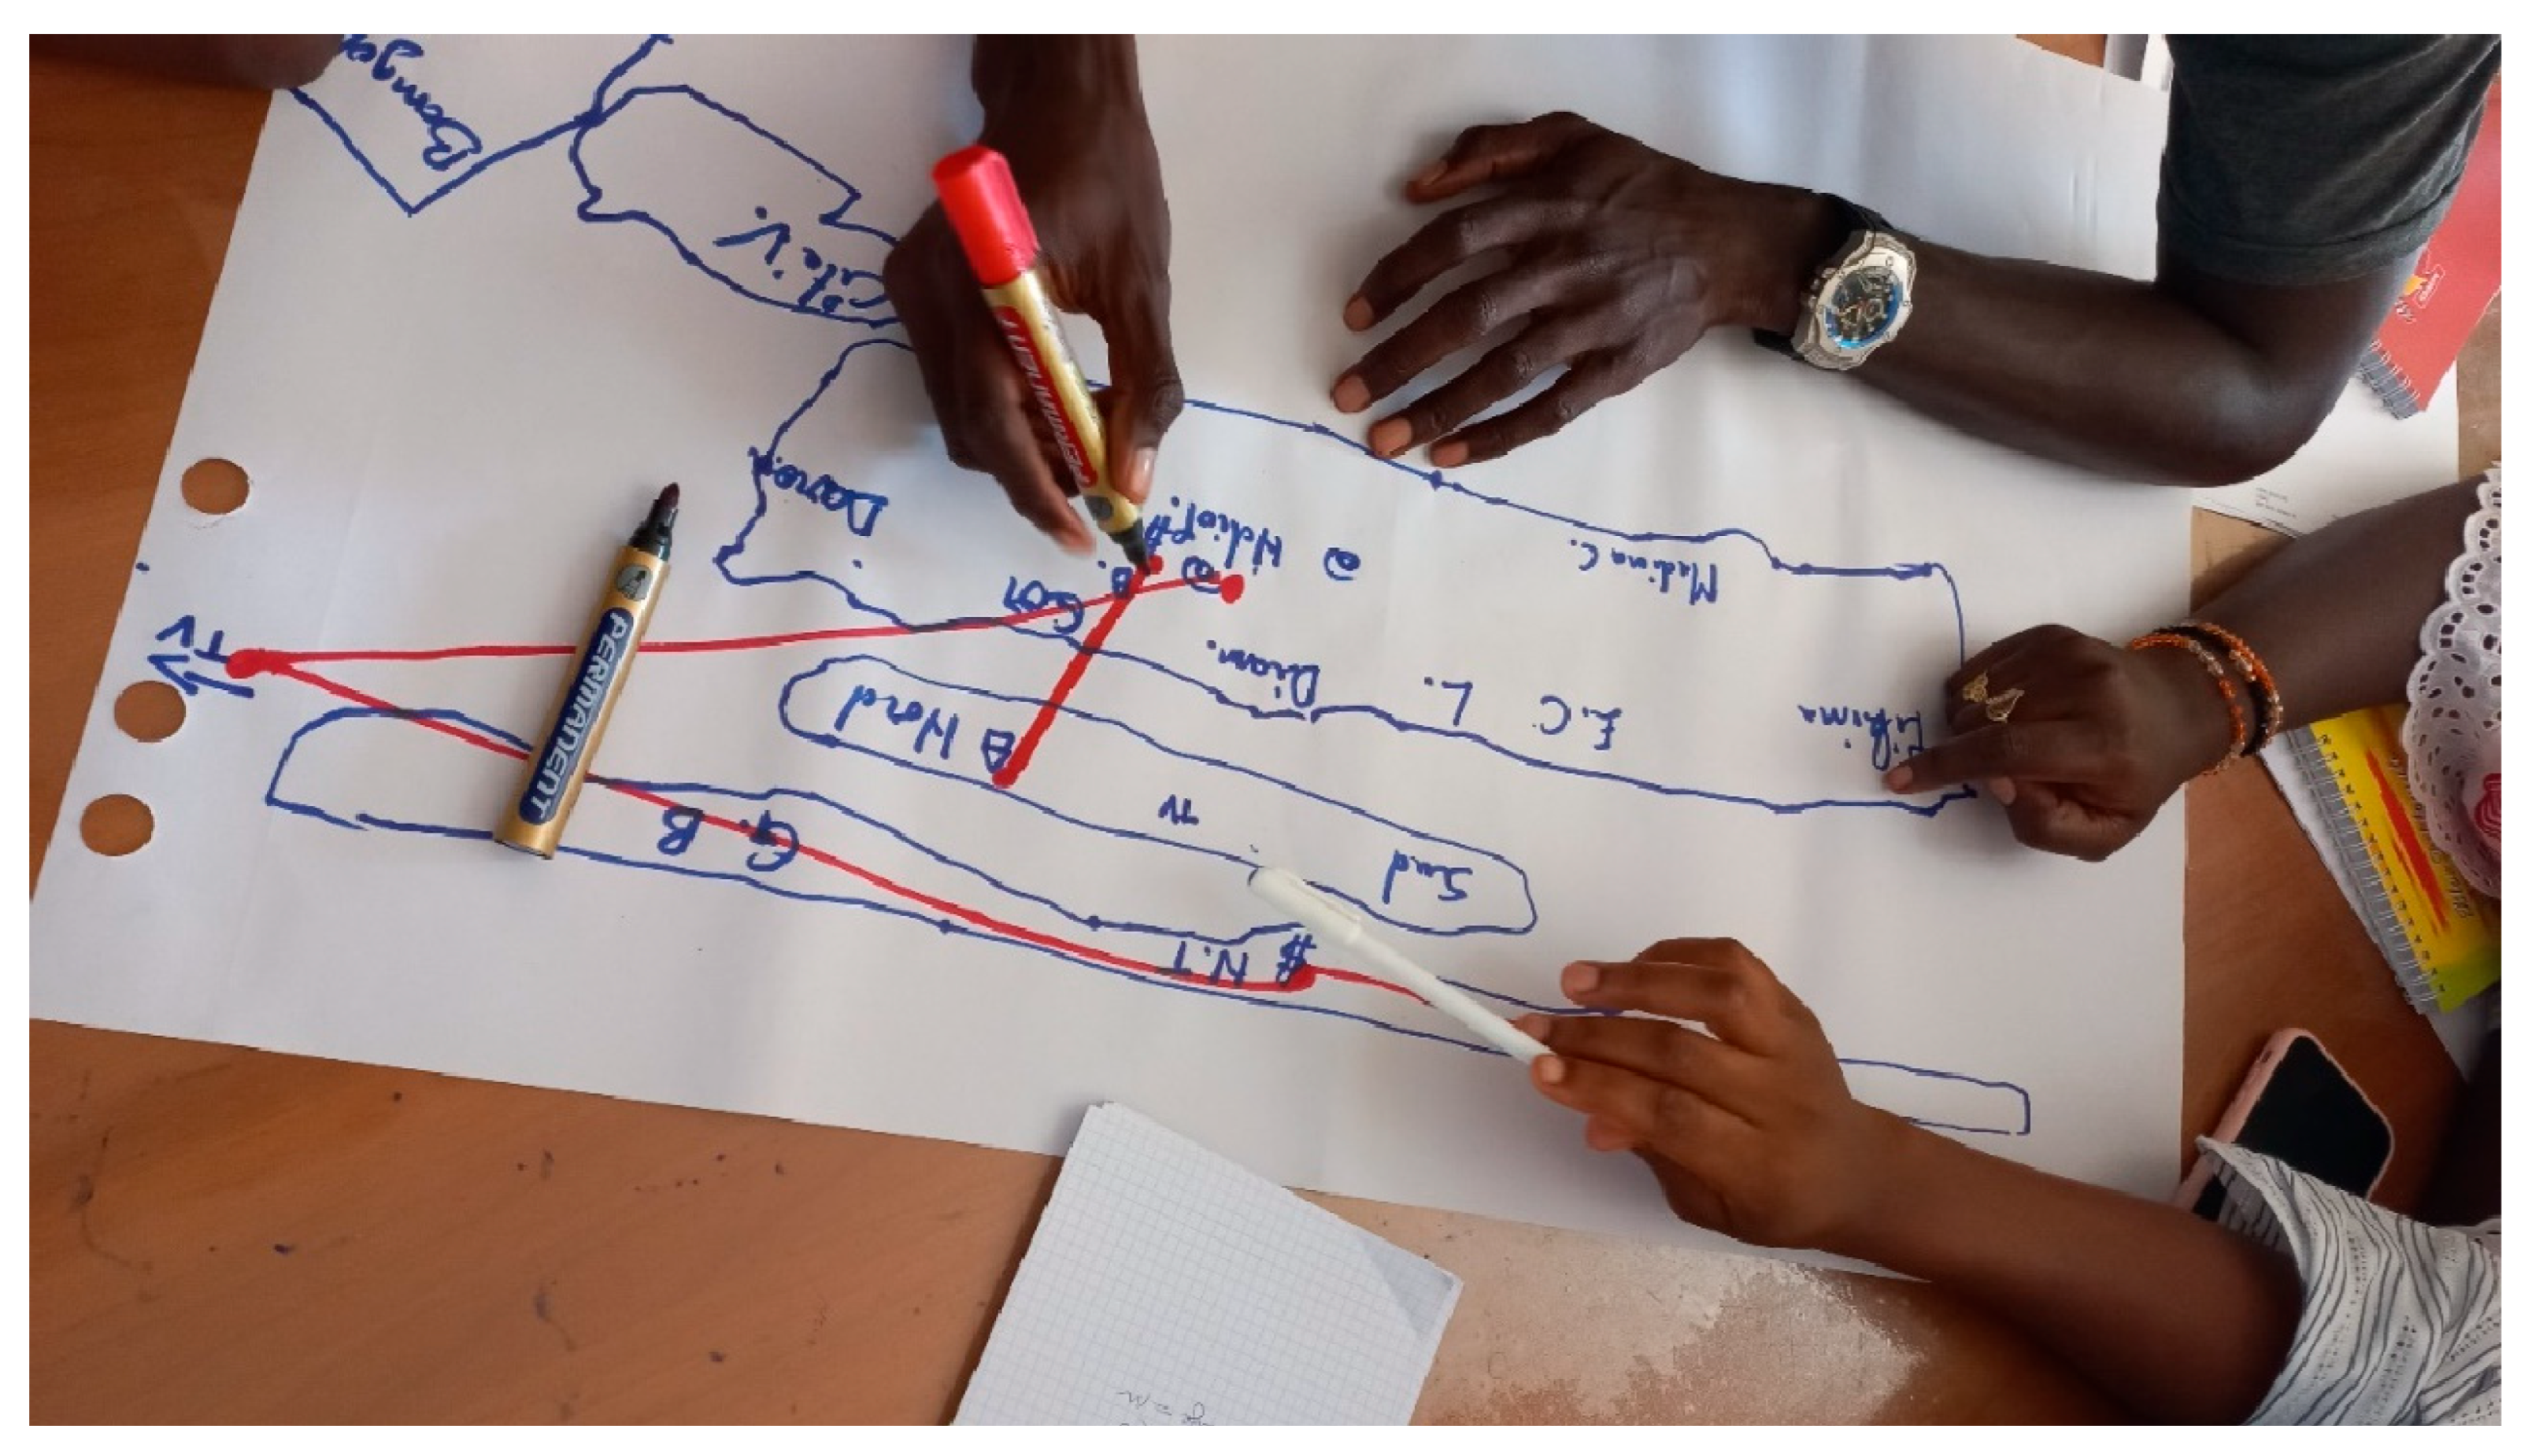
Regarding the territory in particular, the PGIS exercise includes the showing of maps of the city as well as its design by participants on paper maps to plan the itineraries of research participants (Figure 2). The goal of this exercise is two-fold. On the one hand, it allows participants to understand and define the territory on which they will be making the PGIS collection. On the other hand, it gives a base for discussion to understand more broadly how their own electronic devices are related to specific territories. Have they purchased their items from a shop in their neighborhood, or in the main market area? What are the reasons for purchasing an item in one place over another?
The discussion with participants of their consumer habits informs the researchers as well as the participants themselves on the expected quality, and the price that they are willing to invest in their devices. It also informs on their perception of the city and its services. The use of paper maps allows for an easier collaborative work of breaking up groups of participants, as visualizing the city in common on large maps equalizes potential differences in their familiarity with different technologies. It also allows them to stand or sit around a table and start collaborating on the research.
As the training takes place over two days, the end of the first day allows for the research team to make adjustments to the KoboToolbox questionnaires before presenting them over the next few days to participants. Shown on a big screen, all questions are discussed with the participants and further adjustments are applied to the questionnaire. Relying on a flexible and robust tool for data collection allows for this flexibility of usage.
Participants and enumerators are then given the devices on which they will collect the data during the transects. Mock exercises are conducted first in the vicinity to observe and advise the participants on how to ask questions, and if needed, to make additional corrections to the questionnaires. Corrections may serve to clarify questions that would otherwise be ambiguous, either to interviewers or interviewees. They can also serve to add relevant pieces of information, or on the contrary, remove unnecessary questions or choices of answers from the questionnaire.
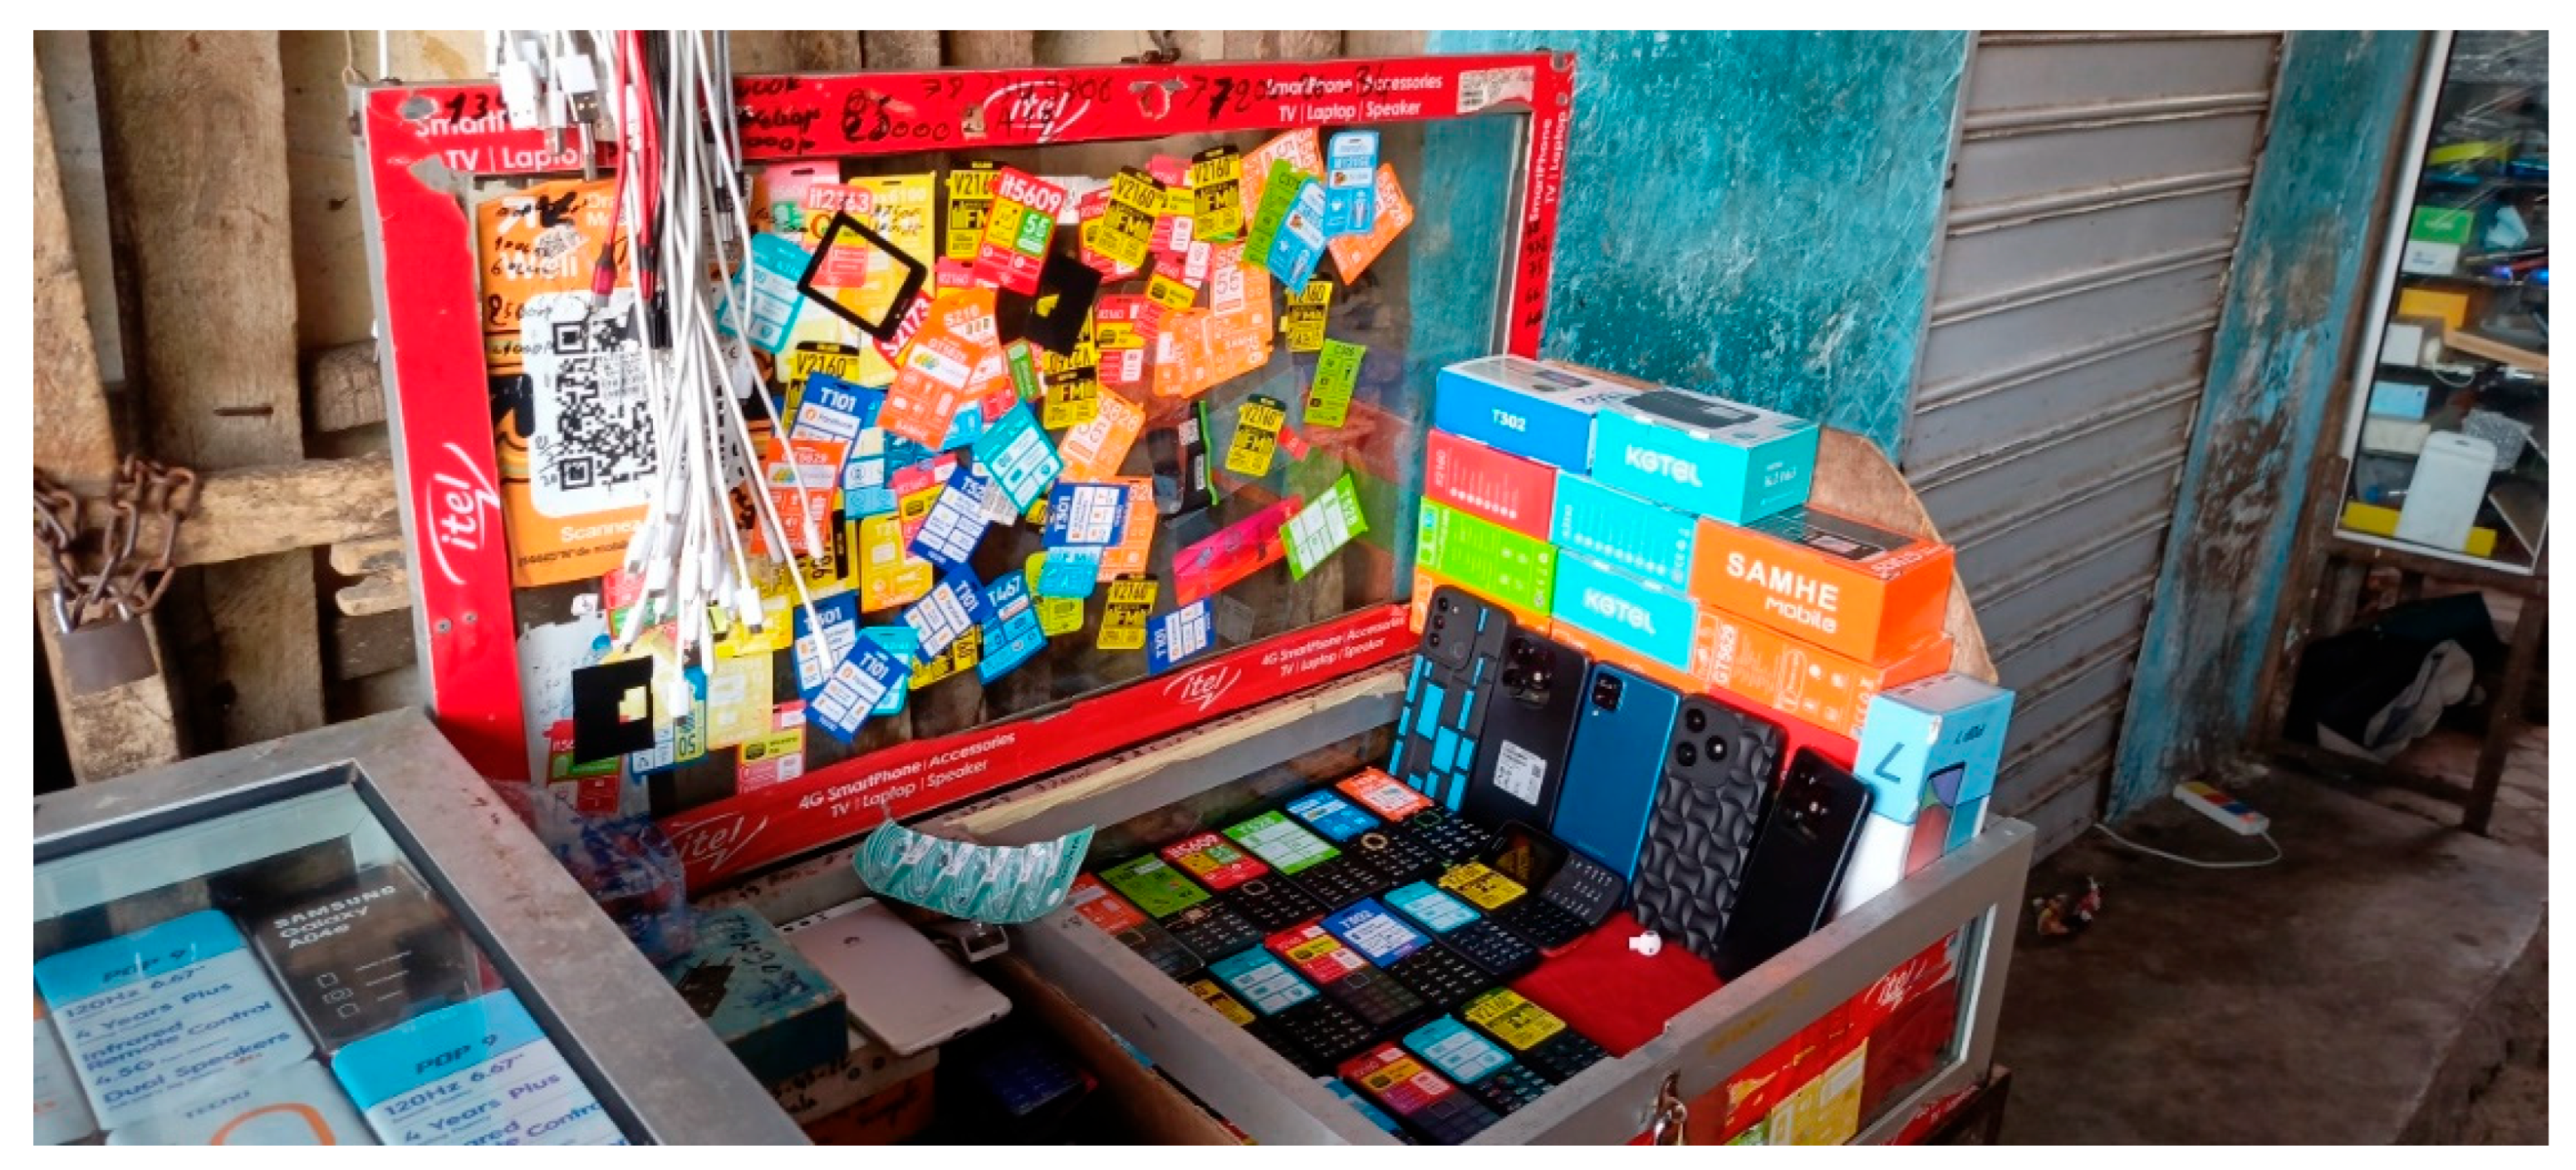
Once the room exercises and training are completed, the working pair of participants/enumerators is assigned an area of research. The participants start in their neighborhoods, going first through the main roads and local hotspots of economic activity, before walking deeper into the neighborhoods. Once all areas of a neighborhood have been visited, participants visit adjacent neighborhoods until the project covers the globality of the urban area of Saint-Louis. The discussion allows them to define the questions that will be asked in electronic shops in the city. African urban markets are widely spread out in the city, rather than centralized with a limited number of shops. As numerous as they are, the shops are always relatively small, often comprising a single room or a stand (Figure 3). The higher-end shops selling the most expensive items also tend to present more polished aspects, rather than stands or kiosks.
In especially busy areas of the market areas, participants were instructed not to collect data on each and every electronics shop, as their density is so high in certain areas that it would have prevented covering the whole of the territory of Saint-Louis. They would instead skip one or two shops for each shop in the densest parts of the market (Figure 4). The aim of this practice was to make sure that all areas of the city were covered, at the expense of diminishing the relative weight of the central market area (Sor Market). However, as discussed below, its commercial centrality remained well reflected in the data.
The instructions given to the participants were that if a market corner of approximately 25 sqm had more than ten electronics shops side by side, to skip one for each two shops, and if the corner had twenty or more, to collect only one in three.
Skipping some shops in the most central area reduced the weight of the central market areas. It was decided, however, that this was preferable to skipping shops in the neighborhoods, for keeping track of the territorial spread of digital businesses. As discussed below, this bias did not prevent the main market areas from being identified as the main digital hubs in the city.
As the rhythm of data collection cannot be exactly predicted in advance, teams were asked to record their walks with a geotracking app installed on their mobile device, allowing the research team to monitor the progress at the end of each day and avoid the overlap of transect teams. The main goal was to cover the city as a whole so that the research coordinators could orient and assign uncovered areas to the research participants based on GPS tracking.

3. Results

This section relies on a number of analyses to present the digital device market in Saint-Louis. On the one hand, it focuses on the types of devices sold, and on the other hand, the spatial distribution of shops. This section presents an exploratory analysis of our dataset, showing a number of statistical correlations to present the digital market. For the study of the localization of electronics shops, point maps as well as cluster analysis are used to show the spatial distribution of particular shops and items.
The analysis of the data focuses on two prominent points raised by the commerce of digital technologies and its place in the particular setting of Saint-Louis. The products sold are presented to describe and analyze their quality and how they provide the connection basis for the Saint-Louis population. We have in particular focused on the distinction between new devices and the two types of second-hand products, locally called “local” and “venant” (imported second-hand). Furthermore, the analysis focuses on where these products are located and what they tell us about the hierarchy of specialization in the city.
All information on brands, prices, and the three categories of new, imported second-hand, and local second-hand is self-reported by the business owners or employees. We are thus relying on the good faith of businesses to provide honest answers to our questions. Although this reliance on self-reporting limits the extent of the confidence in the data, we can trust the fact that the business owners recognized the categories of the questionnaire, and that the information given was recognized as globally trustworthy by the enumerators.
The analysis was carried out in Python 3.13.2. The core libraries used comprised geospatial and mapping packages, including geopandas, shapely, folium, contextily, and osmnx for handling spatial data and visualizing maps; data analysis and statistics libraries such as pandas, numpy, scipy, statsmodels, and scikit-learn; and visualization libraries such as matplotlib and seaborn for creating charts and plots.

3.1. The Products Sold in Saint-Louis

Among the shops selling smartphones, a large majority answered regarding the price given to the different categories of items (260 shops out of 312). A large number of shops sell new and imported second-hand products. Local products are less commonly sold because they are often sold outside the market between individuals, as customers trust less the quality of the item (Table 3).
The brands sold in these 312 shops present an image of a market share where the industry leaders—Tecno, Samsung, Itel, and iPhone—are sold in the majority of the shops (Table 4).
The respondent businesses were asked for the smartphone brands they sold in their shop as well as the minimum and maximum prices of the items they sold—new, local, and imported second-hand. The researchers formulated the hypothesis of a correlation between the quality, brands, and prices in the shops of Saint-Louis.
To explore the relationship between brands and prices, we used a Spearman correlation analysis. This tested the associations between the brands sold and the minimum and maximum prices for smartphones in the new, imported second-hand, and local second-hand categories. For each variable pair, we tested whether a monotonic relationship was present. Under the null hypothesis (ρ = 0), coefficients significantly different from zero (p < 0.05) indicated the presence of a statistical association.
For each pair of variables, we tested the hypothesis of a full matrix of coefficients and p-values generated during the analysis (Table 5).
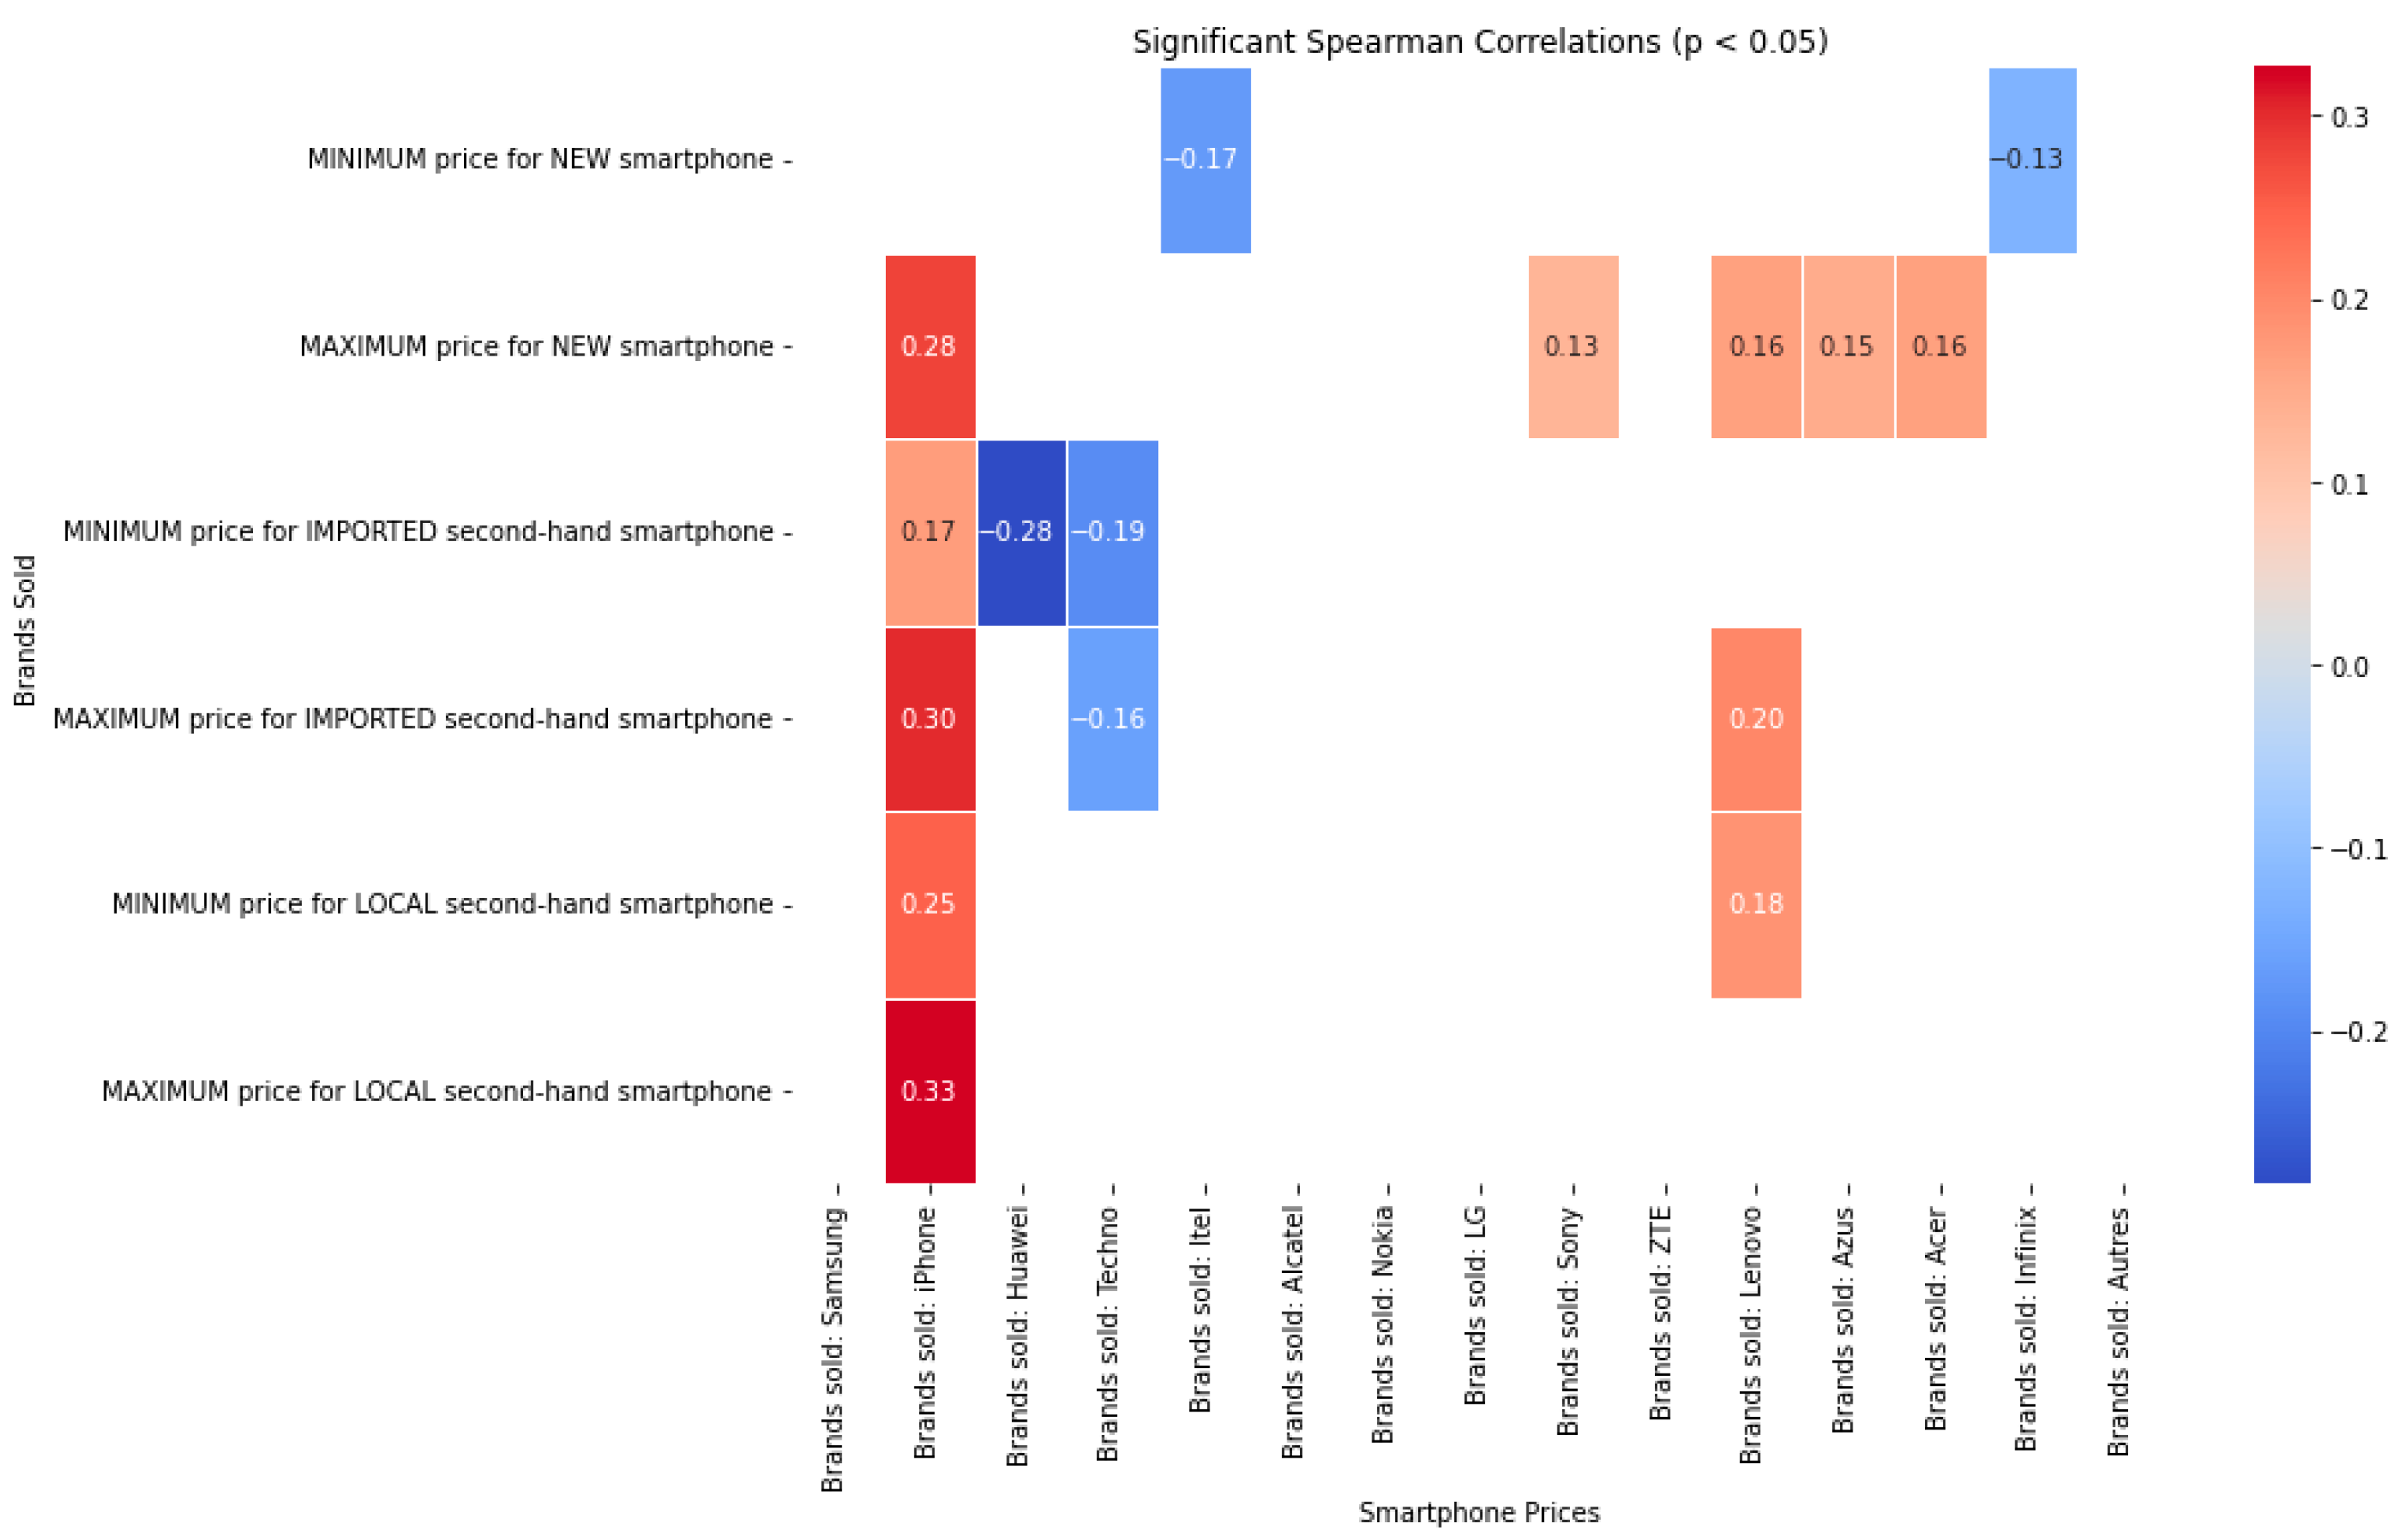
The chart in Figure 5 represents only the statistically significant correlations with a p-value of <0.05. Non-significant results are omitted from the visualization to highlight the most important positive and negative correlations. It shows, for instance, that the presence of iPhones as an option in the shop is most closely correlated with higher prices among the hundreds of shops surveyed. Contrarily, the Chinese brands Huawei, Techno, and Itel are correlated with cheaper prices. Among the best-selling brands sold in Saint-Louis, it is notable that Samsung phones have no significant correlations with either low or high prices, reflecting the ubiquity of their commercial base.
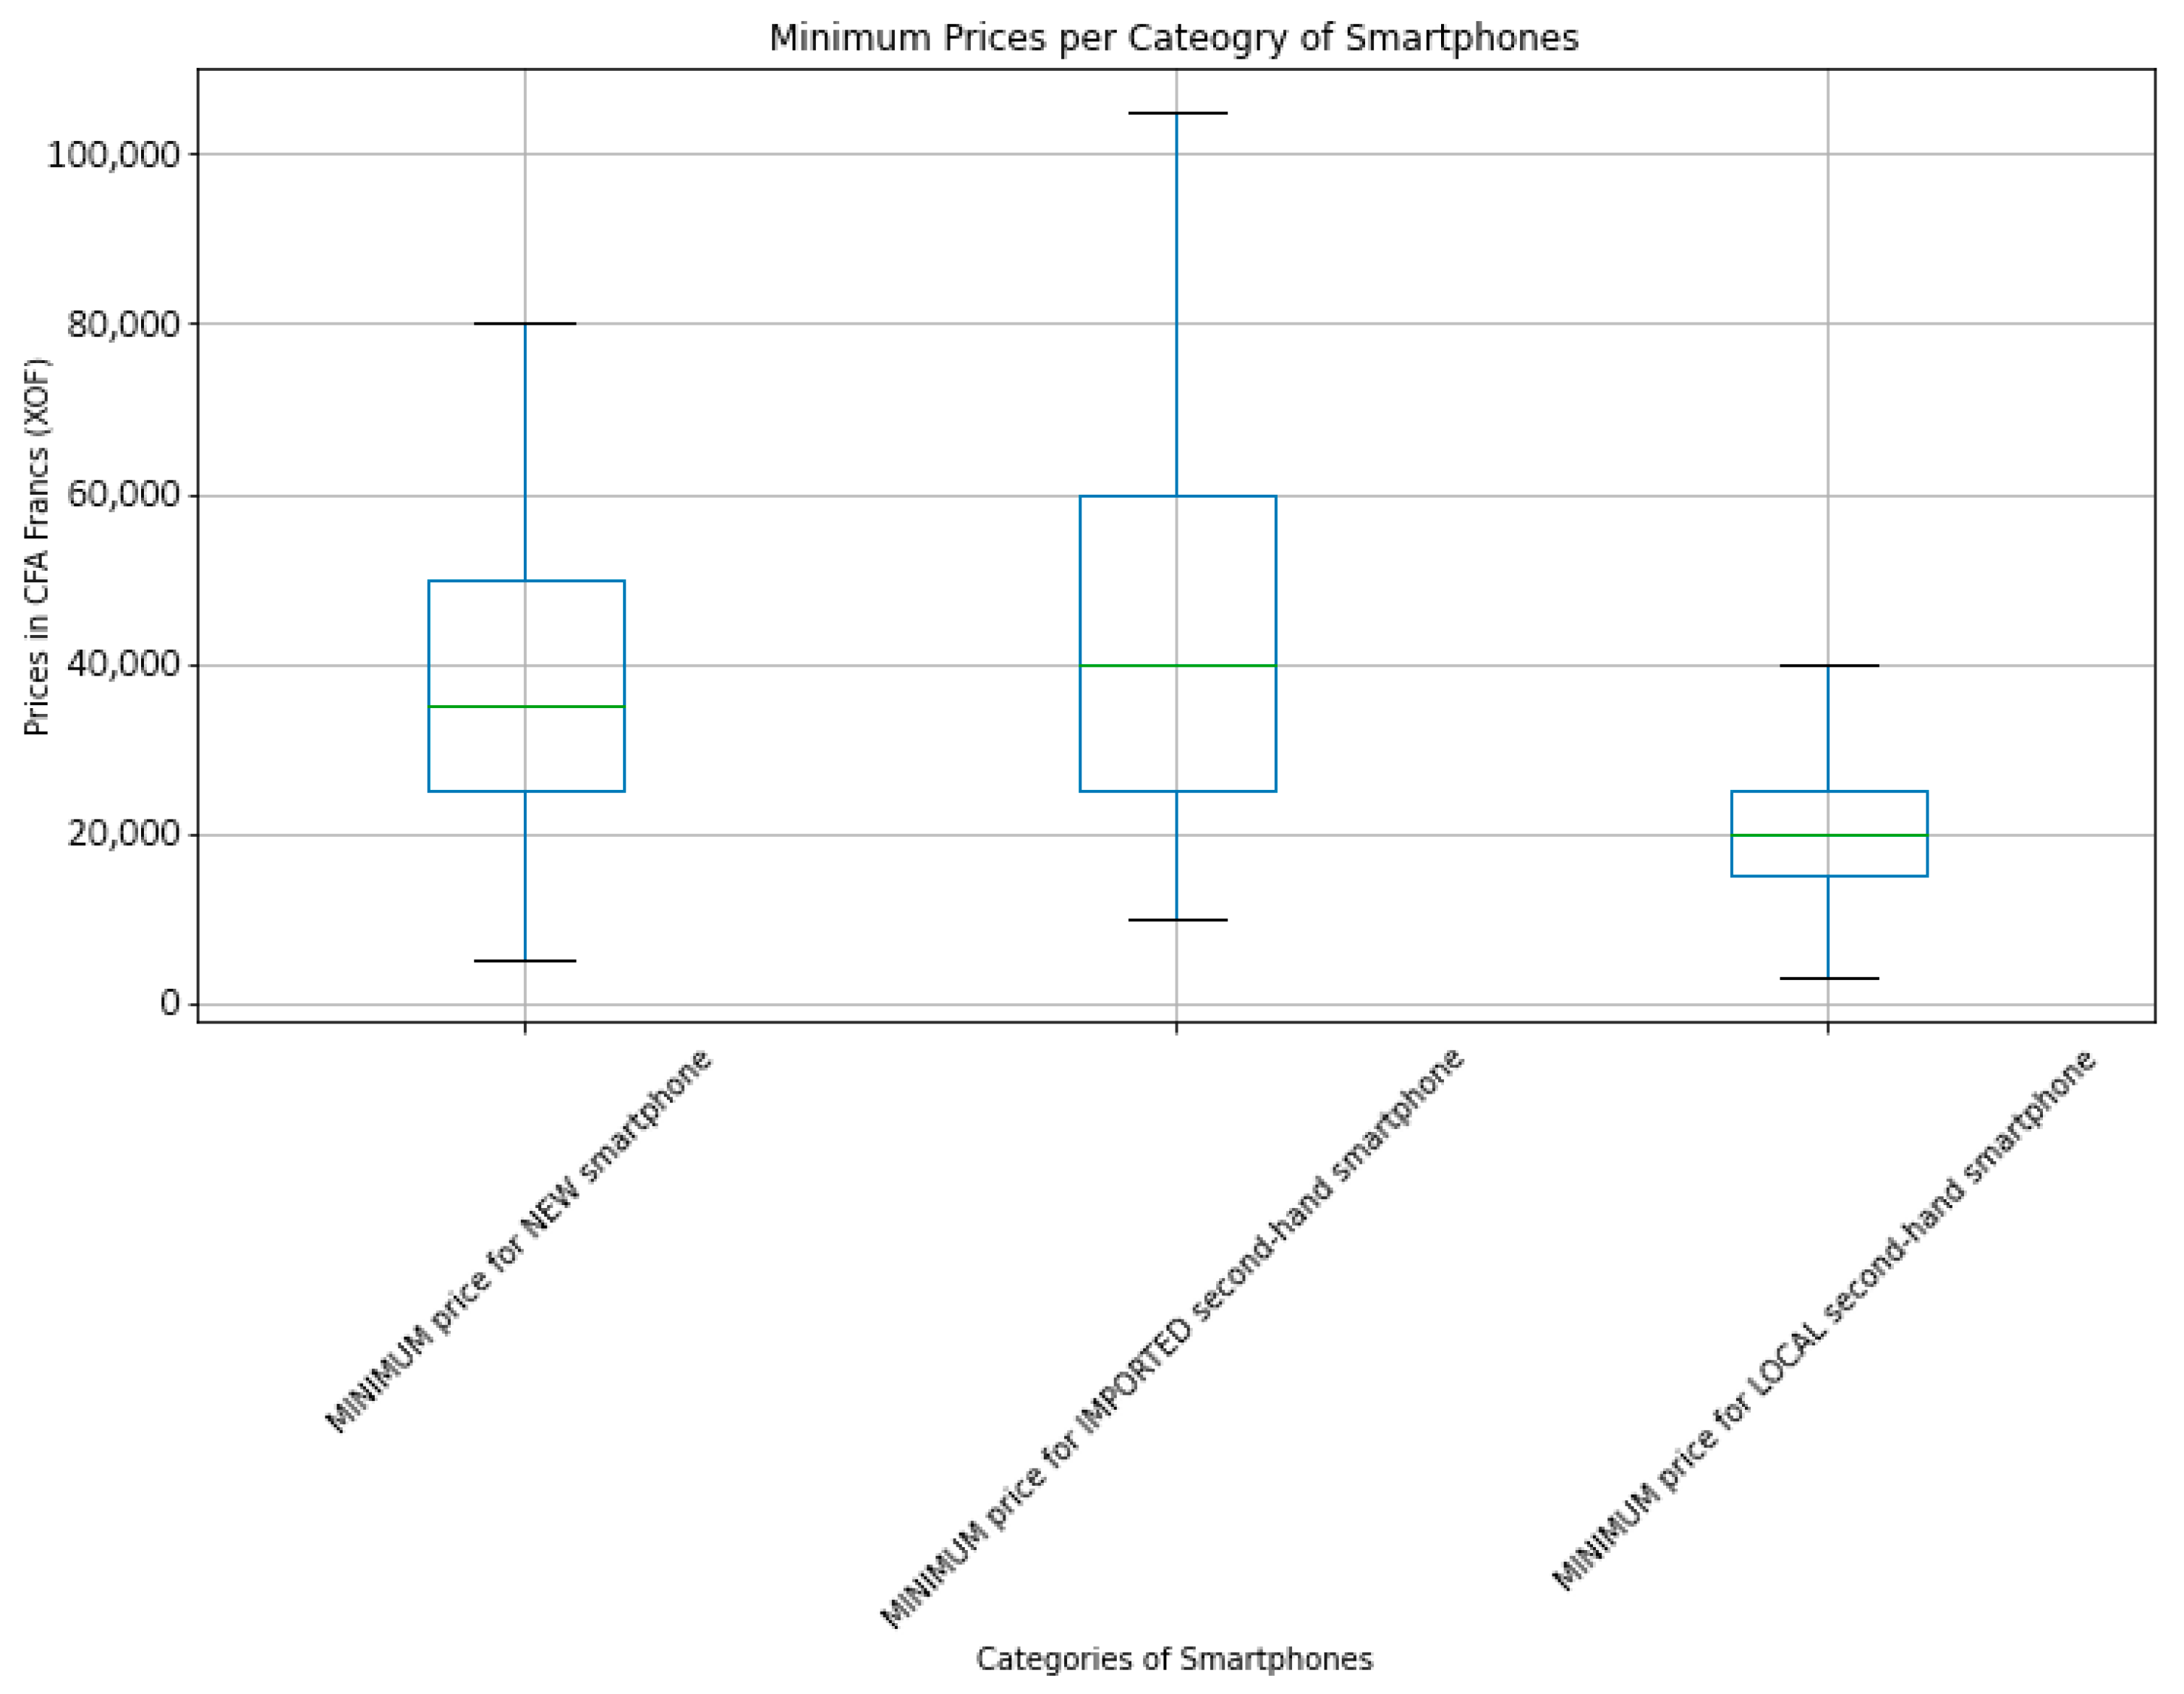
By looking in detail at the range of smartphone prices, we can observe a particularity in the distinction between local and imported products. The imported products are generally considered of higher quality than the local ones and hence have considerably higher prices than the latter ones. The comparative chart of minimum prices below illustrates that local second-hand products start at much lower costs than new or imported second-hand ones. The minimum prices in each category illustrate how imported second-hand products tend to represent the most expensive items sold in the city, rather than new smartphones that may be from less expensive brands (Figure 6). The differences between the imported second-hand and new products also illustrate the perhaps counterintuitive dynamics, where second-hand products start at higher costs than new phones and imported items.
As the differences between the minimum prices of the three categories show the capacity to accommodate customers of different social strata, the maximum prices of the three types of items equally inform us on what the upscale products sold to African customers are (Figure 7). The difference in this case between new and imported items shows very similar price ranges, although the upper quantile of imported smartphones is slightly higher than that of new ones. However, both kinds, excluding outliers, are largely above the maximum price range of local second-hand products. This illustrates that imported second-hand products in this case are far from waste imports into Africa, but rather are the solution to a population with limited financial resources unable to access new upmarket products.
The estimated average salary in Senegal amounts to around 150,000 to 200,000 West African CFA francs (XOF) per month (EUR 228.67 to 304.89). While there are limited statistics on salaries and available income, Saint-Louis is among the areas with a slightly higher average income and lower poverty rate [33,34]. However, the average prices of 400,000 or 500,000 for digital devices represent an enormous cost, only justified by the ubiquity of the smartphone in most aspects of social and economic activities. The essential aspects of social reconnaissance, status, and responsibilities are also driving forces behind the willingness of customers to invest such significant sums in electronic devices [14].
What are the variations in prices in shops within each category of devices? The next boxplot chart shows the price range in the city’s electronics shops (Figure 8). The differences calculated between the cheapest and most expensive items from each category (new, imported, and local) sold in the shops inform us on the price differences in shops and how shops’ standings are structured in the city. The minimum and maximum price differences in the same shops between the cheapest and most expensive options show that the price differences between imported second-hand and new phones have a similar amplitude. Local second-hand products have much less significant price differences, except for a small number of outliers.
The brands, state of the items, and price ranges highlight the particularities of an African urban market, where access to digital technologies is essential, as much as it is contingent upon the population of Saint-Louis’ limited resources. Marking the variety of the items’ brands, qualities, and states illustrates how the commerce is adapted to a customer base with strong discrepancies in income and differences in the part of the income going to their digital connectivity and sociability.

3.2. Hierarchy of Markets in the City

Where are digital devices sold in Saint-Louis? The diversity of items, qualities, and prices is grounded in the urban space, whether sold in a shop or on the street, formally or informally. Overall, the distribution of shops in the city, regardless of the category of commerce, illustrates the centrality of the “Sor Market”, as well as the presence of smaller hubs across the city and towards the outskirts of the city all over the continent. A kernel density estimation illustrates well how these shops reflect the urban organization of Saint-Louis. The Sor Market is located along the main road leading from the island of Sor to the Île Saint-Louis. Located centrally in the city, the areas along the main road have shops for all the main commodities, such as clothing and an important food market, designating the area as the overall main market area.
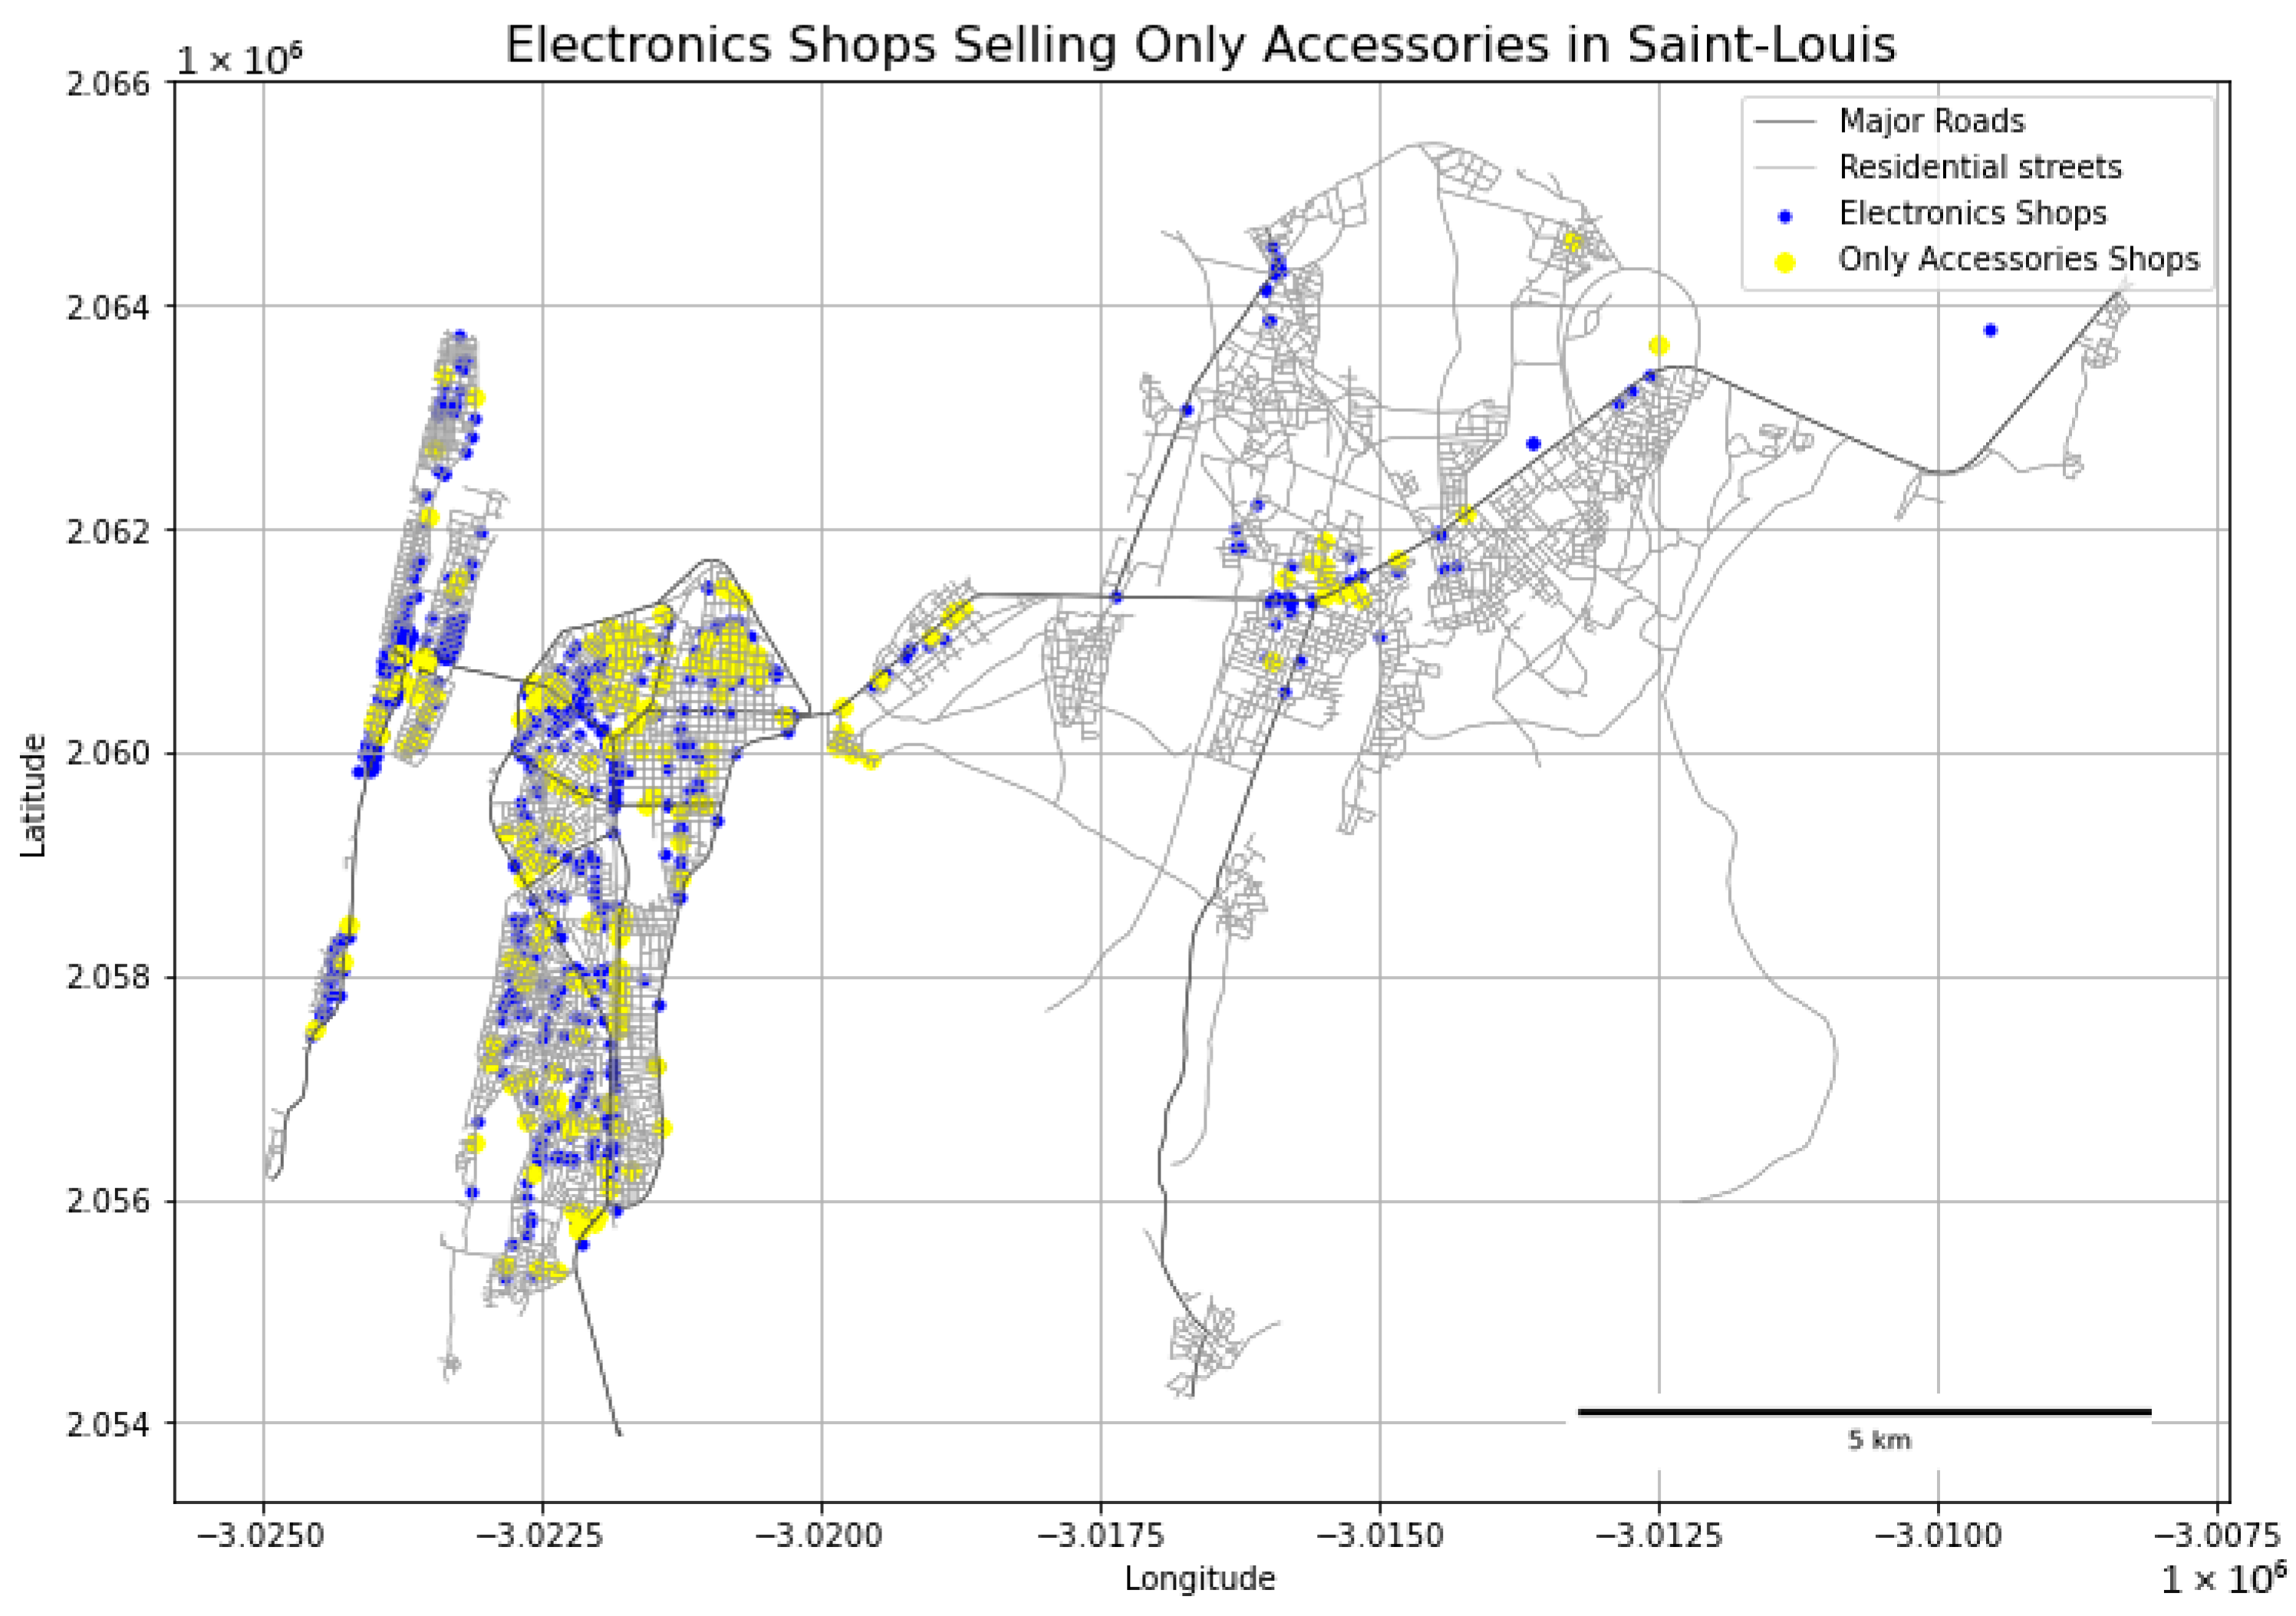
Digital items comprise many different categories, including smartphones, tablets, computers, consoles, and accessories (such as earphones or battery banks). Isolating the 512 shops that sell only accessories presents us with an interesting picture of the hierarchy of commerce in the city. These shops do not necessarily specialize in electronics and sell the accessories along with other goods, such as groceries (or electronic services and network credits). The maps of these “accessories-only” shops show the tendency of these shops to be located inside neighborhoods, while other electronics shops tend to agglomerate closer to main roads (Figure 9).
When looking at the distribution of specialized (computers and game consoles) and non-specialized (smartphones and accessories) products, it is apparent that the former are heavily concentrated in the central market area, while the latter are spread more evenly across all areas of the city, supplying local neighborhood customers. The map below illustrates the places where smartphones are sold in Saint-Louis (Figure 10). Although not as widespread as the accessories-only shops (Figure 9), it still visible how each neighborhood has at least one place where the items are available, with more dots located close to major roads and small and large market areas.
At the opposite end, the most specialized and limited type of electronic items sold are fixed-line telephones (Figure 11). More than anywhere, mobile phones in Africa have largely replaced phone lines. In fact, the spread of mobile phones took place when only a very limited part of the population was connected to line telephones as private users, at the beginning of this century [35,36]. As a result, the fixed-line telephones are sold only in a very limited number of places. And as a specialized product, they are only to be found at the very center of the urban supply hierarchy.
Can we define and find this centrality in the markets of Saint-Louis? Using a cluster analysis of all shops, we can locate the centrality of the Sor market within the city of Saint-Louis. A cluster analysis weighs the proximity and number of shops to pinpoint one or more central area (Figure 12). To illustrate the overall spatial patterns, we applied gaussian Kernel Density Estimation across the study area. The contour map highlights the hotspots of a high concentration of businesses. This area is precisely the part of the city where the sampling was deemed necessary if enough time were to be allocated to less central areas. In this regard, the centrality and density of the Sor market are so strong that the overall picture of centrality is barely affected.
The set of points not only indicates this centrality, but also the higher number of businesses located close to major roads. This clustering is characteristic of agglomeration economies, where shops benefit from the proximity of their own counterparts, as they attract high numbers of customers going to the general area to buy a particular product [37,38,39]. This clustering is concentrated in market areas, but also along major roads.
Although a large number of shops are located in the market area, many small electronics shops are deep inside the neighborhood, serving mostly local customers in the neighborhood for sales and repairs. These shops are themselves more set apart than those in the market areas that benefit from the basin of potential customers in the immediate vicinity [40].
A cluster analysis of the types of items sold in the city illustrates the concentric order of the types of items sold, from the least to the most common (Figure 13). We also applied Kernel Density Estimation to categories of electronic items, scaling the point sizes based on local density values. The weighting by proximity illustrates well the types of distributions of different items [41]. The weighting in the central market area, however, weighs less that it would normally do, if the data collection were to be carried out on the totality of shops and not a transect sampling skipping a number of shops in the most central areas. We can note again that this bias does not affect the overall picture, where the central market areas largely dominate in all categories of items.

4. Discussion

This study explored the differences in the range prices and locations of digital items sold in the city of Saint-Louis. It illustrates the structure of the digital commodity market and its spread across the city, and the subsequent distribution of the electronics retail trade.
Specialized markets are concentrated in the central market area, while there is widespread access to digital devices in the form of a multiplicity of shops, as services and accessory items are everywhere. Although access to the most common electronics items is ubiquitous, the central markets have inward-pulling effects to one main central location.
There are different qualities and prices that respond to the needs, social status aspirations, and financial capabilities of the local residents. This illustrates the importance of smartphones as a commodity of use and display of status, with the availability of items of a very high price relative to the local financial power.
This research shows that the import of electronic goods is more complex than simply considering Africa a graveyard for used electronics. With access to cheap new items, the logic of importing electronic goods is in some regard distinct to the import of used cars, for instance. Whilst the import of used cars in Africa comprises both upmarket brands and a number of old vehicles that would not be allowed to circulate in Europe [42], the import of mobile phones is directly connected to prestigious brands and products. This argument does not diminish the importance of the question of e-waste management in African cities, which remains a crucial environmental and health issue that requires particular focus [43,44,45]. The import of electronics is in fact not limited to communication devices, and similar questions on the consumption circuits of re-use and waste management have been considered in domains including car electronics [46] and solar panels [47]. The products depicted in this paper will at some point become e-waste. Electronic devices are, however, not yet degraded in this particular phase of the product cycle. The research illustrates how an important albeit interstitial phase of the product cycle provides the population with key connectivity instruments while driving local economic dynamics.
The importance of the second-hand sector in facilitating the adoption of digital technologies by urban youth has been documented in other African countries, in support of practical aspects of daily life [48,49], as well as the values attached to the devices as objects of social distinction [14]. Our paper extends this work by presenting the particularities of these second-hand markets and discusses prices, despite limitations related to the self-reporting of prices by business owners. It shows that dynamics specific to African markets drive digital usage, in line with studies on the adoption of mobile phones across the continent [50].
The spatial footprint of the digital markets is marked by different centralities and one dominant hub in the Sor island market on the main road leading to the bridge towards the Île Saint-Louis and the Langue de Barbarie. This spatial grounding of digital technologies illustrates the relevance of central place theory to digital exchanges [51]. Despite the superficial evenness of digital space, its materiality follows geographic dynamics. Specialized product markets (e.g., computers, game consoles, and TVs) are located in the central area. These items are typically used within a family circle, whereas other items are owned individually by most adults and youth. Smartphones thus have a wider consumer base, which is reflected in the higher number of shops selling them. As small businesses include a multiplicity of informal (or semi-formal) activities, responding to a high demand for electronic items and accessories, the spread of the selling of accessories can be found in all neighborhoods. This territorial spread is even more marked in the case of accessories (e.g., earphones, cases, and chargers).
The translation of digital commerce to a specific context via the multiplicity of small businesses illustrates a spatial iteration of central place theory [52]. This particular case of electronic devices and the context of an African city located in a river delta formed of a number of islands and mainland reflects how limited land availability and spatial constraints lead to strong urban densification, reinforcing the clustering of places of interest.
A number of limitations of this study should also be highlighted as a basis to propose future avenues of research. The limited available baseline data on the city of Sant-Louis complexifies the possible sampling methods. As no open and spatialized register of businesses for the region of Saint-Louis exists, the estimates for the sampling had to be carried out visually after visits to the main market areas. This limited baseline data and information have justified the use of generally exploratory methods in both data collection and analysis.
On the question of the sampling method, different avenues could be used in future research and field exercises. In particular, the use of predefined grid sampling applied to businesses could advantageously cover the lack of baseline data with fine granularity. Such a grid could equally be used in conjunction with household surveys [6,53]. The use of grids combined with a study of social and economic inequalities could provide a direct instrument to correlate customer choices and the location of business categories with social inequalities.

5. Conclusions

This study illustrates one example of the ubiquity of digital technologies in a mid-sized African city. The spread of digital technologies is formed in different particular social and economic settings, of which Senegal and Saint-Louis constitute a particular iteration. Commodity markets in African cities have their own characteristics, with major roles played by second-hand products, which themselves have grades within the broad commerce of used materials.
Peculiarities, such as the African consumption of second-hand electronics being connected with upmarket products, demands exploratory approaches. This paper defended the development of a community mapping methodology to study the commerce of digital devices. The method and results show that this approach is adequate for picturing a mid-sized city, although a larger urban area would require important adaptations in time and space.
Second-hand product exports in Africa should not only be understood as waste, but also as the creation and recreation of economic activities that support the living conditions of the urban population. Commodity markets are differently integrated within societies. Markets get adapted to social and cultural conditions [54,55]. As the capacity of the youth to connect to the local, national, and global cyberspaces is contingent upon material devices, the importance of the structure of the market supports further enquiries into local electronics markets and social practices.
Urban structures and policies structure the widespread access to cheap (or expensive, but cheaper than on the “normal” world markets) electronic devices. The connectedness of Senegalese urban society to the global flows of digital trends and communication in turn materializes not only through hand-held or home electronic devices, but in shaping local economic and social life. Smartphones and accessories are sold on every street corner, shaping representations of the city, but also providing economic prospects for a local urban and regional economy.
This paper has defended a contrasting view from the existing research regarding electronics exports to Africa as a chain of waste management [1,2,3,56]. The Saint-Louis digital market, however, presents challenges in terms of sustainability. Within a global supply chain of electronic products, it is striking how much the re-use of digital products follows a circular approach independently of industrial policy. However, this relatively spontaneous process could be enhanced in terms of social and environmental sustainability. The formalization and support of the second-hand sector could help the sector to develop and stabilize, including through the development of technical standardization and training, thereby improving the end-of-life environmental sustainability of the process.
Access to cheap but good quality devices has become essential for the local population to connect to the social and economic force created by digital exchanges. To enhance the economic benefits of the second-hand digital trade while addressing its sustainability challenges, we propose a multi-level policy approach. Municipal authorities in Saint-Louis should launch public awareness campaigns on e-waste and install collection points to prevent environmental contamination. At the national level, the Senegalese government should establish a framework with quality standards for devices of different categories (new, imported second-hand, and locally used) and fund vocational training programs in electronics repair and e-waste management. Internationally, exporting countries and companies must fulfil their responsibility by financing support for local recycling infrastructure. Adopting these recommendations would shift the policy benefits from the existing semi-formal dynamics while actively supporting the sector’s development strength, and ensure more equitable and environmentally sound access to technology for urban populations.
In conclusion, while this exploratory study provides new insights into digital market structures, it also highlights several critical avenues for future research. Descriptively and analytically, the research has mainly been focused on exploring the little-known structure of an African digital market in a secondary city. The presentation of these products and businesses provides the basis for building efficient and relevant theories on consumer habits in Saint-Louis and can serve as a starting point for considering the complex nature of African consumption habits. Future avenues promise the refinement of theories, combined with the inclusion of more households in data collection to assess inequalities in access to technology more broadly.

Author Contributions

Conceptualization, P.D.R. and J.C.; methodology, P.D.R.; software, P.D.R.; validation, P.D.R., J.-C.B.M., D.S.A., D.S., T.M., C.S.W., D.M. and M.R.S.; formal analysis, P.D.R.; investigation, P.D.R., C.S.W., D.S.A., D.S. and T.M.; resources, P.D.R., C.S.W., D.S.A., D.S. and T.M.; data curation, P.D.R.; writing—original draft preparation, P.D.R.; writing—review and editing, P.D.R.; visualization, P.D.R.; supervision, P.D.R., J.C., C.S.W. and M.D.; project administration, P.D.R., J.C., C.S.W., M.L.N. and M.D.; funding acquisition, J.C., P.D.R., C.S.W. and M.L.N. All authors have read and agreed to the published version of the manuscript.

Funding

This project has been funded by Fondation Botnar (www.fondationbotnar.org). Funding reference number REG-22-010.

Institutional Review Board Statement

The study was conducted in accordance with the Declaration of Helsinki and approved in two separate applications by the Institutional Review Board (or Ethics Committee) of the Swiss Federal Institute of Technology, Lausanne (protocol code HREC000307, date of approval: 6 February 2023).

Informed Consent Statement

Informed consent was obtained from all subjects involved in the study.

Data Availability Statement

The data presented in this study are available on request from the corresponding author. The data are not publicly available due to privacy restrictions.

Acknowledgments

The research team wishes to thank the research participants in Saint-Louis for their engagement in the research. The research team also extends its thanks to Elhadji Mamadou Ndiaye at the Department of Geography of UGB and Carine Micheloud at EPFL for their support.

Conflicts of Interest

The authors declare no conflicts of interest.

References

  1. Lepawsky, J. The Changing Geography of Global Trade in Electronic Discards: Time to Rethink the e-Waste Problem. Geogr. J. 2015, 181, 147–159. [Google Scholar] [CrossRef]
  2. Lepawsky, J. Reassembling Rubbish: Worlding Electronic Waste; MIT Press: Cambridge, MA, USA, 2018; ISBN 978-0-262-53533-5. [Google Scholar]
  3. Lubick, N. Shifting Mountains of Electronic Waste. Environ. Health Perspect. 2012, 120, 148–149. [Google Scholar] [CrossRef] [PubMed]
  4. Setyadi, A.; Pawirosumarto, S.; Damaris, A. Embedding Circular Operations in Manufacturing: A Conceptual Model for Operational Sustainability and Resource Efficiency. Sustainability 2025, 17, 6737. [Google Scholar] [CrossRef]
  5. Santos, M. The Shared Space: The Two Circuits of the Urban Economy in Underdeveloped Countries; Routledge: London, UK, 2017; ISBN 978-1-315-10310-5. [Google Scholar]
  6. Adjanohoun, D.S.; Mbengue, T.P.; Sow, D.; Wade, C.S.; Seye, M.R.; Mbaye, D.; Diallo, M.; Ndiaye, M.L.; De Roulet, P.; Munyaka, J.C.B.; et al. The Digital Policies in the Face of Access and Usage Inequalities among Young People in Intermediate Cities in Senegal: The Case of Saint-Louis. J. Infrastruct. Policy Dev. 2025, 9, 10899. [Google Scholar] [CrossRef]
  7. Seye, M.R.; Mbaye, D.; Diallo, M.; Ndiaye, M.L.; Sow, D.; Adjanohoun, D.S.; Mbengue, T.; Wade, C.S.; Pablo, D.R.; Munyaka, J.-C.B.; et al. A Crowdsourcing-Based Walk Test Approach to Evaluate Mobile Network Quality. In Proceedings of the 2025 IEEE International Conference on Consumer Electronics (ICCE), Las Vegas, NV, USA, 11–14 January 2025; pp. 1–6. [Google Scholar]
  8. Sow, D.; Adjanohoun, D.; Mbengue, T.; Wade, C.S.; Seye, M.R.; Mbaye, D.; Ndiaye, M.; Diallo, M.; De Roulet, P.; Munyagua, J.C.; et al. Jeunes et fractures numériques à Saint-Louis (Sénégal): Entre inégalités territoriales, vulnérabilités sociales et dynamiques d’adaptation. Rev. Ivoirienne Géographie Savanes 2025, 18, 677–690. [Google Scholar]
  9. Jakobi, Á. Space and Virtuality: New Characteristics of Inequalities in the Information Society and Economy. Rev. Appl. Socio-Econ. Res. 2013, 5, 4–14. [Google Scholar]
  10. Tomasello, F. From Industrial to Digital Citizenship: Rethinking Social Rights in Cyberspace. Theory Soc. 2023, 52, 463–486. [Google Scholar] [CrossRef]
  11. Hargittai, E. The Digital Reproduction of Inequality. In The Inequality Reader; Routledge: Abingdon, UK, 2018; pp. 660–670. [Google Scholar]
  12. Mwaura, J.; Carter, V.; Kubheka, B.Z. Social Media Health Promotion in South Africa: Opportunities and Challenges. Afr. J. Prim. Health Care Fam. Med. 2020, 12, a2389. [Google Scholar] [CrossRef]
  13. Imoka, C. Digital Media, Popular Culture and Social Activism amongst Urban Youth in Nigeria. Crit. Afr. Stud. 2023, 15, 134–148. [Google Scholar] [CrossRef]
  14. Amankwaa, E.F.; Esson, J.; Gough, K.V. Geographies of Youth, Mobile Phones, and the Urban Hustle. Geogr. J. 2020, 186, 362–374. [Google Scholar] [CrossRef]
  15. ANSD. SES Régionales. Available online: https://www.ansd.sn/ses-regionales (accessed on 20 January 2025).
  16. Gueye Aïda, N. Contribution à l’étude de La Foresterie Urbaine Dans La Commune de Saint-Louis, Sénégal. Rev. Ecosystèmes Paysages 2024, 4, 1–21. [Google Scholar] [CrossRef]
  17. Sane, C. La Région de Saint-Louis Du Sénégal: Patrimoine, Tourisme et Développement. Ph.D. Thesis, Research Center in International and Atlantic History, Nantes, France, 2021. [Google Scholar]
  18. Faye, D. Urbanisation et Dynamique Des Transports “Informels” et Des Mobilités Dans Les Villes Secondaires Sénégalaises: Les Cas de Touba, Thiès et Saint Louis. Ph.D. Thesis, Université Michel de Montaigne-Bordeaux III, Pessac, France, 2013. [Google Scholar]
  19. Silver, J.; McEwan, C.; Petrella, L.; Baguian, H. Climate Change, Urban Vulnerability and Development in Saint-Louis and Bobo-Dioulasso: Learning from across Two West African Cities. Local Environ. 2013, 18, 663–677. [Google Scholar] [CrossRef]
  20. Grydehøj, A. Guest Editorial Introduction: Understanding Island Cities. Isl. Stud. J. 2014, 9, 183–190. [Google Scholar] [CrossRef]
  21. Sui, J.; Zhang, G.; Lin, T.; Hamm, N.A.S.; Li, C.; Wu, X.; Hu, K. Quantitative Evaluation of Spatial Accessibility of Various Urban Medical Services Based on Big Data of Outpatient Appointments. Int. J. Environ. Res. Public Health 2023, 20, 5050. [Google Scholar] [CrossRef] [PubMed]
  22. Diop, C. Water and Sanitation in the Neighborhood of Guet Ndar-Senegal Cheikh DIOP. Int. J. Eng. Work. 2017, 4, 93–100. [Google Scholar]
  23. Hannah, C.; Davies, J.; Green, R.; Zimmer, A.; Anderson, P.; Battersby, J.; Baylis, K.; Joshi, N.; Evans, T.P. Persistence of Open-Air Markets in the Food Systems of Africa’s Secondary Cities. Cities 2022, 124, 103608. [Google Scholar] [CrossRef]
  24. Khouma, M. Commerce et gestion de l’espace urbain à Dakar: Enjeux, logiques et stratégies des acteurs. Ph.D. Thesis, Normandie Université, Caen, France, 2017. [Google Scholar]
  25. Zickgraf, C. Relational (Im)Mobilities: A Case Study of Senegalese Coastal Fishing Populations. J. Ethn. Migr. Stud. 2022, 48, 3450–3467. [Google Scholar] [CrossRef]
  26. Ayson, D. Community Mapping and Data Gathering for City Planning in the Philippines. Environ. Urban. 2018, 30, 501–518. [Google Scholar] [CrossRef]
  27. De Roulet, P.; Chenal, J.; Munyaka, J.-C.B.; Pudasaini, U. Mapping Rural Mobility in the Global South: Case Studies of Participatory GIS Approach for Assessments of Daily Movement Needs and Practice in Nepal and Kenya. Sustainability 2024, 16, 9442. [Google Scholar] [CrossRef]
  28. Santos, A.P.; Pessoa Colombo, V.; Heider, K.; Rodriguez-Lopez, J.M. Comparing Volunteered Data Acquisition Methods on Informal Settlements in Mexico City and São Paulo: A Citizen Participation Ladder for VGI. In Socio-Environmental Research in Latin America: Interdisciplinary Approaches Using GIS and Remote Sensing Frameworks; López, S., Ed.; The Latin American Studies Book Series; Springer International Publishing: Cham, Switzerland, 2023; pp. 255–280. ISBN 978-3-031-22680-9. [Google Scholar]
  29. Sumo, P.D.; Arhin, I.; Danquah, R.; Nelson, S.K.; Achaa, L.O.; Nweze, C.N.; Cai, L.; Ji, X. An Assessment of Africa’s Second-Hand Clothing Value Chain: A Systematic Review and Research Opportunities. Text. Res. J. 2023, 93, 4701–4719. [Google Scholar] [CrossRef]
  30. Manieson, L.A. Castoff from the West, Pearls in Kantamanto? A Critique of Second-hand Clothes Trade. J. Ind. Ecol. 2022, 27, 811–821. [Google Scholar] [CrossRef]
  31. Boimah, M.; Weible, D. “We Prefer Local but Consume Imported”: Results from a Qualitative Study of Dairy Consumers in Senegal. J. Int. Food Agribus. Mark. 2023, 35, 244–260. [Google Scholar] [CrossRef]
  32. Hansen, K.T. Second-Hand Clothing Encounters in Zambia: Global Discourses, Western Commodities, and Local Histories. Africa 1999, 69, 343–365. [Google Scholar] [CrossRef]
  33. ANSD. Enquête Harmonisée sur les Conditions de Vie des Ménages (EHCVM II) au Sénégal: RAPPORT FINAL; Agence Nationale de la Statistique et de la Démographie: Dakar, Senegal, 2024. [Google Scholar]
  34. Senegal Average Monthly Wage. Available online: https://tradingeconomics.com/senegal/wages (accessed on 18 August 2025).
  35. Esselaar, S.; Stork, C. Mobile Cellular Telephone: Fixed-Line Substitution in Sub-Saharan Africa. S. Afr. J. Inf. Commun. 2005, 2005, 64–73. [Google Scholar]
  36. Hamilton, J. Are Main Lines and Mobile Phones Substitutes or Complements? Evidence from Africa. Telecommun. Policy 2003, 27, 109–133. [Google Scholar] [CrossRef]
  37. Arentze, T.A.; Oppewal, H.; Timmermans, H.J.P. A Multipurpose Shopping Trip Model to Assess Retail Agglomeration Effects. J. Mark. Res. 2005, 42, 109–115. [Google Scholar] [CrossRef]
  38. Brown, S. A Perceptual Approach to Retail Agglomeration. Area 1987, 19, 131–140. [Google Scholar]
  39. Mushinski, D.; Weiler, S. A Note on the Geographic Interdependencies of Retail Market Areas. J. Reg. Sci. 2002, 42, 75–86. [Google Scholar] [CrossRef]
  40. Thilmany, D.; McKenney, N.; Mushinski, D.; Weiler, S. Beggar-Thy-Neighbor Economic Development: A Note on the Effect of Geographic Interdependencies in Rural Retail Markets. Ann. Reg. Sci. 2005, 39, 593–605. [Google Scholar] [CrossRef]
  41. Ivaschenko, A.; Stolbova, A.; Golovnin, O. Spatial Clustering Based on Analysis of Big Data in Digital Marketing. In Artificial Intelligence; Kuznetsov, S.O., Panov, A.I., Eds.; Springer International Publishing: Cham, Switzerland, 2019; pp. 335–347. [Google Scholar]
  42. Sigué, O.; Zoma, V. Transport International de Véhicules d’occasion Entre Le Burkina Faso et Le Togo: Un Exemple de Mondialisation Par Le “Bas.”. Djiboul 2022, 1, 470–487. [Google Scholar]
  43. Asante, K.A.; Amoyaw-Osei, Y.; Agusa, T. E-Waste Recycling in Africa: Risks and Opportunities. Curr. Opin. Green Sustain. Chem. 2019, 18, 109–117. [Google Scholar] [CrossRef]
  44. Njoku, A.; Agbalenyo, M.; Laude, J.; Ajibola, T.F.; Attah, M.A.; Sarko, S.B. Environmental Injustice and Electronic Waste in Ghana: Challenges and Recommendations. Int. J. Environ. Res. Public Health 2024, 21, 25. [Google Scholar] [CrossRef]
  45. Owusu-Sekyere, K.; Aladago, D.A.; Leverenz, D.; Oteng-Ababio, M.; Kranert, M. Environmental Impacts on Soil and Groundwater of Informal E-Waste Recycling Processes in Ghana. Sustainability 2024, 16, 4347. [Google Scholar] [CrossRef]
  46. McMahon, K.; Uchendu, C.; Fitzpatrick, C. Quantifying Used Electrical and Electronic Equipment Exported from Ireland to West Africa in Roll-on Roll-off Vehicles. Resour. Conserv. Recycl. 2021, 164, 105177. [Google Scholar] [CrossRef]
  47. Crozier, M.N.; Ntsala, P.G.; Schenck, C.; Crozier McCleland, J.; van Dyk, E.E.; Petersen, J. Drivers, Barriers and Enablers of a South African Circular Solar PV Module Supply Chain: A Focus on Reuse. Waste Manag. Res. 2025, 0, 0734242X251340306. [Google Scholar] [CrossRef]
  48. Porter, G. Mobile Phones, Livelihoods and the Poor in Sub-Saharan Africa: Review and Prospect. Geogr. Compass 2012, 6, 241–259. [Google Scholar] [CrossRef]
  49. Porter, G.; Hampshire, K.; Abane, A.; Munthali, A.; Robson, E.; Mashiri, M.; Tanle, A. Youth, Mobility and Mobile Phones in Africa: Findings from a Three-Country Study. Inf. Technol. Dev. 2012, 18, 145–162. [Google Scholar] [CrossRef]
  50. James, J. Product Use and Welfare: The Case of Mobile Phones in Africa. Telemat. Inform. 2014, 31, 356–363. [Google Scholar] [CrossRef]
  51. Goodchild, M.F. Towards a Geography of Geographic Information in a Digital World. Comput. Environ. Urban Syst. 1997, 21, 377–391. [Google Scholar] [CrossRef]
  52. Fischer, K. Central Places: The Theories of von Thünen, Christaller, and Lösch. In Foundations of Location Analysis; Eiselt, H.A., Marianov, V., Eds.; Springer US: New York, NY, USA, 2011; pp. 471–505. ISBN 978-1-4419-7572-0. [Google Scholar]
  53. Boo, G.; Darin, E.; Thomson, D.R.; Tatem, A.J. A Grid-Based Sample Design Framework for Household Surveys. Gates Open Res. 2020, 4, 13. [Google Scholar] [CrossRef]
  54. Collins, J.L.; Creamer, W.; Dolan, C.S.; Plattner, S.; Polier, N.; Roberts, B.D.; Rothman, M.S.; Stanford, L.; Stone, M.P.; Vargas-Cetina, G.; et al. Commodities and Globalization; Haugerud, A., Stone, P.M., Little, P.D., Eds.; Rowman & Littlefield Publishers: Lanham, MD, USA, 2000; ISBN 978-0-8476-9943-8. [Google Scholar]
  55. Martin, C.; Marmont, G. Global Commodity Circuits. In Research Handbook on the Sociology of Globalization; Edward Elgar Publishing: Northampton, UK, 2023; pp. 45–59. ISBN 978-1-83910-157-1. [Google Scholar]
  56. Xavier, L.H.; Ottoni, M.; Lepawsky, J. Circular Economy and E-Waste Management in the Americas: Brazilian and Canadian Frameworks. J. Clean. Prod. 2021, 297, 126570. [Google Scholar] [CrossRef]
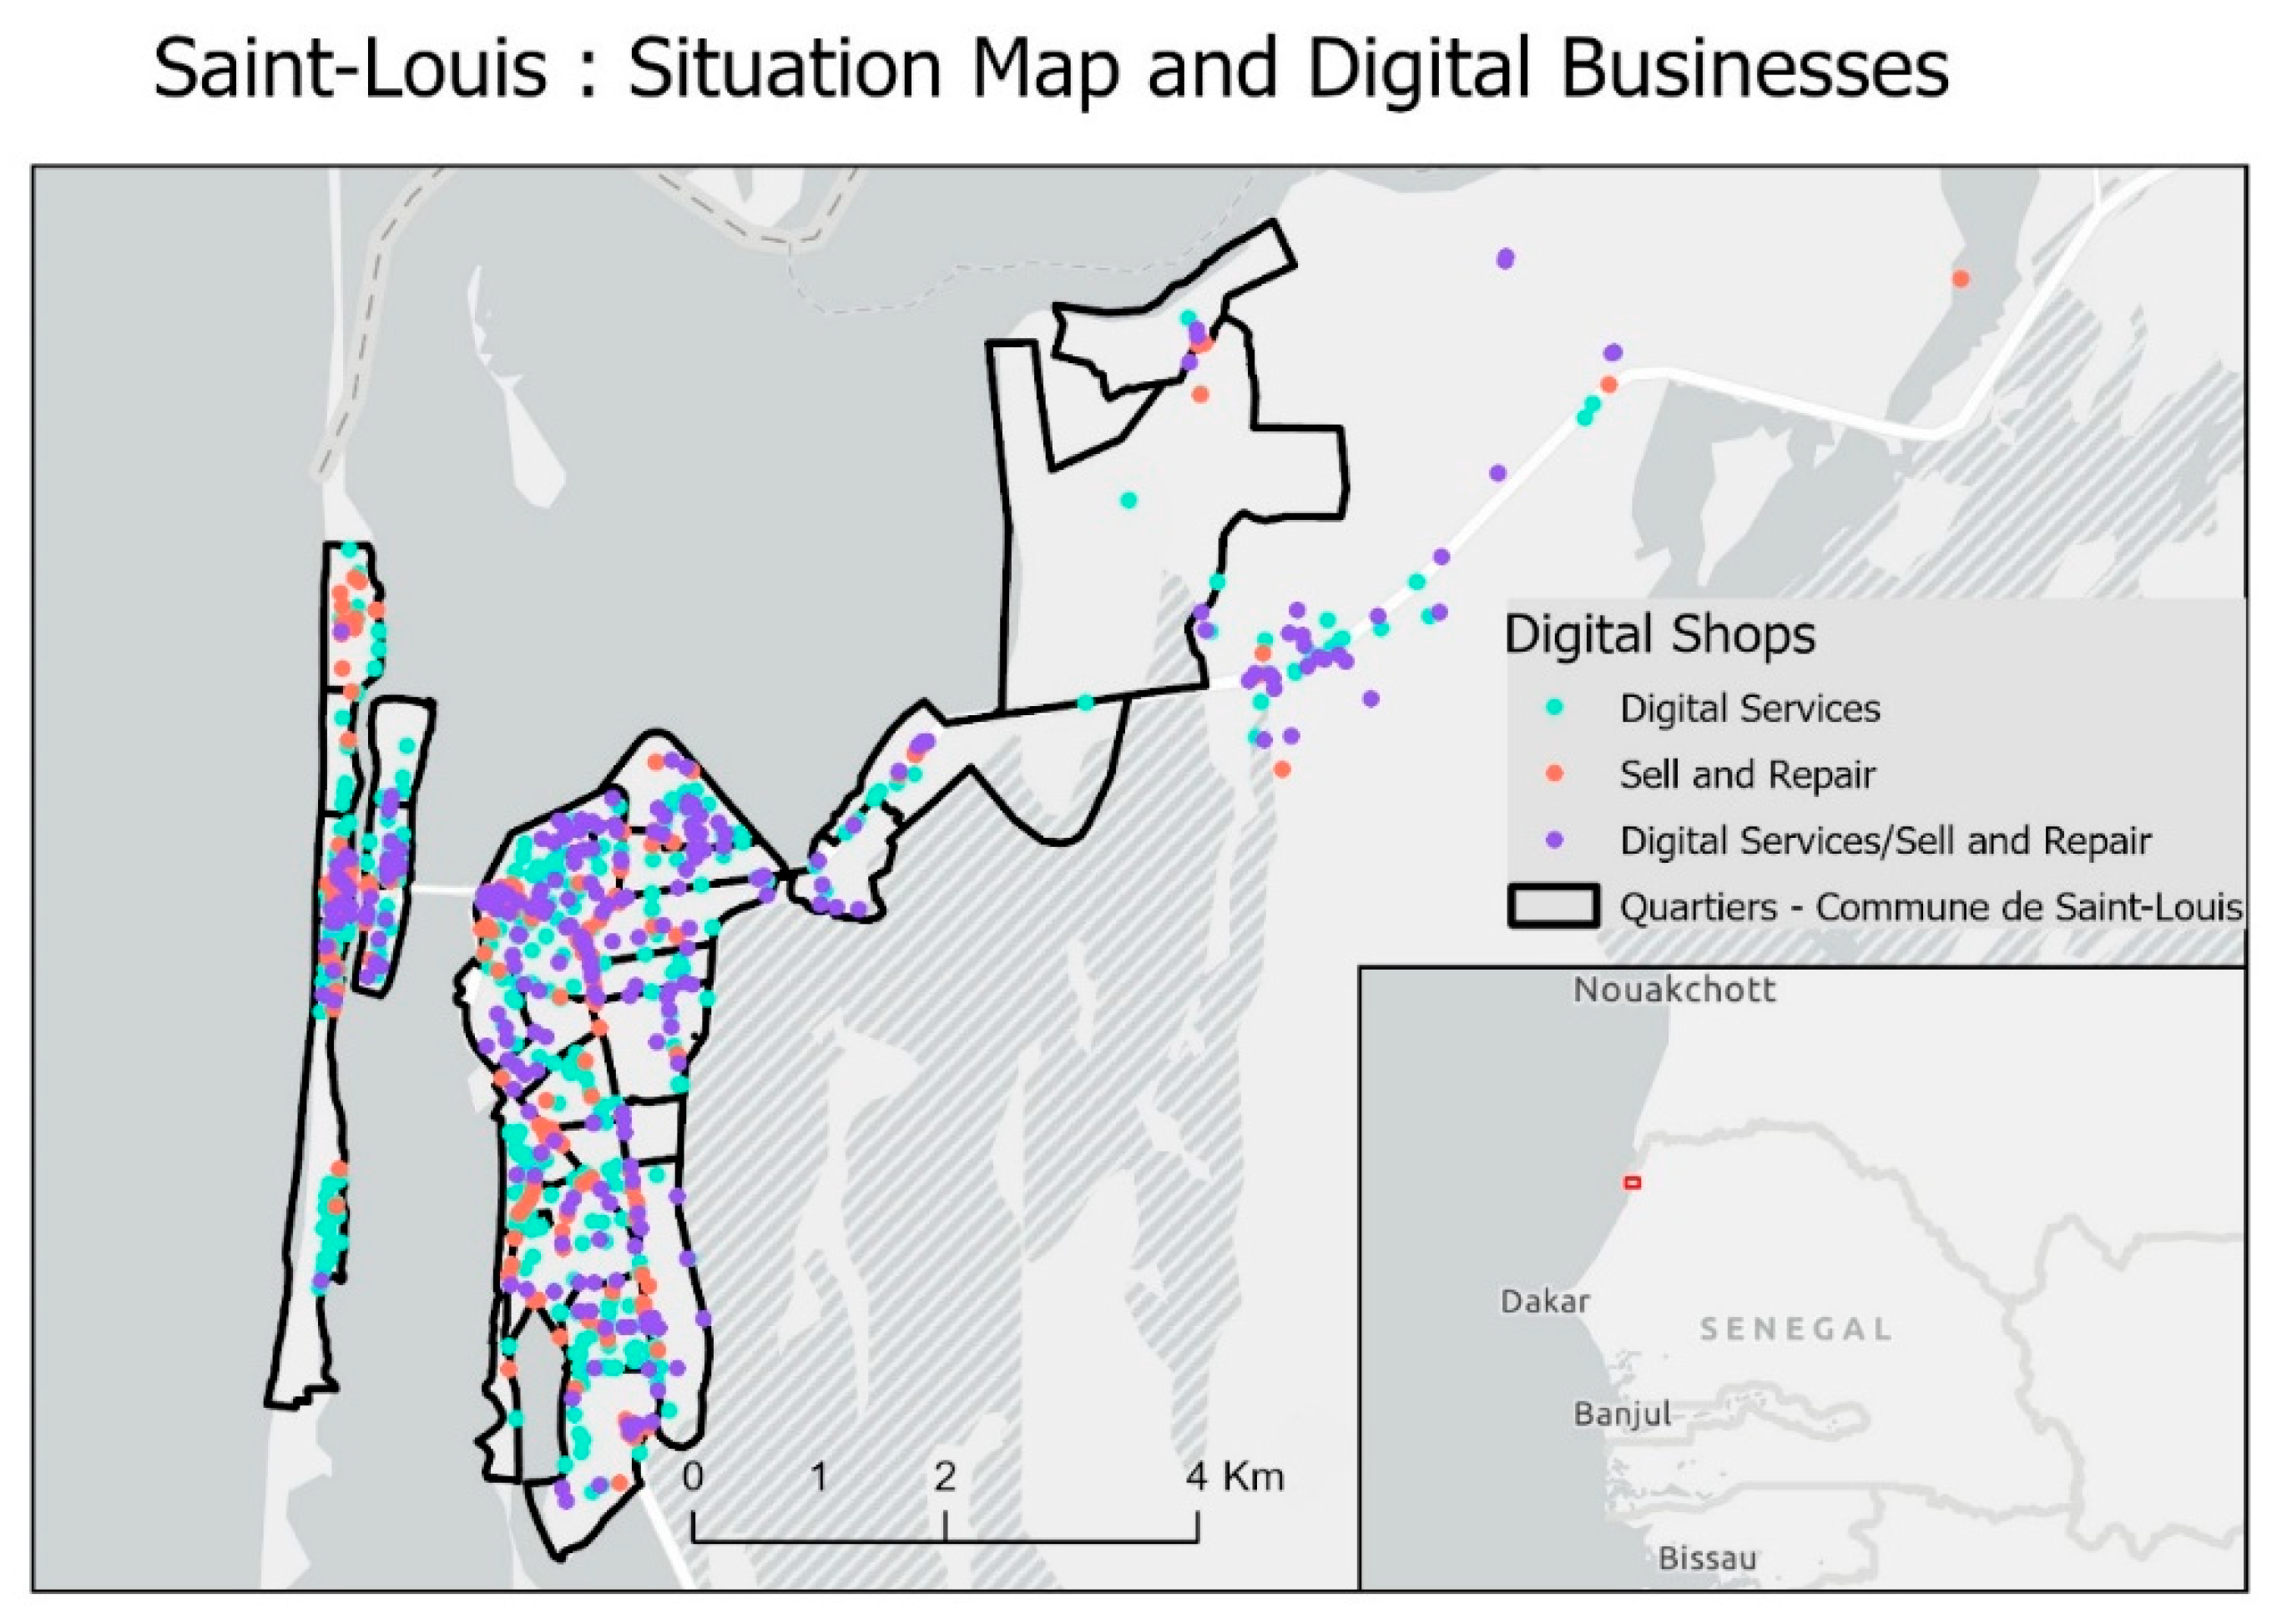
Figure 1. Digital shops in Saint-Louis. (Elaborated from author research and © OpenStreetMap Contributors for basemap).
Sustainability 17 08959 g001
Figure 2. Divided into small groups, participants design maps and plan their itineraries in the city.
Sustainability 17 08959 g002
Figure 3. Electronic repair shop within a neighborhood, serving local customers.
Sustainability 17 08959 g003
Figure 4. In the central market area of the Sor market, shops and stalls are stacked next to each other.
Sustainability 17 08959 g004
Figure 5. Some brands are correlated with higher overall prices, while others are associated with cheaper items.
Sustainability 17 08959 g005
Figure 6. Boxplots of the minimum prices for three kinds of smartphones. In the boxplots, the green line represents the median and the boxes represent the interquartile range.
Sustainability 17 08959 g006
Figure 7. Boxplots of the maximum prices for three kinds of smartphones. In the boxplots, the green line represents the median, the boxes represent the interquartile range, and the circles represent individual outlier values.
Sustainability 17 08959 g007
Figure 8. Boxplots of the price differences for each category of smartphone. In the boxplots, the green line represents the median, the boxes represent the interquartile range, and the circles represent individual outlier values.
Sustainability 17 08959 g008
Figure 9. Shops selling only accessories for smartphones, compared to the other shops, illustrating how they are generally located “deep” into neighborhoods rather than close to the road axes. (Elaborated from author research and © OpenStreetMap Contributors for basemap).
Sustainability 17 08959 g009
Figure 10. Locations of shops selling smartphones in Saint-Louis. (Elaborated from author research and © OpenStreetMap Contributors for basemap).
Sustainability 17 08959 g010
Figure 11. The locations of shops selling fixed telephones in Saint-Louis are almost exclusively in the city center. (Elaborated from author research and © OpenStreetMap Contributors for basemap).
Sustainability 17 08959 g011
Figure 12. A cluster analysis demonstrates how the geographic centrality of the Sor market combines with the highest numbers of digital shops, whare areas in red are closer to the center of the main cluster. Darker shades of points indicate proximity to the main and secondary clusters. (Elaborated from author research).
Sustainability 17 08959 g012
Figure 13. Density-based sizing of concentration of types of electronic items sold shows how some are more central, when more “niche” and others are widespread, when broadly used. (Elaborated from author research).
Sustainability 17 08959 g013
Table 1. All electronics shops surveyed in Saint-Louis.
RepairsSalesSales and RepairsGrand Total
Digital Services 408
Sales/Repairs13186126327Number of shops selling digital devices = 583
Sales/Repairs—Digital Services321835256
Grand Total16404161991
Table 2. Broad distinctions between local and imported second-hand devices, as perceived by research participants.
Local Second-Hand ElectronicsImported Second-Hand Electronics
OriginsSenegal (or less frequently neighboring countries, especially Mauritania).Mainly Europe or Canada.
Quality and ConditionOften heavily used. Condition attributed to longer usage period, and local conditions make maintenance harder (higher temperatures and dust).Perceived as higher quality. More trust regarding the state of the item.
PriceCheaper, no transport or tax costs involved.Generally more expensive.
Social PerceptionSometimes seen as less reliable or less modern.Valued for quality and intrinsic worth.
Table 3. Shops selling new, imported, and local second-hand smartphones.
Number of Shops Selling SmartphonesSelling New SmartphonesSelling Imported SmartphonesSelling Local SmartphonesBusinesses That Have Indicated Their Prices
312242157136260
Table 4. Brands and share of the shops in the city.
Brand SoldNumber of Shops
Tecno273
Samsung264
Itel213
iPhone207
Huawei135
Nokia69
Alcatel43
Sony28
ZTE24
Table 5. Correlation matrix of brands sold, quality, and prices with correlation (Rho) and p-values.
MINIMUM Price for NEW SmartphoneMAXIMUM Price for NEW SmartphoneMINIMUM Price for IMPORTED Second-Hand SmartphoneMAXIMUM Price for IMPORTED Second-Hand SmartphoneMINIMUM Price for LOCAL Second-Hand SmartphoneMAXIMUM Price for LOCAL Second-Hand Smartphone
Samsung−0.06 (p = 0.330)−0.07 (p = 0.268)−0.06 (p = 0.475)−0.04 (p = 0.655)0.15 (p = 0.085)0.02 (p = 0.828)
iPhone0.02 (p = 0.798)0.28 (p = 0.000)0.17 (p = 0.032)0.30 (p = 0.000)0.25 (p = 0.004)0.33 (p = 0.000)
Huawei−0.11 (p = 0.095)0.12 (p = 0.055)−0.28 (p = 0.000)−0.12 (p = 0.149)0.01 (p = 0.940)0.09 (p = 0.304)
Techno−0.09 (p = 0.176)−0.12 (p = 0.066)−0.19 (p = 0.016)−0.16 (p = 0.048)0.06 (p = 0.496)−0.13 (p = 0.140)
Itel−0.17 (p = 0.008)−0.11 (p = 0.085)−0.05 (p = 0.546)−0.06 (p = 0.455)−0.03 (p = 0.711)−0.04 (p = 0.623)
Alcatel−0.00 (p = 0.973)0.01 (p = 0.889)−0.01 (p = 0.915)−0.01 (p = 0.872)−0.00 (p = 0.998)−0.02 (p = 0.862)
Nokia−0.13 (p = 0.050)0.02 (p = 0.717)−0.03 (p = 0.687)0.07 (p = 0.379)0.11 (p = 0.201)0.06 (p = 0.464)
LG0.02 (p = 0.789)0.09 (p = 0.179)−0.05 (p = 0.567)0.01 (p = 0.921)0.15 (p = 0.080)0.06 (p = 0.482)
Sony−0.05 (p = 0.464)0.13 (p = 0.045)−0.06 (p = 0.431)0.03 (p = 0.749)−0.00 (p = 0.983)0.02 (p = 0.786)
ZTE−0.09 (p = 0.166)0.03 (p = 0.653)0.00 (p = 0.966)0.04 (p = 0.654)0.12 (p = 0.161)0.10 (p = 0.268)
Lenovo−0.01 (p = 0.845)0.16 (p = 0.010)0.10 (p = 0.196)0.20 (p = 0.012)0.18 (p = 0.033)0.16 (p = 0.068)
Azus−0.11 (p = 0.085)0.15 (p = 0.023)−0.02 (p = 0.842)0.14 (p = 0.074)−0.02 (p = 0.843)0.14 (p = 0.110)
Acer−0.11 (p = 0.093)0.16 (p = 0.010)−0.04 (p = 0.638)0.12 (p = 0.142)0.02 (p = 0.776)0.14 (p = 0.116)
Infinix−0.13 (p = 0.049)0.10 (p = 0.138)−0.11 (p = 0.168)−0.01 (p = 0.945)0.14 (p = 0.107)0.14 (p = 0.113)
Others−0.02 (p = 0.748)0.09 (p = 0.142)−0.02 (p = 0.799)−0.05 (p = 0.567)−0.01 (p = 0.924)0.01 (p = 0.943)
Disclaimer/Publisher’s Note: The statements, opinions and data contained in all publications are solely those of the individual author(s) and contributor(s) and not of MDPI and/or the editor(s). MDPI and/or the editor(s) disclaim responsibility for any injury to people or property resulting from any ideas, methods, instructions or products referred to in the content.