Article

Designing Sustainable Urban Green Spaces: Audio-Visual Interaction for Psychological Restoration

1
College of Art & Design, Nanjing Forestry University, No.159 Longpan Road, Xuanwu District, Nanjing 210037, China
2
Department of Psychology, Jeffrey Cheah School of Medicine and Health Sciences, Monash University Malaysia, Bandar Sunway 475000, Malaysia
*
Author to whom correspondence should be addressed.
Sustainability 2025, 17(19), 8906; https://doi.org/10.3390/su17198906
Submission received: 4 September 2025 / Revised: 25 September 2025 / Accepted: 6 October 2025 / Published: 7 October 2025

Abstract

Urban green spaces are essential for promoting human health and well-being, especially in cities facing increasing noise pollution and ecological stress. This study investigates the effects of audio-visual interaction on restorative outcomes across three soundscape types (park, residential, and street), focusing on the compensatory role of positive visual stimuli in low-quality soundscape environments. Thirty-two university students participated in a controlled evaluation using soundscapes and corresponding visual materials derived from 30 urban green spaces. A two-way repeated measures ANOVA revealed significant main effects of soundscape type and modality (auditory vs. audio-visual), as well as a significant interaction between these factors. Audio-visual conditions consistently outperformed auditory conditions, with the strongest restorative effects observed in noisy street soundscapes when paired with positive visual stimuli. Further analysis highlighted that visual cleanliness and structural clarity significantly enhanced restorative outcomes in challenging environments. These findings align with existing theories of sensory integration and extend their application to large-scale urban settings. This study shows that multi-sensory optimization can mitigate urban environmental stressors, supporting healthier, more resilient, and sustainable urban environments. Future research should explore long-term and cross-cultural applications to inform evidence-based urban planning and public health policies.

1. Introduction

In the context of accelerating urbanization and ecological degradation, designing spaces that reduce stress and promote human health and well-being has become a key challenge for sustainable urban development. Urban green spaces are recognized as critical infrastructures that support ecosystem services, enhance environmental resilience, and mitigate the negative effects of noise, air pollution, and social stressors. Audio-visual interaction, a critical dimension of multisensory experience, has recently emerged as a prominent topic in these fields. As early as 1969, Southworth conducted a seminal study in Boston, revealing the intricate relationship between urban acoustics and visual experiences [1]. Since then, a growing body of research has examined how audio-visual interactions shape individuals’ perceptions of their surroundings and influence their behavior. These studies have provided valuable theoretical insights into sensory integration while offering practical guidance for creating livable and functionally enhanced urban spaces that improve residents’ quality of life.
At the core of this research lies the concept of audiovisual congruence, which refers to the degree of alignment between auditory and visual elements within an environment. Such congruence has been shown to significantly enhance individuals’ environmental experiences [2]. Empirical evidence suggests that the integration of visual and auditory stimuli under congruent conditions can improve perception and foster positive interactions between individuals and their surroundings [3]. In the context of restorative environments, soundscapes have been found to play a particularly critical role. Compared to visual elements, sound often dominates environmental preferences [4]. Soundscapes are typically classified into three categories—natural, human, and mechanical sounds—with natural sounds such as birdsong consistently rated as more beneficial for psychological well-being, while urban noise (e.g., traffic) is frequently associated with adverse effects [5,6,7]. These findings have spurred the development of augmented soundscape technologies, which aim to mitigate harmful sounds and introduce preferred sounds to improve urban environments [8,9].
However, current applications of these approaches are primarily confined to single types of green space and small or medium-scale spaces. For instance, the “CANOPY/Rainforest Listening” project used mobile devices and headphones to play rainforest sounds at specific locations, offering participants moments of relaxation in noisy urban environments [8]. Similarly, fixed outdoor speakers have been employed to enhance soundscape quality in public spaces [10]. While these approaches have demonstrated positive effects in small and medium-scale settings, their effective influence range is inherently limited, which constrains their scalability for large urban environments where sound propagation is complex and difficult to control.
In large-scale urban settings, the physical properties of acoustic spaces, the characteristics of sound propagation, and the limitations of human auditory perception pose significant challenges. Low-frequency background noise, in particular, is often difficult to control. Consequently, relying solely on auditory adjustments is insufficient; visual elements must also be optimized to improve the overall audio-visual experience. Previous studies have demonstrated that exposure to natural environments can effectively alleviate negative emotional states [11,12,13,14] and offset common urban stressors, such as noise, crowding, and air pollution [15,16]. Importantly, the restorative potential of environments depends not only on visual features, such as landscape color and style, but also on auditory elements, including the degree of congruence between soundscapes and visual stimuli [17,18]. While these findings provide critical insights, the dynamic role of audio-visual congruence across different soundscape types and urban scenarios remains underexplored.
To address these gaps, the present study systematically examines the effects of audio-visual congruence in large-scale urban environments. Specifically, we focus on three representative types of urban green space (park, residential, and street) and compare restorative outcomes under auditory and audiovisual conditions. This approach allows us to assess whether audiovisual integration consistently enhances restoration across different noise levels and whether its compensatory effects are particularly pronounced in noise-dominated environments. Based on this objective, we formulate the following research questions (Figure 1):
Q1: Does audio-visual congruence significantly enhance the restorative quality of urban environments compared with auditory conditions?
Q2: Does the magnitude of this enhancement differ across soundscape types, with the strongest effects expected in streets characterized by high noise levels?

2. Materials and Methods

2.1. Participants

Existing research suggests that university students’ evaluations of landscapes can, to a certain extent, represent public judgments [19]. Additionally, experimental studies have shown no significant differences in landscape evaluations between university students and the general population [20]. Differences in evaluation performance among participants with diverse academic backgrounds are also minimal [21].
The required sample size for this study was estimated using G*Power 3.1 [22]. Given the experimental design, the statistical test was specified as a repeated measures ANOVA within factors. The effect size (f) was set to 0.25, with a significance level (α) of 0.05. Power analysis indicated that a minimum of 18 participants would be necessary to achieve a statistical power of 0.80 (1-β). In this study, 36 university students were initially recruited and offered course credit as compensation. Data from four participants were excluded due to clear signs of inattention during all three experimental blocks, resulting in a final sample of 32 students (6 male, 26 female) aged 18–20 years (M = 19.63, SD = 1.10). Of the participants, 89% had academic backgrounds related to landscape architecture or environmental design. All participants reported normal vision and hearing, meeting the study’s requirements. We obtained informed consent from all participants prior to the experiment. This study, reviewed and approved by the Academic Committee of College of Art & Design in Nanjing Forestry University, ensures a scientifically sound, fair, and impartial design, with voluntary informed consent from participants, protection of their rights and privacy, and no conflicts of interest or ethical violations.

2.2. Site Selection and Survey Design

This study focused on three common types of green spaces in daily life: parks, residential areas, and streetscapes. These categories reflect the diversity of urban green spaces. Site selection criteria included high foot traffic, frequent usage, and distinct visual characteristics. A total of 30 sites were selected: 10 park green spaces, 10 residential green spaces, and 10 street green spaces. These sites were distributed across four major districts in Nanjing: 6 in Xuanwu District, 9 in Gulou District, 8 in Qinhuai District, 4 in Jianye District, and 3 located at district boundaries (Table A1). Surveys were conducted during early summer (June–July 2022) and early spring (February–March 2023), which are peak periods for outdoor activities. All surveys were conducted on days with favorable weather to maximize ecological validity, capturing participants’ typical outdoor experiences. Data collection equipment included Huawei nova8pro smartphones.

2.3. Experimental Materials

2.3.1. Soundscape Materials

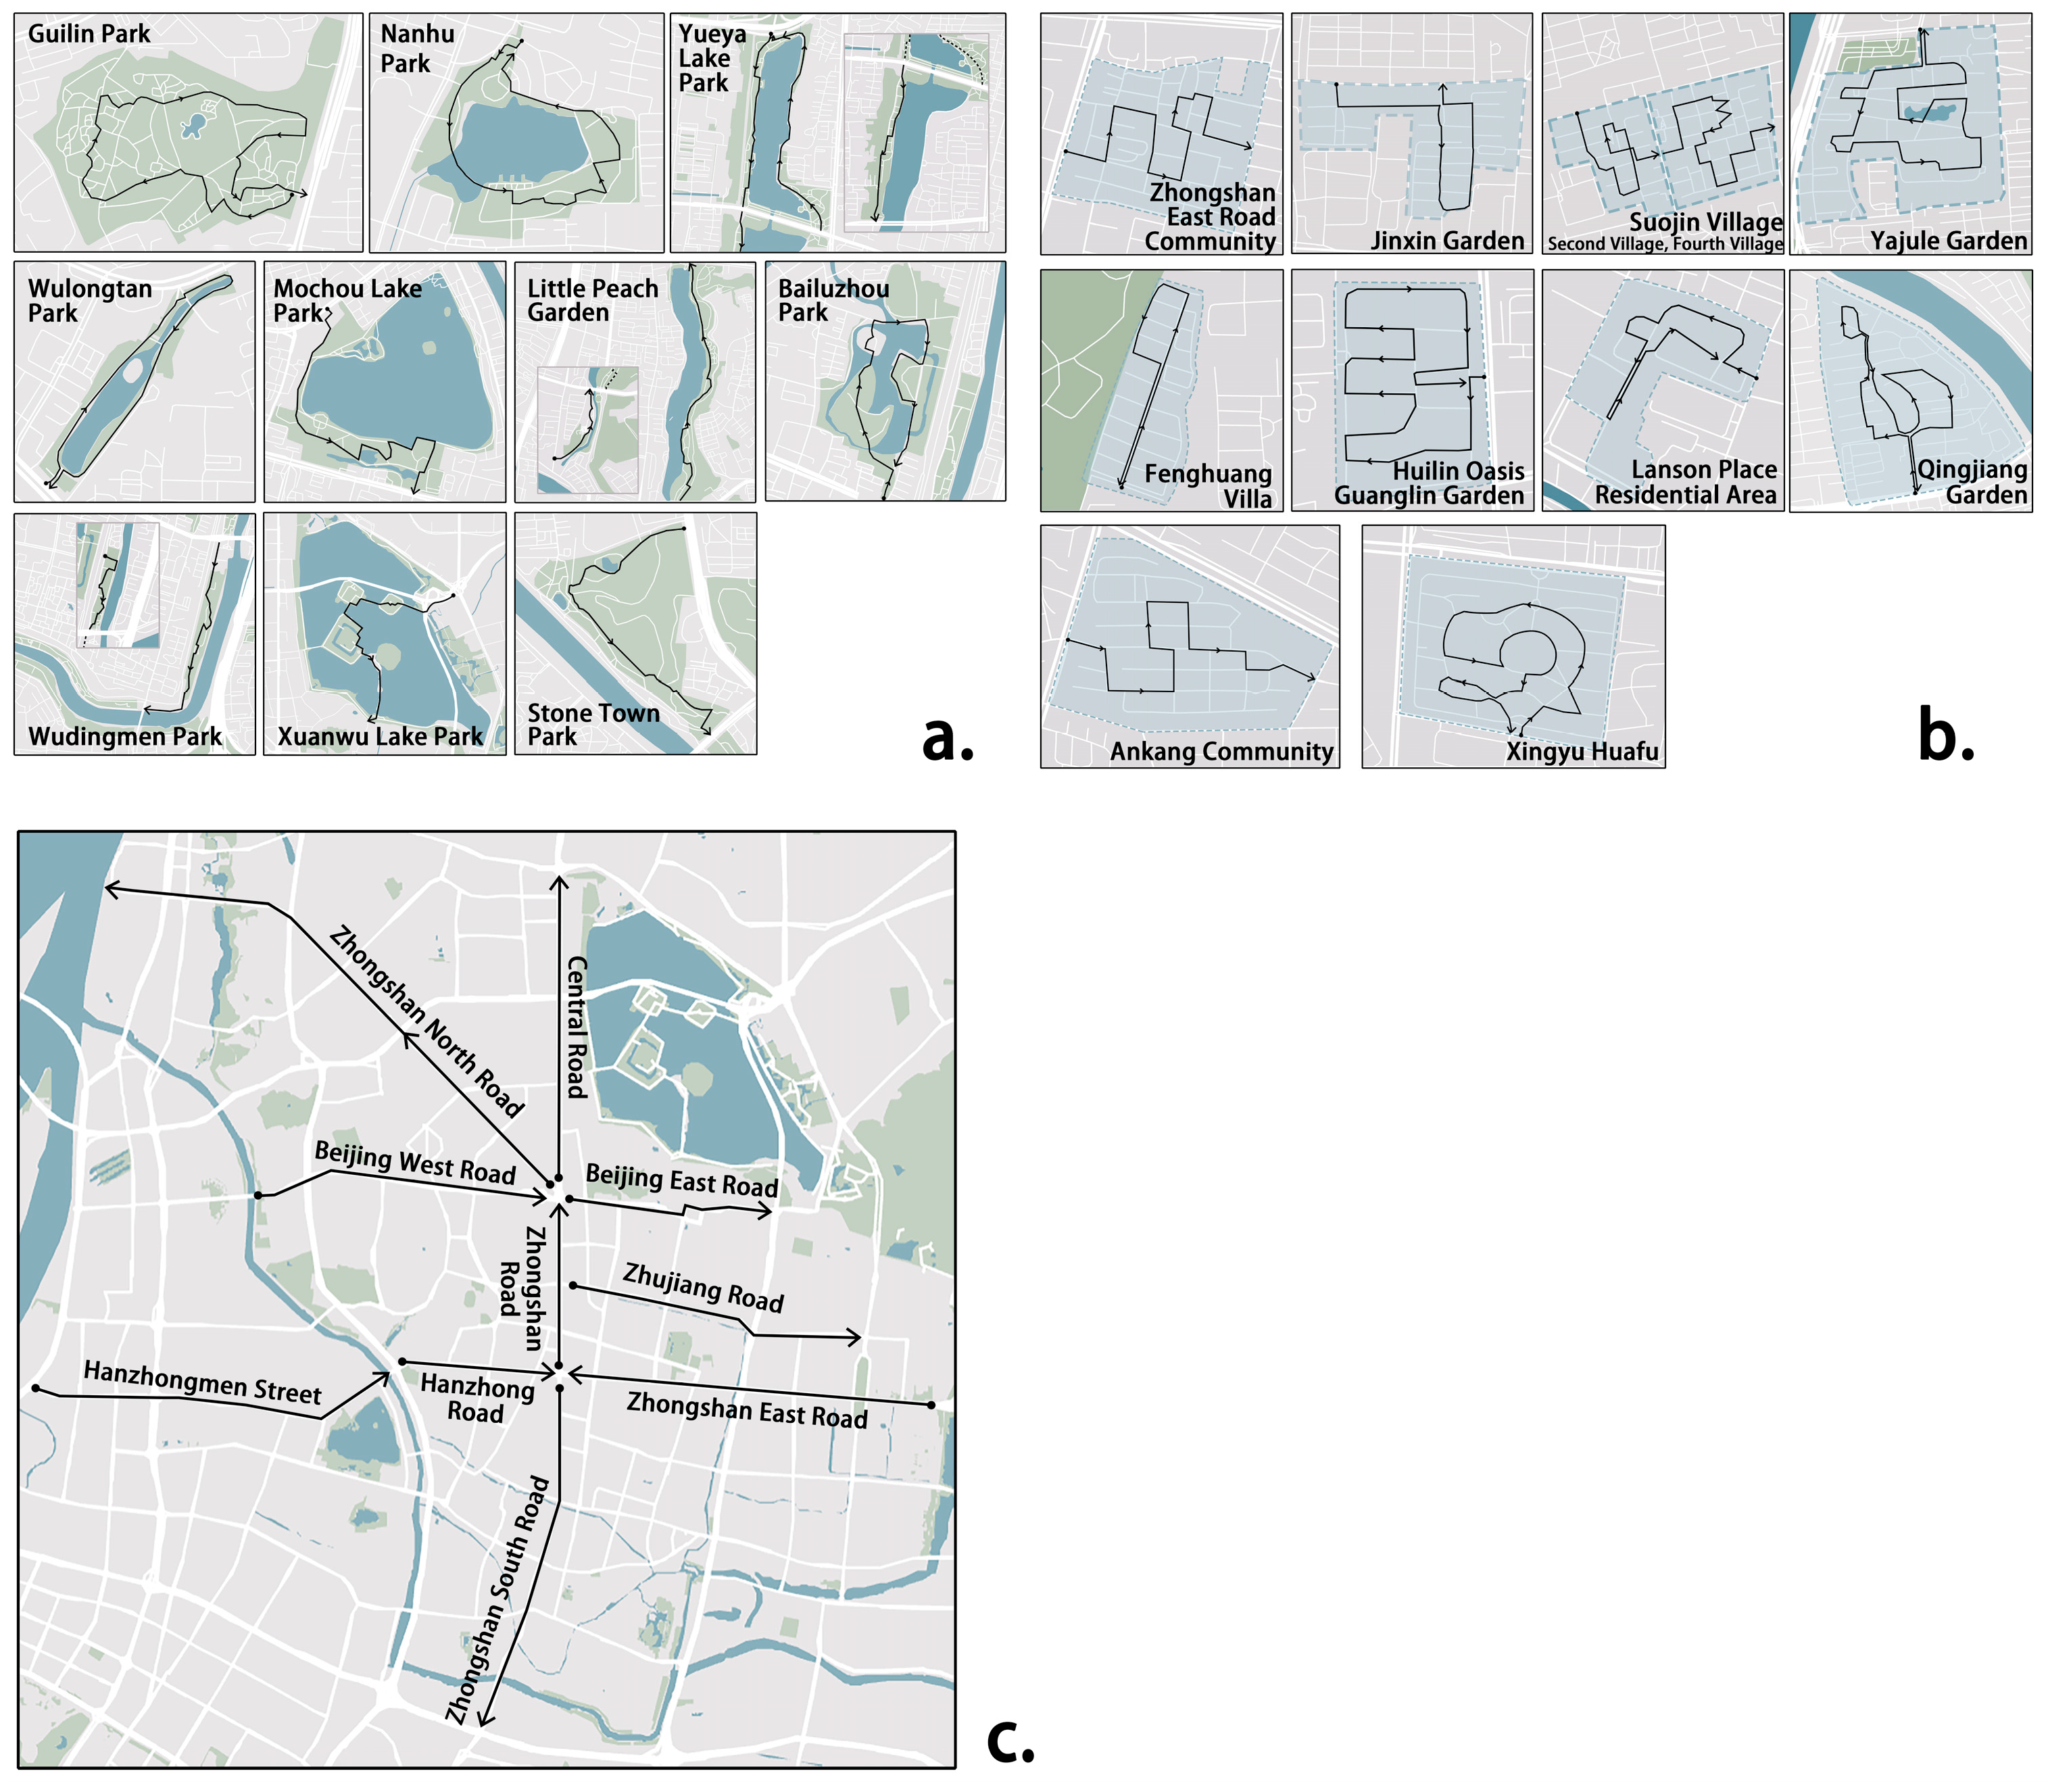
Environmental sounds were collected using the soundwalk method along predefined survey routes. A soundwalk is a structured method for collecting and experiencing soundscapes in situ, in which researchers or participants follow a predetermined route at a constant pace while systematically listening to, recording, and documenting the surrounding acoustic environment. This approach captures the temporal and spatial variation of soundscapes and has been widely recommended in international soundscape standards [23,24]. For parks, the routes followed main pathways. In residential areas, pedestrian-prioritized roads or roads with landscaping were selected. For streetscapes, linear, one-way recordings of environmental sounds were made along the survey routes. Specific survey routes are shown in Figure 2.
Audio recordings were made using a Huawei Nova 8 Pro smartphone (Huawei Technologies Co., Ltd., Shenzhen, China), which supports high-fidelity stereo recording at 48 kHz and 24bit resolution. Recordings were taken at a height of approximately 1.5 m to approximate ear level and were conducted at representative locations within each type of green space. All recordings were made under comparable weather and traffic conditions to ensure consistency. Post processing was carried out in Adobe Audition 2020 to normalize sound levels, remove handling noise, and maintain consistent playback volume across all stimuli.
Recordings revealed distinct differences in soundscape composition across the three categories of green spaces. In parks, the soundscape was dominated by a rich variety of natural sounds, including birdsong and rustling leaves, forming a natural acoustic baseline with relatively low anthropogenic noise. In residential areas, the soundscape was characterized by a simpler acoustic profile, where occasional natural sounds (e.g., isolated birdsong) were interspersed with moderate levels of human activity, such as casual conversations and slow-moving vehicles. In streets, the soundscape was dominated by mechanical sounds, particularly continuous traffic noise (engine sounds, tire friction, and occasional horns), forming a high-noise, low-naturalness acoustic baseline. Based on this analysis, the recordings were edited to create 120-s soundscape samples with loudness levels between 40 and 60 dB. The final experimental soundscapes consisted of park soundscapes (100% natural sounds, 63% human-made sounds, and 15% mechanical sounds), residential soundscapes (100% single-type natural sounds, 27% human-made sounds, and 21% mechanical sounds), and street soundscapes (0% natural sounds, 19% human-made sounds, and 100% mechanical sounds, predominantly traffic noise) (Table 1).

2.3.2. Visual and Audio-Visual Combination Materials

Visual materials were obtained by photographing green spaces along the soundwalk routes. Photos were taken between 9:00 AM and 6:00 PM under sufficient daylight conditions. Camera height and angles were consistent with the natural line of sight to accurately capture realistic landscape features. A total of 375 photos were taken, and 18 were randomly selected after removing duplicates, low-quality images, and overly similar photos. Specifically, six photos were randomly selected for each group (park, residential, and street) with a total of 18 photos. Similar studies often adopt 4–7 stimuli per category, which allows robust within-subject comparisons without overburdening participants [25,26].
To ensure audio-visual congruence, the selected photos were paired with their corresponding soundscapes, forming 18 audio-visual combinations. Control groups featuring soundscapes without visuals were also included. A simulation of the materials is available online at https://space.bilibili.com/381480223/video (accessed on 3 September 2025).
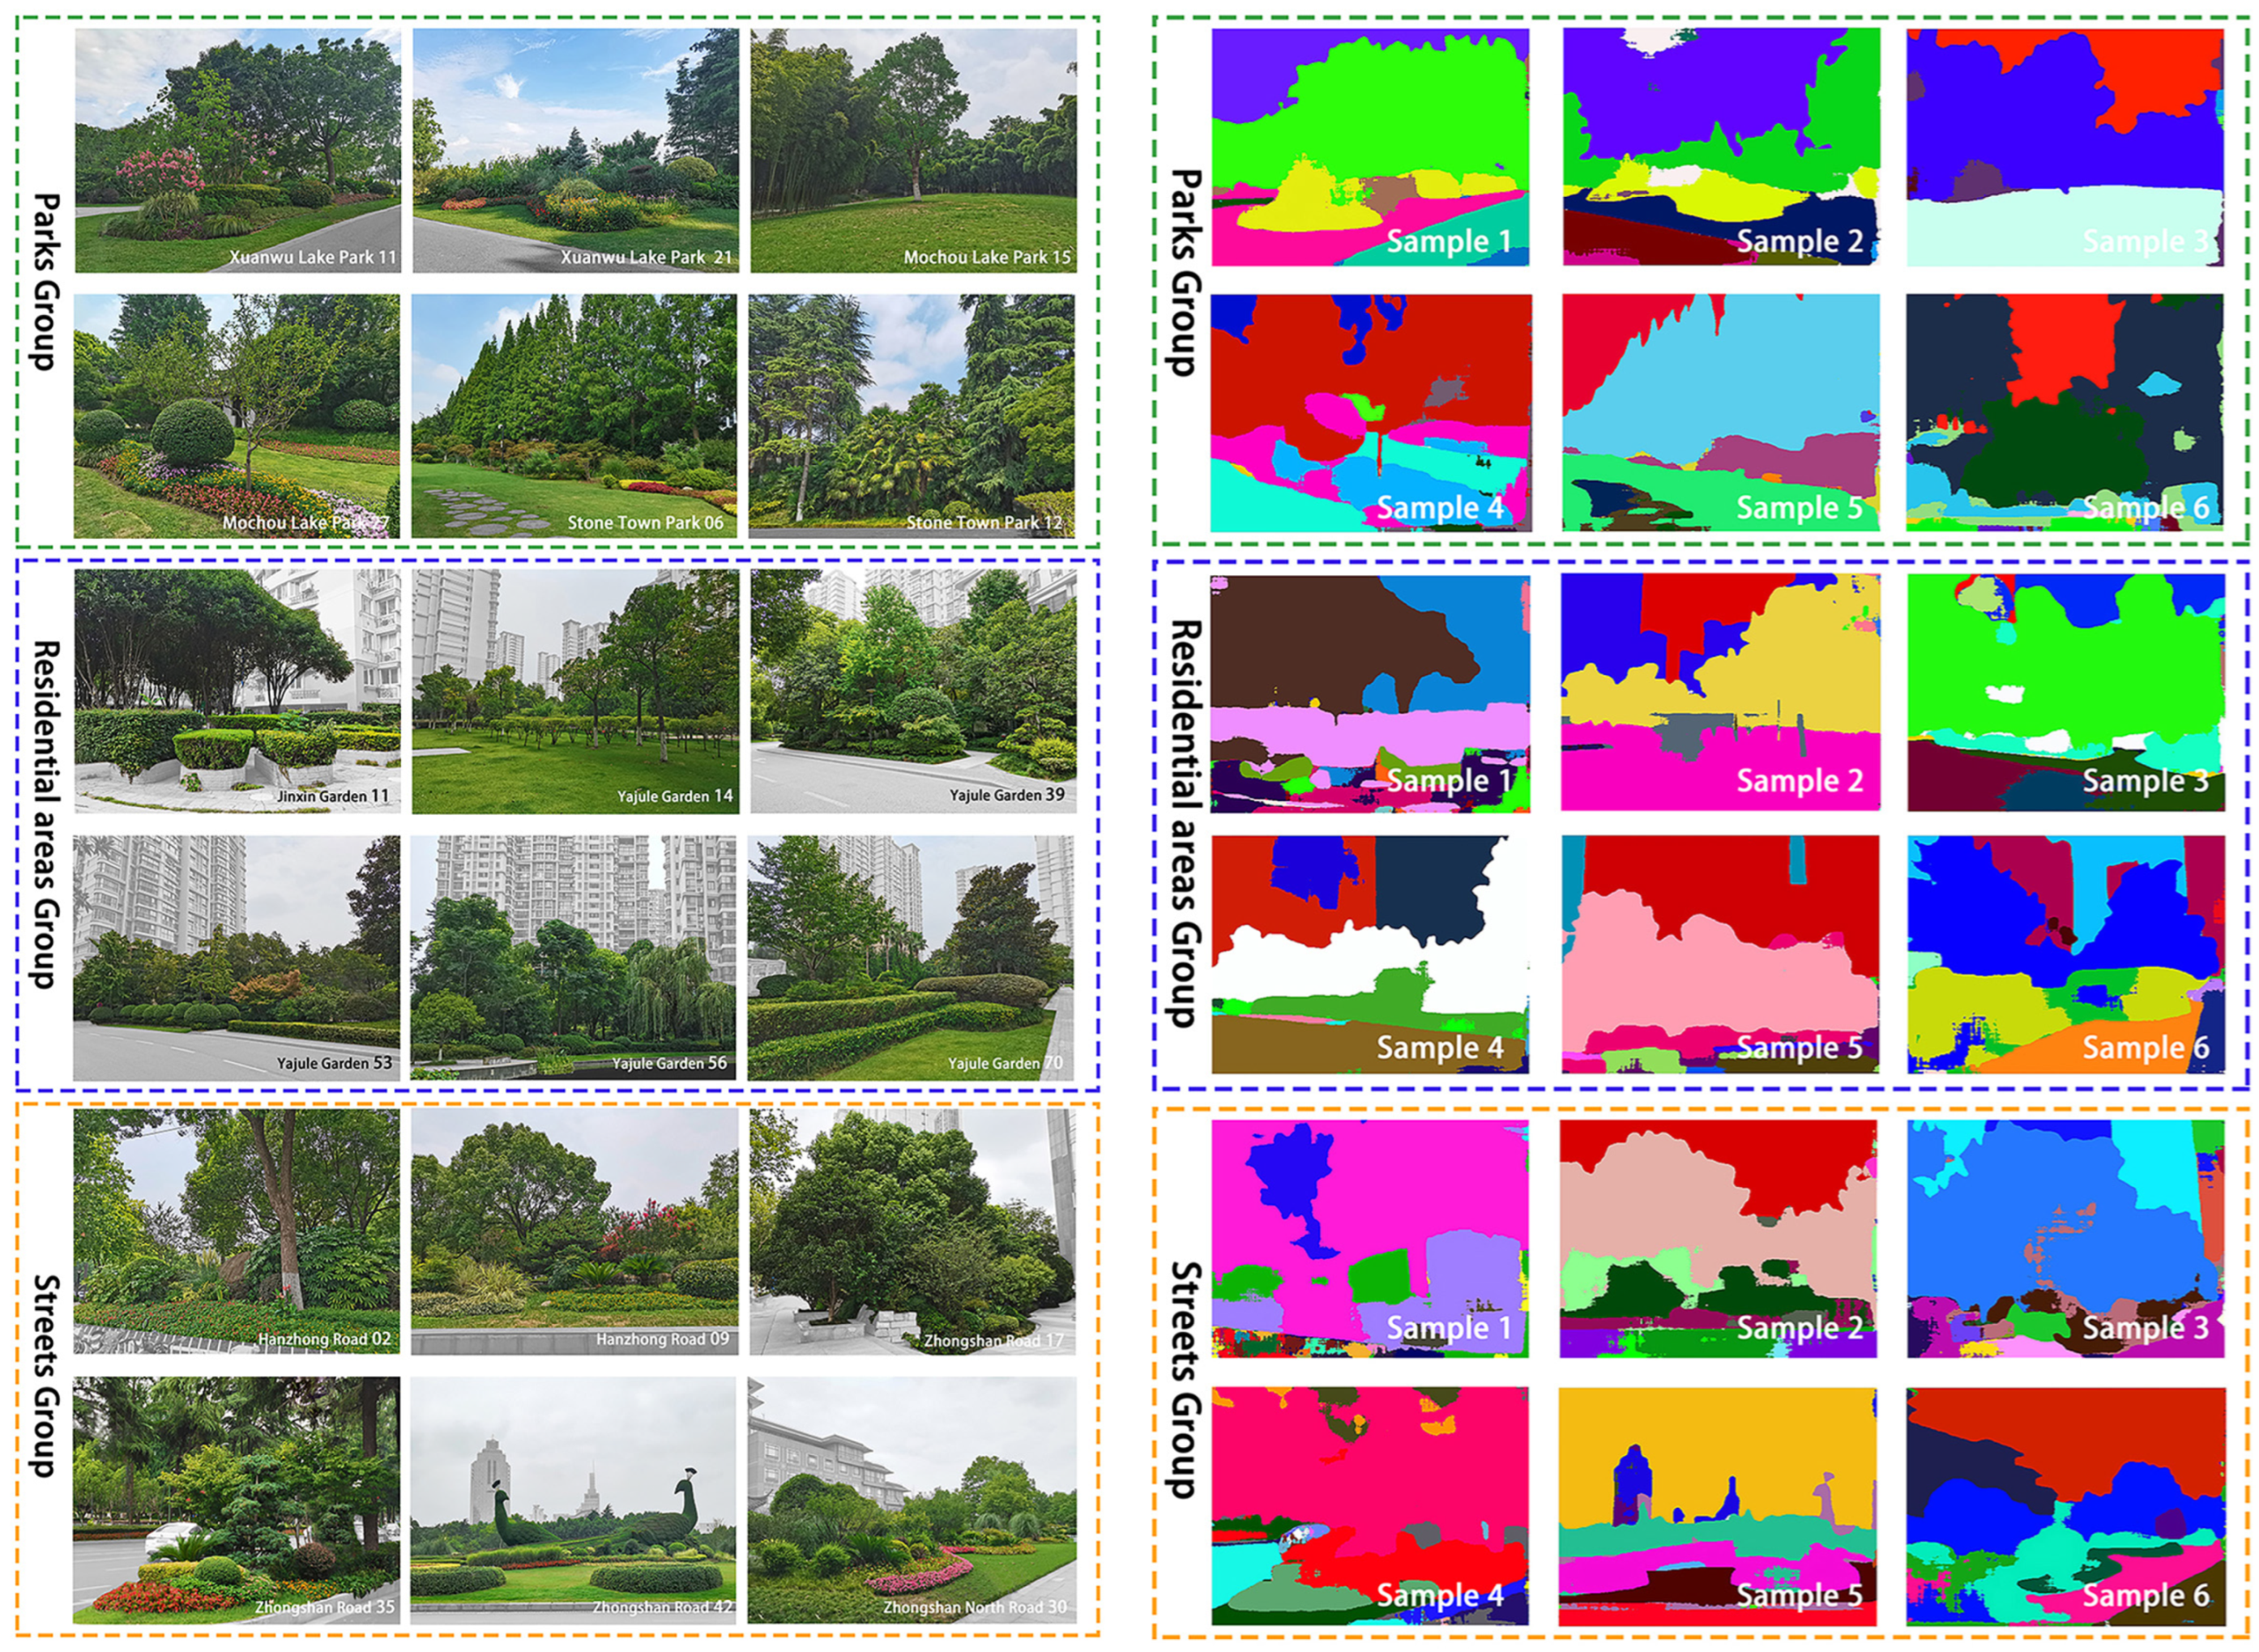
Semantic segmentation analysis, based on convolutional neural networks (CNN), was used to quantify landscape elements in the images [27]. This method classified each pixel into corresponding landscape categories, providing objective quantification of visual characteristics (Figure 3). Semantic segmentation analysis quantified the proportion of key visual elements (sky, tree canopy, grass, road surface, building façade, wall) for each image. On average, park samples were dominated by vegetation, with 47.53% tree canopy, 13.24% grass, and 15.33% sky. Residential samples had minimal sky (0.03%) and grass (0.22%) but exhibited the highest building proportion (18.62%) and 3.40% walls, indicating a more enclosed setting. Street samples displayed 56.27% tree canopy and 8.02% sky, but almost no grass (0.22%), reflecting tree-lined streets with limited ground-level greenery.

2.4. Evaluation Methodology and Instruments

2.4.1. Evaluation Method

This study adopted an indoor evaluation method. While field evaluations are more direct and realistic [28], the use of photographs or slides as proxies for real landscapes has been validated as effective [29]. Photographs offer advantages in terms of convenience, efficiency, and consistency, and their use in landscape perception studies is well-documented [30,31,32,33,34].

2.4.2. Evaluation Scale

The Self-Rating Restoration Scale (SRRS) was employed in this study. Although the Perceived Restorative Scale (PRS) is widely used, its focus on a single theoretical dimension and its technical terminology may limit comprehensiveness and accessibility [35]. By contrast, SRRS integrates attention restoration theory (ART; Kaplan & Kaplan, 1989) and stress reduction theory (SRT; Ulrich, 1983), offering a more holistic evaluation framework. ART emphasizes cognitive recovery, particularly the restoration of directed attention, while SRT focuses on emotional and physiological responses.
SRRS evaluates four dimensions—emotional, physiological, cognitive, and behavioral—ensuring comprehensive coverage. It is concise, clear, and has demonstrated strong reliability and validity [36]. SRRS is widely used in environmental psychology research to assess psychological restoration and stress relief across different environments [37,38,39].

2.5. Experimental Procedure

The experiment was conducted in a controlled classroom environment to minimize external disturbances. Previous research has demonstrated the validity of conducting experiments in indoor settings, supporting the appropriateness of the current experimental environment [40,41,42]. Participants evaluated three types of green spaces (parks, residential areas, and streetscapes) in that order. For each green space type, participants first rated soundscapes alone and then rated audio-visual combinations. All ratings were completed using computers.
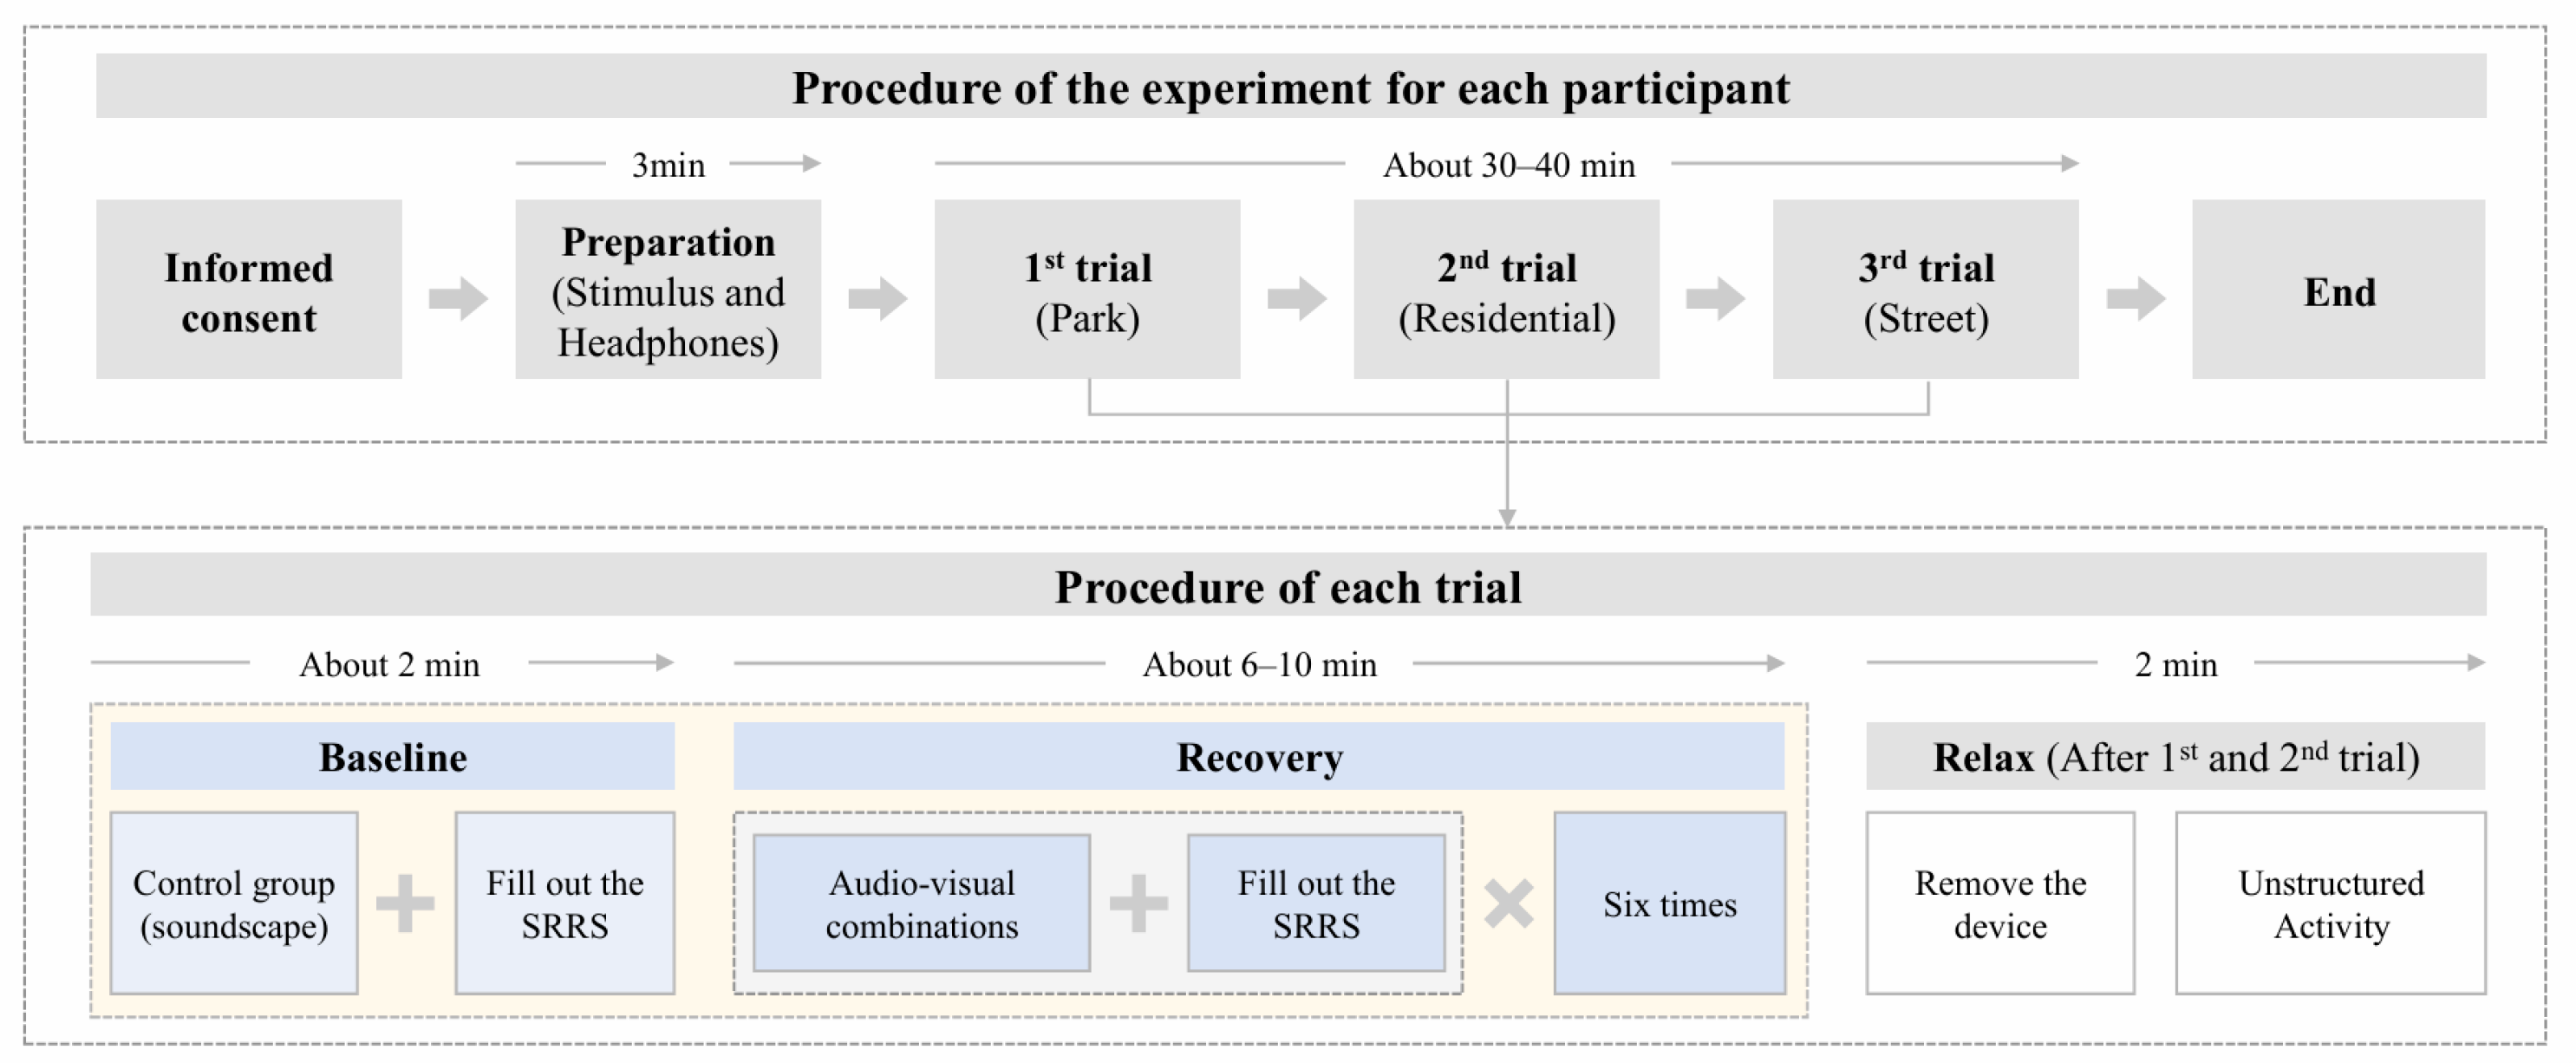
Before the experiment, participants underwent a 3-min calming period to prepare. Instructions about the study objectives, SRRS, and rating procedures were provided. Participants listened to soundscapes through headphones and completed SRRS ratings. They then viewed six photos paired with the corresponding soundscape and rated each audio-visual combination. Photos were presented sequentially on computer and tablet screens to facilitate detailed observation. Soundscapes were continuously played during the evaluation to ensure consistency. All trials lasted 30–40 min per participant (Figure 4). Equipment included Huawei AM115 headphones (Huawei Technologies Co., Ltd., Shenzhen, China), Huawei M5 tablets (Huawei Technologies Co., Ltd., Shenzhen, China), and Dell G15 laptops (Dell Inc., Round Rock, TX, USA).

2.6. Statistical Analysis

A two-way repeated measures ANOVA was employed to examine the main and interaction effects of noise level (Park, Residential, Street) and modality (Auditory, Auditory-Visual) on restorative effects. Mauchly’s test of sphericity was performed to assess whether the assumption of sphericity was met for the main effects and interaction terms. For cases where this assumption was satisfied, unadjusted degrees of freedom were used. Planned contrast analyses were conducted to directly test the hypothesis that the restorative benefits of auditory-visual integration increase as noise levels rise, with weights assigned to reflect this hypothesized trend across conditions.
To investigate the contribution of specific visual stimuli within the street condition, a one-way repeated measures ANOVA was performed with visual stimulus type (six stimuli and a sound-only control) as the factor. Where Mauchly’s test indicated a violation of sphericity, Greenhouse-Geisser corrections were applied. Post hoc pairwise comparisons, adjusted using the Holm correction, were conducted to identify significant differences between visual stimuli and sound-only control. These analyses aimed to determine whether specific visual stimuli within a challenging auditory environment could enhance restorative effects.

3. Results

3.1. The Role of Noise Levels and Modality in Restorative Effects

A two-way repeated measures ANOVA was conducted to examine how noise levels and modality affected restorative effects. Mauchly’s test of sphericity showed that the assumption of sphericity was met for both the main effect of noise level (W = 0.914, χ2(2) = 2.69, p = 0.261) and the interaction between noise level and modality (W = 0.910, χ2(2) = 2.82, p = 0.244). This allowed for unadjusted degrees of freedom in the repeated measures ANOVA. Figure 5 illustrates the mean restorative effect scores (±95% confidence intervals) for each noise level (Park, Residential, Street) and modality (Auditory vs. Auditory-Visual).
The analysis revealed significant main effects of noise level (F(2,62) = 40.23, p < 0.001, η2 = 0.565) and modality (F(1,31) = 85.39, p < 0.001, η2 = 0.734). Restorative effects were strongly influenced by the environmental context, highlighting the critical role of noise in shaping psychological recovery. Additionally, auditory-visual environments consistently outperformed auditory-only environments across all noise levels, emphasizing the robust advantage of multi-sensory integration in producing the restorative effects.
The interaction between noise level and modality was significant (F(2,62) = 11.03, p < 0.001, η2 = 0.262), underscoring that the impact of adding visual elements depends on the noise level. A planned contrast was performed to directly test the hypothesis that the restorative advantage of auditory-visual elements increases with noise level. The weights assigned were −1, −2, −3 for auditory-only conditions across Park, Residential, and Street settings, and +1, +2, +3 for the corresponding auditory-visual conditions. The planned contrast confirmed a significant and meaningful pattern (t(31) = 9.87, p < 0.001), with a mean difference of 8.59 (95% CI [6.82, 10.37]) and a large effect size, Cohen’s d = 6.95 (95% CI [4.65, 9.26]), confirming that the restorative benefits of auditory-visual integration are most pronounced in noisier settings. This result supports the idea that visual elements play a compensatory role in suboptimal auditory environments.

3.2. Follow-Up Analysis: Effects of Visual Stimuli in the Street Condition

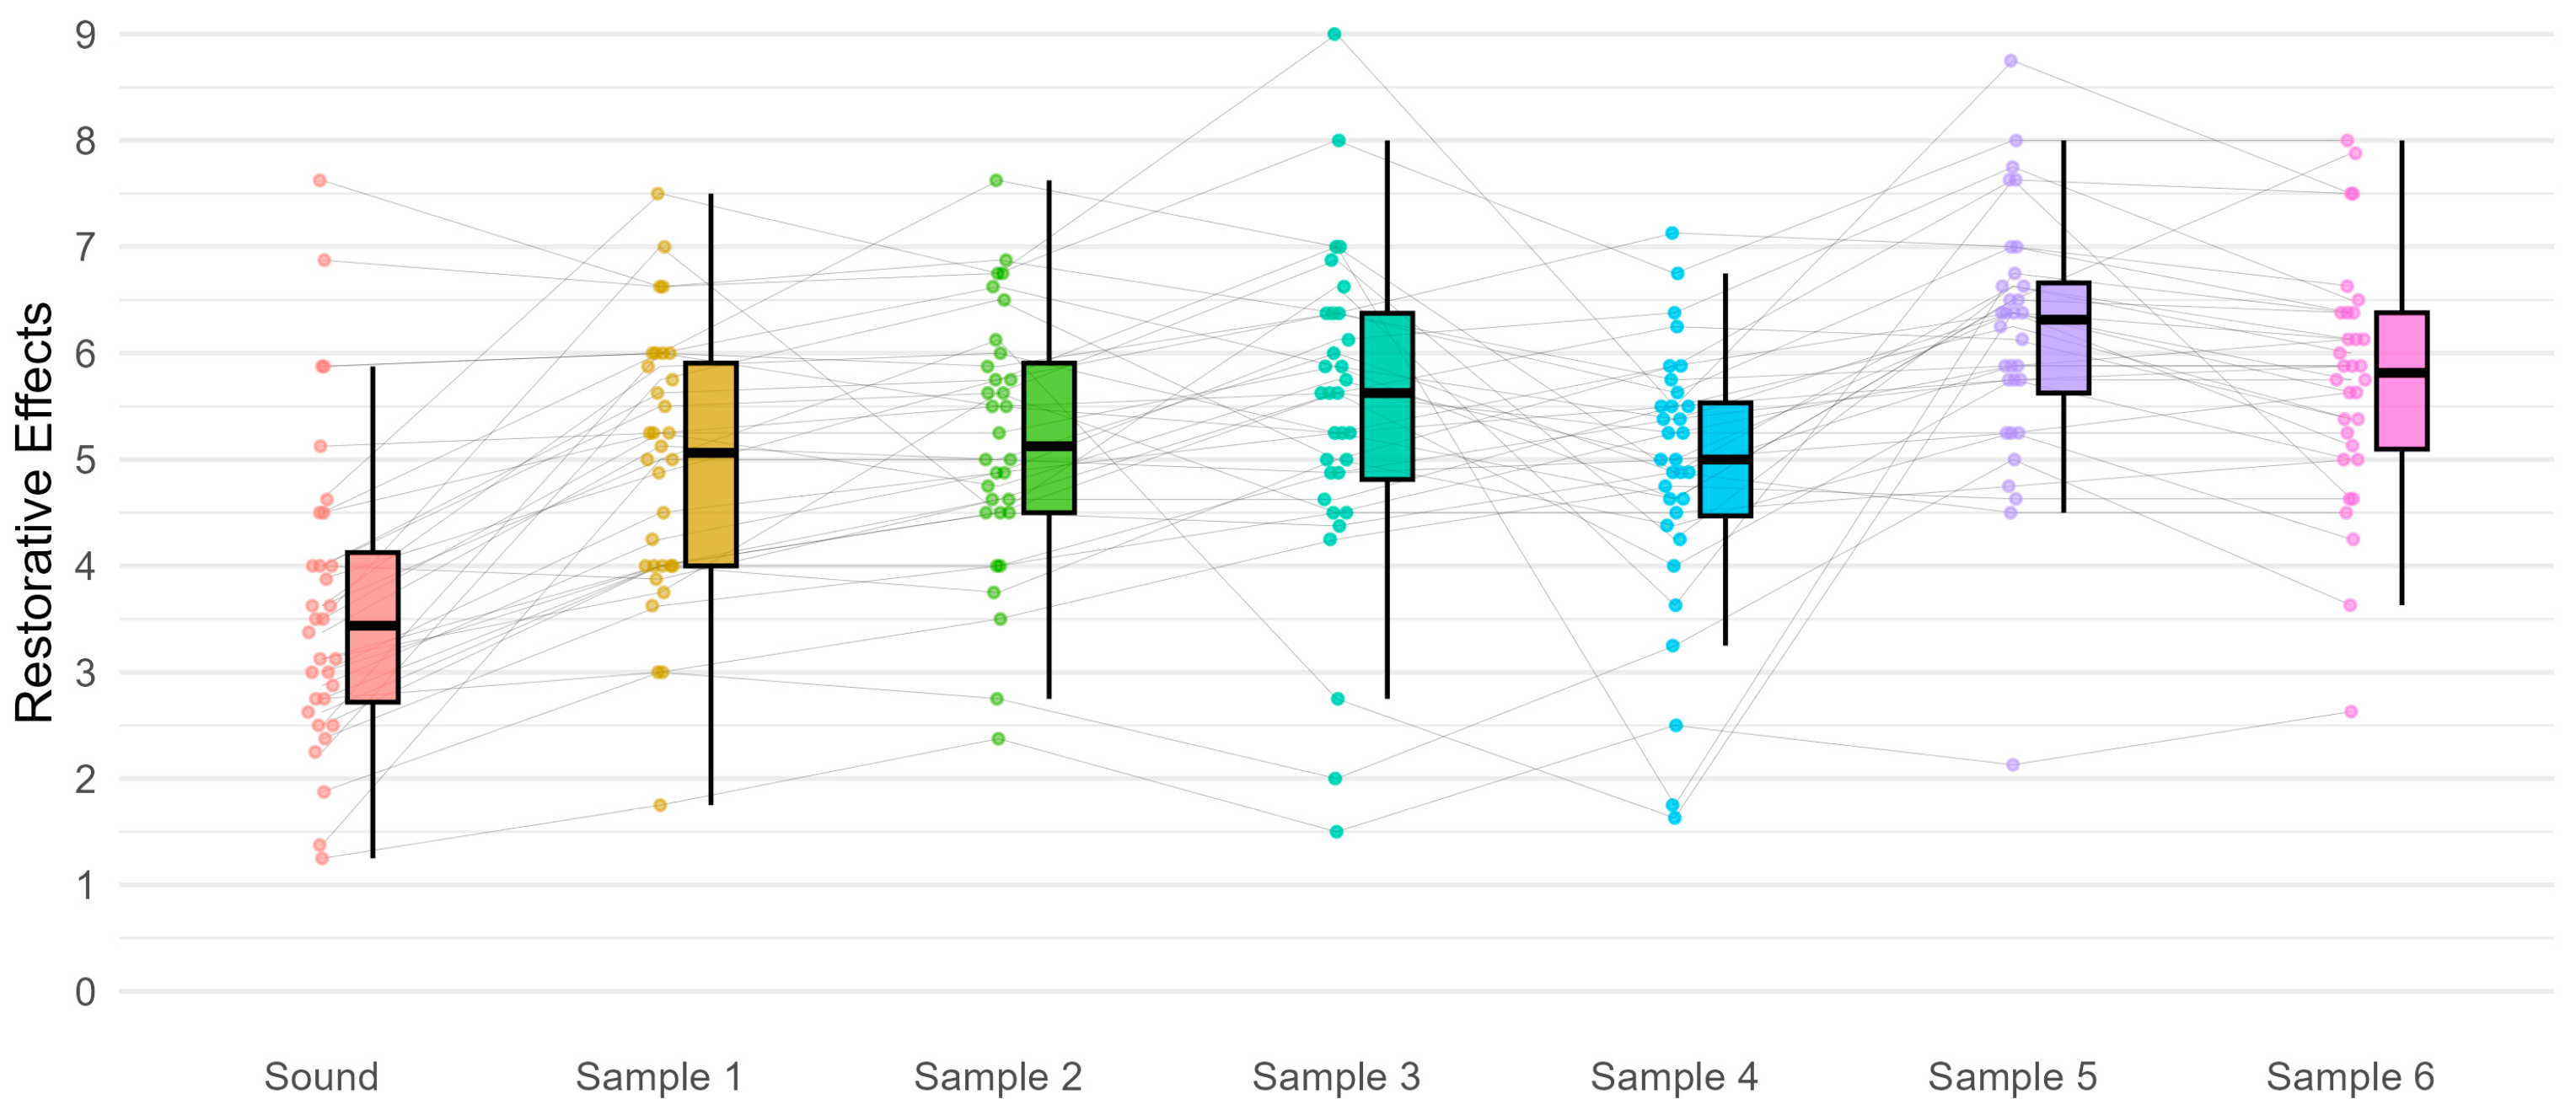
To further investigate the restorative potential of the six visual stimuli within the Street condition, a one-way repeated measures ANOVA was conducted. Mauchly’s test indicated a violation of the sphericity assumption (W = 0.118, χ2 (20) = 61.54, p < 0.001), and Greenhouse-Geisser corrections were applied. The analysis revealed a significant main effect of visual stimulus type, F (3.74, 115.78) = 29.93, p < 0.001, η2 = 0.49.
Post hoc pairwise comparisons using the Holm correction showed that all 6 samples in street condition demonstrated significant restorative effects, as evident by significantly higher scores compared to the sound condition (p < 0.001). Meanwhile, Sample 5 exhibited the strongest restorative potential. For detailed pairwise comparisons and descriptive statistics, refer to Figure 6 and Table 2.
Based on the semantic segmentation results, Sample 5 demonstrates notable structural characteristics. The sky region constitutes 50.48% of the scene, suggesting a highly open and unobstructed view. Vegetation related categories (trees 13.32%, plants 11.81%, and grass 8.27%) collectively exceed one-third of the total area, indicating substantial yet balanced natural coverage. At the same time, the proportions of roads (8.06%) and buildings (3.17%) are relatively low, pointing to a simple and sparsely built street environment. Furthermore, the unknown category accounts for only 3.54%, implying relatively high semantic labeling certainty. Taken together, these features may contribute to lower scene complexity and reduced occlusion, which could partly explain why Sample 5 exhibits comparatively better restoration performance (Table A2).

4. Discussion

4.1. Overall Effects of Audiovisual Interaction

This study aims to investigate the mechanism by which audio-visual interaction influences environmental restoration across different soundscape types (Park, Residential, Street) and to evaluate the compensatory effects of positive visual stimuli in low-quality soundscape environments. Through two core analyses, this study revealed the overall enhancement of restoration effects by audio-visual interaction and highlighted the unique role of visual elements in optimizing restorative outcomes in noisy environments, which is largely consistent with previous research findings. For example, studies have shown that increasing visibility of vegetation and reducing visual enclosure can enhance perceived restorativeness even under traffic noise conditions [43,44]. These findings not only expand the theoretical basis of research on audio-visual landscapes but also provide new insights for designing urban green spaces.
The results of this study clearly demonstrate that the restorative effects of audio-visual interaction are significantly greater than those of soundscape-only conditions. Specifically, the addition of positive visual stimuli significantly enhanced restoration across all three soundscape types: parks, residential areas, and streets. This finding aligns with existing research on multisensory interaction, emphasizing that visual and auditory modalities do not function independently but interact in complex ways to enhance overall environmental perception and psychological restoration [45,46,47,48] further supports this by highlighting that using audio-visual stimuli avoids misleading conclusions regarding sensory interactions, providing a solid theoretical foundation for this study.

4.2. Compensatory Role of Visual Elements Across Soundscapes

The findings revealed significant differences in the effects of audio-visual interaction across soundscape types. In park soundscapes, the diversity of natural sounds provided a stable foundation for restoration. In residential soundscapes, the singular natural sound was effectively supplemented by visual elements. In street soundscapes dominated by mechanical noise, the compensatory role of visual stimuli was most pronounced. These results align with the preference for natural sounds proposed by Irvine et al. (2009) and Payne (2013) [6,7] and further illustrate that in low-quality soundscapes, optimized visual landscapes can significantly enhance environmental restoration.
The superior restorative effects of Sample 5 in street soundscapes suggest that visual cleanliness and structural clarity are critical factors influencing restoration. This finding extends the applicability of Kaplan & Kaplan’s (1989) theory on the importance of visual order and supports Ulrich’s (1983) stress recovery theory, which posits that orderly and clean visual features reduce psychological stress and enhance restoration. While consistent with existing studies, this research also provides significant extensions. Previous research primarily focused on the impact of optimizing soundscapes on restoration [4,49] or examined audio-visual interaction in small-scale environments [5,50]. This study extends the analysis to large urban spaces and includes comparisons of three typical soundscape types. The results confirm the universal role of visual elements in diverse environments and emphasize their compensatory effects in low-quality soundscapes. This finding provides theoretical support for multisensory optimization in urban green space design.

4.3. Limitations

This study has several limitations that should be noted. The participants were 32 university students, most of whom had backgrounds in landscape architecture or environmental design. The use of a relatively homogeneous sample reduced variability and enhanced internal validity. Prior research has indicated that student preferences are broadly comparable to those of the general population. Nevertheless, this sampling strategy may restrict the generalizability of the findings to other age groups, professional populations, or cultural contexts.
Although each trial lasted 8–12 min and was followed by a two-minute rest period, the fixed order of presentation and the total session duration of 30–40 min may still have introduced order effects or slight cumulative fatigue that could have affected rating stability.
The visual analysis was based on CNN-based semantic segmentation to quantify major landscape components. This ensured objectivity in stimulus description but was exploratory in nature and not designed to model predictive links between visual attributes and restorative outcomes.
Finally, the study was conducted in a controlled indoor setting with short-term exposure. While laboratory experiments offer consistency and methodological control, they cannot fully reflect the multisensory complexity of outdoor environments, where thermal comfort, air quality, and pedestrian density may also affect psychological restoration.

4.4. Future Research

Future research should address the present limitations in several ways. A broader and more diverse participant pool is needed, including individuals from different age groups, occupations, and cultural contexts. Cross-regional or cross-cultural studies would be particularly valuable for testing the universality of audiovisual interaction effects. In terms of methodology, future experiments could randomize or counterbalance the order of stimulus presentation. Moreover, objective physiological measures, such as eye-tracking metrics or heart rate variability, could be incorporated to better control for order effects and sustain participant attention.
Another important direction is to conduct a more detailed examination of the visual environment. Applying computational techniques to extract features such as image complexity, color saturation, spatial order, and fractal dimensions would allow for a finer grained understanding of how specific visual attributes interact with soundscape quality to shape restorative outcomes. Such analyses could provide more targeted and actionable recommendations for urban green space design, particularly in noise-dominated settings.
It would also be valuable to explore these effects over longer time scales. Longitudinal studies could assess whether the restorative benefits of audiovisual interaction persist and whether they have cumulative effects on stress reduction, cognitive performance, and emotional well-being. Field experiments conducted in real urban contexts would complement the findings of laboratory studies. They would also help identify how contextual variables, such as pedestrian density, visual clutter, and atmospheric conditions, influence multisensory perception.
Finally, future research could aim to develop a more integrated theoretical framework by linking Attention Restoration Theory and Stress Reduction Theory within a single conceptual model. Multivariate approaches such as structural equation modeling could be used to test the direct and indirect pathways between soundscape quality, visual characteristics, attention recovery, and stress outcomes. Establishing such a model would enhance the theoretical contribution of this line of research and support its application in environmental psychology and urban design.

5. Conclusions

The findings of this study offer new insights into both the theoretical and practical dimensions of audio-visual landscapes. First, the results highlight the universal restorative benefits of audio-visual interaction, particularly in low-quality soundscapes such as streets, where positive visual stimuli effectively compensate for auditory deficiencies. Second, the study provides valuable guidance for optimizing urban green space design, recommending that designers prioritize visual features (e.g., cleanliness and structural clarity) in environments where soundscape quality is difficult to improve. Lastly, as the impact of urban environments on human health increases, this study provides theoretical support and practical guidance for designing multisensory urban green spaces to enhance restoration and well-being. These findings contribute to the broader discourse on sustainable urban development, supporting the creation of cities that promote human health, psychological well-being, and environmental resilience. Nevertheless, due to the fixed experimental sequence employed, potential sequence effects may have influenced the results, necessitating further investigation in future studies. Future research should not only expand the diversity of participant samples and environmental contexts but also explore the long-term and cross-cultural implications of audio-visual interactions to more comprehensively inform urban restorative strategies.

Author Contributions

Conceptualization, H.Z.; methodology, H.Z.; validation, H.Z.; formal analysis, H.Z. and D.-W.Z.; investigation, H.Z.; data curation, H.Z. and D.-W.Z.; writing—original draft preparation, H.Z. and D.-W.Z.; writing—review and editing, H.Z., D.-W.Z. and Z.Z.; visualization, H.Z.; supervision, Z.Z.; project administration, Z.Z.; funding acquisition, Z.Z. All authors have read and agreed to the published version of the manuscript.

Funding

This research was funded by the National Natural Science Foundation of China (31770752).

Institutional Review Board Statement

The study was conducted in accordance with the Declaration of Helsinki and approved by the Academic Committee of College of Art & Design in Nanjing Forestry University (protocol code NJFU-CAD-20220910 and 10 September 2022 of approval).

Informed Consent Statement

Informed consent was obtained from all subjects involved in the study.

Data Availability Statement

The original contributions presented in this study are included in the article. Further inquiries can be directed to the corresponding author.

Acknowledgments

The authors have reviewed and edited the output and take full responsibility for the content of this publication.

Conflicts of Interest

The authors declare no conflicts of interest.

Appendix A

Appendix A.1

Table A1. Sample Site Information.
Type of Green SpaceNo.Name of Sample SiteDistrict
Park Green Space01Xuanwu Lake ParkXuanwu District
02Stone Town ParkGulou District
03Little Peach GardenGulou District
04Gulin ParkGulou District
05Wulongtan ParkGulou District
06Bailuzhou ParkQinhuai District
07Yueya Lake ParkQinhuai District
08Wudingmen ParkQinhuai District
09Mochou Lake ParkJianye District
10Nanhu ParkJianye District
Residential Green Space01Suojin Village
(Second Village, Fourth Village)
Xuanwu District
02Fenghuang VillaXuanwu District
03Jinxin GardenGulou District
04Huilin Oasis Guanglin GardenGulou District
05Qingjiang GardenGulou District
06Yajule GardenQinhuai District
07Langshi XiyuanQinhuai District
08Zhongshan East Road CommunityQinhuai District
09Xingyu HuafuJianye District
10Ankang CommunityJianye District
Street Green Space01Zhongshan RoadXuanwu District
02Beijing East RoadXuanwu District
03Zhujiang RoadXuanwu District
04Zhongshan North RoadGulou District
05Beijing West RoadGulou District
06Hanzhong RoadQinhuai District
07Zhongshan South RoadQinhuai District
08Central RoadBetween Xuanwu and Gulou Districts
09Zhongshan East RoadBetween Xuanwu and Qinhuai Districts
10Hanzhongmen StreetBetween Gulou and Jianye Districts

Appendix A.2

Table A2. Street group image semantic segmentation results.
FilenameUnknownWallBuildingSkyFloorTreeRoadGrassSidewalkPerson
Sample17.64%0.43%0.96%8.02%0.01%56.27%0.00%0.22%0.00%0.00%
Sample26.50%5.45%0.00%21.96%0.00%40.80%0.01%4.86%0.00%0.00%
Sample35.39%3.33%2.61%11.90%0.64%55.16%0.00%0.36%6.64%0.11%
Sample43.04%2.33%0.00%1.57%0.00%56.15%4.52%5.86%1.84%0.00%
Sample53.54%0.08%3.17%50.48%0.00%13.32%8.06%8.27%0.00%0.00%
Sample64.47%0.00%10.06%32.93%0.00%21.38%0.02%9.38%5.89%0.00%
FilenameGroundTablePlantChairCarCouchHouseMirrorFieldFence
Sample10.67%0.17%20.69%0.83%0.00%0.00%0.81%0.00%0.00%0.78%
Sample20.00%0.00%11.91%0.00%0.00%0.00%0.00%0.00%0.00%0.82%
Sample31.54%0.00%6.05%0.00%0.00%0.00%0.00%0.23%0.00%0.00%
Sample40.00%0.00%14.94%0.00%0.14%0.18%0.06%0.00%0.00%0.04%
Sample50.00%0.00%11.81%0.00%0.00%0.00%0.01%0.00%0.00%0.00%
Sample60.00%0.00%11.92%0.00%0.00%0.00%0.00%0.00%0.01%0.00%
FilenameRockRailroadBaseColumnSandSkyscraperPathStairsFlowerPalm
Sample10.00%0.43%0.17%0.00%0.00%0.00%0.02%0.10%0.88%0.10%
Sample20.00%0.00%0.00%0.39%0.00%0.00%5.54%0.00%1.42%0.24%
Sample30.00%0.00%0.00%0.04%0.03%0.00%1.99%0.00%0.00%0.00%
Sample40.34%0.00%0.00%0.00%0.00%0.00%0.05%0.00%5.85%2.62%
Sample50.00%0.00%0.00%0.00%0.00%0.12%0.00%0.00%0.34%0.06%
Sample60.00%0.00%0.00%0.00%0.00%0.00%0.03%0.00%2.82%1.02%
FilenameTowersAwningsStreetlightsPolesRailingsFountainsAwningsStepsPlantersSculptures
Sample10.00%0.00%0.00%0.02%0.08%0.00%0.00%0.00%0.00%0.00%
Sample20.01%0.00%0.00%0.07%0.00%0.00%0.00%0.00%0.00%0.00%
Sample32.78%0.00%0.00%0.04%0.00%0.78%0.08%0.16%0.04%0.01%
Sample40.00%0.00%0.00%0.00%0.04%0.39%0.00%0.02%0.00%0.04%
Sample50.73%0.00%0.00%0.00%0.00%0.00%0.00%0.00%0.00%0.00%
Sample60.00%0.01%0.01%0.05%0.00%0.00%0.00%0.00%0.00%0.00%

References

  1. Southworth, M. The Sonic Environment of Cities. Environ. Behav. 1969, 1, 49–70. [Google Scholar] [CrossRef]
  2. Carles, J.L.; Barrio, I.L.; de Lucio, J.V. Sound Influence on Landscape Values. Landsc. Urban Plan. 1999, 43, 191–200. [Google Scholar] [CrossRef]
  3. Torresin, S.; Pernigotto, G.; Cappelletti, F.; Gasparella, A. Combined Effects of Environmental Factors on Human Perception and Objective Performance: A Review of Experimental Laboratory Works. Indoor Air 2018, 28, 525–538. [Google Scholar] [CrossRef] [PubMed]
  4. Carles, J.; Bernáldez, F.; Lucio, J.D. Audio-visual Interactions and Soundscape Preferences. Landsc. Res. 1992, 17, 52–56. [Google Scholar] [CrossRef]
  5. Hong, J.Y.; Jeon, J.Y. Designing Sound and Visual Components for Enhancement of Urban Soundscapes. J. Acoust. Soc. Am. 2013, 134, 2026–2036. [Google Scholar] [CrossRef]
  6. Irvine, K.N.; Devine-Wright, P.; Payne, S.R.; Fuller, R.A.; Painter, B.; Gaston, K.J. Green Space, Soundscape and Urban Sustainability: An Interdisciplinary, Empirical Study. Local Environ. 2009, 14, 155–172. [Google Scholar] [CrossRef]
  7. Payne, S.R. The Production of a Perceived Restorativeness Soundscape Scale. Appl. Acoust. 2013, 74, 255–263. [Google Scholar] [CrossRef]
  8. Barclay, L. Augmenting Urban Space with Environmental Soundscapes and Mobile Technologies. Acoust. Ecol. Rev. 2017, 16, 21–34. [Google Scholar] [CrossRef]
  9. Van Renterghem, T.; Vanhecke, K.; Filipan, K.; Sun, K.; De Pessemier, T.; De Coensel, B.; Joseph, W.; Botteldooren, D. Interactive Soundscape Augmentation by Natural Sounds in a Noise Polluted Urban Park. Landsc. Urban Plan. 2020, 194, 103705. [Google Scholar] [CrossRef]
  10. Cobianchi, M.; Drever, J.L.; Lavia, L. Adaptive Soundscape Design for Liveable Urban Spaces: A Hybrid Methodology across Environmental Acoustics and Sonic Art. Cities Health 2021, 5, 127–132. [Google Scholar] [CrossRef]
  11. Kaplan, R.; Kaplan, S. The Experience of Nature: A Psychological Perspective; Cambridge University Press: New York, NY, USA, 1989; pp. 7–340. ISBN 978-0-521-34139-4. [Google Scholar]
  12. Ulrich, R.S. Aesthetic and Affective Response to Natural Environment. Hum. Behav. Environ. Adv. Theory Res. 1983, 6, 85–125. [Google Scholar]
  13. Ulrich, R.S. Human Responses to Vegetation and Landscapes. Landsc. Urban Plan. 1986, 13, 29–44. [Google Scholar] [CrossRef]
  14. Van Renterghem, T. Towards Explaining the Positive Effect of Vegetation on the Perception of Environmental Noise. Urban For. Urban Green. 2019, 40, 133–144. [Google Scholar] [CrossRef]
  15. Gan, Y.; Zheng, Y.; Zhang, L. Audio-Visual Analysis of Visitors’ Landscape Preference for City Parks: A Case Study from Zhangzhou, China. Forests 2022, 13, 1376. [Google Scholar] [CrossRef]
  16. Viollon, S.; Lavandier, C.; Drake, C. Influence of Visual Setting on Sound Ratings in an Urban Environment. Appl. Acoust. 2002, 63, 493–511. [Google Scholar] [CrossRef]
  17. Graham, C.S.R. Designing Landscapes for Psychological Restoration: Adding Considerations of Sound. Master’s Thesis, University of Guelph, Guelph, ON, Canada, 2004. [Google Scholar]
  18. Xiang, Y.; Meng, Q.; Li, M.; Yang, D.; Wu, Y. Using Soundscape Diversity to Interpret Soundscape Evaluation in Urban Green Spaces—Relationship, Integration, and Application. Urban For. Urban Green. 2024, 97, 128371. [Google Scholar] [CrossRef]
  19. Stamps, A.E. Demographic Effects in Environmental Aesthetics: A Meta-Analysis. J. Plan. Lit. 1999, 14, 155–175. [Google Scholar] [CrossRef]
  20. Yao, Y.; Zhu, X.; Xu, Y.; Yang, H.; Wu, X.; Li, Y.; Zhang, Y. Assessing the Visual Quality of Green Landscaping in Rural Residential Areas: The Case of Changzhou, China. Environ. Monit. Assess. 2012, 184, 951–967. [Google Scholar] [CrossRef]
  21. Zhang, Y. The Study of Urban Space SensationBased on the SD Method. Master’s Thesis, Tongji University, Shanghai, China, 2008. (In Chinese). [Google Scholar]
  22. Faul, F.; Erdfelder, E.; Lang, A.-G.; Buchner, A. G*power 3: A Flexible Statistical Power Analysis Program for the Social, Behavioral, and Biomedical Sciences. Behav. Res. Methods 2007, 39, 175–191. [Google Scholar] [CrossRef]
  23. ISO 12913-1:2014; Acoustics—Soundscape—Part 1: Definition and Conceptual Framework. ISO: Geneva, Switzerland, 2014.
  24. ISO/TS 12913-2:2018; Acoustics—Soundscape—Part 2: Data Collection and Reporting Requirements. ISO: Geneva, Switzerland, 2018.
  25. Shibata, S.; Tokuhiro, K.; Ikeuchi, A.; Ito, M.; Kaji, H.; Muramatsu, M. Visual Properties and Perceived Restorativeness in Green Offices: A Photographic Evaluation of Office Environments with Various Degrees of Greening. Front. Psychol. 2024, 15, 1443540. [Google Scholar] [CrossRef]
  26. Kang, Y.; Kim, E.J. Differences of Restorative Effects While Viewing Urban Landscapes and Green Landscapes. Sustainability 2019, 11, 2129. [Google Scholar] [CrossRef]
  27. Yao, Y.; Liang, Z.; Yuan, Z.; Liu, P.; Bie, Y.; Zhang, J.; Wang, R.; Wang, J.; Guan, Q. A Human-Machine Adversarial Scoring Framework for Urban Perception Assessment Using Street-View Images. Int. J. Geogr. Inf. Sci. 2019, 33, 2363–2384. [Google Scholar] [CrossRef]
  28. Briggs, D.J.; France, J. France Landscape Evaluation: A Comparative Study. J. Environ. Manag. 1980, 10, 263–275. [Google Scholar]
  29. Shuttleworth, S.; Shuttleworth, S. The Use of Photographs as an Environment Presentation Medium in Landscape Studies. J. Environ. Manage 1980, 11, 61–76. [Google Scholar]
  30. Arriaza, M.; Cañas-Ortega, J.F.; Cañas-Madueño, J.A.; Ruiz-Aviles, P. Assessing the Visual Quality of Rural Landscapes. Landsc. Urban Plan. 2004, 69, 115–125. [Google Scholar] [CrossRef]
  31. Cañas, I.; Ayuga, E.; Ayuga, F. A Contribution to the Assessment of Scenic Quality of Landscapes Based on Preferences Expressed by the Public. Land Use Policy 2009, 26, 1173–1181. [Google Scholar] [CrossRef]
  32. Hartig, T.; Böök, A.; Garvill, J.; Olsson, T.; Gärling, T. Environmental Influences on Psychological Restoration. Scand. J. Psychol. 1996, 37, 378–393. [Google Scholar] [CrossRef]
  33. Pflüger, Y.; Rackham, A.; Larned, S. The Aesthetic Value of River Flows: An Assessment of Flow Preferences for Large and Small Rivers. Landsc. Urban Plan. 2010, 95, 68–78. [Google Scholar] [CrossRef]
  34. Zhao, J.; Luo, P.; Wang, R.; Cai, Y. Correlations between Aesthetic Preferences of River and Landscape Characters. J. Environ. Eng. Landsc. Manag. 2013, 21, 123–132. [Google Scholar] [CrossRef]
  35. Seamon, D. A Geography of the Lifeworld (Routledge Revivals): Movement, Rest and Encounter; Routledge: London, UK, 2015; ISBN 978-1-315-71569-8. [Google Scholar]
  36. Han, K.-T. A Reliable and Valid Self-Rating Measure of the Restorative Quality of Natural Environments. Landsc. Urban Plan. 2003, 64, 209–232. [Google Scholar] [CrossRef]
  37. Cui, W.; Li, Z.; Xuan, X.; Li, Q.; Shi, L.; Sun, X.; Zhu, K.; Shi, Y. Influence of Hospital Outdoor Rest Space on the Eye Movement Measures and Self-Rating Restoration of Staff. Front. Public Health 2022, 10, 855857. [Google Scholar] [CrossRef] [PubMed]
  38. Fei, X.; Zhang, Y.; Kong, D.; Huang, Q.; Wang, M.; Dong, J. Quantitative Model Study of the Psychological Recovery Benefit of Landscape Environment Based on Eye Movement Tracking Technology. Sustainability 2023, 15, 11250. [Google Scholar] [CrossRef]
  39. Neale, C.; Lopez, S.; Roe, J. Psychological Restoration and the Effect of People in Nature and Urban Scenes: A Laboratory Experiment. Sustainability 2021, 13, 6464. [Google Scholar] [CrossRef]
  40. Gaede, R. Validity in Image-Based Research: A Delphi Study. Ph.D. Thesis, The University of Stellenbosch, Stellenbosch, South Africa, 1 December 2004. [Google Scholar]
  41. Mostajeran, F.; Krzikawski, J.; Steinicke, F.; Kühn, S. Effects of Exposure to Immersive Videos and Photo Slideshows of Forest and Urban Environments. Sci. Rep. 2021, 11, 3994. [Google Scholar] [CrossRef]
  42. Palmer, J.F.; Hoffman, R.E. Rating Reliability and Representation Validity in Scenic Landscape Assessments. Landsc. Urban Plan. 2001, 54, 149–161. [Google Scholar] [CrossRef]
  43. Yilmaz, N.G.; Lee, P.-J.; Imran, M.; Jeong, J.-H. Role of Sounds in Perception of Enclosure in Urban Street Canyons. Sustain. Cities Soc. 2023, 90, 104394. [Google Scholar] [CrossRef]
  44. Ren, X.; Wei, P.; Wang, Q.; Sun, W.; Yuan, M.; Shao, S.; Zhu, D.; Xue, Y. The Effects of Audio-Visual Perceptual Characteristics on Environmental Health of Pedestrian Streets with Traffic Noise: A Case Study in Dalian, China. Front. Psychol. 2023, 14, 1122639. [Google Scholar] [CrossRef]
  45. Marks, L.E. On Cross-Modal Similarity: Auditory-Visual Interactions in Speeded Discrimination. J. Exp. Psychol. Hum. Percept. Perform. 1987, 13, 384–394. [Google Scholar] [CrossRef]
  46. McGurk, H.; MacDonald, J. Hearing Lips and Seeing Voices. Nature 1976, 264, 746–748. [Google Scholar] [CrossRef]
  47. Radeau, M.; Bertelson, P. Adaptation to Auditory-Visual Discordance and Ventriloquism in Semirealistic Situations. Percept. Psychophys. 1977, 22, 137–146. [Google Scholar] [CrossRef]
  48. Warren, D.H.; McCarthy, T.J.; Welch, R.B. Discrepancy and Nondiscrepancy Methods of Assessing Visual-Auditory Interaction. Percept. Psychophys. 1983, 33, 413–419. [Google Scholar] [CrossRef]
  49. De Vries, S.; Verheij, R.A.; Groenewegen, P.P.; Spreeuwenberg, P. Natural Environments—Healthy Environments? An Exploratory Analysis of the Relationship between Greenspace and Health. Environ. Plan. Econ. Space 2003, 35, 1717–1731. [Google Scholar] [CrossRef]
  50. Andringa, T.; van den Bosch, K. Core Affect and Soundscape Assessment: Fore- and Background Design for Quality of Life. In Proceedings of the Internoise 2013, Innsbruck, Austria, 15–18 September 2013. [Google Scholar]
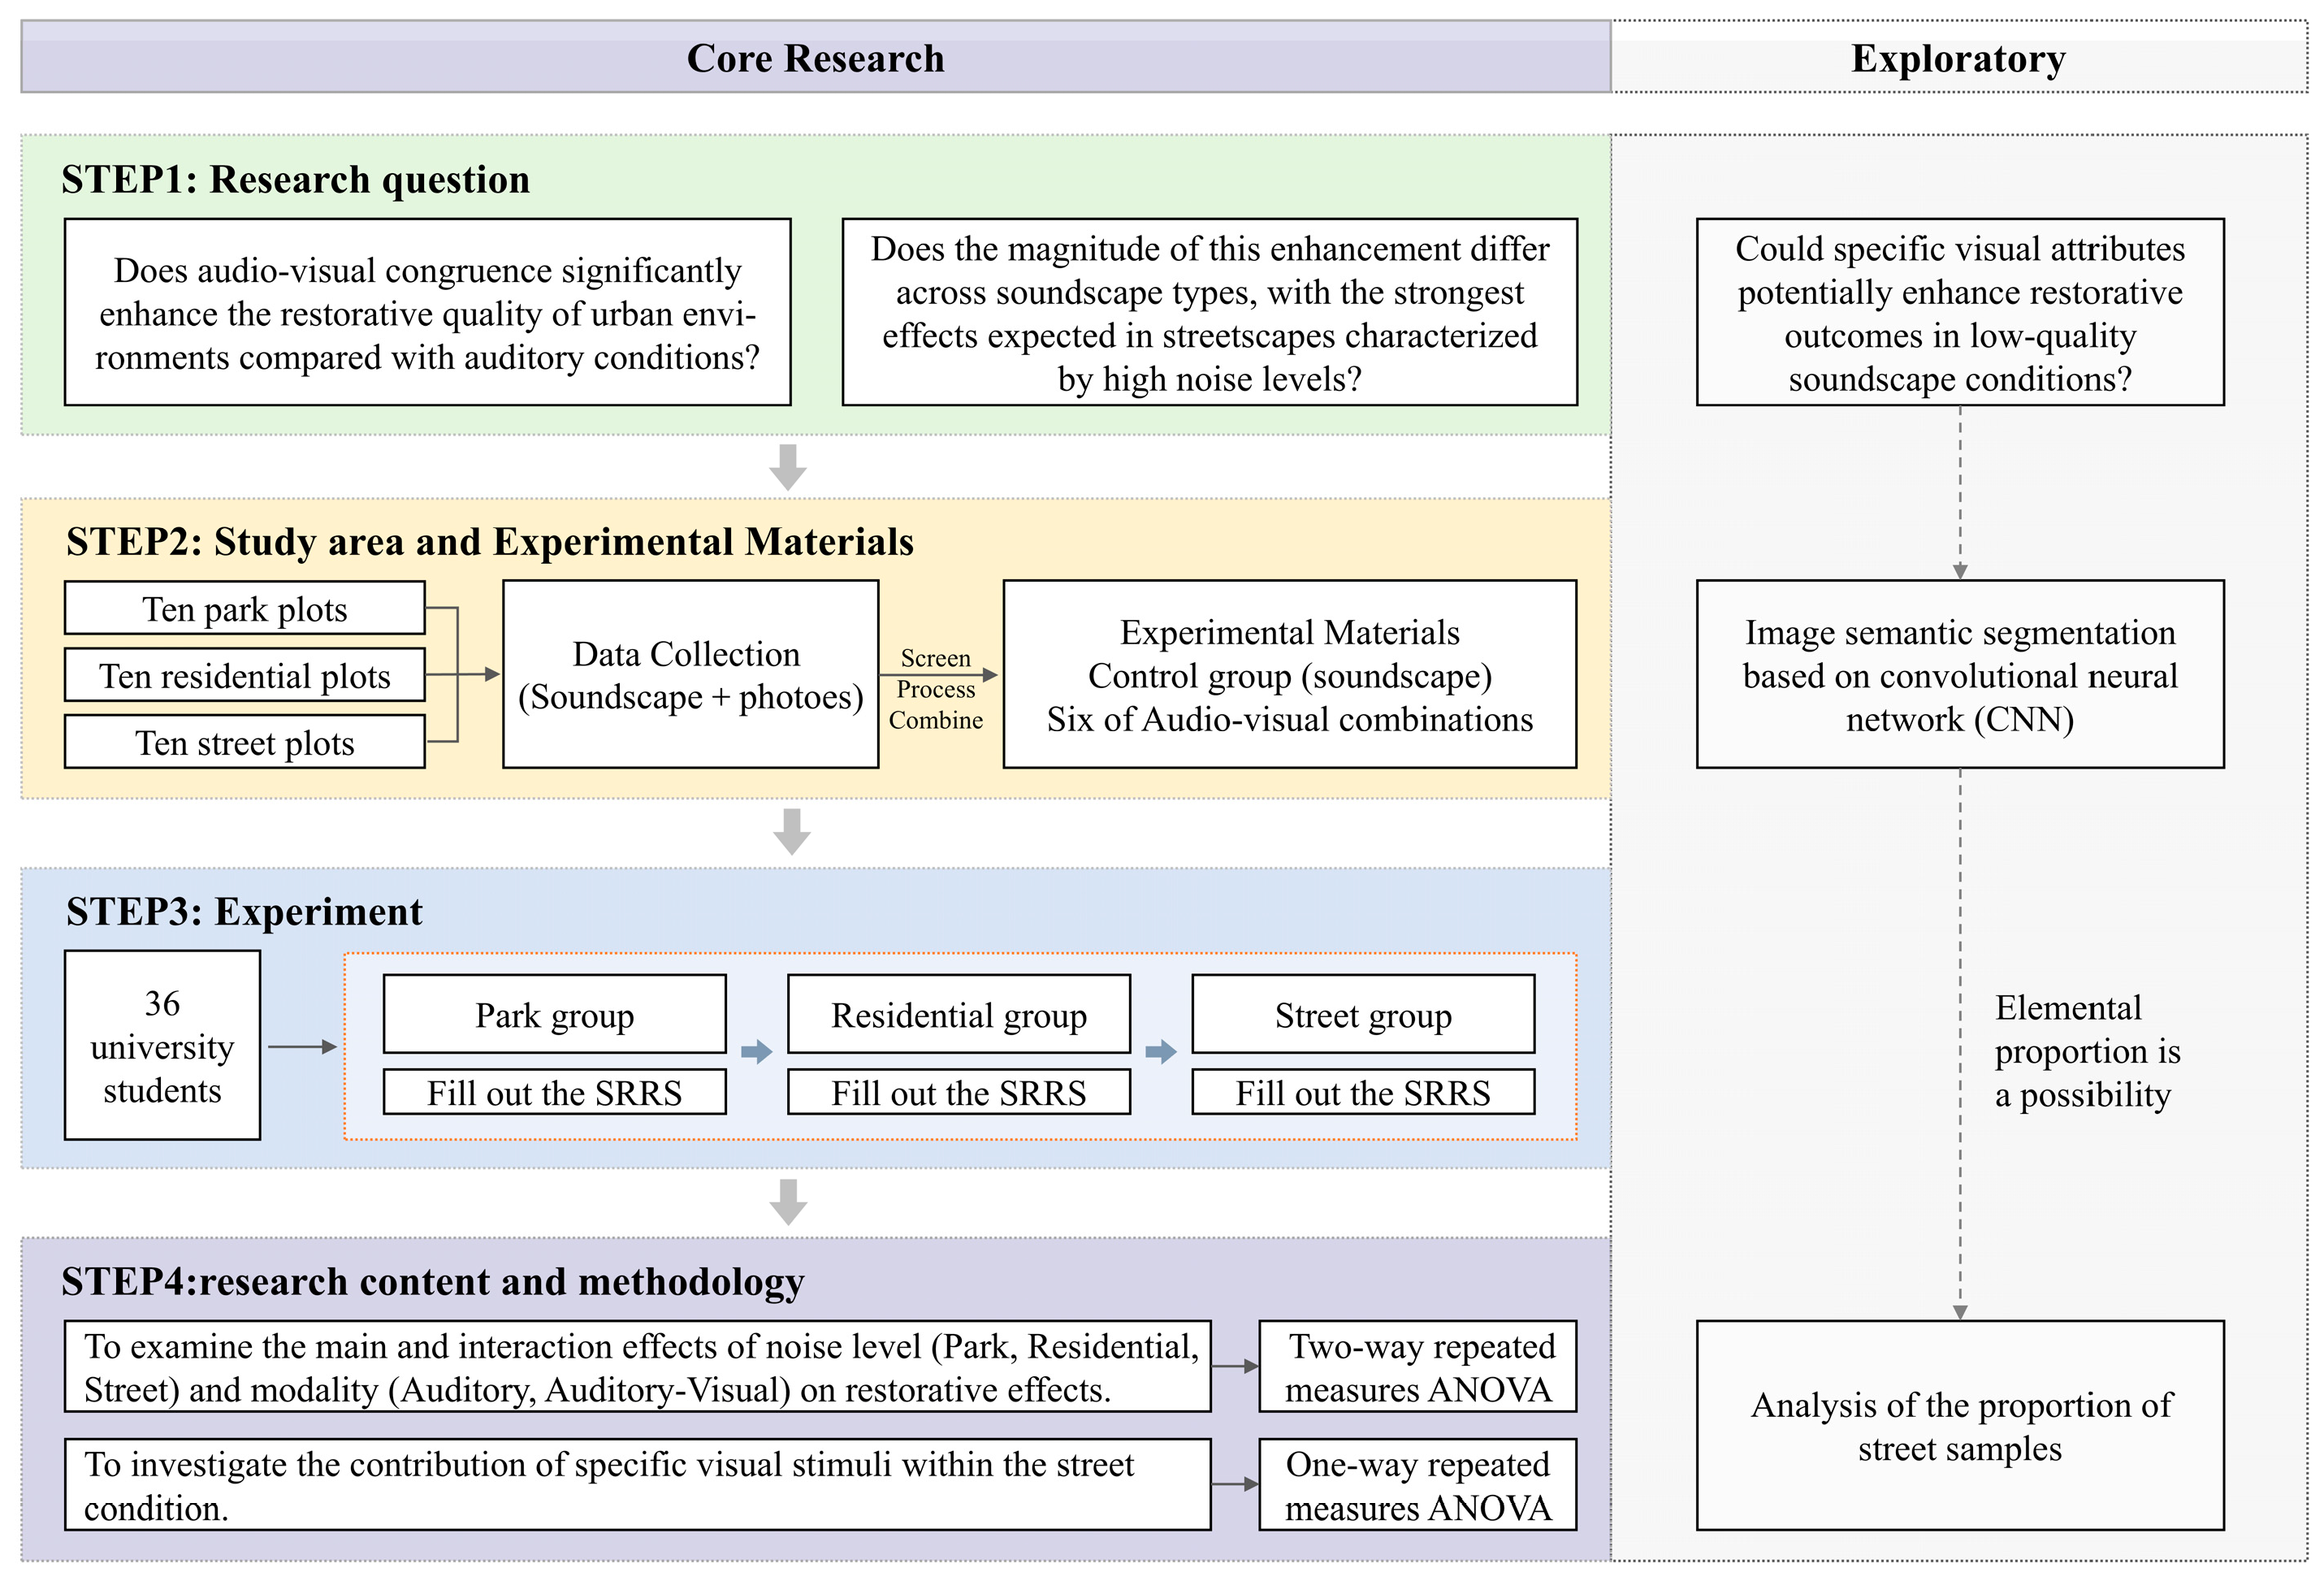
Figure 1. A framework of the work.
Sustainability 17 08906 g001
Figure 2. Soundwalk Routes and Photography Paths ((a) Park, (b) Residential, (c) Street).
Sustainability 17 08906 g002
Figure 3. Visual Samples and the Corresponding Semantic Segmentation.
Sustainability 17 08906 g003
Figure 4. A flow-chart step by step experimental procedure.
Sustainability 17 08906 g004
Figure 5. Restorative Effects Across Noise Levels and Modalities. Mean restorative effect scores (±95% confidence intervals) are depicted for each noise level (Park, Residential, Street) and modality (Auditory: open circles; Auditory-Visual: filled circles).
Sustainability 17 08906 g005
Figure 6. Restorative Effects of the Samples in the Street Condition. The plot displays individual participant responses and the distribution of the sound condition and six samples in the street condition (Sample 1 to Sample 6).
Sustainability 17 08906 g006
Table 1. Soundscape Proportions at 30 Sites.
CategoryNo.NameAudio Total
Duration
Natural SoundHuman SoundMechanical Sound
DurationProportionDurationProportionDurationProportion
Park01Xuanwu Lake Park0:19:430:19:43100%0:15:1477%0:00:182%
02Stone City Park0:17:090:17:09100%0:05:1330%0:02:2714%
03Little Peach Garden0:27:040:27:04100%0:13:2049%0:02:329%
04Gulin Park0:26:450:26:45100%0:13:1550%0:03:1012%
05Wulongtan Park0:39:040:39:04100%0:27:2670%0:04:4112%
06Bailuzhou Park0:19:460:19:46100%0:10:5655%0:09:0646%
07Yueya Lake Park0:37:190:37:19100%0:33:0188%0:08:3323%
08Wudingmen Park0:17:580:17:58100%0:09:4154%0:02:0211%
09Mochou Lake Park0:35:150:35:15100%0:22:5165%0:02:207%
10Nanhu Park0:23:430:23:43100%0:22:3895%0:04:2719%
Residential 01Jinxin Garden0:19:430:19:43100%0:03:0215%0:01:388%
02Suojin Second Village0:15:220:15:22100%0:04:2028%0:01:108%
Suojin Fourth Village0:17:480:17:48100%0:09:2653%0:03:3921%
03Yajule Garden0:37:050:37:05100%0:07:5221%0:03:199%
04Fenghuang Villa0:14:540:14:54100%0:03:1121%0:02:3317%
05Huilin Oasis Guanglin Garden0:13:320:13:32100%0:04:5336%0:02:4120%
06Qingjiang Garden0:18:400:18:40100%0:06:0032%0:05:4130%
07Langshi Xiyuan0:15:420:15:42100%0:06:4743%0:07:5050%
08Zhongshan East Road Community0:08:300:08:30100%0:01:0713%0:00:5411%
09Xingyu Huafu0:18:540:18:54100%0:01:5010%0:07:1238%
10Ankang Community0:08:250:08:25100%0:02:2529%0:01:4721%
Street01Hanzhong Road0:22:09————0:04:2620%0:22:09100%
02Zhongshan North Road0:45:10————0:05:5813%0:45:10100%
03Zhongshan Road0:23:49————0:04:5020%0:23:49100%
04Central Road0:26:55————0:08:4232%0:26:55100%
05Beijing East Road0:24:45————0:03:5916%0:24:45100%
06Beijing West Road0:19:41————0:01:338%0:19:41100%
07Zhongshan East Road0:29:03————0:04:5317%0:29:03100%
08Zhongshan South Road0:12:22————0:03:0925%0:12:22100%
09Hanzhongmen Street0:28:38————0:04:3916%0:28:38100%
10Zhujiang Road0:27:14————0:05:1319%0:27:14100%
—— Cannot be clearly identified.
Table 2. Pairwise Comparisons involving the Sound and 6 Stimuli in the Street Condition.
Mean DifferenceSEtCohen’s dPholm
SoundSample 1−1.3160.203−6.495−1.005<0.001
Sample 2−1.5590.229−6.816−1.189<0.001
Sample 3−1.8200.225−8.098−1.389<0.001
Sample 4−1.2520.232−5.394−0.956<0.001
Sample 5−2.5140.247−10.179−1.918<0.001
Sample 6−2.1090.231−9.139−1.609<0.001
Sample 1Sample 2−0.2420.134−1.814−0.1850.397
Sample 3−0.5040.167−3.010−0.3850.041
Sample 40.0640.2720.2350.0490.815
Sample 5−1.1980.145−8.272−0.914<0.001
Sample 6−0.7920.164−4.833−0.605<0.001
Sample 2Sample 3−0.2620.202−1.298−0.2000.611
Sample 40.3060.2721.1270.2340.611
Sample 5−0.9550.163−5.870−0.729<0.001
Sample 6−0.5500.120−4.572−0.420<0.001
Sample 3Sample 40.5680.2612.1740.4330.225
Sample 5−0.6940.172−4.030−0.5290.003
Sample 6−0.2880.194−1.486−0.2200.590
Sample 4Sample 5−1.2620.246−5.131−0.963<0.001
Sample 6−0.8560.225−3.800−0.6530.006
Sample 5Sample 60.4050.1353.0100.3090.041
All visual stimuli showed significantly higher restorative effects compared to the sound condition with Sample 5 demonstrating the strongest restorative potential.
Disclaimer/Publisher’s Note: The statements, opinions and data contained in all publications are solely those of the individual author(s) and contributor(s) and not of MDPI and/or the editor(s). MDPI and/or the editor(s) disclaim responsibility for any injury to people or property resulting from any ideas, methods, instructions or products referred to in the content.