Article

The Impact of the Economic Crisis and the Pandemic on the Portuguese Tourism Industry: An Econometric Approach

by
Teresa Ferreira
1,
Sandra Custódio
1,2 and
Manuel do Carmo
3,4,5,*
1
Lisbon Accounting and Business School, Lisbon Polytechnic Institute, Av. Miguel Bombarda, 20, 1069-035 Lisboa, Portugal
2
CEFAGE (Univ. Évora—ISCAL) Research Center, Av. Miguel Bombarda, 20, 1069-035 Lisboa, Portugal
3
Military Academy/CINAMIL, Av. Conde Castro Guimarães, 2720-113 Amadora, Portugal
4
IADE-FDTC|Universidade Europeia, Oriente Green Campus, Rua Adão Manuel Ramos Barata, 1885-100 Lisboa, Portugal
5
CIMA/IIFA-University of Évora, Rua Romão Ramalho, 59, 7000-671 Évora, Portugal
*
Author to whom correspondence should be addressed.
Sustainability 2025, 17(19), 8896; https://doi.org/10.3390/su17198896
Submission received: 14 July 2025 / Revised: 30 September 2025 / Accepted: 2 October 2025 / Published: 7 October 2025
(This article belongs to the Section Tourism, Culture, and Heritage)

Abstract

Tourism is a key driver of Portugal’s economy, with the WTTC projecting it to contribute EUR 56.4 billion (21.1% of GDP) by 2033. However, the sector has proven highly vulnerable to external shocks, such as the 2008 financial crisis, Brexit, and the pandemic, which have disrupted demand patterns and exposed structural weaknesses. It is essential to understand these impacts at a regional level in order to design more resilient and sustainable tourism strategies. This study examines how major crises have shaped tourism in Portugal’s NUTS II regions, focusing particularly on overnight stays, and assesses the implications for sustainable development and regional policy. Quarterly data from the National Statistics Institute (INE) covering 2004/2024 are used. We apply ARIMA and SARIMA models to account for seasonality and autocorrelation, and evaluate the accuracy of our forecasts using Mean Absolute Percentage Error (MAPE) and Theil’s U statistics. Structural breaks are considered to capture the effects of crises. The findings show that crises have significantly altered tourism patterns, with a shift towards less crowded and more remote destinations. This reflects vulnerabilities and opportunities for sustainability-oriented tourism. The study offers policymakers actionable guidance by aligning its results with the United Nations Sustainable Development Goals (SDGs), particularly those related to economic resilience (SDG 8), innovation and infrastructure (SDG 9), and partnerships for sustainable governance (SDG 17). This work is original in combining long-term regional data with robust forecasting techniques to provide innovative insights for scientific research and practical policy planning.

1. Introduction

Tourism plays a vital role in Portugal’s economy and regional development, accounting for a significant proportion of employment, income, and investment. According to the World Travel & Tourism Council [1], the sector is expected to generate EUR 56.4 billion, equivalent to 21.1% of national GDP, by 2033. However, beyond its economic importance, tourism is also highly vulnerable to external shocks. Past crises, including the global financial crisis of 2008, Brexit, and, most recently, the pandemic caused by the SARS-CoV-2 virus, have demonstrated the sector’s susceptibility to disruptions that reshape demand patterns and test the resilience of destinations [2,3].
The 2008 global financial crisis led to a prolonged downturn in international travel, which had a significant impact on Southern European economies that rely heavily on tourism revenues [4]. Political and economic uncertainty surrounding Brexit also created volatility in source markets crucial for Portuguese tourism, particularly in regions that rely heavily on British visitors [5,6]. The pandemic then caused an unprecedented disruption, with international mobility collapsing and overnight stays in Portugal dropping to historically low levels [7,8]. These crises illustrate the vulnerability of tourism systems to external shocks, while also highlighting the need for improved forecasting and adaptive policy strategies at the regional level.
The impacts of crises on tourism have been examined from multiple perspectives in the academic literature, including demand forecasting, resilience, and sustainability. Econometric approaches, such as ARIMA, VAR, and GARCH models, are often used to model and predict tourism demand [9,10]. However, although ARIMA and SARIMA are widely used and validated for handling seasonality and autocorrelation [11], few studies have systematically applied them to long-term regional data across Portugal. Furthermore, existing research frequently emphasises national-level impacts or short-term fluctuations, overlooking the spatial and temporal heterogeneity of shocks across regions [12]. There has also been limited attention paid to linking quantitative forecasts to broader sustainability agendas, such as the United Nations Sustainable Development Goals (SDGs) [13].
This study addresses these gaps by investigating the impact of major crises on Portuguese tourism at the NUTS II regional level, focusing on overnight stays as a key demand indicator. Using quarterly data from the National Statistics Institute (INE) covering 2004–2024, we apply ARIMA and SARIMA models to capture seasonal patterns, generate forecasts, and evaluate model accuracy using mean absolute percentage error (MAPE) and Theil’s U statistics. Structural break tests are also employed to evaluate the degree to which external shocks have altered tourism dynamics.
This research makes a threefold contribution. Firstly, it provides a long-term regional analysis of Portuguese tourism demand, highlighting how crises affect different destinations, such as Lisbon and the Algarve, in different ways. These two regions are central to national tourism development, but they have distinct market profiles. Secondly, it demonstrates the value of robust forecasting models in capturing crisis-induced disruptions and supporting adaptive planning. Thirdly, by framing the analysis within the context of the SDGs, the study connects empirical results to broader sustainability goals, such as promoting economic resilience (SDG 8), strengthening infrastructure and innovation for regional adaptation (SDG 9), and fostering partnerships between academia, policymakers, and statistical authorities (SDG 17).
Accordingly, this study seeks to answer the following research questions: (1) How have external crises, such as the 2008 financial crisis, Brexit, and the pandemic, reshaped regional tourism demand in Portugal? (2) To what extent can ARIMA/SARIMA models capture and forecast these crisis-induced disruptions in overnight stays? (3) How can the findings inform sustainable tourism policies aligned with the SDGs, particularly in regions with different market structures and vulnerabilities?

2. Literature Review

2.1. Crisis and Tourism Demand

Tourism has long been recognised as being highly sensitive to external shocks. For example, the 2008 global financial crisis reduced international demand across Southern Europe, particularly in countries that rely heavily on tourism revenues [4]. Subsequent research has shown that the impact varies by region, with destinations that rely more heavily on discretionary spending and international markets experiencing greater declines [12]. Brexit introduced further uncertainty in outbound travel from the UK, with implications for Portugal given its strong dependence on British tourists [14,15]. The disruption caused by the subsequent pandemic was even greater, leading to unprecedented declines in international arrivals and overnight stays [2,3].
In the case of the pandemic caused by the SARS-CoV-2 virus, most studies have focused on the immediate effects of travel disruption [16,17] or post-pandemic travel intentions [15]. However, few studies analyse the recovery process or the differentiated impact on regions dependent on domestic versus international tourism in a longitudinal and regional manner. This distinction is important because the resilience observed in regions with a greater reliance on domestic tourism (e.g., the Centre) may contrast with the vulnerability of regions such as the Algarve, which depend heavily on external markets, such as the British market.
According to Dutta et al. [15], tourism as a component of overall economic growth in the UK is projected to grow at an annual rate of 3.8 per cent to 2025. Using seasonally adjusted series of tourist arrivals extracted from trends, together with the uncertainty of Brexit, they conclude that there is strong evidence of long-term persistence in the volatility of tourist arrivals.
Regarding Brexit, existing studies [17,18] primarily highlight anticipated impacts on the Irish hotel sector and the arrival of British tourists in Spain. However, there are no empirical studies focusing on Portugal. As the United Kingdom is one of the Algarve’s main source markets, there is an opportunity for further empirical research in this area.
A study of the Azores Islands showed that employment declined by 7% due to reduced tourism activity during the pandemic [16]. This approach helps to identify the knock-on effects of a decline in tourism on local economies.
While these studies demonstrate the vulnerability of tourism to crises, the majority focus on either global patterns or national aggregates. Fewer studies have examined regional resilience and recovery trajectories, despite evidence suggesting that structural characteristics such as market diversification, seasonality, and accessibility influence destinations’ vulnerability [7]. This highlights the need for long-term, region-specific analyses to understand how crises affect demand in different geographical areas.

2.2. Forecasting Tourism Demand

In recent decades, considerable progress has been made in the field of tourism demand forecasting. Traditional econometric approaches, such as ARIMA, VAR, and GARCH models, remain widely used thanks to their statistical robustness and transparency [9,10]. In particular, ARIMA and SARIMA models are well-suited to data with strong seasonal and autoregressive components, and have been validated in a variety of tourism contexts [11]. These models have been used in studies to predict international arrivals, overnight stays, and revenues, with relatively high accuracy often reported in short- to medium-term forecasting.
Nevertheless, limitations are evident. For example, univariate models such as ARIMA may not fully capture structural breaks or incorporate explanatory variables beyond the time series itself. Multivariate models (VAR and ARIMA–GARCH) and, more recently, machine learning approaches (e.g., artificial neural networks and long short-term memory (LSTM) networks) have been proposed as alternatives [19]. While these methods may improve predictive performance, they often require larger datasets and complex calibration, making them difficult for policymakers to interpret [20]. In the context of tourism policy and sustainability analysis, achieving the right balance between interpretability and predictive accuracy remains critical.
In the Portuguese context, most studies have applied ARIMA-type models either at a national level or over short time periods [17]. Few studies combine long-term data with regional granularity, and even fewer explicitly assess how crises alter forecasting accuracy and dynamics. This justifies further exploration of the use of ARIMA/SARIMA models to forecast regional-level tourism demand in times of crisis.
To analyse the impact of Brexit on British tourism in Spain [21], use Bayesian structural time series models and conclude that between July 2016 and September 2017 (the period of preparation for the implementation of Brexit), Brexit had no negative impact on the arrival of British tourists or their spending in Spain.
In their work, Burnett and Johnston [22] present a study entitled ‘The expected economic shock of Brexit on hotel and tourism planning in Ireland: resilience, volatility and exposure’. Through qualitative and pragmatic research involving interviews with senior Irish hotel managers, the authors concluded that the sector is facing few threats due to complacency and a ‘wait and see’ mentality. However, the authors also conclude that, although tourism has been resilient to economic shocks in the past, historical lessons have not been applied in anticipation of the potential shock that Brexit could cause.
More research has mainly focused on aggregate series and macroeconomic analysis, with few studies combining regional disaggregation with robust longitudinal analysis [23]. This research aims to address this issue by applying ARIMA models at the NUTS II regional level and comparing the effects of different exogenous shocks over time.
Economic crises, caused by the impact of negative global events on tourism demand, can cause anxiety in certain tourism segments [24], leading to the construction of new segmentation concepts.

2.3. Sustainability, Tourism, and the SDGs

Alongside methodological advances, research has increasingly positioned tourism within the sustainability and resilience agenda. The United Nations’ 2030 Agenda highlights the importance of tourism in achieving various Sustainable Development Goals (SDGs), particularly in terms of economic growth and employment (SDG 8), innovation and infrastructure (SDG 9), and fostering partnerships for sustainable governance (SDG 17) [13]. Empirical studies have shown that crises not only disrupt tourism flows but also create opportunities for more sustainable models. These include promoting domestic tourism, encouraging less popular destinations, and diversifying source markets [25].
In Portugal, policy frameworks such as the Tourism Strategy 2027 emphasise the integration of sustainability indicators and resilience planning. However, quantitative assessments linking crisis impacts, forecasting, and SDG-related outcomes remain limited. Most sustainability-oriented tourism studies are conceptual or policy-driven, with relatively few connecting econometric analyses of demand with resilience and sustainable development [3].

2.4. Research Gap

Taken together, the literature highlights three main gaps. Firstly, although the impact of crises on tourism has been widely studied, there has been limited regional analysis within Portugal despite its NUTS II regions being highly heterogeneous. Secondly, although ARIMA/SARIMA models are well established in tourism forecasting, few studies have tested their performance in long-term, crisis-affected regional contexts. Thirdly, the integration of quantitative forecasting with the broader sustainability agenda (SDGs) is underdeveloped.
This study addresses these gaps by applying ARIMA and SARIMA models to long-term regional data (2004–2024) on overnight stays in Portugal. It explicitly assesses the impact of crises on tourism demand and draws conclusions regarding sustainable development strategies.
Furthermore, the literature often emphasises the need for public policies that are more sensitive to the cyclical and regionally differentiated nature of tourism [26,27]. However, few proposals have been made for operational indicators or regional risk metrics. This is another area to which this research aims to contribute.

3. Methodology and Methods

This study uses quarterly tourism data collected by the INE/Turismo de Portugal survey between the first and third quarters of 2004. The dataset includes figures on overnight stays, the number of guests, and revenues, categorised by type of accommodation and NUTS II region (Norte, Centro, Lisbon e Vale do Tejo, Alentejo, Algarve, Madeira, and the Azores). To ensure analytical accuracy, the impact of the crises was assessed using data on overnight stays in the Lisbon and Algarve regions (the two regions that had the greatest impact on Portuguese GDP), as well as in all NUTS II regions combined.
The data are modelled as a time series, enabling retrospective analysis and prospective forecasting. Due to the presence of trends and seasonality, stationarity was assessed using graphical methods and formal unit root tests (Augmented Dickey–Fuller, Phillips–Perron, and KPSS). First differentiation was applied where necessary.
To account for seasonal patterns and autocorrelation, SARIMA models were employed. The ARIMA/SARIMA model was chosen for three main reasons: (i) it is a well-validated method in the tourism forecasting literature and is suitable for time series with strong seasonality and external shocks; (ii) it ensures the results are simple, transparent and interpretable, which is essential for supporting public decision-makers; and (iii) consistent data are limited, which restricts the application of multivariate models such as VAR or machine learning-based approaches, which require a greater volume and granularity of information. Thus, the ARIMA/SARIMA model strikes a balance between statistical rigour and practical applicability, while also capturing the impact of economic crises and the pandemic on tourism demand.
A Chow test confirmed a structural break between the fourth quarter of 2019 and the first quarter of 2020 (p < 0.001), which was attributed to the impact of the pandemic. Consequently, the series was segmented into pre- and post-pandemic periods (2004–2019 and 2020–2024, respectively), and separate SARIMA models were fitted to each period. This approach facilitates comparative analysis and improves the reliability of forecasts by taking abrupt changes in tourism dynamics into account.
While splitting the series addresses the structural break, we also evaluated robustness by comparing forecasts with alternative ARIMA models and assessing forecast accuracy using MAPE and U-Theil statistics. This approach ensures that results are not driven by the modelling choice but reflect actual dynamics in the data. All data were processed in Gretl 1.9.4 (free econometric software) and JASP 0.18.3 (statistical software).

3.1. Methods

Time series analysis of stationary data often employs linear stochastic models, such as ARMA, ARIMA, and SARIMA, which were developed by Box, Jenkins, Reinsel, and Ljung [28]. These models require an initial assessment of stationarity, which is typically achieved through logarithmic transformation or differencing. Model selection is guided by autocorrelation analysis and diagnostic criteria, including the Akaike Information Criterion (AIC) and the Schwarz Bayesian Criterion (SBC) [11,28]. The autocorrelation function (ACF) and the partial autocorrelation function (PACF) [11,28] are estimated from the observed data and are then compared with the theoretical expectations in order to identify the most suitable model. Once a model has been specified, its parameters are estimated using statistical software. Diagnostic checks are then performed to ensure that the model is adequate, particularly with regard to the behaviour of the residuals as white noise. Validated models can then be used for forecasting.
In this study, the Box et al. [28] methodology was applied to quarterly overnight stay data across Portugal’s NUTS II regions. This approach enables dual-layer analysis: one capturing autoregressive behaviour based on historical patterns and the other modelling stochastic influences via moving averages. SARIMA models allow for seasonal decomposition and trend isolation, which proved essential in understanding the temporal dynamics of tourism. The results demonstrate the effectiveness of this framework in capturing structural and seasonal variations in tourism-related time series.

3.1.1. ARMA Model

The Box et al. (2015) [28] stationary series models, known in the literature as A R M A p , q , models, are formalised using the relationship:
y t = ϕ 1 y t 1 + + ϕ p y t p + ε t θ 1 ε t 1 θ q ε t q
The series of interest, y t , is a function of its past values and the linear combination of random shocks ε t , ε t 1 , , ε t q , the autoregressive parameters of order p , ϕ 1 , ϕ 2 , , ϕ p and the moving average parameters of order q , θ 1 , θ 2 , θ q .
In the general case and using the delay operator, the ARMA ( p , q ) model given in (1) is presented by:
ϕ p L y t = θ q L ε t y t = θ q L ϕ p L ε t
where the parameters ϕ i i = 1 , , p   and   θ i i = 1 , , q are such that the roots of the polynomials ϕ L   and   θ L in the module are strictly greater than one (guaranteeing the stationarity and invertibility of the process). When p = 0 , the model is called a moving average of order q , M A ( q ) , and when q = 0 , an autoregressive of order p , A R ( p ) .

3.1.2. ARIMA Model

Another linear statistical model used to analyse time series is the ARIMA (Autoregressive Integrated Moving Average) model. Theoretically, this type of model is the most widely used for forecasting time series that are not stationary but can be made stationary by differentiation. They are a generalisation of ARMA models, which basically aim to make the process stationary through difference operations, where the letter I stands for “integrated”. In general, a process is said to be A R I M A p , d , q if:
ϕ p L Δ d y t = θ q L ε t y t = θ q L ϕ p L Δ d ε t
where p , d and q are positive integers: p is the order of the autoregressive model, d the degree of differentiation, and q the order of the moving average model.
Thus, if y t ~ A R I M A p , d , q , then y t is a non-stationary process which, after d differentiations, is an A R M A p , q process of the form:
d y t ~ A R M A p , q
A process y t is said to be integrated of order d if the autoregressive polynomial of y t has several roots equal to one.

3.1.3. SARIMA Model

To take account of the seasonal behaviour of some time series, multiplicative seasonal ARIMA models (SARIMA) are used. SARIMA models have a non-seasonal part corresponding to the parameters p , d , q and a seasonal part corresponding to the parameters ( P , D , Q ) . Thus, we have a seasonal autoregressive component S A R ( P ) and a moving average S M A ( Q ) , and it is represented as S A R I M A p , d , q P , D , Q , where D refers to the order of seasonal differentiation. Thus, this type of model has the following form:
A R I M A p , d , q ( P , D , Q ) m
where the first bracket refers to the non-seasonal part of the model and the second to the seasonal part. The letter m corresponds to the number of seasonal periods in the series.
The fitting of a SARIMA model is like the process of fitting an ARIMA to time series data, specified by the following:
L Φ L s w t = θ L Θ L s ε t
with w t = s d d y t .
After presenting the different types of models and considering the main issues related to forecasting, a wide range of results has been obtained, which we present in the next section.
In terms of assessing the accuracy/performance of the selected models, and for forecasting purposes, an analysis of the behaviour of the residuals was carried out and the MAPE and U-Theil’s metrics were presented. The MAPE measures the average of the absolute differences between the predicted values and the actual values, expressed as a percentage.
M A P E = i = 1 n ε t y t × 100
where ε t is the absolute value of the error in period t and y t the absolute real value of the variable in period t ( n being all the periods in the series). A MAPE of less than 10 per cent suggests perfect forecasts, below 20 per cent good forecasts and close to 30 per cent indicates that the model is not effective at forecasting.
The U-Theil’s value (or Theil’s Inequality Coefficient) is a metric used to assess the accuracy of an ARIMA model’s forecasts. It compares the model’s forecasts with the actual values, according to
U T h e i l s = 1 n i = 1 n y t * y t 2 1 n i = 1 n y t * 2 + 1 n i = 1 n y t 2
where y t * is the predicted value of the variable.
Values close to 0 indicate that the model has good accuracy. Conversely, values greater than 1 indicate that the model is worse than simply using the average of the actual values as a forecast. This suggests that the model needs to be adjusted or that the data is too volatile to be predicted accurately.

4. Discussion and Results

4.1. Analysis of Overnight Stays Data in Lisbon, Algarve, and Total NUTS II—Period Due 2004/2019

As the regions with the largest contribution to GDP from the tourism sector in Portugal are the Algarve, with a large part of its economy based on the tourism sector, and the Lisbon Metropolitan Area, which is a region with many international tourists, the focus of our study centres on these two regions. However, to complement the study, we also present an analysis of the total by NUTS II. The study will be carried out according to the proposed methodology, ending with a presentation of the forecast errors for the period 2020:1 to 2024:3. After aggregating the data by NUTSII region, the behaviour of the series is presented in Figure 1.
For all regions, and throughout the period analysed, there is an upward trend in the number of overnight stays, with the marked fluctuations between quarters being justified by the presence of seasonality. It should be noted that the ARIMA, suitable for short-term forecasts and in the case of series containing seasonal variations [29]. However, the models introduced by Box and Jenkins exclusively describe stationary series, i.e., with constant mean and variance over time and autocovariance dependent only on the degree of lag between the variables, and the first step is to verify or prove the stationarity of the series [30].

4.1.1. Identification, Estimation, and Evaluation of Diagnostics

Analysis of the stationarity of the series is intuitive, based on knowledge of the nature of the phenomenon being analysed and observation of the series timeline (Figure 1).
The stationarity of the series under study was achieved by applying a simple differentiation X t = X t X t 1 = 1 B X t and a seasonal difference s X t = X t X t s = 1 B s X t to the initial series. It should be noted that it is advisable to minimise data differencing (to avoid over differencing), as differencing leads to an increase in the variance of the forecast error. Although the series in the first differences and with a seasonal lag can be considered stationary.
Using the “Best Fitting” option and including period 4 in the “Seasonal Custom”, we have the model for the three regions. The best model, compared to the others, was chosen based on the AIC and the value of the coefficient of determination.
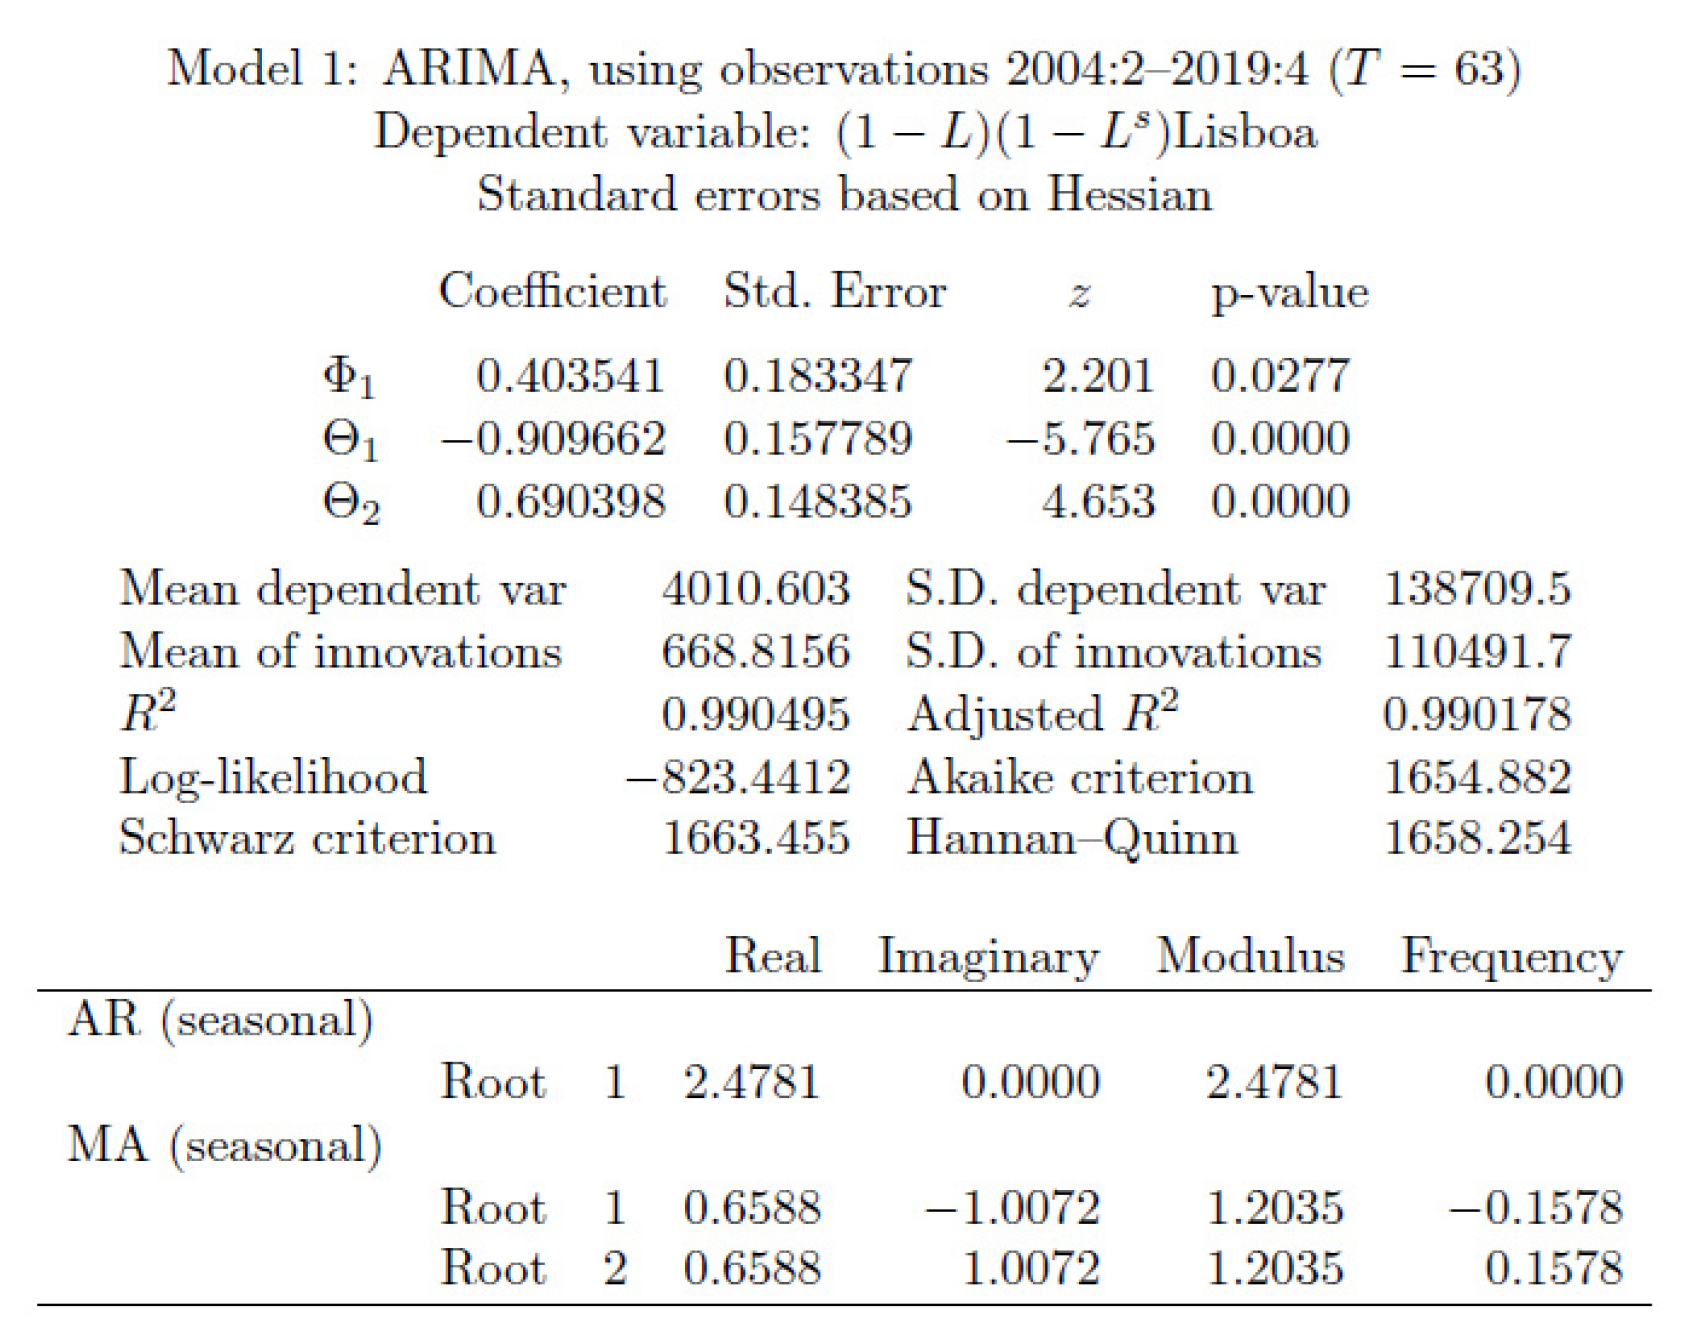
For the Lisbon region, the model selected is S A R I M A ( 0 , 1 , 0 ) ( 1,1 , 2 ) , Figure 2, leading to better indicators in terms of forecasting.
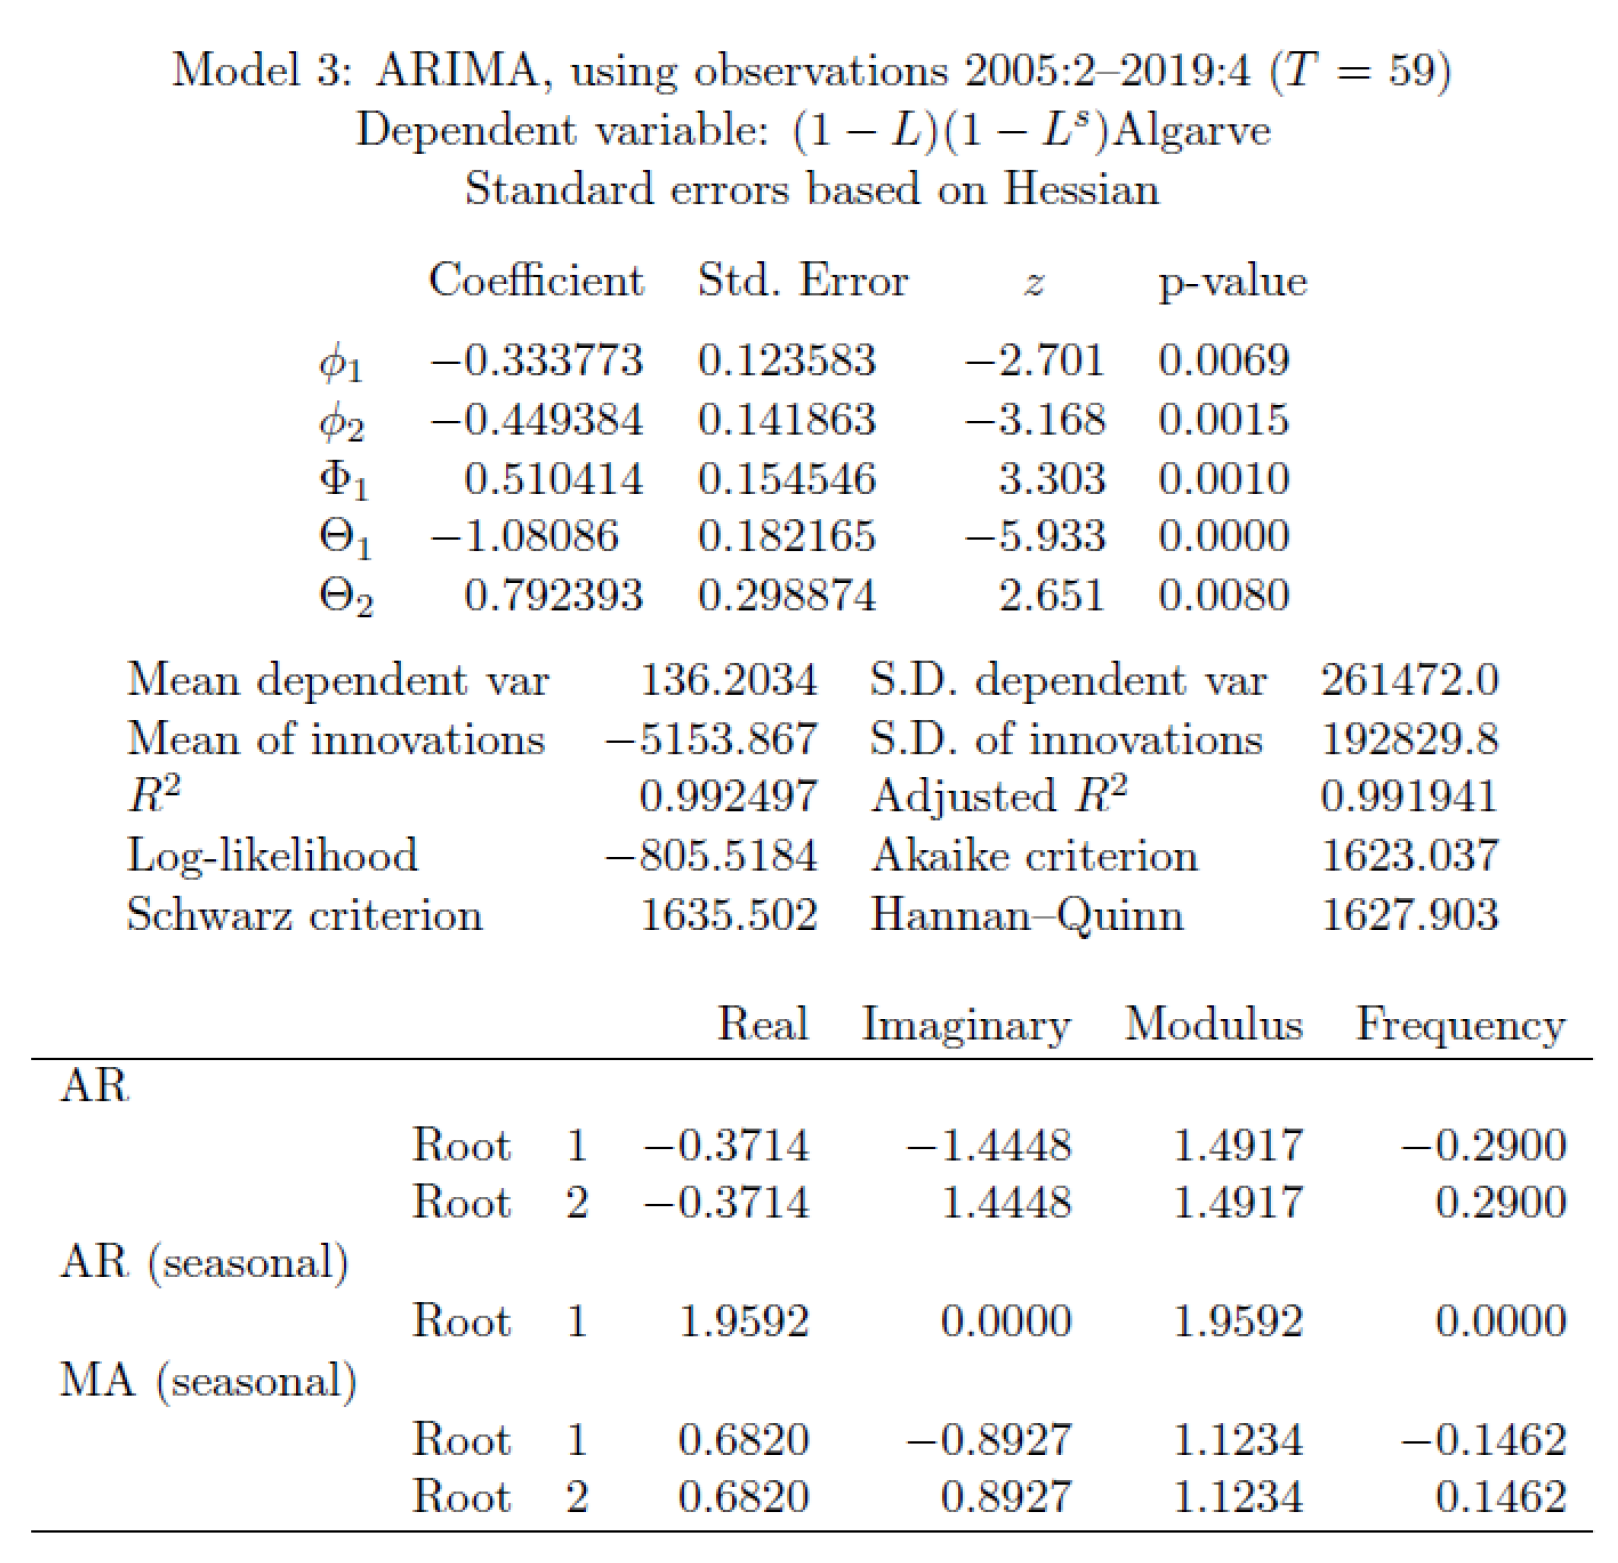
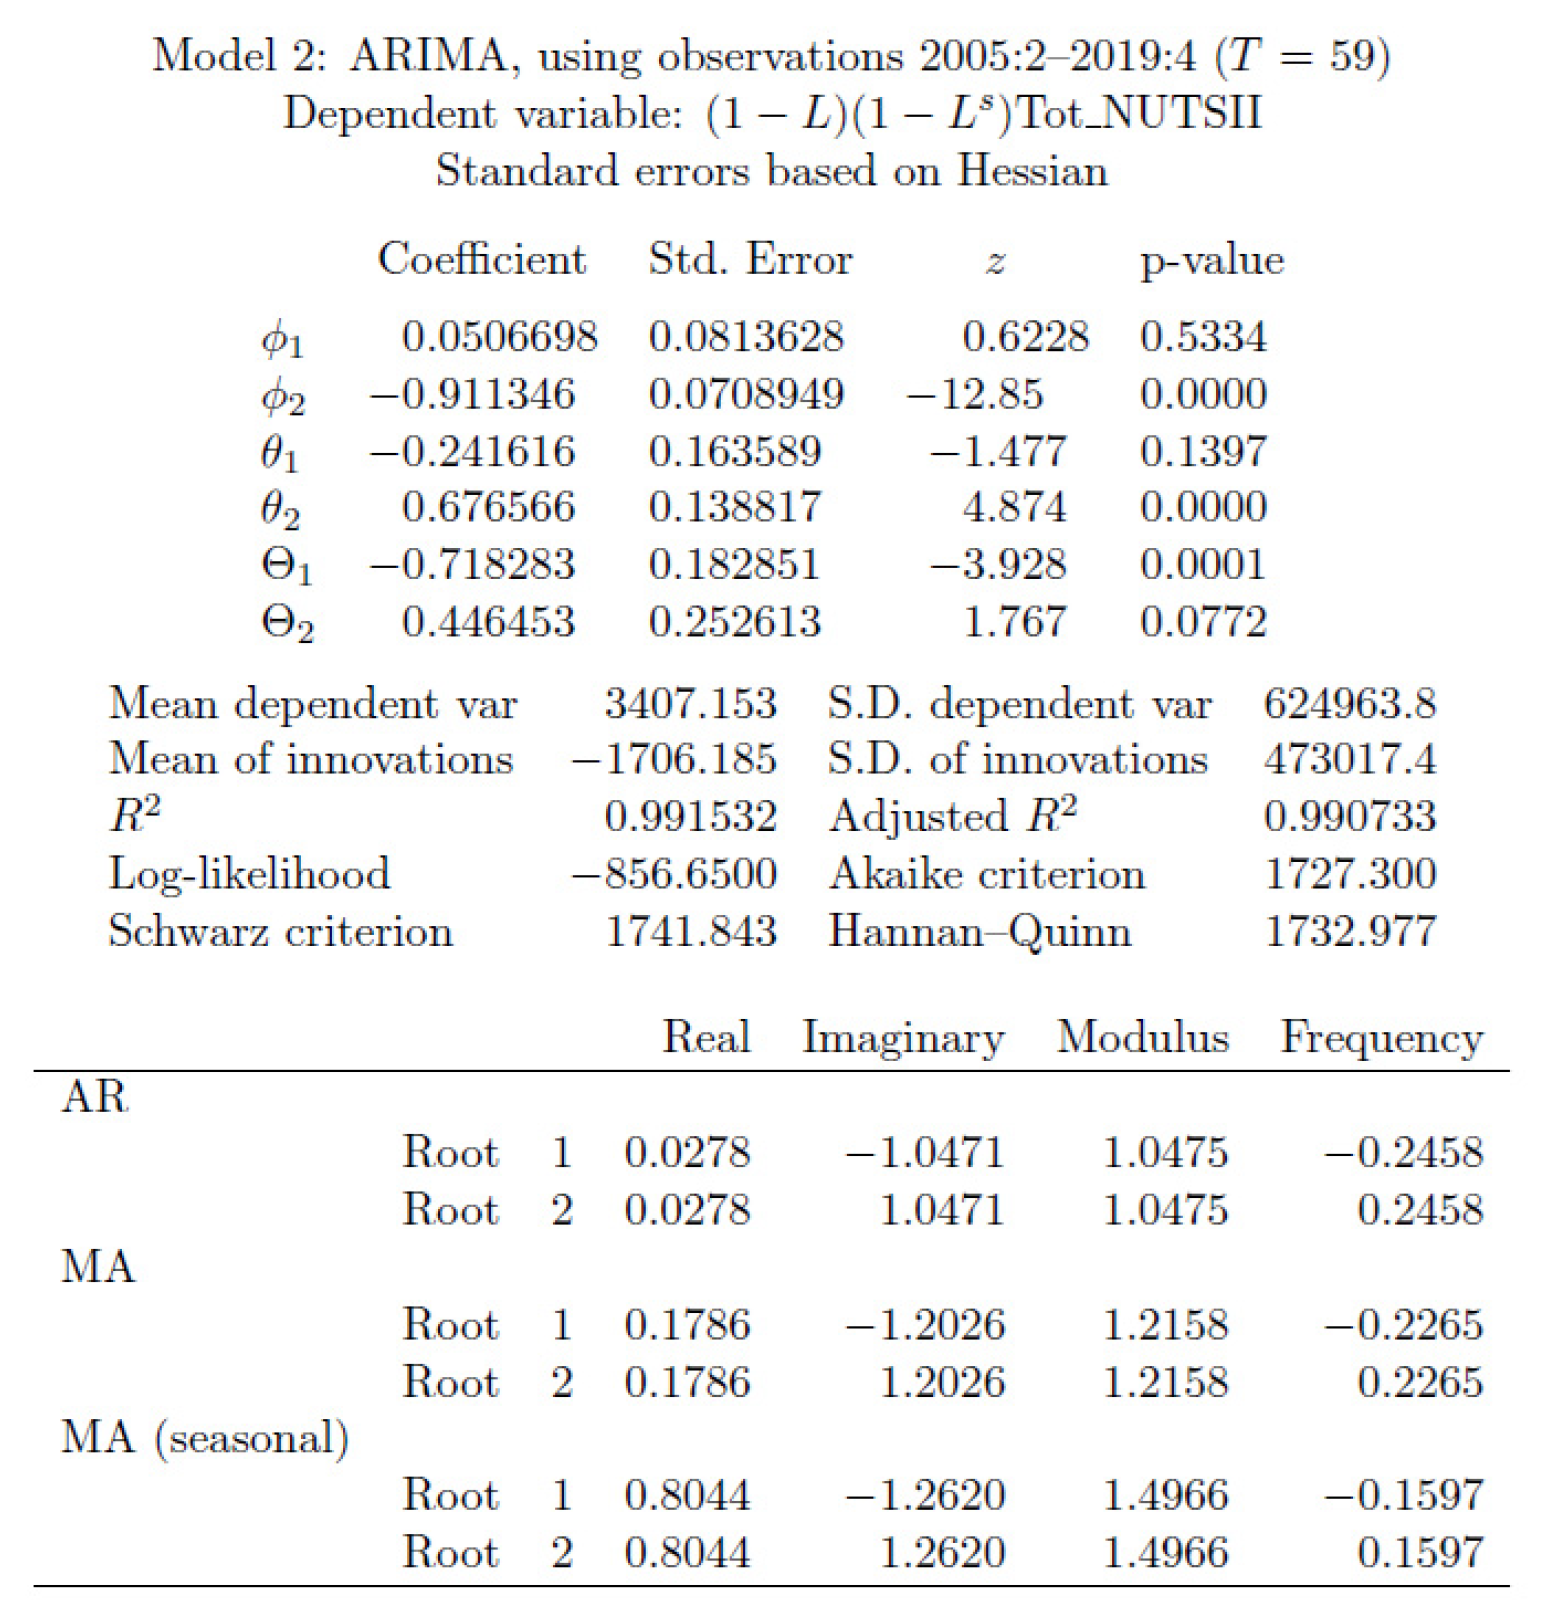
Applying the same methodology, the model was identified and estimated for the Algarve region and for Total Nuts II, resulting in the following models (Figure 3 and Figure 4):
The selected models are well identified, as the estimated coefficients are statistically significant test (p < 0.001). Both seasonal and non-seasonal components satisfy the invertibility condition, since the moving average parameters are, in modulus, below unity. Furthermore, the roots of the polynomials ϕ ( L ) and θ ( L ) lie outside the unit circle, ensuring stationarity and invertibility.
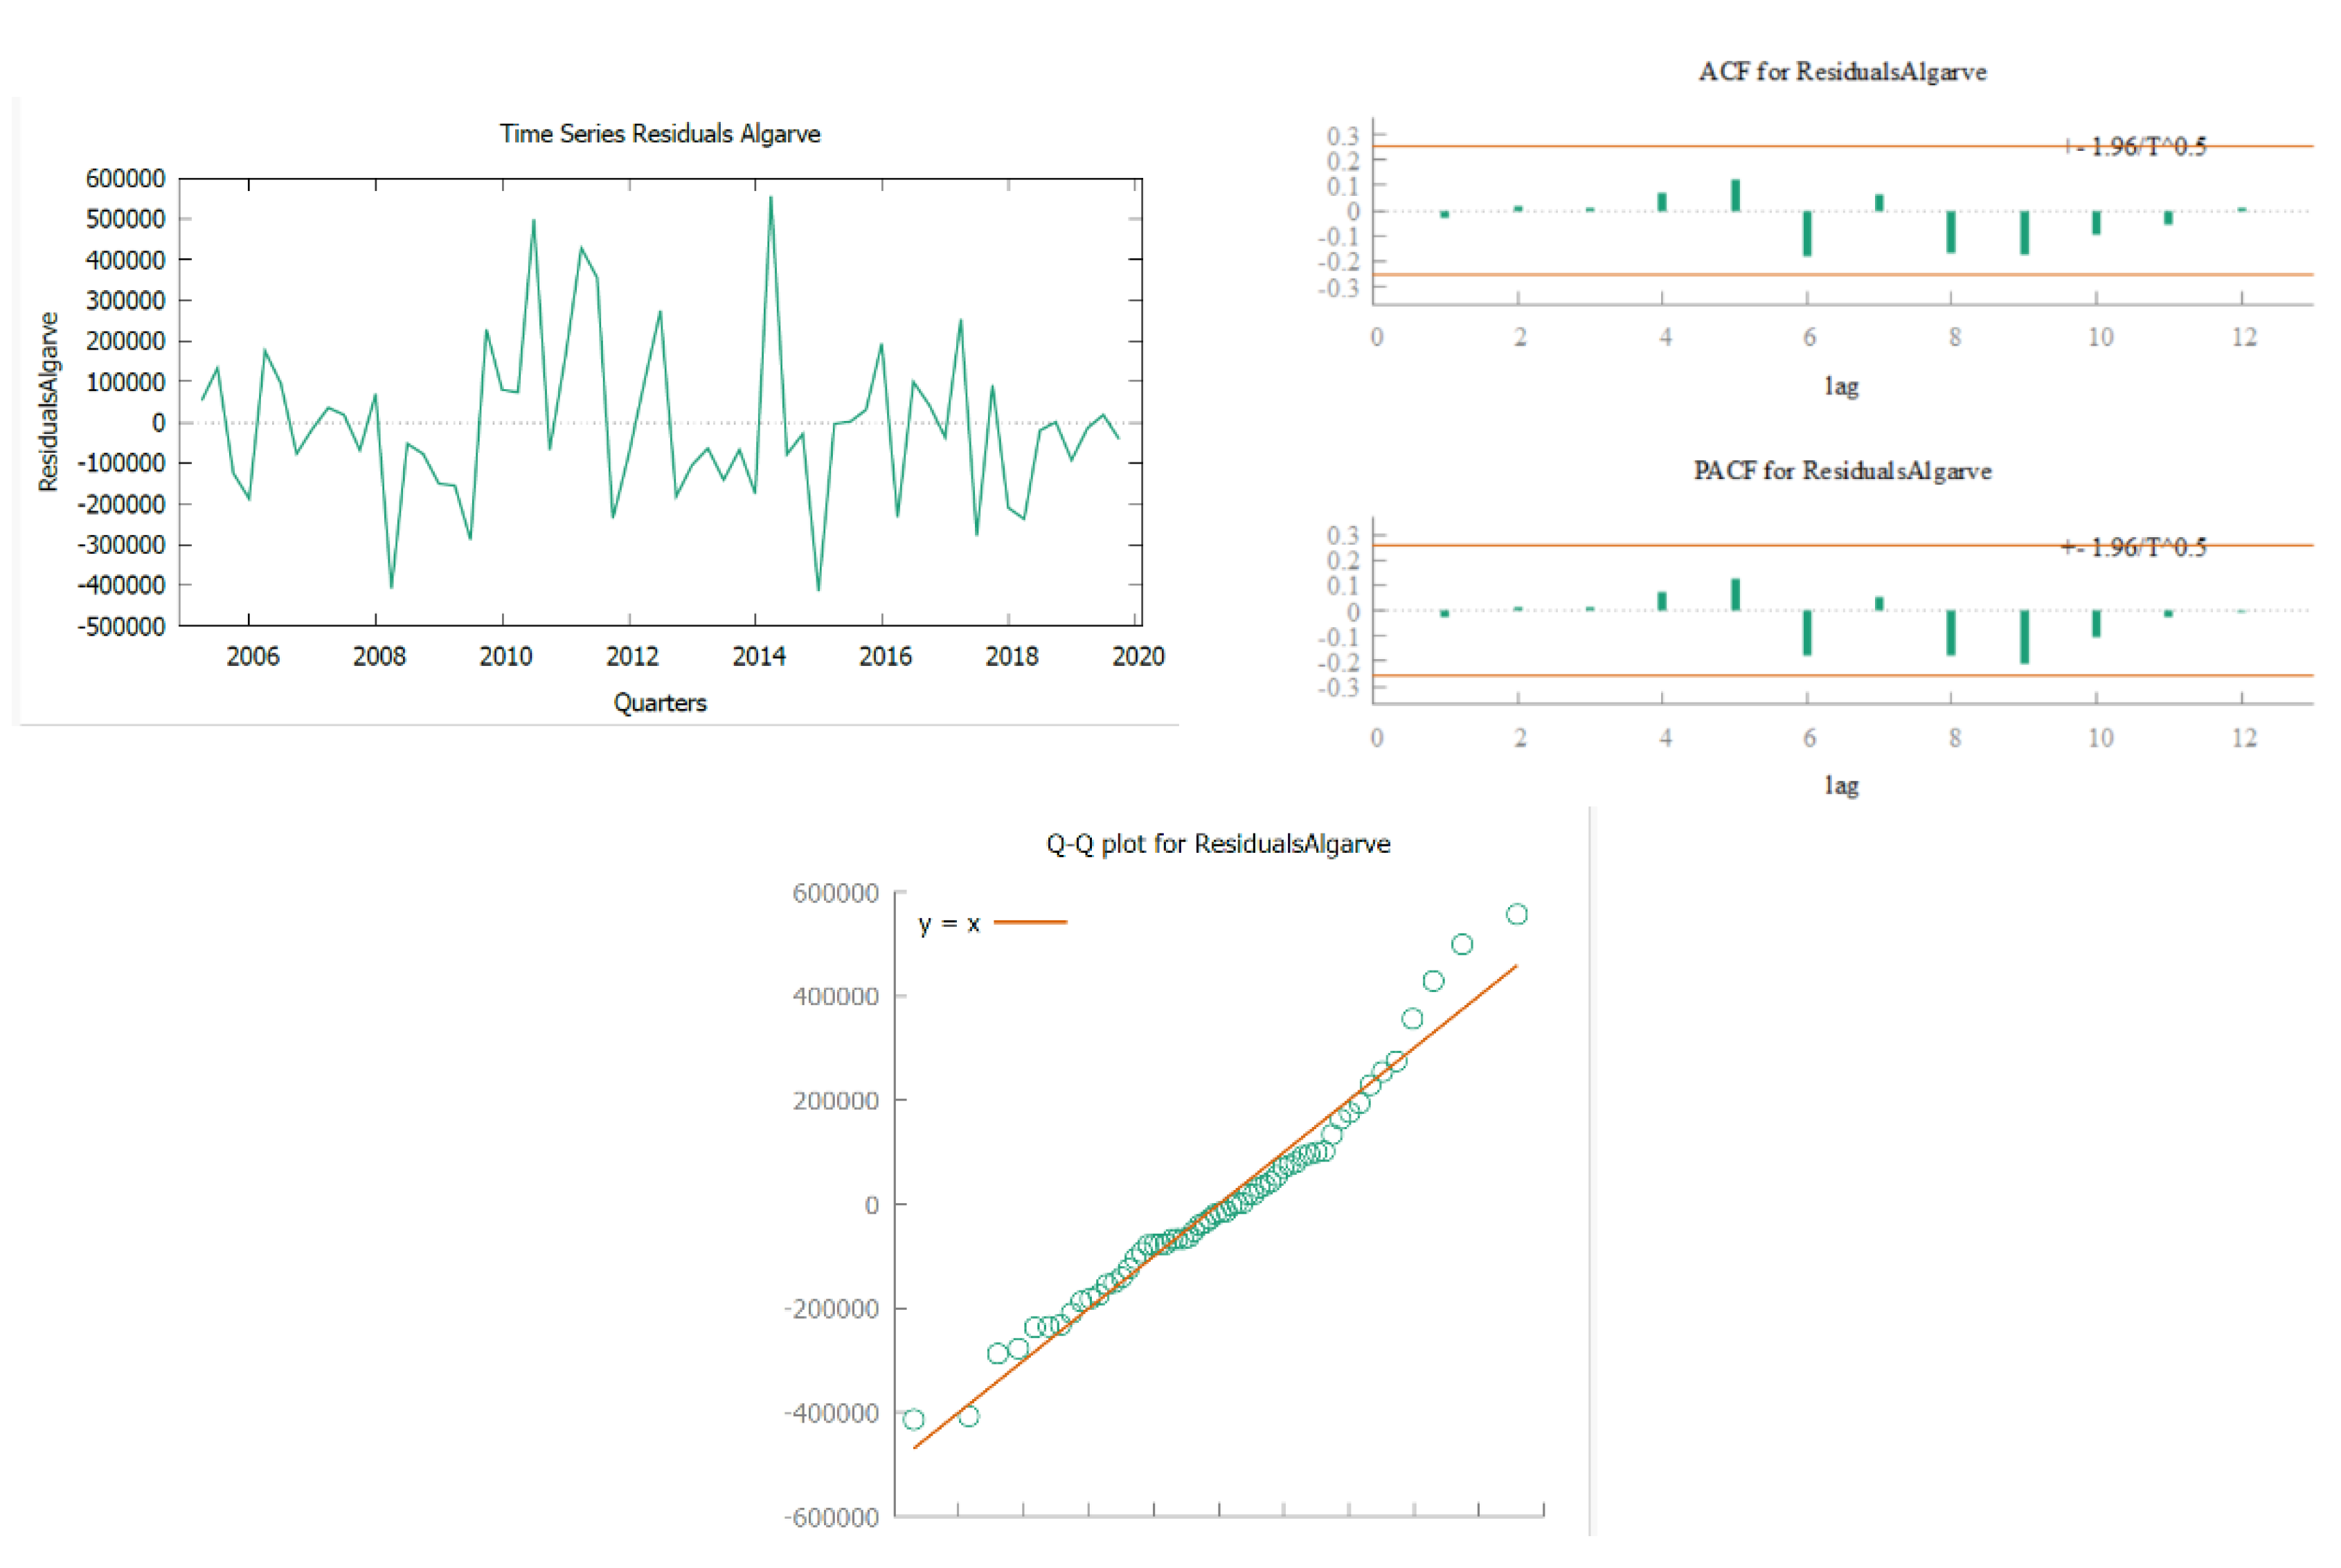
After assessing the statistical quality of the model, it is important to evaluate the quality of the fit, which is performed by analysing the residuals. In fact, if this model properly explains the series of overnight stays in the three selected regions, the residuals should behave like a process analogous to white noise.
Below are the respective graphs of the residual series and the QQ-plots (Figure 5). It can be concluded that the residuals of the identified model behave like white noise and with a behaviour that a normal distribution can describe.
The residuals oscillate around zero, indicating a zero mean, but their varying amplitude (notably between 2011 and 2015) suggests heteroscedasticity. Some persistent patterns also hint at autocorrelation, which was further examined with ACF and PACF. The ARCH (4) test (p < 0.001) rejects homoscedasticity, while the QQ-plot suggests normality is not problematic. Overall, the residuals approximate white noise, though not perfectly.
For the Algarve region (Figure 6), the residuals behave more like white noise, but with some caveats. There are some residuals with extreme values (in 2013 and 2014), which may indicate the presence of outliers or slight heteroscedasticity.
Some oscillations are visible, especially between 2010 and 2014, though they may reflect randomness. The ACF and PACF do not indicate significant autocorrelation, and the ARCH (4) test (p = 0.841 > 0.001) does not reject homoscedasticity. The QQ-plot suggests normality, so the residuals can be considered white noise.
In Figure 7, the residuals for the NUTS II total show a more complicated behaviour in relation to the hypothesis that they are white noise.
Although the residuals oscillate around the zero line and there is a certain randomness in the movements, the variance is increasing (a sign of heteroscedasticity). From 2005 until around 2010, the amplitude of the residuals is smaller, but after 2010, there are more intense oscillations, suggesting that the variance is not constant. On the other hand, systematic and regular peaks between 2011 and 2015 may indicate the presence of autocorrelation.
The ACF and PACF of the residuals show no evidence of autocorrelation. The ARCH (4) test (p = 0.934 > 0.001 does not reject homoscedasticity, and the QQ-plot suggests normality, indicating that the residuals behave like white noise.
In Lisbon, however, a peak in 2008 likely reflects the financial crisis, though it does not compromise model fit. To formally assess this structural break, the Chow test was applied, comparing model coefficients before and after 2008, with results for the three regions (Table 1).
In view of the results and given that there is statistical evidence not to reject the hypothesis being tested, it can be concluded that any structural break is not significant. To support this conclusion, we present some results for two sub-periods, pre-crisis from 2004 to 2007, and post-crisis from 2008 to 2012, specifically the graphs of the series (Figure 8).
Graphically, the structure of the evolution of the number of overnight stays in the three regions has remained the same.
These diagnostic results not only validate the adequacy of the SARIMA models but also provide substantive insights into how crises have shaped tourism demand. For instance, the evidence of a peak in 2008 in Lisbon reflects the financial crisis, even if not statistically significant across regions, while the structural break associated with COVID-19 confirms the depth of the disruption. The residual dynamics, including episodes of heteroscedasticity and outliers, further illustrate the uneven vulnerability of different regions to external shocks. Thus, beyond their statistical relevance, these findings reinforce the importance of interpreting crises not merely as temporary disturbances but as events that reshape regional tourism trajectories in distinctive ways. In summary, the SARIMA models applied to Lisbon, Algarve, and the total NUTS II regions proved to be valid and reliable econometric approaches for capturing the dynamics of tourism demand.

4.1.2. Forecast

Forecasting future values for a series of overnight stays in the three regions is one of the crucial objectives of this study. At the same time, we present the graphs (Figure 9) with the adjusted series and the forecasts based on a 95% confidence interval, until the year 2024, with historical data until 2020.
In Lisbon, values show consistent seasonal growth, with the forecast well calibrated up to 2020 and increasing uncertainty thereafter, especially from 2022. The Algarve exhibits strong seasonality and a gentle upward trend until 2020, which is expected to continue, albeit with wider confidence intervals, due to its dependence on tourism and economic factors. For the total NUTS II regions, growth and seasonality are clear, with forecasts fitting well until 2020 and increasing uncertainty afterward, while the upward trend suggests moderate economic recovery.
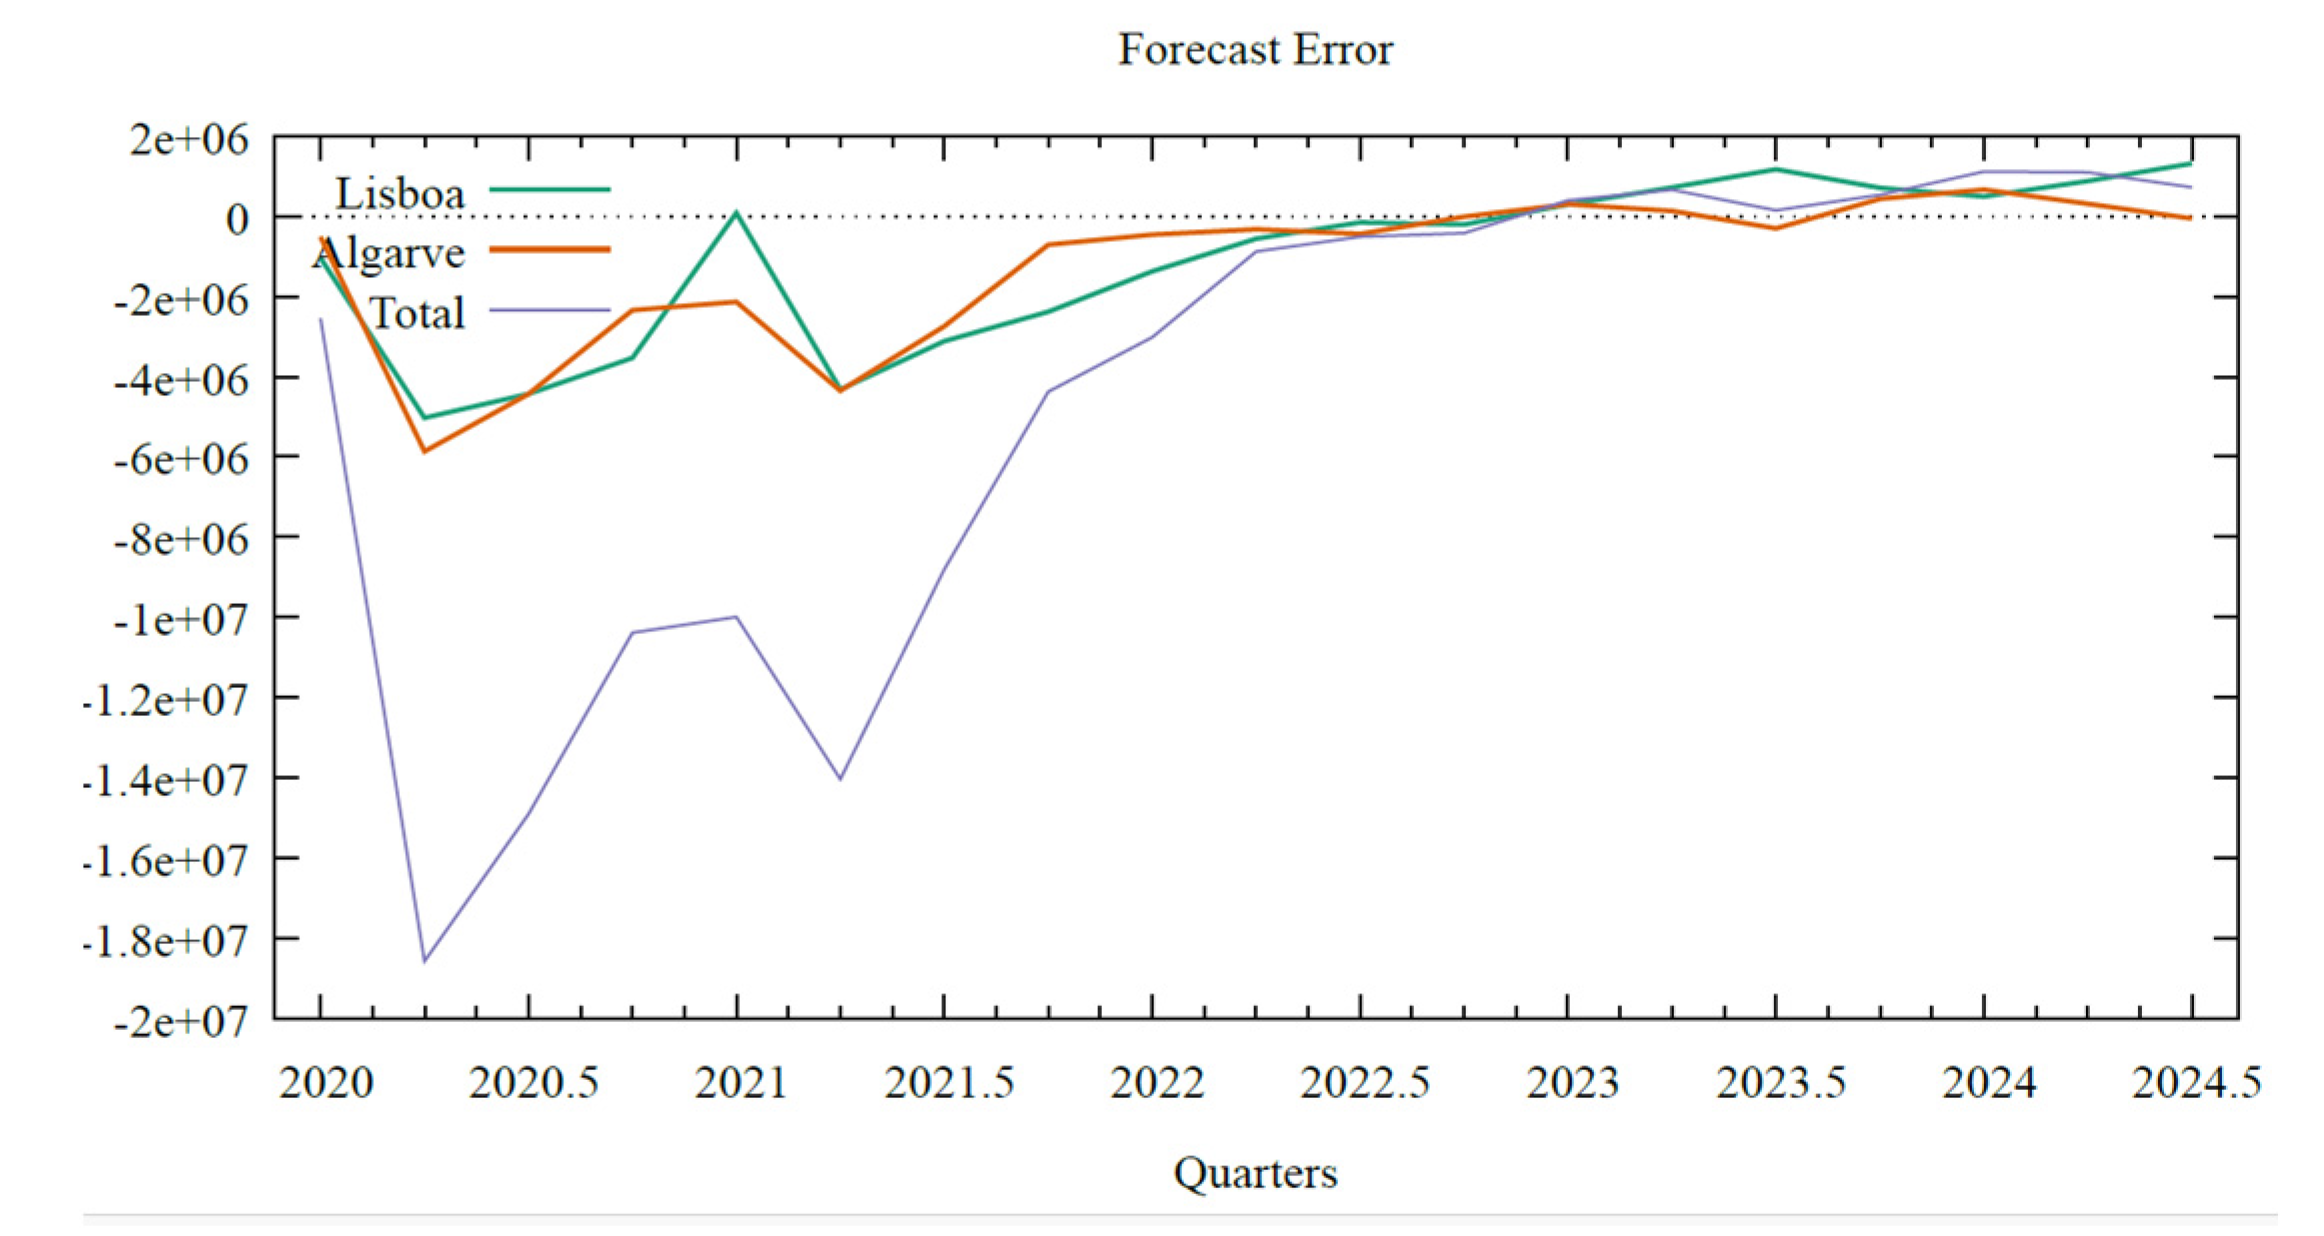
Below are the metrics for assessing accuracy and a joint graph of the forecast error (see Table 2).
If the MAPE value is less than 10 per cent for any of the regions, it suggests perfect forecasts. On the other hand, based on the U-Theil’s value, values close to 0 indicate that the model has good accuracy.
However, analysing the graph in Figure 10, which shows the evolution of the forecast errors, and as would be expected, the forecast errors are very high during the pandemic period, so it can be concluded that this period has a marked effect on the forecasting effectiveness of the ARIMA models. In subsequent quarters, the graph shows that the errors are much less marked and are close to the zero line. There is no doubt that the pandemic period had structural effects on the Portuguese economy and on the tourism sector.
These forecasting results provide further insight into the differentiated regional impacts of crises. In Lisbon, the relatively stable seasonal pattern and moderate uncertainty suggest greater resilience and faster recovery capacity, consistent with the region’s diversified economic base. In contrast, the Algarve forecasts highlight pronounced seasonality and wider confidence intervals, underlining the structural dependence on international tourism and greater vulnerability to external shocks such as COVID-19. At the aggregate NUTS II level, the forecasts show an upward trend but with persistent uncertainty, suggesting that national recovery is uneven and strongly influenced by regional disparities. Importantly, the forecast errors peaking during the pandemic period confirm that COVID-19 represented a structural disruption of a magnitude not observed during the 2008 financial crisis, thereby answering one of the central research questions.

4.2. Analysis of Overnight Stays Data in Lisbon, Algarve, and Total NUTS II—Period Due 2020/2024

Applying the same procedure for the previous period, now for the series from 2020 to 2024, we can see the behaviour of the number of overnight stays in the regions under study (Figure 11).
Across all regions, the number of overnight stays shows an upward trend, with seasonal fluctuations between quarters. In 2020 and early 2021, figures declined due to the COVID-19 pandemic, with Lisbon disproportionately affected due to its higher reliance on international arrivals. From 2022 onwards, a rebound is evident, but seasonal fluctuations remain, and competition between coastal (Algarve) and urban (Lisbon) destinations persists. This confirms that while growth has resumed, structural patterns of demand-such as strong seasonality and regional differentiation-continue to shape tourism dynamics.

4.2.1. Identification, Estimation, and Evaluation of Diagnostics

To apply the same methodology, we have the model for the three regions.
For Lisbon, the model selected is S A R I M A ( 0 , 1 , 0 ) ( 1 , 0 , 0 ) , Figure 12, leading to better indicators in terms of forecasting.
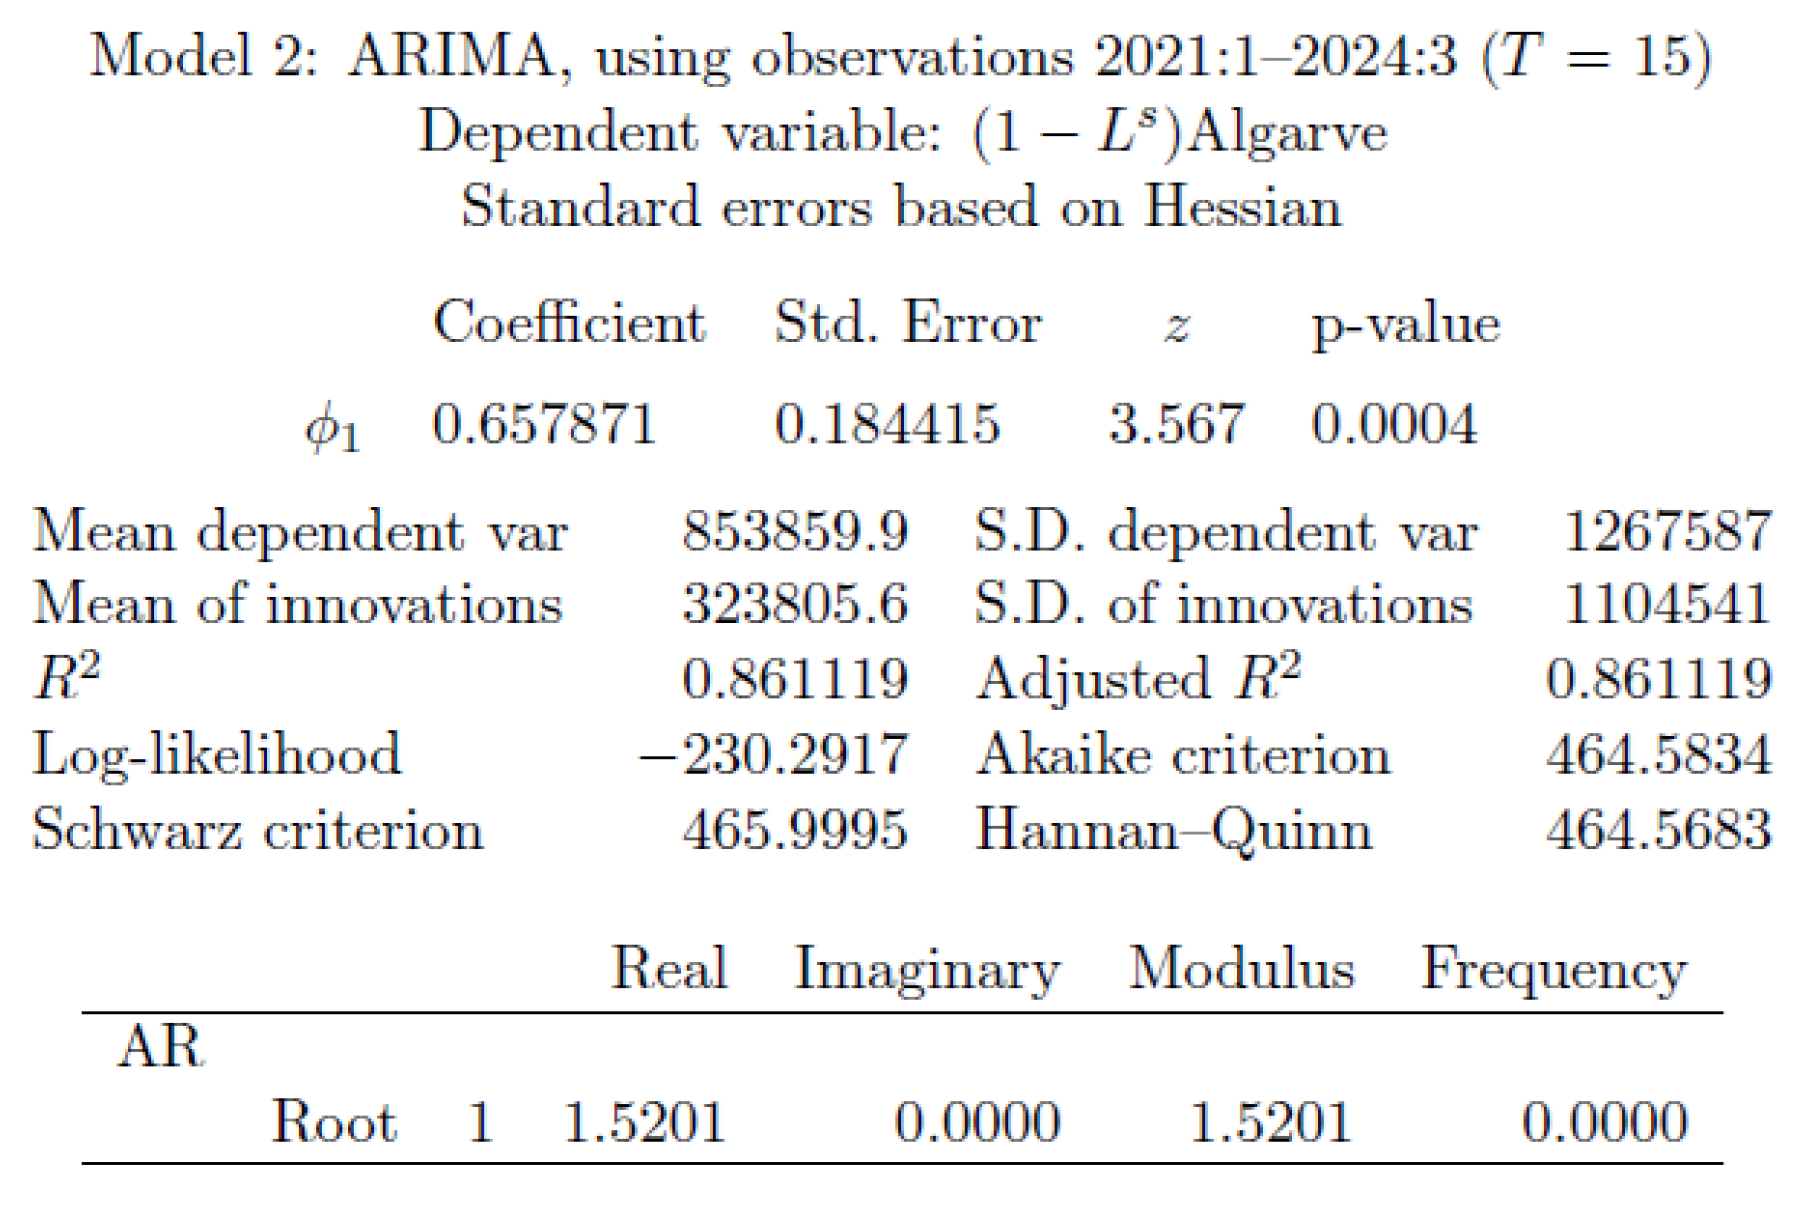
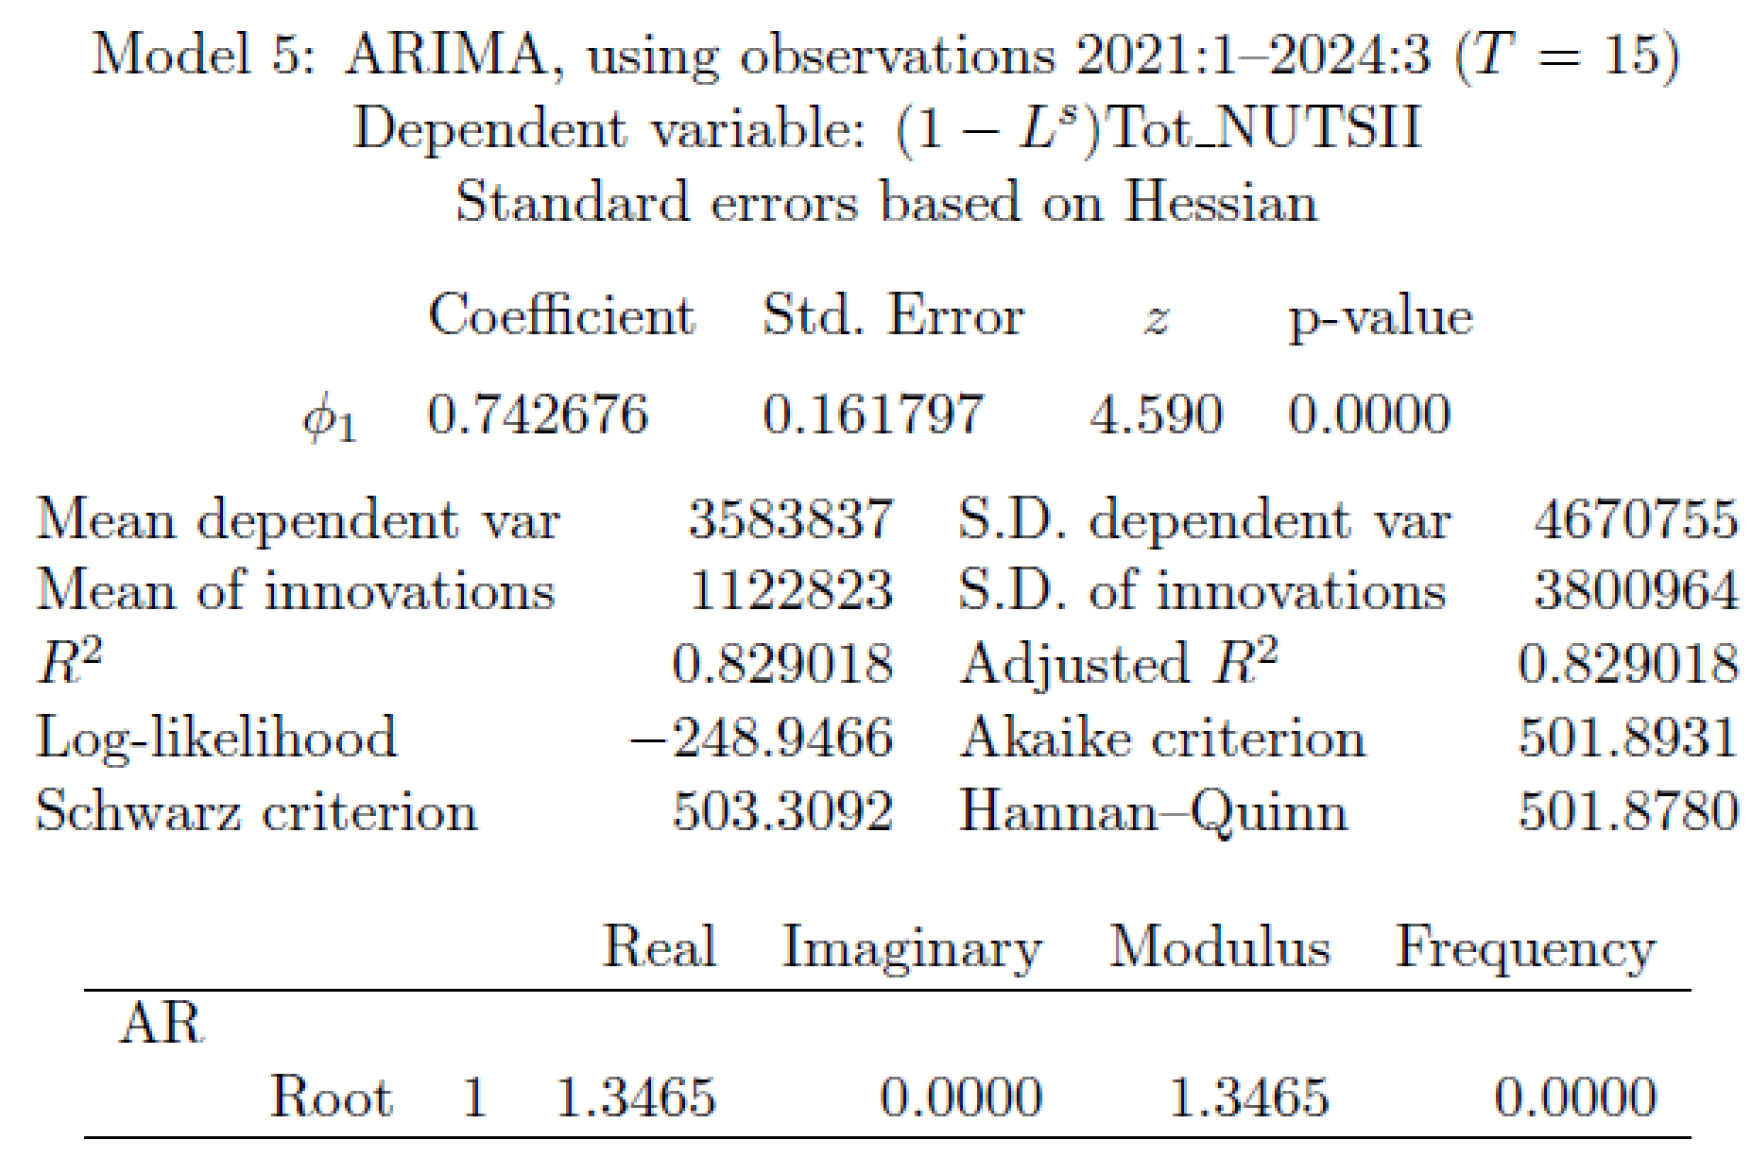
The model was identified and estimated for Algarve and for Total Nuts II, resulting in the following models (Figure 13 and Figure 14):
Based on what can be seen on selected models, and by analysing the statistical significance of the models’ coefficients, they are significantly different from zero, allowing us to conclude that the models are well identified.
The assessment of statistical quality, as explained above, considers the analysis of the residuals of the estimated models. Below are the respective graphs of the residual series (Figure 15, Figure 16 and Figure 17).
For the Lisbon region, between 2021 and 2022, the residuals appear to be larger, indicating greater variability, which could be explained by the pandemic crisis. From 2023 onwards, the residuals appear to be more stabilised, suggesting that the model can be used more accurately to make more consistent forecasts.
In the Algarve region, residuals oscillate around zero but show varying dispersion over time, suggesting possible heteroscedasticity. Some cyclical patterns hint at autocorrelation; however, the ACF and PACF indicate that no lagged values are significantly correlated. Overall, despite minor deviations from white noise, the fitted ARIMA model appears to capture the underlying data structure effectively.
For the total NUTS II regions, residuals exhibit changing variance, indicating heteroscedasticity. The sharp drop in tourism during 2020–2021, due to pandemic travel restrictions, was followed by a strong recovery in 2022–2024, contributing to this volatility. To better account for these fluctuations, an ARIMA–GARCH model could be considered, potentially bringing the residuals closer to white noise.
Taken together, these findings reveal that while standard SARIMA models are adequate for regional short-term forecasting, macro-level volatility in tourism demand may require models capable of handling time-varying variance. Importantly, the analysis highlights not only the statistical properties of the models but also the structural differences in recovery patterns between urban and coastal regions.

4.2.2. Forecast

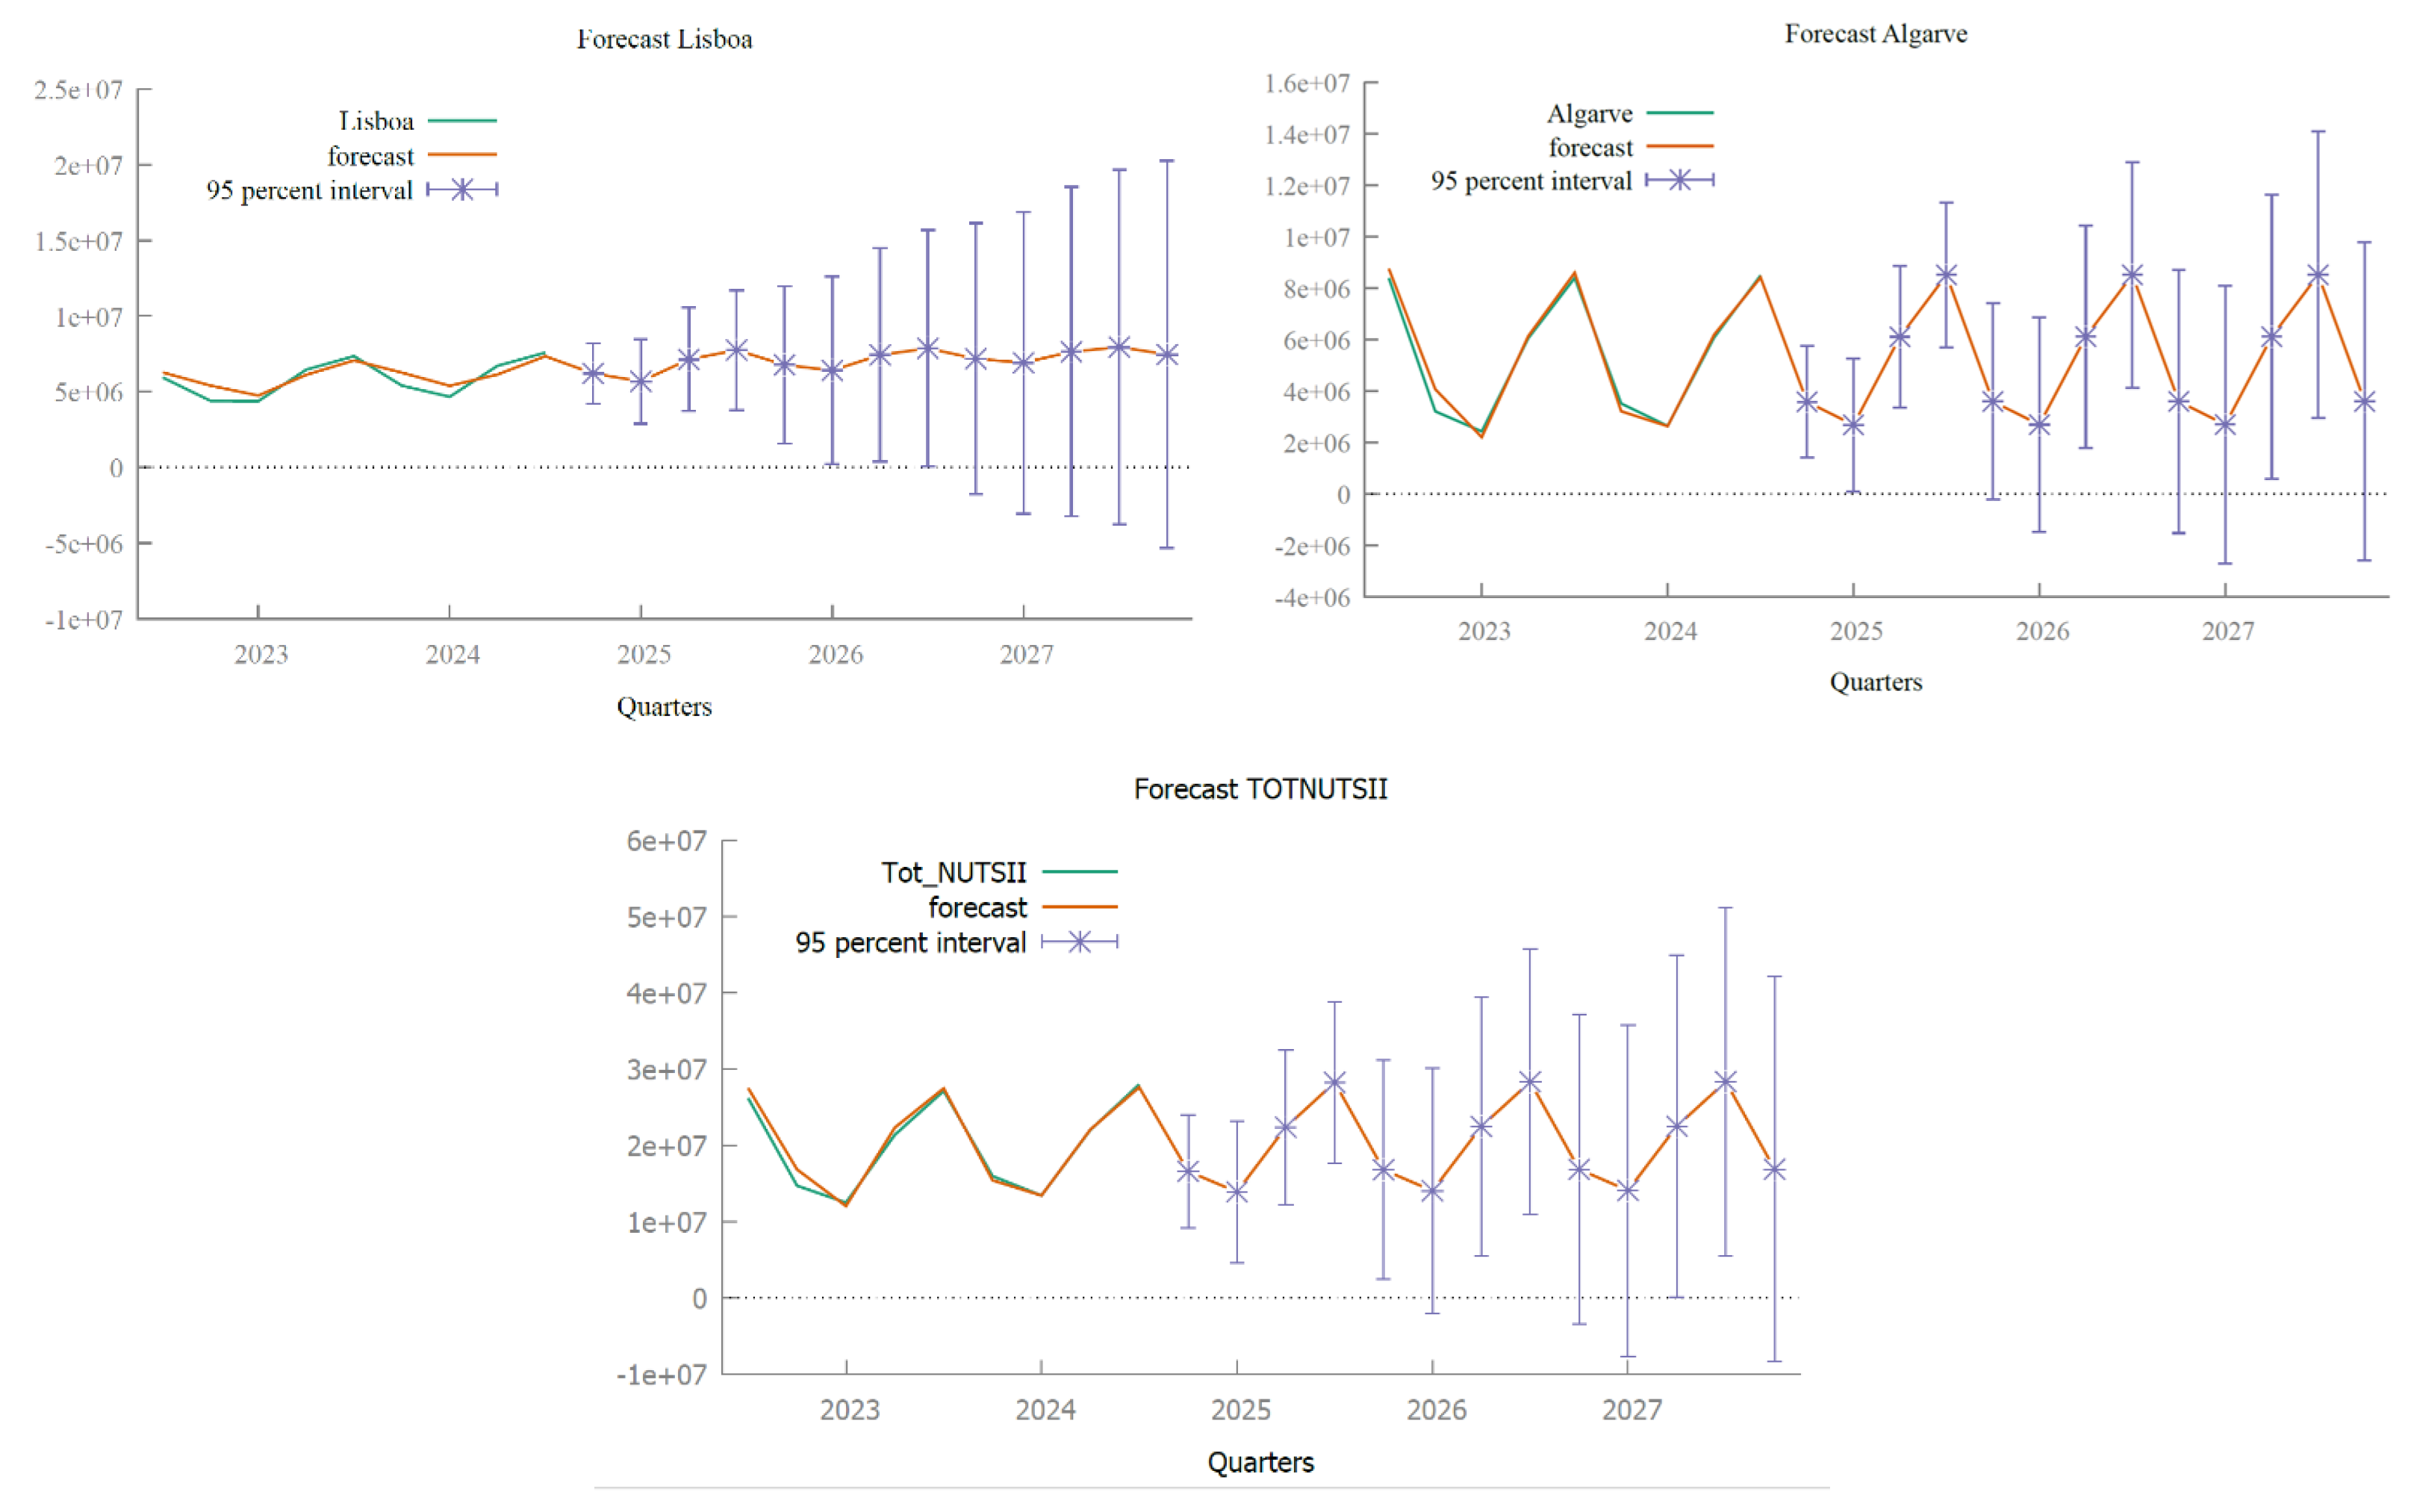
Forecasting overnight stays in the three regions is an objective of this study. Figure 18 presents the adjusted series and forecasts up to 2027 with 95% confidence intervals, along with accuracy metrics and a combined forecast error graph.
In Lisbon, the series shows moderate fluctuations before the forecast period (2023–2024), with a gradual increase projected for 2025–2027. The Algarve exhibits clear seasonal patterns, with forecasts suggesting stable or slight growth. For the total NUTS II regions, despite seasonal oscillations, a gradual upward trend is expected. In all regions, uncertainty increases over time, as reflected by progressively wider confidence intervals toward 2026–2027.
High MAPE and U-Theil values (Table 3) indicate poor forecast accuracy, particularly for Lisbon and the Algarve. The series begins in 2020, during the pandemic, which caused a structural shock, increased volatility, and altered sector behaviour. To improve forecasts, the 2020–2021 data could be excluded or smoothed, or models better suited to structural breaks could be applied.
These results are not only statistically relevant but also offer insights for tourism management: urban destinations such as Lisbon may require strategies to mitigate external shocks, while coastal regions like the Algarve need to address persistent seasonality. At the national level, recognising structural volatility suggests that forecasting tools should integrate heteroscedastic models to improve the resilience of policy planning.

4.3. Impact of External Shocks (Financial Crises and Pandemics) on the Number of Overnight Stays

Impacts of the Financial by NUTS II Regions

The 2008 financial crisis, resulting from market deregulation, had a profound impact on tourism in Portugal, reflected in reduced investment, declining consumer confidence, and decreases in overnight stays and occupancy rates across several regions, with unequal intensity between Lisbon, the Algarve, and other NUTS II territories. This vulnerability of the sector highlights the need to strengthen its resilience and sustainability, in line with the Sustainable Development Goals (SDGs). SDG 8 (Decent Work and Economic Growth) underscores the importance of fostering tourism that is less exposed to global financial shocks; SDG 10 (Reduced Inequalities) draws attention to the asymmetric effects of the crisis across regions; SDG 11 (Sustainable Cities and Communities) stresses the role of balanced management of urban and coastal destinations; and SDG 12 (Responsible Consumption and Production) reinforces the need for more balanced models of tourism consumption. Thus, the experience of the crisis demonstrates that the sustainability of tourism depends not only on environmental factors but also on its economic and social robustness in the face of external crises.
A summary, in Table 4, is presented with the quarterly unit rates of change in three different periods: 2007 to 2008, which reflects the period before and during the crisis; 2008 to 2009, during and after the crisis; and 2009 to 2010, the post-crisis period, to verify the recovery or persistence of the effects.
In 2008, the tourism sector in Portugal was deeply affected by the global financial crisis that broke out in the middle of the year. This impact was reflected in the quarterly rates of change in the number of overnight stays in the country’s main tourist regions: Lisbon, the Algarve, and the NUTS II.
In 2008, the global financial crisis led to a sharp decline in tourism in Portugal, with the steepest drops occurring in the third and fourth quarters of that year. The Algarve, being more dependent on international tourism, was the most affected region.
In 2009, the first quarter continued to show strong declines, but Lisbon started to recover by the end of the year, while the Algarve still faced significant losses. At the national level, the downturn eased, marking the beginning of a gradual stabilisation.
In 2010, the sector entered a recovery phase, with Lisbon recording consistent growth in all quarters. The Algarve recovered more slowly but achieved positive results in the third and fourth quarters. Overall, Portugal experienced a progressive rebound, particularly in the second half of the year, which marked a positive turning point for tourism.
The quarterly variations in overnight stays observed in 2009 and 2010 are consistent with the results of the Chow test. For Lisbon, Algarve, and Total NUTS II, the test for a structural break at the first quarter of 2008 yielded very high p-values (0.9972, 0.9497, and 0.9870, respectively), indicating no evidence of a significant structural change in the series. This suggests that the 2008 financial crisis did not cause a permanent break in the historical trend of overnight stays, and that ARIMA models based on the full time series remain valid and robust despite short-term fluctuations during the crisis.
Brexit had a significant impact on overnight stays in all of Portugal’s NUTS II regions, given their strong dependence on UK tourists as an inbound market. Although Brexit and the COVID-19 pandemic overlapped in time, they should be analysed separately to identify their specific effects. However, since the data does not distinguish British holidaymakers, this will not be a priority in this article. Brexit (effective from 2021) introduced bureaucratic barriers, visa requirements, and exchange rate fluctuations, which may have reduced the flow of British tourists to Portugal. From a theoretical perspective, if the decline after 2021 is observed only in relation to UK visitors, this would point to a specific Brexit effect. In sustainability terms, this reinforces the importance of SDG 8 (Decent Work and Economic Growth) and SDG 11 (Sustainable Cities and Communities), as reducing dependency on a single source market is key to building a more resilient and sustainable tourism sector.
COVID-19 has had a drastic impact on tourism due to travel restrictions, causing sharp falls and irregular recoveries. We will now analyse the impact of COVID-19 through the year-on-year rates of change in quarterly overnight stays in Portugal’s NUTS II regions, starting by analysing behaviour in the pre-pandemic vs. pandemic period, while also considering implications for sustainable tourism development in line with the UN Sustainable Development Goals (SDGs), particularly those related to economic resilience, decent work, and responsible consumption.
The immediate impact, measured by the rates of change in the quarters from 2020 to 2019 (Table 5), reflects the period with the greatest restrictions.
According to the information above, the most severe impact occurred in the 2nd quarter of 2020, largely due to lockdowns and travel restrictions caused by the pandemic crisis, with decreases of over 90% in all regions. The Lisbon region was the most affected, especially in the 2nd and 4th quarters. The Algarve, despite the sharp declines, performed relatively better in terms of overnight stays, particularly in the 3rd quarter, which may suggest some degree of recovery through domestic or international tourism, albeit limited. The Total NUTS II followed the trend of the Lisbon and Algarve regions, reflecting the national pattern.
In the subsequent recovery phase, we analysed the quarters of 2021 compared with 2020 (Table 5), as well as the rates of change for 2022 compared with 2019, to assess whether overnight stays had returned to pre-pandemic levels.
Between 2020 and 2021, both Lisbon and the Algarve were severely impacted by the pandemic, recording historic falls in 2020 and a slow recovery in 2021. From the 2nd quarter of 2021 onwards, variations turned slightly positive, with Lisbon reaching the maximum growth rate (3.8%). Nevertheless, these figures reveal the persistence of restrictions and the sluggish recovery of the tourism sector. Overall, Lisbon was the region most affected during the period, while the Algarve showed some seasonal resilience. Both territories, however, ended 2021 still well below pre-pandemic levels.
The comparison between 2022 and 2019 (Table 6) allows us to gauge the degree of structural recovery after two years of pandemic impact. The evolution of the Lisbon and Algarve regions shows that, despite some positive signs, the sector was still recovering, with results still below pre-pandemic levels. In the 1st quarter, both regions showed sharp falls compared to 2019: Lisbon (−25.4%) and the Algarve (−23.6%), revealing a still fragile recovery at the start of the year. In the 2nd quarter, there was almost a complete recovery in Lisbon (−1.9%), while the Algarve saw a more significant drop (−7.8%). The 3rd quarter, historically the strongest for tourism, showed an increase in Lisbon (+3.1%), but a decrease in the Algarve (−6.9%), showing a reversal from previous years when the Algarve was more resilient in the summer. In the 4th quarter, Lisbon grew again compared to 2019 (+3.9%), while the Algarve remained below the pre-pandemic level (−3.5%). In short, Lisbon surpassed 2019 levels in the last two quarters, demonstrating a more solid recovery, while the Algarve remained below pre-pandemic values throughout the year, suggesting a slower and more uneven recovery between regions.
Between 2020 and 2022 (Table 5 and Table 6), Lisbon and the Algarve faced sharp falls due to the pandemic, with a slow and uneven recovery over the years. The year 2020 was the most critical: falls of over 90 per cent in the 2nd quarter in both regions. Lisbon was the worst affected overall, with sharper falls in all quarters. The year 2021 marked the beginning of a recovery, but still with very modest variations. The Algarve had a weak summer, and Lisbon recovered slightly better in the 2nd quarter. The year 2022 shows a more evident recovery in Lisbon, which surpassed 2019 levels in the last few quarters. The Algarve, on the other hand, remained below pre-pandemic values throughout the year, signalling a slower recovery.
Finally, to assess the long-term trend, comparing 2023 with 2019 makes it possible to see whether the recovery has been sustained and whether structural changes are possible. Comparing the number of overnight stays in 2024 with 2019 aims to assess the recovery (or change) in 2024 (Table 7).
In 2023, compared to 2019 levels, the trends in the Lisbon and Algarve regions are quite different. Lisbon showed a strong recovery in all quarters, with consistent growth of between +24.9% and +27.7%, signalling a solid and sustained recovery, well above pre-pandemic levels. The Algarve had a more irregular behaviour, with growth in the 1st quarter (+2.3%), followed by falls in the 2nd (−2.7%) and 3rd quarters (−6.8%), even in high season. Only in the 4th quarter was there a visible recovery (+5.7%).
Lisbon’s superior performance in 2024 compared to the Algarve can be attributed to a combination of factors. The Lisbon region has benefited from a diversified tourist profile, the recovery of urban and business tourism, and greater international appeal. In contrast, the Algarve has faced challenges due to the seasonality of tourism, growing competition, and changing tourist preferences. These factors, combined with economic difficulties, partly explain the region’s weaker performance. Additionally, the Algarve has traditionally been heavily dependent on the British market. Fluctuations in the UK economy and potential post-Brexit challenges, such as the devaluation of the pound and higher travel costs, may have negatively impacted the number of overnight stays by British tourists in the Algarve in 2024.
From a sustainability perspective, Lisbon has been able to leverage more diversified and year-round tourism activities, contributing to more resilient and balanced development aligned with sustainable tourism principles, while the Algarve’s dependence on seasonal and international markets underscores the need to promote sustainable practices that reduce vulnerability and enhance long-term economic and environmental resilience.
To better contextualise these findings, it is important to compare the relative impacts of the 2008 financial crisis and the COVID-19 pandemic on Portuguese tourism, assessing not only the magnitude of the declines but also the speed and nature of the subsequent recovery.
In comparative terms, the 2008 financial crisis and the COVID-19 pandemic affected tourism in Portugal through different mechanisms and with contrasting magnitudes. The financial crisis led to relevant short-term declines, particularly in the Algarve, but recovery began within two years, and no permanent structural break was detected in the series, as confirmed by the Chow test. In contrast, the pandemic caused unprecedented contractions of more than 90% in the second quarter of 2020, with a slower and more uneven recovery across regions. Lisbon proved more resilient in the medium term due to a more diversified tourism profile, while the Algarve remained more vulnerable to seasonal dependence and exposure to specific source markets. Overall, COVID-19 had the most severe and persistent impact, fundamentally altering the trajectory of tourism recovery, while the 2008 crisis mainly exposed vulnerabilities without changing the sector’s long-term growth potential.

5. Results and Discussion

In this study, the Box and Jenkins methodology [28] was applied to the series of quarterly overnight stays by NUTS II regions in Portugal, with the main objective of assessing the impacts of the financial and pandemic crises. The graphical representation of the series revealed structural breaks, indicating abrupt changes that could challenge the applicability of SARIMA models.
The ARIMA and SARIMA estimations successfully captured the strong seasonal variation in Portuguese overnight stays across NUTS II regions. Forecast accuracy indicators were satisfactory, with mean absolute percentage error (MAPE) values consistently below 8% and Theil’s U statistics consistently below 0.4, demonstrating reliable predictive performance. Structural break tests confirmed significant shifts in demand associated with the global financial crisis of 2008 and the pandemic caused by the SARS-CoV-2 virus. In contrast, the impact of Brexit was more modest and concentrated in regions heavily dependent on the British market, such as the Algarve.
Lisbon exhibited a faster recovery trajectory following both the 2008 crisis and the impact of the pandemic, reflecting its diversified demand base and robust position in business and city tourism. In contrast, the Algarve showed greater volatility and a slower recovery, which is consistent with its high reliance on seasonal international visitors, particularly from the United Kingdom. The Northern and Central regions displayed comparatively resilient patterns, underpinned by more balanced demand structures and domestic tourism.
Crisis episodes reshaped the spatial distribution of demand. Forecasts suggest a shift towards less crowded, inland destinations in the post-pandemic period, reflecting changes in consumer preferences regarding safety, space, and sustainability. This reallocation of flows poses challenges for traditional mass destinations and presents opportunities for regions with underutilised capacity.
Overall, the results confirm that external crises have a differential impact on different regions and that ARIMA/SARIMA models are robust tools for capturing these dynamics and supporting policy planning.
Our findings reinforce the established view that tourism is highly vulnerable to crises (see, for example, [2,4]). However, adopting a regional perspective reveals how structural characteristics influence resilience. Lisbon’s quicker recovery emphasises the importance of diversification and connectivity, whereas the Algarve’s greater exposure highlights the risks of relying on a single international market. This corroborates earlier findings in Southern Europe that emphasise the significance of market composition in shaping the impact of crises [12,21]. This regional differentiation is central to the research design, as it highlights asymmetries that policymakers must address.
From a methodological standpoint, the study confirms the suitability of ARIMA/SARIMA models for forecasting tourism demand in the presence of seasonality and autocorrelation. Although machine learning approaches have been proposed as an alternative [19], our results demonstrate that transparent, statistically grounded models continue to be valuable, especially when policy relevance and interpretability are priorities. At the same time, the structural breaks identified during the crises emphasise the need for models to account for shocks and discontinuities—a limitation that should inform future methodological innovation.
Importantly, the results are consistent with the discourse on sustainability. The relative growth of less crowded inland destinations since the onset of the pandemic suggests an opportunity to redistribute demand, mitigate overtourism in popular destinations, and support more balanced regional development. This aligns with SDG 8 (Decent Work and Economic Growth) as it promotes resilience in employment—intensive sectors and with SDG 9 (Industry, Innovation and Infrastructure) as it highlights the importance of adaptive regional planning. Furthermore, the strengthening of cooperation between academia, policymakers, and statistical agencies advocated in this study contributes to the achievement of SDG 17 (Partnerships for the Goals).
Nevertheless, limitations must be acknowledged. Firstly, reliance on univariate time-series models excludes explanatory variables such as exchange rates, consumer confidence, or airline capacity, which could enhance our understanding of the effects of crises. Secondly, although quarterly data capture seasonality, higher-frequency datasets (monthly or even weekly) could reveal additional dynamics. Thirdly, this study focused on overnight stays, leaving other indicators such as tourist receipts, average expenditure, and employment for future research.
In summary, the discussion highlights that crises are both a source of vulnerability and a catalyst for transformation. Acknowledging regional differences and incorporating forecasting tools into strategic planning are essential for enhancing resilience and promoting sustainable tourism development in Portugal.

Contributions to the GRI Standards and Territorial Sustainability

In addition to the econometric analysis of the impact of financial and pandemic crises on regional tourism in Portugal, the results of this study can be interpreted in the context of the Global Reporting Initiative (GRI) standards. These standards provide an international benchmark for monitoring and reporting on economic, social, and environmental sustainability, and are widely adopted by entities in the public, private, and third sectors. Applying these standards to regional tourism enables sustainability to be implemented in a measurable way, particularly through indicators showing economic performance, indirect impacts, local community involvement, and organisational resilience.
The territorial breakdown by NUTS II and the focus on the differentiated effects of the crises mean that the GRI indicators can be used to link empirical results with the Sustainable Development Goals (SDGs). Specifically, these are SDG 8 (Decent work and economic growth), SDG 9 (Industry, innovation and infrastructure), and SDG 17 (Partnerships for the implementation of the goals).
This correspondence is based on official United Nations Sustainable Development Goal benchmarks [31] and Global Reporting Initiative Standards [32], as well as recent scientific literature discussing sustainability metrics in tourism and resilient planning approaches [2,23,33].
Table 8 shows the links between the study’s main conclusions, the relevant SDGs, and the GRI Standards for sustainable tourism reports.
The link between the empirical results obtained in this study and the GRI indicators shows that regional econometric analyses can inform not only the formulation of public policy, but also concrete, sustainable reporting and planning practices. This correspondence enables scientific evidence to be translated into actionable indicators, thereby reinforcing the usefulness of data in developing more resilient, inclusive, and data-driven tourism strategies. By aligning with both the Sustainable Development Goals (SDGs 8, 9, and 17) and the GRI Standards, this study helps to create a more transparent, territorially sensitive, and forward-looking model of tourism.

6. Conclusions and Future Research

This study analysed the impact of three major crises—the 2008 financial crisis, Brexit, and the Coronavirus pandemic—on Portuguese tourism at the NUTS II level. Quarterly data from 2004 to 2024 was used, alongside ARIMA/SARIMA forecasting models. The results showed that crises significantly altered regional demand patterns, with stronger and more persistent effects in regions that were heavily dependent on international flows, such as the Algarve. In contrast, regions with a more diversified economy, such as Lisbon, showed greater resilience. This vulnerability reflects the region’s high dependence on international tourism, mainly from the UK, limited diversification, and pronounced seasonality.
Future research should consider alternative econometric approaches, including autoregressive models with structural breaks, panel data, and state-space methods, as well as the integration of exogenous variables such as the type of accommodation, turnover, macroeconomic indicators, flight arrivals, and climate conditions. To improve forecasting accuracy, special attention should be given to structural breaks, for instance by smoothing or excluding the 2020–2021 data. Such methodological refinements can enhance predictive performance and provide more robust and comprehensive insights to support evidence-based policymaking in the tourism sector.
Furthermore, the analysis demonstrates the relationship between the results and international sustainability standards, such as those of the Global Reporting Initiative (GRI) [33]. The study demonstrates that the data can be used for forecasting, planning, monitoring, and reporting in accordance with the principles of sustainability and good governance in tourism.

7. Practical Implications and Policy Contributions

The findings of this study significantly contribute to the formulation of public policy and the management of regional tourism in the context of tourism-related crises, as well as to academic research in this field.
The policy implications emphasise the importance of aligning tourism development with SDG 8 (economic resilience and employment), SDG 9 (innovation and infrastructure for adaptation), and SDG 17 (partnerships for governance). Cooperation between academia, statistical authorities, and policymakers is vital for monitoring, forecasting, and preparing for future shocks.
In terms of practical contributions, the study does not prescribe specific regional policies; however, the results can serve as indirect indicators for policymakers. The observed asymmetries between regions such as Lisbon and the Algarve, as well as the relative resilience of inland destinations since the onset of the pandemic, provide valuable signals that may support informed decision-making. These findings can be interpreted as inputs for discussions on market diversification, regional planning, and the monitoring of structural vulnerabilities in tourism. Rather than offering prescriptive guidance, the study highlights empirical evidence that can be considered alongside other economic, social, and environmental factors when designing recovery strategies and evaluating progress towards the SDGs.
In terms of scientific contributions, the study applied ARIMA/SARIMA models to long-term regional data, demonstrating the robustness of these models for forecasting in crisis contexts and emphasising the importance of structural break testing. Combining econometric forecasting with sustainability concerns advances methodological integration in tourism research.
While the ARIMA/SARIMA framework proved effective, future research should extend to multivariate and machine learning approaches, incorporate alternative indicators of tourism performance, and examine broader sustainability dimensions. In this way, tourism forecasting can evolve into a comprehensive tool for promoting resilience, recovery, and sustainable policy planning.

Author Contributions

M.d.C.: Investigation, Project administration, Data collection, Supervision, Writing—Original draft, Writing—Review and editing. T.F.: Conceptualisation, Investigation, Data collection, Resources, Validation, Writing—Original draft, Writing—Review and editing. S.C.: Data curation, Formal analysis, Methodology, Resources, Validation, Writing—Original draft, Writing—Review and editing. All authors have read and agreed to the published version of the manuscript.

Funding

This research received no external funding.

Institutional Review Board Statement

Not applicable.

Informed Consent Statement

Not applicable.

Data Availability Statement

The original contributions presented in this study are included in the article. Further inquiries can be directed to the corresponding author.

Acknowledgments

The authors are pleased to acknowledge the financial support from Lisbon Accounting and Business School—Lisbon Polytechnic Institute, Portugal (ISCAL-IPL).

Conflicts of Interest

The authors declare no conflicts of interest.

References

  1. WTTC Travel & Tourism Council. WTTC Travel & Tourism Economic Impact 2023: Portugal; WTTC Travel & Tourism Council: London, UK, 2023. [Google Scholar]
  2. Gössling, S.; Scott, D.; Hall, C.M. Pandemics, Tourism and Global Change: A Rapid Assessment of COVID-19. J. Sustain. Tour. 2020, 29, 1–20. [Google Scholar] [CrossRef]
  3. UN World Tourism Organization. UNWTO Tourism and COVID-19: A Global Review for Tourism Policy Makers; UN World Tourism Organization: Madrid, Spain, 2021; Available online: https://www.untourism.int/un-tourism-news-28 (accessed on 15 May 2025).
  4. Papatheodorou, A.; Rosselló, J.; Xiao, H. Global Economic Crisis and Tourism: Consequences and Perspectives. J. Travel Res. 2010, 49, 39–45. [Google Scholar] [CrossRef]
  5. OECD. OECD Strengthening the Evidence Base for a Sustainable Tourism Future in Portugal: A Tailored Set of Sustainability Indicators; OECD: Paris, France, 2025; Available online: https://www.oecd.org/en/publications/strengthening-the-evidence-base-for-a-sustainable-tourism-future-in-portugal_e362c609-en.html (accessed on 15 May 2025).
  6. Mueller, R.; Sobreira, N. Tourism Forecasts after COVID-19: Evidence of Portugal. Ann. Tour. Res. Empir. Insights 2024, 5, 1. [Google Scholar] [CrossRef]
  7. Baum, T.; Hai, N.T.T. Hospitality, Tourism, Human Rights and the Impact of COVID-19. Int. J. Contemp. Hosp. Manag. 2020, 32, 2397–2407. [Google Scholar] [CrossRef]
  8. OECD. Mitigating the Impact of COVID-19 on Tourism and Supporting Recovery. In OECD Tourism Papers; OECD Publishing: Paris, France, 2020; Available online: https://www.oecd.org/en/publications/mitigating-the-impact-of-covid-19-on-tourism-and-supporting-recovery_47045bae-en.html (accessed on 15 May 2025).
  9. Song, H.; Li, G. Tourism Demand Modelling and Forecasting—A Review of Recent Research. Tour. Manag. 2008, 29, 203–220. [Google Scholar] [CrossRef]
  10. Goh, C.; Law, R. The Methodological Progress of Tourism Demand Forecasting: A Review of Related Literature. J. Travel Tour. Mark. 2011, 28, 296–317. [Google Scholar] [CrossRef]
  11. Hyndman, R.J.; Athanasopoulos, G. Forecasting: Principles and Pratice, 3rd ed.; OTexts: Melbourne, Australia, 2021. [Google Scholar]
  12. Massidda, C.; Etzo, I. The Determinants of Italian Domestic Tourism: A Panel Data Analysis. Tour. Manag. 2012, 33, 603–610. [Google Scholar] [CrossRef]
  13. Hall, C.M. Constructing Sustainable Tourism Development: The 2030 Agenda and the Managerial Ecology of Sustainable Tourism. J. Sustain. Tour. 2019, 27, 1044–1060. [Google Scholar] [CrossRef]
  14. Perles-Ribes, J.F.; Ramón-Rodríguez, A.B.; Sevilla-Jiménez, M.; Rubia, A. The Effects of Economic Crises on Tourism Success: An Integrated Model. Tour. Econ. 2016, 22, 417–447. [Google Scholar] [CrossRef]
  15. Dutta, A.; Mishra, T.; Uddin, G.S.; Yang, Y. Brexit Uncertainty and Volatility Persistence in Tourism Demand. Curr. Issues Tour. 2021, 24, 2225–2232. [Google Scholar] [CrossRef]
  16. Sass, K.S.; Maciel, R.F.; Dentinho, T.P. The Impact of COVID-19 on Tourism, Employment, and Population of the Azores Islands. Lett. Spat. Resour. Sci. 2023, 16, 42. [Google Scholar] [CrossRef]
  17. Silva, S.; Carvalho, P. Impact of COVID-19 on Summer Holiday Behaviours: Evidence from Portugal. ANATOLIA-Int. J. Tour. Hosp. Res. 2022, 33, 688–691. [Google Scholar] [CrossRef]
  18. Santos, R.; Castanho, R.A. Tourism and Sustainable Landscapes: A Portuguese Case. IntechOpen 2024. [Google Scholar] [CrossRef]
  19. Assaf, A.G.; Li, G.; Song, H.; Tsionas, M.G. Modeling and Forecasting Regional Tourism Demand Using the Bayesian Global Vector Autoregressive (BGVAR) Model. J. Travel Res. 2019, 58, 383–397. [Google Scholar] [CrossRef]
  20. Pan, M.; Liao, Z.; Wang, Z.; Ren, C.; Xing, Z.; Li, W. Tourism Forecasting: A Dynamic Spatiotemporal Model. Ann. Tour. Res. 2025, 110, 103871. [Google Scholar] [CrossRef]
  21. Perles-Ribes, J.F.; Ramón-Rodríguez, A.B.; Padilla, A.O. Brexit Announcement: Immediate Impact on British Tourism in Spain. Cornell Hosp. Q. 2019, 60, 97–103. [Google Scholar] [CrossRef]
  22. Burnett, M.; Johnston, T. Brexit Anticipated Economic Shock on Ireland’s Planning for Hospitality and Tourism: Resilience, Volatility and Exposure. Tour. Rev. 2020, 75, 595–606. [Google Scholar] [CrossRef]
  23. Rebola, F.; Loures, L.; Ferreira, P.; Loures, A. Inland or Coastal: That’s the Question! Different Impacts of COVID-19 on the Tourism Sector in Portugal. Sustainability 2022, 14, 16248. [Google Scholar] [CrossRef]
  24. Hajibaba, H.; Gretzel, U.; Leisch, F.; Dolnicar, S. Crisis-resistant tourists. Ann. Tour. Res. 2015, 14, 46–60. [Google Scholar] [CrossRef]
  25. Romão, J. Tourism, Smart Specialisation, Growth, and Resilience. Ann. Tour. Res. 2020, 84, 102995. [Google Scholar] [CrossRef]
  26. Almeida, F.; Silva, O. The Impact of COVID-19 on Tourism Sustainability: Evidence from Portugal. Adv. Hosp. Tour. Res.-AHTR 2020, 8, 440–446. [Google Scholar] [CrossRef]
  27. Lopes, A.; Sargento, A.; Carreira, P. Vulnerability to COVID-19 Unemployment in the Portuguese Tourism and Hospitality Industry. Int. J. Contemp. Hosp. Manag. 2021, 33, 1850–1869. [Google Scholar] [CrossRef]
  28. Box, G.E.; Jenkins, G.M.; Reinsel, G.C.; Ljung, G.M. Time Series Analysis: Forecasting and Control, 5th ed.; John Wiley & Sons: Hoboken, NJ, USA, 2015; ISBN 978-1-118-67502-1. [Google Scholar]
  29. Witt, S.F.; Witt, C.A. Modeling and Forecasting Demand in Tourism; Academic Press: London, UK, 1992; ISBN 0-12-760740-4. [Google Scholar]
  30. Pulido San Román, A.; Pérez García, J. Modelos Econométricos; Ediciones Pirámide: Madrid, Spain, 2001; ISBN-10: 8436815343, ISBN-13: 978-9436815344. [Google Scholar]
  31. United Nations Transforming Our World: The 2030 Agenda for Sustainable Development. United Nations General Assembly. 2015. Available online: https://www.unep.org/resources/report/transforming-our-world-2030-agenda-sustainable-development (accessed on 5 April 2025).
  32. GRI Standards. Global Reporting Initiative GRI Standards: Consolidated Set of GRI Sustainability Reporting Standards 2021; GRI Standards: Amsterdam, The Netherlands, 2021; Available online: https://www.globalreporting.org/media/zauil2g3/public-faqs-universal-standards.pdf (accessed on 10 April 2025).
  33. Ritchie, B.; Jiang, Y. A Review of Research on Tourism Risk, Crisis and Disaster Management: Launching the Annals of Tourism Research Curated Collection on Tourism Risk, Crisis and Disaster Management. Ann. Tour. Res. 2019, 79, 102812. [Google Scholar] [CrossRef]
Figure 1. Time Series Plot. Lisbon, Algarve, and regions NUTS II.
Sustainability 17 08896 g001
Figure 2. S A R I M A ( 0 , 1 , 0 ) ( 1,1 , 2 ) model. Lisbon.
Sustainability 17 08896 g002
Figure 3. S A R I M A ( 2,1 , 0 ) ( 1,1 , 2 ) model. Algarve.
Sustainability 17 08896 g003
Figure 4. S A R I M A ( 2,1 , 2 ) ( 0 , 1 , 2 ) model. Total NUTS II.
Sustainability 17 08896 g004
Figure 5. Time Series Plot Residuals. Residuals Autocorrelation Functions (ACF and PAF). QQ Plot. Lisboa.
Sustainability 17 08896 g005
Figure 6. Time Series Plot Residuals. Residuals Autocorrelation Functions (ACF and PAF). QQ Plot. Algarve.
Sustainability 17 08896 g006
Figure 7. Time series plot residuals. residuals autocorrelation functions (ACF and AF). QQ Plot. NUTS II.
Sustainability 17 08896 g007
Figure 8. Time series plot: overnight stays 2004–2007 and 2009–2012.
Sustainability 17 08896 g008
Figure 9. Forecast Lisbon, Algarve, and NUTS II (2020:1 to 2024:4).
Sustainability 17 08896 g009
Figure 10. Forecast error (2020:1 to 2024:4).
Sustainability 17 08896 g010
Figure 11. Time Series Plot. Lisbon, Algarve, and NUTS II regions.
Sustainability 17 08896 g011
Figure 12. S A R I M A ( 0 , 1 , 0 ) ( 1 , 0 , 0 ) model. Lisbon.
Sustainability 17 08896 g012
Figure 13. S A R I M A ( 1 , 0 , 0 ) ( 0 , 1 , 0 ) model. Algarve.
Sustainability 17 08896 g013
Figure 14. S A R I M A ( 1 , 0 , 0 ) ( 0 , 1 , 0 ) model. Total NUTS II.
Sustainability 17 08896 g014
Figure 15. Time series plot residuals and residuals PACF. Lisbon.
Sustainability 17 08896 g015
Figure 16. Time series plot residuals and residuals PACF. Algarve.
Sustainability 17 08896 g016
Figure 17. Time series plot residuals and residuals PACF. NUTS II.
Sustainability 17 08896 g017
Figure 18. Forecast Lisbon, Algarve, and NUTS II (2024:4 to 2027:4).
Sustainability 17 08896 g018
Table 1. Chow test for structural break at observation 2008:1.
Adjusted Model Region Lisbon: F 1,58 = 0.2843 with p - v a l u e = 0.5960
Adjusted Model Region Algarve: F 1,57 = 0.03002   with p - v a l u e = 0.8631
Adjusted Model Region NUTS II: F 1,57 = 0.101233   with p - v a l u e = 0.7515
Table 2. MAPE and U-Theil’s metrics.
RegionsMAPE (%)U-Theil’s
Lisbon3.20650.14819
Algarve4.55170.09923
Tot NUTS II3.42630.10866
Table 3. MAPE and U-Theil’s metrics.
RegionsMAPE (%)U-Theil’s
Lisbon71.451.1649
Algarve52.8441.3631
Tot NUTS II37.8081.6303
Table 4. Quarterly rate of change (%) 2008/2007, 2009/2008, and 2010/2009.
2008/2007 2009/2008
Quarters1ºQ2ºQ3ºQ4ºQ 1ºQ2ºQ3ºQ4ºQ
Regions
Lisbon9.0−0.7−4.8−13.0 −17.5−7.0−2.92.0
Algarve4.6−6.1−2.2−6.4 −21.4−6.2−6.7−10.8
Tot NUTS II8.6−2.8−1.6−6.9 −17.0−4.5−5.1−4.9
2010/2009
Quarters1ºQ2ºQ3ºQ4ºQ
Regions
Lisbon8.14.512.210.6
Algarve−2.3−4.78.23.2
Tot_NUTS II0.8−2.56.73.4
Table 5. Quarterly rate of change (%) 2020/2019 and 2021/2020.
2020/2019 2021/2020
Quarters1ºQ2ºQ3ºQ4ºQ 1ºQ2ºQ3ºQ4ºQ
Regions
Lisbon−22.7−95.2−74.8−79.8 −0.83.81.01.5
Algarve−19.0−93.6−49.5−68.9 −0.93.60.41.5
Tot_NUTS II18.7−92.8−55.9−70.1 −0.83.50.61.5
Table 6. Quarterly rate of change (%) 2022/2019.
2022/2019
Quarters1ºQ2ºQ3ºQ4ºQ
Regions
Lisbon−25.4−1.93.13.9
Algarve−23.6−7.8−6.9−3.5
Tot_NUTS II−19.0−0.22.95.8
Table 7. Quarterly rate of change (%) 2023/2019 and 2024/2019.
2023/2019 2024/2019
Quarters1ºQ2ºQ3ºQ4ºQ 1ºQ2ºQ3ºQ
Regions
Lisbon24.924.927.627.7 33.129.931.7
Algarve2.3−2.7−6.85.7 11.2−2.3−5.7
Tot_NUTS II13.88.66.614.8 22.311.910.0
Table 8. Adapted by the authors based on the Global Reporting Initiative (GRI Standards, 2021) and United Nations Sustainable Development Goals (UN SDGs, 2015).
Empirical FindingsSDGRelevant GRI IndicatorPractical Application
Asymmetric crisis impact across NUTS II regionsSDG 8GRI 203-2: Significant indirect economic impactsSupports regional mitigation policies and economic diversification strategies
Strong recovery in Lisbon vs. fragility in the AlgarveSDG 9GRI 201-1: Direct economic value generated and distributedInforms investment priorities in more resilient destinations
High dependency of the Algarve on the UK marketSDG 17GRI 102-15: Key impacts, risks, and opportunitiesHighlights the need for cooperative planning and market diversification
Relevance of time series forecanting and monitoringSDG 9GRI 102-10: Significant changes in operations and value chainEncourages integration of forecasting tools into institutional sustainability reporting
Structural vulnerability in highly seasonal destinationsSDG 8, 17GRI 413-1: Operations with local community engagementPromotes off-season tourism and local community capacity-building
Disclaimer/Publisher’s Note: The statements, opinions and data contained in all publications are solely those of the individual author(s) and contributor(s) and not of MDPI and/or the editor(s). MDPI and/or the editor(s) disclaim responsibility for any injury to people or property resulting from any ideas, methods, instructions or products referred to in the content.