Article

A Data-Driven Approach to Lean and Digital Process Re-Modeling for Sustainable Textile Production: A Case Study

1
Faculty of Engineering, Universidad Peruana de Ciencias Aplicadas, Santiago de Surco 15023, Peru
2
The European Institute for Advanced Behavioural Management, Saarland University, 66123 Saarbrücken, Germany
3
Faculty of Industrial Engineering, National University of San Marcos, Lima 15081, Peru
4
MIS Department, Faculty of Economics and Administrative Sciences, Izmir Democracy University, Izmir 35620, Türkiye
*
Author to whom correspondence should be addressed.
Sustainability 2025, 17(19), 8888; https://doi.org/10.3390/su17198888
Submission received: 11 July 2025 / Revised: 21 September 2025 / Accepted: 27 September 2025 / Published: 6 October 2025

Abstract

This study presents a data-driven framework that integrates lean management and digital business process modelling to enhance sustainability in textile manufacturing. Conducted in a company producing industrial safety textiles from Peru, this research applies lean tools within a digital BPM structure supported by real-time data tracking. The integrated approach led to increased production efficiency (from 79% to 86%), reduced setup times, and improved operational agility. The digital infrastructure empowered operators and supported informed decision-making. This work contributes to Industrial Engineering, Business Administration, and MIS by offering a holistic model that bridges lean principles with Industry 4.0 technologies. The findings, though context-specific, provide actionable insights for manufacturers aiming for smart and sustainable operations. Future research should validate the proposed framework across diverse industrial contexts and assess its longitudinal impact on lean performance outcomes.

1. Introduction

The global textile industry is undergoing a profound transformation, driven by shifting consumer expectations, intensifying international competition, and the progressive adoption of Industry 4.0 technologies. Increasing demands for speed, customization, and sustainability are challenging traditional production models, particularly in labor-intensive sectors such as apparel manufacturing. Although emerging technologies—including the Internet of Things (IoT), cyber–physical systems, and blockchains—hold promise for enhancing operational performance, their adoption in the textile sector remains fragmented and limited in scope [1].
In Peru, small and medium-sized textile enterprises (SMEs) continue to face persistent challenges such as outdated machinery, inefficient workflows, and minimal digital integration, which hinder productivity and global competitiveness [2]. While pilot implementations of lean tools like 5S and standardized work have shown localized improvements [3], more comprehensive interventions have demonstrated greater potential. For example, a recent study integrating lean–green methodologies reported a 120% increase in productivity, alongside significant reductions in water and electricity consumption in a textile dyeing facility [4]. However, such initiatives often lack systemic integration with digital technologies, highlighting the need for a cohesive framework that aligns lean practices, sustainability principles, and Industry 4.0 capabilities tailored to the operational realities of Peruvian textile SMEs.
Recent scholarship on Lean 4.0 emphasizes the importance of integrating traditional process improvement tools with digital enablers to support data-driven decision-making, real-time responsiveness, and continuous improvement [5,6]. Similarly, the evolution of Business Process Management (BPM) into digital BPM frameworks has introduced new possibilities for operational transparency, traceability, and agility—particularly when combined with sensor-based monitoring and IoT applications [1]. In parallel, sustainability-driven manufacturing models increasingly advocate for the operationalization of environmental and social goals beyond compliance, embedding them into core production processes through design optimization, resource efficiency, and closed-loop systems [4].
Sustainability in this context should be understood beyond waste reduction and ergonomics, encompassing broader environmental, economic, and social dimensions. These include energy efficiency, resource optimization, cost-effectiveness, and improved working conditions, all of which are increasingly critical for long-term competitiveness and resilience in emerging markets.
To address this gap, the present study proposes an integrated strategy that combines lean management tools—specifically Single-Minute Exchange of Dies (SMED), Systematic Layout Planning (SLP), and standardized work—with real-time sensor systems, embedded within a sustainability-oriented Industry 4.0 framework. These tools were selected due to their direct applicability to short-cycle textile production environments, where setup time, spatial efficiency, and workflow standardization are critical. Tools such as Six Sigma were excluded due to their statistical complexity and longer implementation cycles, which were not feasible within the scope of this case study.
The central research question guiding this investigation is as follows:
How can the combined implementation of SMED, SLP, standardized work, and real-time sensor systems improve efficiency and environmental outcomes in small-scale textile production?
This question is supported by sub-questions related to operational responsiveness, digital integration, and sustainability performance, which are addressed holistically through the proposed framework. Empirical evidence suggests that sensor-supported SMED can reduce setup times by approximately 30% and significantly enhance responsiveness [7]. A growing body of literature emphasizes the importance of unified Lean–Industry 4.0 frameworks to enable data-driven continuous improvement [5]. Moreover, the integration of design optimization with IoT and standardized workflows has been shown to reduce material waste and energy consumption. Recent studies on Lean 4.0 highlight the benefits of sensor-optimized lean tools in manufacturing environments [6].
This study adopts a case study methodology focused on a Peruvian textile SME characterized by persistent inefficiencies, low digital maturity, and high customization demands. The proposed framework aims to offer a scalable and replicable model that enhances competitiveness while supporting sustainable production practices in emerging market contexts. This research builds upon a full conference paper previously presented at a scientific event and incorporates feedback received during the presentation [8].
This paper is structured into five main sections: Literature Background, Methodology, Findings, Discussion, and Conclusions. The Literature Background (Section 2) reviews existing scholarship on lean management, Industry 4.0 technologies, and digital transformation in textile SMEs, identifying key gaps and theoretical foundations. The Methodology (Section 3) outlines the case study design, data collection techniques, and analytical procedures used to evaluate the framework. The Findings (Section 4) present empirical results related to operational efficiency, environmental performance, and digital integration. The Discussion (Section 5) interprets these results considering existing literature, assesses practical implications, and evaluates the scalability of the framework. Finally, the Conclusions (Section 6) summarize the study’s contributions, outlines limitations, and suggests directions for future research in sustainable and digitally enabled textile manufacturing.

2. Literature Background

2.1. Digitalization in Manufacturing and Supply Chain

In this section, we handled digital transformation tool applications in supply chain and operation management. This entailed a bibliometric analysis of AI and IoT integration on supply chain and operation management to benefit the analysis of the general picture of technology preferences in digital supply chain management and smart manufacturing [9]. According to this study, in the analysis results of the clustering topic analysis, seven different topics are AI and machine learning, the agri-food supply chain, cold chain logistics, smart grid and energy management systems, supply chain performance, water distribution systems, and smart manufacturing. Supply chain performance and smart production are very related with this study’s focus. This topic highlights the essential role of IoT, cloud computing, and advanced technologies in transforming supply chain management and risk assessment, ultimately driving improvements in efficiency, security, and competitiveness across these vital areas. Moreover, bibliometric and topic modeling analyses identify key technologies—such as the industrial Internet of Things, digital twins, cloud manufacturing, and big data analytics—as central themes in smart manufacturing research [10,11]. Supervised learning remains the primary approach for addressing a wide array of supply chain problems. Nonetheless, unsupervised, reinforcement, and hybrid algorithms are also successfully utilized to solve other significant supply chain issues, providing alternative pathways for process optimization. Similarly, key technologies utilized in the digitalization of supply chains include artificial intelligence, blockchain technology, supply chain management systems, Industry 4.0 solutions, and logistics platforms [12,13,14,15,16]. Therefore, clustering algorithms like k-means and dimensionality reduction techniques such as principal component analysis (PCA) are commonly employed when there are no labeled data, particularly for grouping observations or simplifying complex data sets. These approaches are especially advantageous in applications like customer segmentation [17,18]. Artificial Neural Networks (ANNs) and grading boosting are very useful analytics methods for predicting demand forecasting in business organizations, which helps inventory management and supply chain planning. Thus, organizations can make informed planning decisions, pricing dynamically, and maintain optimal inventory level management [17] Unforeseen disruptions in supply chain risk prediction are able to be predicted by using supervised machine learning techniques, which are convolutional neural networks, (CNNs) and reinforcement learning (RL). These models ensure billions of data points can be processed in the steps of receiving IoT sensors, enabling real-time decision-making and proactive risk mitigation [19]. Additionally, the combination of fuzzy logic and ML enables dynamic supply chain configuration, which may be more flexible and lead to more accurate decisions in organizations [20].
Finally, it is understood that firms’ adoption of AI algorithms in their supply chain and operation management is very critical for those that struggle with huge amounts of data in their business processes and managing, because it gives strategical advances to gain operation excellence, which provides capabilities for dynamic demand forecasting, dynamic pricing, cyber-attack defending, and streamlined tasks. In other words, AI algorithms help business process operational excellence in organizations. Because they enable easy solutions and usability, supervised and unsupervised algorithmic analytic models with small budgets can, on day one, facilitate agility in SMEs for being an effective player in the marketplace due to excellence in inventory and supply chain management.
From a lean management perspective, digital transformation acts as a strategic enabler that enhances both operational efficiency and sustainability in manufacturing and supply chain contexts. Theoretically, digital technologies such as the IoT, AI, and cloud-based analytics extend lean principles by enabling real-time visibility, predictive control, and adaptive resource allocation—thus transforming static process optimization into dynamic, data-driven continuous improvement. Practically, these technologies support the reduction of waste, energy consumption, and material inefficiencies, while improving responsiveness and traceability across supply networks. This integration allows organizations to embed sustainability not only through efficiency gains but also via circular resource flows, proactive risk mitigation, and resilient supply chain design, aligning lean operational excellence with long-term environmental and strategic goals.

2.2. Lean Management in Textile Sector

The textile industry operates within a highly competitive landscape, compelling firms to consistently integrate innovative strategies to refine their operations. Among these, lean manufacturing has garnered substantial attention for its capacity to boost both productivity and operational efficiency across diverse sectors, including textiles. In empirical research, which applied lean manufacturing principles, there was reported a 44% surge in productivity by utilizing tools such as 5S and Poka-Yoke. Furthermore, this approach led to a 75% decline in idle time within the organization [21]. In a similar vein, other research introduced a suite of lean instruments—including 5S, Kaizen, Poka-Yoke, Kanban, and Andon—across various divisions of an Indian apparel enterprise [22]. Their implementation yielded an 8% rise in productivity, attributed to shortened process cycles, minimized material waste, and enhanced product quality. Comparable outcomes were observed in a Slovakian study focusing exclusively on the Poka-Yoke technique [23], which demonstrated improvements in operational efficiency, market competitiveness, customer satisfaction, and workforce morale. Collectively, these investigations underscore the effectiveness of deploying either a comprehensive set of lean tools or the targeted use of Poka-Yoke in fostering systematic organization and mitigating errors throughout all organizational units.
The academic literature presents a range of investigations into the application of lean management techniques to enhance productivity and operational efficiency within textile enterprises. These studies often concentrate on distinct operational challenges. For instance, one study examined delays in the delivery of protective clothing orders, which adversely affect the company’s productivity levels [24]. Their research employs a comprehensive set of lean manufacturing tools, utilizing Value Stream Mapping (VSM) for diagnostic purposes and integrating 5S, SMED, Poka-Yoke, and Kanban to streamline operations. The study centers on reconfiguring the company’s business process model, ultimately achieving a 10% reduction in delivery time and a 50.37% improvement in the sewing department’s production efficiency. These outcomes suggest that re-engineering business processes through lean practices can significantly enhance customer satisfaction.
A parallel study also targeted delivery time optimization. They apply VSM to identify inefficiencies and time-related losses within assembly operations and broader business workflows [25]. The primary objective is to detect and eliminate Non-Value-Added Activities (NVAs) that hinder time efficiency. As a result of this intervention, setup time was reduced by approximately 180 min, and process time by around 98 min, leading to a notable decrease in total production time and a corresponding rise in efficiency [25]. These findings reinforce the premise that lean manufacturing seeks to minimize costs and maximize throughput by removing wasteful practices. Moreover, the study highlights that lean management not only contributes to improved time efficiency and customer satisfaction but also supports firms in achieving financial objectives related to revenue growth and profitability.
Complementing these findings, a series of empirical studies conducted in Peru provide further evidence of lean manufacturing’s effectiveness in micro and small enterprises (MSEs) and other industrial sectors. For example, Tejada et al., implemented a data-driven lean framework in a Peruvian textile MSE, integrating 5S, TPM, and digital analytics to address a significant productivity gap [26]. Their pilot project led to a measurable increase in productivity and demonstrated the value of combining lean tools with digital transformation to optimize operations. Similarly, Matias et al., applied SMED, SLP, and work standardization in the production of industrial safety vests, achieving reductions in setup time and defective output while promoting sustainability and Industry 4.0 principles [8].
Beyond the textile sector, Guerra et al., explored lean and circular economy practices in spinach production, showing how TPM, FIFO, and process standardization—enhanced by digital tools—can improve sustainability and operational efficiency in agro-industrial supply chains [27]. Then, Calderon et al. examined the use of OEEM within a green–lean framework in plastic manufacturing, identifying barriers to adoption and demonstrating how strategic implementation of lean tools can enhance machine performance and reduce setup times [28]. In the food industry, Castañeda et al. applied TPM, SMED, and Reliability-Centered Maintenance (RCM) methodologies to address inefficiencies caused by frequent equipment failures. The proposed model improved MTBF, MTTR, and OEE indicators, resulting in increased productivity and reduced operational costs [29].
These cross-sectoral insights reinforce the versatility of lean methodologies and their adaptability to diverse industrial contexts. They also highlight the growing importance of integrating digital technologies and sustainability principles into lean frameworks to meet contemporary operational and environmental challenges.
Research has underscored the comparatively low productivity levels of textile-sector SMEs in Latin America compared to other industries. In response, they carried out a study aimed at enhancing operational consistency and minimizing inefficiencies by implementing 5S and Standard Work methodologies within Peruvian textile SMEs [30]. The proposed framework seeks to formalize existing procedures and design an optimized workflow, thereby enabling productivity gains through the structured deployment of lean tools. In a similar context, Barrientos-Ramos et al. explored productivity enhancement in a Peruvian textile SME through the application of lean management techniques [31]. Their research emphasized the integration of workforce coordination, work methods, and production cycles to reduce waste and elevate efficiency. The study simulated three distinct scenarios involving various lean tools, ultimately demonstrating improvements such as increased sales, a 4% decline in defective output, and a 2% reduction in equipment malfunctions. These findings suggest that the company can pursue sustainable, growth-oriented operations aligned with continuous improvement principles, while also boosting customer satisfaction and ensuring timely delivery of high-quality products through enhanced team performance. Moreover, this case study offers a practical reference for textile SMEs seeking to align their internal culture with agile manufacturing standards. Thus, the research not only highlights the positive influence of lean tools on production efficiency, standardization, and delivery reliability, but also emphasizes their role in shaping organizational culture. These insights are particularly valuable as they illustrate how the systematic application of lean methodologies can address operational shortcomings while contributing to the strategic redesign of workflows—ultimately fostering sustainable productivity improvements and reinforcing long-term competitiveness. Based on the empirical outcomes of these studies, lean manufacturing practices have proven effective in reducing defect rates, underscoring cost reduction and waste elimination as key advantages of lean implementation.
A critical factor in advancing both productivity and sustainability within textile manufacturing lies in the ergonomic configuration of machinery across production environments. It can be argued that a layout prioritizing human-centered design and operational efficiency is essential for manufacturing success. Ergonomically refined production systems not only mitigate operational errors and time-related inefficiencies but also contribute to higher output levels. In this regard, it offered valuable contributions. By applying the SiSMED technique, the authors achieved an ergonomic restructuring of machinery within a production setting. They further employed the Interval-Valued Pythagorean Fuzzy Analytic Hierarchy Process (IVPF-AHP) alongside the Fuzzy Technique for Order Preference by Similarity to Ideal Solution (TOPSIS) to assess the outcomes. Their results revealed a 58% reduction in machine setup time and a 19% enhancement in ergonomic conditions [32].
A related study utilized the Spaghetti Diagram within a lean management framework to optimize business processes through ergonomic improvements in the Hybrid Manufacturing and Machine Building Industry (HMMBI) [33]. By identifying and resolving bottlenecks, the study achieved reductions in both operational and idle times, culminating in an 8.6% increase in process cycle efficiency. Similarly, it also focused on boosting productivity by redesigning business models through the elimination of non-value-adding activities using lean methodologies. Employing tools such as Value Stream Mapping and the Spaghetti Diagram, the researchers identified inefficiencies and losses in various workflow stages. Their intervention led to measurable improvements in production time, process duration, and the handling of raw, semi-finished, and finished materials, resulting in a 25.59% increase in overall process cycle efficiency [34].
These findings collectively demonstrate that lean-based reconfiguration of business processes positively influences productivity and waste reduction, thereby supporting sustainable operations. Within the textile manufacturing domain, numerous recent studies have adopted lean strategies to restructure business models with the dual aim of enhancing efficiency and minimizing waste [35,36,37,38,39,40,41]. For instance, it showed the effectiveness of Value Stream Mapping (VSM), SMED, and standardized work practices in optimizing fabric-cutting operations, leading to reduced rework, fewer delays, and notable productivity gains [35]. It also emphasized the benefits of integrating Overall Equipment Effectiveness (OEE) with Total Productive Maintenance (TPM) and Six Sigma, which significantly improved production efficiency by addressing material and accessory availability issues [36]. Moreover, Afum et al. (2024) examined the combined application of lean practices (LPs) and Quick Response Manufacturing (QRM) in Ghana’s textile sector during the COVID-19 pandemic, revealing that QRM played a mediating role in enhancing both internal operations and customer satisfaction [37]. In the context of yarn production, it adopted a system dynamics model to implement 5S strategies, resulting in increased throughput and reductions in work-in-progress, processing time, and waste [38]. Additionally, it applied VSM to identify non-value-adding steps in the preparatory phase of textile production, achieving improvements in cycle time, lead time, and process transparency [23]. Finally, Tejada et al. (2025) proposed a data-driven lean manufacturing framework incorporating 5S, Total Productive Maintenance (TPM), digitalization, and advanced analytics, which—when piloted in a Peruvian textile micro-enterprise—led to a measurable productivity increase and demonstrated the effectiveness of integrating lean tools with data intelligence to address operational inefficiencies [39].
Taking together, these studies highlight the transformative capacity of lean methodologies in re-engineering business models to foster productivity, sustainability, and long-term competitiveness in textile manufacturing.
Recent scholarly work has increasingly focused on advancing sustainability within the textile industry by harnessing data-driven insights made possible through digital transformation and Industry 4.0 technologies. These studies adopt lean management principles to enhance productivity and minimize inefficiencies, thereby promoting more sustainable manufacturing systems [42,43,44]. In this context, an empirical study was conducted, identifying key enablers for successful Industry 4.0 implementation in Indian manufacturing sectors, including textiles, highlighting the pivotal roles of organizational commitment, employee preparedness, technological readiness, and effective data utilization [42]. Complementarily, another study also explored the dual transition—digital and sustainable—among textile firms in Italy’s Prato region, demonstrating that the integration of Industry 4.0 tools with lean methodologies significantly supports both environmental sustainability and innovation in business models [43]. Additionally, Azzolini Junior et al. (2025) introduced a simulation-based decision-support system that merges lean practices with optimization techniques, yielding tangible improvements in operational performance and throughput within a textile packaging environment [44].
To contextualize the innovative contribution of this study, a comparative analysis of recent scholarly work on lean manufacturing and digital transformation in textile production is presented in Table 1. The table synthesizes key studies that address similar thematic areas, methodological approaches, and toolsets, enabling a clearer understanding of how this research advances the field.
The reviewed literature demonstrates a consistent emphasis on productivity enhancement through lean tools such as 5S, Poka-Yoke, SMED, and Value Stream Mapping. While these interventions have yielded measurable improvements in operational efficiency, waste reduction, and delivery reliability, most studies remain limited in their integration of digital technologies. For instance, several works focus solely on physical process optimization without embedding real-time data systems or digital process modelling frameworks.
Moreover, sustainability is often addressed narrowly—primarily through ergonomic improvements or reductions in idle time and material waste. In contrast, the present study adopts a broader sustainability perspective, encompassing environmental, economic, and operational dimensions. It also distinguishes itself by embedding lean tools within a digitally enabled Business Process Management (BPM) structure supported by IoT technologies, thereby facilitating data-driven decision-making and continuous improvement.
Table 1 below provides a structured comparison of key studies in the field of lean manufacturing and digital transformation within textile production. It synthesizes the thematic focus, methodological approaches, toolsets, sustainability dimensions, and digital integration levels of each study. This comparative overview serves to highlight the distinctive contribution of the present research, which integrates lean methodologies with Industry 4.0 technologies through a digitally enabled Business Process Management (BPM) framework tailored to the operational realities of textile SMEs.
In conclusion, despite the growing body of research integrating lean manufacturing and digital transformation, most existing studies tend to examine these domains in isolation—either focusing on the application of lean tools or on the adoption of Industry 4.0 technologies without a unified operational framework. This fragmentation leaves a critical gap in the literature regarding how data-driven lean practices can be systematically embedded within digitalized business process models to achieve both operational efficiency and long-term sustainability. Addressing this gap, the present study proposes a holistic, data-centric framework that integrates SMED, work standardization, and ergonomic layout redesign within a digitally enabled BPM structure, supported by real-time data analytics. By doing so, it not only enhances production efficiency and process agility but also empowers operators through digital control mechanisms. Accordingly, this research seeks to answer the following questions:
(1)
How can lean manufacturing tools be effectively integrated into a digital BPM framework to improve production efficiency in textile manufacturing?
(2)
What role does real-time data tracking play in enhancing transparency, decision-making, and sustainability outcomes in re-engineered production systems?
(3)
To what extent can such an integrated approach contribute to long-term operational resilience and competitiveness in the textile sector?
3. Methodology

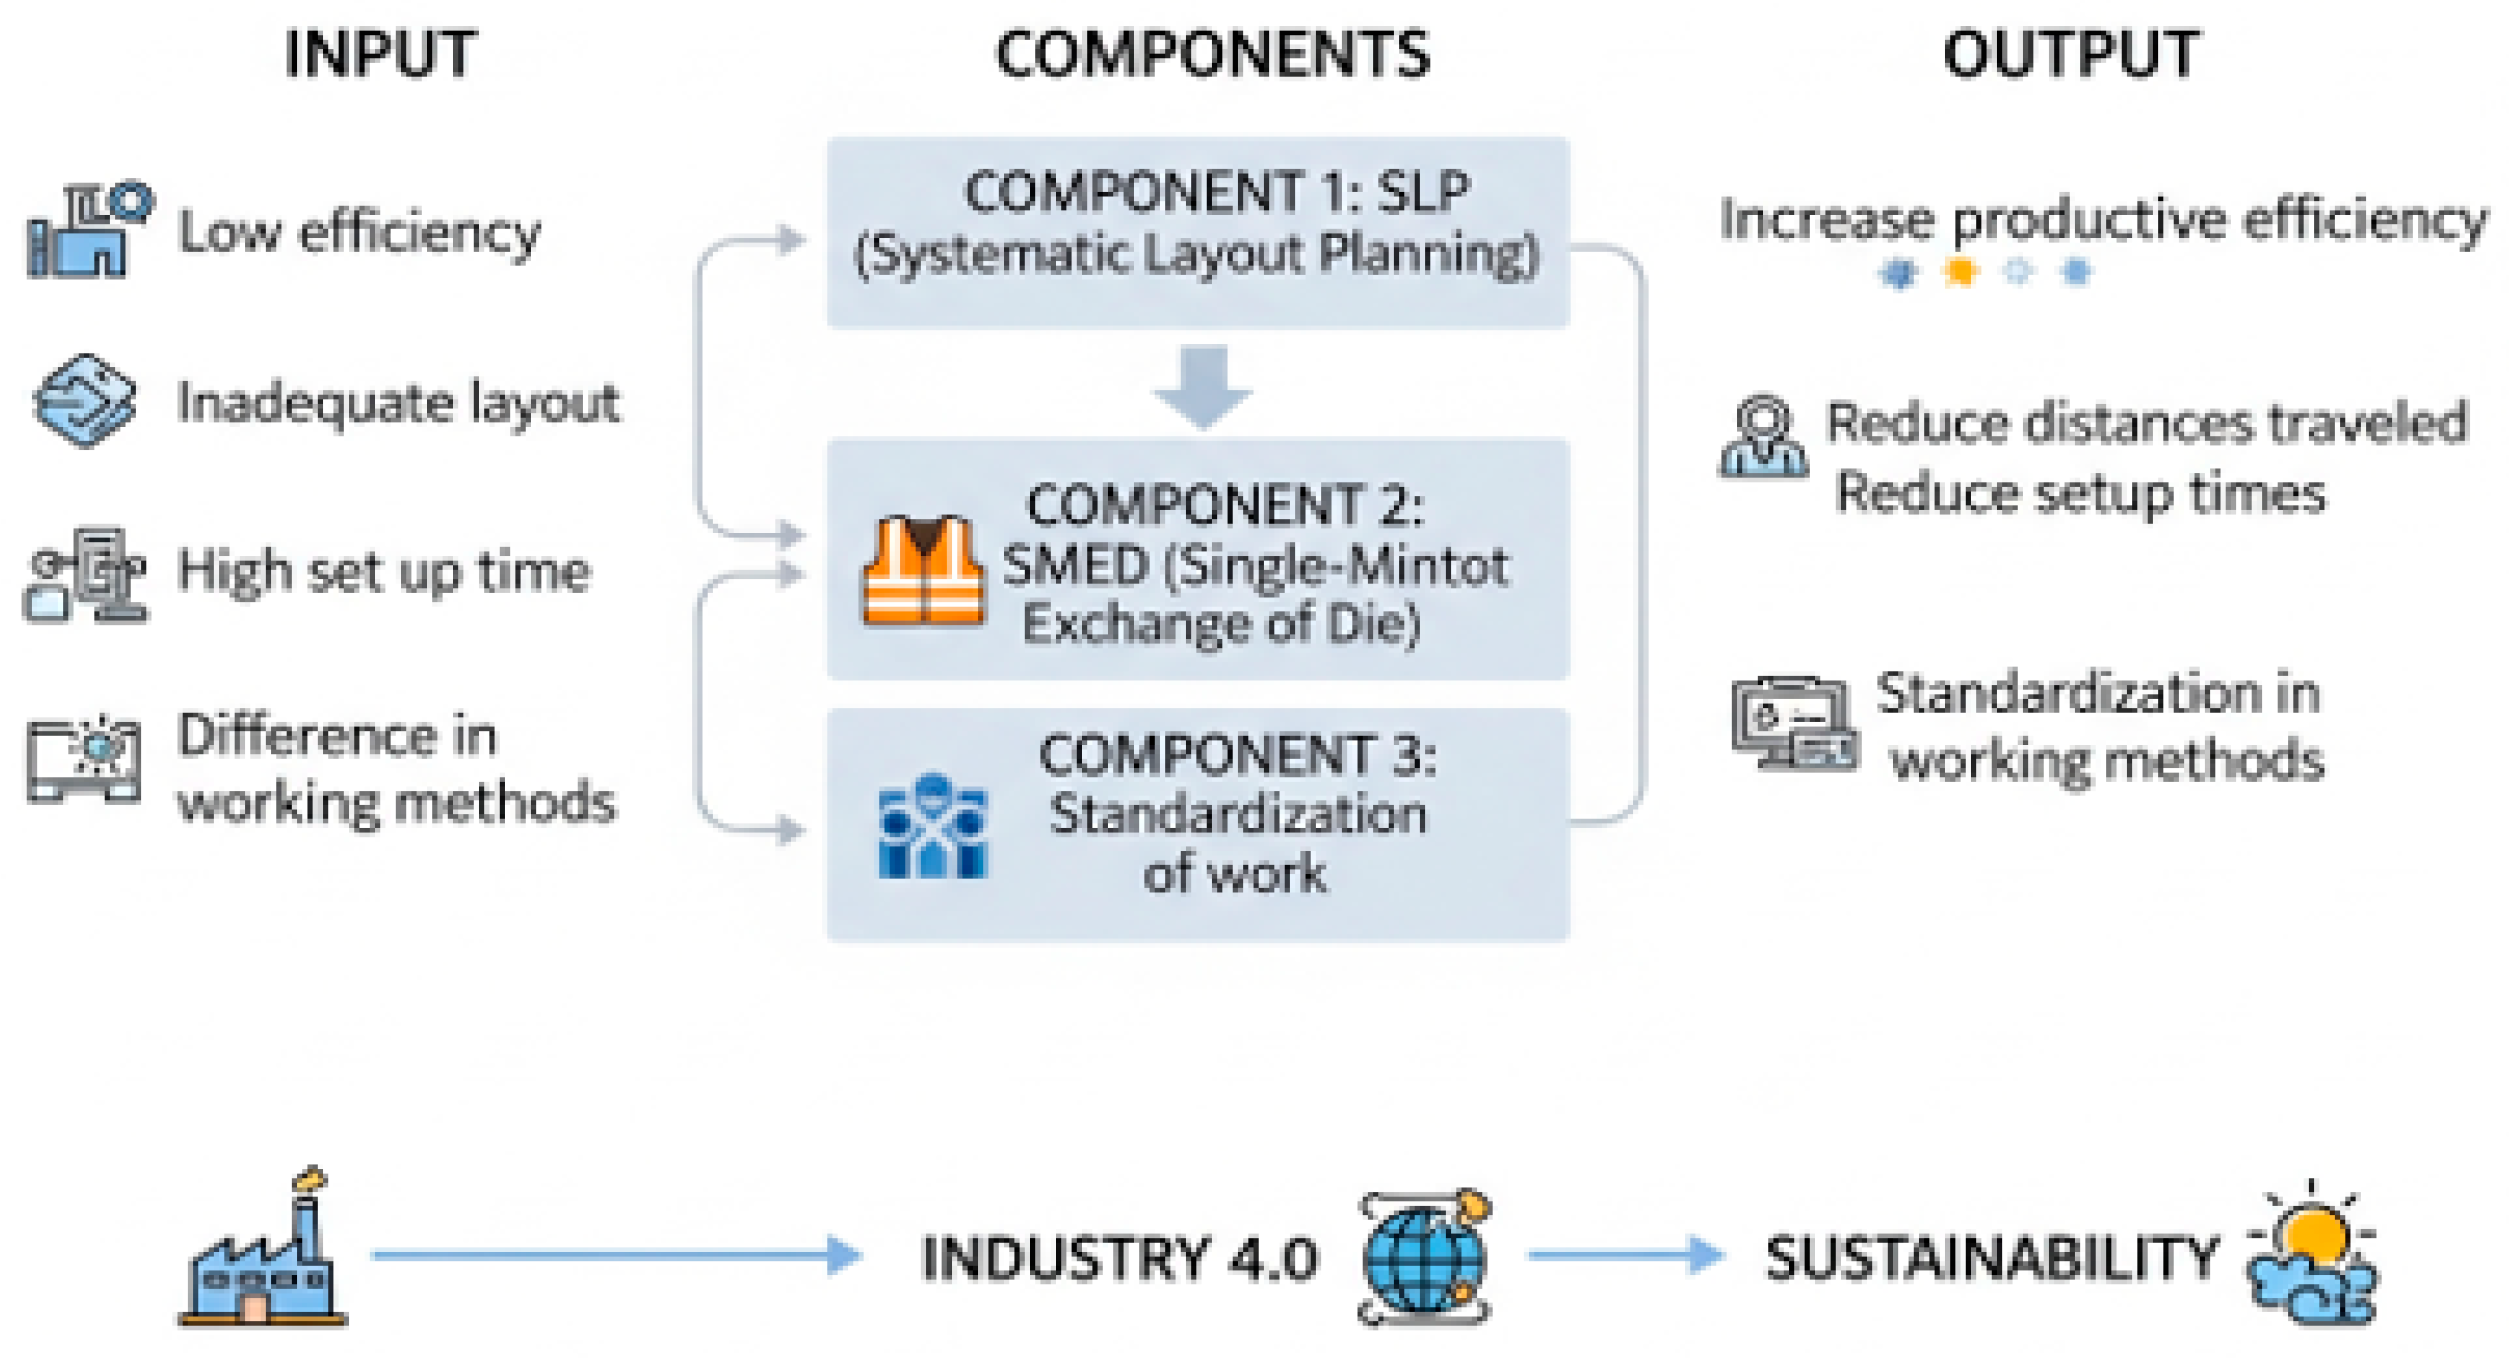
This study adopts an integrated methodological framework that combines core lean manufacturing tools—namely 5S, Total Productive Maintenance (TPM), and Standard Work—with complementary components aligned with digital transformation and sustainability imperatives, including digitization and circular economy principles. While lean tools are employed to eliminate inefficiencies and standardize operations, digitization enhances data capture and real-time monitoring, and circular economy practices promote resource optimization. The proposed model is validated through a pilot implementation in the apparel division of a textile company, and its structure is organized around three primary components: SLP, SMED, and Standard Work. The subsequent sections elaborate on each component individually. The methodological design for this study is provided in Figure 1, as seen below.
As illustrated in Figure 1, the model aims to enhance operational efficiency, reduce waste, and improve decision-making through real-time data integration and process automation. The implementation sequence of the proposed model begins with the application of SLP to address inefficiencies in the existing facility layout. This is followed by the deployment of the SMED methodology to minimize excessive machine changeover times. Lastly, Standard Work is introduced to enhance material utilization and ensure consistency in operational procedures within the manufacturing area. The model is further reinforced by its alignment with sustainability objectives and Industry 4.0 principles, aiming to foster economic growth while preserving environmental resources. Through the integration of process automation and real-time data monitoring, the approach also seeks to improve productivity, operational agility, and data-informed decision-making.
The combined application of SLP, SMED, and Standard Work not only enhances the efficiency of industrial vest production but also strengthens the company’s competitive position by improving product quality and responsiveness to market dynamics. The following subsections provide a detailed explanation of each component within the proposed framework.

3.1. Integrated Lean Tools Application

The proposed model is operationalized through the sequential application of three core lean manufacturing tools: SLP, SMED, and Standard Work. Each tool addresses specific inefficiencies within the production system and contributes to the overarching goals of productivity enhancement, process standardization, and sustainability.
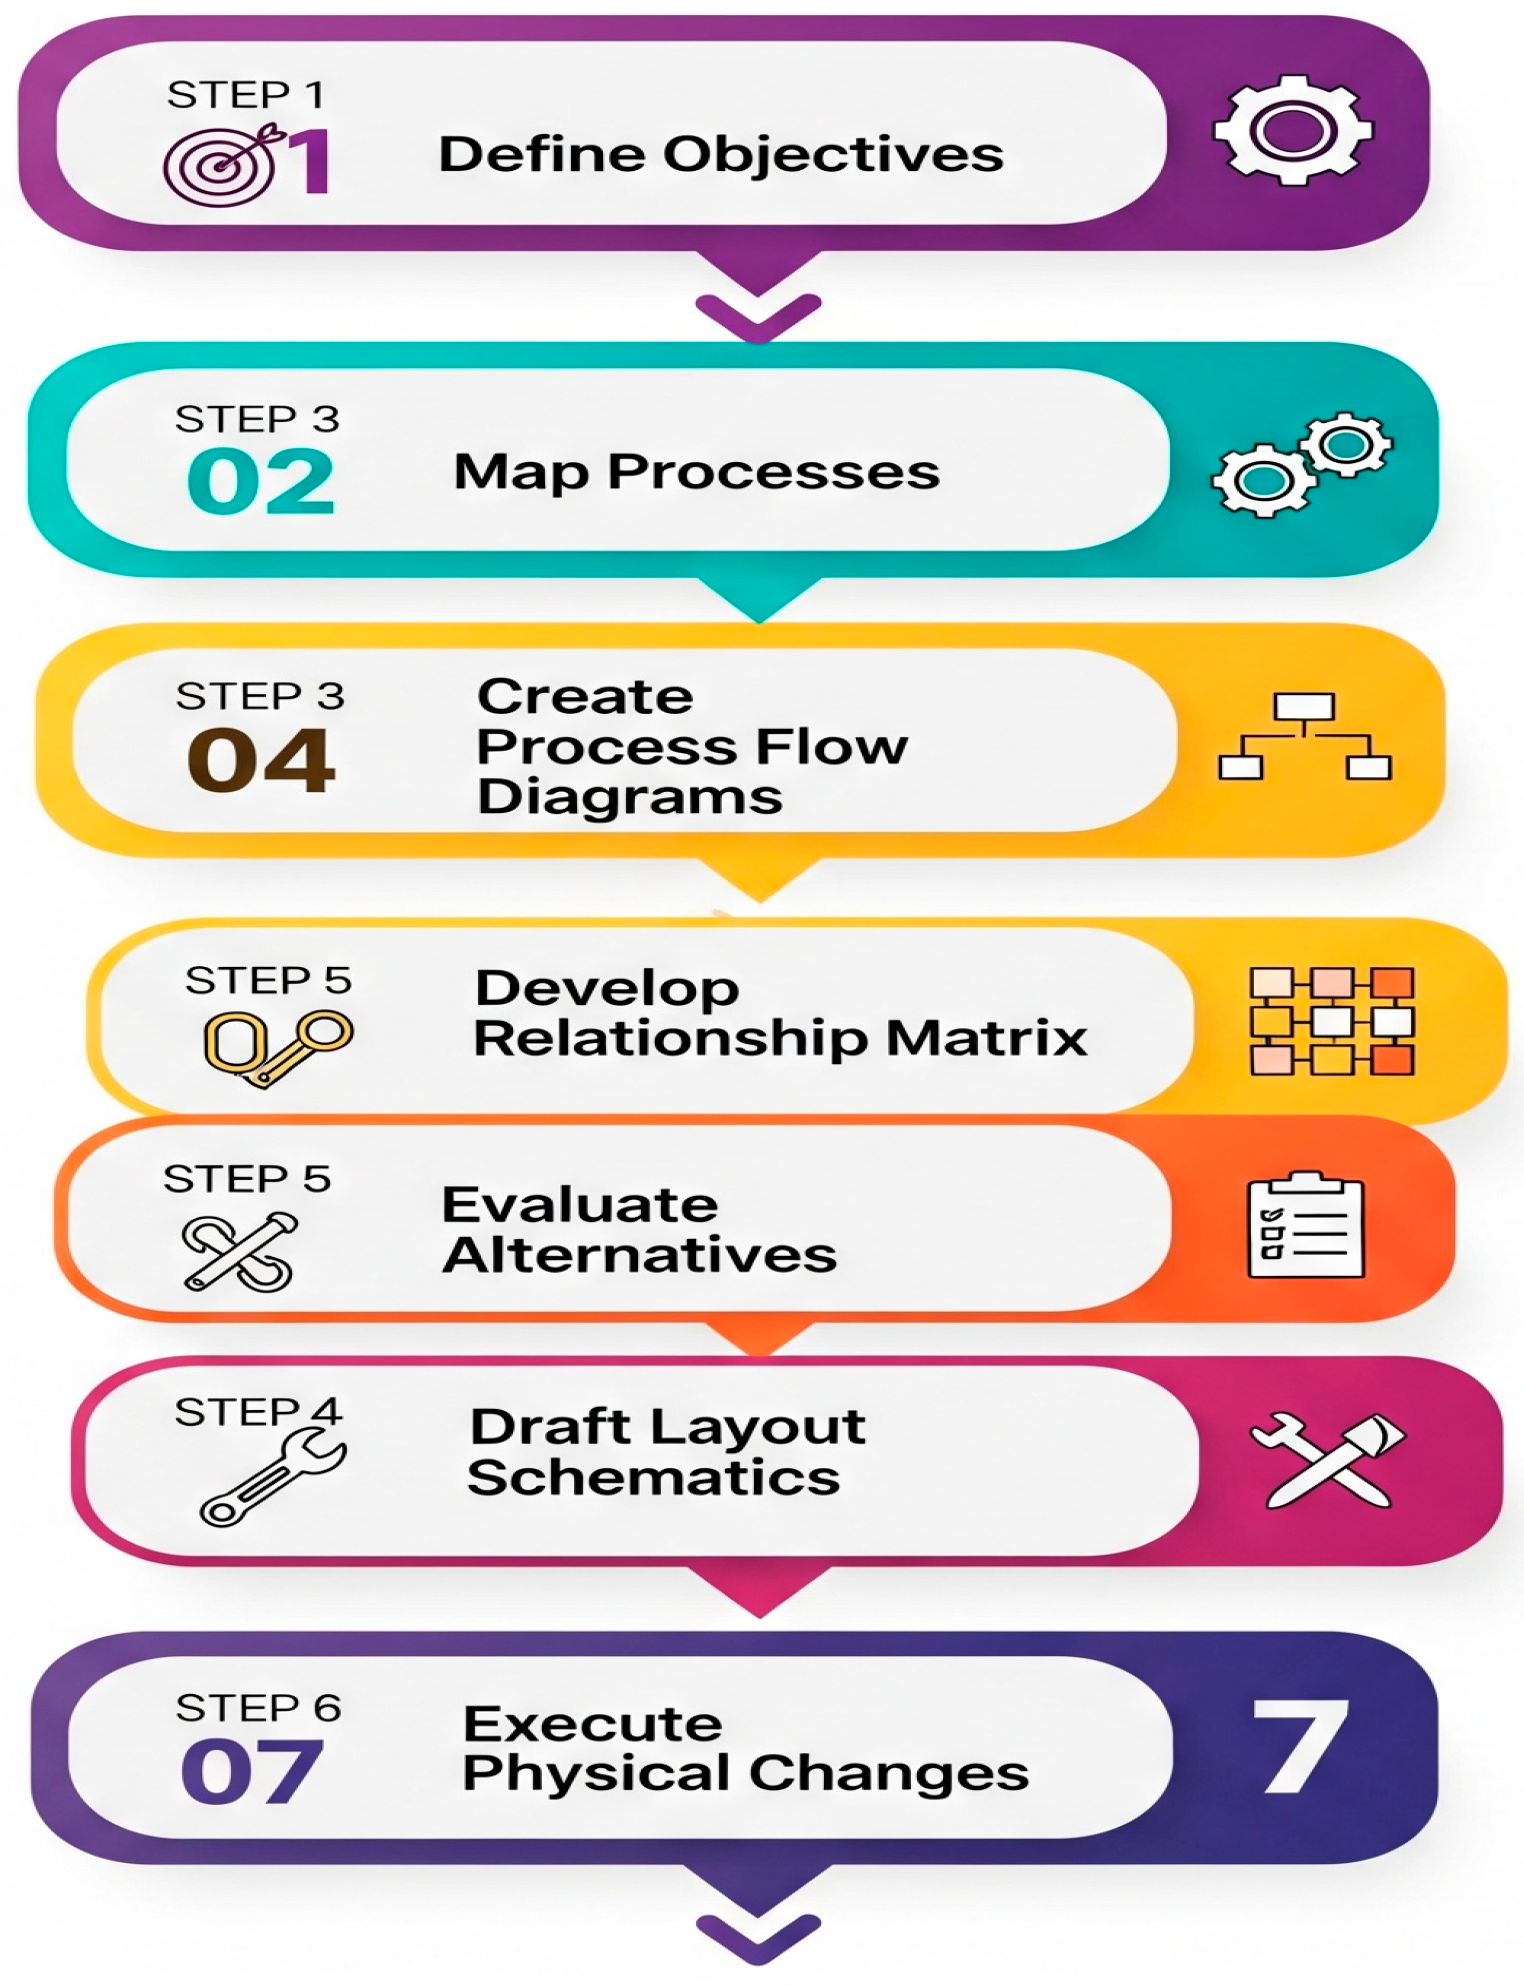
Systematic Plant Layout Planning (SLP): The first phase involves the application of SLP to resolve inefficiencies in the existing facility layout. This structured, eight-step methodology aims to reduce downtime and improve spatial efficiency by optimizing the physical arrangement of production resources. The steps include the following:
As illustrated in Figure 2, the SLP process comprises seven structured steps, each designed to optimize spatial efficiency and streamline production flows within the selected textile manufacturing firm. The process begins with a clear articulation of the objectives behind the layout redesign or relocation—such as reducing material handling time, improving workflow continuity, or accommodating future expansion—ensuring that the redesign aligns with the company’s broader operational and strategic goals. Following this, the manufacturing processes are thoroughly mapped, including detailed documentation of each operation’s sequence, duration, and interdependence. This step provides a foundational understanding of how materials and information flow through the production system.
To further clarify these relationships, process flow diagrams are developed, offering a visual representation of the interactions between different workstations and departments. These diagrams serve as a basis for constructing a relationship matrix, which evaluates the necessity and frequency of interactions between functional areas, thereby informing decisions about spatial proximity. With this analytical foundation, alternative layout configurations are generated and assessed using both qualitative criteria (e.g., safety, flexibility, and ergonomics) and quantitative metrics (e.g., travel distance, cycle time, and space utilization).
Once the most suitable layout is selected based on this multi-criteria evaluation, detailed schematics are drafted to guide the physical implementation. These technical drawings include precise measurements, equipment placements, and workflow paths. The final stage involves executing the physical modifications to the plant, such as relocating machinery, adjusting workstations, and updating signage and pathways. This step translates the planned improvements into tangible operational enhancements, ultimately contributing to reduced downtime, improved productivity, and a more ergonomic and sustainable production environment.
An illustrated in Figure 3, there is the six-step process of SMED methodology as applied in the textile manufacturing context. The process begins with distinguishing internal and external setup activities, followed by analyzing each task to identify opportunities for externalization. Subsequent steps involve modifying tools and procedures, implementing technical enhancements such as quick-release systems, standardizing operations through training, and fostering continuous improvement via employee feedback. This structured approach aims to minimize machine downtime and enhance production flexibility.
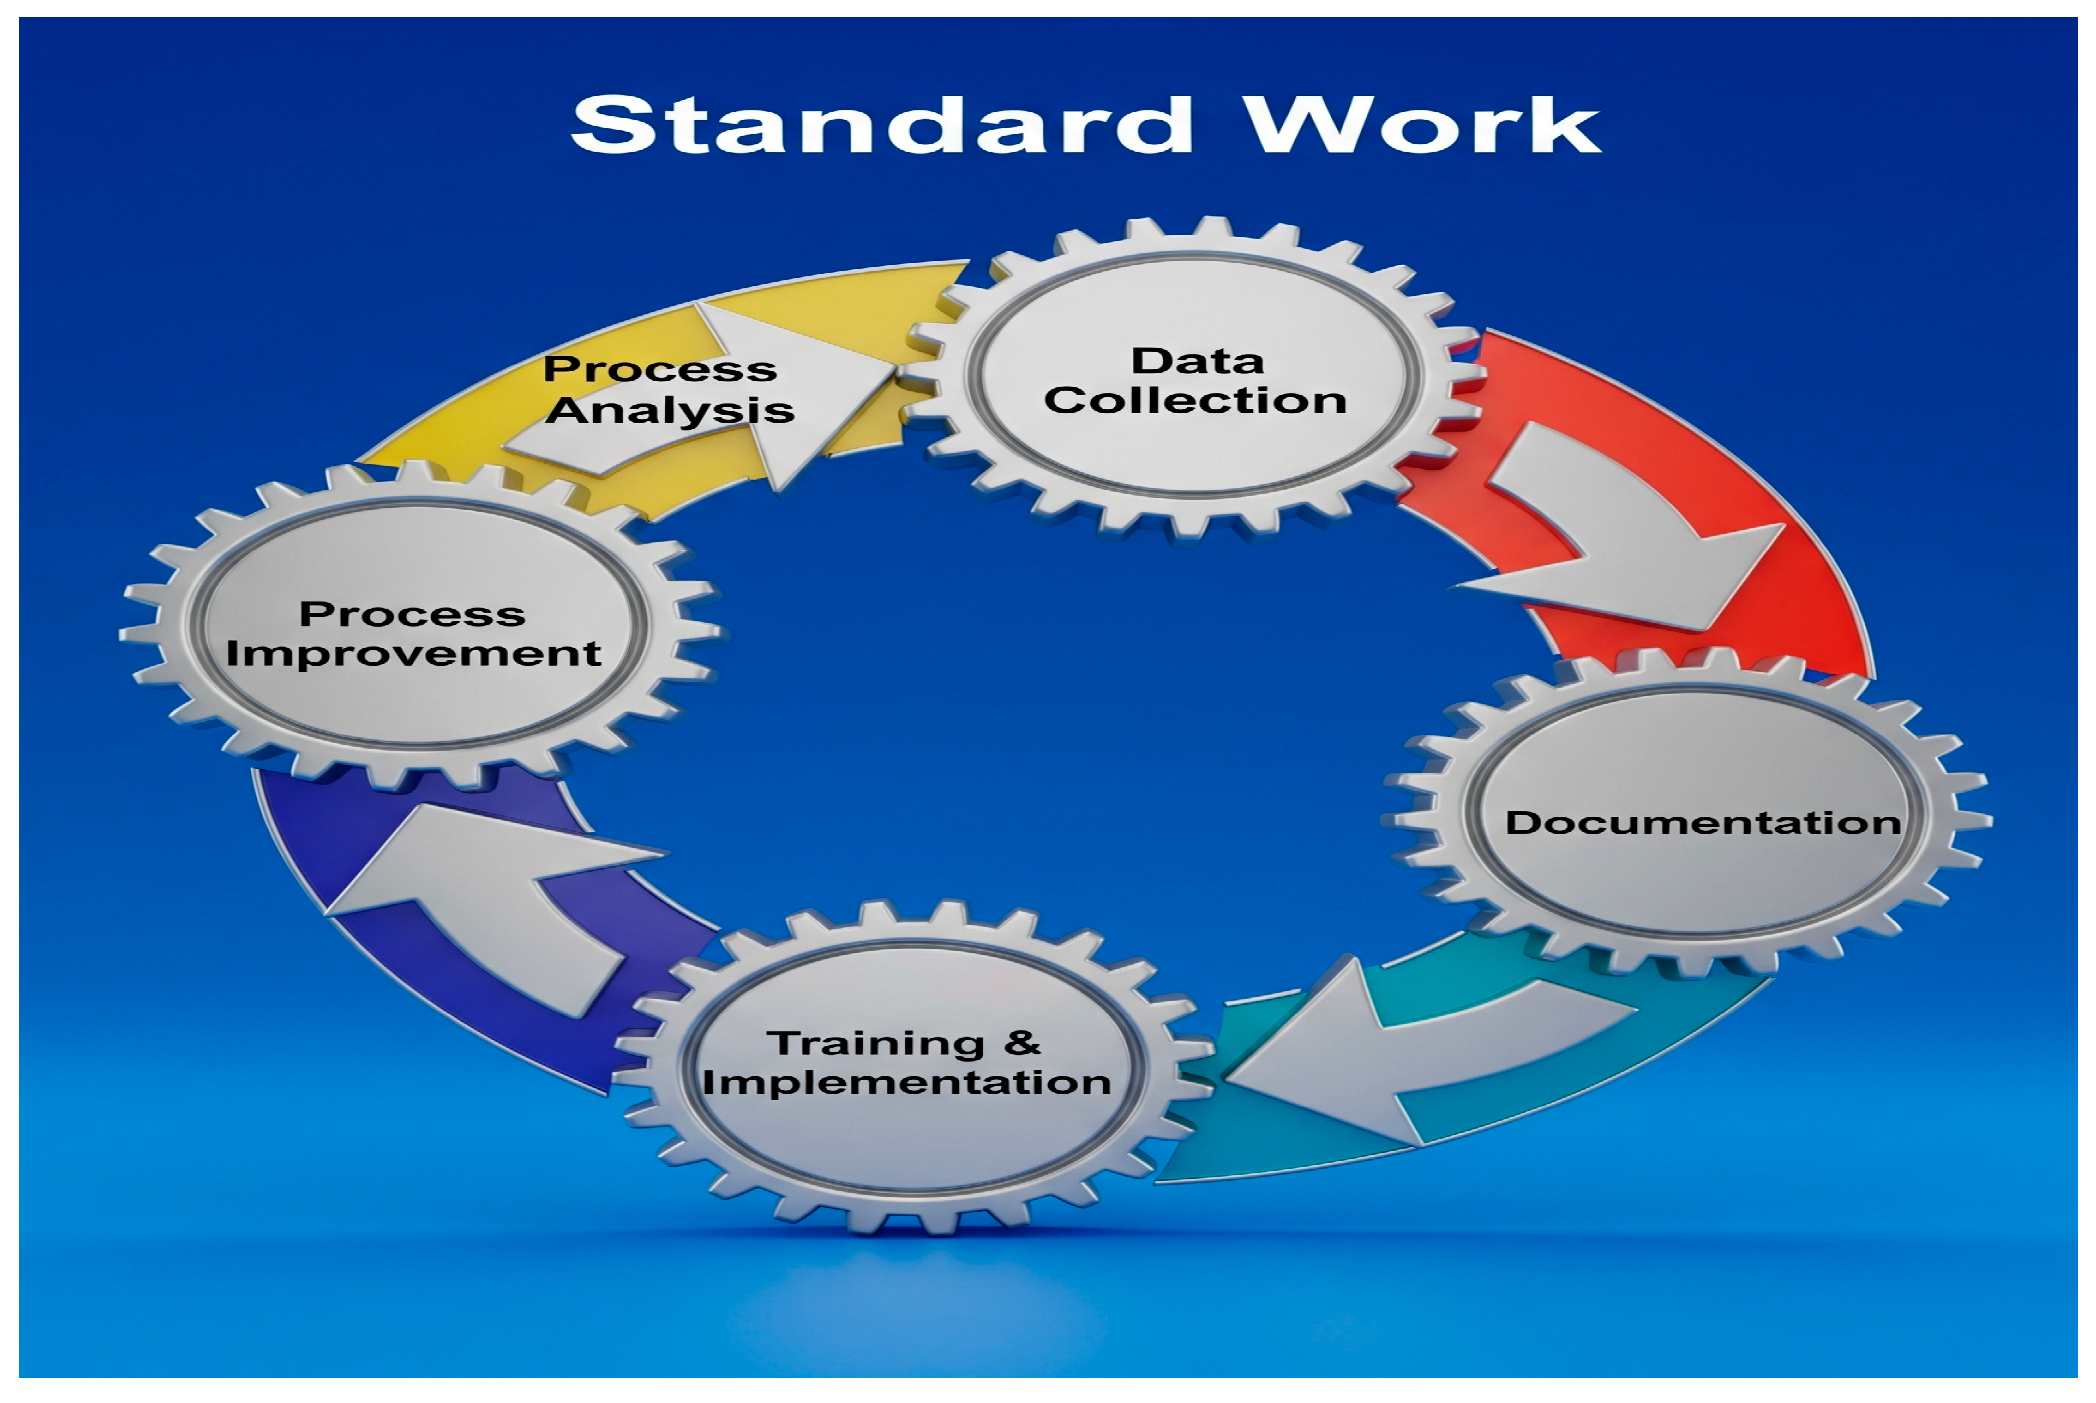
This five-step approach begins with analyzing the criticality of each process in terms of its impact on quality, safety, productivity, and cost (Figure 4). Operational data—such as cycle times, operator movements, and tool usages—are then collected to identify inefficiencies and inconsistencies. Based on these insights, targeted improvements are introduced to streamline workflows, reduce unnecessary motions, and enhance ergonomics. The improved processes are documented with clearly defined quality standards, and comprehensive training is provided to ensure that all personnel understand and adhere to the standardized procedures. This structured implementation of Standard Work contributes to greater process stability, improved product quality, and enhanced workforce alignment.

3.2. Validating Indicators and Pilot Implementation

To evaluate the effectiveness of the proposed model, a set of six performance indicators was employed. These indicators were selected to measure improvements in production efficiency, resource utilization, and operational consistency. Each metric is defined below, along with its corresponding formula:
-
Production Efficiency (%): this indicator measures the ratio of actual output to theoretical production capacity, expressed as a percentage:
E f f i c i e n c y = ( A c t u a l   P r o d u c t i o n T h e o r e t i c a l   P r o d u c t i o n ) × 100
An increase in this value reflects a higher number of industrial vests produced relative to the baseline.
-
Distance Reduction (m): this metric quantifies the reduction in material handling distance within the production area:
D i s t a n c e   R e d u c t i o n   m = I n i t i a l   D i s t a n c e F i n a l   D i s t a n c e
The result indicates the number of meters eliminated from the workflow due to layout optimization.
-
Setup Time (min): this indicator captures the reduction in machine setup time following the implementation of SMED:
S e t u p   T i m e = F i n a l   S e t u p   T i m e I n i t i a l   S e t u p   T i m e
-
Equipment Utilization (%): this metric assesses the proportion of available machine time that is actively used in production:
E q u i p m e n t   U t i l i z a t i o n = ( A c t u a l   O p e r a t i o n   T i m e A v a i l a b l e   T i m e ) × 100
-
Non-Value-Added Activities (%): this indicator measures the proportion of tasks that do not contribute to value creation, supporting the development of targeted improvement actions:
% N V A = ( N V A   A c t i v i t i e s T o t a l   A c t i v i t i e s ) × 100
-
Fabric Waste (%): this metric evaluates material efficiency by comparing fabric waste to total purchased fabric:
% F a b r i c   W a s t e = ( F a b r i c   W a s t e T o t a l   P u r c h a s e d   F a b r i c ) × 100
To validate the proposed framework, a pilot program was conducted in the company’s apparel division. The implementation of the three lean tools—SLP, SMED, and Standard Work—was closely monitored throughout the pilot phase. The validation process was structured in alignment with the model’s design stages to ensure accurate measurement of outcomes and to identify areas for further refinement.
Specifically, the validation of spatial reconfiguration was carried out through the SLP component, while the SMED methodology was tested in a controlled environment to assess its impact on changeover time reduction. This real-world application enabled a comprehensive evaluation of the model’s effectiveness and its potential to enhance production performance under operational conditions.
In parallel with the layout and setup time validations, the effectiveness of the Standard Work methodology was also assessed through a structured pilot implementation. Initially, eight operators from the manufacturing area received targeted training on the newly standardized procedures. Following the training phase, the standardized workflow was deployed and detailed time measurements were recorded for each activity. This enabled a comparative analysis of task durations and the proportion of non-value-added (NVA) activities before and after implementation. The results provided empirical evidence of improved process consistency and reduced variability in operator performance.
To ensure a comprehensive evaluation of the proposed model, the SMED methodology was likewise validated through a dedicated pilot program. In this phase, changeover time reduction techniques were applied in a controlled production environment. This real-world application allowed for close observation of the methodology’s impact on operational efficiency, particularly in terms of setup time reduction and production continuity.
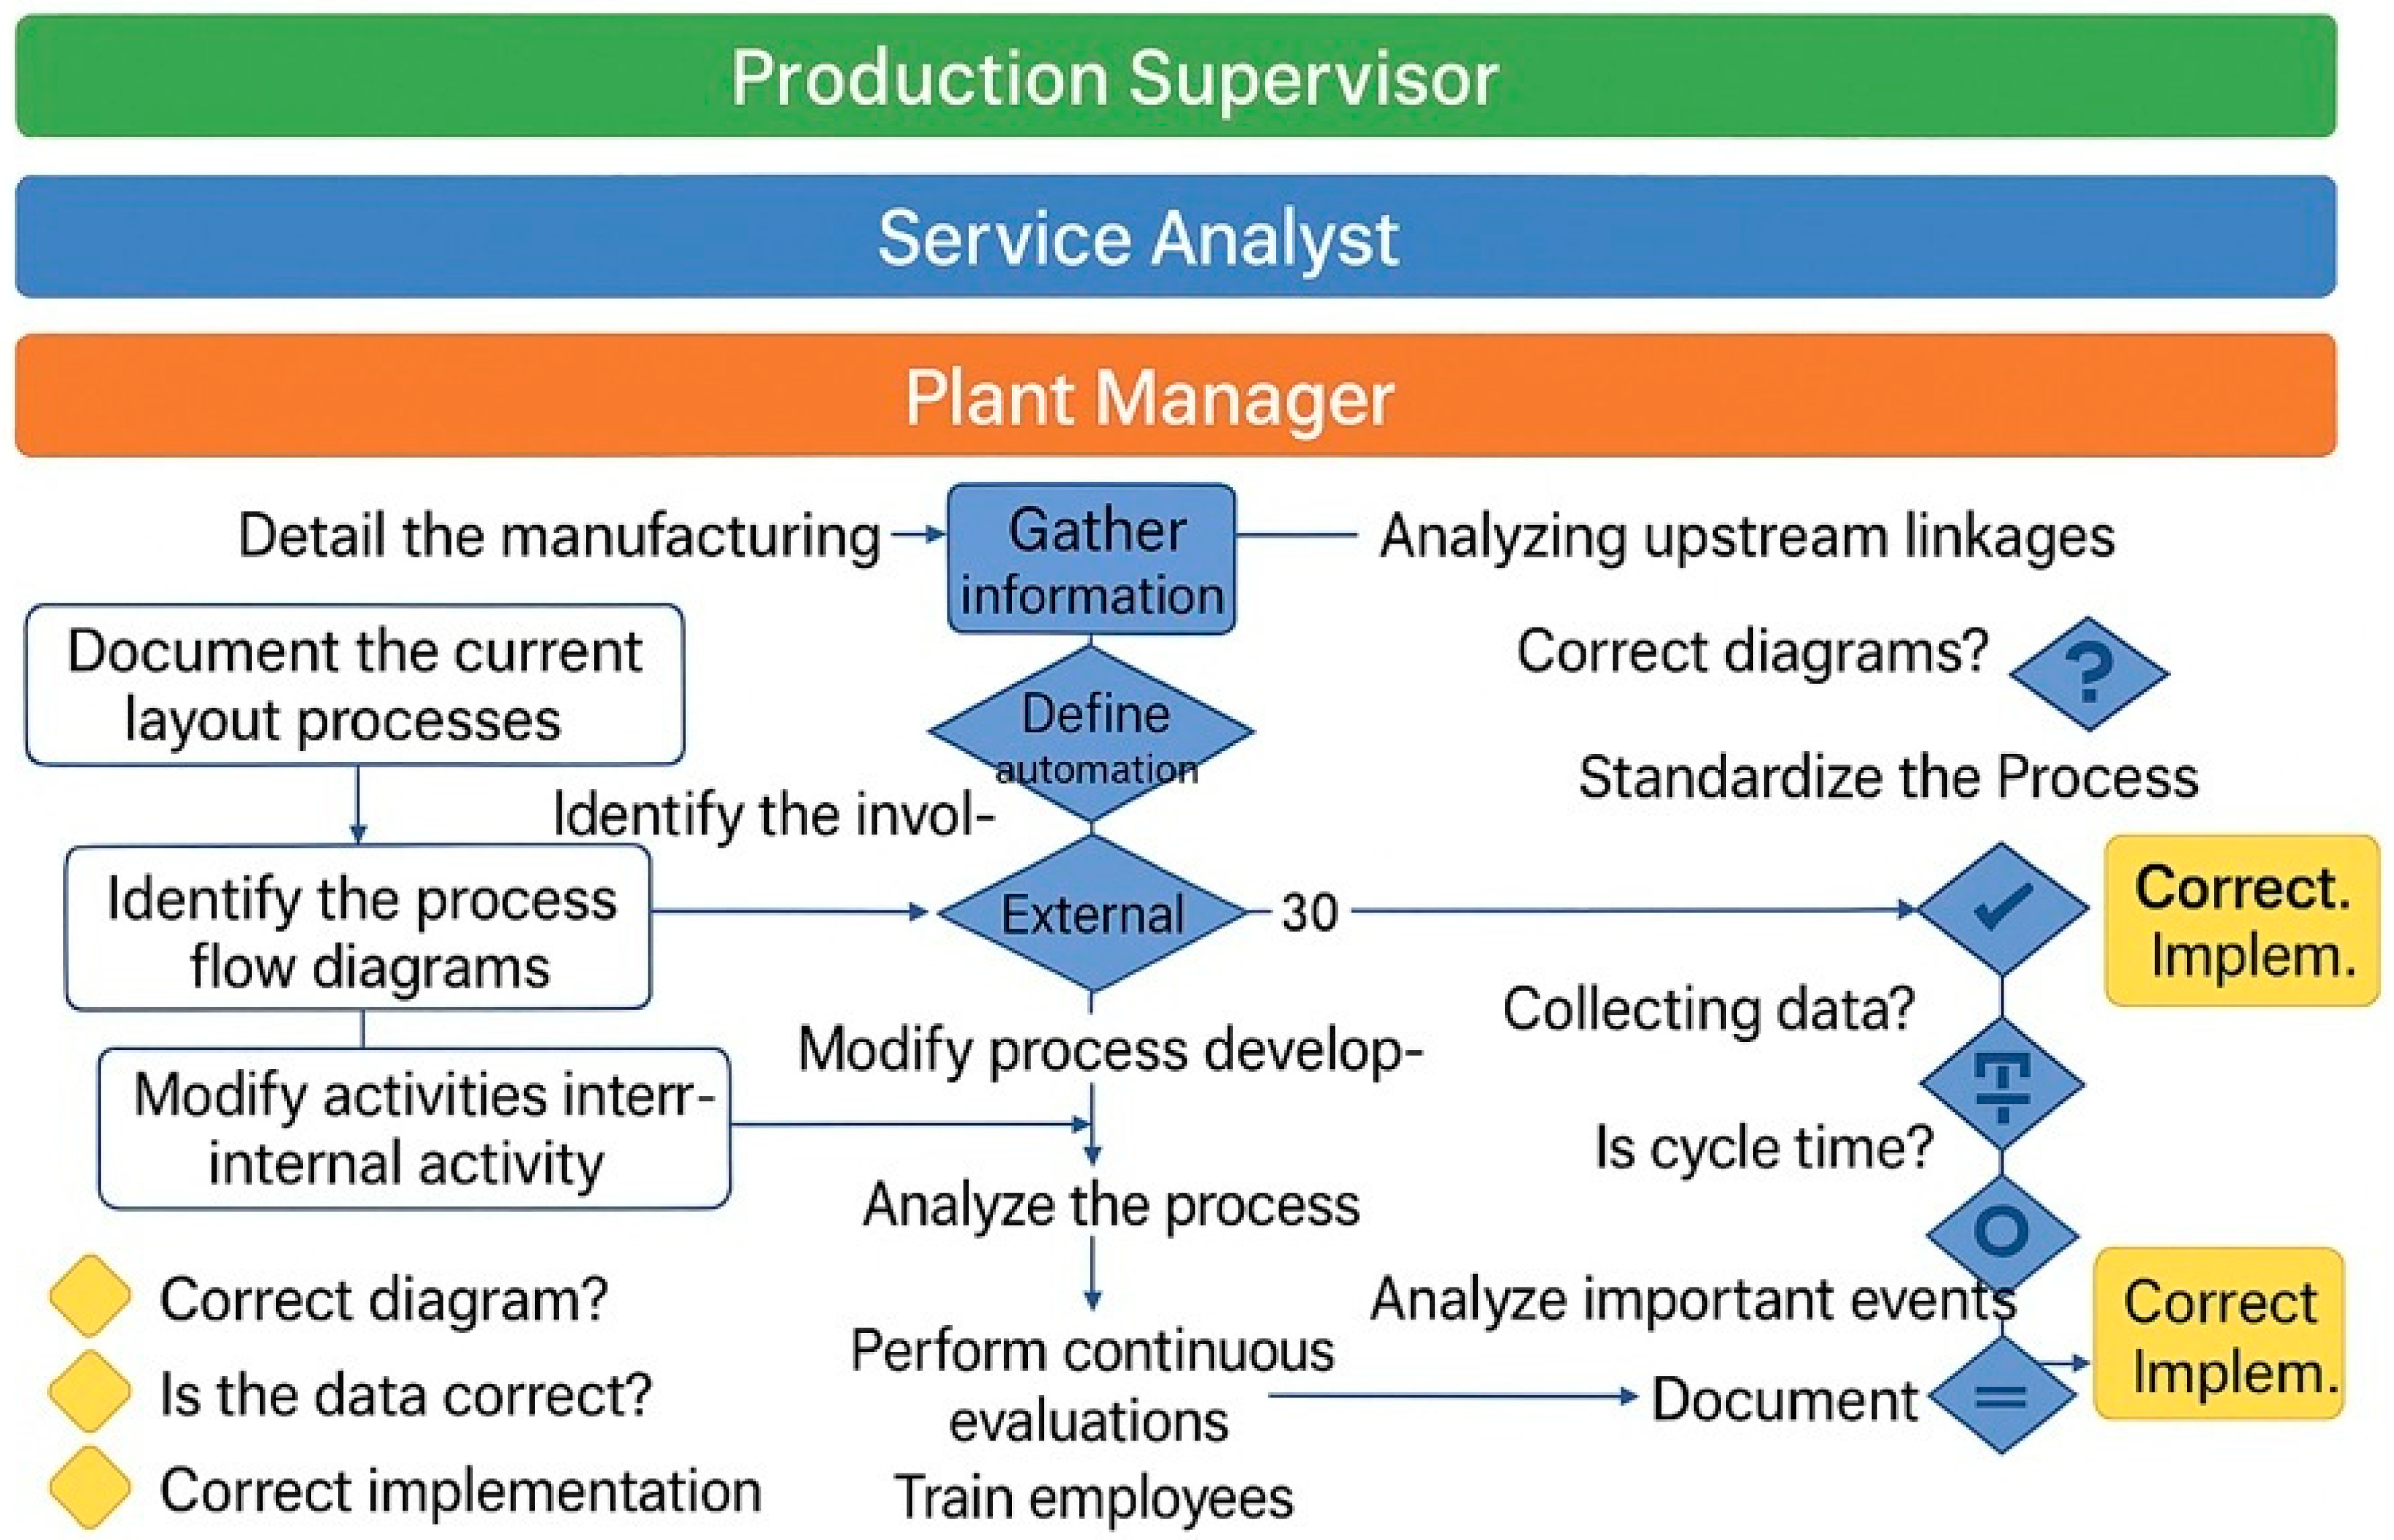
As illustrated in Figure 5, a flowchart was designed to systematically guide and document the validation process of lean tool implementation within the case study firm. It delineates the sequential and role-specific steps undertaken to apply and evaluate three core lean methodologies—Systematic Layout Planning (SLP), Single-Minute Exchange of Dies (SMED), and Standard Work—during the pilot phase. The process begins with the production supervisor collecting data on current layout configurations and material flows. This is followed by the Service Analyst, who analyses internal linkages and identifies opportunities for process standardization. Subsequently, the plant manager assesses the feasibility and strategic alignment of proposed changes, including decisions on whether certain activities can be externalized or require internal restructuring.
The flowchart integrates key decision points—such as verifying the correctness of claims, assessing the potential for external conversion, evaluating cycle times, and confirming implementation accuracy—which ensure that each intervention is critically examined before proceeding. Based on these evaluations, specific actions are triggered, including the documentation of existing processes, development of process flow diagrams, reclassification of activities, implementation of improvements, employee training, and continuous monitoring.
This structured and iterative approach not only enhances methodological rigor and traceability but also facilitates cross-functional collaboration. By clearly mapping responsibilities and decision logic, the flowchart ensures that the deployment of lean tools is both systematic and adaptable to the dynamic conditions of the production environment.

4. Findings

This section presents the results of a pilot simulation conducted to evaluate the effectiveness of the proposed lean manufacturing model. The simulation compares the current production process with an improved version that integrates SMED, SLP, and Standard Work. In parallel, financial validation was performed using key investment appraisal metrics—Net Present Value (NPV), Internal Rate of Return (IRR), and the Benefit–Cost (B/C) ratio—to assess the economic feasibility of the proposed improvements. The findings from both operational and financial perspectives confirm the advantages and viability of implementing the lean-based process redesign.
The case study focuses on a textile manufacturing company located in Lima, Peru, operating within the apparel sector. The firm comprises six production lines: Safety Clothing, Face Protection, Head Protection, Hand Protection, Fall Protection, and Industrial Footwear. Among these, the production of industrial vests represents a core product line. However, the current production efficiency for this line was 78%, falling short of the industry benchmark of over 85%. This performance gap resulted in an estimated economic loss of 11% in 2023. To address this issue, the company initiated a pilot program aimed at implementing lean tools to enhance efficiency and achieve more competitive outcomes.
To assess the practical applicability of the proposed lean manufacturing model, a series of pilot tests were conducted with the objective of reducing downtime and enhancing consistency in work methods. The validation of Standard Work was carried out by measuring task durations and ensuring adherence to the newly established procedures. The implementation process followed a structured sequence of phases, including baseline data collection, process optimization, and on-site training of operators. Monitoring visits were conducted periodically between August and November 2024 to track progress and ensure compliance with the standardized workflow.

4.1. SLP Application Validation

The implementation of the new layout commenced with a preliminary meeting involving the production supervisor, during which the proposed modifications and their anticipated benefits were clearly outlined.
Redeployment Schedule: A detailed schedule was developed, specifying the dates for both the redeployment of workstations and the associated training activities.
Work Area Redeployment: The physical relocation of workstations was carried out on August 19 of the current year. This process required a total of five hours and was completed with the assistance of eight area workers.
Operator Training: A training session was conducted to familiarize operators with the revised layout and the new workflow for industrial vest production. Operator feedback was minimal, as the changes had been designed with a strong emphasis on comfort and satisfaction.
Measurement of Travel Time and Distance: To assess the effectiveness of the new layout, travel time and distance data were collected. A distance matrix was subsequently constructed based on the updated configuration of the sewing and embroidery areas.
Table 2 below presents the distance matrix compiled during the site visit following the completion of operator training.
Table 2 presents a percentage-based analysis of route measurements within the production area, following the implementation of the new layout. The data reflects the relative contributions of various routes to overall travel distance and time. Notably, one route accounts for over 98% of both distance and time, indicating it is the primary operational pathway—likely to represent the core production flow. Conversely, other routes, such as the one contributing only 4.45% to distance and 1.36% to time, suggest minimal movement and high efficiency, possibly associated with auxiliary or support tasks.
A particularly striking observation is the final entry, where the recorded distance is 0.00%, yet the corresponding time is 98.12%. This discrepancy implies that the activity in question involves negligible physical movement but is highly time-consuming, potentially due to processing delays, manual operations, or waiting periods. Such insights are critical for identifying inefficiencies that are not spatial but temporal in nature. Overall, the table serves as a diagnostic tool, highlighting both spatial and temporal dynamics of the workflow and offering a foundation for further optimization.

4.2. SMED Application of the Validation

The implementation of the SMED methodology in this pilot initiative aims to minimize machine setup times within the garment production area. Specifically, the straight-stitch machine involves nine distinct setup activities, each managed by a single operator with prior experience in its operation. Similarly, the overlock machine comprises ten setup tasks, also executed individually by trained operators. The pilot plan was launched in collaboration with the production supervisor, beginning with a briefing session to outline the objectives of SMED implementation and to identify the target machines. Subsequently, training sessions were organized for the operators responsible for both the straight-stitch and overlock machines. Figure 4 illustrates the training process conducted with the company’s personnel.
In the second phase, setup times were systematically measured to establish a baseline for evaluating improvements. An initial sample of 15 observations was collected, enabling a more accurate and representative analysis. For the flat-bed machine, eight samples were recorded initially, followed by seven additional samples taken on September 8th. These observations were gathered from the four operators actively working in the garment section. An identical procedure was applied to the overlock machine, ensuring consistency in data collection across both machine types. All four operators involved in its operation participated in the measurement process. The results of these time studies are summarized in Table 3, providing a comparative overview of set-up durations for both machines under current operating conditions.
The data presented in Table 3 illustrate the impact of SMED methodology on machine setup times for two key machines in the garment production area: the straight-stitch machine and the overlock machine. Prior to the implementation of SMED, the average setup time for the straight-stitch machine was 7.15 min. Following the intervention, this time was reduced to 4.59 min, representing a reduction of approximately 36%. Similarly, the overlocking machine showed a significant improvement, with setup time decreasing from 7.50 min to 4.24 min, which corresponds to a reduction of roughly 43%. These reductions indicate that the SMED approach effectively streamlined the setup process, minimizing downtime and enhancing operational efficiency.
These results are particularly significant given that each machine is operated by a single trained operator, and the improvements were achieved without increasing labor input. The consistent reduction across both machine types suggests that the SMED methodology was successfully adapted to the specific context of garment manufacturing. Moreover, the relatively close post-implementation setup times (4.59 and 4.24 min) indicate a more standardized and predictable setup process, which can contribute to better production planning and reduced variability. Overall, the data validates the effectiveness of the SMED pilot and supports its broader application across similar production environments.

4.3. Industry 4.0 Validation

The application of Industry 4.0 principles played a pivotal role in enhancing operational efficiency within the company. During the project, it was identified that proximity sensors—capable of detecting objects without physical contact—were already installed in the facility but remained unused due to a lack of training and a perceived lack of value. To address this, a structured reactivation plan was developed. The first phase involved a meeting with the production supervisor, during which the benefits of reactivating the sensors were presented. A detailed implementation schedule was created, outlining the training sessions and key milestones. The plant manager was also included in the training plan to ensure alignment across all levels of operation.
In the second phase, targeted training was delivered to machine operators. The sessions focused on the purpose and functionality of the proximity sensors, including how to analyze their application across different machines in the manufacturing area. The expected improvements—such as increased automation, reduced manual intervention, and enhanced process control—were clearly communicated. The operational flow introduced during the training is illustrated in Figure 6.
This visual representation helped operators understand the logic and timing of sensor-based automation. The reactivation of these sensors not only revived underutilized technology but also marked a significant step toward digital transformation on the shop floor.
In the third phase of the project, proximity sensors were reactivated and integrated into the company’s manufacturing area following the completion of operator training. These sensors were configured to detect machine occupancy and record usage duration. Once activated, operators resumed their regular tasks, during which the sensors collected 20 data points. This data were subsequently analyzed to assess the effectiveness of sensor integration and to identify patterns in machine utilization. The reactivation not only enabled real-time monitoring but also laid the groundwork for data-driven decision-making in production management.
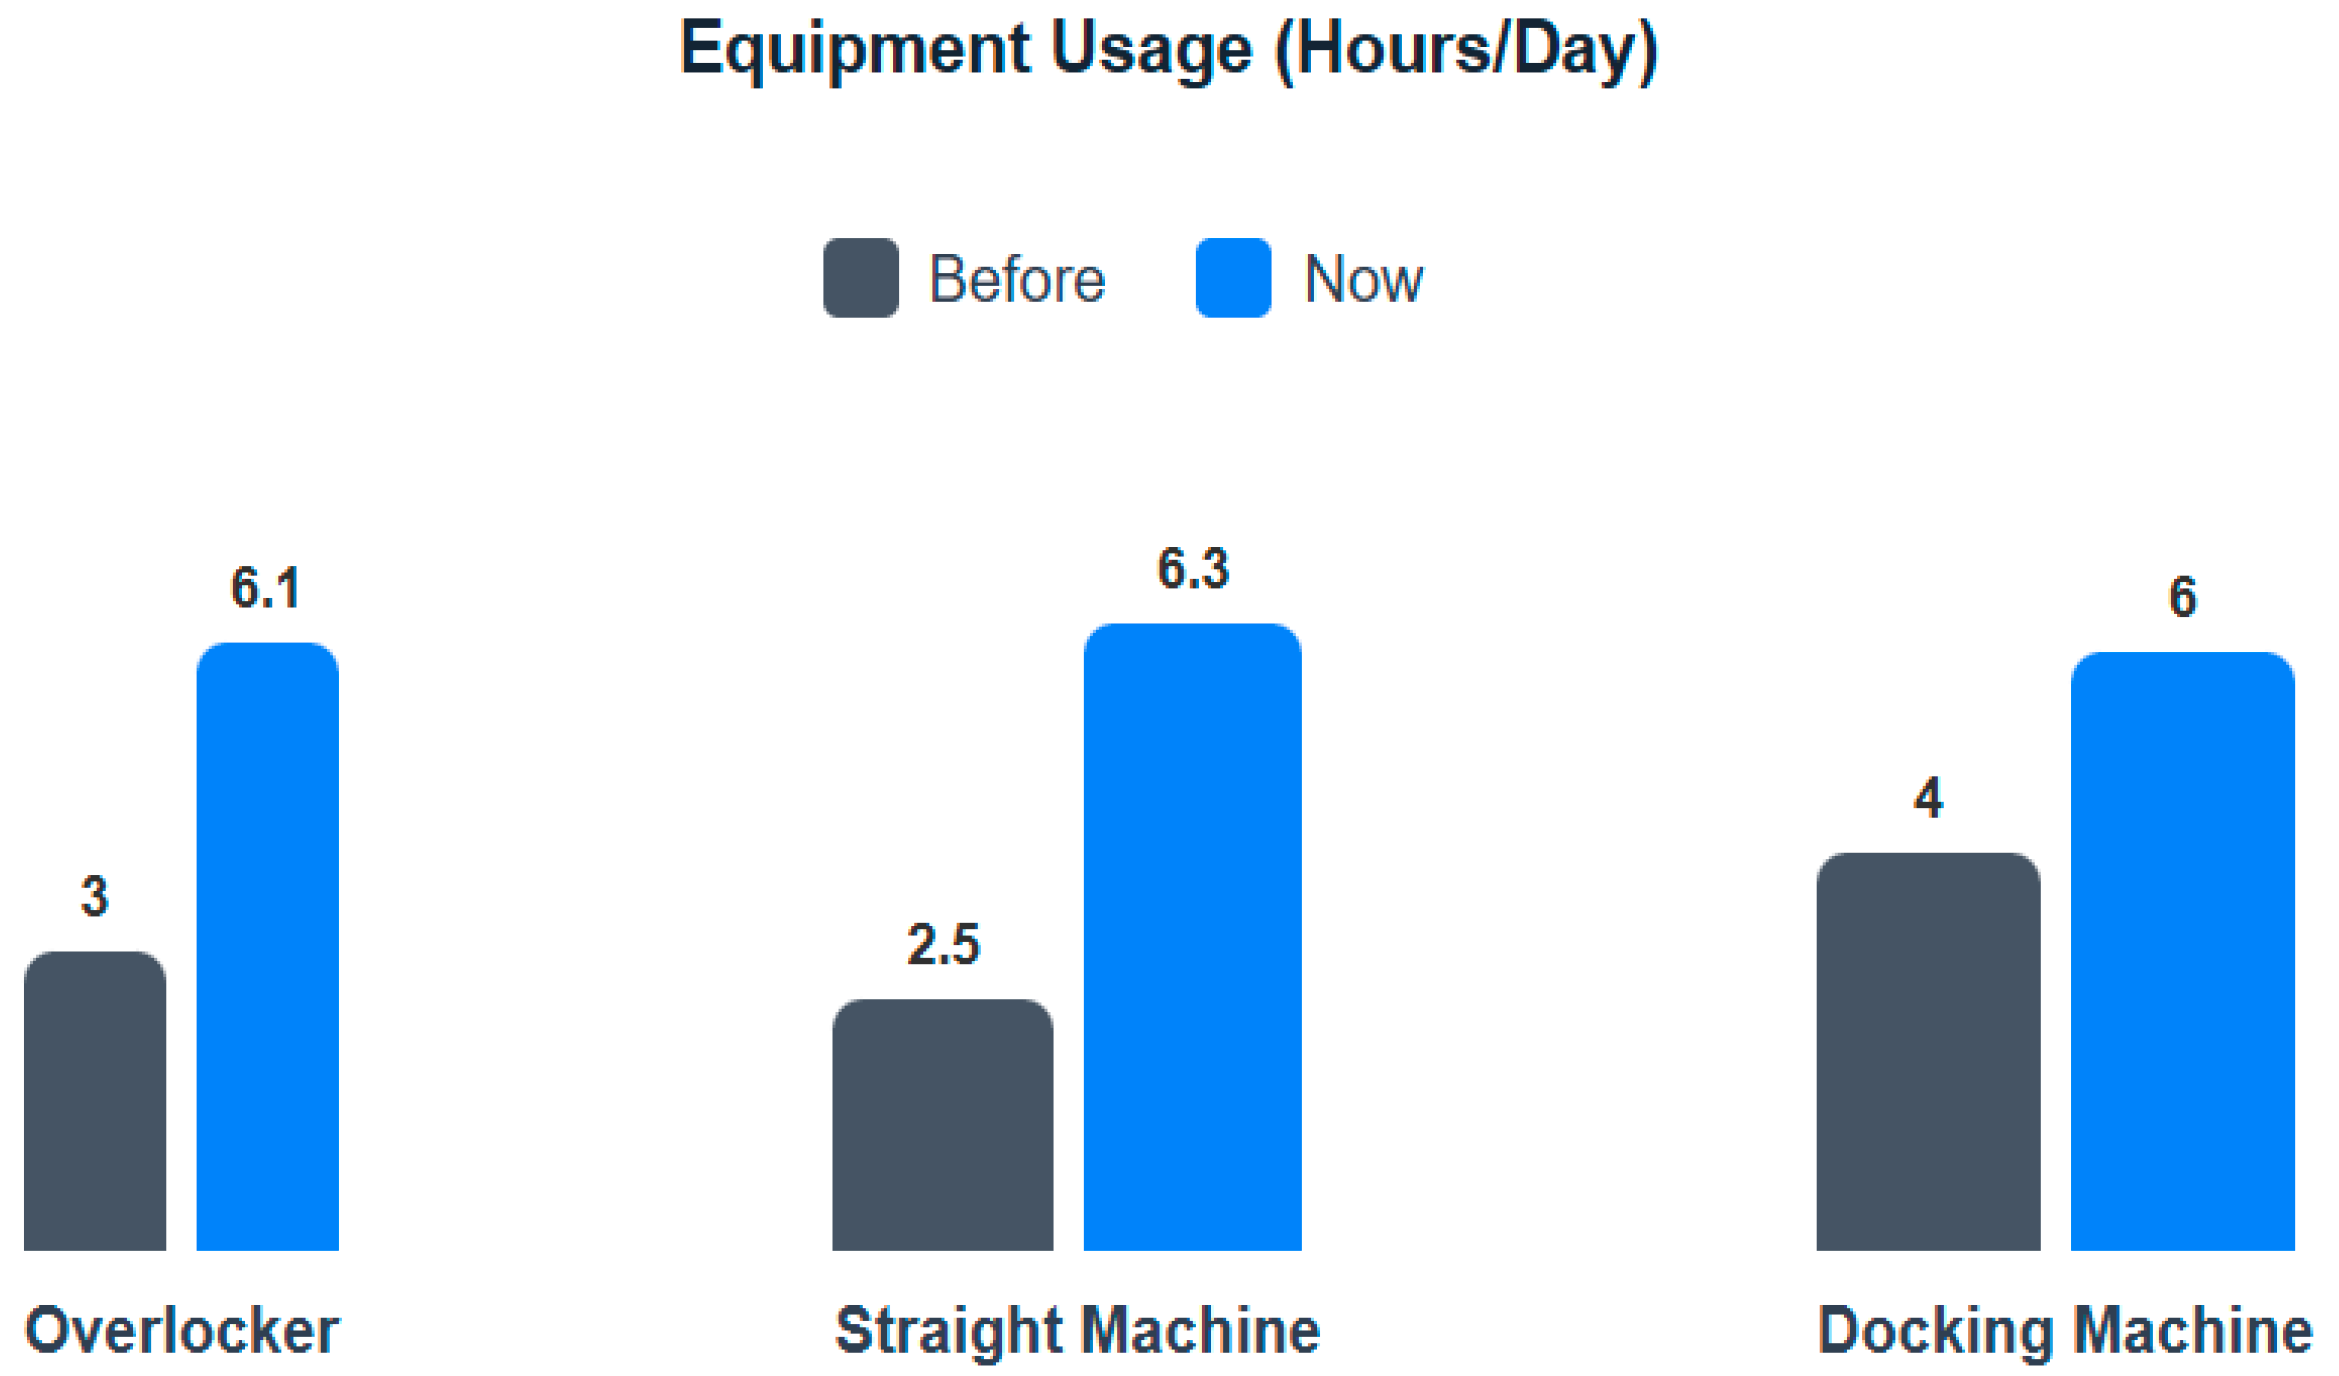
The fourth phase focused on validating operator performance based on the time measurements captured by the sensors. The analysis confirmed that the operators met the required performance standards to produce industrial vests. This validation demonstrated that the integration of proximity sensors provided accurate and actionable insights into production efficiency. The results obtained from this phase are visually represented in Figure 7, which illustrates the performance outcomes following sensor reactivation. Overall, this phase reinforced the value of Industry 4.0 technologies in enhancing transparency, accountability, and productivity on the shop floor.
Figure 7 illustrates the impact of proximity sensor activation on equipment utilization, as measured in hours per day. The bar chart compares the usage of three key machines—overlocker, straight machine, and docking machine—before and after the reactivation of the sensors. The data reveals a significant increase in daily usage across all three machines. For instance, the overlocker’s usage rose from 3 to 6.1 h per day, while the straight machine saw an even more substantial increase from 2.5 to 6.3 h. The docking machine also experienced a notable rise, from 4 to 6 h per day.
These results suggest that the activation of proximity sensors contributed to more consistent and efficient machine operation. By enabling real-time monitoring of machine occupancy and usage, the sensors are likely to help reduce idle time and improve workflow coordination. The increased usage times reflect not only better resource utilization but also enhanced operator awareness and accountability, as the system now provides transparent data on machine activity. Overall, the chart demonstrates how a relatively simple Industry 4.0 intervention can lead to measurable improvements in production efficiency.

4.4. Work Standardization Validation

The analysis of the garment production process revealed a total cycle time of 8.3 min, of which only 4 min were classified as value-added (VA) activities. To better understand the distribution of time, an activity table was developed, categorizing each task into the VA, Necessary but Non-Value-Added (NNVA), and Non-Value-Added (NVA) activities. The results showed that VA activities accounted for 53% of the total time, the NNVA activities 33%, and the NVA activities 14%. This breakdown provided a clear foundation for identifying inefficiencies and targeting areas for process improvement. The insights gained from this analysis were used to inform the development of a standardized procedure for overlock sewing.
In the second phase, operator training was conducted on 7 September 2024, via Zoom, ensuring accessibility and convenience for all participants. The training session introduced the objectives of the new standard procedure and utilized flowcharts and visual aids to enhance comprehension. Following the training, the third phase involved the practical application of the standardized process. The research team conducted time measurements based on 20 observations per activity, capturing data from real production batches. Operators implemented the new workflow in the garment area, and the recorded times were used to evaluate consistency and efficiency.
In the fourth phase of the project, activity time measurements were conducted to assess the impact of process improvements on production consistency. Initial validation revealed that variability in materials and execution times was negatively affecting overall performance. These inconsistencies led to fluctuations in output quality and resource utilization. To address this, the team implemented task standardization and enhanced coordination among operators. These adjustments contributed to a more stable production environment, reducing errors and optimizing the use of available resources. As a result, confidence in both product efficiency and quality increased significantly.
Following these improvements, a comparative analysis of activity times was carried out, as presented in Table 4. This table highlights the differences in execution times before and after the standardization efforts, providing quantitative evidence of the process stabilization. The data not only validates the effectiveness of the interventions but also serves as a benchmark for future optimization initiatives. By minimizing variability and aligning operator performance with standardized procedures, the company achieved greater predictability and control in its garment production workflow.
Table 4 presents a comparative analysis of activity classifications before and after the implementation of process improvements. The most notable change is observed in the proportion of Value-Added (VA) activities, which increased significantly from 64% to 83%. This indicates that a larger portion of the total process time is now dedicated to tasks that directly contribute to the final product. Such an increase reflects the effectiveness of standardization and training efforts, as more time is being spent on productive, outcome-oriented operations. This shift not only enhances efficiency but also improves the overall value delivered to the customer.
Simultaneously, there is a marked reduction in Non-Value-Added (NVA) and Necessary but Non-Value-Added (NNVA) activities. NVA activities dropped from 22% to 9%, while NNVA activities decreased from 14% to 8%. These reductions suggest that sources of waste—such as delays, unnecessary movements, or redundant steps—have been successfully minimized. The decline in NNVA activities also implies better coordination and planning, allowing essential but indirect tasks to be executed more efficiently. Overall, the data in Table 4 confirm that the process improvements led to a more streamlined, value-focused workflow, aligning with lean manufacturing principles.

4.5. Sustainability Validation

In a real-world production setting, a validation process was conducted to identify limitations affecting the sustainability of the sewing area. This analysis enabled the research team to connect practical observations with actionable improvement opportunities. The first phase involved direct interviews with 11 sewing operators, conducted with prior consent. Workers highlighted that the current pocket design led to excessive fabric waste, a claim substantiated by the visible accumulation of textile scraps near their workstations. This insight allowed the team to address material inefficiencies and initiate waste reduction strategies. Additionally, participants were encouraged to share broader perspectives on sustainability, including environmental initiatives and resource-conscious practices relevant to the Sustainable Project.
The second phase focused on stakeholder engagement through targeted surveys. To assess the feasibility and relevance of the sustainability pilot, feedback was gathered from two key groups: B2B customers and production operators. A sample of ten frequent B2B clients was surveyed regarding their expectations of suppliers integrating sustainability into their manufacturing processes—75% expressed support for sustainable vest production. Similarly, ten operators involved in garment manufacturing were surveyed, showing strong support for sustainability, particularly in areas such as material selection, production practices, recycling, and transparency. Responses were categorized as “Yes,” “No,” or “Not sure” to facilitate clear visualization. The results, presented in Figure 8, validate the strategic direction of the sustainability initiative and confirm alignment with both internal capabilities and market expectations.
Figure 8 presents key insights into sustainability perceptions from two distinct stakeholder groups: operators and B2B customers, illustrated through two separate radar charts. The first chart, “Survey of Operators,” reveals a predominantly positive outlook among operators regarding sustainability. High affirmative responses are observed for “Sustainability training” (90% Yes), “Application of good sustainable practices” (70% Yes), and “Interest in participating in improvements” (80% Yes). Conversely, a relatively low “Yes” rate (30%) for “Difficulties in implementing sustainability” suggests that operators generally perceive few challenges in this area. The “Perception of unnecessary waste” (60% Yes) and some “Not Sure” responses indicate potential areas where further awareness or clarification could be beneficial.
The second chart, “B2B Customer Survey,” highlights strong positive perceptions among customers concerning their “Knowledge of sustainable practices” (90% Yes) and their “Preference for suppliers with sustainable practices” (80% Yes). However, customer interest in “receiving information on sustainable actions” (30% Yes) and their “Willingness to pay a little more” (40% Yes) are notably lower. These findings suggest that while customers generally support sustainability, their engagement might be limited when it comes to actively seeking information or incurring additional costs. Collectively, both surveys provide a clear snapshot of the current stance of different stakeholders on sustainability and pinpoint areas ripe for strategic development and communication.
In the third phase of the sustainability initiative, a revised version of the standardized work method was developed, incorporating environmentally conscious practices. Drawing on insights from the initial diagnostic phases, each step of the garment production process was reviewed and updated to include sustainability-focused recommendations. These included strategies to minimize material waste, reduce unnecessary operator movement, and enhance ergonomic conditions. To clearly communicate these improvements, a dedicated “green column” was added to the standardized work sheet, highlighting the sustainable actions associated with each task. This integration ensured that sustainability was embedded directly into daily operations, rather than treated as a separate or secondary concern.
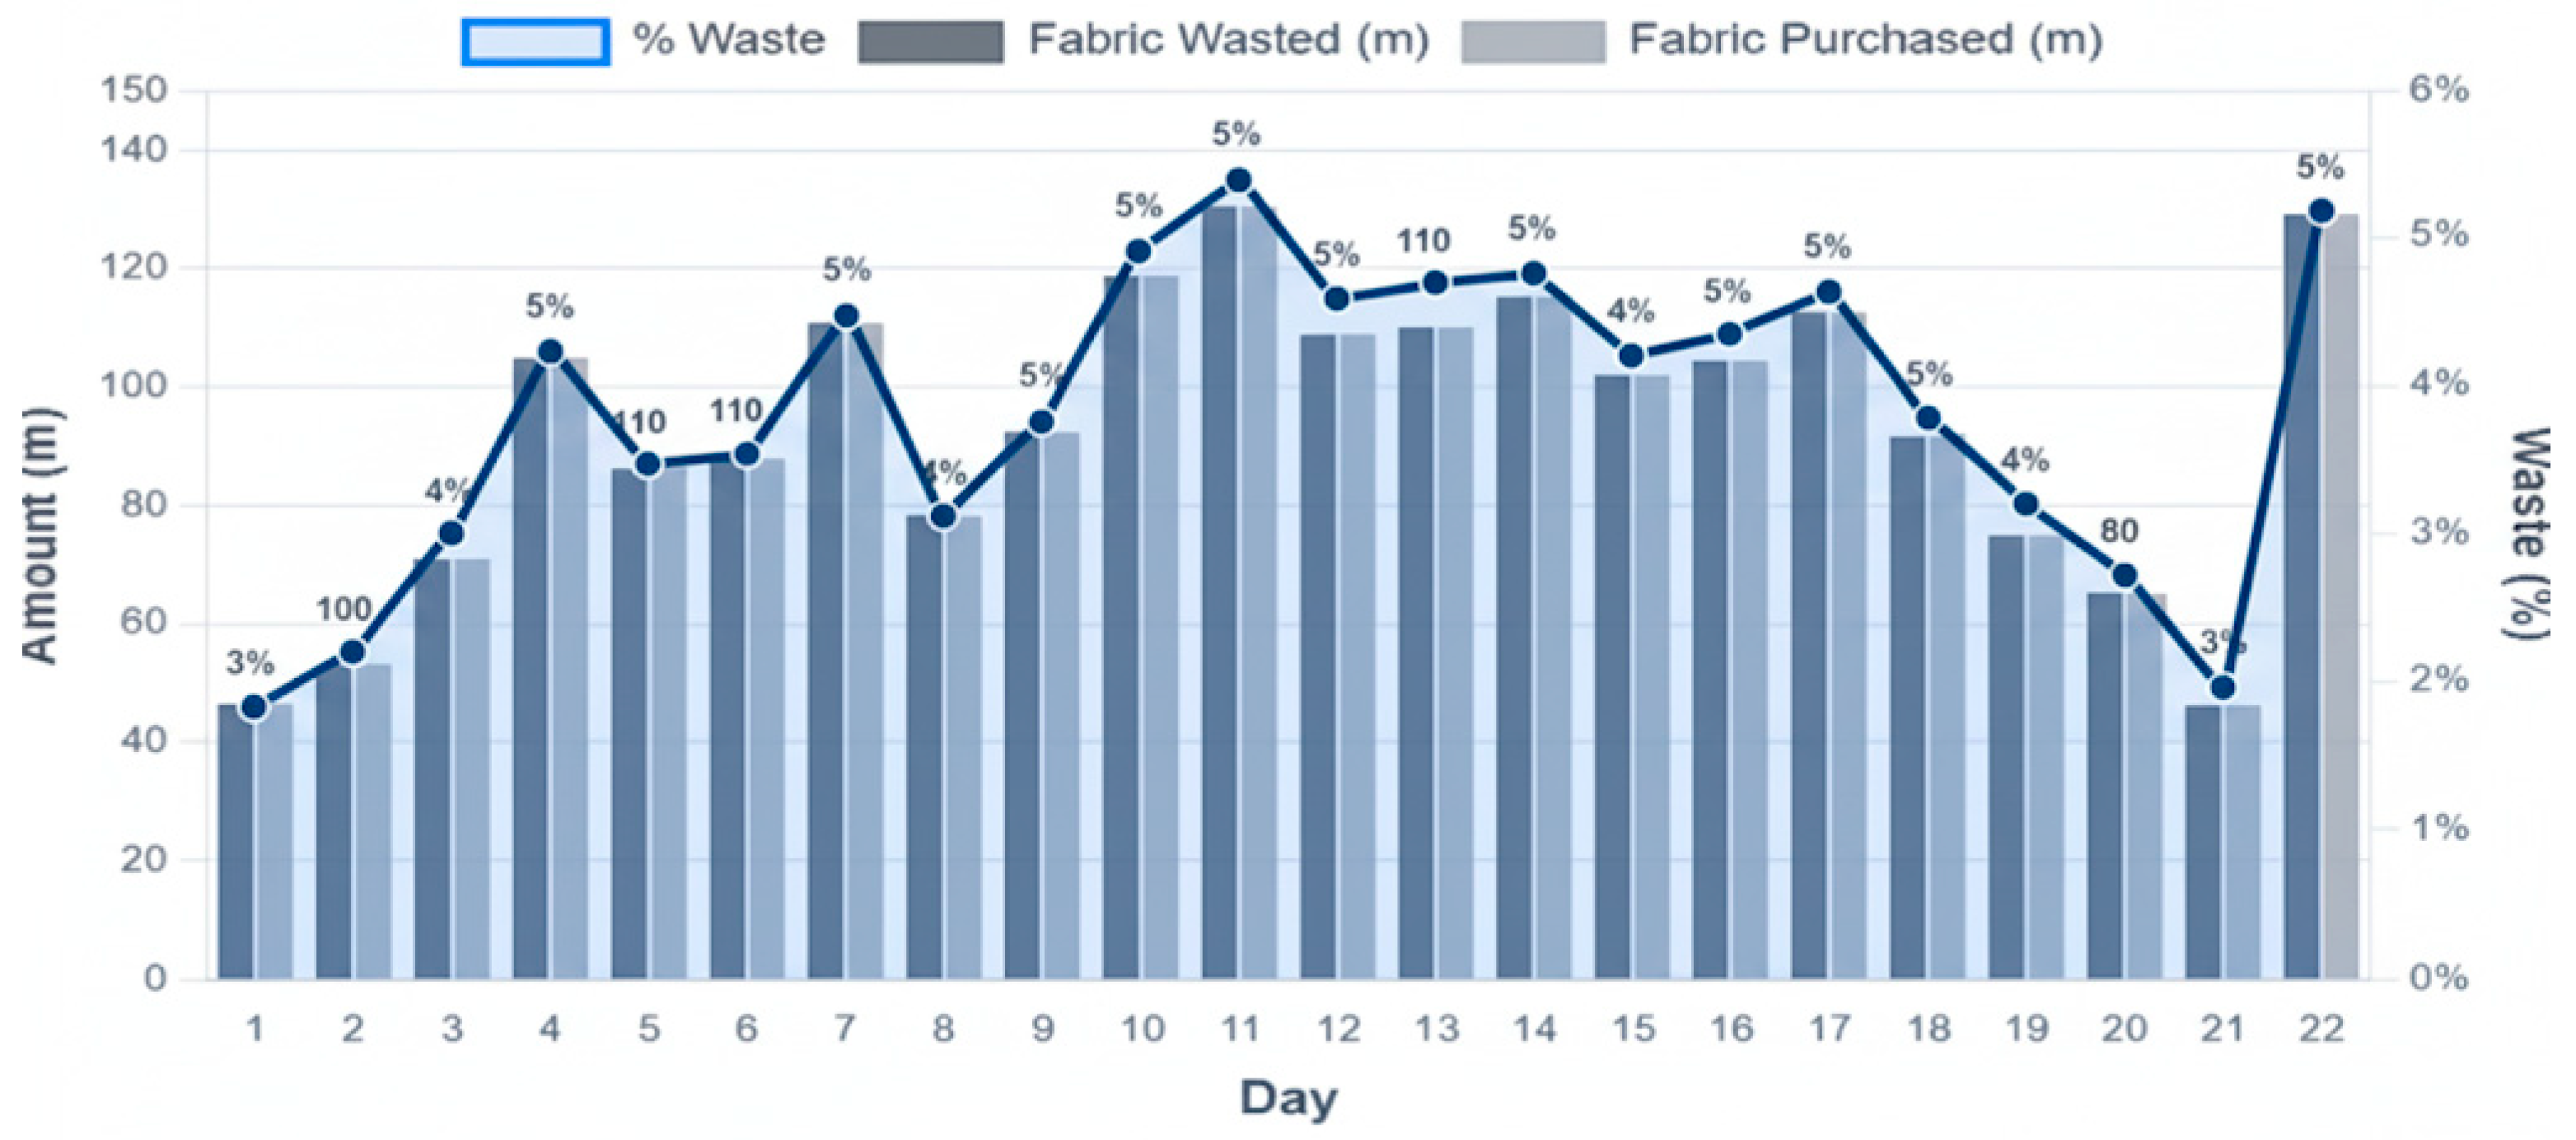
The fourth phase focused on evaluating the effectiveness of these sustainable practices. Data collected between mid-September, and mid-October revealed a measurable reduction in fabric waste. For clarity, in this study, fabric waste refers only to the unusable fraction of cut fabric (e.g., margins, irregular scraps, or defective parts). Based on this definition, waste levels decreased from 8% of the total fabric used at the beginning of the process to 4% after the implementation of the revised standardized working method. In other words, approximately 96% of the fabric cut during production was effectively transformed into garments, while only 4% represented irrecoverable waste. These findings validate the approach and support the continued application of sustainability principles in production planning and execution. The results are visually represented in Figure 9, which shows the percentage of textile residues following the implementation of the revised process. These findings validate the approach and support the continued application of sustainability principles in production planning and execution.
This chart in Figure 9 illustrates the daily fabric waste and purchased amounts in meters, alongside the daily waste percentage during production, over a period of 22 days. The light grey bars represent the amount of fabric purchased each day, while the dark grey segments on top of these bars indicate the portion wasted. The blue line with data points shows the daily waste percentage. Throughout most of the observed period, the fabric purchased remained stable at around 110 m per day and the waste percentage consistently stayed at 5%, reflecting controlled and predictable production waste levels.
However, there are a few noticeable deviations from this pattern. On Day 18 and Day 20, the purchased fabric dropped significantly to 80 and 100 m, respectively, and the waste percentage also decreased to 3%. This indicates improved efficiency or perhaps a change in the production process or material handling on those specific days. Conversely, on Day 19, despite an increase in purchased fabric to 120 m, the waste percentage returned to 5%, suggesting that higher input does not necessarily lead to reduced waste. Overall, the chart highlights consistent production patterns with a few exceptional days that could warrant further investigation to identify best practices.
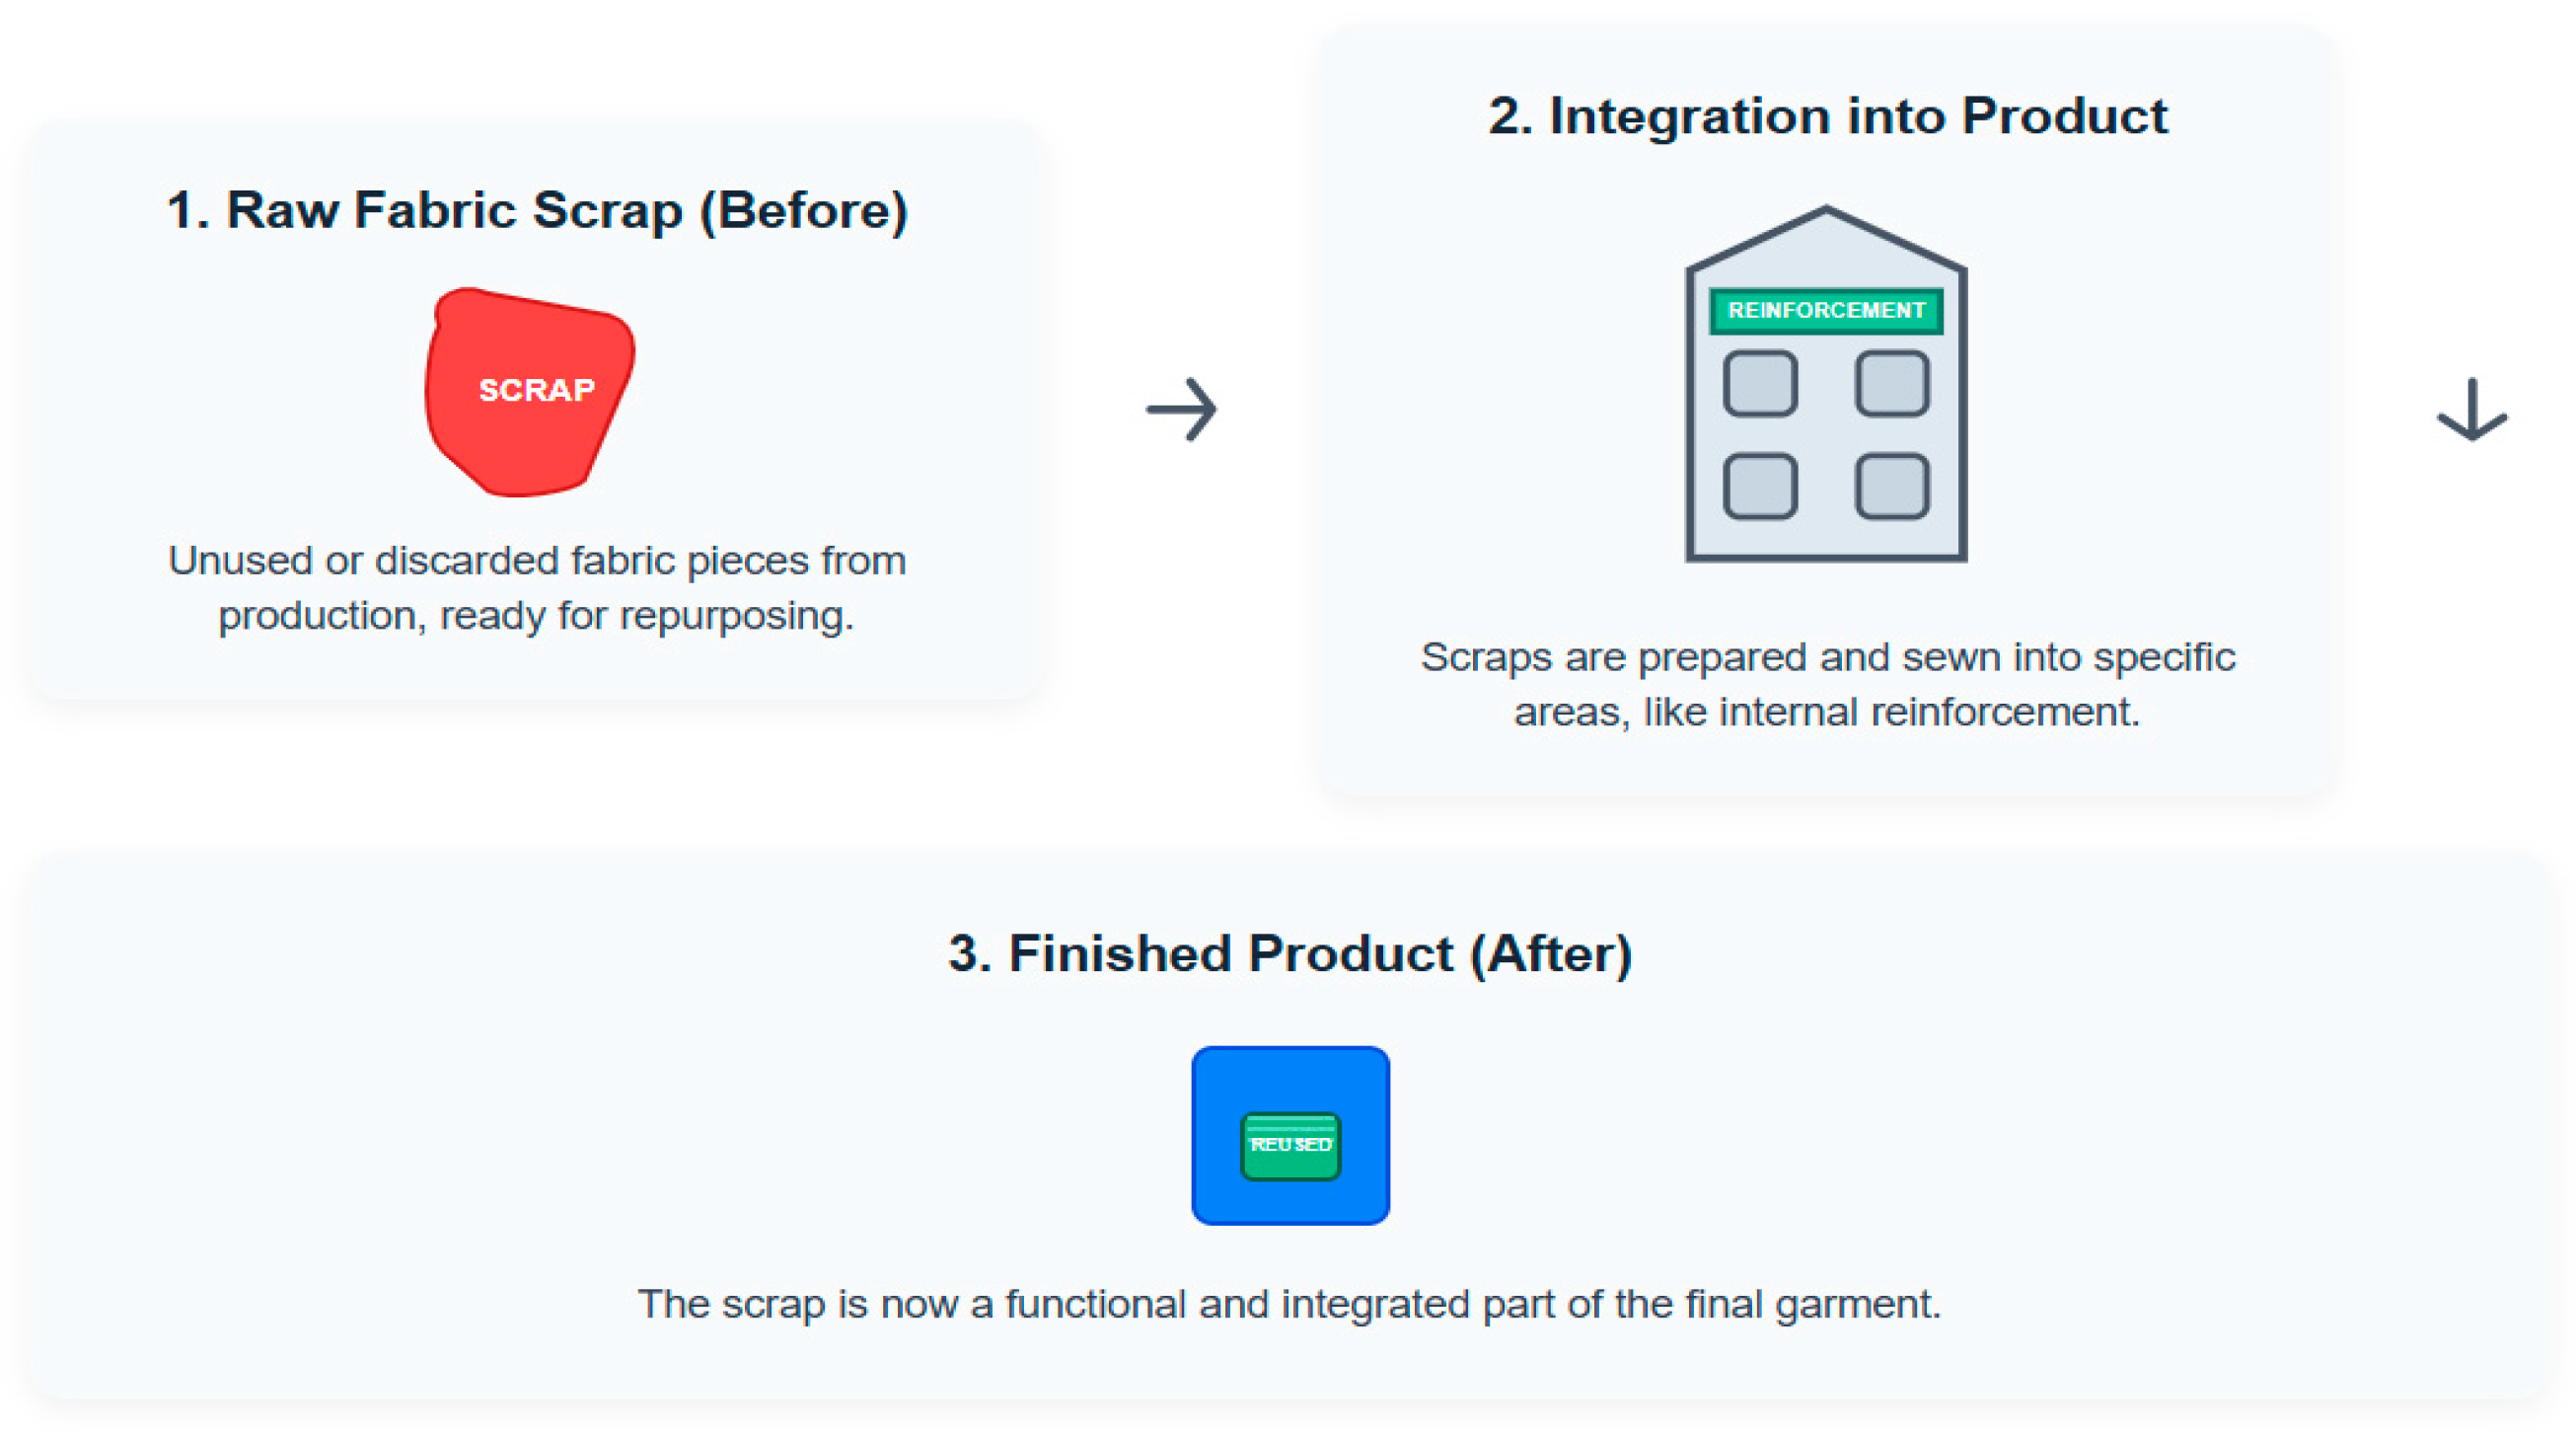
Figure 10, titled “Reusing Fabric Scraps: A Sustainable Process,” visually outlines a three-stage transformation of textile waste into a functional component of a finished garment. The first stage labelled “1. Raw Fabric Scrap (Before),” depicts a red piece of fabric marked as “SCRAP,” representing unused or discarded textile remnants from the production line. The accompanying description emphasizes that these materials, which would typically be considered waste, are now being collected and prepared for repurpose. This stage highlights the initial opportunity to intercept waste before it exists in the production cycle.
The second and third stages illustrate the integration and final use of these scraps. In “2. Integration into Product,” the scraps are shown being sewn into specific areas of a garment—such as internal reinforcements, demonstrating a practical and value-adding reuse strategy. The schematic of a building with the label “Reinforcement” symbolizes structural support, reinforcing the idea that these scraps contribute to product durability. Finally, “3. Finished Product (After)” presents a blue square labelled “Reused,” signifying that the once-discarded material is now a functional part of the final product. This visual progression effectively communicates how sustainable design can be embedded into production by transforming waste into utility, aligning with circular economic principles.
As a final step in the sustainability initiative, the figure illustrates the volume of fabric scraps that were successfully recycled during the assessment period. In parallel, the implementation of sustainable practices contributed to improved organization within the manufacturing area, notably eliminating loose fabric remnants that previously accumulated on the floor. This not only enhanced workplace cleanliness but also reinforced a culture of efficiency and environmental responsibility.
During the pilot test, the reuse of fabric scraps led to a 10% reduction in new fabric consumption per unit, a value obtained by comparing the average input required before and during implementation. This was possible because certain internal components were replaced with reused materials. Functional tests confirmed the durability of these reinforcements, which remained intact after five days of continuous use. Furthermore, optimized cutting planning led to a 4% reduction in textile waste, calculated from the difference between the initial surplus material and that recorded in the pilot test. Operators also reported that the addition of scraps did not affect production speed and led to a more organized and efficient workspace. Overall, these improvements translated into increased production, highlighting the operational benefits of implementing sustainable practices.
As a final component of the sustainability pilot, the facility upgraded its lighting system by replacing conventional fixtures with energy-efficient LED lights. These were installed in each production area with clear usage guidelines: lights were to remain on only during active vest production. This initiative was supported by a broader behavioral shift toward responsible energy use, reinforced through updated work routines. Operators were instructed to activate lighting only during machine operation, significantly reducing daily energy consumption. Over the course of a week, lighting usage was monitored in relation to machine activity, while air conditioning was restricted to operate only between 23 °C and 25 °C. On/off controls were assigned to operators, who recorded estimated usage times daily. These measures demonstrate that small and medium-sized enterprises (SMEs) can adopt impactful sustainability practices without major financial investment—by focusing on environmental responsibility, employee engagement, and a balanced approach to economic growth and social well-being.
The implementation of lean practices and process standardization generated measurable environmental benefits. Annual electricity savings reached 2010 kWh, representing avoided emissions of approximately 804 kg CO2e. This reduction is equivalent to the yearly electricity use of two average Peruvian households or the carbon sequestration of 13 mature trees. In terms of material efficiency, scrap levels decreased from 8% to 4%, cutting raw material waste by half. This translates into lower disposal needs and reduced demand for virgin inputs, aligning with ISO 14001 [45] environmental management principles and reporting approaches recommended by the GRI Standards.
Overall, these improvements not only reduced operational costs but also contributed to a more sustainable production model. By combining efficiency gains with quantifiable environmental indicators, the SME advanced toward internationally recognized sustainability benchmarks while reinforcing its competitiveness. Following the validation of the implemented tools, Table 5 presents a consolidated summary of the results obtained. It compares key performance indicators before and after implementation, along with their respective units of measurement. The improvements achieved across various areas of the plant are clearly reflected in this comparison, offering a comprehensive view of the operational impact and effectiveness of the applied strategies.
Table 5 presents a comparative analysis of key performance indicators before and after the implementation of process improvements in the manufacturing area. The data reveal a notable increase in efficiency, rising from 79% to 84% and indicating a more streamlined and productive workflow. Additionally, the distance travelled by operators was reduced from 14.13 m to 11.6 m, reflecting improved workstation layout and reduced unnecessary movement. This spatial optimization likely contributed to the observed reduction in preparation time, which decreased significantly from 7.5 min to 4.55 min, enhancing overall responsiveness and cycle time.
Moreover, the utilization rate of equipment improved from 87% to 94%, suggesting better scheduling, fewer idle periods, and more consistent machine use. Perhaps most importantly from a lean manufacturing perspective, the percentage of non-value-added (NVA) activities dropped from 14% to 8%, demonstrating a successful effort to eliminate waste and focus on value-generating tasks. Collectively, these results confirm that the implemented changes not only enhanced operational efficiency but also aligned the production process more closely with lean and sustainable manufacturing principles.

4.6. Economic Validation

The financial analysis of the project demonstrates its strong economic viability. Annual savings were estimated at approximately S/31,000, which, although lower than the total initial investment, is supported by robust financial indicators. The Net Present Value (NPV) was calculated at S/54,292.23, a positive figure that confirms the project’s capacity to generate value over time. Additionally, the Internal Rate of Return (IRR) reached 76.02%, significantly exceeding the Cost of Capital (COK) of 18%, further validating the project’s profitability. The Benefit–Cost (B/C) ratio stood at 1.31, indicating that for every sol invested, the return was S/2.13, highlighting a favorable return on investment.
Moreover, the payback period was estimated at five years, suggesting a reasonable timeframe for recovering the initial investment through operational savings. These financial metrics collectively confirm that the project is not only economically feasible but also strategically sound. The combination of cost reduction, efficient resource use, and long-term financial return underscores the project’s alignment with sustainable business practices. This analysis reinforces the idea that sustainability-oriented investments can yield measurable economic benefits, particularly when supported by structured implementation and performance monitoring.
To further support the financial viability of the project, a summary of the key economic indicators is presented in Table 6. This table consolidates the most relevant financial metrics, offering a clear and concise overview of the project’s economic performance. Each metric is accompanied by a brief interpretation to facilitate understanding of its significance. The data confirms that the project not only meets but exceeds the minimum financial thresholds typically required for investment justification
The positive Net Present Value (NPV), high Internal Rate of Return (IRR), and favorable Benefit–Cost (B/C) ratio collectively reinforce the project’s profitability and long-term sustainability. These indicators, when considered alongside the estimated annual savings and reasonable payback period, provide compelling evidence of the project’s strategic and financial soundness. The table below serves as a comprehensive reference point for stakeholders evaluating the return on investment and the broader impact of the implemented improvements.
Table 6 summarizes the core financial outcomes of the project. The estimated annual savings of S/31,000 reflect a tangible reduction in operational costs. A Net Present Value (NPV) of S/54,292.23 confirms that the project is expected to generate value over time, while the Internal Rate of Return (IRR) of 76.02% significantly surpasses the Cost of Capital (COK) of 18%, indicating high profitability. Furthermore, the Benefit–Cost (B/C) ratio of 1.31 demonstrates that for every sol invested, the return was S/2.13. These results collectively validate the financial feasibility of the project and provide a solid foundation for future replication or scaling in similar industrial contexts.

5. Discussion

This study builds upon a previous investigation that diagnosed operational inefficiencies, including bottlenecks, workstation layout issues, and material flow disruptions. While the earlier work proposed a conceptual model for improvement, the current study validates its practical effectiveness through empirical monitoring and comparison with baseline data. A 6% increase in the efficiency index was observed, confirming the positive impact of the integrated approach on operational optimization and reinforcing the company’s competitive position.
Beyond this general improvement, several key performance indicators (KPIs) demonstrated notable progress. For instance, the distance travelled by operators and materials during production was reduced from 14 m to 11.4 m, reflecting the successful application of SLP methodology. This not only enhanced process efficiency but also improved ergonomic conditions by minimizing unnecessary movement.
Setup time was reduced by 60%, from an average of 7.6 min, through the implementation of SMED supported by Industry 4.0 technologies. The integration of smart sensors and partial automation enabled faster machine changeovers, contributing to a more agile production environment. These findings align with previous studies that reported similar efficiency gains through SMED and targeted training, emphasizing the importance of preparation and continuous monitoring [46].
Work Standardization techniques led to a 10% reduction in non-value-adding activities—from 14% to 8%. This was achieved by promoting task consistency and reducing variability, allowing workers to focus on value-generating operations. Time and motion studies further enabled the elimination of redundant steps. These results are consistent with prior research that reported reductions in non-value-added activities from 43% to 5%, demonstrating the effectiveness of combining lean and work-study tools in the textile sector [47].
From a sustainability perspective, fabric waste was reduced to 4% by reusing leftover materials for components such as pockets and decorative stripes, now labelled sustainable. This approach resonates with growing consumer demand for environmentally responsible practices, as highlighted by Juanga et al. [48], who emphasized the challenges of textile waste management in fast fashion. While some studies approached sustainability through AI-based quality control [49], this study integrates sustainability from the outset using simple sensors and low-cost solutions adapted to small enterprises. This distinction highlights the feasibility of implementing sustainable practices without heavy technological dependence.
Evidence from previous studies confirms that lean practices can be successfully implemented in low-technology settings, generating productivity gains without the need for high financial investments [50]. In the case of textile micro-enterprises, the application of a data-driven lean framework proved effective in enhancing performance by improving the use of resources and decision-making processes [40]. Complementarily, research has shown that integrating Industry 4.0 solutions into manual workstations together with IoT systems and Business Intelligence tools produced a 12.3% increase in efficiency, even when production faced seasonal fluctuations [51]. Taking together, these contributions reinforce the present study, which integrates conventional lean techniques such as SMED and SLP with Industry 4.0 technologies and sustainability principles to achieve improvements across multiple dimensions. These findings support the current study’s approach, which combines traditional lean tools such as the SMED and the SLP with Industry 4.0 technologies and sustainability principles to achieve multidimensional improvements.
Unlike previous studies that often focus on isolated interventions—such as training [28], layout optimization [50], or digitalization [51] —this study presents a holistic framework that integrates multiple methodologies. The observed improvements in setup time, reduction of non-value-added activities, and material waste reflect a comprehensive advancement that surpasses the one-dimensional approaches of earlier research. This multidimensional integration offers both theoretical and practical contributions by demonstrating how traditional lean tools can be effectively combined with emerging technologies and sustainability strategies in resource-constrained environments.
However, it is important to acknowledge certain limitations. This study is based on a single case within the Peruvian textile sector, which may limit the generalizability of the findings. While the framework is designed to be scalable, its effectiveness in other sectors or regions may vary depending on contextual factors such as digital maturity, workforce skills, and production complexity. Additionally, the reliance on low-cost sensor technologies, while practical, may not capture the full potential of advanced Industry 4.0 systems.
Theoretically, this study contributes to the growing body of literature on hybrid models that integrate lean manufacturing with Industry 4.0 and sustainability. It provides empirical evidence supporting the feasibility of such integration in SMEs, particularly in the textile sector. Practically, the findings offer a replicable model for similar organizations seeking to enhance efficiency without significant capital investment. This dual contribution is particularly relevant for industries operating under resource constraints, where the adoption of high-cost technologies may not be feasible, yet operational improvements remain critical for competitiveness.

6. Conclusions

This study proposed and empirically validated an integrated framework that combines lean manufacturing tools—namely Systematic Layout Planning (SLP), Single-Minute Exchange of Dies (SMED), and Standard Work—with real-time data tracking within a digital Business Process Management (BPM) environment. Conducted in a Peruvian textile SME, the research addressed persistent inefficiencies and low digital maturity by demonstrating how traditional process improvement methodologies can be effectively adapted to resource-constrained production settings.
The findings reveal that the hybrid approach led to measurable improvements in operational performance, including a 5% increase in overall efficiency, a 60% reduction in setup time, and a 5% decrease in fabric waste. These results underscore the practical viability of integrating lean tools with low-cost Industry 4.0 technologies to enhance workflow standardization, layout optimization, and production responsiveness.
Real-time monitoring of key performance indicators (KPIs) played a critical role in enabling transparency and data-driven decision-making. The reuse of textile waste for eco-labelled components further illustrates the framework’s alignment with sustainability objectives, achieved without reliance on high-cost technological infrastructure.
From a methodological perspective, this study contributes to the literature by presenting a replicable and scalable model that bridges lean manufacturing, digital transformation, and sustainability. Unlike prior research that often isolates these domains, this study demonstrates their synergistic potential when applied holistically in low-tech environments.
Scientifically, this research advances the discourse on hybrid operational models by providing empirical evidence of their applicability in emerging market contexts. It highlights the feasibility of achieving multidimensional improvements—efficiency, adaptability, and environmental performance—through integrated, context-sensitive interventions. Practically, the framework offers a strategic pathway for SMEs seeking to modernize operations under financial and infrastructural constraints. Its adaptability to varying production conditions and emphasis on incremental innovation make it particularly relevant for industries facing volatile market dynamics and increasing sustainability pressures. It presents answers for each research question in this study, as seen below:
(1) How can lean manufacturing tools be effectively integrated into a digital BPM framework to improve production efficiency in textile manufacturing?
The findings demonstrate that lean tools can be successfully embedded within a digital BPM structure to streamline workflows, reduce setup times, and optimize layout design. The integration led to a measurable increase in overall efficiency from 79% to 84%, confirming the effectiveness of this hybrid approach.
(2) What role does real-time data tracking play in enhancing transparency, decision-making, and sustainability outcomes in re-engineered production systems?
Real-time monitoring enabled continuous tracking of key performance indicators (KPIs), such as setup time, material flow, and non-value-added activities. This transparency facilitated faster decision-making, reduced fabric waste by 5%, and supported the production of eco-friendly garments, aligning operational goals with sustainability objectives.
(3) To what extent can such an integrated approach contribute to long-term operational resilience and competitiveness in the textile sector?
The results suggest that the proposed model enhances not only short-term efficiency but also long-term adaptability. By reducing production cycle times, improving ergonomics, and minimizing waste, the company strengthened its capacity to respond to market fluctuations and sustainability demands—key factors for maintaining competitiveness in a dynamic global industry.

6.1. Limitations

This study is based on a single case within a specific SME context, which may limit the generalizability of the findings. Additionally, while performance improvements were quantitatively measured, no formal statistical significance testing was conducted. The environmental impact of fabric reuse was not assessed through a life cycle analysis (LCA), which could provide a more comprehensive view of sustainability outcomes.

6.2. Future Research Directions

Future research could extend the proposed framework across multiple organizations and sectors to assess its scalability and contextual adaptability. Incorporating advanced analytics—such as AI-driven predictive maintenance, digital twins, or machine learning-based process optimization—may further enhance operational resilience. Additionally, integrating formal life cycle assessments and cost–benefit analyses would strengthen the evaluation of both environmental and economic impacts, thereby supporting more informed decision-making in sustainable manufacturing systems.

Author Contributions

Conceptualization—F.M., S.M., and O.Y.; Methodology—F.M., S.M., O.Y., P.C., and J.C.A.; Validation—F.M. and S.M.; Formal analysis—F.M., S.M., P.C., and O.Y.; Investigation—F.M. and S.M.; Resources—F.M., S.M., O.Y., P.C., and J.C.A.; Data curation—F.M. and S.M.; Writing-original draft—F.M., S.M., O.Y., and P.C.; Writing-review and editing—F.M., S.M., O.Y., and J.C.A.; Visualization—F.M., S.M., and O.Y.; Supervision—P.C., J.C.A., and O.Y.; Project administration—F.M., S.M., P.C., J.C.A., and O.Y.; Funding acquisition—J.C.A. All authors have read and agreed to the published version of the manuscript.

Funding

This research work is funded by Dirección de Investigación de la Universidad Peruana de Ciencias Aplicadas through Ex-POST 2025-1, with the knowledge contribution of Izmir Democracy University.

Institutional Review Board Statement

Not applicable.

Informed Consent Statement

Not applicable.

Data Availability Statement

The data presented in this study is available on request from the corresponding author.

Acknowledgments

The authors acknowledge the valuable inputs from reviewers and the editor in enhancing the quality of this work.

Conflicts of Interest

The authors declare no conflicts of interest. The funders had no role in the design of the study; in the collection, analyses, or interpretation of data; in the writing of the manuscript; or in the decision to publish the results.

Abbreviations

The following abbreviations are used in this manuscript:
5SSeiri (Sort), Seiton (Set in order), Seiso (Shine), Seiketsu (Standardize), and Shitsuke (Sustain)
B/CBenefit–Cost Ratio
BPMBusiness Process Management
COKCost of the Capital
HMMBIHybrid Manufacturing and Machine Building Industry
IRRInternal Rate of Return
IVPF-AHPthe Interval-Valued Pythagorean Fuzzy Analytic Hierarchy Process
KPIsKey Performance Indicators
LCALife Cycle Analysis
LPsLean Practices (LPs)
NNVANecessary but Non-Value-Added (NNVA)
NPVNet Present Value
NVANon-Value-Added
NVAsNon-Value-Added Activities
OEEOverall Equipment Effectiveness
QRMQuick Response Manufacturing
SLPSystematic Layout Planning
SMEDSingle-Minute Exchange of Dies
SMEsSmall Medium Size Companies
TPMTotal Productive Maintenance
VAValue Added
VSMValue Stream Mapping

References

  1. Monteiro, R.A.; Junior, D.S.G.; Sobral, E.F.M.; de Falcão, P.H.B.; de Melo, F.J.C.; Bastos-Filho, C. Global Trends and Practices of Industry 4.0 Applications in the Clothing Sector: A Systematic Literature Review. Adm. Sci. 2024, 14, 258. [Google Scholar] [CrossRef]
  2. Mestanza, M.T.; López, N.G.; Moron, M.S.; Torres-Mestanza, M.; Eng, B.; Guerrero-López, N.; Sáenz-Moron, M.; Eng, M. Improvement Model to Increase the Efficiency of the Sewing Area in a Textile SME by Applying SMED, 5S and Standardized Work—A Peruvian Case Study. In Proceedings of the 21st LACCEI International Multi-Conference for Engineering, Education and Technology (LACCEI 2023): “Leadership in Education and Innovation in Engineering in the Framework of Global Transformations: Integration and Alliances for Integral Development”, Buenos Aires, Argentina, 17–21 July 2023; Volume 1. [Google Scholar] [CrossRef]
  3. Romero-Parra, J.R.; Tataje-Sánchez, F.G.; Meza-Ortiz, R.N. Application of 5S and Standardized Work to Improve Labor Productivity: Case of Textile SME. In Proceedings of the 2nd LACCEI International Multi-Conference for Engineering, Education and Technology (LACCEI 2024): “Sustainable Engineering for a Diverse, Equitable, and Inclusive Future at the Service of Education, Research, and Industry for a Society 5.0.”, San Jose, Costa Rica, 17–19 July 2023. [Google Scholar]
  4. De-La-Flor, A.; Vigil, M.; Ruiz-Ruiz, M.F. Improvement of the Sustainable Performance in a Textile Company Using the Lean-Green Methodology. Int. J. Prod. Manag. Eng. 2024, 12, 105–116. [Google Scholar] [CrossRef]
  5. Saad, S.M.; Bhovar, C.; Bahadori, R.; Zhang, H. Industry 4.0 Application in Lean Manufacturing—A Systematic Review. In Advances in Transdisciplinary Engineering; IOS Press: Amsterdam, The Netherlands, 2021; Volume 15. [Google Scholar]
  6. Rossi, A.H.G.; Marcondes, G.B.; Pontes, J.; Leitão, P.; Treinta, F.T.; De Resende, L.M.M.; Mosconi, E.; Yoshino, R.T. Lean Tools in the Context of Industry 4.0: Literature Review, Implementation and Trends. Sustainability 2022, 14, 12295. [Google Scholar] [CrossRef]
  7. Lean, Y.; Ferreira, P.; Ávila, P.; Bastos, J.; G Silva, F.J.; Carlos Sá, J.; Brito, M.; Gallo, M.; Rahardjo, B.; Wang, F.-K.; et al. Lean Manufacturing in Industry 4.0: A Smart and Sustainable Manufacturing System. Machines 2023, 11, 72. [Google Scholar] [CrossRef]
  8. Matias, F.; Miranda, S.; Chavez, P.; Alvarez, J.C. Analysis of the Integration of SMED, SLP and Work Standardization to Increase Efficiency in the Production of Industrial Vests: Focus on Sustainability and Industry 4.0. In Proceedings of the 2025 7th International Conference on Management Science and Industrial Engineering (MSIE 2025), Bali Island, Indonesia, 24–26 April 2025. [Google Scholar]
  9. Zaman, J.; Shoomal, A.; Jahanbakht, M.; Ozay, D. Driving Supply Chain Transformation with IoT and AI Integration: A Dual Approach Using Bibliometric Analysis and Topic Modeling. IoT 2025, 6, 21. [Google Scholar] [CrossRef]
  10. Cavalcante, I.M.; Frazzon, E.M.; Forcellini, F.A.; Ivanov, D. A Supervised Machine Learning Approach to Data-Driven Simulation of Resilient Supplier Selection in Digital Manufacturing. Int. J. Inf. Manag. 2019, 49, 86–97. [Google Scholar] [CrossRef]
  11. Oesterreich, T.D.; Teuteberg, F. Understanding the Implications of Digitisation and Automation in the Context of Industry 4.0: A Triangulation Approach and Elements of a Research Agenda for the Construction Industry. Comput. Ind. 2016, 83, 121–139. [Google Scholar] [CrossRef]
  12. Saberi, S.; Kouhizadeh, M.; Sarkis, J.; Shen, L. Blockchain Technology and Its Relationships to Sustainable Supply Chain Management. Int. J. Prod. Res. 2019, 57, 2117–2135. [Google Scholar] [CrossRef]
  13. Wang, G.; Gunasekaran, A.; Ngai, E.W.T.; Papadopoulos, T. Big Data Analytics in Logistics and Supply Chain Management: Certain Investigations for Research and Applications. Int. J. Prod. Econ. 2016, 176, 98–110. [Google Scholar] [CrossRef]
  14. Dolgui, A.; Ivanov, D. Ripple Effect and Supply Chain Disruption Management: New Trends and Research Directions. Int. J. Prod. Res. 2021, 59, 102–109. [Google Scholar] [CrossRef]
  15. Hofmann, E.; Rüsch, M. Industry 4.0 and the Current Status as Well as Future Prospects on Logistics. Comput. Ind. 2017, 89, 23–34. [Google Scholar] [CrossRef]
  16. Ivanov, D.; Dolgui, A. New Disruption Risk Management Perspectives in Supply Chains: Digital Twins, the Ripple Effect, and Resileanness. IFAC-Pap. 2019, 52, 337–342. [Google Scholar] [CrossRef]
  17. Abid, H.M.R.; Khan, N.; Hussain, A.; Anis, Z.B.; Nadeem, M.; Khalid, N. Quantitative and Qualitative Approach for Accessing and Predicting Food Safety Using Various Web-Based Tools. Food Control 2024, 162, 110471. [Google Scholar] [CrossRef]
  18. Tirkolaee, E.B.; Sadeghi, S.; Mooseloo, F.M.; Vandchali, H.R.; Aeini, S. Application of Machine Learning in Supply Chain Management: A Comprehensive Overview of the Main Areas. Math. Probl. Eng. 2021, 2021, 1476043. [Google Scholar] [CrossRef]
  19. Alzahrani, A.; Asghar, M.Z. Intelligent Risk Prediction System in IoT-Based Supply Chain Management in Logistics Sector. Electronics 2023, 12, 2760. [Google Scholar] [CrossRef]
  20. Materikina, M.; Shoomal, A.; Manh, L.H.; Zhou, Y. Investigating Production Yield Effect on Inventory Control through a Hybrid Simulation Approach. In Proceedings of the 2023 Winter Simulation Conference (WSC), San Antonio, TX, USA, 10–13 December 2023; pp. 2088–2099. [Google Scholar] [CrossRef]
  21. Silva, V.; Ferreira, L.P.; Silva, F.J.G.; Tjahjono, B.; Ávila, P. Simulation-Based Decision Support System to Improve Material Flow of a Textile Company. Sustainability 2021, 13, 2947. [Google Scholar] [CrossRef]
  22. Ukey, P.; Deshmukh, A.; Arora, A. Implementation of Lean Tools in Apparel Industry for Improving Productivity. Proc. Eng. Sci. 2021, 3, 241–246. [Google Scholar] [CrossRef]
  23. Husár, J.; Hrehova, S.; Trojanowski, P.; Wojciechowski, S.; Kolos, V. Perspectives of Lean Management Using the Poka Yoke Method. In Lecture Notes in Mechanical Engineering; Springer: Berlin/Heidelberg, Germany, 2023; pp. 121–131. [Google Scholar] [CrossRef]
  24. Liza Ludeña, B.; Paulino Fierro, G.; Altamirano Flores, E. Design of a Lean Manufacturing Model to Reduce Order Delivery in a Textile Mype. In Proceedings of the LACCEI international Multi-Conference for Engineering, Education and Technology, Virtual, 5–7 December 2022. [Google Scholar]
  25. Parthasarathi, S.; Prabhu, M.K.; Krishanamani, J.; Mitun, L.; Vellingiri, G.P.; Rahul, C.S. Productivity Improvement and Reduction of Lead Time in Manufacturing Industry Using Lean Tools. Ind. Eng. 2021, 5, 1–6. [Google Scholar] [CrossRef]
  26. Tejada, S.; Valdez, R.S.-C.; Alvarez, J.C.; Yildiz, O. Proposal of Redesign of Data-Based Lean Management Oriented Business Process in the Textile Industry: Previous Diagnosis. In Proceedings of the 2024 Congreso Internacional de Innovation y Tendencies en Ingeniera (CONIITI), Bogota, Colombia, 2–4 October 2024; pp. 1–6. [Google Scholar]
  27. Guerra, J.D.; Palomino, G.; Yildiz, O.; Macassi, I.A.; Alvarez, J.C. Re-Designing Business Process Models for Enhancing Sustainability in Spinach Production Through Lean Tools with Digital Transformation. Sustainability 2025, 17, 5673. [Google Scholar] [CrossRef]
  28. Calderon, J.; Cuellar, M.; Yildiz, O.; Aranda, D.; Alvarez, J.C. Business Process Model Re-Design with A Data-Based Green Lean Management Approach with OEEM: A Case of Plastic Product Manufacturing Firm. Int. J. Eng. Trends Technol. 2025, 73, 289–314. [Google Scholar] [CrossRef]
  29. Castañeda, S.; Rodriguez, S.; Yildiz, O.; Aranda, D.; Alvarez, J.C. Increase of the Availability of Machinery in a Food Company Applying the TPM, SMED and RCM Methodologies. Int. J. Eng. Trends Technol. 2024, 72, 128–138. [Google Scholar] [CrossRef]
  30. Advincula, E.A.; Ortiz Vigo, J.M.; Ibañez, C.R.; Rojas García, J.A.; Sifuentes, C.T. Methodology to Increase Productivity in a Production Process in a Textile Company by Means of 5S and Standard Work. In Proceedings of the LACCEI International Multi-Conference for Engineering, Education and Technology, Virtual, 5–7 December 2022. [Google Scholar]
  31. Barrientos-Ramos, N.; Tapia-Cayetano, L.; Maradiegue-Tuesta, F.; Raymundo, C. Lean Manufacturing Model of Waste Reduction Using Standardized Work to Reduce the Defect Rate in Textile MSEs. In Proceedings of the LACCEI International Multi-Conference for Engineering, Education and Technology, Virtual, 27–31 July 2020. [Google Scholar]
  32. Kose, Y.; Civan, H.N.; Ayyildiz, E.; Cevikcan, E. An Interval Valued Pythagorean Fuzzy AHP–TOPSIS Integrated Model for Ergonomic Assessment of Setup Process under SMED. Sustainability 2022, 14, 13804. [Google Scholar] [CrossRef]
  33. Gochel, A.; Gebeyehu, S.G.; Abebe, M. Production Lead Time Improvement through Lean Manufacturing. Int. J. Ind. Syst. Eng. 2022, 40, 121045. [Google Scholar] [CrossRef]
  34. Gebeyehu, S.G.; Abebe, M.; Gochel, A. Production Lead Time Improvement through Lean Manufacturing. Cogent Eng. 2022, 9, 2034255. [Google Scholar] [CrossRef]
  35. Alanya, B.S.; Dextre, K.E.; Nuñez, V.H.; Marcelo, G.E.; Alvarez, J.C.; Hatakeyama, K. Application of Lean Manufacturing to Improve Processes and Increase Productivity in The Textile Industry of Peru: Case Study. S. Afr. J. Ind. Eng. 2024, 35, 140–153. [Google Scholar] [CrossRef]
  36. Kalwar, M.A.; Wassan, A.N.; Khan, M.A.; Wadho, M.H.; Shaikh, S.A.; Memon, B.A. Application of Overall Equipment Effectiveness in Increasing Productivity: Case of Textile Company. WPOM-Work. Pap. Oper. Manag. 2025, 16, 21168. [Google Scholar] [CrossRef]
  37. Afum, E.; Agyabeng-Mensah, Y.; Baah, C.; Dacosta, E. Consolidating Lean Practices with Quick-Response Manufacturing: A Boon or Bane for the Textiles Industry during the Era of COVID-19. Int. J. Lean Six. Sigma 2024, 15, 1393–1414. [Google Scholar] [CrossRef]
  38. Narassima, M.S.; Aashrith, V.; Ronald, C.A.; Anbuudayasankar, S.P.; Thenarasu, M. Implementation of Lean Principles in the Yarn Manufacturing Industry: A System Dynamics Approach. Benchmarking-Int. J. 2025, 32, 222–240. [Google Scholar] [CrossRef]
  39. Tejada, S.; Valdez, S.; Yildiz, O.; Salas-Castro, R.; Alvarez, J.C. A Data-Driven Lean Manufacturing Framework for Enhancing Productivity in Textile Micro-Enterprises. Sustainability 2025, 17, 5207. [Google Scholar] [CrossRef]
  40. Hussain, W. Requirements Change Management in Global Software Development: A Case Study in Pakistan. Ph.D. Thesis, Auckland University of Technology, Auckland, New Zealand, 2016. [Google Scholar]
  41. Hussain, D.; Figueiredo, M.C. Improving the Time-Based Performance of the Preparatory Stage in Textile Manufacturing Process with Value Stream Mapping. Bus. Process Manag. J. 2023, 29, 801–837. [Google Scholar] [CrossRef]
  42. Bhatia, M.S.; Kumar, S. An Empirical Analysis of Critical Factors of Industry 4.0: A Contingency Theory Perspective. Int. J. Technol. Manag. 2023, 91, 82–106. [Google Scholar] [CrossRef]
  43. Ferlito, R. Industry 4.0 and Sustainability: The Case of the Italian Textile District of Prato. Compet. Rev. 2024, 34, 995–1016. [Google Scholar] [CrossRef]
  44. Azzolini, W.J.; Santos, C.H.; Romano, A.L.; Salles, H.O.; Palma, J.M.; Augusto, R.T. Integration of Simulation and Hierarchical Approach to Support Lean Implementation. Int. J. Simul. Model. 2025, 24, 111–122. [Google Scholar] [CrossRef]
  45. ISO 14001:2015(En), Environmental Management Systems—Requirements with Guidance for Use. Available online: https://www.iso.org/obp/ui/en/#iso:std:iso:14001:ed-3:v1:en (accessed on 1 October 2025).
  46. Habib, M.A.; Rizvan, R.; Ahmed, S. Implementing Lean Manufacturing for Improvement of Operational Performance in a Labelling and Packaging Plant: A Case Study in Bangladesh. Results Eng. 2023, 17, 100818. [Google Scholar] [CrossRef]
  47. Ewnetu, M.; Gzate, Y. Assembly Operation Productivity Improvement for Garment Production Industry through the Integration of Lean and Work-Study, a Case Study on Bahir Dar Textile Share Company in Garment, Bahir Dar, Ethiopia. Heliyon 2023, 9, e17917. [Google Scholar] [CrossRef]
  48. Juanga-Labayen, J.P.; Labayen, I.V.; Yuan, Q. A Review on Textile Recycling Practices and Challenges. Textiles 2022, 2, 174–188. [Google Scholar] [CrossRef]
  49. Ozek, A.; Seckin, M.; Demircioglu, P.; Bogrekci, I. Artificial Intelligence Driving Innovation in Textile Defect Detection. Textiles 2025, 5, 12. [Google Scholar] [CrossRef]
  50. Santos, E.; Lima, T.M.; Gaspar, P.D.; Santos, E.; Lima, T.M.; Gaspar, P.D. Optimization of the Production Management of an Upholstery Manufacturing Process Using Lean Tools: A Case Study. Appl. Sci. 2023, 13, 9974. [Google Scholar] [CrossRef]
  51. Novochadlo, Y.M.; Paladini, E.P. The Application of Real-Time Overall Equipment Efficiency Indicator in a Medium-Sized Company. Braz. J. Oper. Prod. Manag. 2024, 21, 2042. [Google Scholar] [CrossRef]
Figure 1. Implementing the efficiency of the production process.
Sustainability 17 08888 g001
Figure 2. Steps of SLP for optimizing textile manufacturing processes.
Sustainability 17 08888 g002
Figure 3. SMED implementation steps for reducing setup time.
Sustainability 17 08888 g003
Figure 4. Implementation of Standard Work.
Sustainability 17 08888 g004
Figure 5. Validation flowchart for the implementation of lean tools in the case study.
Sustainability 17 08888 g005
Figure 6. Flow in the sensor activation.
Sustainability 17 08888 g006
Figure 7. Results obtained for Industry 4.0.
Sustainability 17 08888 g007
Figure 8. Operator and customer perceptions on key sustainability aspects.
Sustainability 17 08888 g008
Figure 9. Daily fabric waste percentage during production.
Sustainability 17 08888 g009
Figure 10. Reusing fabric scraps: a sustainable process.
Sustainability 17 08888 g010
Table 1. Comparative overview of lean and digital transformation studies in textile manufacturing.
StudyTopic AreaMethodTools UsedSustainability DimensionDigital IntegrationContribution Difference
[9]Textile ManufacturingCase Study5S, Poka-YokeTime EfficiencyNoneNo BPM or digital infrastructure
[10]Textile ManufacturingImplementation Analysis5S, Kaizen, Kanban, AndonProductivityNoneNo digital integration
[11]Textile ManufacturingFocused ApplicationPoka-YokeCustomer SatisfactionNoneSingle tool, no systemic model
[12]Protective TextilesCase StudyVSM, 5S, SMED, KanbanDelivery TimePartialLimited BPM, no IoT
[13]Assembly ProcessesProcess AnalysisVSMTime EfficiencyNoneLean tools present, no digital integration
[14]Peruvian Textile SMEsProcess Improvement5S, Standard WorkOperational ConsistencyNoneNo digital infrastructure or BPM
[15]Peruvian Textile SMEsSimulationVarious Lean ToolsProductivity, QualityNoneNo digital integration
[16]Ergonomic ProductionDecision ModellingSiSMED, IVPF-AHP, TOPSISErgonomic ImprovementPartialDigital decision support, no BPM
[17]HMMBI SectorSpaghetti Diagram AnalysisErgonomic Lean ToolsProcess OptimizationNoneDifferent sector, no BPM integration
[18]Textile ManufacturingProcess RedesignVSM, Spaghetti DiagramTime and Material EfficiencyNoneNo digital infrastructure
[19,20,21,22,23,24]Textile ManufacturingVariousVSM, SMED, TPM, Six SigmaProduction and QualityPartialNo integrated model
[8,26,27]Textile ManufacturingEmpirical and SimulationLean + Industry 4.0Digital SustainabilityHighData-driven focus, limited BPM integration
This StudyPeruvian Textile SMEsCase StudySMED, SLP, Standard Work, IoTEnvironmental, Economic, OperationalHighIntegrated Lean + IoT + BPM + Industry 4.0
Table 2. Route measurement.
AreasDistance (m)Time
4.45%3%1.36%
78.13%90%92.80%
98.17%99%99.47%
1.52%1%0.79%
0.00%97%98.12%
Table 3. Comparison of machine setup times before and after SMED implementation.
ActivitiesBeforeNow
Straight machine7.154.59
Overlock7.54.24
ActivitiesBeforeNow
Straight machine7.154.59
Overlock7.54.24
Table 4. Comparison of activity classifications.
ActivitiesBeforeNow
VA64%83%
NVA22%9%
NNVA14%8%
ActivitiesBeforeNow
VA64%83%
Table 5. Comparison of key performance indicators.
ActivitiesCurrentObtained
Efficiency79%84%
Distance travelled14.13 m11.6 m
Preparation time7.5 min4.55 min
Used of equipment87%94%
%NVA14%8%
Table 6. Project financial analysis summary.
Financial MetricValueInterpretation
Annual SavingsS/31,000Estimated yearly cost reduction from project implementation.
Net Present Value (NPV)S/54,292.23Positive value confirming the project’s capacity to generate value over time.
Internal Rate of Return (IRR)76.02%Significantly exceeds the Cost of Capital, validating profitability.
Cost of Capital (COK)18%The minimum required rate of return for the project.
Benefit–Cost (B/C) Ratio1.31It indicates that for every sol invested, the return was S/2.13.
Disclaimer/Publisher’s Note: The statements, opinions and data contained in all publications are solely those of the individual author(s) and contributor(s) and not of MDPI and/or the editor(s). MDPI and/or the editor(s) disclaim responsibility for any injury to people or property resulting from any ideas, methods, instructions or products referred to in the content.