Article

The Effect of Awareness-Raising on Household Water Consumption

Department of Civil and Environmental Engineering, University of Perugia, Via G. Duranti 93, 06125 Perugia, Italy
*
Author to whom correspondence should be addressed.
Sustainability 2025, 17(19), 8887; https://doi.org/10.3390/su17198887
Submission received: 28 August 2025 / Revised: 24 September 2025 / Accepted: 1 October 2025 / Published: 6 October 2025
(This article belongs to the Section Air, Climate Change and Sustainability)

Abstract

This work analyses what the systematic effect of public awareness on domestic water consumption is. In some parts of the world, the availability of water is continually decreasing, mainly due to reduced rainfall, so it is of paramount importance to raise awareness among the population. We conducted an experiment on a large sample of participating units located in urban areas of Italy, mainly in the central portion of the country. Approximately 750 people participated, belonging to 250 buildings, mainly domestic residences, but also professional offices, small companies, and student residences. In the first phase, lasting three weeks, normal per capita water consumption was quantified. Subsequently, instructions were given on how to save water during various uses in the household (showers, cleaning hands, use of water in toilets and in the kitchen, watering small green areas, use of water in the kitchen, and so on), and small visual messages conveyed through stickers were posted on water dispensers to remind users to behave properly. Finally, household consumption was assessed again during a further 3-week period. An average water-saving ( W S ) rate of +17.20% was found, in line with results obtained from a previous similar experiment involving a much smaller sample. Higher W S rates were recorded for buildings with less inhabitants. This experiment enabled us to quantify the significant effect of the awareness-raising action on the reduction in water consumption, without the use of any structural action (e.g., replacement of dispensers, improvement of the water system, realization of recycling systems). Moreover, the simplicity of the proposed methodology makes it suitable for implementation in other regions worldwide, thus promoting a step forward towards more sustainable use of water.

1. Introduction

Observation of climate trends and projected modifications for the coming decades show that changes in temperatures and precipitation in Europe differ from region to region, with an increase in temperatures across the continent, an increase in precipitation in the north and a decrease in the south, in agreement with the results already found by the IPCC (Intergovernmental Panel on Climate Change) Fifth Assessment Report [1] and substantially confirmed in the Sixth [2]. The studies highlight that there is expected to be a significant increase in maximum temperatures, drought periods, and extreme weather, with variations within Europe itself. Fluvial runoffs have decreased in southern Europe and eastern regions, while in the north an increase was found [3,4]. An increase in the maximum flow over the past half-century has been observed in parts of Germany [5], in the Meuse River basin [6], in parts of central Europe [7], in Russia [8], and in northeastern France [9], while a decrease was found in the Czech Republic [10] and a stationary situation affects another part of Germany [11] and some Nordic countries [4].
Climate change is projected to differentially affect the hydrological systems of watersheds [12]. In fact, the recurrence of flow rates with current 100-year return time is expected to increase in continental Europe, while it is expected to decrease in some regions of northern and southern Europe by 2100 [13,14].
Simulated results from several climate change studies at the regional and global level predict an increase in the duration and intensity of drought periods in central Europe and the southern part [15,16]. Even in the regions where rainfall appears to be increasing, drought periods may become more severe as a result of increasing evapotranspiration [17]. Ref. [18] predicted increased drought frequencies in the Mediterranean area under future climate scenarios, and more pronounced in its southern portion. Soil moisture droughts, whose propagation impacts agricultural production, are expected to exacerbate in particular over eastern Europe and the Mediterranean area [19]. In this regard, satellite retrievals are of strategic importance for building operational monitoring systems. Limitations and uncertainties attributable to single products can be overcome by merging different remotely sensed soil moisture data sets with them and with additional modeled data, bringing benefits for operational drought monitoring as recently demonstrated by [20].
In some basins, especially those located at high latitudes and in tropical areas, the trend analysis of extreme weather events and flow rates highlights evidence for an increased risk of regional-scale flooding events, and many areas show an increase in intense precipitation [21]. Globally, the costs associated with damage produced by flood events have increased since 1970, although this increase is partly due to increased exposure of populations and assets to such phenomena [22,23,24,25]. However, the validity of this evidence is often limited due to the reduced availability of long-time series of data within watersheds. Furthermore, in the analysis of thermo–hydro–pluviometric variations, it is very difficult to distinguish the role played by climate change and anthropogenic activity [26,27].
As mentioned, river outflows in Europe have been decreasing in the south and east and have, in general, increased in the remaining regions [28], particularly in the northern areas [4]. In the comprehensive study by [29], trends of yearly streamflow volumes during a 63-year period (1950–2013) over Europe have been investigated. To do this, the authors leveraged a large database, relying on records from more than 3000 stations monitoring several basins located in more than 40 countries. They found a clear dichotomy consisting of decreasing trends found in the Mediterranean area (about −1 ∙ 103 m3/km−2 year−1) and positive ones in northern areas quantified in about +0.5 ∙ 103 m3/km−2 year−1. Ref. [26] evaluated the response in terms of freshwater availability to climate change over five pilot basins with drainage areas ranging from 934 km2 to 4147 km2 located in central Italy. Results highlighted a decreasing trend of yearly runoff thicknesses during the time span 1927–2020 quantified in a median loss of −1.62 mm/year across the considered catchments Ref. [27] elaborated on the analysis above, finding that over the same area, hydroclimatic features (in particular temperature and soil water storage) are the main drivers of runoff generation, with a higher impact with respect to anthropogenic interventions; for instance, land use and land cover alterations.
In North America, an increase in river runoff was observed in the Mississippi River basin; while in China, a consistent decrease was observed in the Yellow River, with a 12.00% reduction in rainfall in summer and fall, while the Yangtze River showed a slight increase in runoff produced by an increase in monsoon rainfall [30]. It is important to take into account that these trends may also be influenced by other factors which interact with the generation of river runoff, such as land use change, irrigation practices, and urbanization [31]. Significant decreasing trends in outflows are found, however, in low and mid-latitudes, due to global warming, particularly in west Africa, southern Europe, the eastern and southern parts of the Asian continent, in the eastern part of Australia, in the western United States and in the northern parts of South America [32], putting at risk the availability of resource water in each of these territories.
The expected effects within a watershed depend on the sensitivity of the watershed to the changes in climatic characteristics and to the expected variation in the intensity and seasonal distribution of precipitation, temperatures, and evaporation [33]. In addition to global warming, changes in land use and land cover are expected to strongly influence, in the future, the hydrographic systems of different regions. For example, increasing urbanization could increase the risk of flooding and reduce groundwater recharge, with a decrease in the groundwater resource. Of particular importance are the future agricultural land use and especially irrigation, to which a relevant percentage of global freshwater consumption is attributed, and which seriously affects the amount of water resource available to humans and ecosystems [34]. Due to the growth in populations and economies, as well as climate change, the use of freshwater for irrigation purposes could increase significantly in the future, just as it could increase the amount of water extracted from groundwater for this purpose, due to the increasing variability of the surface water resource, also due to the changing climate [35]. This is exemplified by the well-known phenomenon of irrigation-induced groundwater depletion in India, where sub-surface resources supply more than 60.00% of the water used for agricultural practices [36]. A similar issue has been reported over other irrigated areas worldwide [37], such as United States (US) high plains and northern China [38,39].
In this complex context, the use of freshwater for civilian and particularly domestic purposes appears increasingly critical. In the framework of the Digital Twin of the terrestrial water cycle proposed by [40], a Decision Support System (DSS) for water resources management has been developed [41]. Such a DSS relies on high-resolution satellite observations used to feed a modeling chain for returning forecasts of water available for various uses (civil, agricultural, and industrial) under varying initial states and hydroclimatic scenarios. The system was originally developed for the Po basin, in northern Italy, a strategic hotspot for studying the interplay between human-induced and natural dynamics affecting the water cycle. However, it has the proper flexibility to be easily extended elsewhere. It is clear how such tools assume a strategic importance for stakeholder to prevent water shortage crises, as, for example, the one that occurred in 2018 in Cape Town (South Africa). In that circumstance, a population of about 4 million was left almost without potable water due to the limited availability of the main source of supply (Theewaterskloof Lake). Under this condition, a maximum of 50 L per capita per day was provided, which is the quantity strictly necessary for a short shower. The crisis was never fully resolved, although with a series of extraordinary interventions it was later alleviated. Bearing in mind this case, which is entirely identical to some others (see also the problems related to the use of Colorado River water by 10 states in the USA), it seems clear that serious measures must be undertaken to prevent certain water crises. In this sense, in addition to structural actions to modernize the networks, which require large investments, actions can certainly be put in place to raise awareness of the wise use of the water resource, thus limiting multiple and unnecessary wastage of water. Water-saving strategies need to build on self-awareness of daily consumption rates, which people often lack [42]. Under this perspective, the “Water Diary” initiative proposed by [43] is of particular importance. It consists of measuring and sharing water use data among the occupants of the same dwelling to increase awareness and promote positive behavioral changes. Ref. [44] highlighted the need of sensitization initiatives and environmental education from school age to convey the importance of saving water and create a water-consumption-aware population. Refs. [45,46] assessed the effects of nudging initiatives to promote water conservation for case studies in India and Costa Rica, respectively, by considering water usage indirectly derived from invoiced bills. However, the impact of awareness-raising actions in quantitative terms remains poorly understood, especially if evaluated through direct measurements. The main objective of this work is to quantify whether and to what extent a public awareness campaign can lead to limiting domestic drinking water consumption and consequently fostering a sustainable use of the resource. To do this, an experiment easily implementable over other regions worldwide has been carried out.

2. Materials and Methods

To assess the effect of awareness-raising actions on household water consumption, an experiment involving the population of the University of Perugia (https://www.unipg.it/) has been carried out. The city of Perugia is located in the Umbria region, in central Italy. It is characterized by a Mediterranean climate shifting to humid climate from the western to the eastern side. The average yearly rainfall amount over the region is around 900 mm. Nevertheless, ref. [26] highlighted critical reduction in annual precipitation rates (around −1 mm/year in the last century) associated with increasing air temperature at higher rates than the planetary mean (over +0.02 °C/year). Ref. [26] also reported a change in the region’s rainfall pattern, as the rainfall rates result was more evenly distributed throughout the year than in the past.
The sample that joined the experiment consists of around 750 people distributed in 250 buildings; they are mainly domestic residences, but a few professional offices, a student house, and a company are also present. Most of the participating units are located within the Umbria region; however, there are also some exceptions located in other areas of the Italian country. The logic of the experiment is explained in Figure 1.
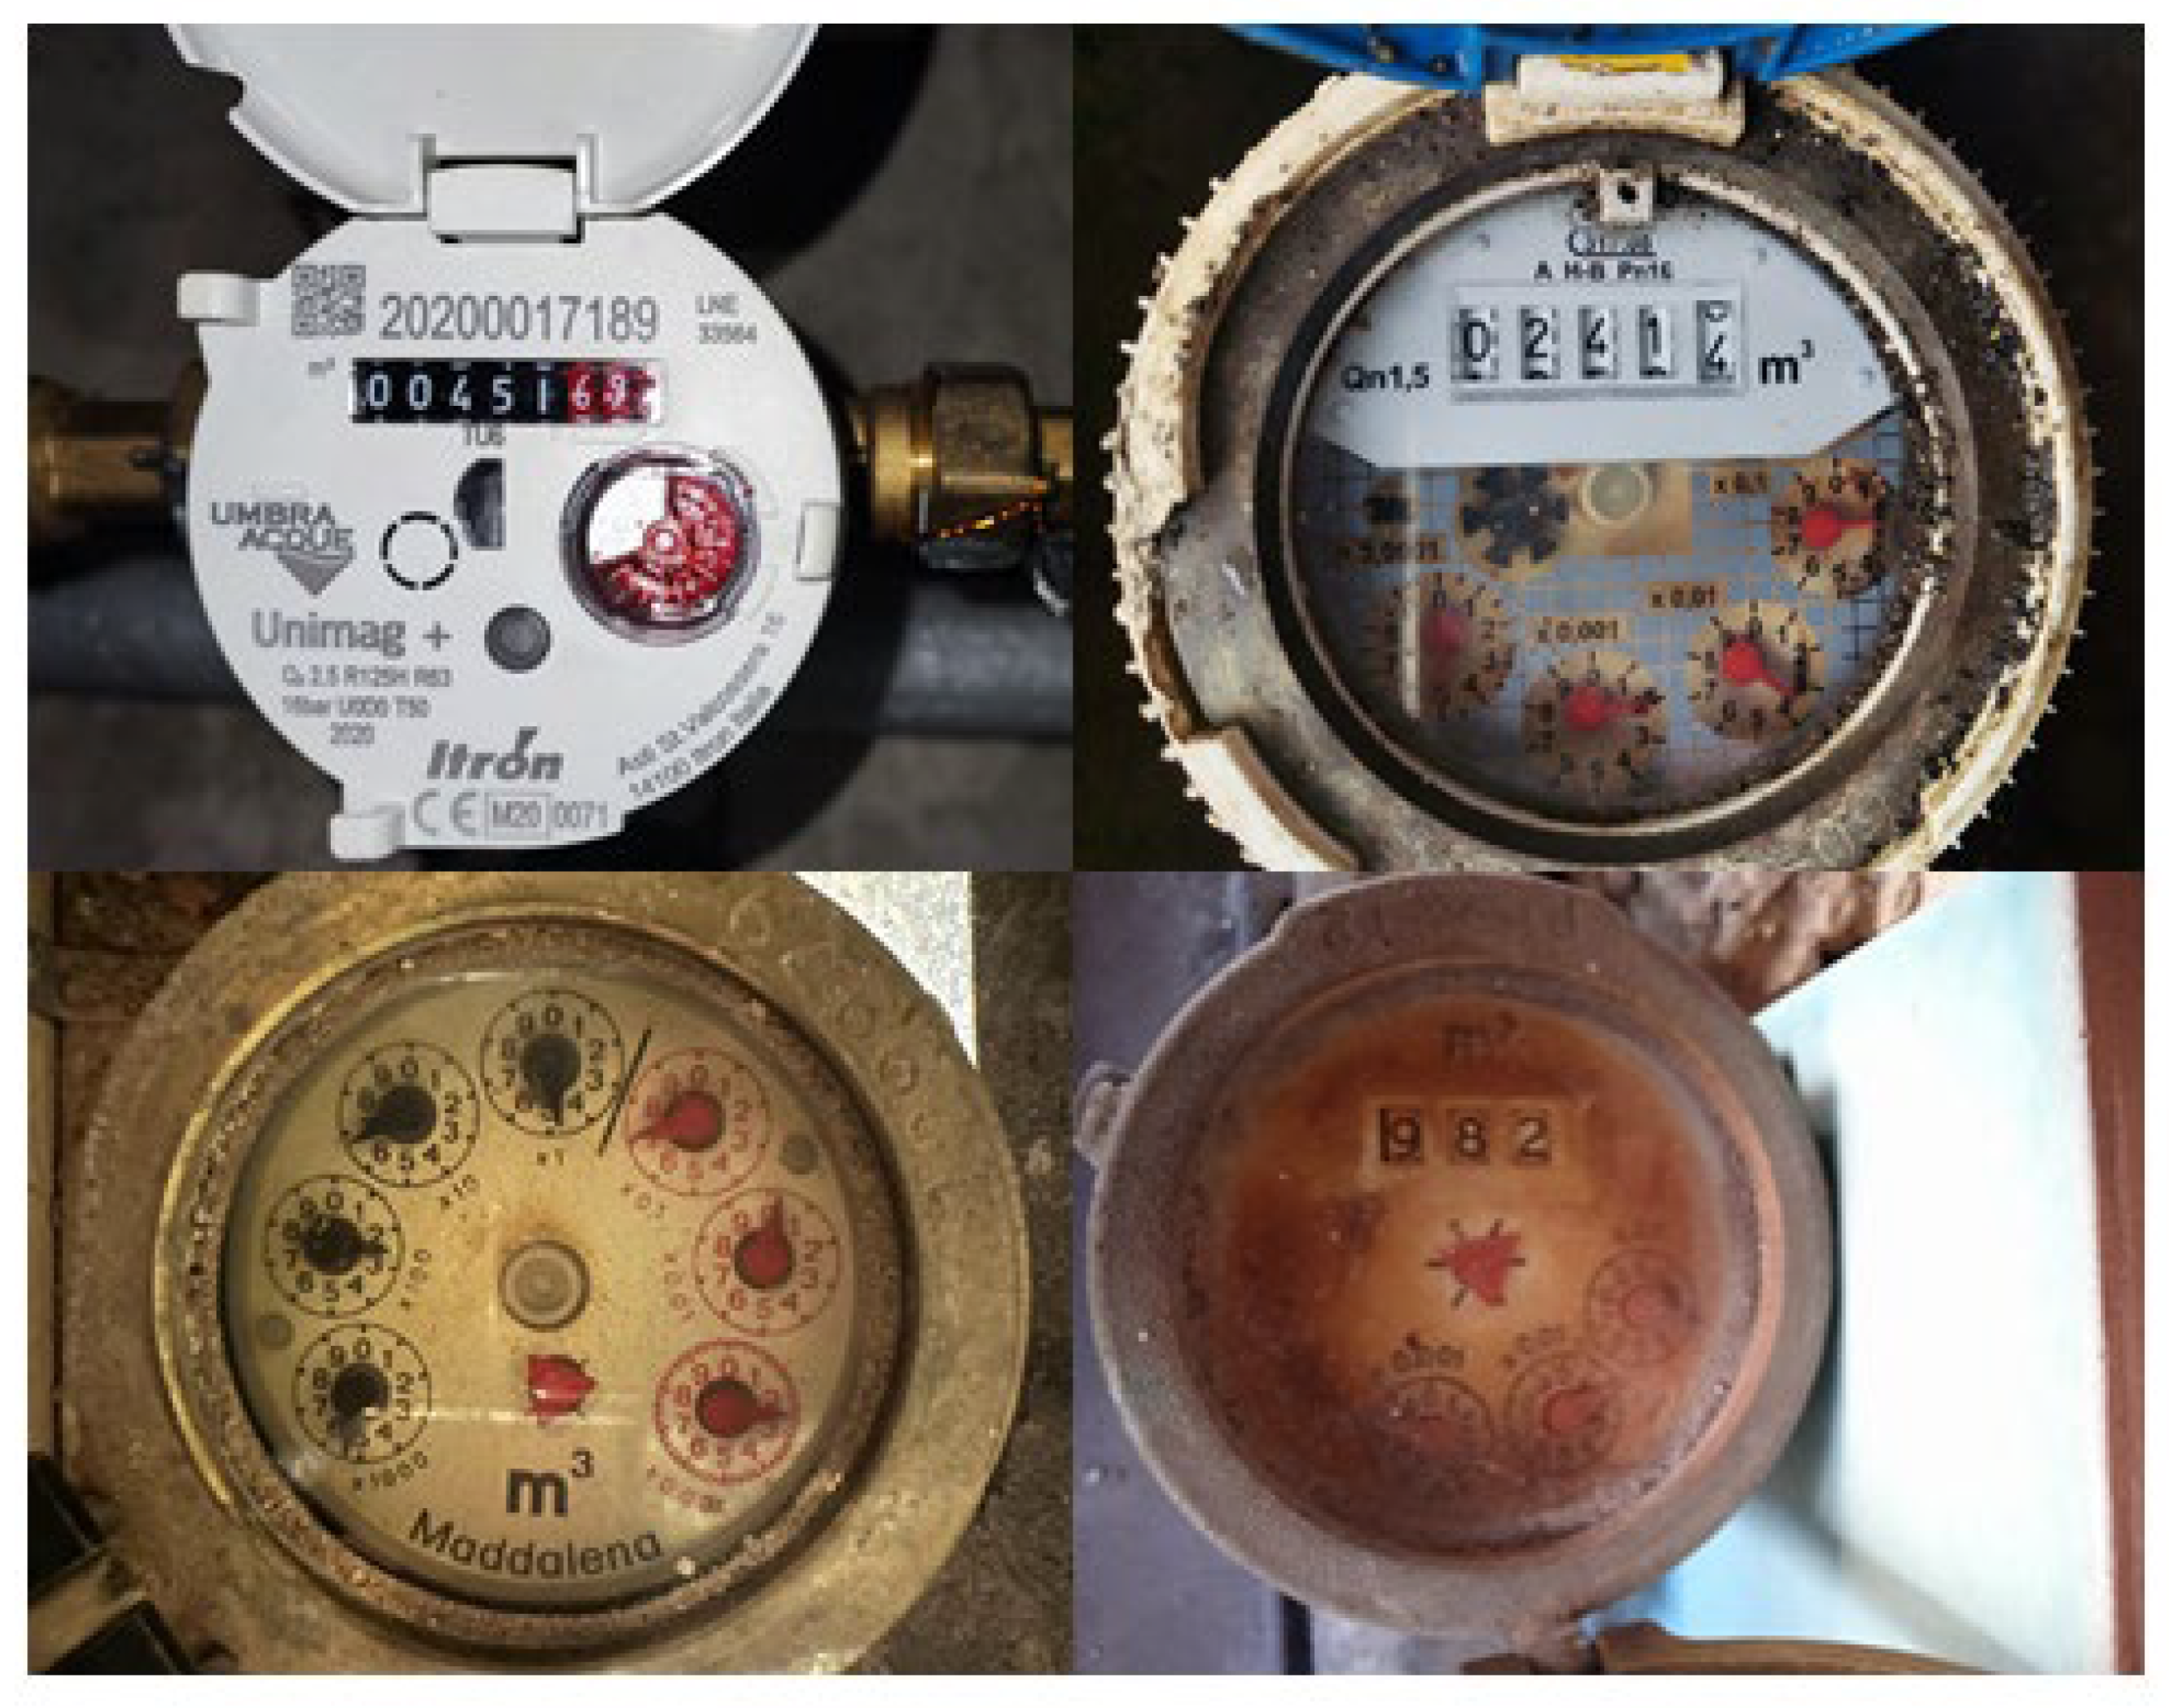
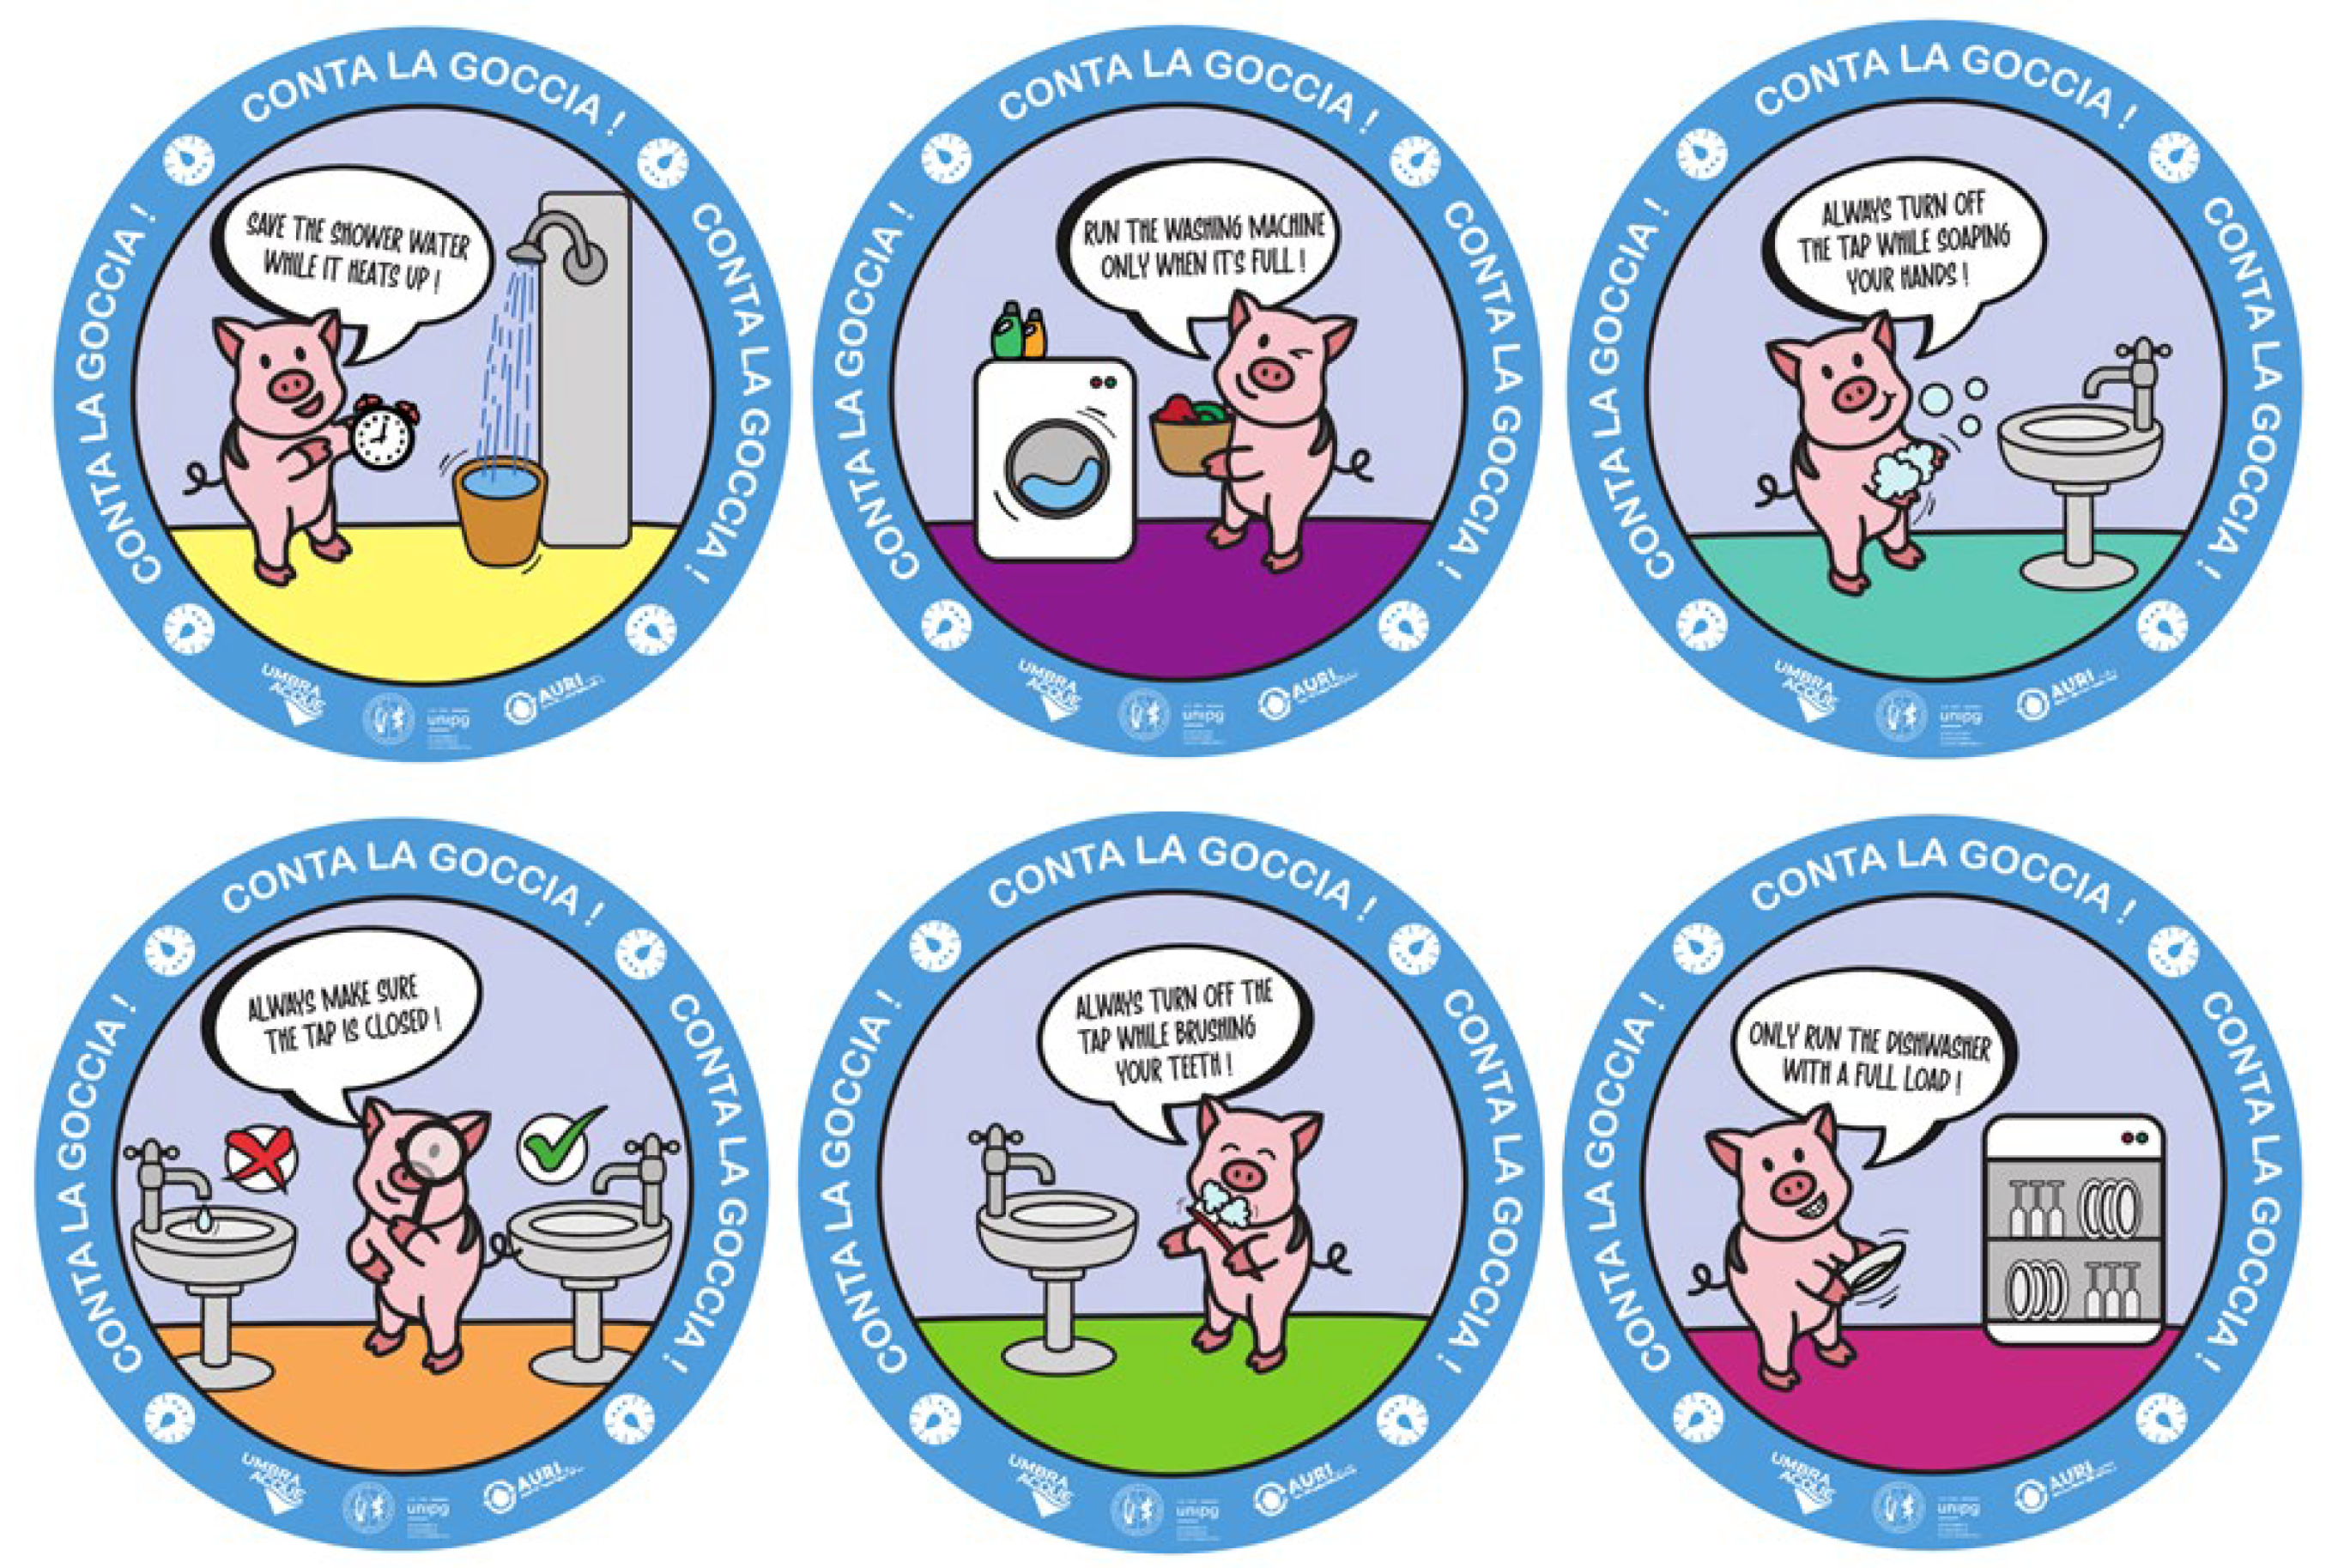
In the first phase, covering a period spanning from March to April 2024, reference water consumption by the people involved in the experiment has been measured. In more detail, starting from two water meter records, one referring to the start and one to the end of the first period, per capita daily consumptions in [L/inhabitant∙day] have been derived. To limit the possibility of reading errors, participants have been asked to take photographs of the meters (see, as an example, Figure 2). After this first step, a campaign for raising awareness with respect to water-saving-related thematizes has been initiated. It involved verbal communication among people occupying the same building and the use of stickers (see Figure 3) giving tips to save water which have been affixed close to water use points (i.e., kitchens, bathrooms, gardens, and so on). The stickers remind about saving shower water while it is heating up, running the washing machine and the dishwasher at full capacity only, and turning off the sink faucet while soaping hands, brushing teeth and when it is not used. In addition, a list of best practices to adopt for saving water has been distributed to the participants. They comprise the adoption of efficient taps that can reduce water flow without compromising performance and comfort. For instance, by using flow regulators, the consumption can be reduced by up to 50.00%; this rate can be increased up to 80.00% in case of photocell faucets. Another best practice concerns regularly checking that there are no leaks from taps and toilet drains, with practical suggestions on how to do it. The guidelines also provide a thorough explanation of why a shower is preferable to a bath, on the efficiencies of different types of toilet drains, on how to wash clothes, and on how to properly care for plants and gardens with an emphasis on saving water.
Following the awareness campaign, measures have been repeated in a second phase to assess the effects of awareness-raising actions (reference period April–May 2024). Participants have been asked to fill in a form reporting the measured values and the exact measurement dates, together with a number of features of the building such as the location, characteristics of the water dispensing systems, year of construction or renovation, average number of inhabitants, and their age. The questionnaires have gone through a quality check by the authors to prevent glaring errors, such as non-reasonable records or measurements incompatible with photos of water meters.
Defining the per capita daily consumptions obtained in Phase 1 and 2 as D 1 and D 2 , respectively, the water-saving ( W S ) rate has been calculated as:
W S   =   D 1 D 2 D 1
W S rates have then by expressed as a percentage. Note that in case of higher consumptions in phase 2 with respect to phase 1, negative W S values are obtained. The comparison of consumption in the two phases, considering the people populating the various buildings/homes, has allowed us to derive the effect of awareness-raising.
A set of features related to the participating units have been collected as metadata. They concern the municipality where the building is located, the construction year, and the average age of the occupants. Along with this, information on the installed facilities for dispensing water has been collected, namely, the number of water dispensers in kitchens and bathrooms, the number of washing machines and dishwashers, the number and type of toilet cisterns, the presence of plants and flowers to water, and the presence and size of gardens. The form distributed among the participants is publicly available at: https://doi.org/10.6084/m9.figshare.30189649.v1 (accessed on 25 September 2025).

3. Results and Discussion

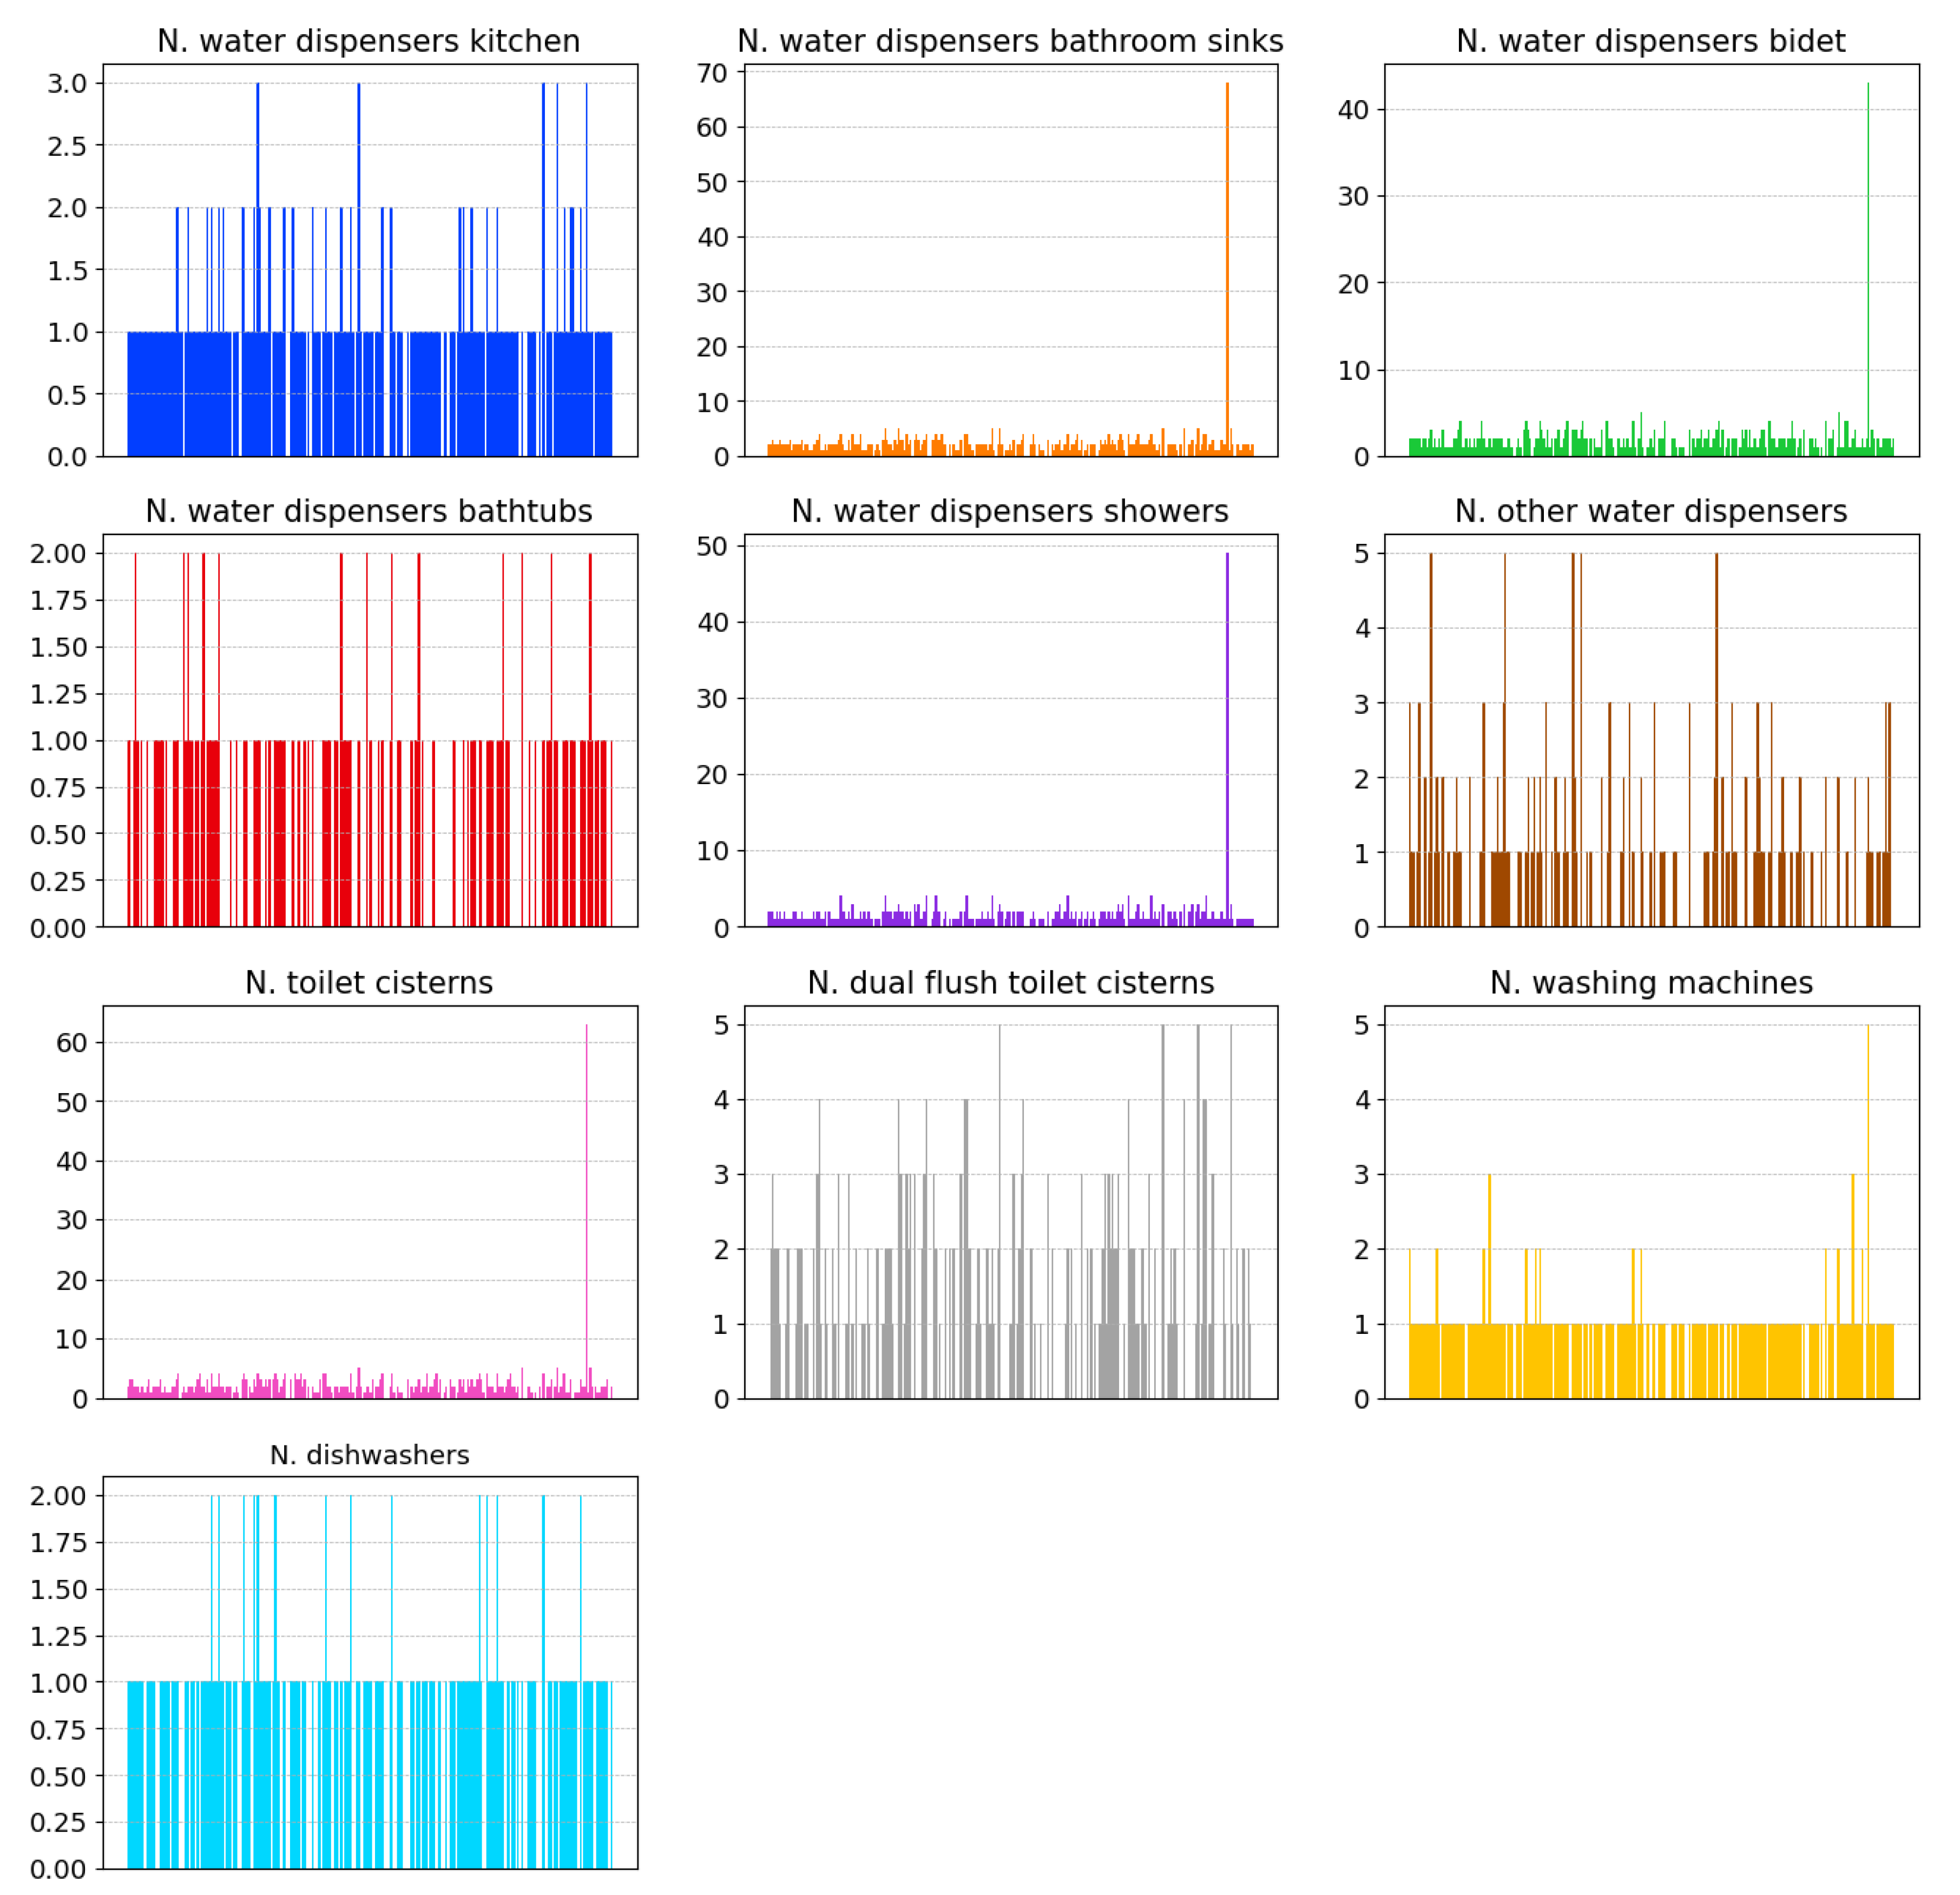
In this section, the results of the experiment are presented and commented on. First, details on the installed facilities and appliances for dispensing or using water in the 250 buildings belonging to the participating sample are provided in Figure 4, in which each panel refers to a specific feature and each bar identifies a participating unit. Different colors for different domestic water supply facilities have been adopted. The information is derived from the form that the participants returned completed together with consumption monitoring. Concerning kitchens, the maximum number of water dispensers in a single participating unit is 3. Focusing on bathrooms, up to 68, 43, 2, and 49 dispensers in sinks, bidets, bathtubs, and showers are detected. The high numbers above are due to the participation of a student house in the experiment described in this study. Concerning toilet cisterns, a maximum of 63 per building is observed; the analogous amount of dual flush toilet cisterns, which are more efficient in terms of water savings, is equal to 5. The maximum number of water dispensers belonging to all the other categories not previously mentioned is 5. Finally, a maximum of five and two washing machines and dishwashers per participating unit are present. The information provided by the participants reveals that a total number of 2159 water dispensers have been targeted in this study. Out of the total 589 toilet cisterns, 48.00% are equipped with dual flush. The total number of washing machines and dishwashers results equal to 230 and 188, respectively. Additional information on the use of water for plants and gardens (collected but not reported in Figure 4) reveals that more than 60.00% of the units have balconies with flowers, while around 40.00% have gardens.
Figure 5 shows the per capita daily consumption recorded in phase 1 (represented through black bars) and phase 2 (indicated by blue bars). The positive effect of awareness-raising actions can be immediately detected, as higher frequencies of lower consumptions can be observed. In fact, per capita daily water use in phase 1 ranges between 39.07 and 336.55 L/inhabitant∙day, with an average value of 123.91 L/inhabitant∙day (standard deviation of ±50.50%). Such a value decreases to 98.59 L/inhabitant∙day (±46.80%) in phase 2, when minimum and maximum consumptions equal to 30,70 and to 247.02 L/inhabitant∙day, respectively, have been recorded.
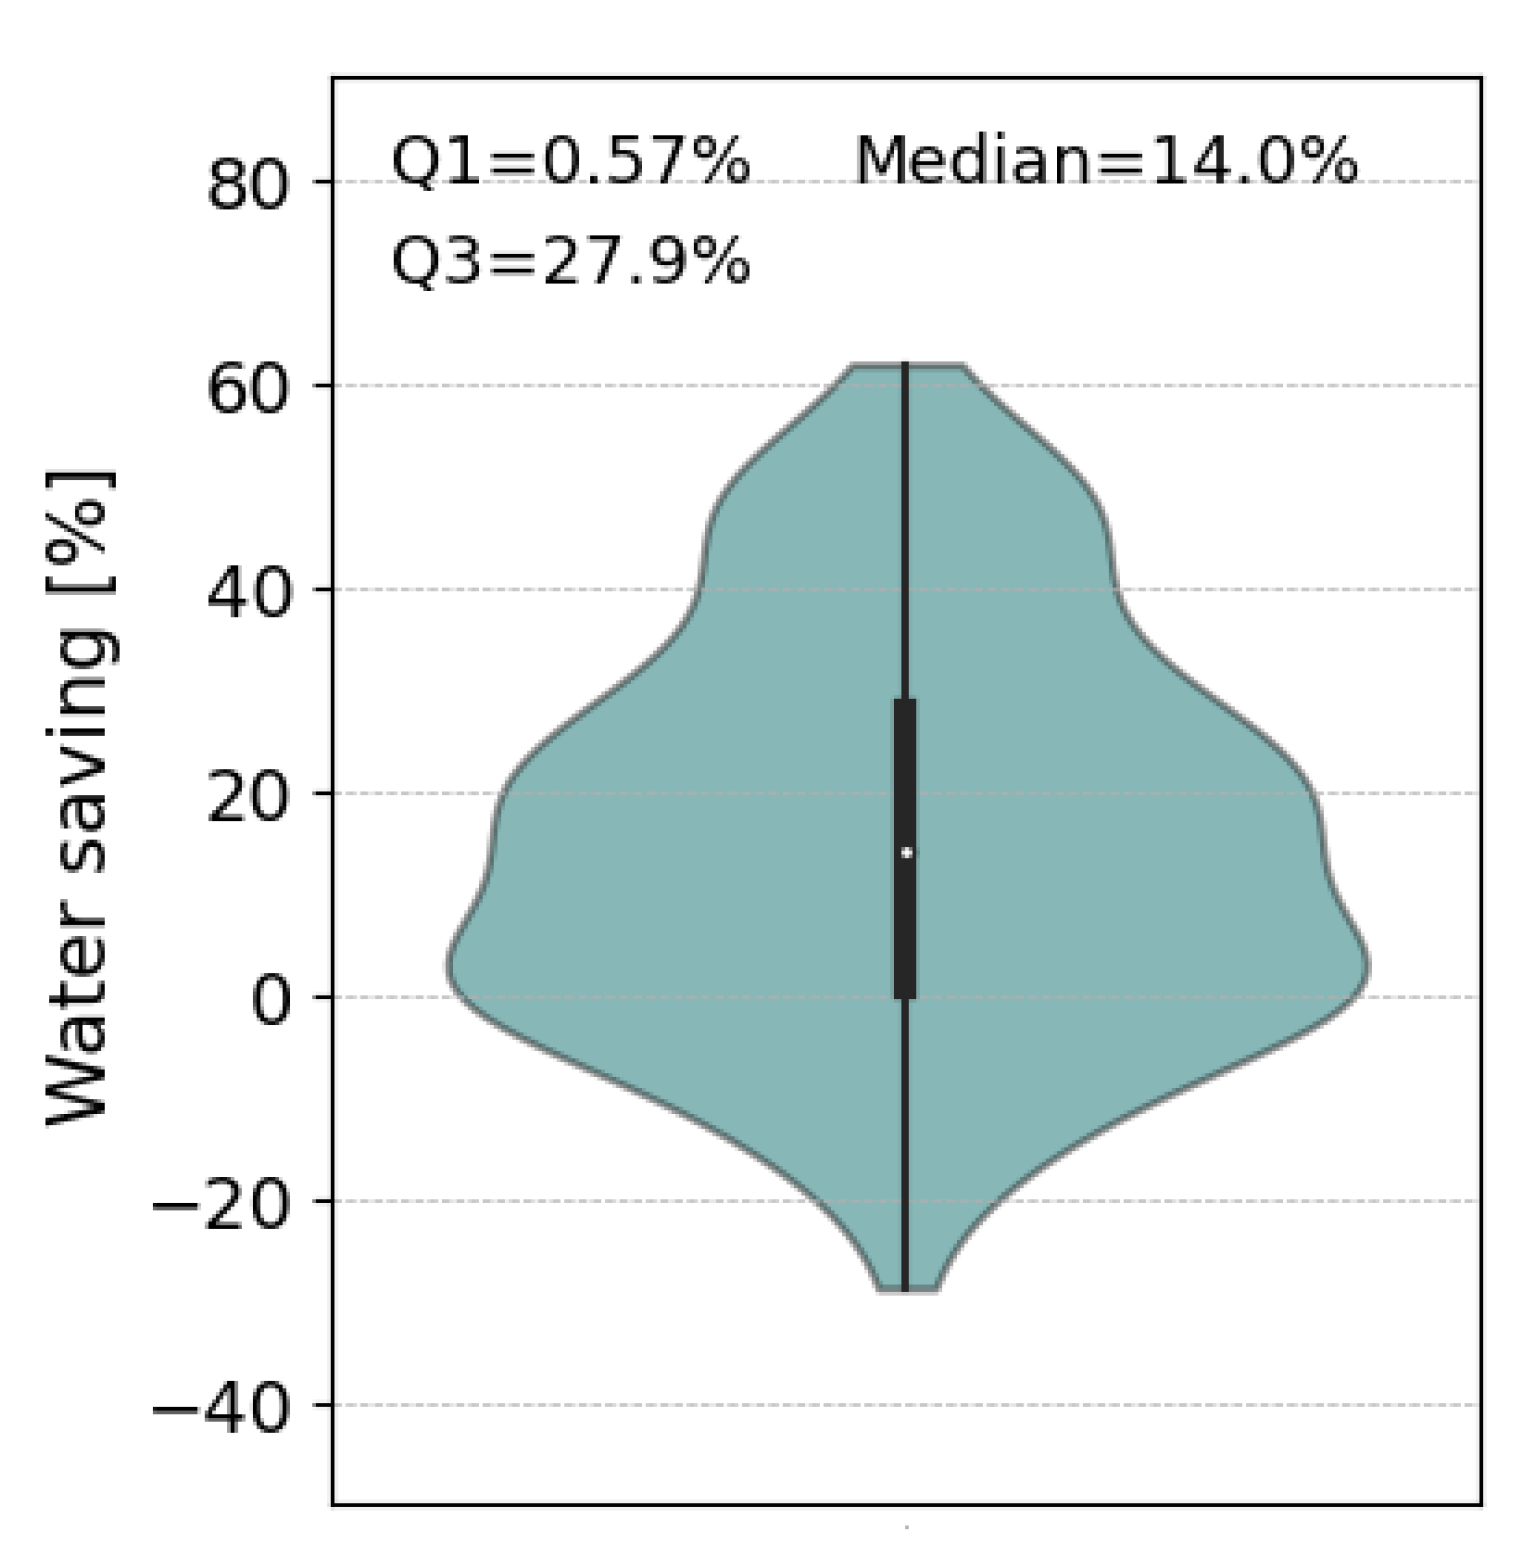
The distribution of W S rates deriving from the values above is provided in Figure 6; minimum and maximum values equal to −28.80% and +61.80%, respectively, are found. Note that a negative W S rate of −28.80% means that a participating unit has consumed more water in phase 2 than in phase 1. This issue is attributable to different reasons, such as the ineffectiveness of the awareness-raising campaign or the impossibility of implementing water-saving strategies for external factors (e.g., due to higher temperatures in phase 2 with respect to phase 1). An average W S rate weighed by water volumes equal to +17.20% is found. Figure 6 also reports additional features of the W S distribution, namely the first and third quartiles (equal to 0.57% and to 27.90%, respectively) and the median value of 14.00%. The average W S rate is the crucial result of the experiment carried out, quantifying the beneficial effect of the awareness-raising campaign. It is important to highlight that in many cases in which no savings have been achieved, there was already a great deal of attention to water consumption, thus reducing the scope for further saving. Another important aspect to recall is that the second phase of the experiment was carried out in a warmer period than the first phase, implying a greater propension to water use both for personal hygiene and for watering small gardens, terraces, and houseplants. Most of the buildings participating in this experiment are located in the Umbria region, where average monthly temperatures recorded in phase 1 and phase 2 were around 15 °C and 18 °C, respectively. Therefore, the result obtained in terms of average W S may be slightly underestimated.
A similar experiment was carried out in 2023 involving a smaller number of participants, i.e., the students in the Water Resources Management course delivered by the Department of Civil and Environmental Engineering at the University of Perugia. This former experiment involved around 394 people in 40 buildings in the time span from March to May 2023. In that occasion, per capita daily consumption rates around 120 L/inhabitant∙day were observed, determined through the analysis of water use from a total of 656 and 232 water dispensers and showers, respectively, of 254 toilet cisterns (34.00% with dual flush), of 113 washing machines and dishwashers; around 70.00% of the investigated buildings declared the use water for flowers and plants, and less than 40.00% had gardens. In such conditions, an average W S rate equal to +16.90% was found (minimum and maximum rates equal to −11.40% and +50.50%, respectively), closely aligned with the outcome of this study despite its reliance on almost twice as many participants and more than six times the number of buildings involved. Hence, the W S rate achievable through a low-cost awareness campaign, not implying any structural intervention, is stable when the size of the sample analyzed varies. Concerning the comparison against similar studies targeting other areas worldwide, W S rates reported in this study are higher than those found by [46] in Belén, Costa Rica (lower than 5.00%) and by [45] in Chennai, India ( W S = 10.30%). The study by [46] interested around 1400 households, while target and control groups of 615 and 150 members, respectively, have been considered by [45]. Differently from this work, in the studies above, the assessment of W S rates was not based on direct measurements, but water consumption is derived from invoiced bills instead, which included fixed costs and costs linked to consumed volumes through non-linear relationships.
The obtained W S rates have also been evaluated with respect to features of the buildings involved to assess potential relationships. Three main characteristics have been considered, namely the average number and age of inhabitants and the date of construction/renovation of the building. Results are summarized in Figure 7. A negligible decreasing trend of W S rates with increasing age of the inhabitants is found (slope of the linear regression line equal to −0.03%/year). Hence, factors like belonging to generations with a different culture on the use of water with respect to current times or potentially spending more time at home with respect to younger people do not affect the results. The clearest relationship is found with respect to the average number of inhabitants; as they increase, W S rates tend to decrease (slope of the linear regression line equal to −3.78%/inhabitant), confirming outcomes of previous studies (see, e.g., [47]). This is reasonable, as for a higher number of people belonging to the same participant unit, major difficulties in implementing water-saving strategies are expected because of the heterogeneity of habits. Ref. [48] highlighted that the cultural background of individuals may not be reflected in the overall behavior of a group of people, e.g., a family, in terms of water consumption habits. No relationship is observed between W S rates and the date of construction or renovation of the building, even though higher water consumption rates for more aged buildings are commonly expected [49].
As a follow-up to the experiment described above, water dispensers (faucets and showers) with water-saving elements (5 L/min) have been installed and monitored in three homes. The updated consumption quantification has shown further W S rates in two out of the three cases (resulting in +69.00% and +12.00%). This circumstance corroborates the importance of water-saving appliances in reducing household water consumption [50], which are just an example of the several individual actions that can make the difference within the scope of broader concepts such as sustainable water use [51] and environmental education [52,53]. Nevertheless, no substantial W S rates have been observed in the third home involved in the follow-up. A potential further extension of the proposed experiment is the assessment of long-term effects of the awareness-raising campaign. It is out of the scope of this work, but implementable through a new survey proposed to the same participants.

4. Conclusions

This study is aimed at showcasing the persuasive power of awareness-raising actions on household water consumption. To do this, an experiment involving around 750 participating people belonging to the population of the University of Perugia and distributed in 250 buildings with various destinations of use has been carried out. Water consumption has been monitored before and after the adoption of very simple strategies fostering the reduction in water wasting (e.g., verbal communication and stickers corresponding to water dispensers), whose positive effect has been quantified at an average W S rate of +17.20%. Such a number takes on great significance when compared to the simplicity of the awareness-raising actions perpetrated and if collocated in the context of projected freshwater reduction due to global warming and population growth. The estimated W S rates have shown no relationship against the average age of the participants and the date of construction or renovation of buildings involved. In contrast, a clear relationship between W S rates and the average number of inhabitants of the housing units is found. In fact, W S rates tend to decrease as the number of inhabitants increases.
In light of the positive outcome of the experiment presented in this study, the University of Perugia has decided to launch an awareness campaign involving all its facilities. Stickers to convey messages on elementary water-saving strategies have been adopted to potentially reach the entire student community (slightly less than 30,000 people) and the teaching and technical staff. Given the amount of people potentially reachable, massive quantities of water are expected to be saved. It is important to recall that, to foster the implementation of the experiment described in this study in other regions worldwide, the form used to collect data from the participants is made publicly available at: https://doi.org/10.6084/m9.figshare.30189649.v1 (accessed on 25 September 2025).

Author Contributions

Conceptualization, R.M.; methodology, R.M., C.S., A.F. and J.D.; formal analysis R.M., C.S., A.F. and J.D.; investigation, R.M., C.S., A.F. and J.D.; resources, R.M., C.S. and A.F.; data curation, R.M. and J.D.; writing—original draft preparation, R.M. and J.D.; writing—review and editing, R.M., C.S., A.F. and J.D.; visualization, R.M. and J.D.; supervision, R.M. and C.S.; funding acquisition, R.M., C.S., A.F. and J.D. All authors have read and agreed to the published version of the manuscript.

Funding

This research received no external funding.

Institutional Review Board Statement

This study is waived for ethical review as the use of anonymous data that does not violate anyone’s privacy by Institution Committee.

Informed Consent Statement

Informed consent for participation was obtained from all subjects involved in the study.

Data Availability Statement

Data will be made available upon reasonable request. The form that the participants of the experiment were asked to return completed together with consumption monitoring is publicly available at: https://doi.org/10.6084/m9.figshare.30189649.v1 (accessed on 25 September 2025).

Acknowledgments

The authors acknowledge AURI (Autorità Umbra Rifiuti e Idrico) Umbria (https://www.auriumbria.it/) for the support under the Interreg Europe Gov4Water project.

Conflicts of Interest

The authors declare no conflicts of interest.

References

  1. Kovats, R.S.; Valentini, R.; Bouwer, L.M.; Georgopoulou, E.; Jacob, D.; Martin, E.; Rounsevell, M.; Soussana, J.-F. Europe. In Climate Change 2014: Impacts, Adaptation, and Vulnerability Part B: Regional Aspects. Contribution of Working Group II to the Fifth Assessment Report of the Intergovernmental Panel on Climate Change; Barros, V.R., Field, C.B., Dokken, D.J., Mastrandrea, M.D., Mach, K.J., Bilir, T.E., Chatterjee, M., Ebi, K.L., Estrada, Y.O., Genova, R.C., et al., Eds.; Cambridge University Press: Cambridge, UK; New York, NY, USA, 2014; pp. 1267–1326. [Google Scholar]
  2. Bednar-Friedl, B.; Biesbroek, R.; Schmidt, D.N.; Alexander, P.; Børsheim, K.Y.; Carnicer, J.; Georgopoulou, E.; Haasnoot, M.; Le Cozannet, G.; Lionello, P.; et al. Europe. In Climate Change 2022: Impacts, Adaptation and Vulnerability. Contribution of Working Group II to the Sixth Assessment Report of the Intergovernmental Panel on Climate Change; Pörtner, H.-O., Roberts, D.C., Tignor, M., Poloczanska, E.S., Mintenbeck, K., Alegría, A., Craig, M., Langsdorf, S., Löschke, S., Möller, V., et al., Eds.; Cambridge University Press: Cambridge, UK; New York, NY, USA, 2022; pp. 1817–1927. [Google Scholar] [CrossRef]
  3. Stahl, K.; Hisdal, H.; Hannaford, J.; Tallaksen, L.M.; Van Lanen, H.A.J.; Sauquet, E.; Demuth, S.; Fendekova, M.; Jódar, J. Streamflow Trends in Europe: Evidence from a Dataset of near-Natural Catchments. Hydrol. Earth Syst. Sci. 2010, 14, 2367–2382. [Google Scholar] [CrossRef]
  4. Wilson, D.; Hisdal, H.; Lawrence, D. Has Streamflow Changed in the Nordic Countries?—Recent Trends and Comparisons to Hydrological Projections. J. Hydrol. 2010, 394, 334–346. [Google Scholar] [CrossRef]
  5. Petrow, T.; Merz, B. Aspects of Seasonality and FLood Generating Circulation Patterns in a Mountainous Catchment in South-Eastern Germany. Hydrol. Earth Syst. Sci. 2007, 11, 1455–1468. [Google Scholar] [CrossRef]
  6. Tu, M.; Hall, M.J.; De Laat, P.J.M.; De Wit, M.J.M. Extreme Floods in the Meuse River over the Past Century: Aggravated by Land-Use Changes? Phys. Chem. Earth Parts A/B/C 2005, 30, 267–276. [Google Scholar] [CrossRef]
  7. Villarini, G.; Smith, J.A.; Serinaldi, F.; Ntelekos, A.A. Analyses of Seasonal and Annual Maximum Daily Discharge Records for Central Europe. J. Hydrol. 2011, 399, 299–312. [Google Scholar] [CrossRef]
  8. Semenov, V.A. Climate-Related Changes in Hazardous and Adverse Hydrological Events in the Russian Rivers. Russ. Meteorol. Hydrol. 2011, 36, 124–129. [Google Scholar] [CrossRef]
  9. Renard, B.; Lang, M.; Bois, P.; Dupeyrat, A.; Mestre, O.; Niel, H.; Sauquet, E.; Prudhomme, C.; Parey, S.; Paquet, E.; et al. Regional Methods for Trend Detection: Assessing Field Significance and Regional Consistency. Water Resour. Res. 2008, 44, W08419. [Google Scholar] [CrossRef]
  10. Yiou, P.; Ribereau, P.; Naveau, P.; Nogaj, M.; Brázdil, R. Statistical Analysis of Floods in Bohemia (Czech Republic) since 1825. Hydrol. Sci. J. 2006, 51, 930–945. [Google Scholar] [CrossRef]
  11. Bormann, H.; Pinter, N.; Elfert, S. Hydrological Signatures of Flood Trends on German Rivers: Flood Frequencies, Flood Heights and Specific Stages. J. Hydrol. 2011, 404, 50–66. [Google Scholar] [CrossRef]
  12. Settele, J.; Scholes, R.; Betts, R.; Bunn, S.; Leadley, P.; Nepstad, D.; Overpeck, J.T.; Taboada, M.A. Terrestrial and inland water systems. In Climate Change 2014: Impacts, Adaptation, and Vulnerability. Part A: Global and Sectoral Aspects. Contribution of Working Group II to the Fifth Assessment Report of the Intergovernmental Panel on Climate Change; Cambridge Press: Cambridge, UK; New York, NY, USA, 2014; pp. 271–359. [Google Scholar]
  13. Dankers, R.; Feyen, L. Climate Change Impact on Flood Hazard in Europe: An Assessment Based on High-resolution Climate Simulations. J. Geophys. Res. 2008, 113, D19105. [Google Scholar] [CrossRef]
  14. Rojas, R.; Feyen, L.; Bianchi, A.; Dosio, A. Assessment of Future Flood Hazard in Europe Using a Large Ensemble of Bias-corrected Regional Climate Simulations. J. Geophys. Res. 2012, 117, D17109. [Google Scholar] [CrossRef]
  15. Gao, X.; Giorgi, F. Increased Aridity in the Mediterranean Region under Greenhouse Gas Forcing Estimated from High Resolution Simulations with a Regional Climate Model. Glob. Planet. Change 2008, 62, 195–209. [Google Scholar] [CrossRef]
  16. Tsanis, I.K.; Koutroulis, A.G.; Daliakopoulos, I.N.; Jacob, D. Severe Climate-Induced Water Shortage and Extremes in Crete: A Letter. Clim. Change 2011, 106, 667–677. [Google Scholar] [CrossRef]
  17. Wong, W.K.; Beldring, S.; Engen-Skaugen, T.; Haddeland, I.; Hisdal, H. Climate Change Effects on Spatiotemporal Patterns of Hydroclimatological Summer Droughts in Norway. J. Hydrometeorol. 2011, 12, 1205–1220. [Google Scholar] [CrossRef]
  18. Essa, Y.H.; Hirschi, M.; Thiery, W.; El-Kenawy, A.M.; Yang, C. Drought characteristics in Mediterranean under future climate change. npj Clim. Atmos. Sci. 2023, 6, 133. [Google Scholar] [CrossRef]
  19. Grillakis, M.G. Increase in severe and extreme soil moisture droughts for Europe under climate change. Sci. Total Environ. 2019, 660, 1245–1255. [Google Scholar] [CrossRef]
  20. Gaona, J.; Bavera, D.; Fioravanti, G.; Hahn, S.; Stradiotti, P.; Filippucci, P.; Camici, S.; Ciabatta, L.; Mosaffa, H.; Puca, S.; et al. Soil moisture product consistency for operational drought monitoring in Europe. Hydrol. Earth Syst. Sci. 2025, 29, 3865–3888. [Google Scholar] [CrossRef]
  21. Seneviratne, S.I.; Nicholls, N.; Easterling, D.; Goodess, C.M.; Kanae, S.; Kossin, J.; Luo, Y.; Marengo, J.; McInnes, K.; Rahimi, M.; et al. Changes in climate extremes and their impacts on the natural physical environment. In Managing the Risks of Extreme Events and Disasters to Advance Climate Change Adaptation. A Special Report of Working Groups I and II of the Intergovernmental Panel on Climate Change; Cambridge University Press: Cambridge, UK; New York, NY, USA, 2012; pp. 109–230. [Google Scholar]
  22. Handmer, J.Y.; Honda, Z.W.; Kundzewicz, N.; Arnell, G.; Benito, J.; Hatfield, I.F.; Mohamed, P.; Peduzzi, S.; Wu, B.; Sherstyukov, B.; et al. Changes in Impacts of Climate Extremes: Human Systems and Ecosystems. In Managing the Risks of Extreme Events and Disasters to Advance Climate Change Adaptation; Cambridge University Press: Cambridge, UK; New York, NY, USA, 2012; pp. 231–290. [Google Scholar]
  23. Visser, H.; Petersen, A.C.; Ligtvoet, W. On the Relation between Weather-Related Disaster Impacts, Vulnerability and Climate Change. Clim. Change 2014, 125, 461–477. [Google Scholar] [CrossRef]
  24. Hoegh-Guldberg, O.; Jacob, D.; Taylor, M.; Bindi, M.; Brown, S.; Camilloni, I.; Diedhiou, A.; Djalante, R.; Ebi, K.L.; Engelbrecht, F.; et al. Impacts of 1.5 °C Global Warming on Natural and Human Systems. In Global Warming of 1.5 °C. An IPCC Special Report on the Impacts of Global Warming of 1.5 °C Above Pre-Industrial Levels and Related Global Greenhouse Gas Emission Pathways, in the Context of Strengthening the Global Response to the Threat of Climate Change, Sustainable Development, and Efforts to Eradicate Poverty. Masson-Delmotte, V.; Zhai, P., Pörtner, H.-O., Roberts, D., Skea, J., Shukla, P.R., Pirani, A., Moufouma-Okia, W., Péan, C., Pidcock, R., et al., Eds.; Cambridge University Press: Cambridge, UK; New York, NY, USA, 2018; pp. 175–311. [Google Scholar]
  25. Merz, B.; Blöschl, G.; Vorogushyn, S.; Dottori, F.; Aerts, J.C.J.H.; Bates, P.; Bertola, M.; Kemter, M.; Kreibich, H.; Lall, U.; et al. Causes, Impacts and Patterns of Disastrous River Floods. Nat. Rev. Earth Environ. 2021, 2, 592–609. [Google Scholar] [CrossRef]
  26. Dari, J.; Flammini, A.; Morbidelli, R.; Saltalippi, C. Evolution of Freshwater Availability in a Climate-changing Mediterranean Context: The case of Umbria region, central Italy. Hydrol. Process. 2023, 37, e15050. [Google Scholar] [CrossRef]
  27. Rahi, A.; Rahmati, M.; Dari, J.; Saltalippi, C.; Brogi, C.; Morbidelli, R. Unraveling hydroclimatic forces controlling the runoff coefficient trends in central Italy’s Upper Tiber Basin. J. Hydrol. Reg. Stud. 2023, 50, 101579. [Google Scholar] [CrossRef]
  28. Stahl, K.; Tallaksen, L.M.; Hannaford, J.; van Lanen, H.A.J. Filling the white space on maps of European runoff trends: Estimates from a multi-model ensemble. Hydrol. Earth Syst. Sci. 2012, 16, 2035–2047. [Google Scholar] [CrossRef]
  29. Masseroni, D.; Camici, S.; Cislaghi, A.; Vacchiano, G.; Massari, C.; Brocca, L. The 63-year changes in annual streamflow volumes across Europe with a focus on the Mediterranean basin. Hydrol. Earth Syst. Sci. 2021, 25, 5589–5601. [Google Scholar] [CrossRef]
  30. Piao, S.; Ciais, P.; Huang, Y.; Shen, Z.; Peng, S.; Li, J.; Zhou, L.; Liu, H.; Ma, Y.; Ding, Y.; et al. The Impacts of Climate Change on Water Resources and Agriculture in China. Nature 2010, 467, 43–51. [Google Scholar] [CrossRef]
  31. Jones, J.A. Hydrologic Responses to Climate Change: Considering Geographic Context and Alternative Hypotheses. Hydrol. Process. 2011, 25, 1996–2000. [Google Scholar] [CrossRef]
  32. Dai, A. Increasing Drought under Global Warming in Observations and Models. Nat. Clim. Change 2013, 3, 52–58. [Google Scholar] [CrossRef]
  33. Jiménez Cisneros, B.E.; Oki, T.; Arnell, N.W.; Benito, G.; Cogley, J.G.; Döll, P.; Jiang, T.; Mwakalila, S.S. Freshwater resources. In Climate Change 2014: Impacts, Adaptation, and Vulnerability. Part A: Global and Sectoral Aspects. Contribution of Working Group II to the Fifth Assessment Report of the Intergovernmental Panel on Climate Change; Cambridge University Press: Cambridge, UK; New York, NY, USA, 2014; pp. 229–269. [Google Scholar]
  34. Dari, J.; Quintana-Seguí, P.; Barella-Ortiz, A.; Rahmati, M.; Saltalippi, C.; Flammini, A.; Brocca, L. Quantifying the Hydrological Impacts of Irrigation on a Mediterranean Agricultural Context Through Explicit Satellite-Derived Irrigation Estimates. Water Resour. Res. 2024, 60, e2023WR036510. [Google Scholar] [CrossRef]
  35. Taylor, I.H.; Burke, E.; McColl, L.; Falloon, P.D.; Harris, G.R.; McNeall, D. The Impact of Climate Mitigation on Projections of Future Drought. Hydrol. Earth Syst. Sci. 2013, 17, 2339–2358. [Google Scholar] [CrossRef]
  36. Bhattarai, N.; Pollack, A.; Lobell, D.B.; Fishman, R.; Singh, B.; Dar, A.; Jain, M. The impact of groundwater depletion on agricultural production in India. Environ. Res. Lett. 2021, 16, 085003. [Google Scholar] [CrossRef]
  37. Dari, J.; Filippucci, P.; Brocca, L.; Quast, R.; Vreugdenhil, M.; Miralles, D.G.; Morbidelli, R.; Saltalippi, C.; Flammini, A. A novel approach for estimating groundwater recharge leveraging high-resolution satellite soil moisture. J. Hydrol. 2025, 652, 132678. [Google Scholar] [CrossRef]
  38. Feng, W.; Zhong, M.; Lemoine, J.-M.; Biancale, R.; Hsu, H.-T.; Xia, J. Evaluation of groundwater depletion in North China using theGravity Recovery and Climate Experiment (GRACE) data andground-based measurements. Water Resour. Res. 2013, 49, 2110–2118. [Google Scholar] [CrossRef]
  39. Famiglietti, J.S. The global groundwater crisis. Nat. Clim. Chang. 2014, 4, 945–948. [Google Scholar] [CrossRef]
  40. Brocca, L.; Barbetta, S.; Camici, S.; Ciabatta, L.; Dari, J.; Filippucci, P.; Massari, C.; Modanesi, S.; Tarpanelli, A.; Bonaccorsi, B.; et al. A Digital Twin of the terrestrial water cycle: A glimpse into the future through high-resolution Earth observations. Front. Sci. 2024, 1, 1190191. [Google Scholar] [CrossRef]
  41. Camici, S.; Dari, J.; Filippucci, P.; Massari, C.; Avanzi, F.; Delogu, F.; Baez-Villanueva, O.M.; Vreugdenhil, M.; Volden, E.; Fernandez-Prieto, D.; et al. High-resolution satellite observations for developing advanced decision support systems for water resources management in the Po River. J. Hydrol. 2025, 662, 134047. [Google Scholar] [CrossRef]
  42. Broering, L.A.; Michel, J.; Henning, E.; Konrath, A.C. An investigation into water consumption by university students: Actions, beliefs and perceptions. Discov. Water 2024, 4, 114. [Google Scholar] [CrossRef]
  43. Harriden, K. Water Diaries: Generate intra-household water use data—Generate water use behaviour change. J. Water Sanit. Hyg. Dev. 2013, 3, 70–80. [Google Scholar] [CrossRef]
  44. Morote, Á.-F.; Hernández, M.; Olcina, J.; Rico, A.-M. Water Consumption and Management in Schools in the City of Alicante (Southern Spain) (2000–2017): Free Water Helps Promote Saving Water? Water 2020, 12, 1052. [Google Scholar] [CrossRef]
  45. Nayar, A.; Kanaka, S. Nudging urban water conservation:evidence from India on the effect of behavior economics on water consumption. Eur. J. Res. Soc. Sci. 2017, 5, 73–84. [Google Scholar]
  46. Miranda, J.J.; Datta, S.; Zoratto, L. Saving Water with a Nudge (or Two): Evidence from Costa Rica on the Effectiveness and Limits of Low-Cost Behavioral Interventions on Water Use. World Bank Econ. Rev. 2020, 34, 444–463. [Google Scholar] [CrossRef]
  47. Bich-Ngoc, N.; Prevedello, C.; Cools, M.; Teller, J. Factors Influencing Residential Water Consumption in Wallonia, Belgium. Util. Policy 2022, 74, 101281. [Google Scholar] [CrossRef]
  48. Jorgensen, B.S.; Martin, J.F.; Pearce, M.W.; Willis, E.M. Predicting Household Water Consumption With Individual-Level Variables. Environ. Behav. 2014, 46, 872–897. [Google Scholar] [CrossRef]
  49. Dias, T.F.; Kalbusch, A.; Henning, E. Factors Influencing Water Consumption in Buildings in Southern Brazil. J. Clean. Prod. 2018, 184, 160–167. [Google Scholar] [CrossRef]
  50. Lu, S.; Gao, X.; Li, W.; Jiang, S.; Huang, L. A Study on the Spatial and Temporal Variability of the Urban Residential Water Consumption and Its Influencing Factors in the Major Cities of China. Habitat Int. 2018, 78, 29–40. [Google Scholar] [CrossRef]
  51. Figueiredo, M.; Fernandes, A.; Neves, J.; Vicente, H. Sustainable Water Use and Public Awareness in Portugal. Sustainability 2024, 16, 5444. [Google Scholar] [CrossRef]
  52. Boca, G.D.; Saraçlı, S. Environmental Education and Student’s Perception, for Sustainability. Sustainability 2019, 11, 1553. [Google Scholar] [CrossRef]
  53. Hajj-Hassan, M.; Chaker, R.; Cederqvist, A.-M. Environmental Education: A Systematic Review on the Use of Digital Tools for Fostering Sustainability Awareness. Sustainability 2024, 16, 3733. [Google Scholar] [CrossRef]
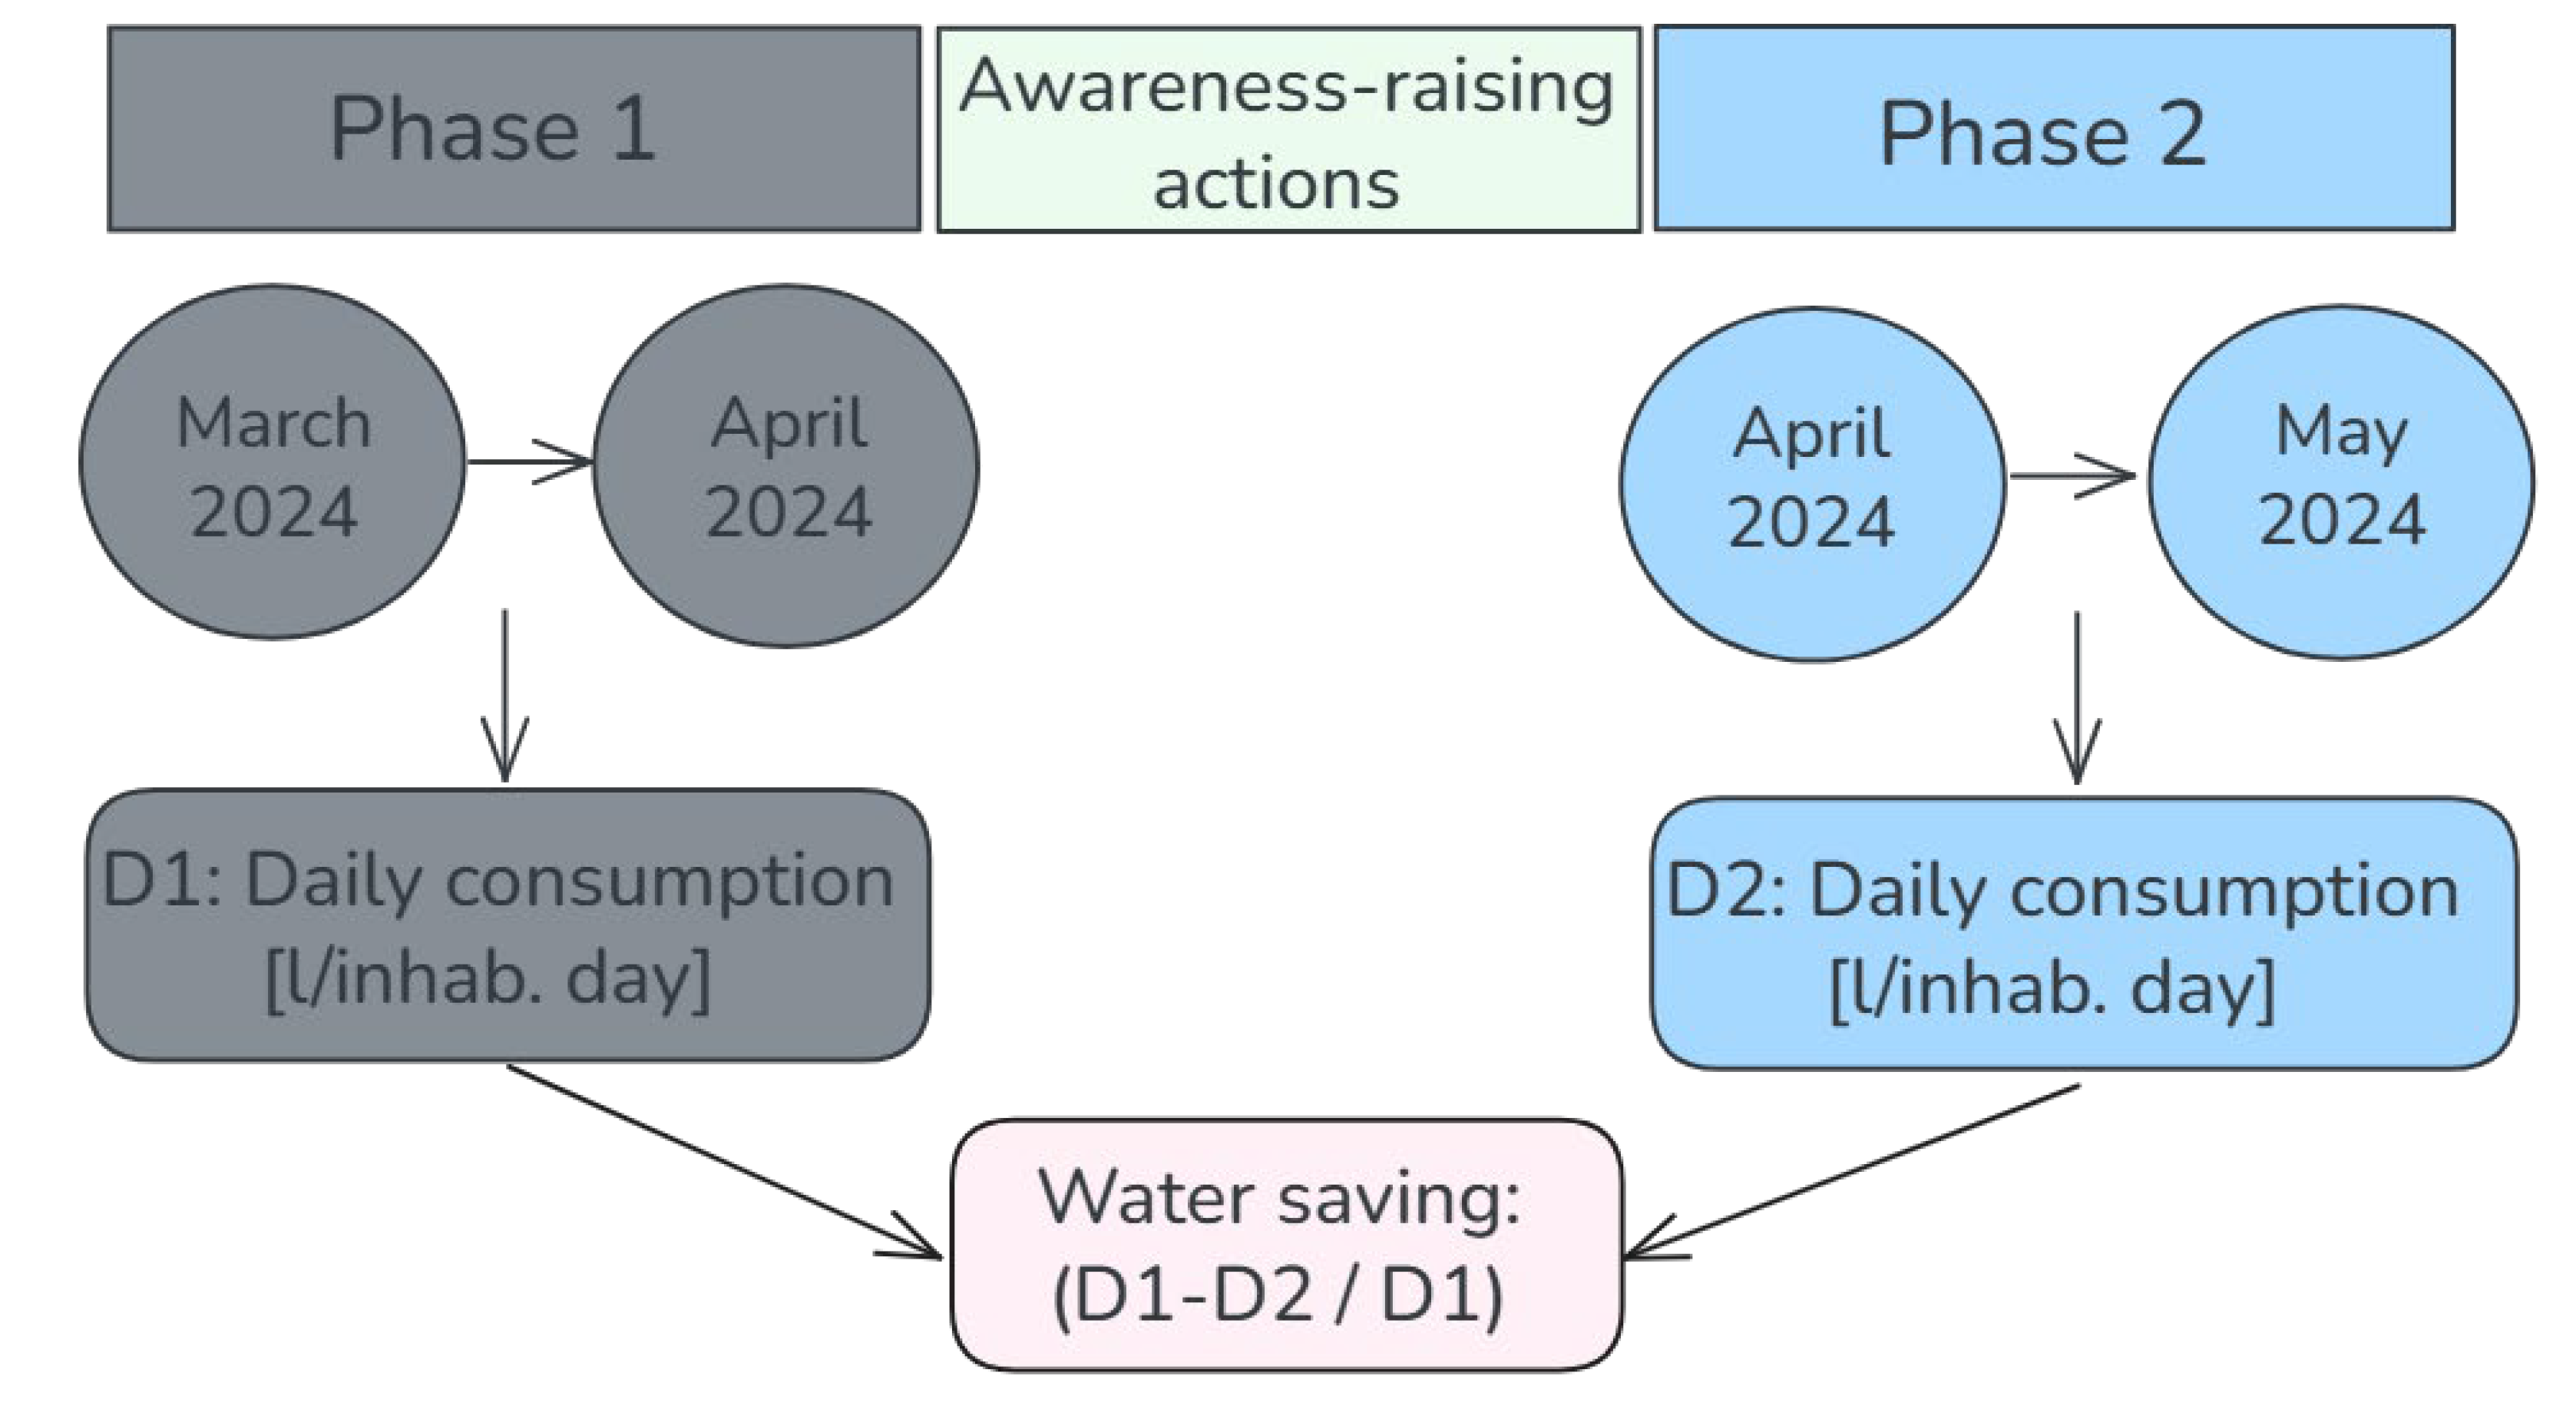
Figure 1. Overarching scheme of the experiment.
Sustainability 17 08887 g001
Figure 2. Example of photographs of water meters taken by the participants to the experiment.
Sustainability 17 08887 g002
Figure 3. Stickers used in the awareness-raising campaign. They report the name of the initiative “Conta la goccia!” (in Italian) that means “Count the drop!”.
Sustainability 17 08887 g003
Figure 4. Features of the 250 buildings involved in the experiment in terms of facilities and appliances for dispensing or using water. Each panel refers to a specific feature (also differentiated by color) and each bar identifies a participating unit.
Sustainability 17 08887 g004
Figure 5. Relative frequency of per capita daily consumption rates observed in the two phases of the experiment.
Sustainability 17 08887 g005
Figure 6. Distribution of the water-saving ( W S ) rates obtained as an effect of the awareness-raising campaign.
Sustainability 17 08887 g006
Figure 7. Relationship between WS (water-saving) rates and average age of inhabitants, average number of inhabitants, and date of construction or renovation of the building.
Sustainability 17 08887 g007
Disclaimer/Publisher’s Note: The statements, opinions and data contained in all publications are solely those of the individual author(s) and contributor(s) and not of MDPI and/or the editor(s). MDPI and/or the editor(s) disclaim responsibility for any injury to people or property resulting from any ideas, methods, instructions or products referred to in the content.