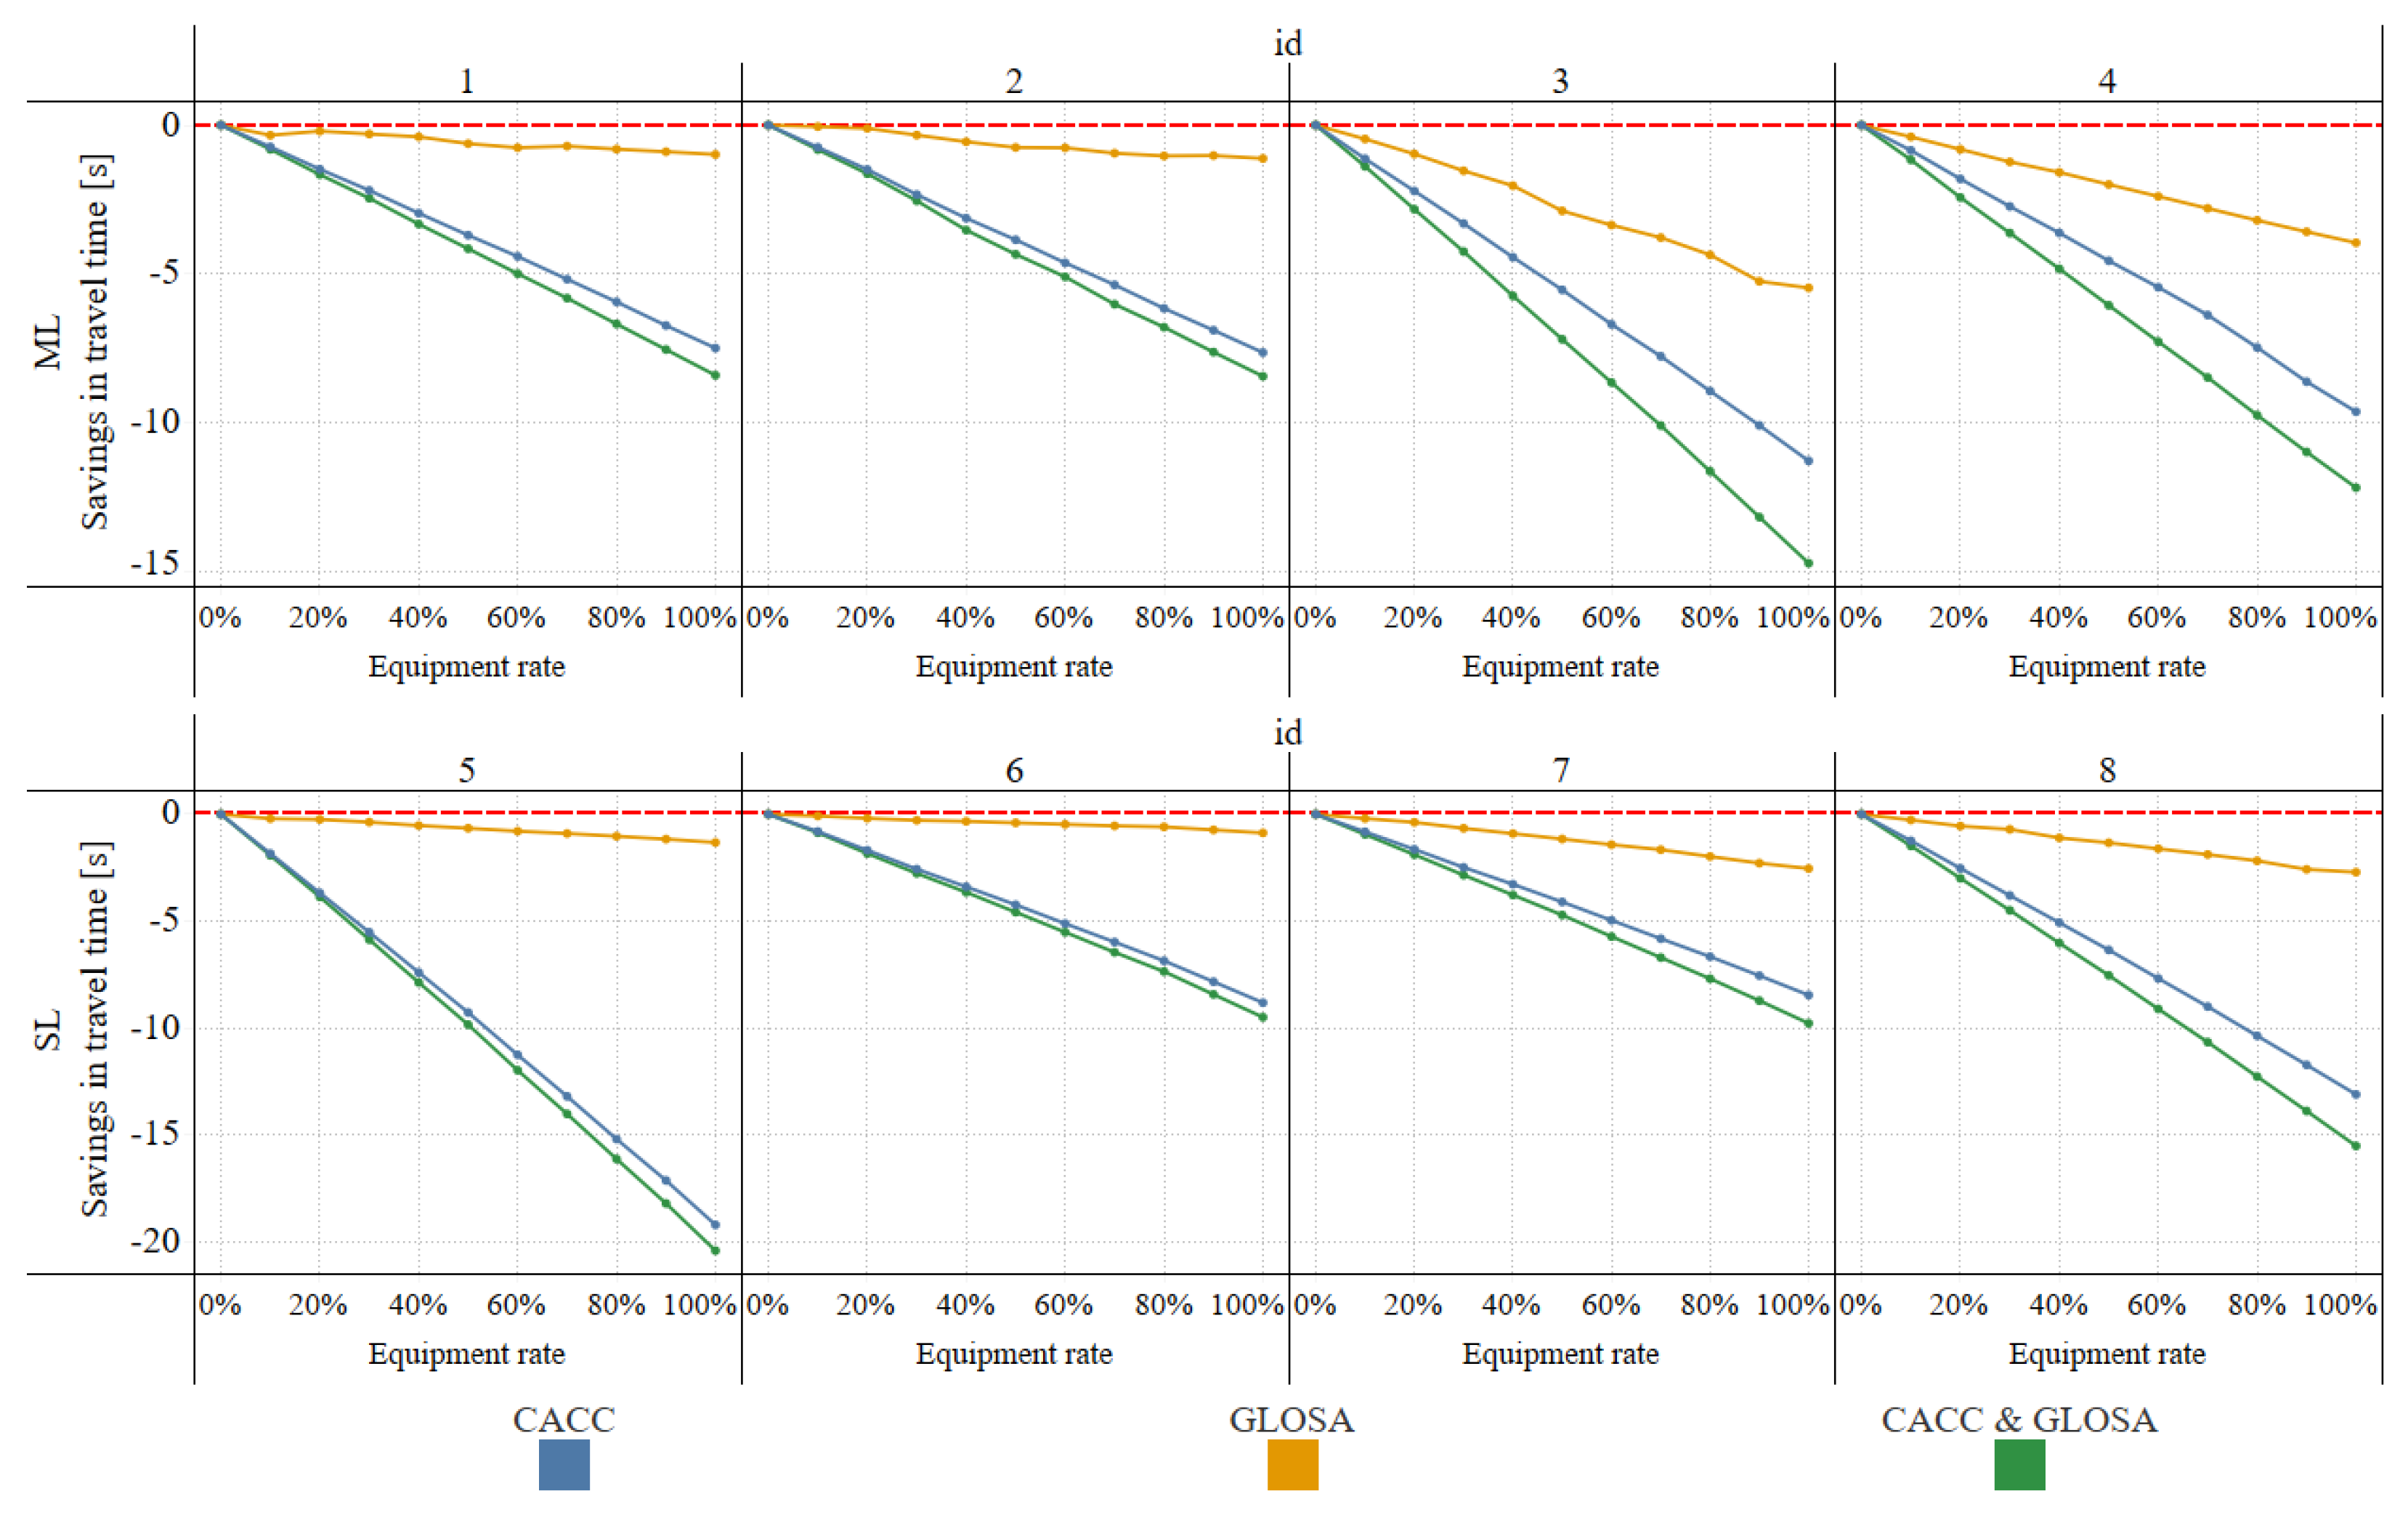
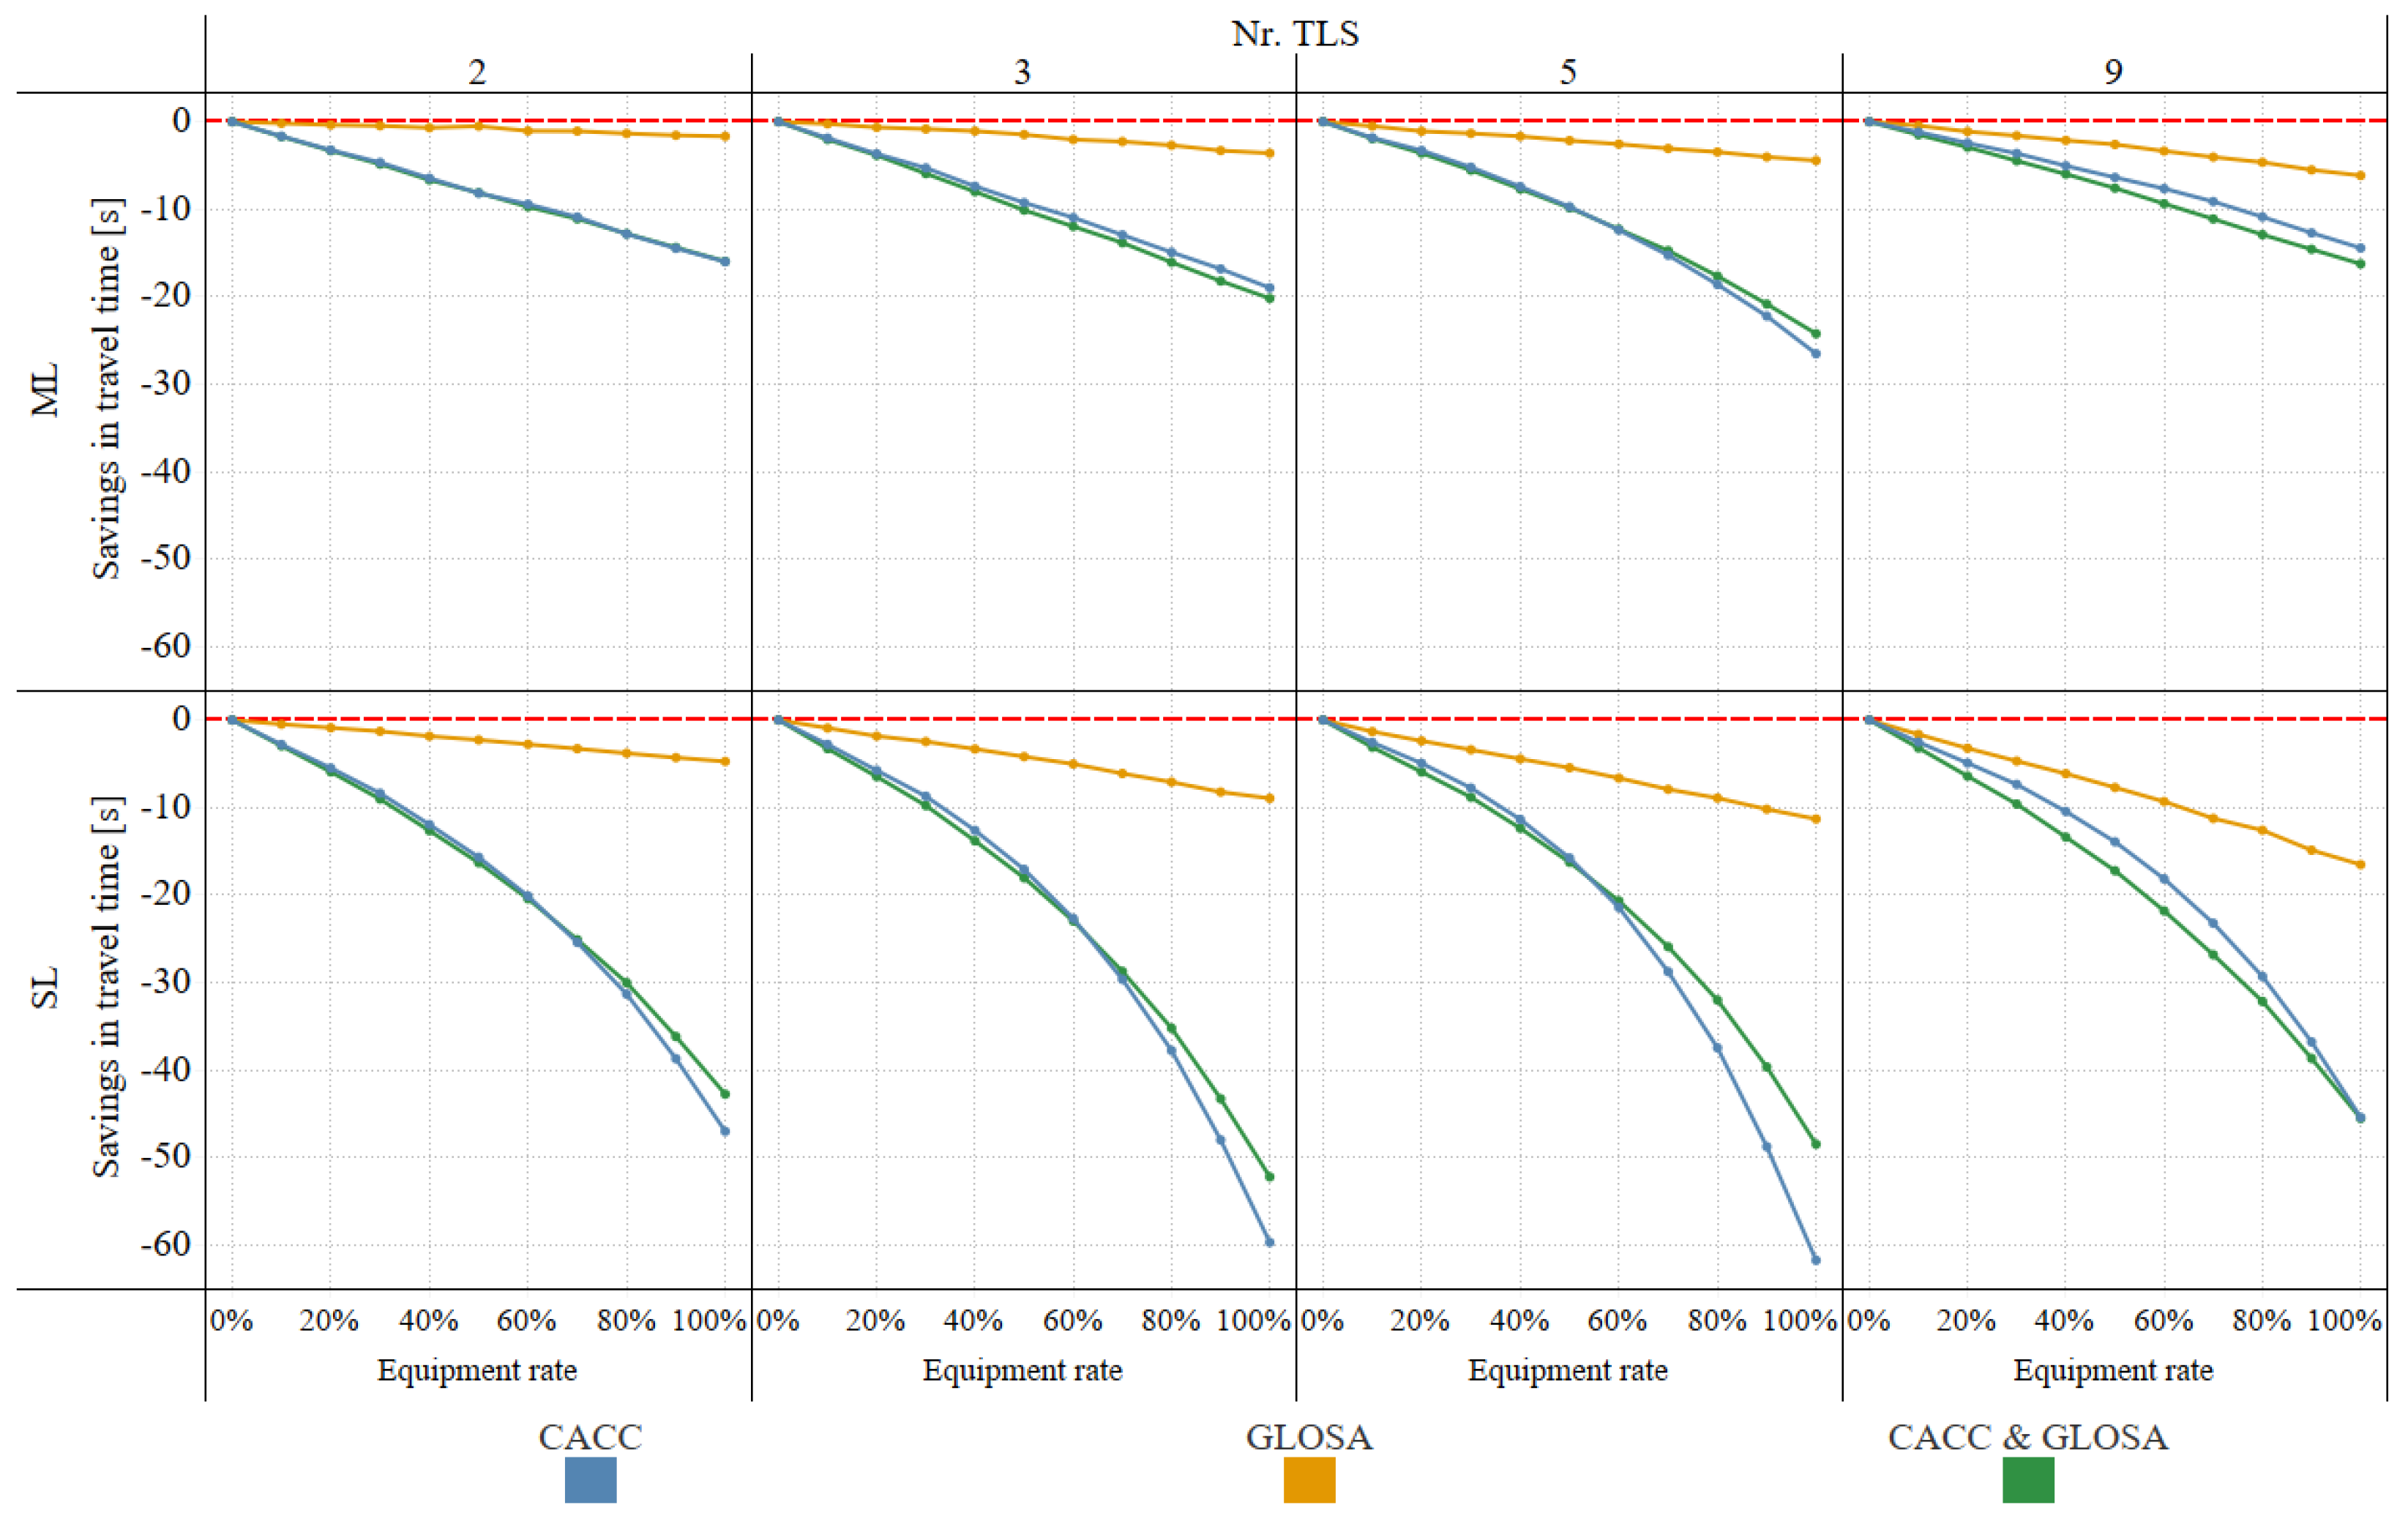
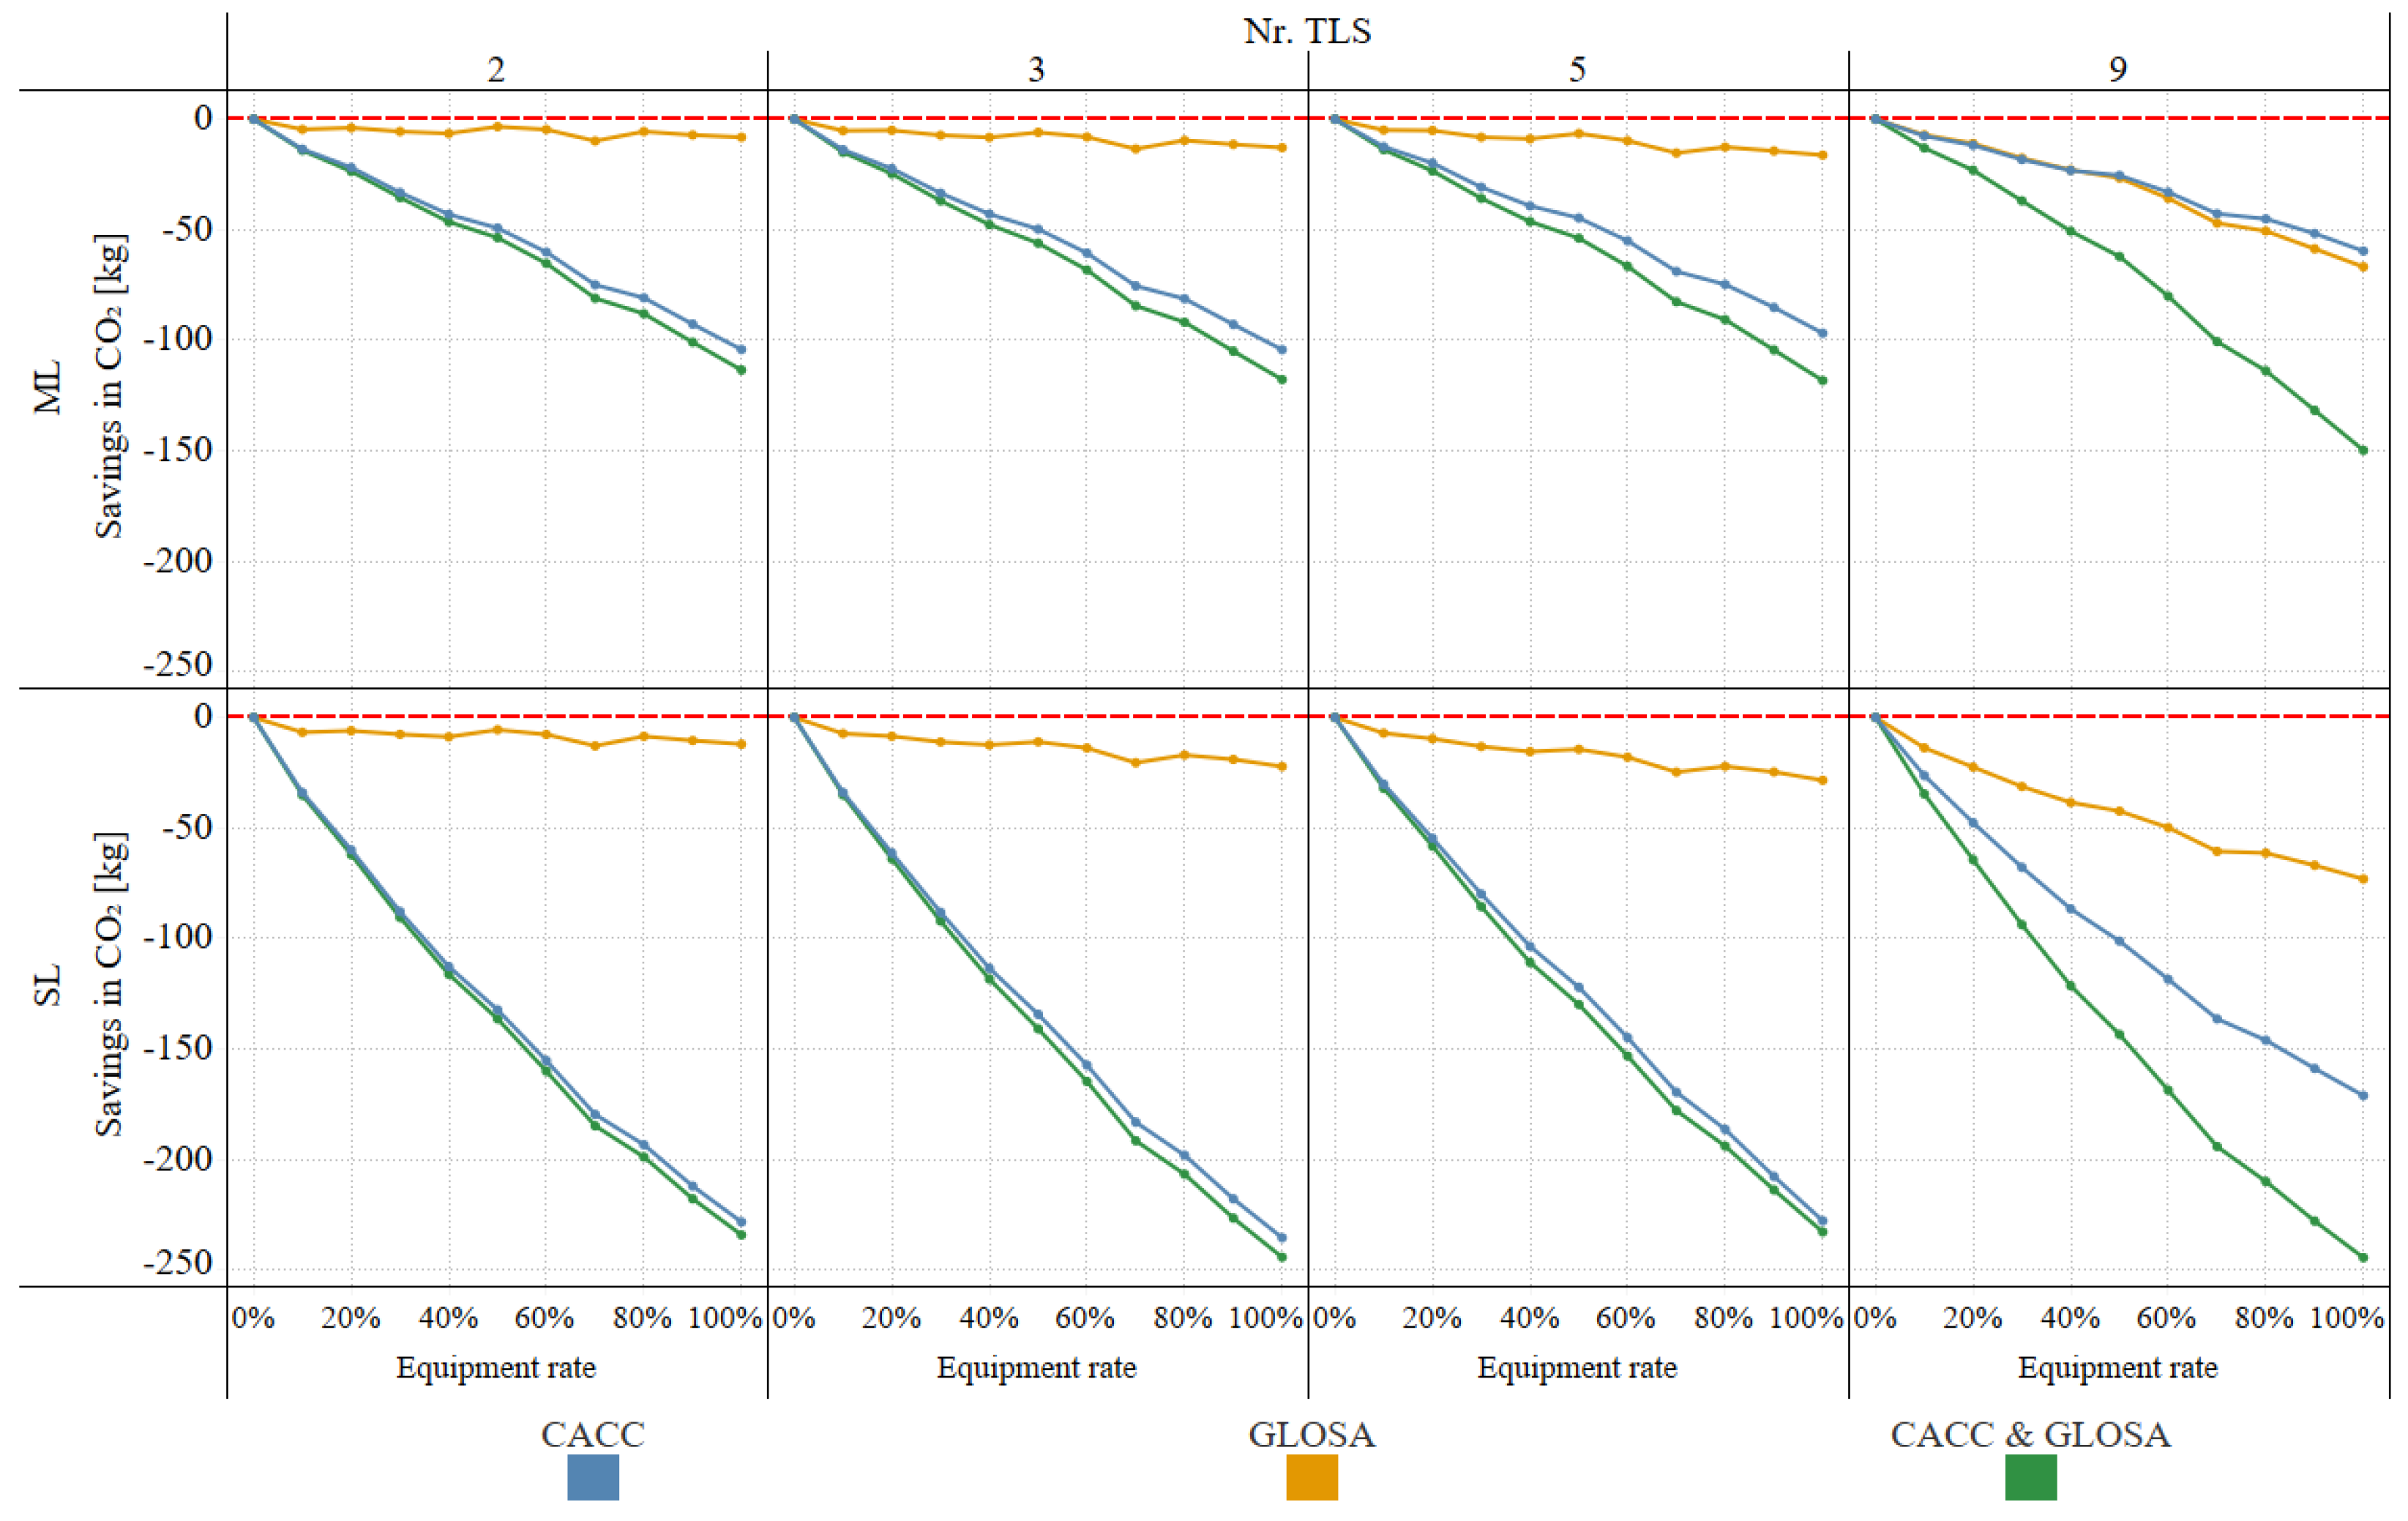
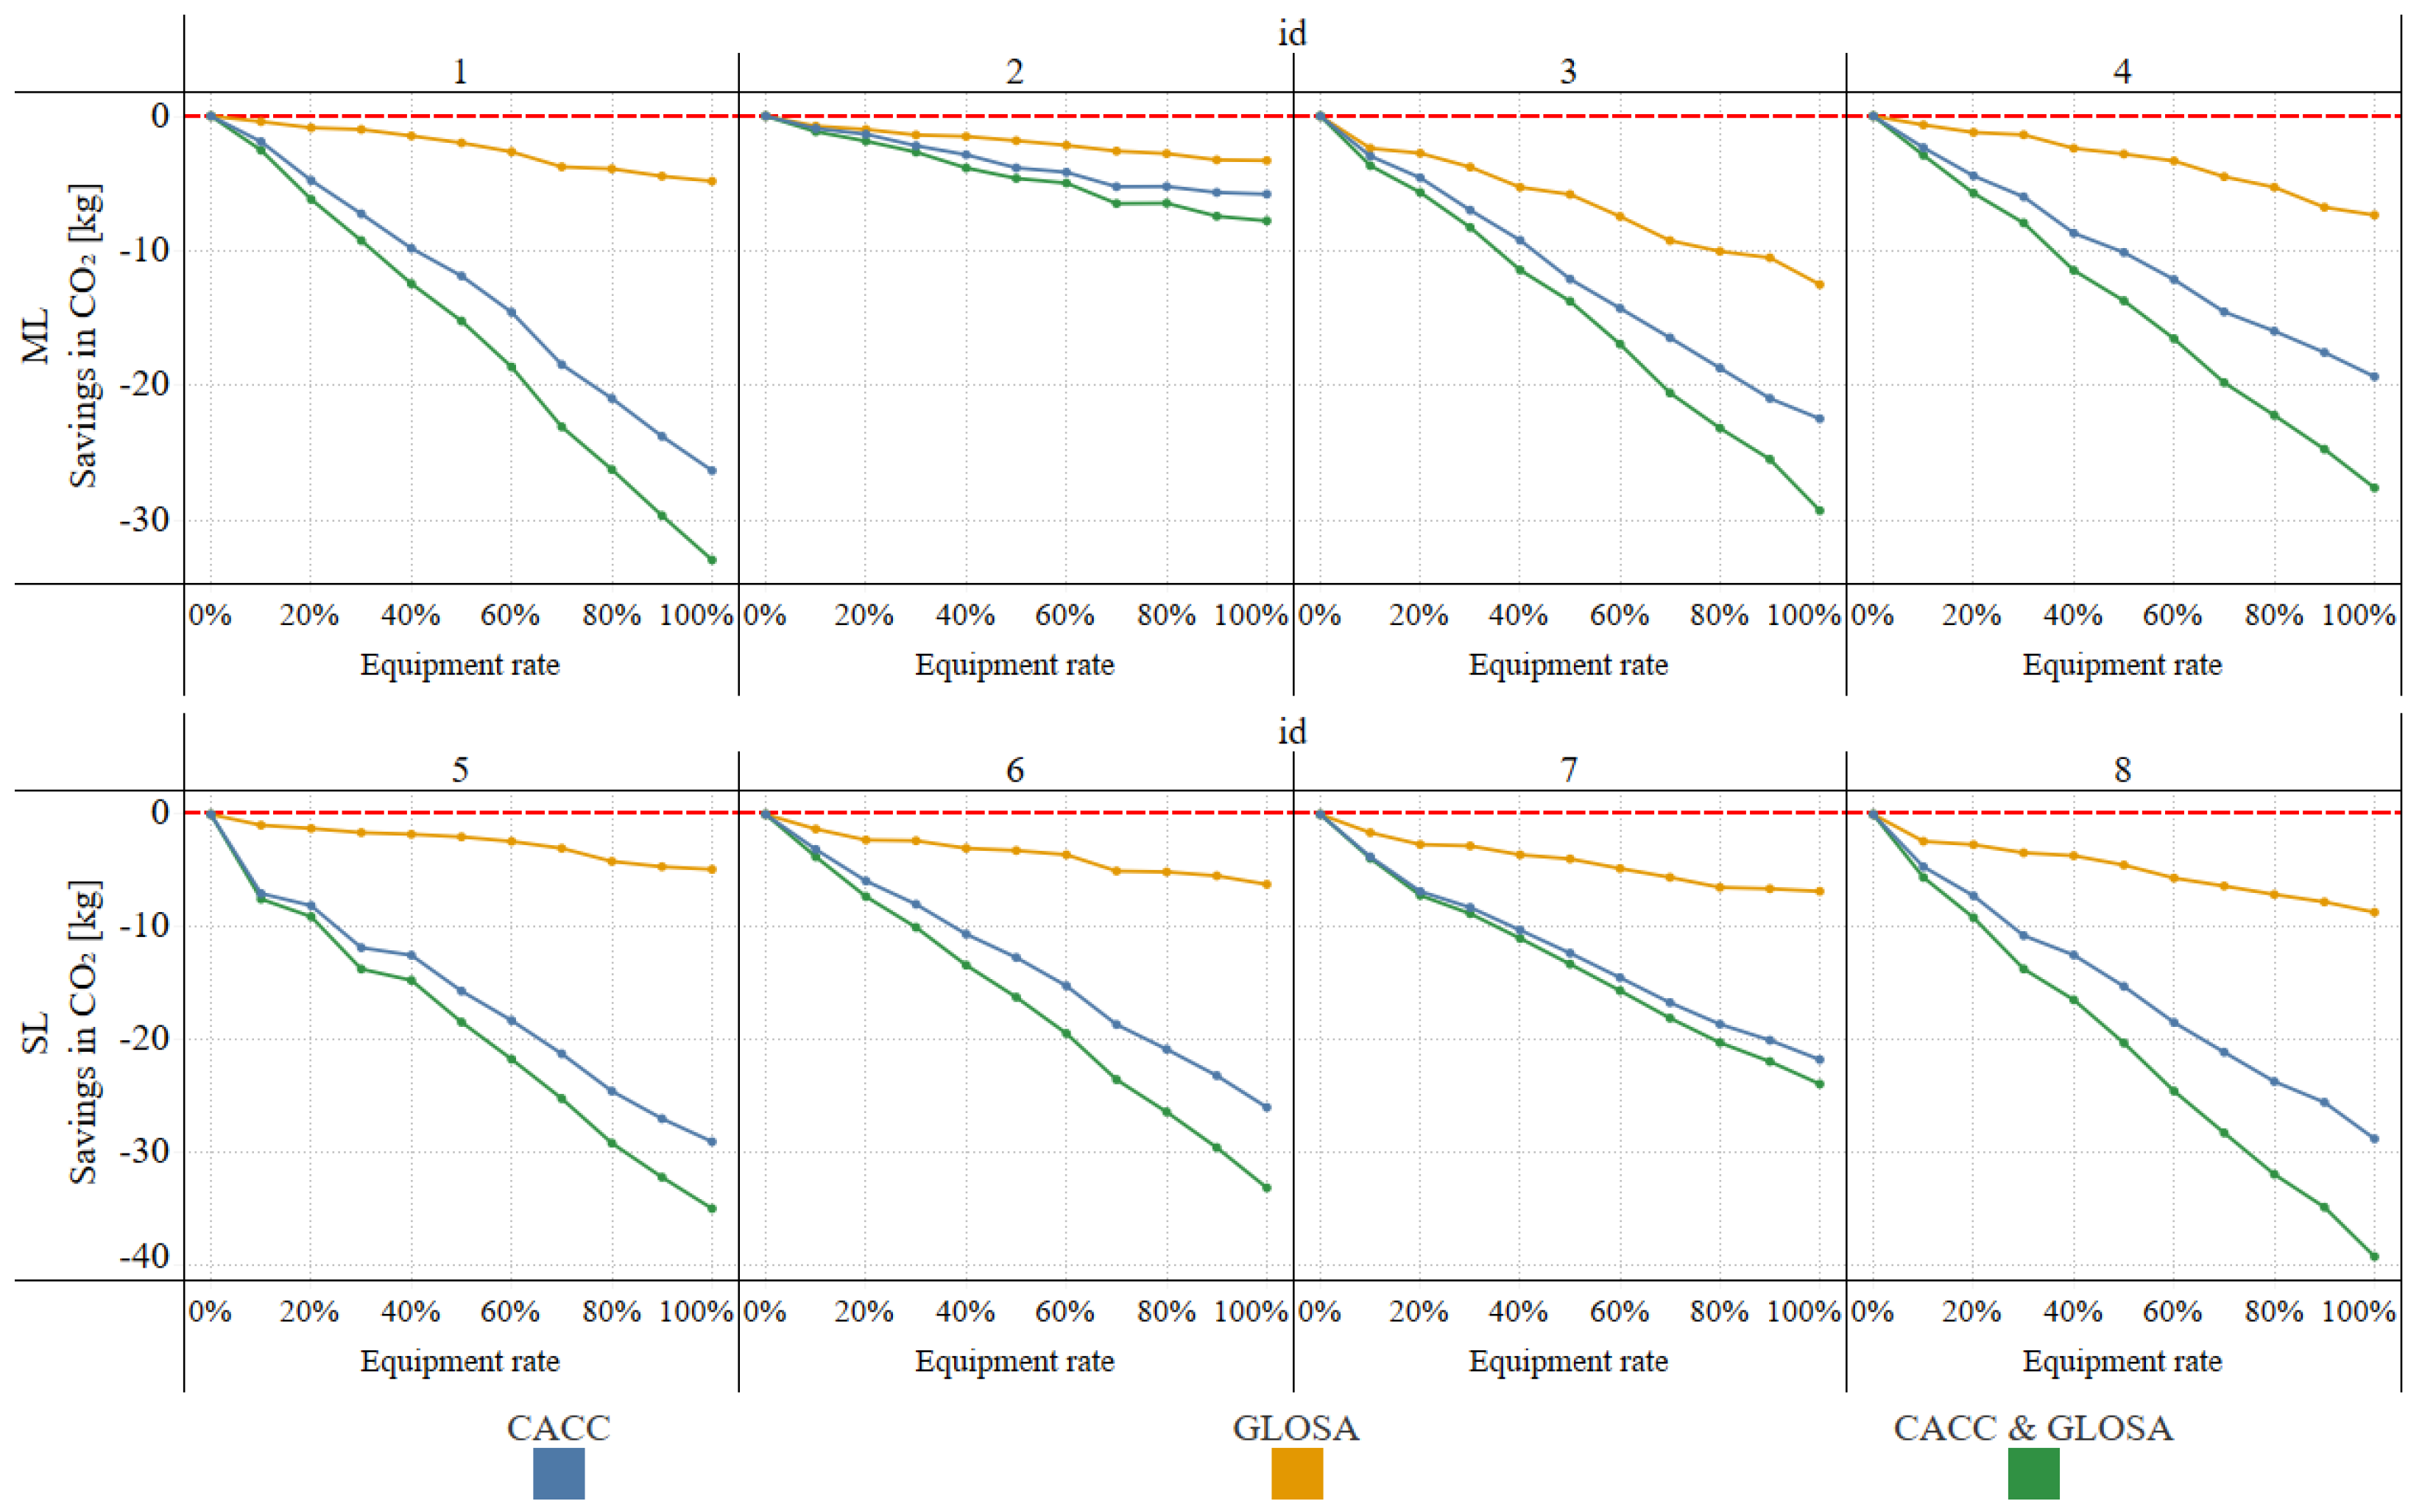
The statistically significant differences in the impacts of the C-ITS services on CO2 emissions reveal an even clearer outcome. Only a single variable combination (ML, 9 TLS, 100 veh/h, 10% ER) shows no differences in the CO2 emissions per vehicle. In all other cases, the CO2 emissions differ significantly between the respective C-ITS services used.
In summary, based on the ANOVA results, the impacts of the C-ITS services are clearly observable. However, the ANOVA alone does not allow us to determine which C-ITS service results differ from one another. Therefore, for all significant ANOVA results, we conducted Tukey’s HSD post-hoc.
4.1.1. Tukey’s HSD Result-Travel Time
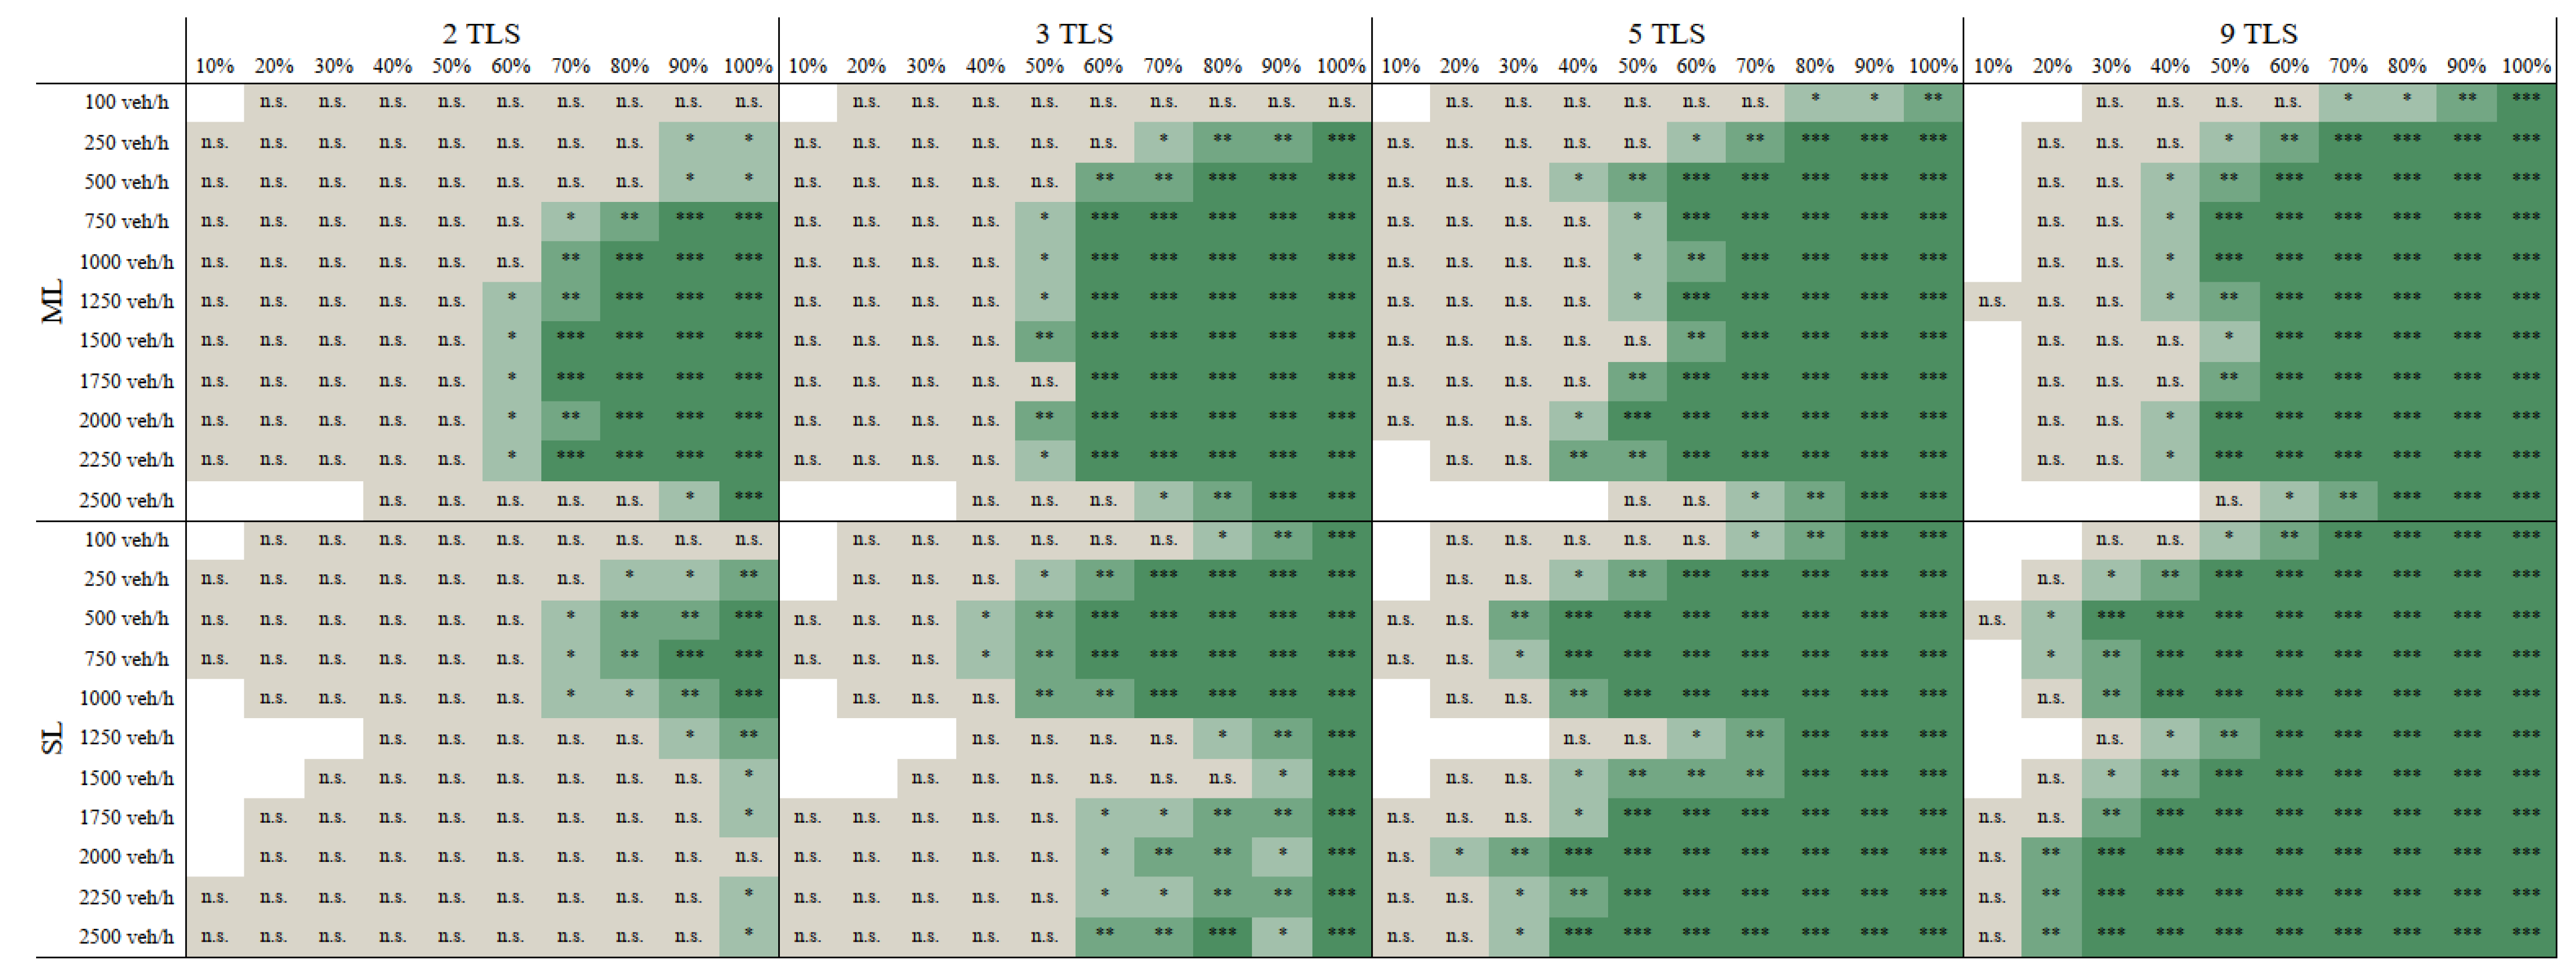
Using Tukey’s HSD test, we can identify statistically significant differences between pairwise comparisons of treatments, in this case the respective C-ITS services (baseline, CACC, GLOSA and SC). C-ITS services or bundles are compared to each other, resulting in six possible pairwise comparisons. This section discusses the Tukey’s HSD results for each C-ITS service or bundle with respect to their impact on per-vehicle TT.
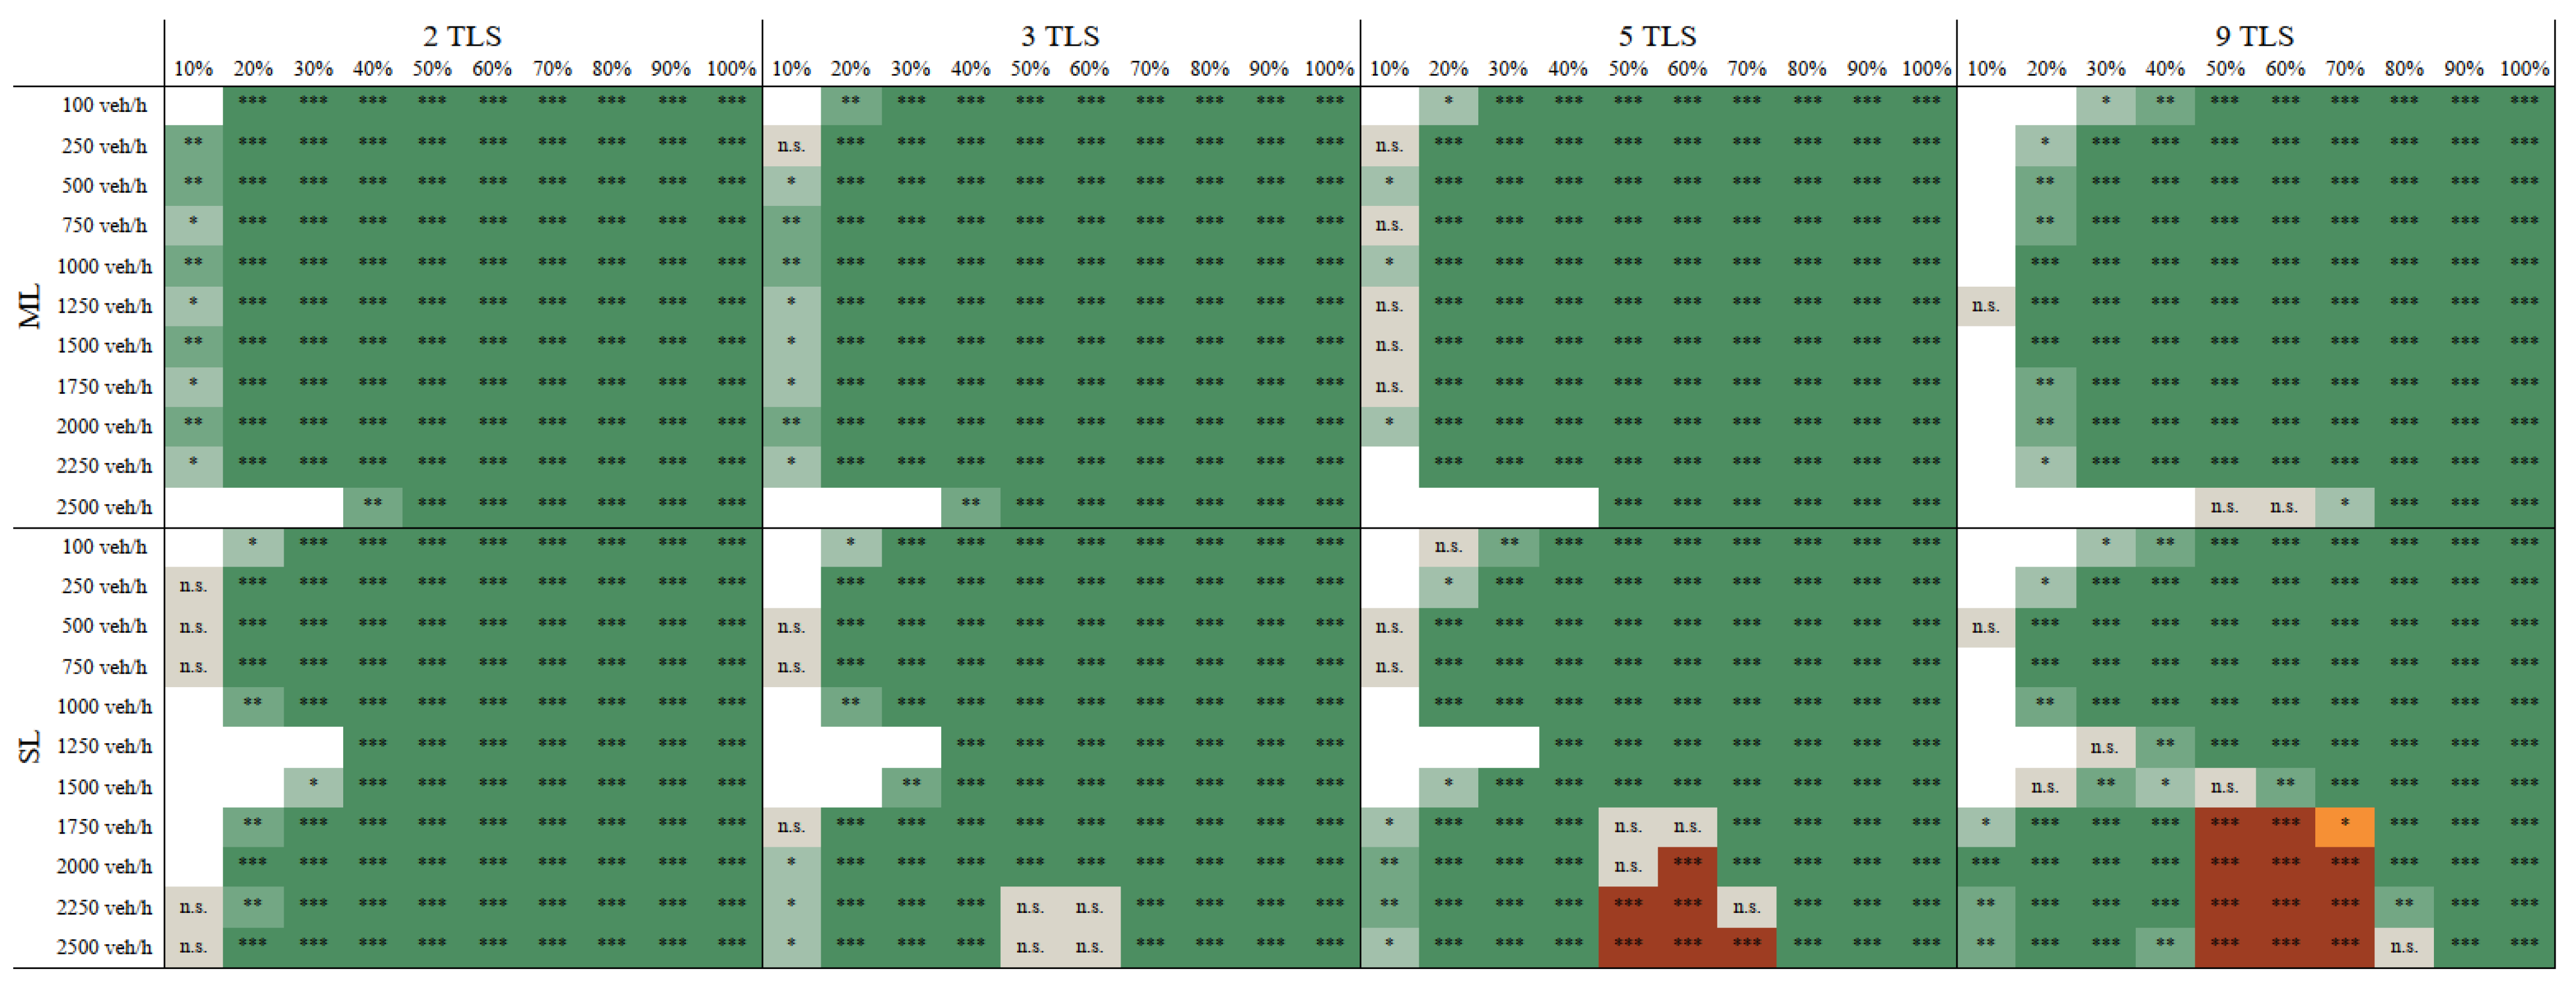
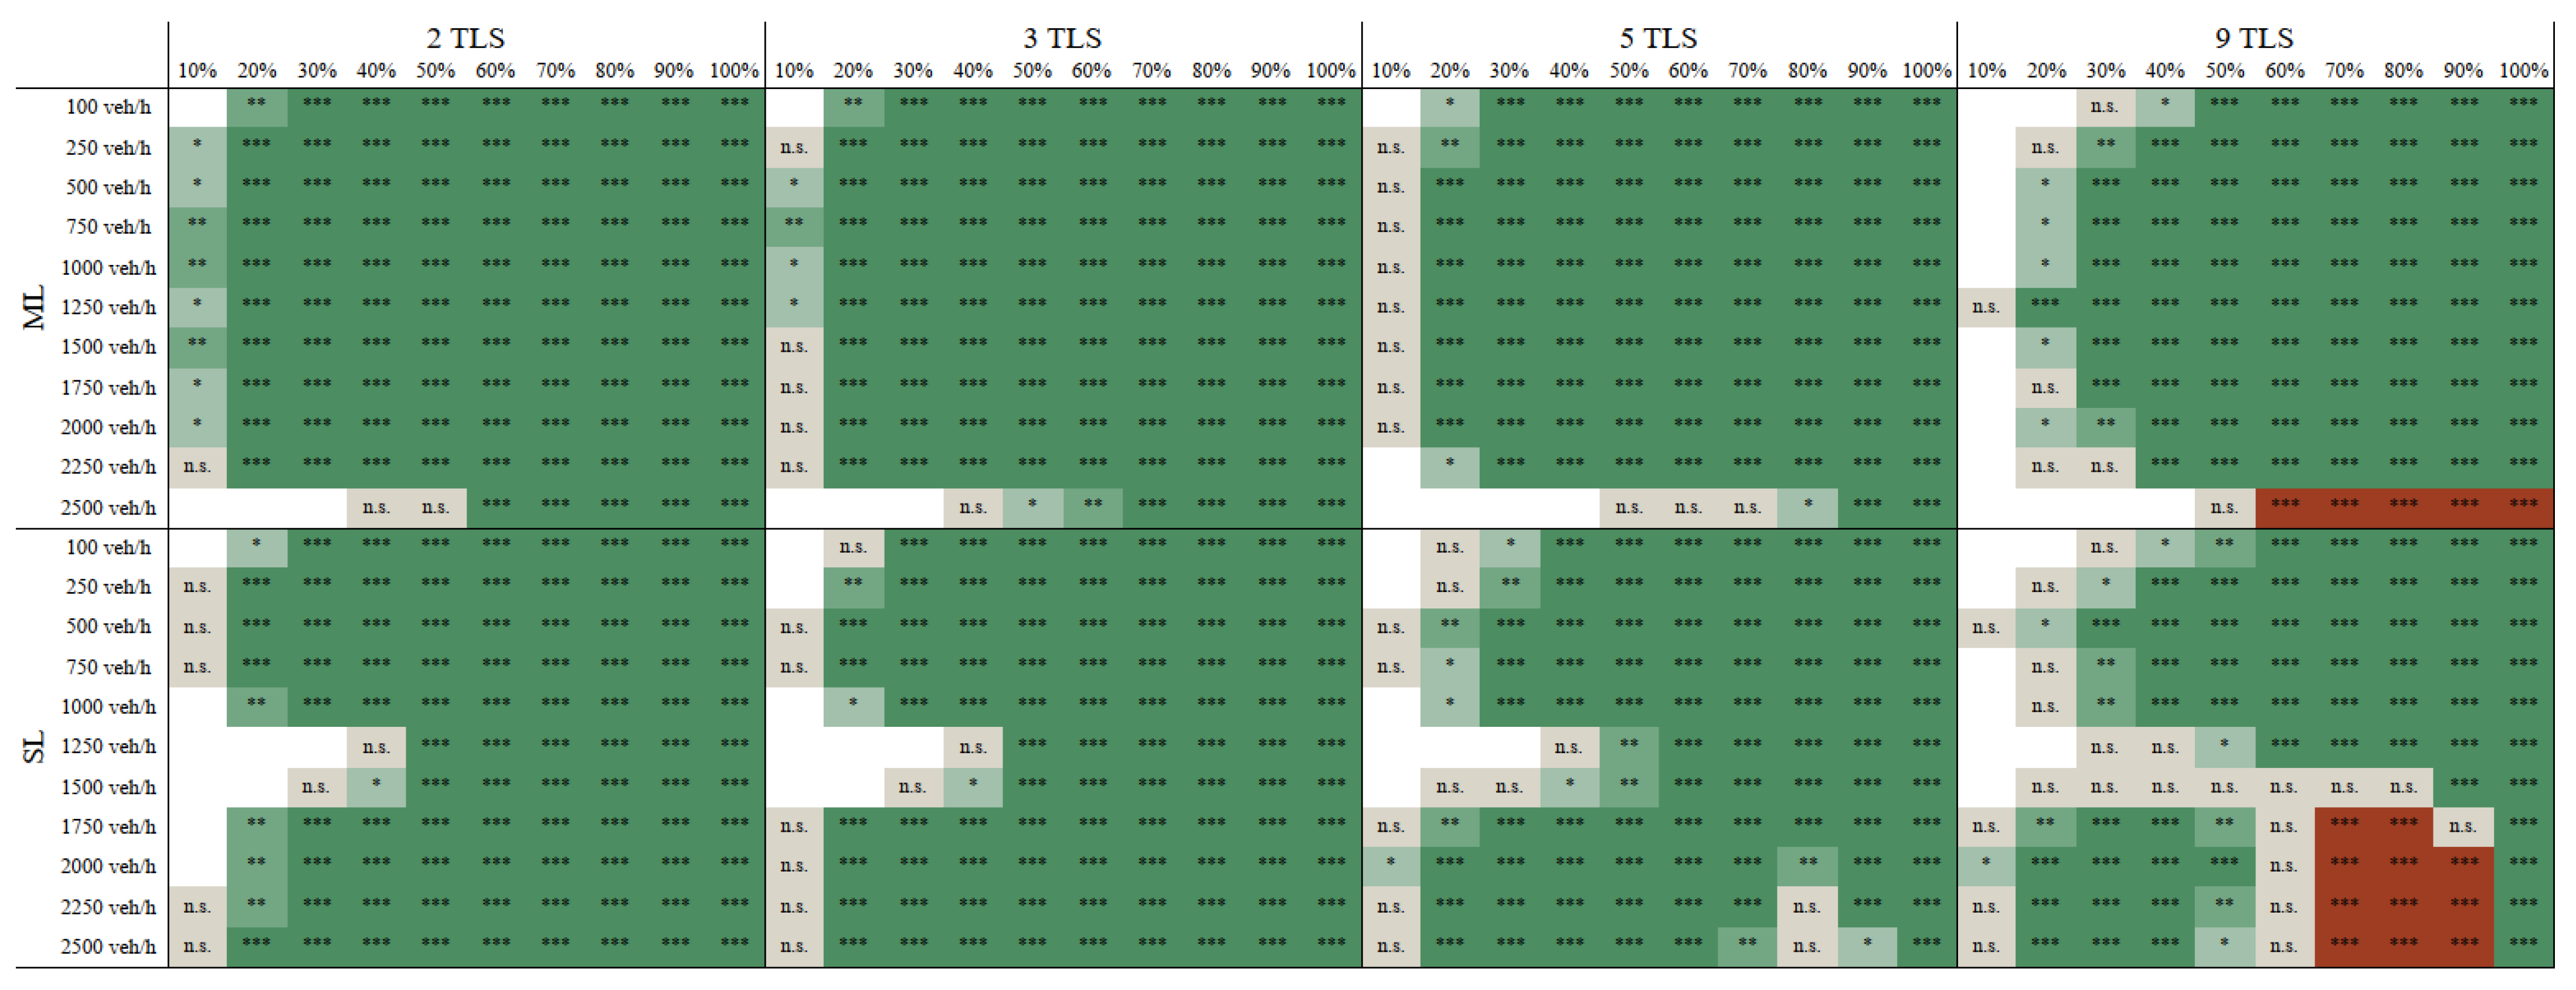
Figure 6 presents the post-hoc test results for the pairwise comparison between the baseline and CACC scenarios. Empty cells indicate cases in which no post-hoc test was performed, i.e., where the ANOVA results were not statistically significant (see
Table 7). The colour legend (green or red) indicates which service achieves better results in case of a significant difference. In
Figure 6, green represents CACC and red the baseline scenario.
The results in show that the majority of cases exhibit statistically significant differences between the baseline and CACC TTs. Most non-significant results occur at low ERs. A large share of significant differences favor CACC, indicating that CACC reduces TT compared to the baseline scenario. Only in scenarios with 5 TLS and 9 TLS do a few significant differences appear in favor of the baseline scenario. This pattern can be explained by considering the actual TT savings achieved with CACC.
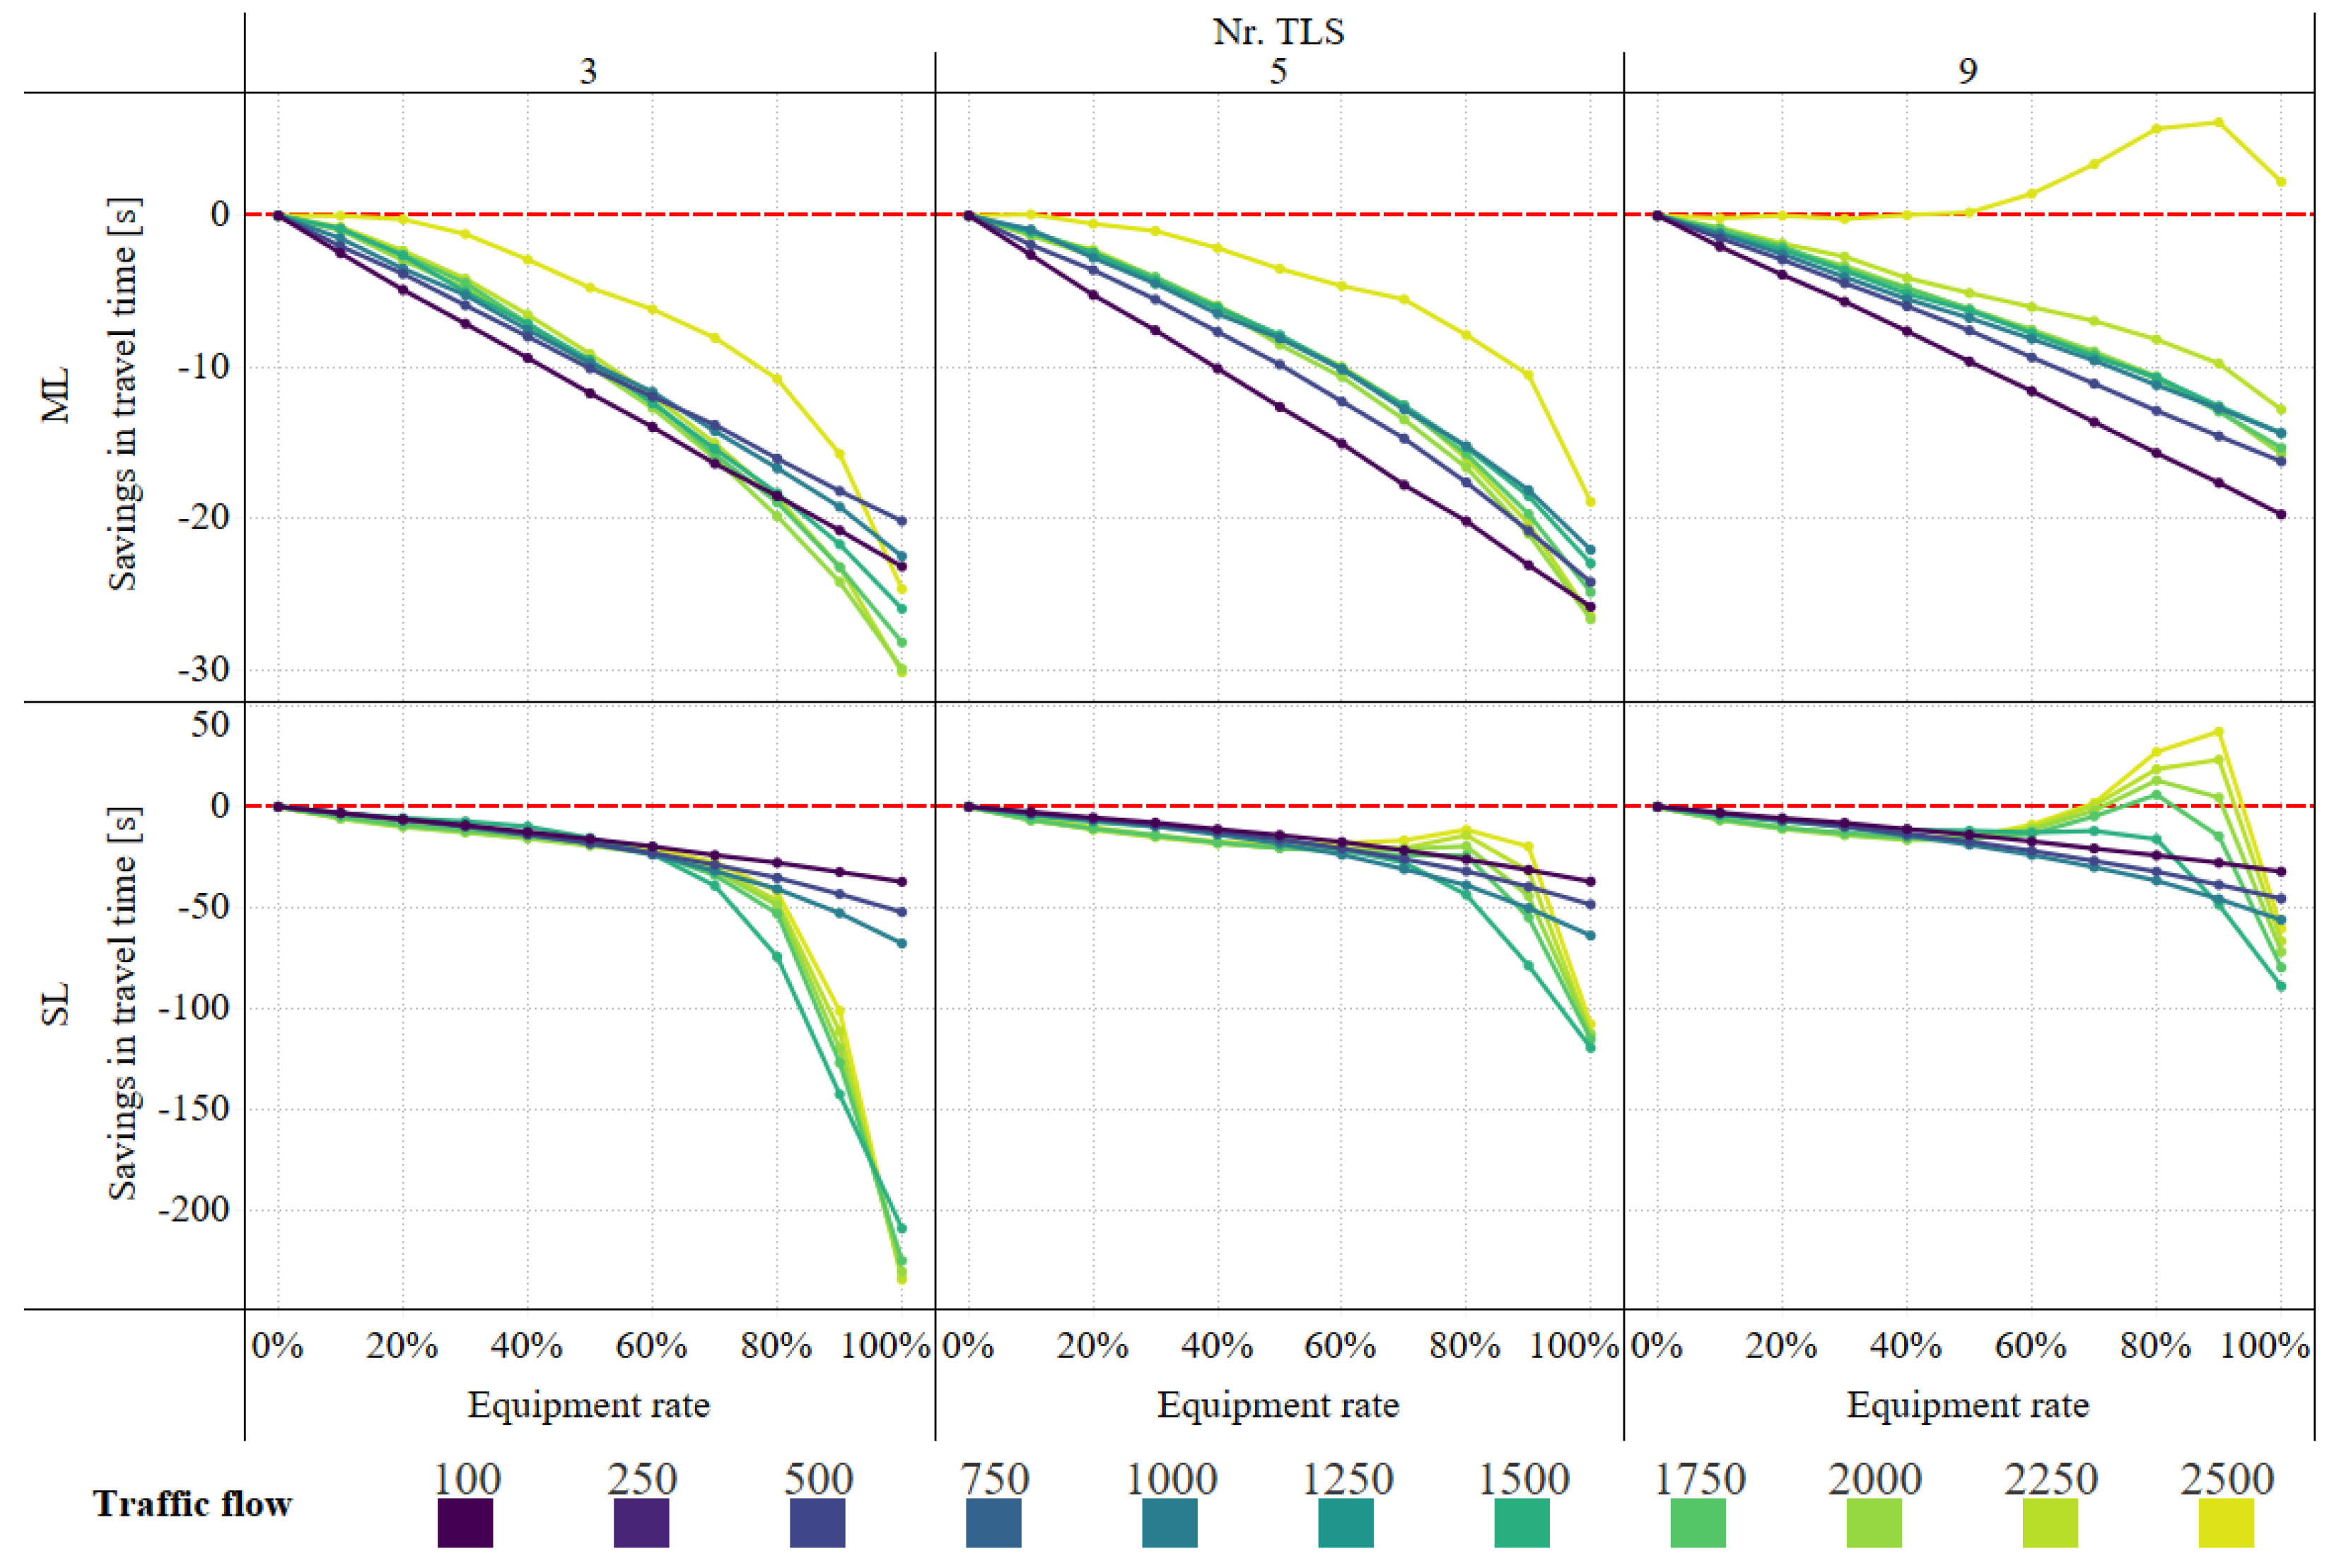
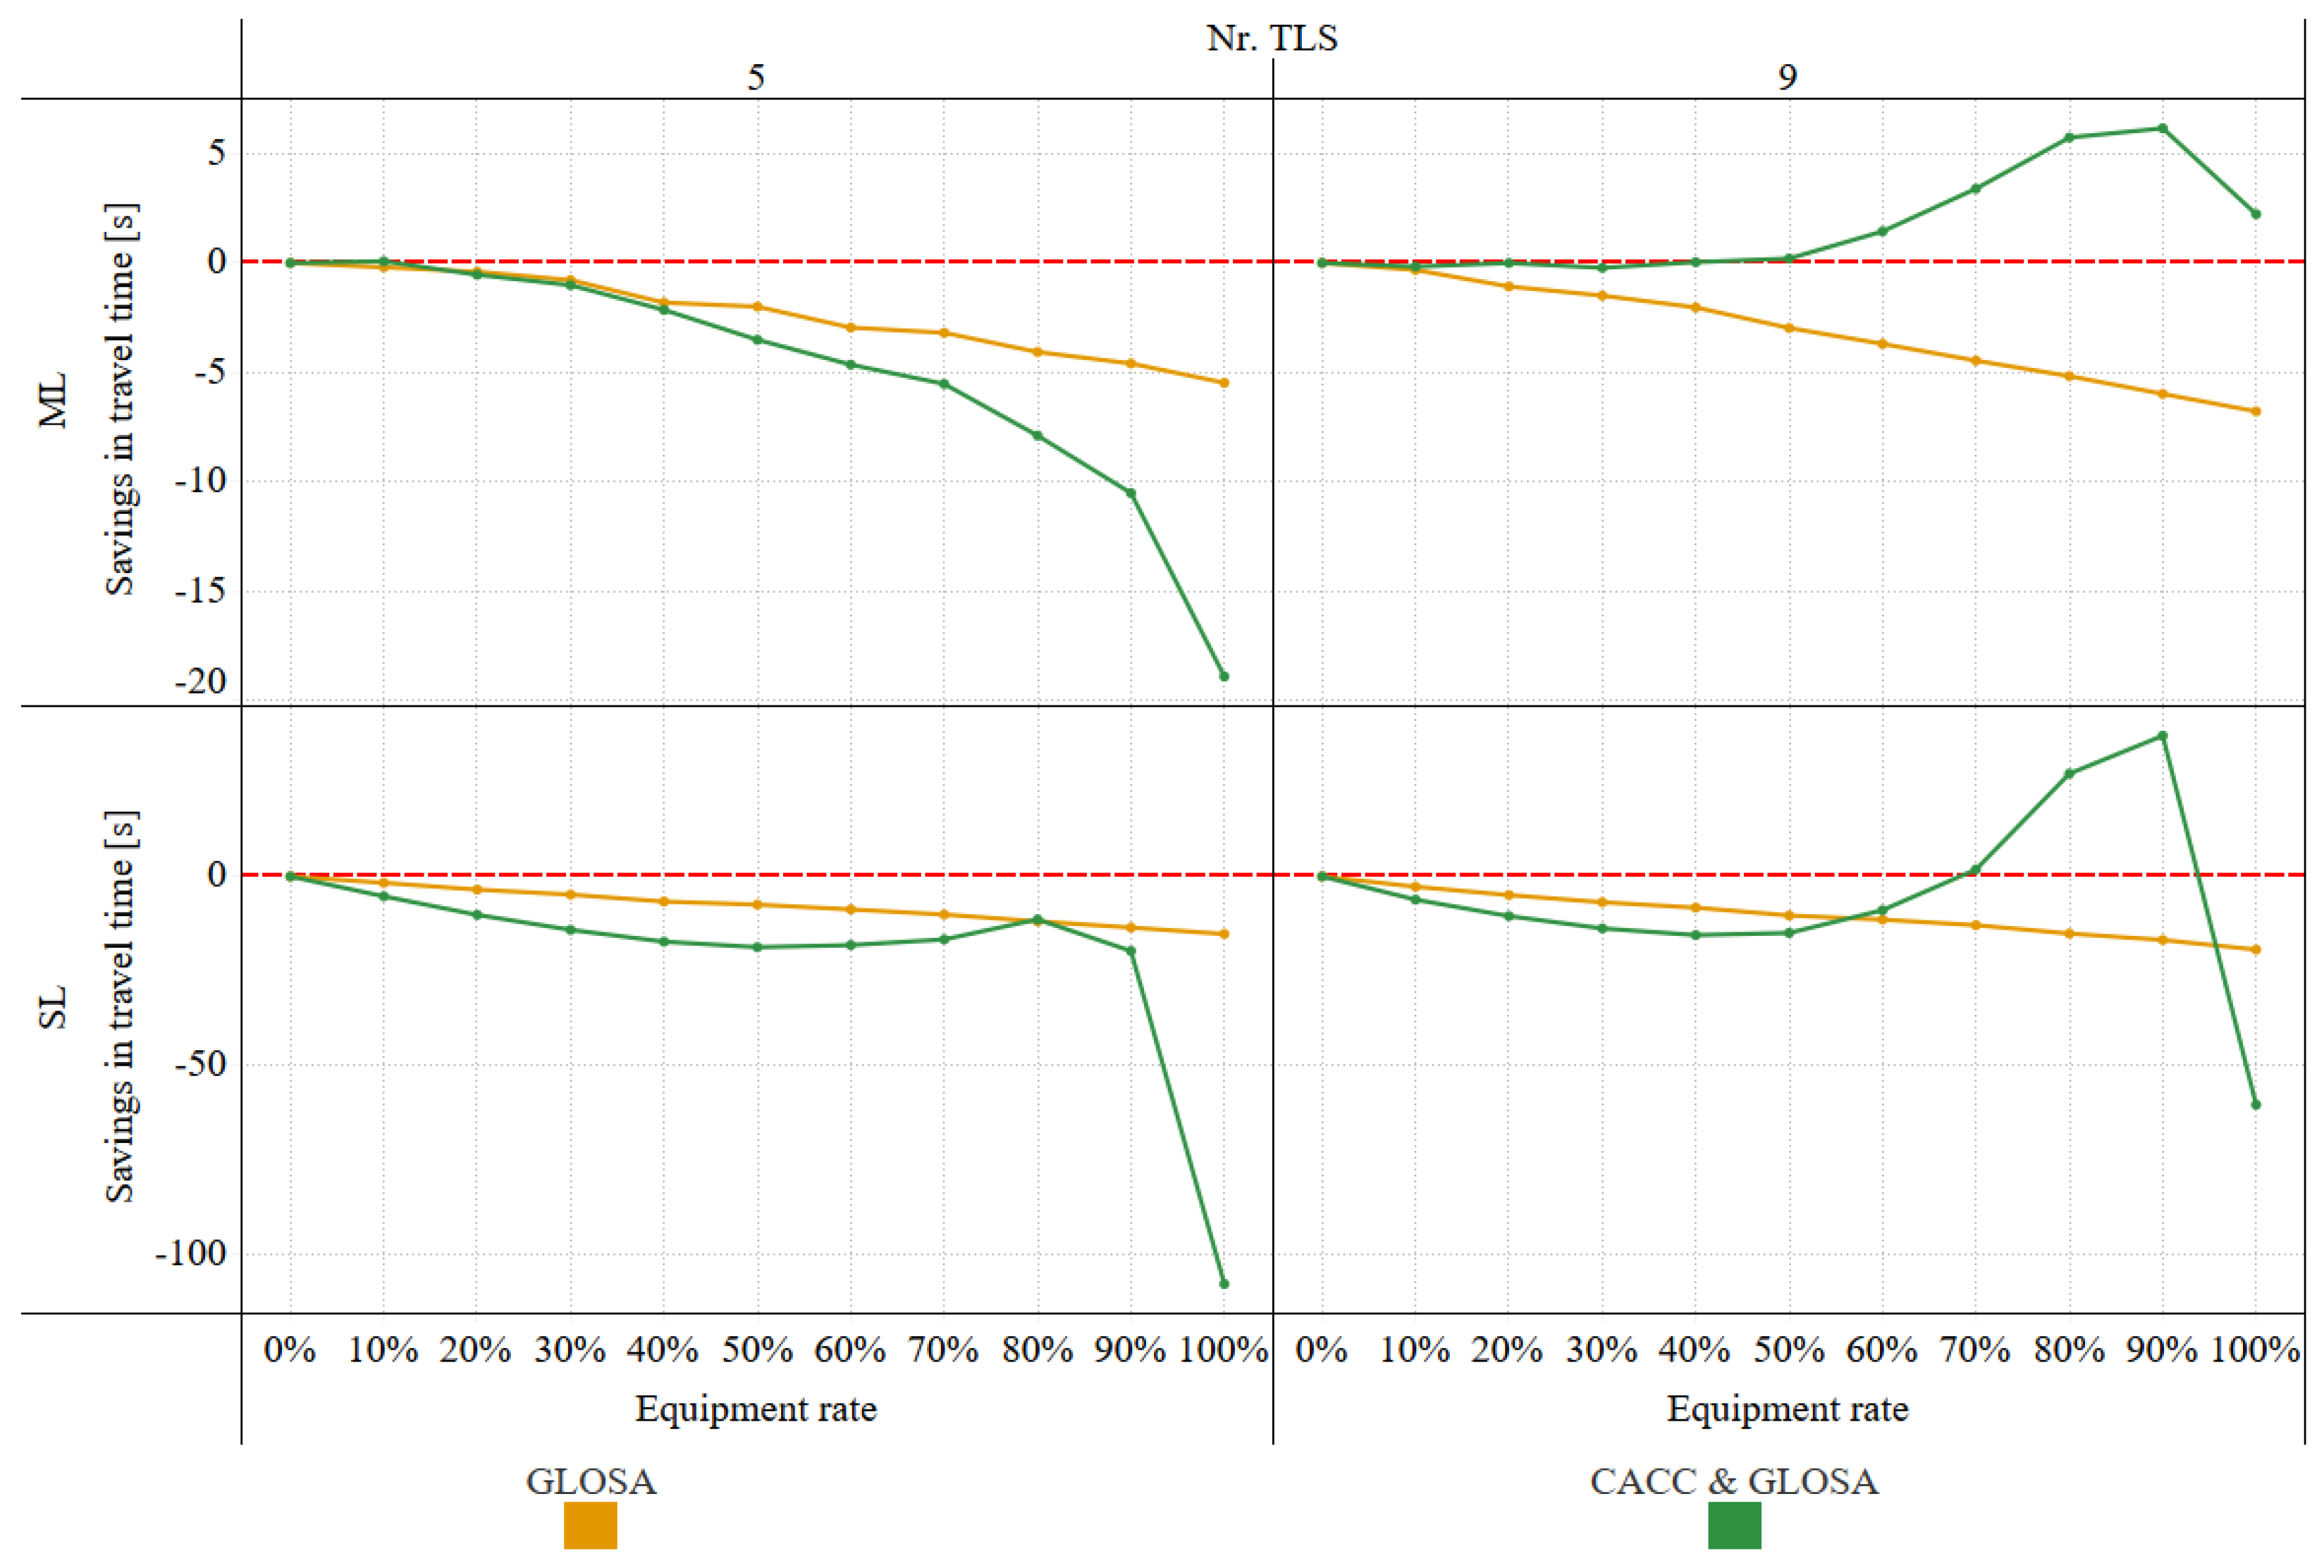
Figure 7 illustrates the TT reductions for selected scenarios and clarifies the significance behavior observed in
Figure 6.
For example, in ML scenarios with 9 TLS and a traffic flow of 2500 veh/h, TT savings remain low at low ERs and increase only once the ER exceeds 70%. Consequently, Tukey’s HSD results become significant only for ERs ≥ 70%. In SL scenarios, particularly under high traffic flows and medium ERs, CACC even leads to performance deterioration. In some cases, the TT exceeds that of the baseline scenario. This effect is also visible in
Figure 6, where variable combinations with high traffic flow and ERs between 50% and 70% either remain non-significant or show significant differences in favor of the baseline scenario.
The effect observed may result from the interaction of the CACC model with high traffic densities and numerous signalized intersections. A detailed stability analysis of CACC platoons in dense, signalized environments, however, lies beyond the scope of this study. Overall, these findings indicate that CACC can even cause TT increases, particularly under conditions of high traffic flow and a balanced share of equipped and non-equipped vehicles.
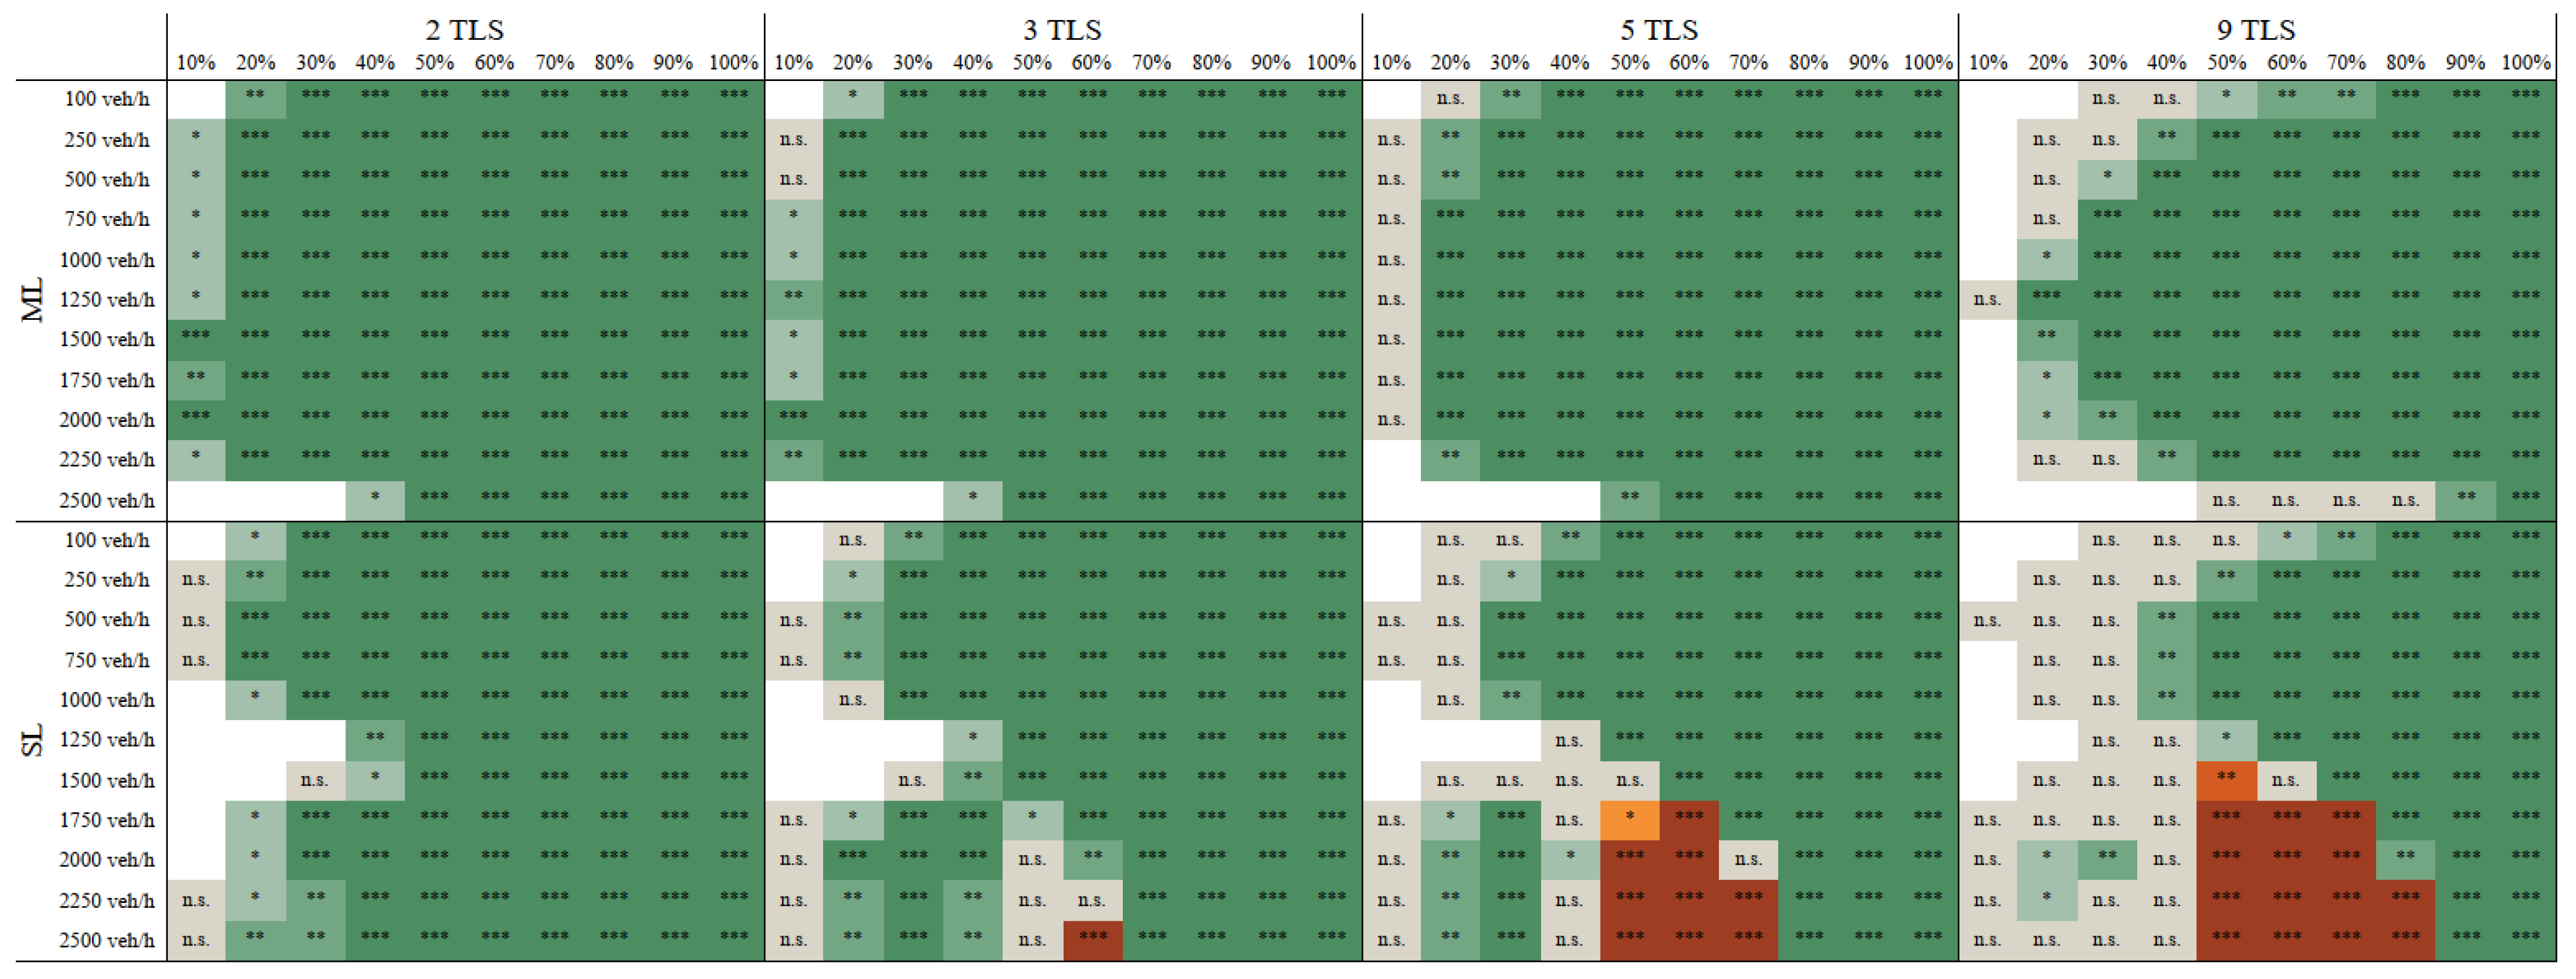
The comparison between the baseline and GLOSA scenarios reveals a somewhat different pattern (see
Figure 8). On the one hand, all differences in TTs favor GLOSA. On the other hand, the results also show that, particularly with a low number of TLS and low ERs, differences in average TT are much more frequently not statistically significant. As a result, in contrast to CACC, GLOSA does not lead to deterioration but its benefits remain limited to predominantly high ER and high number of TLS settings.
In contrast, the comparison between the baseline and the SC scenario resembles the results obtained for the baseline and CACC comparison. Most pairwise comparisons indicate statistically significant differences in favour of the SC, although a few cases still favour the baseline scenario. Non-significant outcomes predominantly occur at low ERs or around thresholds where significance shifts between the SC and baseline scenario. The corresponding post-hoc test results are presented in
Figure 9.
The detailed simulation results again show that the SC leads to increasing TTs, particularly under high traffic volumes (see
Figure 10). However, compared to CACC alone, this increase is less pronounced and becomes apparent at higher ERs. In SL scenarios, only configurations with 9 TLS show an increase in TT compared to the baseline level when using the SC under high traffic flow. In SL scenarios with 5 TLS, TT increases occur, but TTs remain below those of the baseline scenario. Moreover, in ML scenarios with 9 TLS and high traffic flow, TTs deteriorate significantly between 70% and 90% ER.
The previous pairwise comparisons focused exclusively on TT differences between the baseline scenario and the respective C-ITS services. Beyond this, we analyzed the extent to which the impacts of the individual C-ITS services differ from each other. Accordingly,
Figure 11 shows the results of the post-hoc test comparing CACC and GLOSA.
In most cases, CACC achieves significantly greater TT savings than GLOSA. Only under very high traffic volumes and ERs between 50% and 70%, where CACC TTs increase (see
Figure 7), does GLOSA yield better results. Non-significant differences in TTs between CACC and GLOSA tend to occur at low ERs or near the transition point where significance shifts in favor of GLOSA.
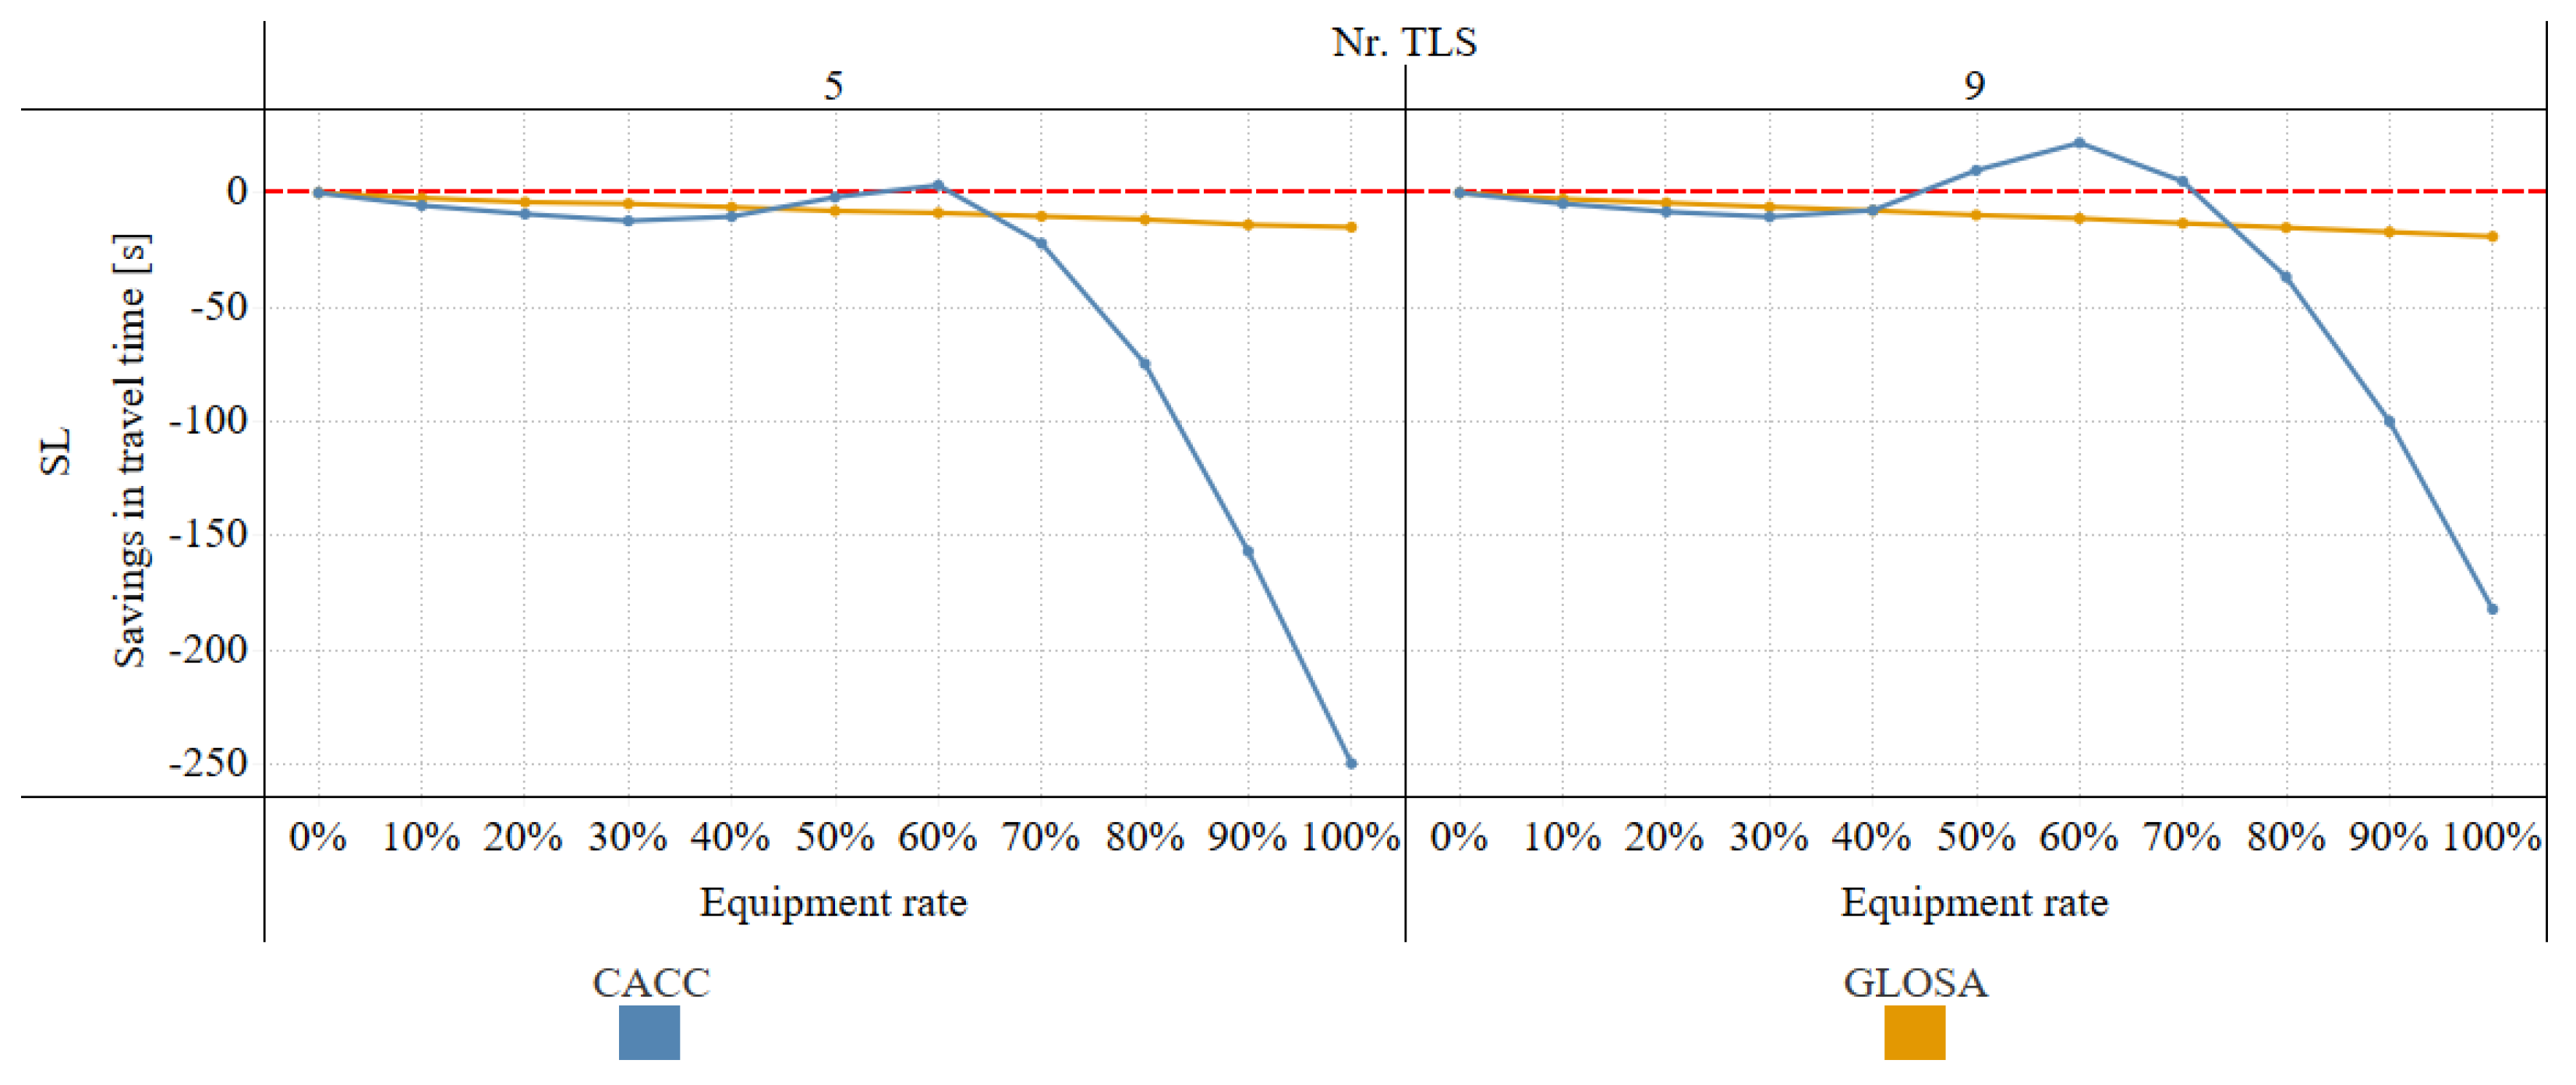
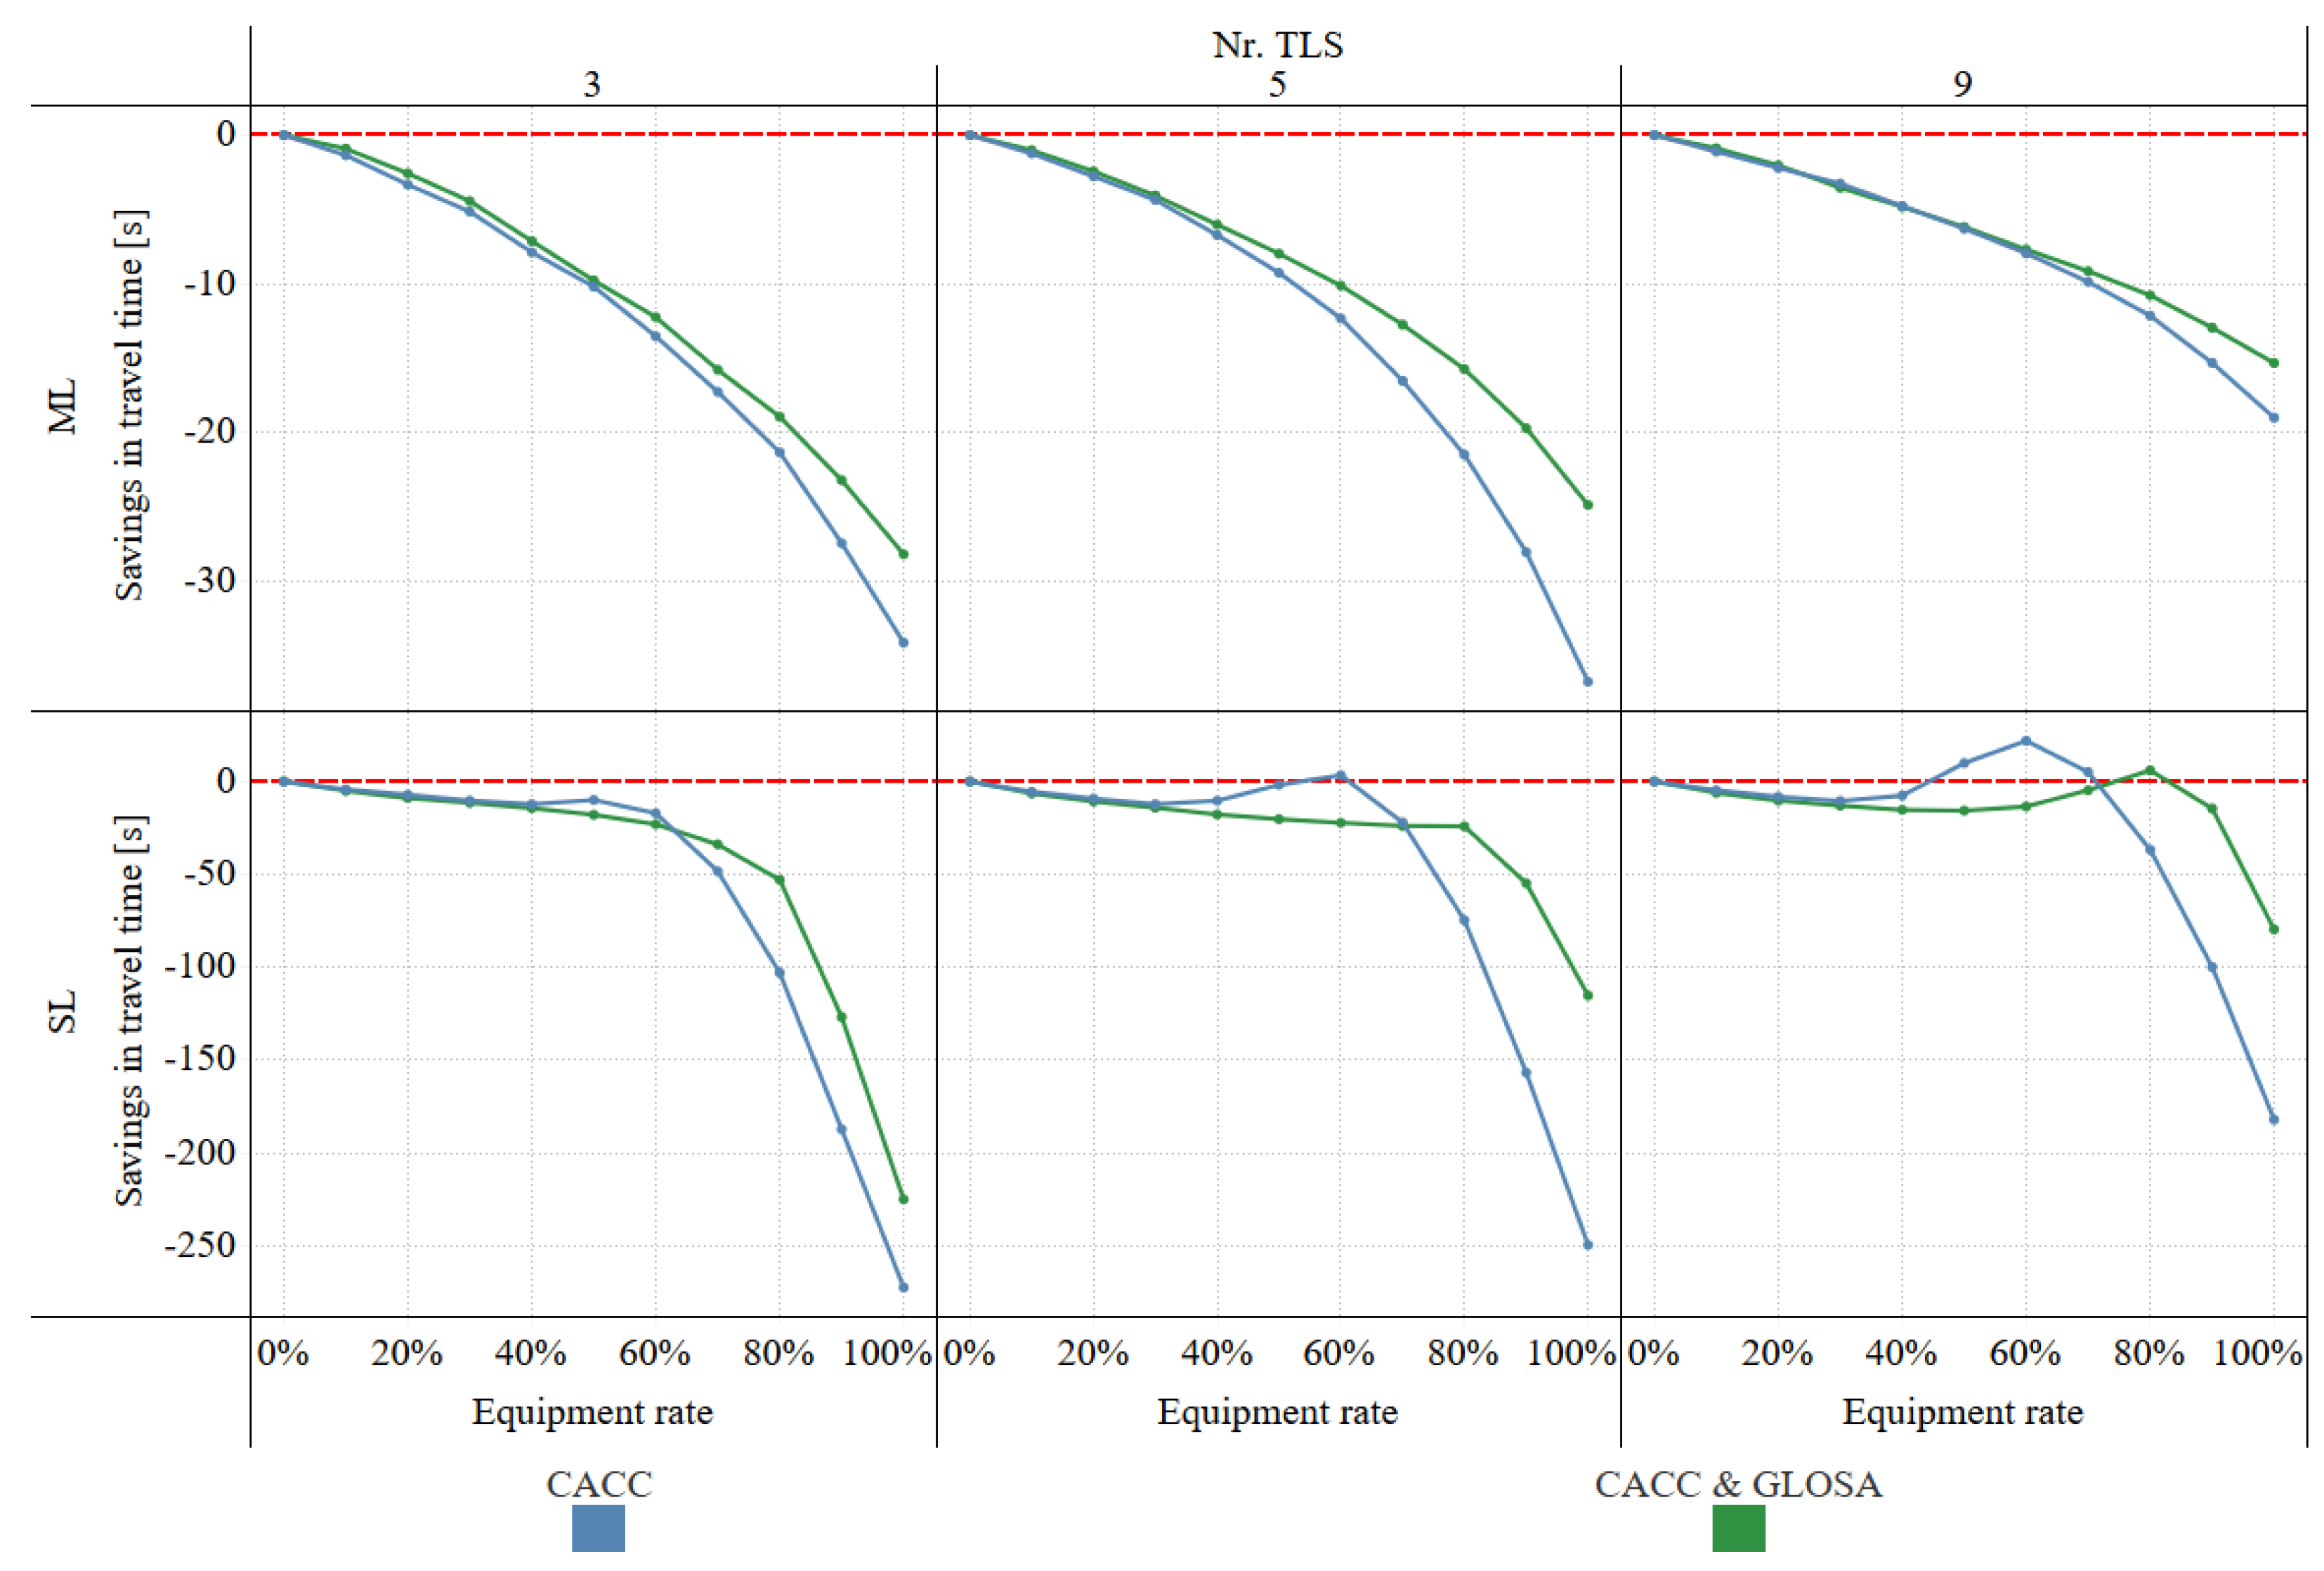
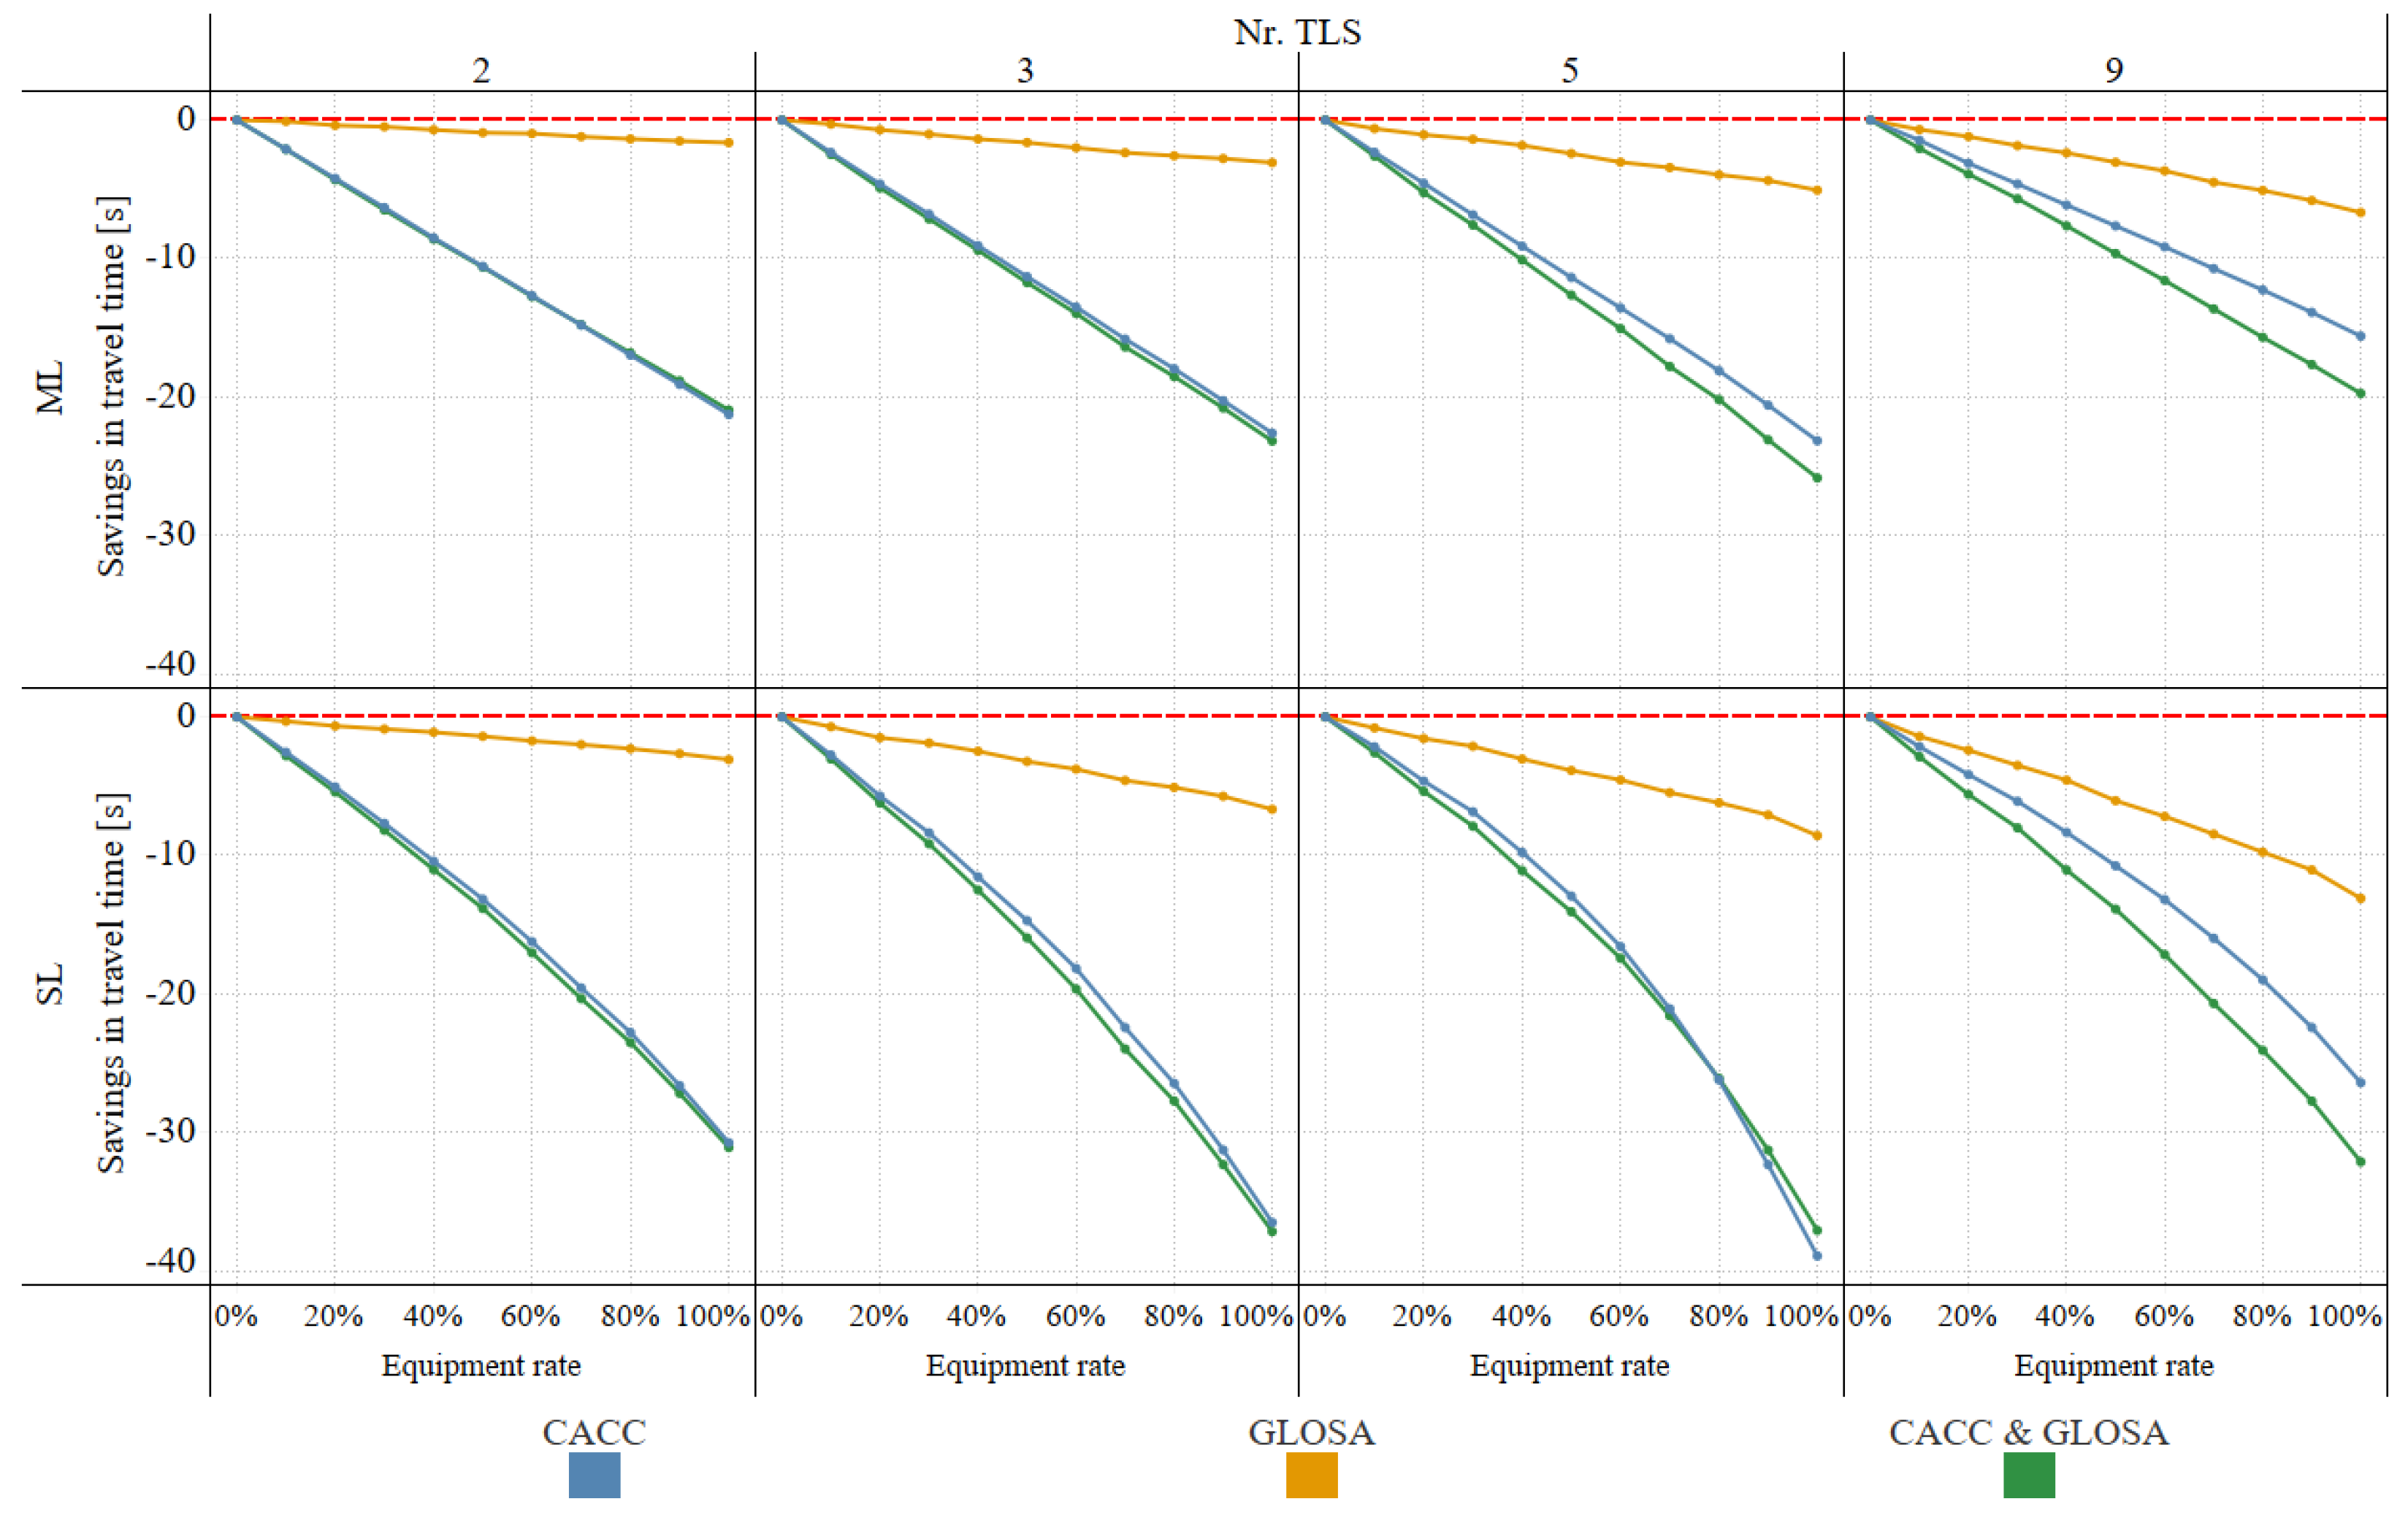
Figure 12 provides an excerpt of the direct comparison between GLOSA and CACC at a traffic flow of 1750 veh/h, illustrating the findings from
Figure 11 in more detail. At low ERs, the TT savings relative to the baseline scenario are very similar for GLOSA and CACC, with significant differences in favor of CACC only with 5 TLS at 20% and 30% ER.
Larger differences in TT impacts emerge at ERs above 50%. CACC TTs increase above those of GLOSA, with significant differences in favor of GLOSA at 5 TLS (50% and 60% ER) and at 9 TLS (50% to 70% ER). At ERs above 70%, the positive effect of CACC increases substantially, and TTs drop significantly below the GLOSA level. In summary, GLOSA achieves better TTs than CACC only under conditions in which CACC performance deteriorates markedly.
The post-hoc test results for the pairwise comparison between the SC and GLOSA show a pattern similar to the comparison between CACC and GLOSA (see
Figure 13). Overall, the SC outperforms GLOSA in most cases with respect to average vehicle TT. Exceptions occur at low ERs, where differences are often not statistically significant, and in conditions where SC TTs exceed the baseline scenario (see
Figure 10).
Figure 14 illustrates this effect in more detail. In the SL configuration with 5 TLS, a slight increase in the SC TT can be observed, eliminating significant difference at 80% ER compared to GLOSA. This increase becomes more substantial with 9 TLS, resulting in a shift of significance in favor of GLOSA between 70% and 90% ER. In the ML configuration with 5 TLS, both GLOSA and the SC continuously reduce TT as ER increases, although a significant difference emerges only from 80% ER onward.
In contrast, in ML scenarios with 9 TLS, the SC consistently performs worse than GLOSA, and from 60% ER onward, the TTs are even significantly higher than both GLOSA and the baseline scenario. Nevertheless, the SC generally outperforms GLOSA and yields worse results only in scenarios where the SC itself performs very poorly.
While the comparison of GLOSA with either CACC or the SC clearly tends to disadvantage GLOSA, the comparison between CACC and the SC is less straightforward.
Figure 15 presents the results of Tukey’s HSD post-hoc test comparing CACC and the SC.
In many cases, particularly at low ERs or under low traffic volumes, no significant differences emerge between CACC and the SC. At the same time, the previously identified TT increases in CACC and the SC under SL configurations with high traffic volumes (see
Figure 7 and
Figure 10) can be identified. Occasionally, significant TT differences in favor of the SC appear at low traffic flows with 3 TLS (ML) or 9 TLS (SL and ML).
The strongest differences in favor of the SC, however, occur under high traffic flows and medium ERs (between 40-70%, depending on the number of TLS). This effect results from the TT increase observed in CACC, while the SC shows this increase only at higher ERs. Accordingly, the results shift back in favor of CACC at high ERs. In ML configurations, where CACC and the SC exhibit limited TT increases, CACC achieves better results in the majority of cases.
Figure 16 illustrates these findings in detail, showing the TT savings for CACC and the SC compared to the baseline scenario at a traffic flow of 1750 veh/h.
In summary, the Tukey’s HSD results show that CACC generally achieves stronger TT reductions than both the baseline scenario and GLOSA. GLOSA only outperforms CACC under specific conditions of high traffic flow and medium ERs, where CACC performance deteriorates. The SC typically outperforms GLOSA but it exceeds CACC only in cases where CACC itself performs particularly poorly.
Overall, these results provide a basis for deriving targeted recommendations for C-ITS service (bundle) usage under different conditions (see
Section 4.4).
4.1.2. Tukey’s HSD Result-CO2
As with travel time, the average CO2 emissions were analyzed using Tukey’s HSD for cases where ANOVA indicated significance. This section presents the results for each C-ITS service and service combination regarding their impact on per-vehicle CO2 emissions.
Similar to the ANOVA results, the Tukey’s HSD post-hoc tests reveal that statistically significant differences among the C-ITS services occur much more frequently for CO2 emissions than for TT. For example:
CACC vs. baseline: Only 3 scenarios show no significant difference in CO2 emissions; CACC outperforms the baseline scenario in all significant cases.
SC vs. baseline: All scenarios show significant difference in CO2 emissions; the SC outperforms the baseline scenario in all cases.
CACC vs. GLOSA: 16 scenarios show no significant difference in CO2 emissions; CACC outperforms GLOSA in all significant cases.
SC vs. GLOSA: 5 scenarios show no significant difference in CO2 emissions; the SC outperforms GLOSA in all significant cases.
The detailed results of these comparisons are therefore not discussed further. An overview of the non-significant cases is provided in
Table 8.
In contrast to the pairwise comparisons summarized in
Table 8, the comparison between the baseline and GLOSA scenarios exhibits greater variation in statistical significance.
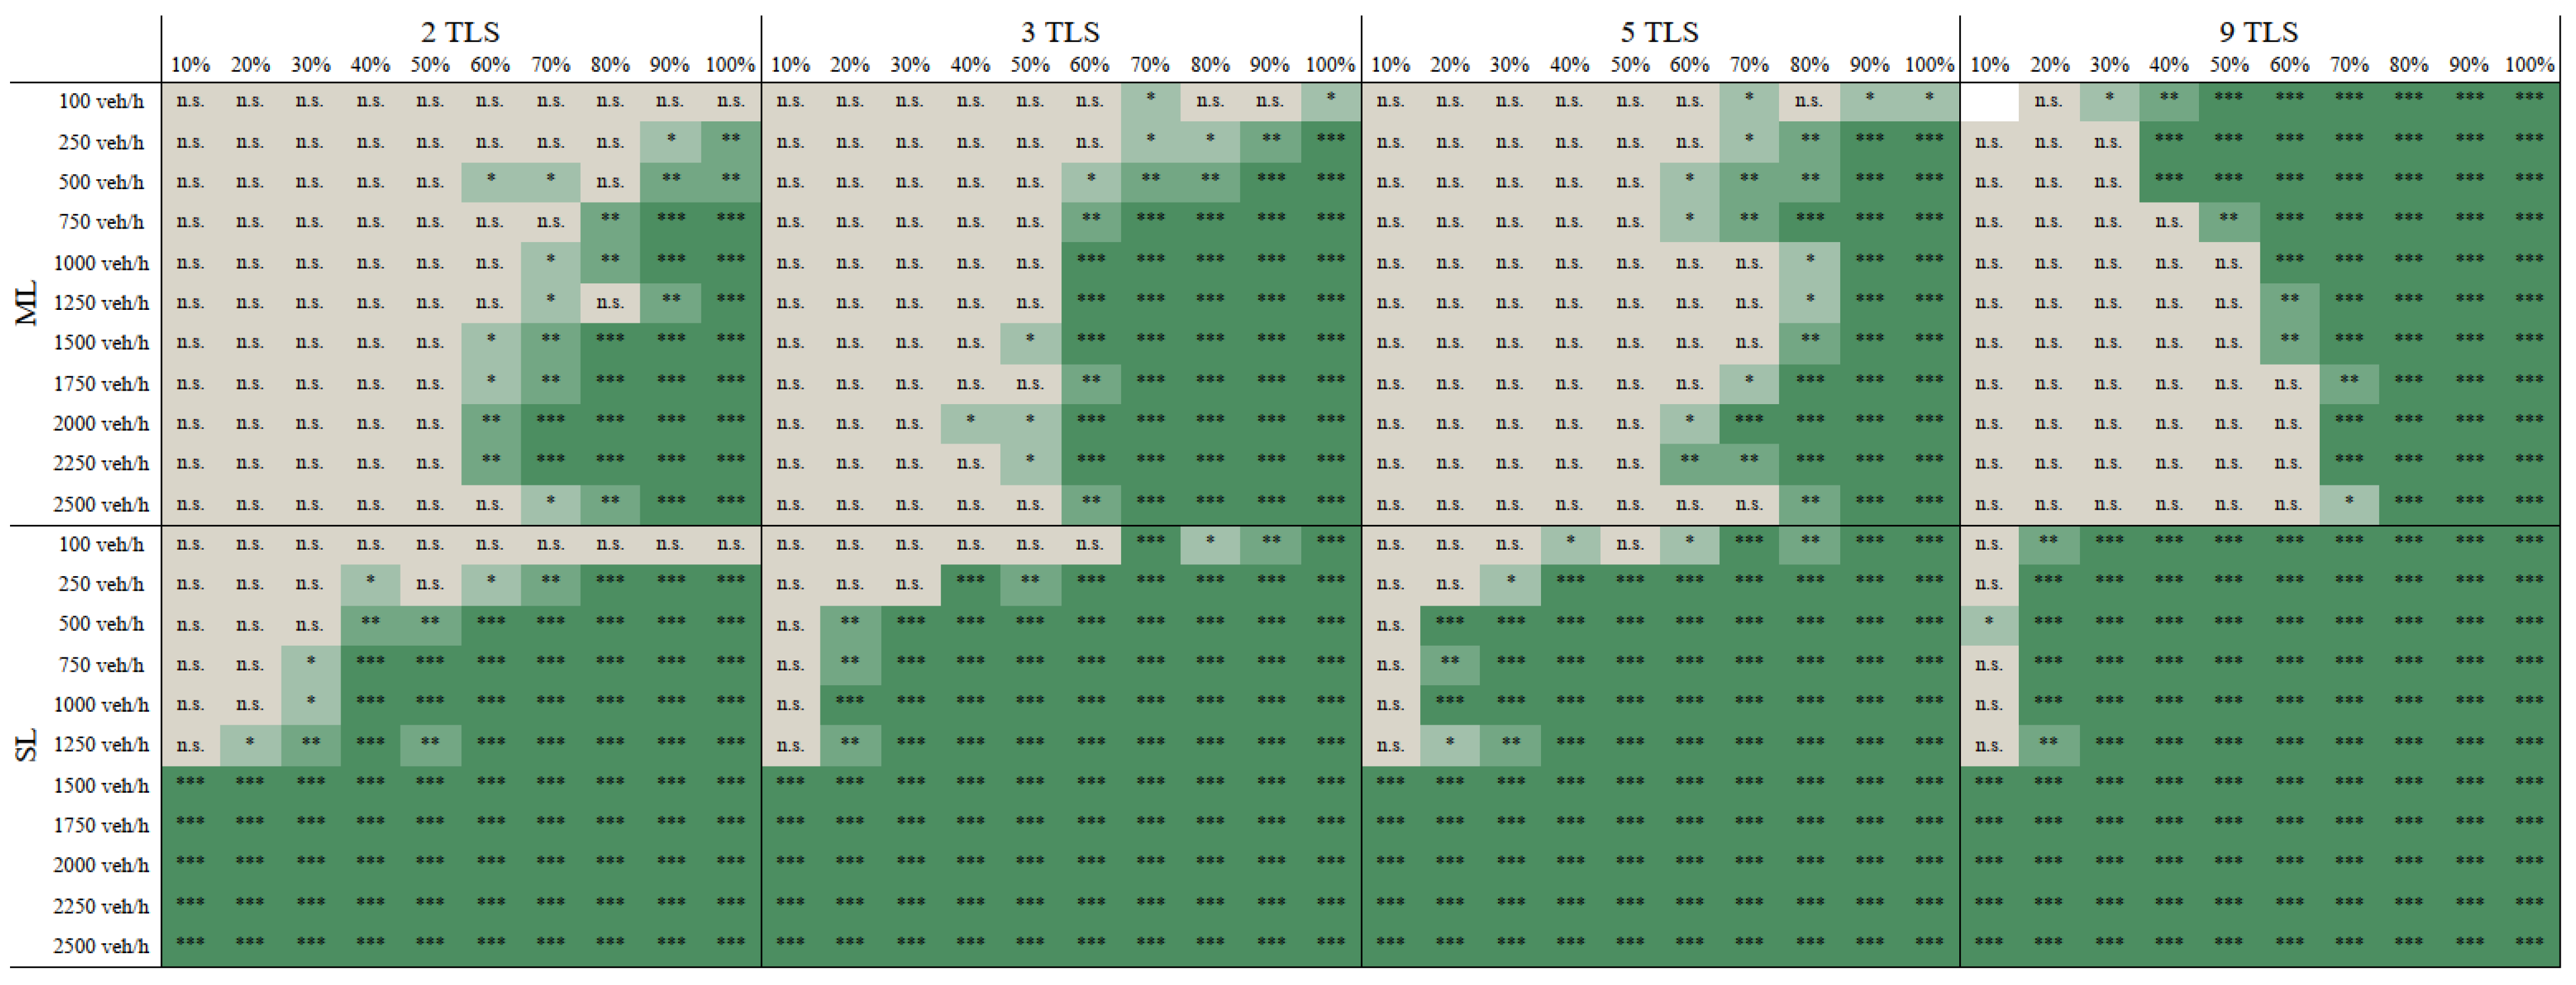
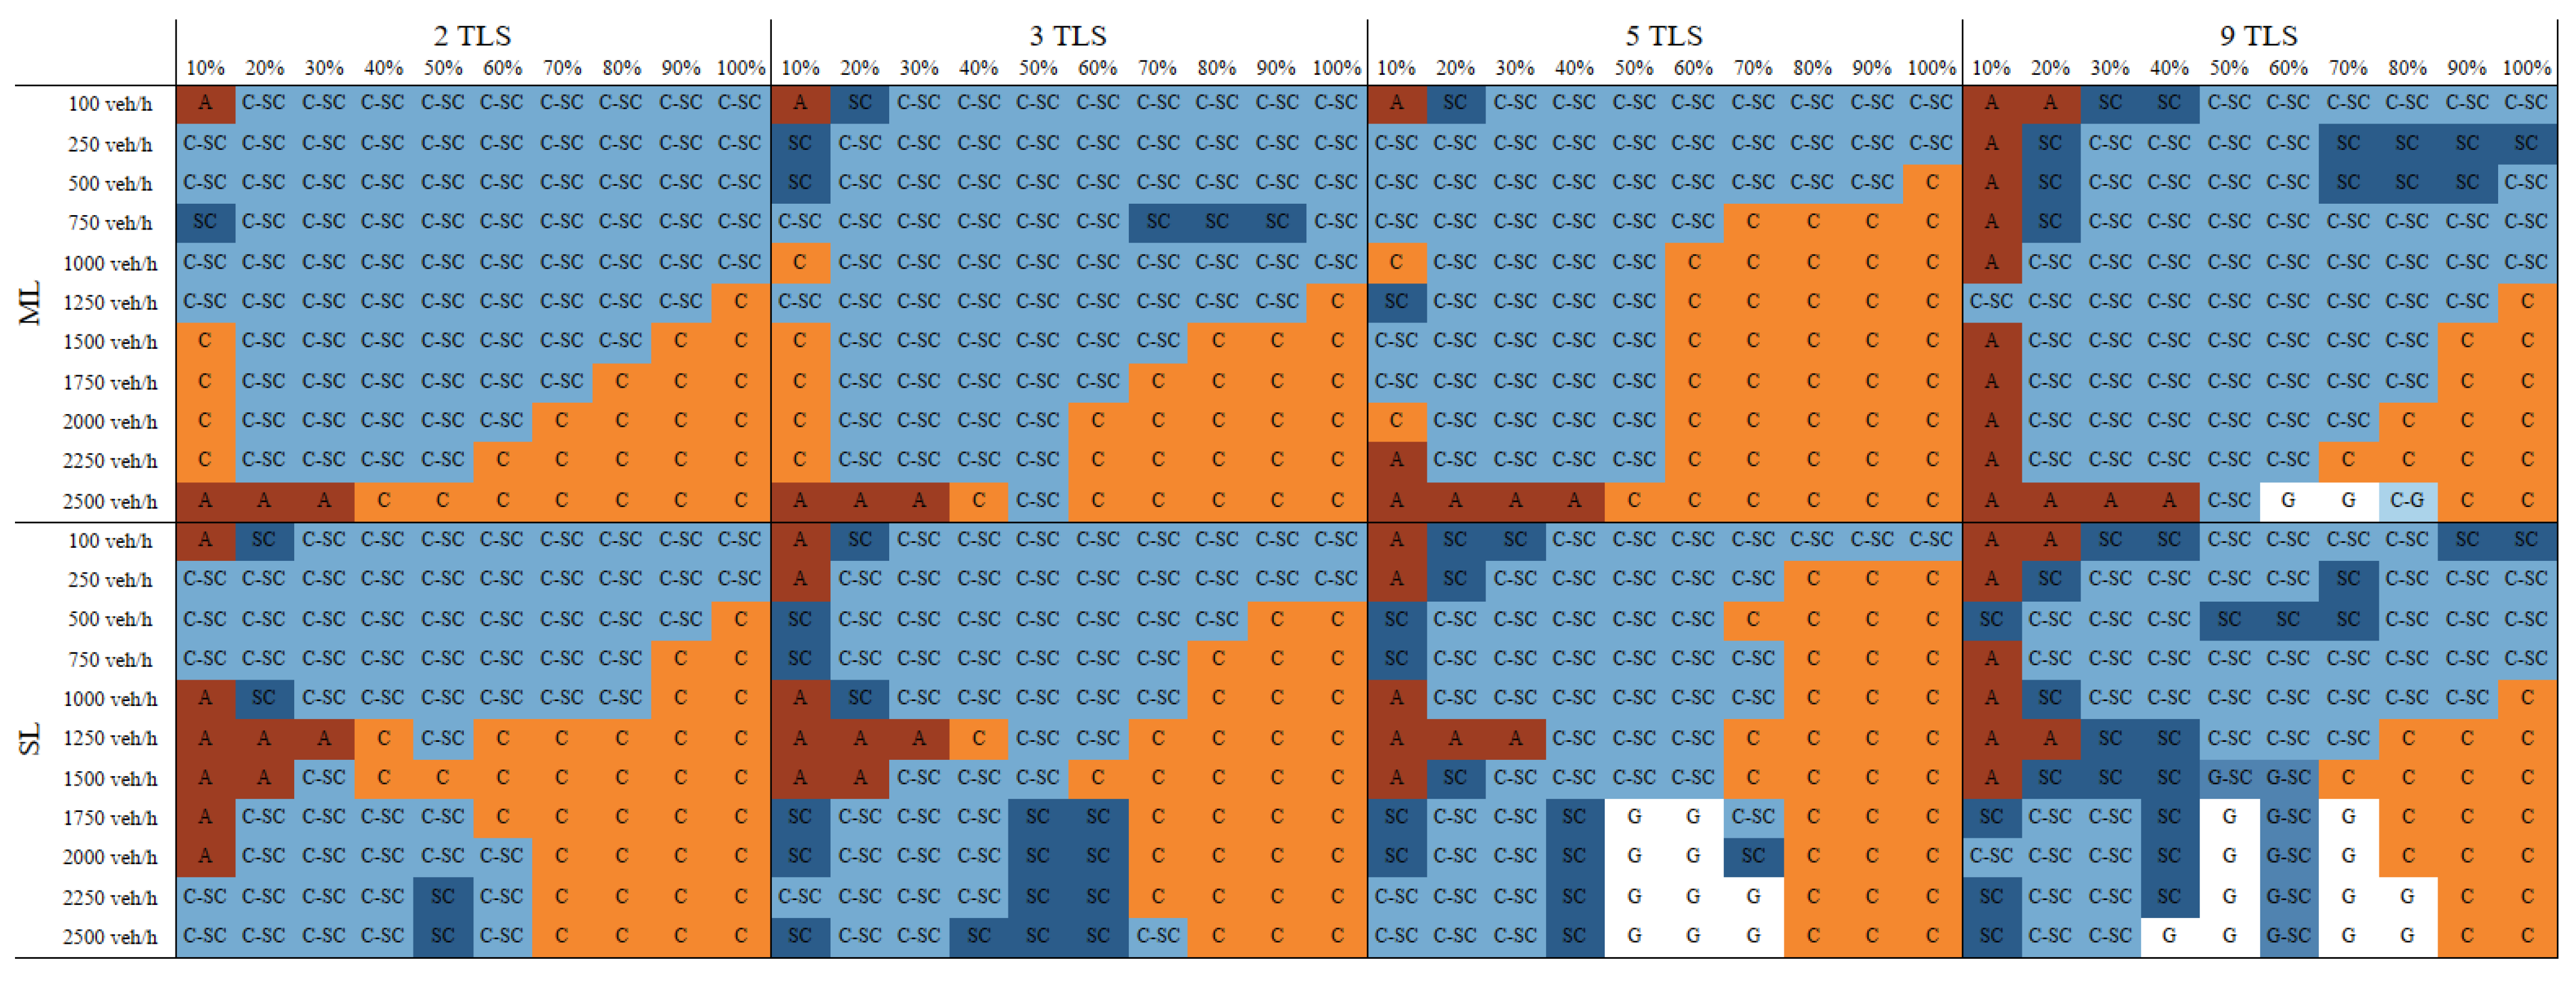
Figure 17 shows that GLOSA reduces average CO
2 emissions in most cases, although several results remain non-significant. These outcomes occur mainly at low ERs and under low traffic demand, particularly in ML configurations. At higher traffic flows and increasing ERs, however, the reductions become highly significant across all TLS configurations.
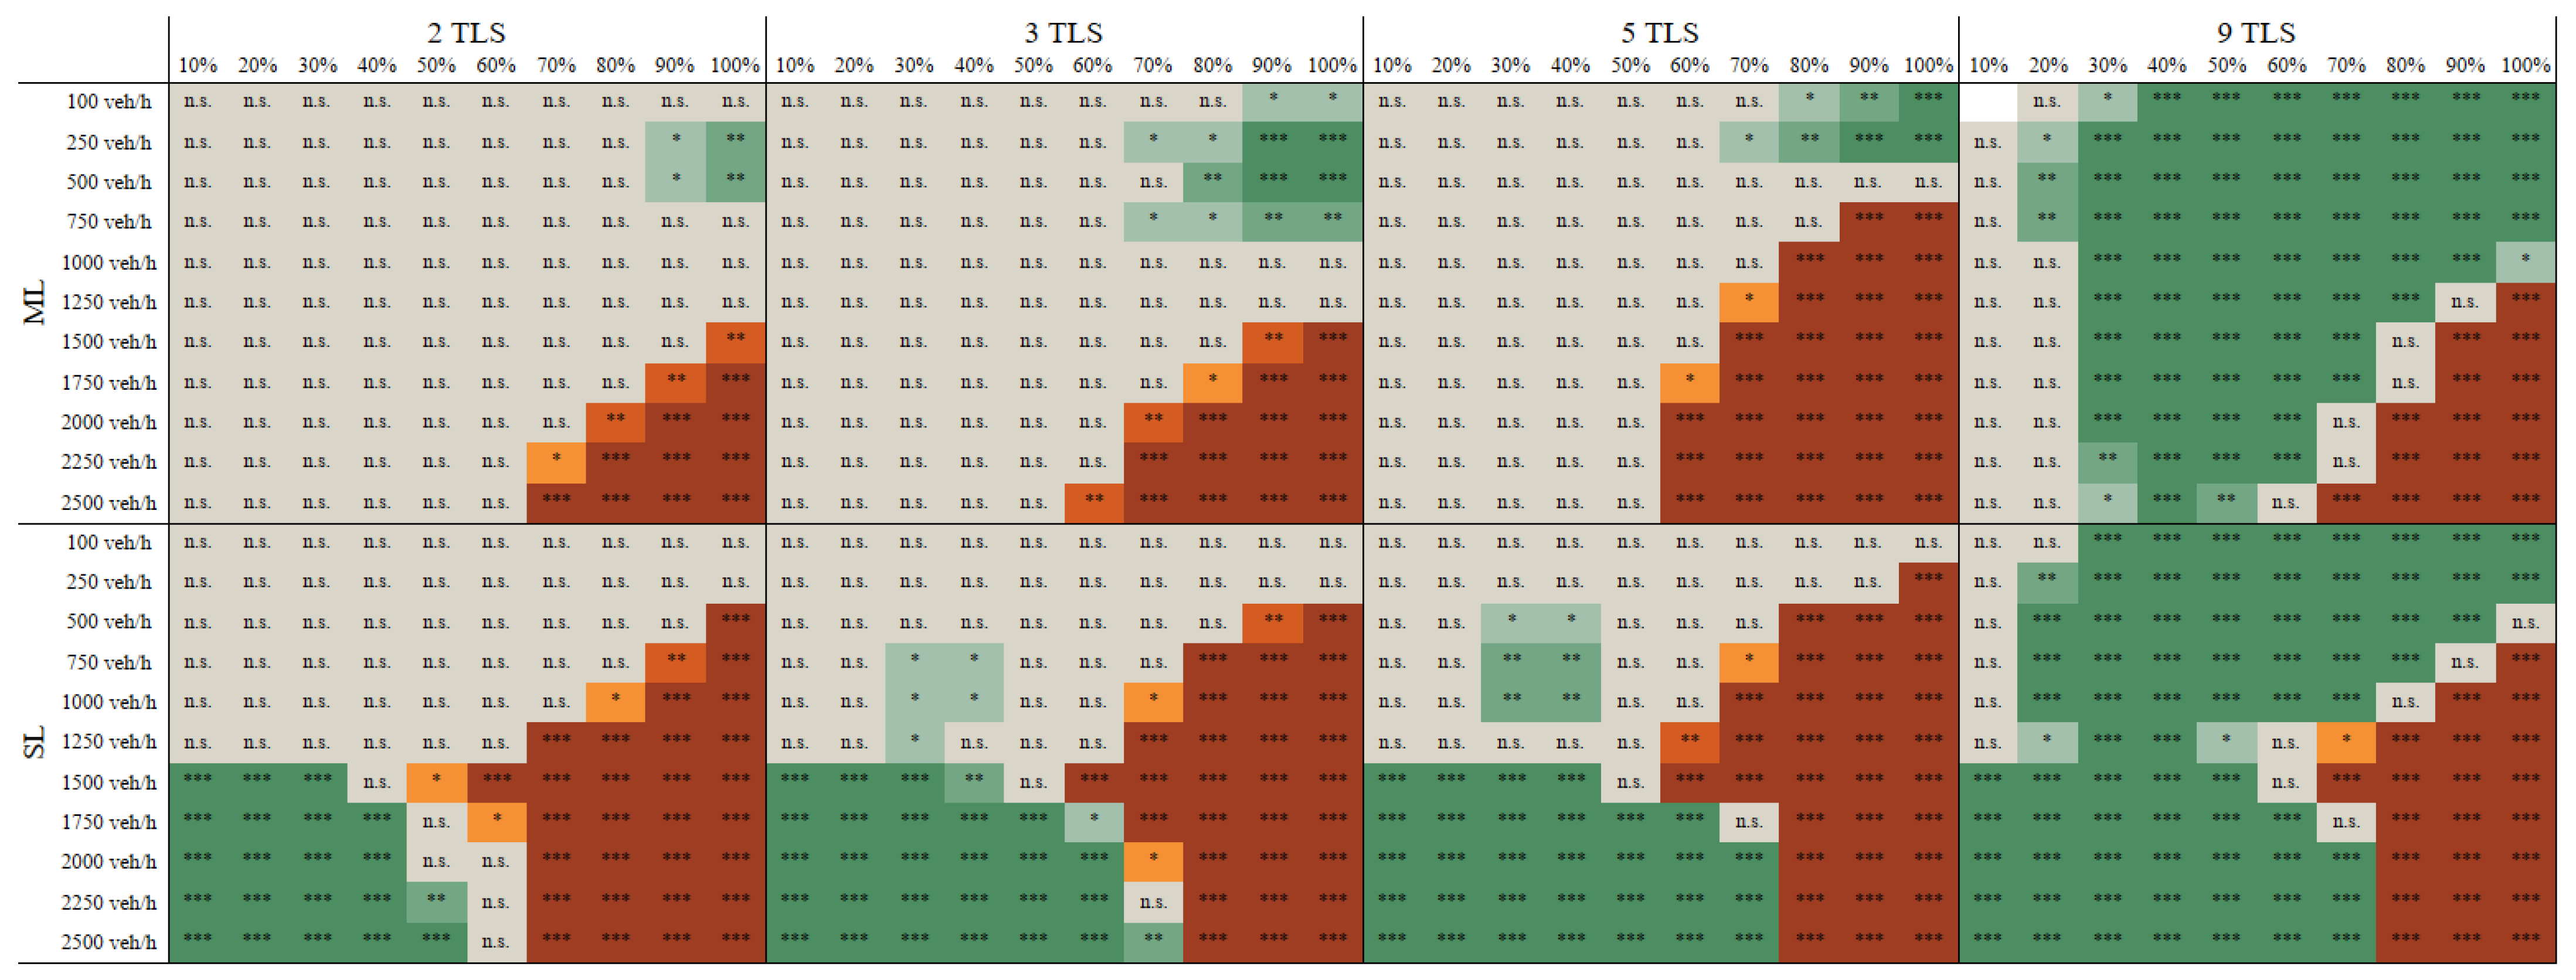
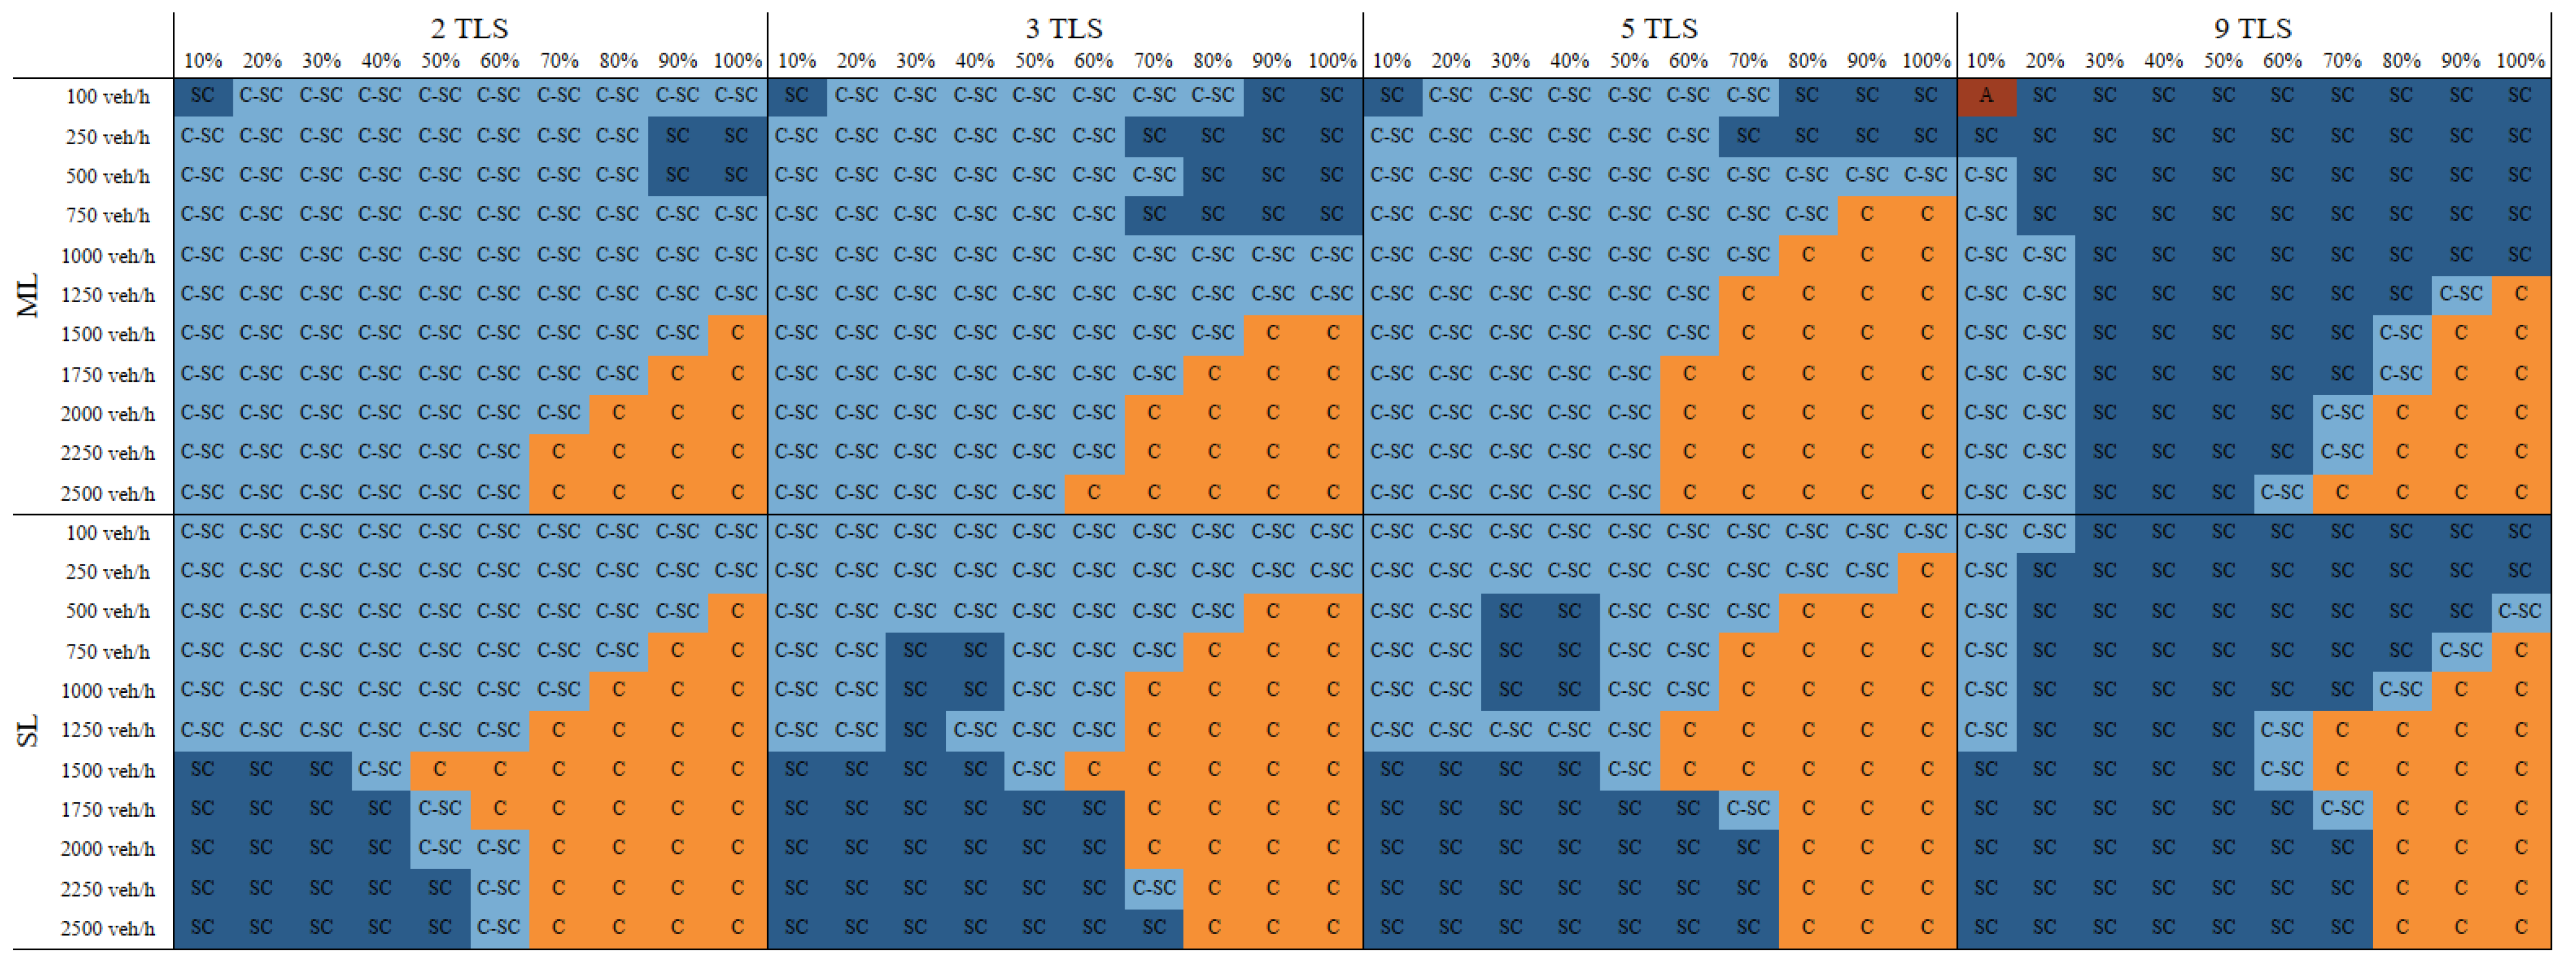
Figure 18 presents the post-hoc test results for CO
2 emissions when comparing CACC with the SC. As with the TT results, both the significance and the direction of the effects vary considerably. Non-significant outcomes cluster mainly at low ERs and low to moderate demand, and occur more frequently with fewer TLS. In ML configurations with up to 5 TLS, significant differences appear only at higher ERs (>60%). Here, the SC tends to outperform CACC under lower traffic flows, while the reverse holds true at higher volumes.
In SL configurations with up to 5 TLS, the SC performs better only under high traffic flows and low to medium ERs, whereas CACC achieves greater reductions at higher ERs. The 9 TLS configurations largely reflect a mixture of these patterns. For both SL and ML, the SC outperforms CACC when either ER or traffic flow is high, but when both are high, CACC achieves less CO2 emissions.
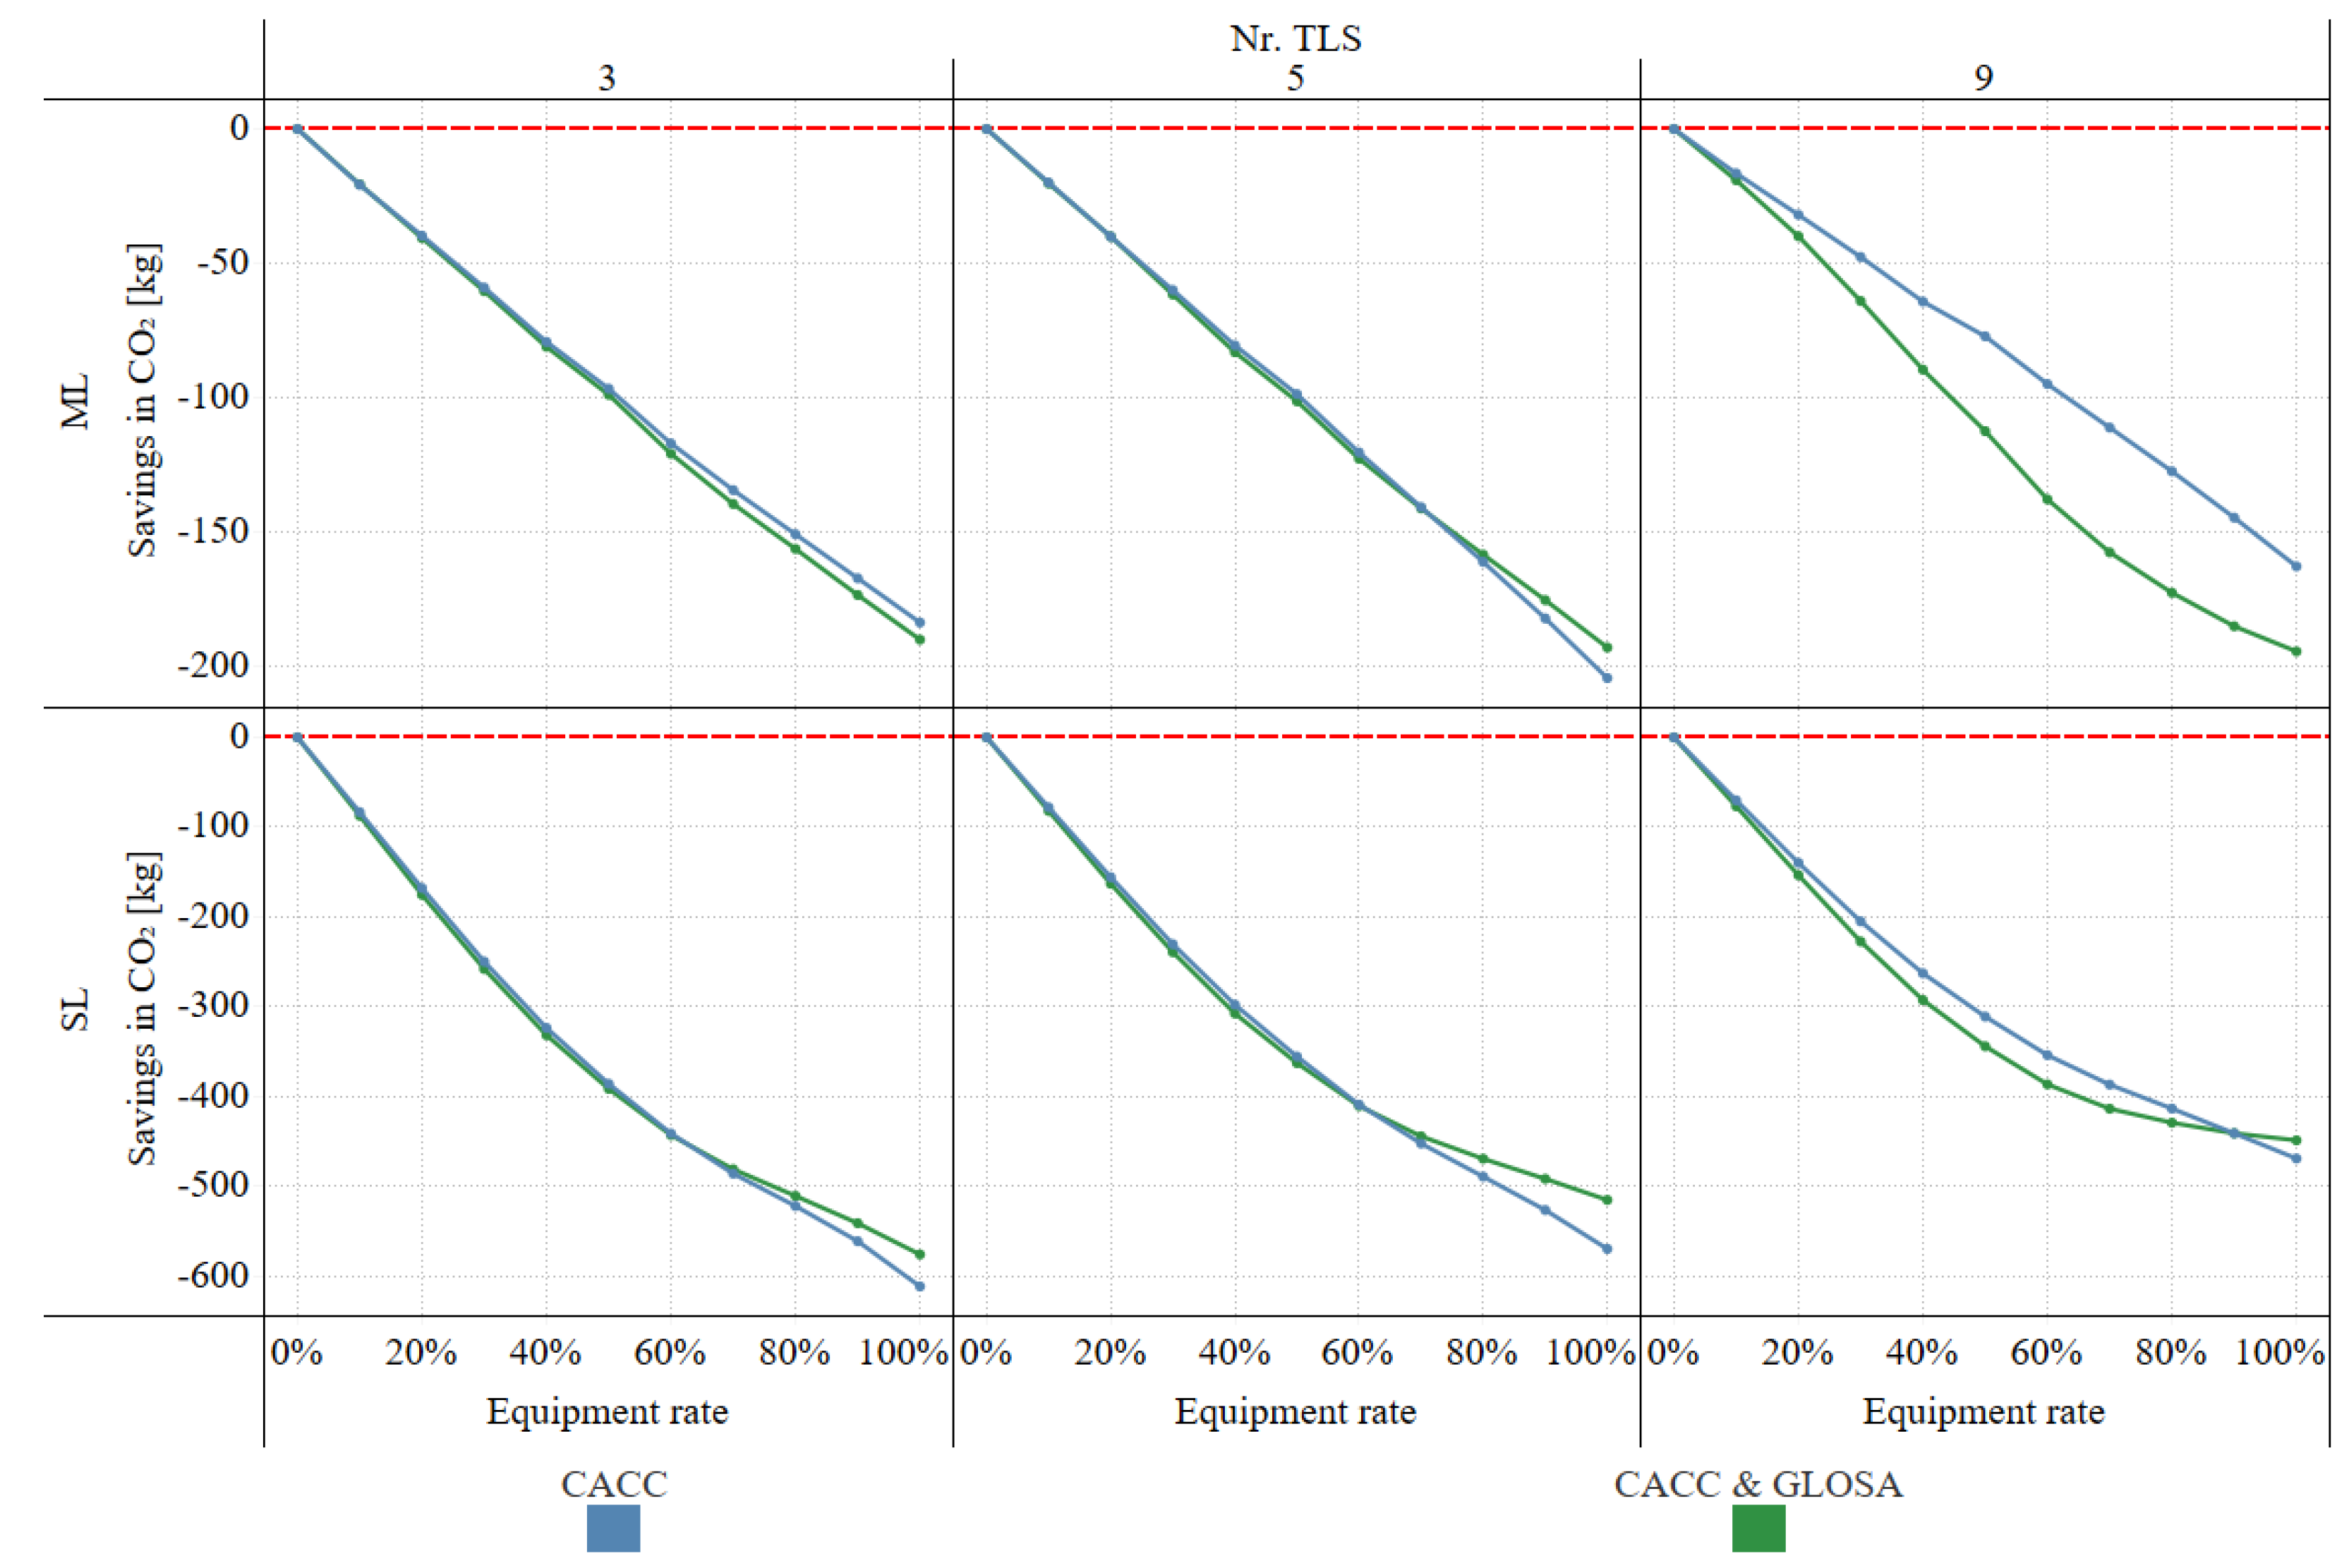
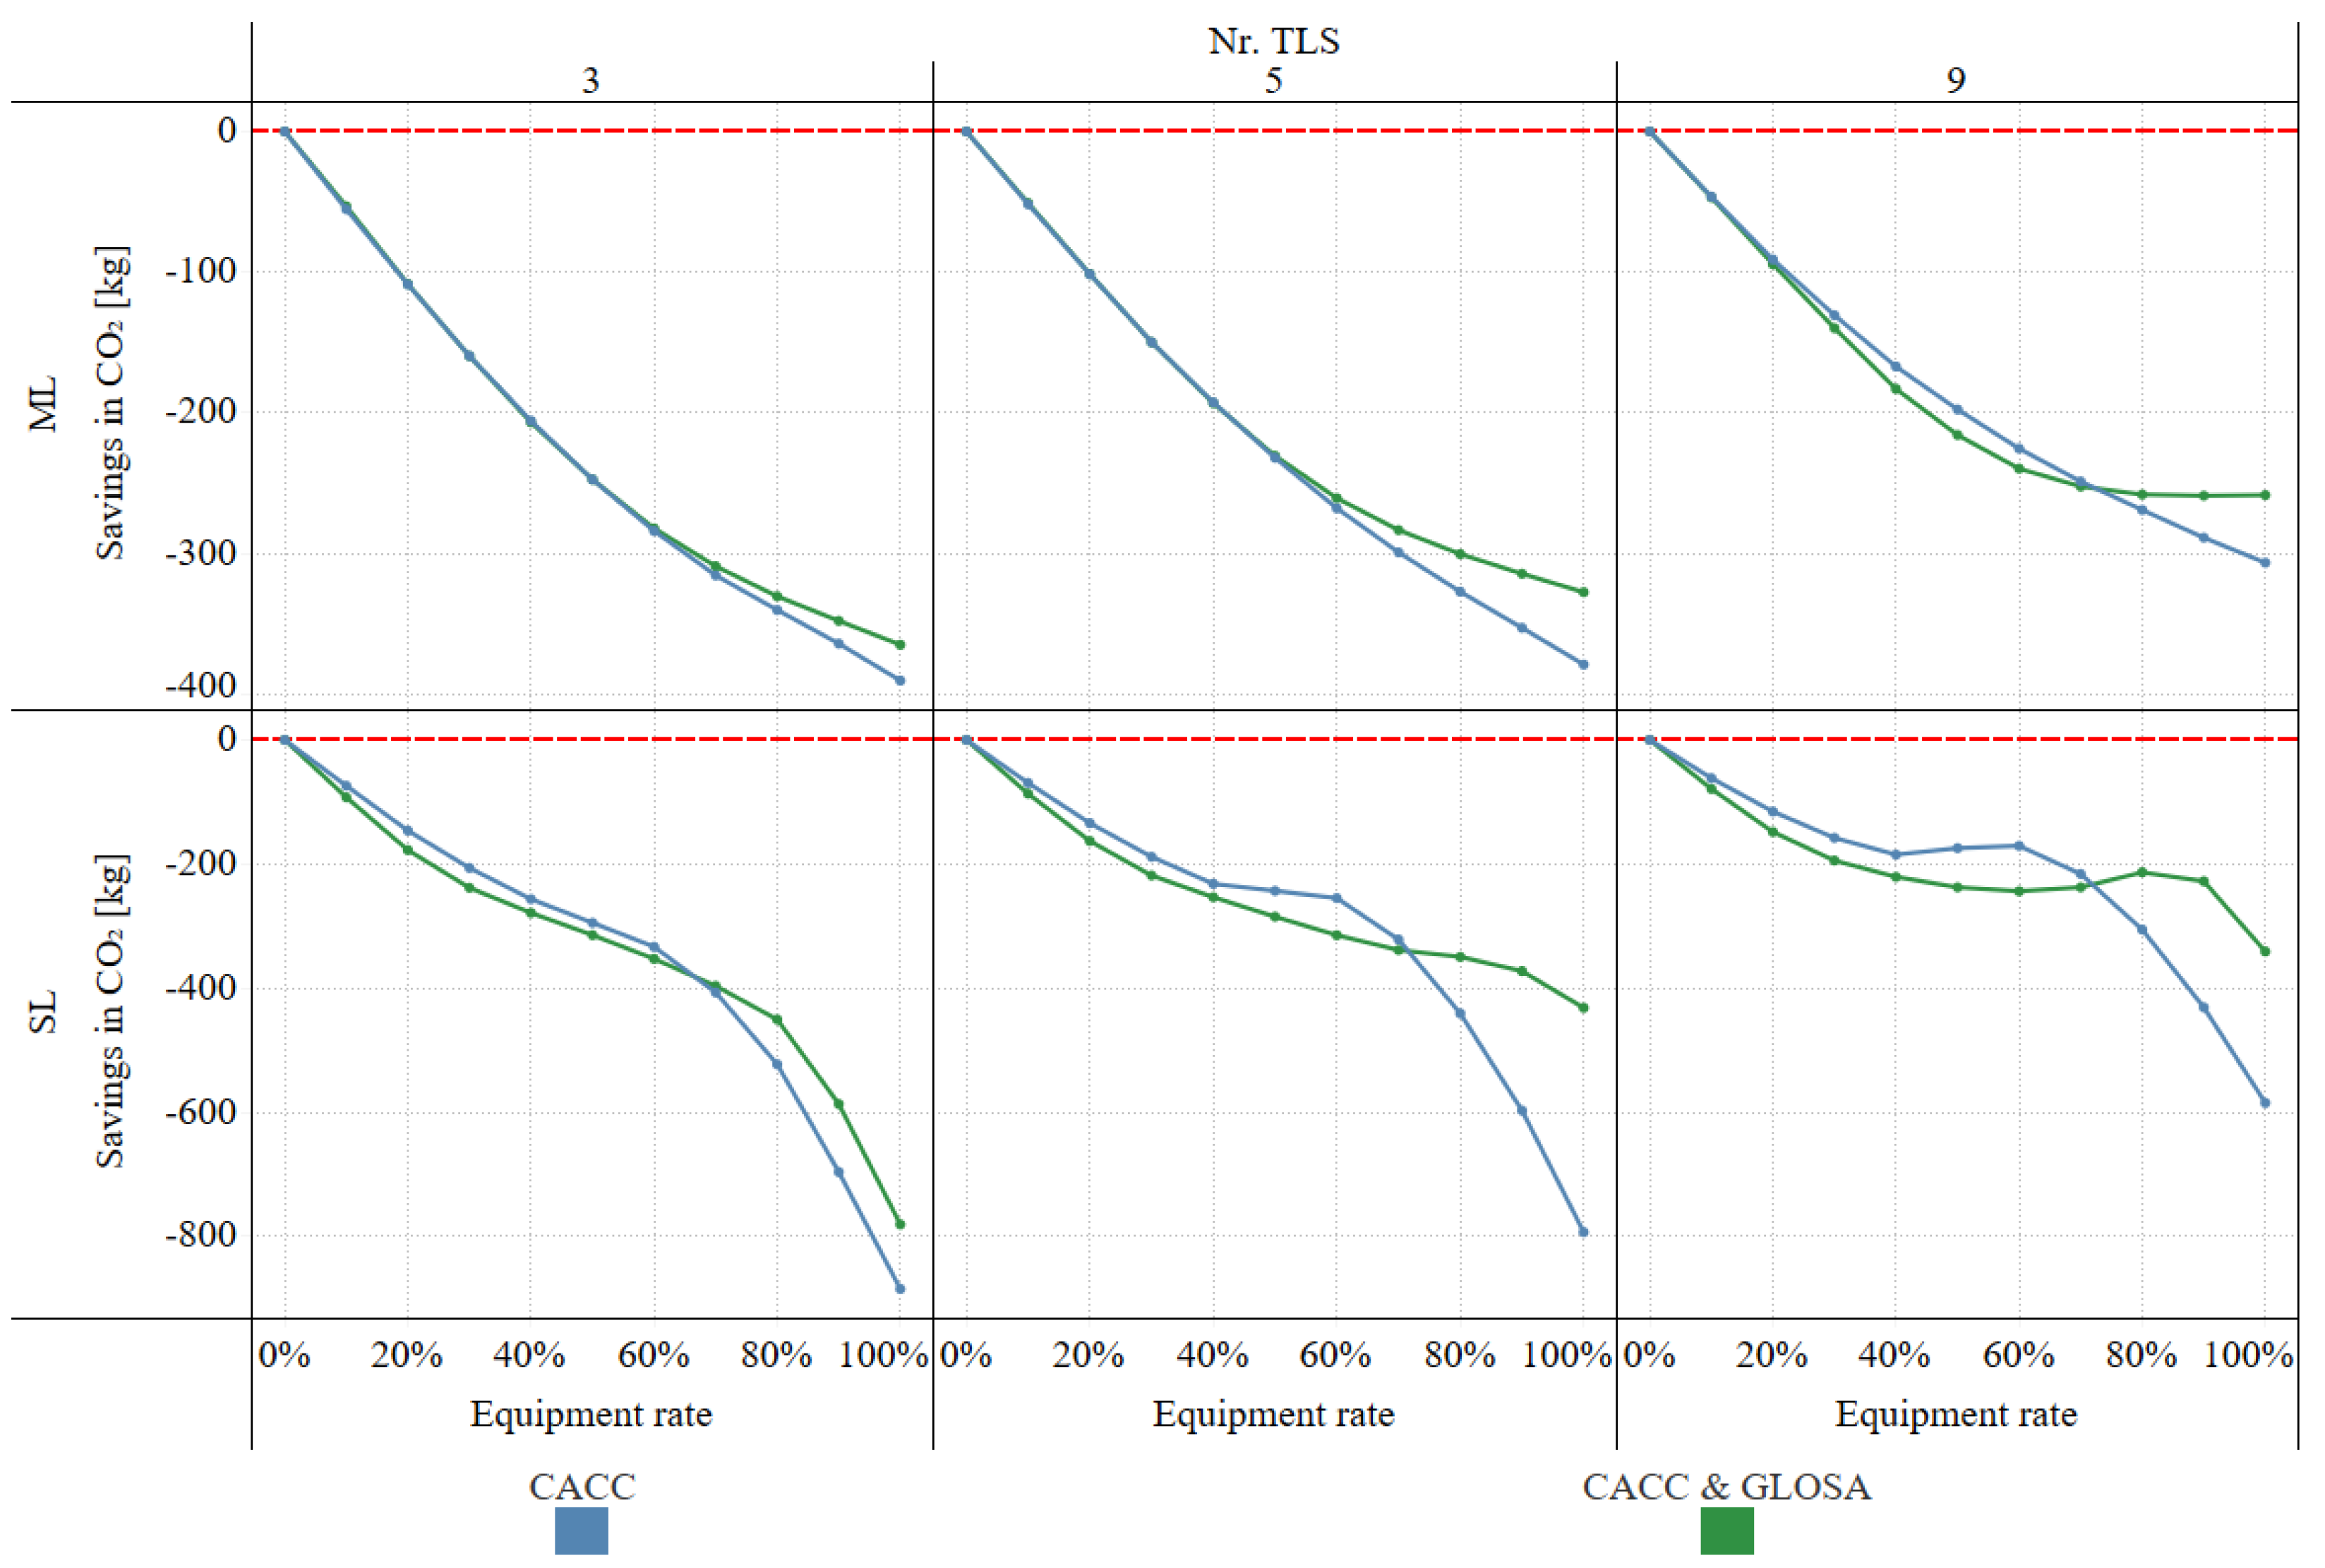
To illustrate these shifts in significance in more detail,
Figure 19 and
Figure 20 present two excerpts of the simulation results, comparing CACC and the SC under different traffic flows.
Figure 19 illustrates the CO
2 savings at a moderate traffic flow of 750 veh/h. In ML configurations with 3 and 5 TLS, the CO
2 reductions achieved by both CACC and the SC follow very similar trends. Statistically significant differences appear only at very high ERs, favoring the SC in the case of 3 TLS, and CACC in the case of 5 TLS (compare
Figure 18). For 9 TLS, however, the difference between the two C-ITS configurations becomes much more pronounced. The SC already achieves clearly higher and statistically significant CO
2 reductions from 20% ER onward.
This pattern is less clear in SL configurations. Here, the CO2 reduction curves for CACC and the SC again remain very similar for 3 and 5 TLS. Significant differences occur at 30% to 40% ER in favor of the SC and at very high ERs in favor of CACC. The trend becomes more evident with 9 TLS, where the SC achieves substantially greater reductions between 20% and 80% ER, before the results shift back in favor of CACC at 100% ER.
Figure 20 illustrates the CO
2 savings at a high traffic flow of 2000 veh/h. In the SL results, a trend similar to the TT analysis can be observed. At certain ERs, the reductions achieved by both CACC and the SC stagnate or even deteriorate. Although this effect is less pronounced than for TT, since no deteriorations relative to the baseline scenario occur, it remains clearly visible. Again, the increase occurs at lower ERs for CACC than for the SC, causing a shift in significance at higher ERs.
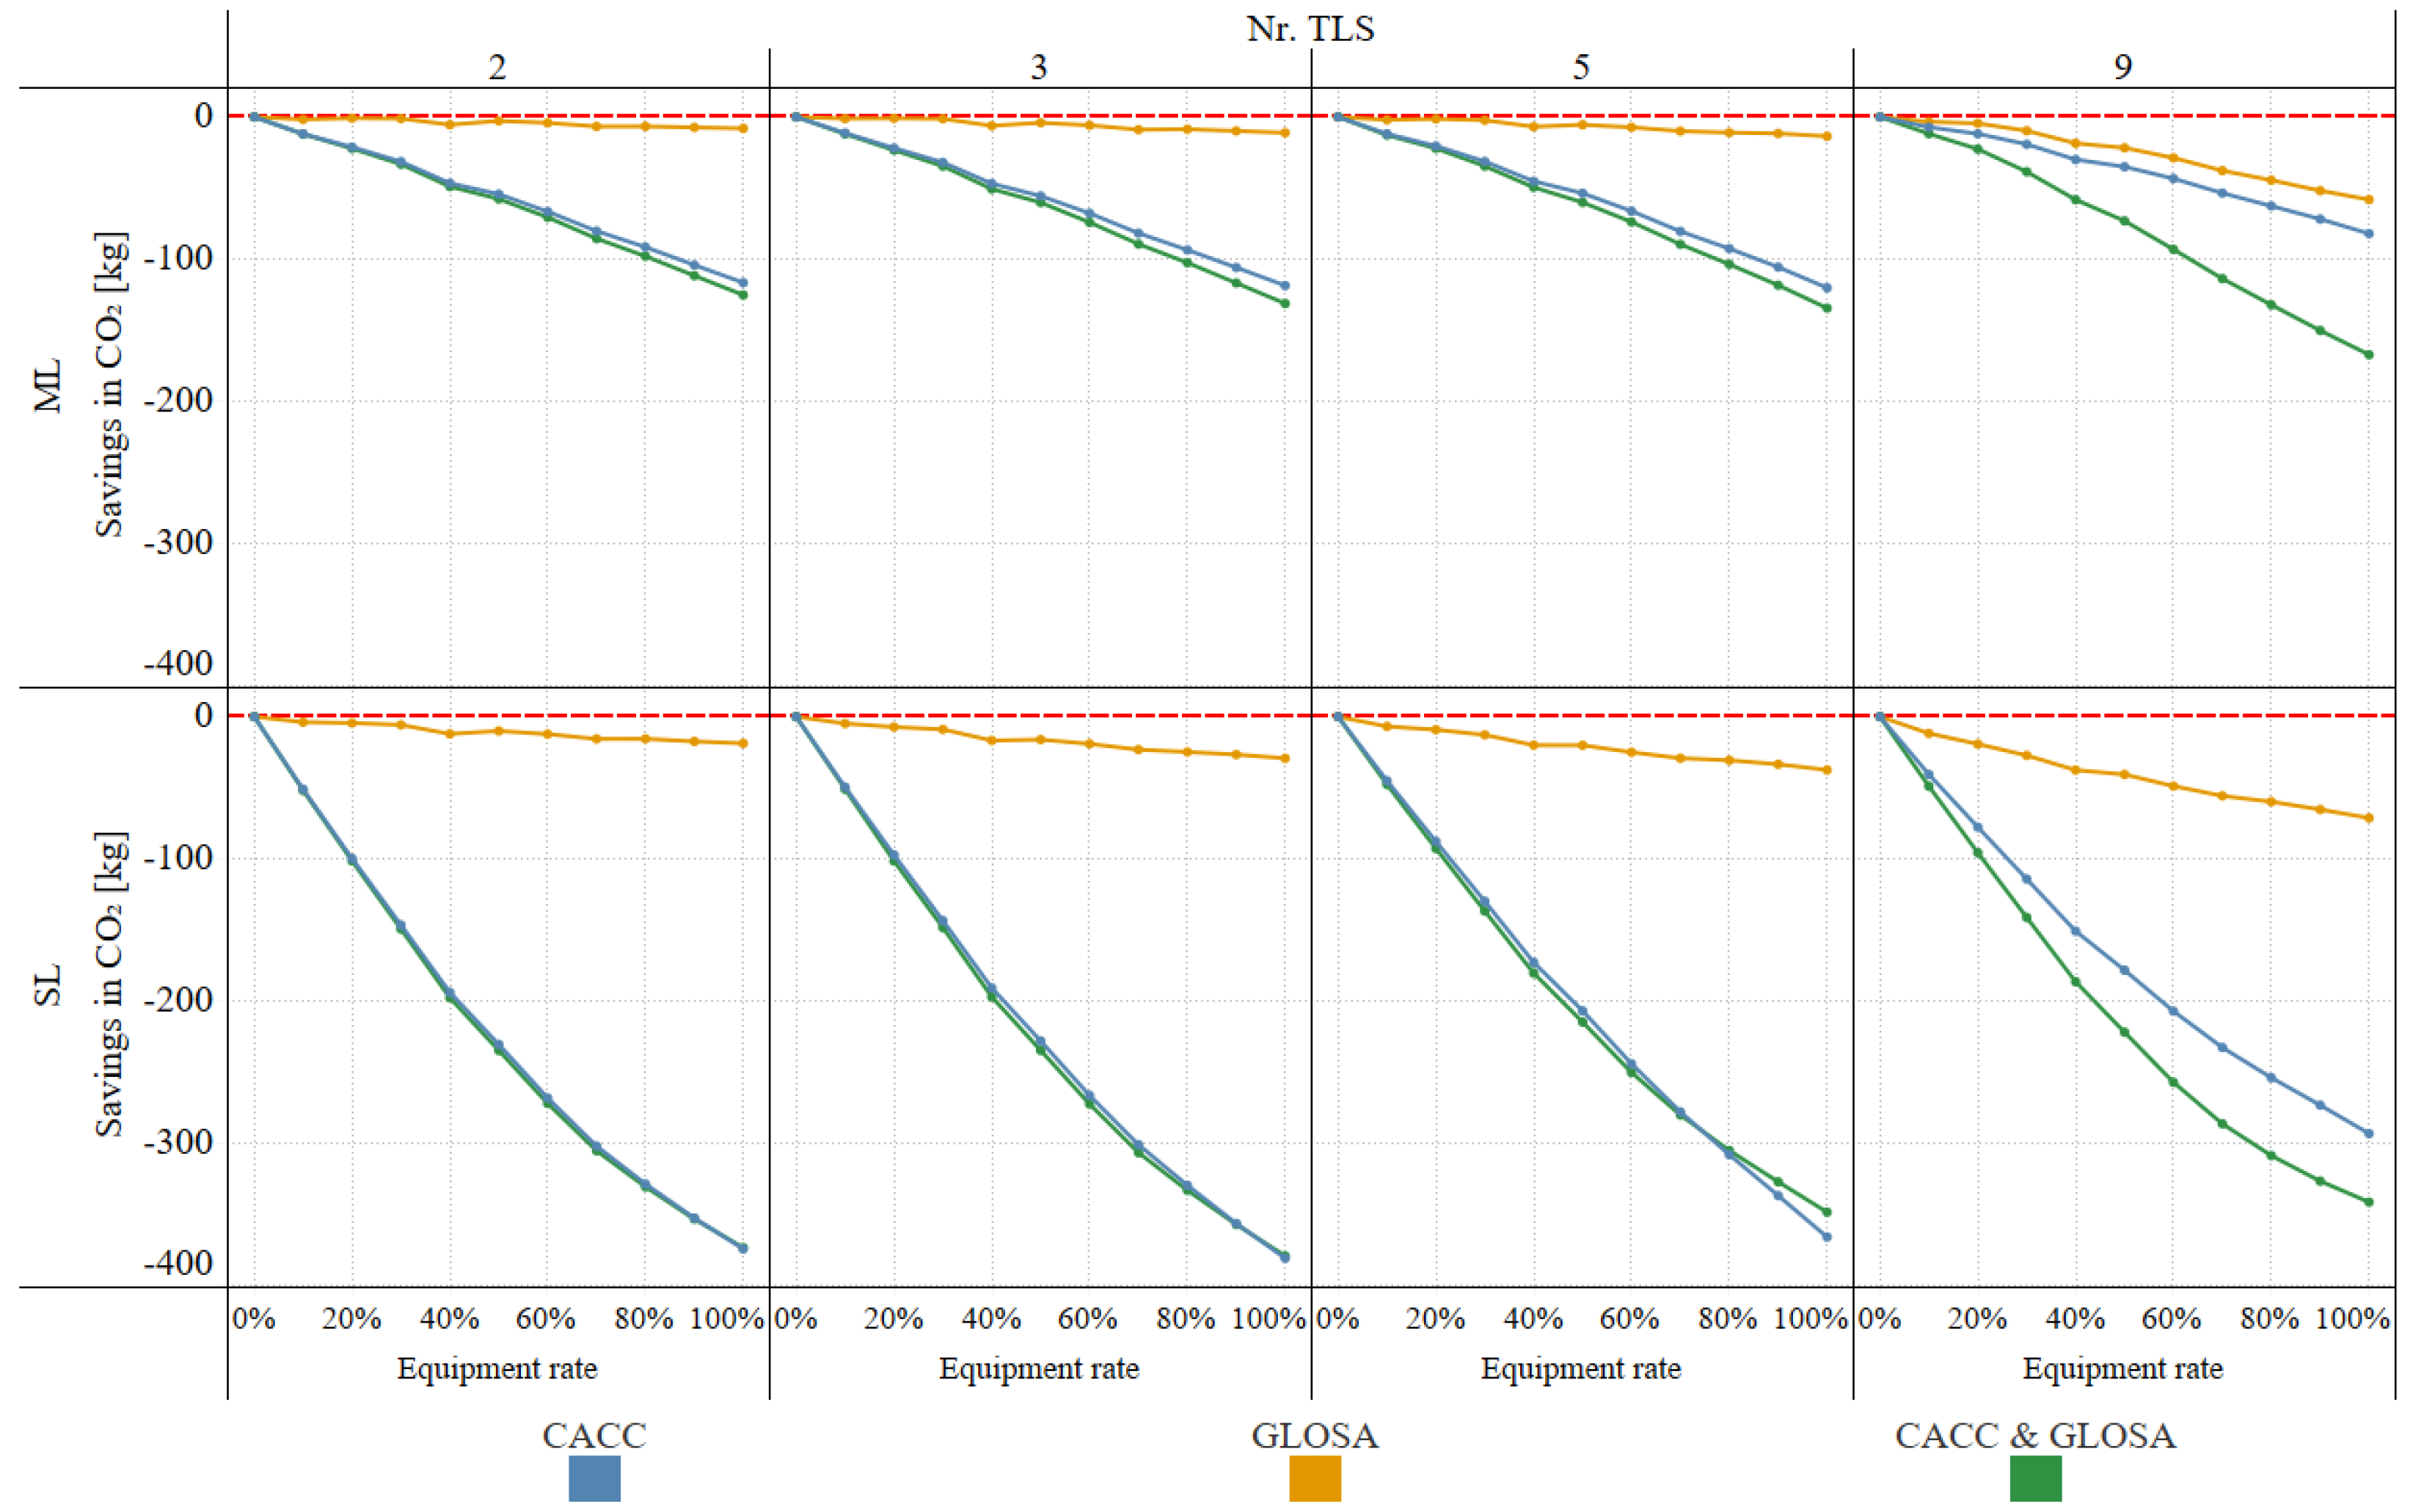
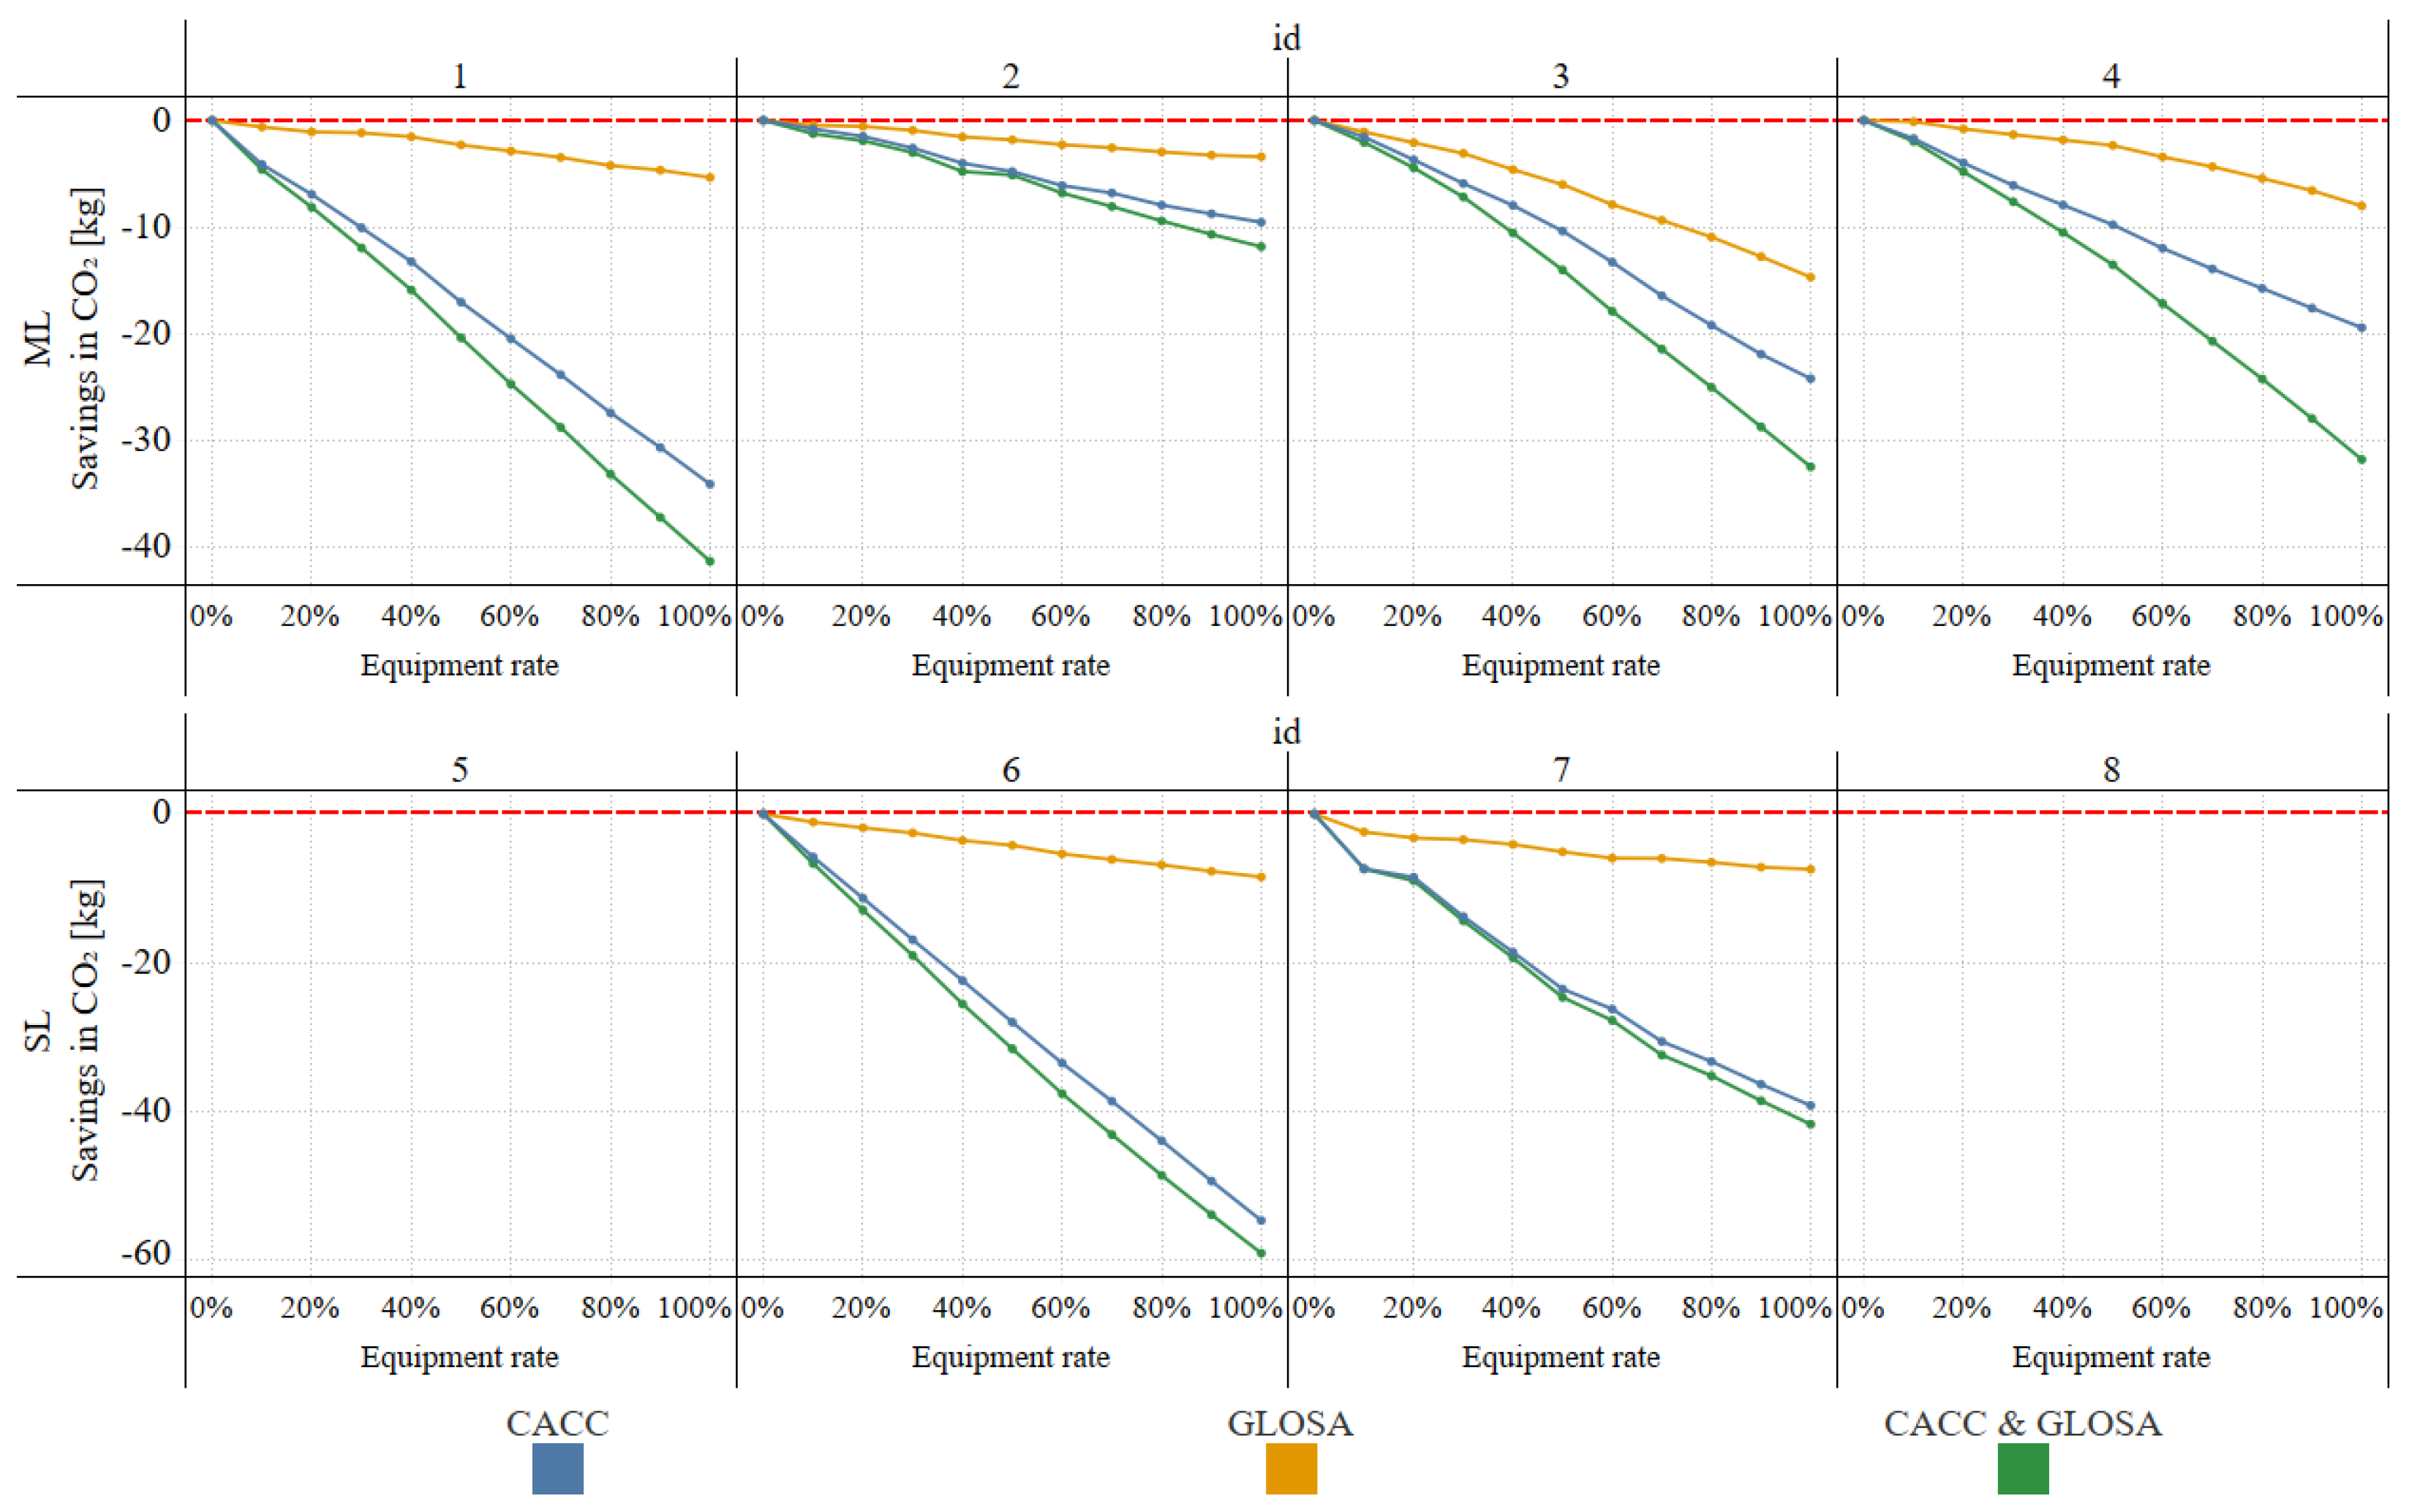
In summary, the Tukey’s HSD results show that all C-ITS services lead to substantial and mostly significant reductions in CO
2 emissions. Both CACC and the SC consistently outperform GLOSA. When directly comparing CACC with the SC, the results are more heterogeneous. At high ERs and high traffic flows, CACC tends to achieve stronger reductions in CO
2 emissions than the SC. Overall, these findings provide a basis for deriving targeted recommendations for C-ITS service (bundle) usage under different conditions (see
Section 4.4).
