Article

Utilization of Low-Viscosity Sustainable Quaternary Microemulsification Fuels Containing Waste Frying Oil–Diesel Fuel–Bio-Alcohols in a Turbocharged-CRDI Diesel Engine

Department of Automotive Technology, Corlu Vocational School, Tekirdag Namik Kemal University, 59860 Corlu, Türkiye
Sustainability 2025, 17(19), 8835; https://doi.org/10.3390/su17198835
Submission received: 22 August 2025 / Revised: 24 September 2025 / Accepted: 30 September 2025 / Published: 2 October 2025
(This article belongs to the Topic Advanced Bioenergy and Biofuel Technologies)

Abstract

In this study, low-viscosity (<5 mm2·s−1, fits European Biodiesel Standard-EN 14214) quaternary microemulsification fuels were developed and tested in a CRDI diesel engine to evaluate their effects on engine performance, injection, combustion, and emission characteristics. The fuels were formulated using 50% petro-diesel, 30% waste frying oil (without converting biodiesel), and a combination of 10% n-butanol with either 10% methanol or 10% ethanol. Engine tests were conducted at constant speed of 2000 rpm and five different engine loads. The results indicated that both microemulsified fuels exhibited increased brake specific fuel consumption by about 20% and brake specific energy consumption by around 8% compared to petro-diesel, while thermal efficiency decreased by about 8%. Injection timing for both pilot and main injections occurred earlier with the emulsification fuels, and higher injection amount and injection rate values were observed at all loads. As engine load increased, the peak cylinder pressures of the emulsified fuels surpassed those of petro-diesel, although the crank angles at which these peak values were attained were similar. The combustion duration was shorter for both quaternary fuels, with similar maximum pressure rise rates to petro-diesel. Emulsification fuels caused higher exhaust emissions (especially THC) and this difference increased with increasing load. When comparing two formulations, the methanol-containing fuel demonstrated slightly better results than the ethanol-containing blend. These findings suggest that microemulsified fuels containing bio-alcohols and waste frying oil can be sustainable fuel alternatives for partial petro-diesel substitution if the injection settings are adapted in accordance with the properties of these fuels.

1. Introduction

Energy is one of the most fundamental inputs for sustainability of modern life. Therefore, total energy consumption has been a consistent upward pathway. Global energy demand, which was 634 EJ in 2024, is projected to reach 779 EJ in 2035 [1]. Most of this energy demand (81.5% in 2024) is still met from fossil sources [2]. Thus, the negative environmental impact of energy usage is increasing. The transport sector is an important source of environmental problems. Recently, battery electric vehicles (BEVs) have emerged as a very popular option for decarbonizing transport. However, BEVs are not yet a final solution, as there are many techno-economic barriers such as limited charging infrastructure, long charging times, high battery costs, and environmental impacts of battery production and disposal. The most important issue to be emphasized here is that the electricity used in battery charging should be produced from renewable sources without polluting the environment. Nevertheless, when analyzing electricity generation, it is seen that electric mobility powered by renewables is very low [3]. Therefore, BEVs’ contribution to reducing petroleum dependence and environmental problems is quite limited.
The transport sector is still mainly dependent on thermal engines and will continue to be for many years. Thus, biofuels have the greatest potential for sustainability of transportation and mitigating its environmental impacts. In 2024, biofuels accounted for 90.2% of total renewable energy used in transportation (4.6 EJ biofuels-0.5 EJ renewable electricity) [4]. Contrary to current debates, diesel engines are widely used in transportation thanks to their advantages, including better thermal efficiency, higher torque output, lower fuel consumption, and durability. Therefore, the importance of a sustainable, renewable, domestically producible, and low-carbon-footprint alternative diesel fuel is clear. Through its various technical advantages and relatively better emissions (excluding NOx), biodiesel not only promotes environmental sustainability but also reduces dependence on petroleum [5,6,7,8,9]. Biodiesel can be produced from various feedstocks such as vegetable oils, waste frying oils, waste animal fats, and algae oil. In addition to feedstock cost, another factor increasing the break-even price of biodiesel is transesterification reaction. It requires facility and infrastructure investment, alcohol-catalyst and water consumption, time, labor, and processing costs.
There are other methods to reduce vegetable oils’ extremely high viscosity, which is the biggest obstacle to their use as diesel fuel. Vegetable oils can be blended with petroleum-based diesel fuel (PDF) in certain quantities (dilution). Dilution may seem like a fairly economical and practical method, but it does not reduce injector clogging problems and results in fuel blends with poor cold flow properties. Also, vegetable oils have limited miscibility within PDF, which causes dispersion problems and restricts blending percentage [10]. Additives and/or emulsifiers are needed to increase phase stability. The addition of oxygenates such as bio-alcohols to PDF–vegetable oil blends not only results in more stable biofuels (microemulsification) but also improves combustion properties and reduces emissions [11,12]. Microemulsification refers to the formation of thermodynamically stable, optically isotropic colloidal dispersion consisting of a polar phase and a non-polar phase, stabilized by emulsifiers, with a particle size smaller than one-fourth the wavelength of visible light [13]. In a diesel-based microemulsification fuel, a polar phase (alcohol) disperses within a non-polar phase (diesel and/or vegetable oil-diesel blends) [14]. The microemulsification method has several advantages such as not requiring significant plant infrastructure, easy implementation, no additional energy, catalyst and water usage, and no by-products [15]. Generally, short-chain alcohols such as methanol or ethanol are used as polar phases in microemulsification fuels. However, they have some unfavorable fuel properties, including unacceptably low cetane number, poor lubricity, high latent heat of evaporation, low calorific value, and high volatility, restricting their usage in diesel engines [16]. Additionally, as short-chain alcohols are highly polar and hydrophilic, their miscibility within vegetable oil–PDF is not good, leading to phase separation problems [17]. Since higher alcohols (such as n-butanol, pentanol, hegzanol, etc.) reduce interfacial tension and intermolecular stress, they can be added as a co-surfactant to ternary fuels containing lower alcohols, resulting in quaternary microemulsification fuels [18,19]. Also, this application improves calorific value, cetane number, flash point, and lubricity while reducing latent heat of vaporization, making microemulsification fuels more suitable for diesel engines [20,21,22]. Moreover, the use of quaternary microemulsification fuels instead of ternary ones may reduce PDF usage by enabling the addition of more vegetable oil [23]. It might be considered more practical to use only higher alcohols (without using methanol or ethanol), but it should be noted that they have higher viscosities, lower oxygen contents, and are quite expensive compared to lower alcohols. It should be noted that as the alcohol’s chain length increases, its viscosity and cost increase. Thus, quaternary microemulsification fuels containing both short-chain and long-chain alcohol (such as n-butanol) in certain proportions may be superior in terms of phase stability, fuel properties, and cost [24].
There are many studies in the literature on the use of quaternary microemulsification fuels in diesel engines. Feng et al. [25] investigated the effects of methanol/n-butanol/biodiesel/PDF mixtures on diesel engine characteristics. Three different microemulsification fuels were prepared: 80% PDF-10% methanol-10% n-butanol, 80% PDF-10% methanol-10% biodiesel, 80% PDF-10% methanol-5% n-butanol-5% biodiesel. The engine tests were performed in a four-cylinder, four-stroke, turbocharged, common rail direct injection (CRDI) diesel engine. During experiments, engine load was increased from 0.2 MPa to 1.0 MPa while engine speed was kept constant at 1600 rpm. Compared to PDF, microemulsification fuels increased in-cylinder pressure, brake thermal efficiency, ignition delay, and brake specific fuel consumption. Microemulsification fuels reduced soot emissions by 30% while increasing NOx slightly. The lowest smoke and NOx emissions and the highest thermal efficiency were determined for microemulsification fuel containing 10% methanol and 10% n-butanol.
Khan et al. [26] determined the influences of quaternary fuels containing different alcohols (ethanol, propanol, butanol, heptanol, and decanol) on engine performance and emission characteristics. Test fuels contained 50% PDF, 25% sunflower oil biodiesel, 5% sunflower oil, and 20% alcohol. A four-stroke, single-cylinder, CRDI diesel engine was used as a test engine. Engine tests were carried out at 1800 rpm, two different loads (10 and 20 Nm), and four different injection pressures (300, 400, 500, and 600 bar). It should be expressed that viscosities of almost all fuels exceeded 5 mm2·s−1 (viscosity upper limit given in EN 14214). Also, the viscosity of fuels containing heptanol and decanol was above 6 mm2·s−1 (viscosity upper limit given in ASTM D6751). With increasing injection pressure, performance characteristics improved, CO and soot emissions decreased, but NOx increased. The lowest CO, CO2, HC, and NOx emissions were measured for blends containing heptanol, propanol, ethanol, and propanol, respectively. The highest smoke emission was detected for fuel produced with ethanol. They reported that the most promising fuel blend was the quaternary fuel containing propanol in terms of performance and emissions.
Cedik et al. [27] prepared three different quaternary microemulsification fuels consisting of PDF/rapeseed oil/methanol/isobutanol: 60/30/5/5 (M5), 50/30/10/10 (M10), and 50/10/20/20 (M20). Before engine tests, phase stability of the fuel blends was analyzed. While there was no problem in M5, phase separation occurred in M10 and M20. While a relatively small amount of alcohol was separated in M10, phase separation was strong in M20. Engine tests were performed in a four-stroke, four-cylinder, turbocharged, direct injection diesel engine equipped with a mechanically controlled fuel injection system at 1950 rpm and three different engine loads (50-70-100% load). As alcohol content increased, performance and emission characteristics deteriorated. For example, compared to PDF, M20 reduced torque by 27%, power by 22.5%, and thermal efficiency by 5.3%, while it increased CO2 by up to 5.5% and NOx by up to 21.9%. Also, the increasing alcohol fraction caused small soot particles. The authors concluded that M5 and M10 are more suitable as diesel engine fuel.
Although there are many articles on quaternary fuels, test fuels’ viscosities are generally quite high and test engines are also old technology equipped with mechanical fuel injection systems which can tolerate low-quality fuels. Today’s modern diesel engines are very sensitive to fuel quality, especially viscosity [28]. They cannot be operated with most microemulsification fuels, having viscosities given in the literature. Also, when creating ternary or quaternary microemulsification fuels, only one type of alcohol (usually short-chain alcohols) is used. However, using a long-chain alcohol in equal quantities with short-chain alcohols will both improve phase stability and offset these alcohols’ drawbacks as diesel fuel. Microemulsifications containing different alcohols will have varying fuel features depending on alcohol type. Therefore, the influences of each alcohol on a modern diesel engine’s characteristics should be studied in depth. Despite the broad literature, there are still many questions regarding optimal formulation of low-viscosity (biodiesel quality) quaternary microemulsification fuels containing PDF, two different bio-alcohols (methanol–butanol or ethanol–butanol), and waste frying oil (WFO) and their individual or combined effects on a CRDI diesel engine’s characteristics. This study aims to partially fill this gap in the literature.

2. Materials and Methodology

In this study, to determine the potential of low-viscosity (<5 mm2·s−1) microemulsification fuels as diesel engine fuel, quaternary microemulsification fuels consisting of PDF, WFO, and two different bio-alcohols (one short-chain and one long-chain alcohol) were produced. To reduce the dependence on petroleum, test fuels’ PDF content was limited to 50% (v/v). Related literature suggests that a maximum of 20% alcohol can be used in microemulsification fuels [29]. For this reason, the total alcohol content of emulsified fuels (including long-chain and short-chain) was limited to this ratio. As a triglyceride constituent, 30% WFO (without converting biodiesel) was used. WFO was obtained from a catering company. It was filtered, dried at 110 °C for one hour, and then its physico-chemical features and fatty acid structure were determined (Table 1). WFO’s chemical formula (C18H33O2) was calculated from its fatty acid composition. By using WFO, it was aimed to prevent a fuel–food debate, to prevent possible problems that may arise from waste disposal, to transform waste into a critical value such as energy, and also to reduce the cost of microemulsification fuels. In first stage of fuel blend preparation, a co-surfactant was not used to observe the solubility of methanol and ethanol in PDF-WFO. When 50% PDF-30% WFO-20% methanol and 50% PDF-30% WFO-20% ethanol were used, phase separation occurred in a very short time.
To prevent phase separation, n-butanol was added as a co-surfactant and quaternary blends (50% PDF-30% WFO-15% methanol-5% n-butanol and 50% PDF-30% WFO-15% ethanol-5% n-butanol) were prepared, but the phase separation problem continued, although not as much as in ternary mixtures. This should be noted that phase separation in ethanol was relatively less than methanol. In the next step, n-butanol content was increased to 10% and no phase separation was observed. After being left at room temperature for one week, it was stored in the refrigerator at 4 °C for another week to observe phase stability at low temperatures, and no phase separation problem was observed at this temperature, either. Since phase stability was achieved with a 10% n-butanol content as a co-surfactant, the n-butanol content was not increased beyond this ratio in order to avoid further increasing the cost and viscosity of the quaternary microemulsification fuels and to use equal amounts of long-chain and short-chain alcohols.
PDF (EN 590) was purchased from a local gas station. Test fuels were coded as following: “PDF” for petro-diesel as reference fuel, “DWMB” for 50% PDF-30% WFO-10% methanol-10% n-butanol, and “DWEB” for 50% PDF-30% WFO-10% ethanol-10% n-butanol. Quaternary microemulsification fuels’ kinematic viscosities were kept below 5 mm2·s−1 (biodiesel viscosity quality). The chemical formulas and some basic fuel properties of test fuels can be seen in Table 2.
Table 3 shows technical specifications of the test engine. Engine tests were performed at 2000 rpm while engine load was gradually increased (BMEP= 3.3 bar, 5.0 bar, 6.6 bar, 8.3 bar, and 10.0 bar). The AVL Flowsonix-Air product was used to determine intake air mass flow. A glow-plug sensor (AVL-GH13P) was mounted on the cylinder and AVL FlexIFEM brand product was used to determine in-cylinder gas pressure. A current plug (Fluke) was used to receive injection signals. AVL Indicom combustion analysis program was used to obtain and also to analyze in-cylinder gas pressure data. In-cylinder pressure data of 50 engine cycles were collected with a resolution of 0.2 crank angle (°CA). Exhaust emissions were determined using AVL SESAM FTIR exhaust emission analyzer. Measuring instruments on the testbed and the accuracy of the measurements and the uncertainty of the calculated results are briefly given in Table 4 and Table 5, respectively. To ensure the accuracy and repeatability of the measurements, the experiments were repeated three times, and the results were averaged. Figure 1 illustrates schematic view of the experimental setup.

3. Results and Discussion

3.1. Performance Characteristics

3.1.1. Brake Specific Fuel Consumption

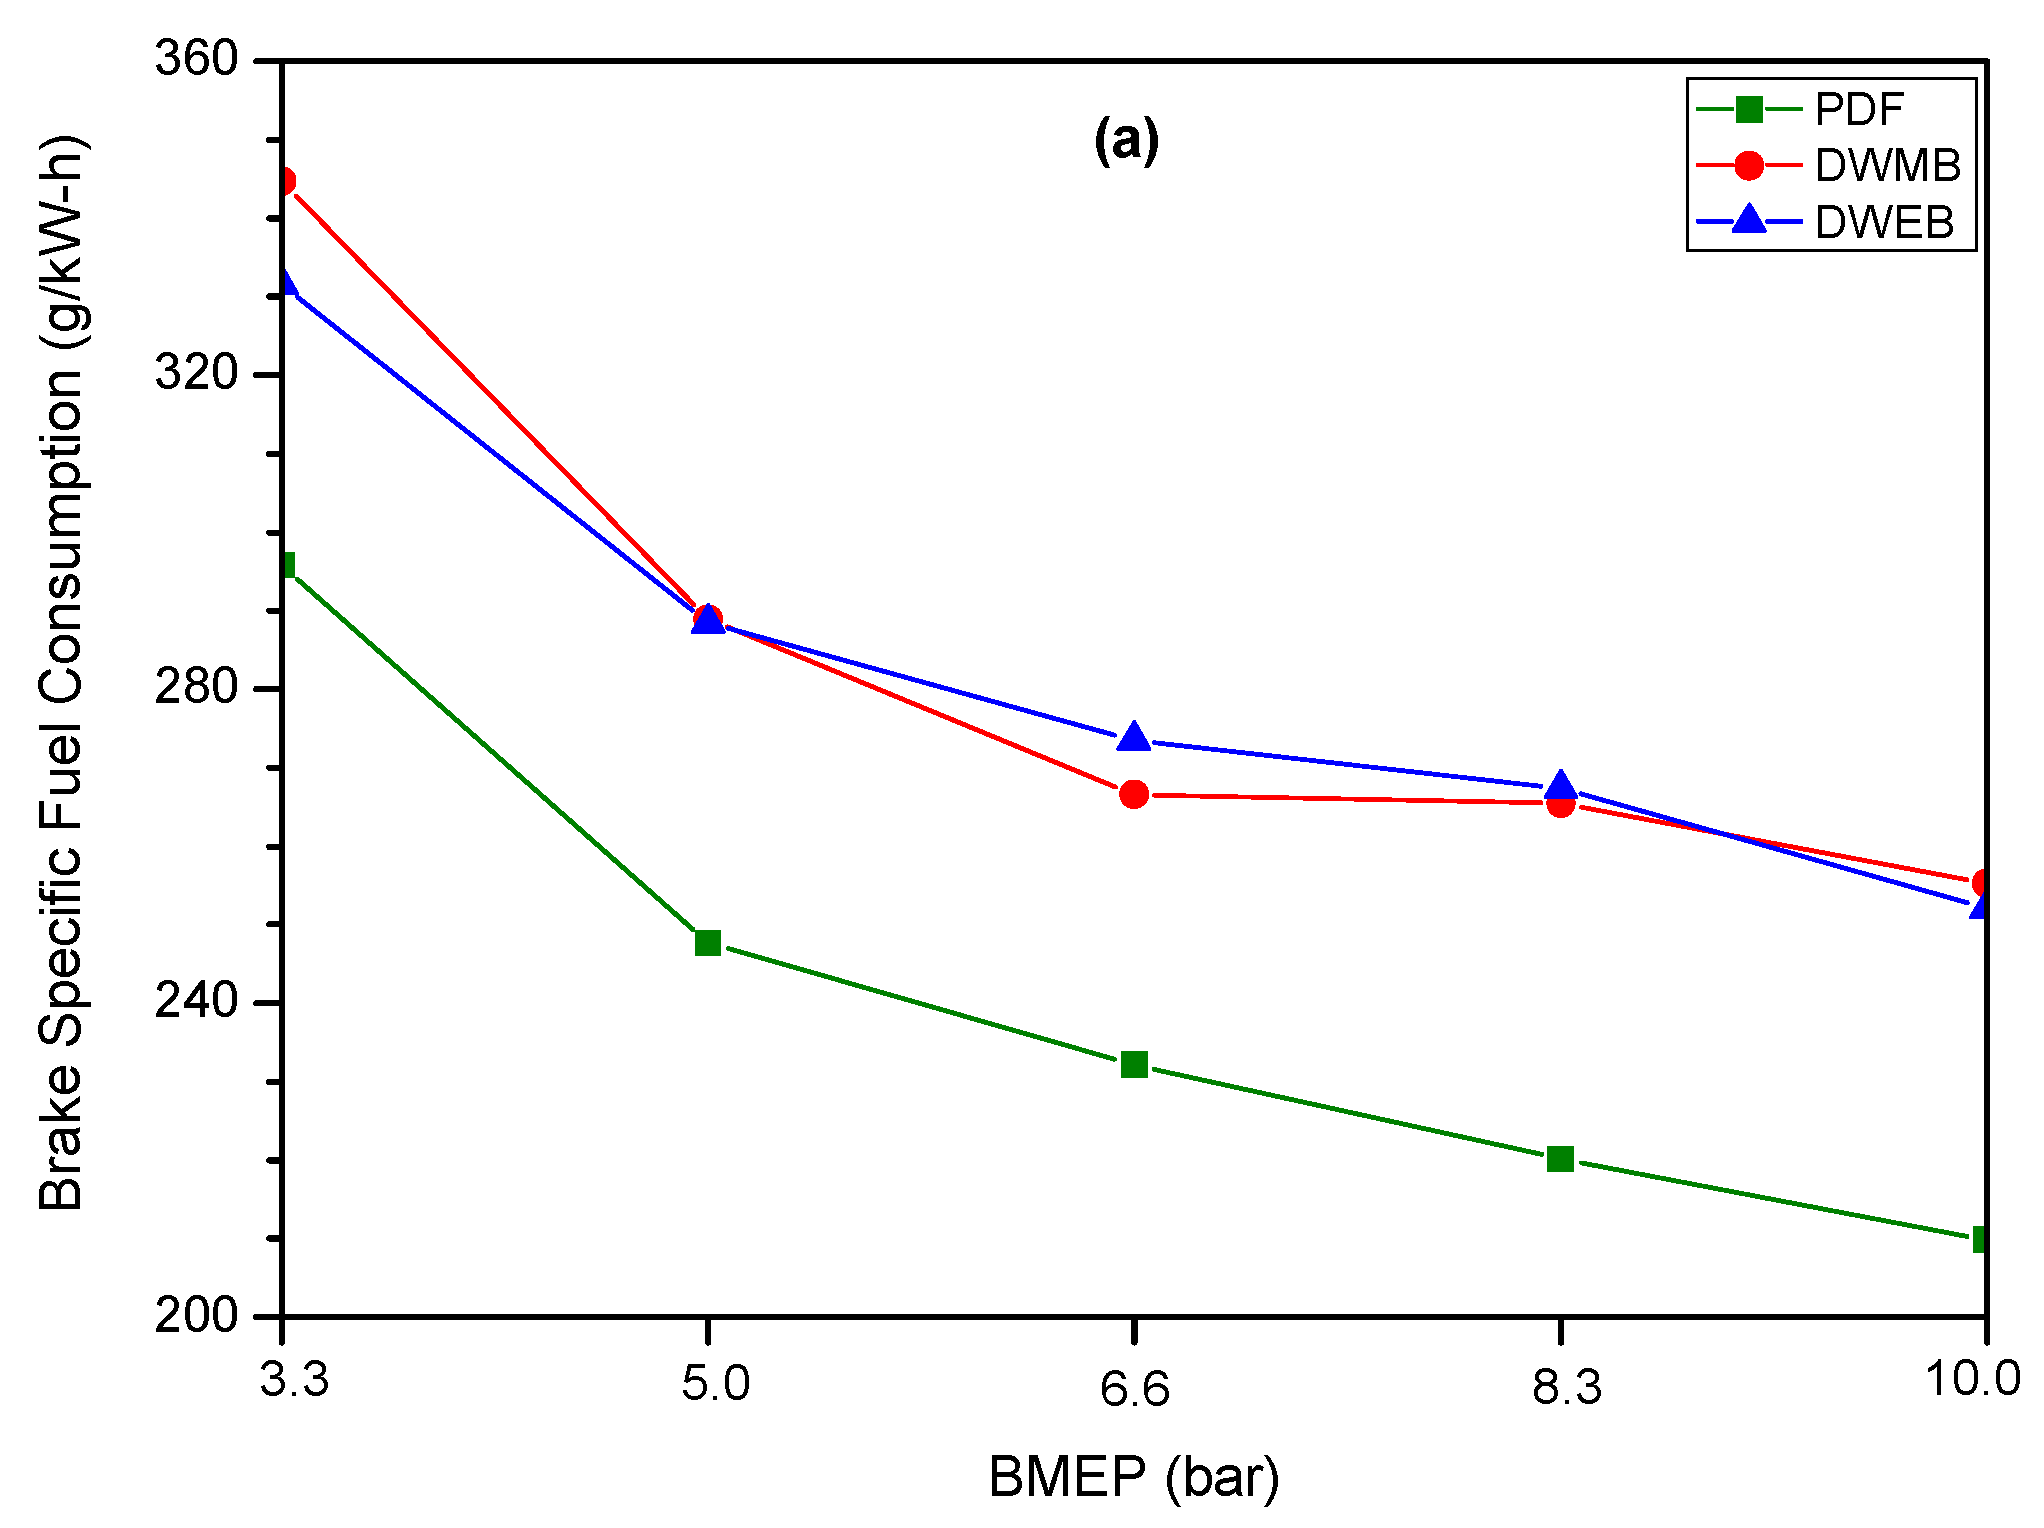
Brake specific fuel consumption (BSFC) is particularly useful when comparing alternative fuels to conventional ones, as it allows objective comparison based on differences in combustion characteristics, energy content, and fuel efficiency [30]. As seen in Figure 2a, BSFCs of all fuels decreased with increasing engine load. When BMEP was increased from 3.3 to 10.0 bar, the decrease in BSFC was 29.07%, 25.95%, and 23.96% for PDF, DWMB, and DWEB, respectively. Although injected fuel mass increases with BMEP, this trend can be explained by the increase in engine effective power, indicating the engine operates more efficiently under higher loads. Furthermore, as engine load increases, more air is introduced into the engine, air turbulence (swirl ratio) improves and also fuel injection pressure increases, enhancing combustion efficiency and decreasing BSFC.
As seen in the graph, PDF exhibited lower BSFCs than microemulsifications at all loads. However, this distinction became more pronounced with BMEP. At 3.3 bar, BSFC of DWMB and DWEB was 16.51% and 12.09% higher than PDF, respectively, while this difference increased to 21.64% and 20.16% at 10.0 bar. However, it is noteworthy that the difference between BSFCs of microemulsification fuels and PDF was greater than the difference between their heating contents (11.81% and 9.16% less calorific value for DWMB and DWEB, respectively). This may be due to emulsification fuels’ relatively high viscosity and density, reducing atomization quality and combustion efficiency. Moreover, lower combustion chamber temperature caused by high latent heat of vaporization of alcohols and WFO’s poor volatility may have also been influential in these results. Comparing microemulsification fuels, it is seen that BSFCs were quite close to each other (the largest difference was 13.07 g/kWh at 3.3 bar). Although the calorific value of DWMB was about 2.92% lower than DWEB, its relatively better viscosity may have compensated for this difference. Ooi et al. [31], Bidir et al. [32], and Kolhe et al. [33] have reported similar results in their articles.

3.1.2. Brake Specific Energy Consumption

Brake specific energy consumption (BSEC) is a key parameter used to assess how efficiently chemical energy of a fuel is converted into useful work. BSEC accounts for fuel’s net heating content, allowing for more accurate comparison between fuels with different calorific values [34]. As Figure 2b depicts, BSECs decreased with increasing BMEP. This may be attributed to improved combustion efficiency and reduced heat losses at higher loads. PDF yielded lower BSECs than microemulsification fuels at all loads, indicating its comparatively better energy efficiency. However, it should be underlined that the difference between BSECs of test fuels was considerably less than BSFCs. For example, the difference between BSEC of DWMB and PDF was 2.99% at 3.3 bar and 7.54% at 10 bar, while the difference between BSFCs was 16.51% and 21.64% at corresponding BMEPs. This can be explained by lower calorific values of emulsification fuels and also by their alcohol and WFO contents, which alter the vaporization and combustion dynamics.
BSECs of DWEB were higher than DWMB at all loads except 3.3 bar, and this difference was clearer than BSFCs. Although DWEB’s calorific value was relatively higher than DWMB, its higher BSECs may be explained by its relatively higher viscosity, which deteriorates atomization and combustion efficiency. Appavu et al. [23], Dhanasekaran and Sriramulu [35], and Qi et al. [36] also reported lower BSECs for PDF.

3.1.3. Brake Thermal Efficiency

Brake thermal efficiency (BTE) indicates the ability of an engine to convert fuel’s chemical energy into useful mechanical work [37]. As given in Figure 2c, BTEs inclined with BMEP. This can be explained by decreasing BSFCs since they are inversely proportional. Furthermore, elevated in-cylinder temperatures–pressures, better swirl ratio, and higher injection pressures enhance evaporation process and air–fuel mixture quality, resulting in increased BTE. Also, lowered frictional and heat losses might also be effective in these results. It is noteworthy that improvement in BTEs with increasing BMEP was more pronounced for PDF. For example, between 3.3 and 10.0 bar, BTE increased by 40.95%, 35.04%, and 31.50% for PDF, DWMB, and DWEB, respectively.
PDF exhibited higher BTEs than emulsification fuels at all BMEPs. At 3.3 bar, BTE of DWMB and DWEB was 2.87% and 1.50% lower than PDF, respectively. This difference increased with load, reaching 6.96% and 8.12% at 10.0 bar. Microemulsification fuels’ lower BTEs may emanate from their relatively higher viscosity, density, and surface tension, deteriorating atomization quality. Also, their lower calorific value, higher latent heat of vaporization, and lower volatility might be influential in these results. Similarly to BSEC, BTEs of DWMB were slightly better than DWEB at all BMEPs except for 3.3 bar. This can be explained by its relatively low viscosity and also by better volatility and lower latent heat of vaporization, resulting in superior atomization, evaporation, and combustion. These results are in accordance with the findings of Waluyo et al. [38], El-Seesy et al. [39], and Sanli et al. [40].

3.2. Injection Characteristics

Injection characteristics of a diesel engine are critically important as they directly affect combustion phenomenon, determining engine performance, fuel economy, noise, vibration, and emissions. In mechanically controlled fuel injection systems (in-line type pump or distributor type pump), the injection process is carried out by mechanically controlling the start or end of injection. However, in electronically controlled fuel injection systems, the injection characteristics are changed very dynamically based on the ECU mapping. Therefore, it is critical to determine in detail how injection characteristics change in fuels with different properties. The test engine utilizes a split injection approach; one pilot injection (before Top Dead Center, bTDC) and one main injection (after Top Dead Center, aTDC). To evaluate injection characteristics, multiple parameters were monitored: start of pilot injection (sPI), end of pilot injection (ePI), pilot injection duration (PID), start of main injection (sMI), end of main injection (eMI), main injection duration (MID), injection amount (IA), and injection rate (IR).
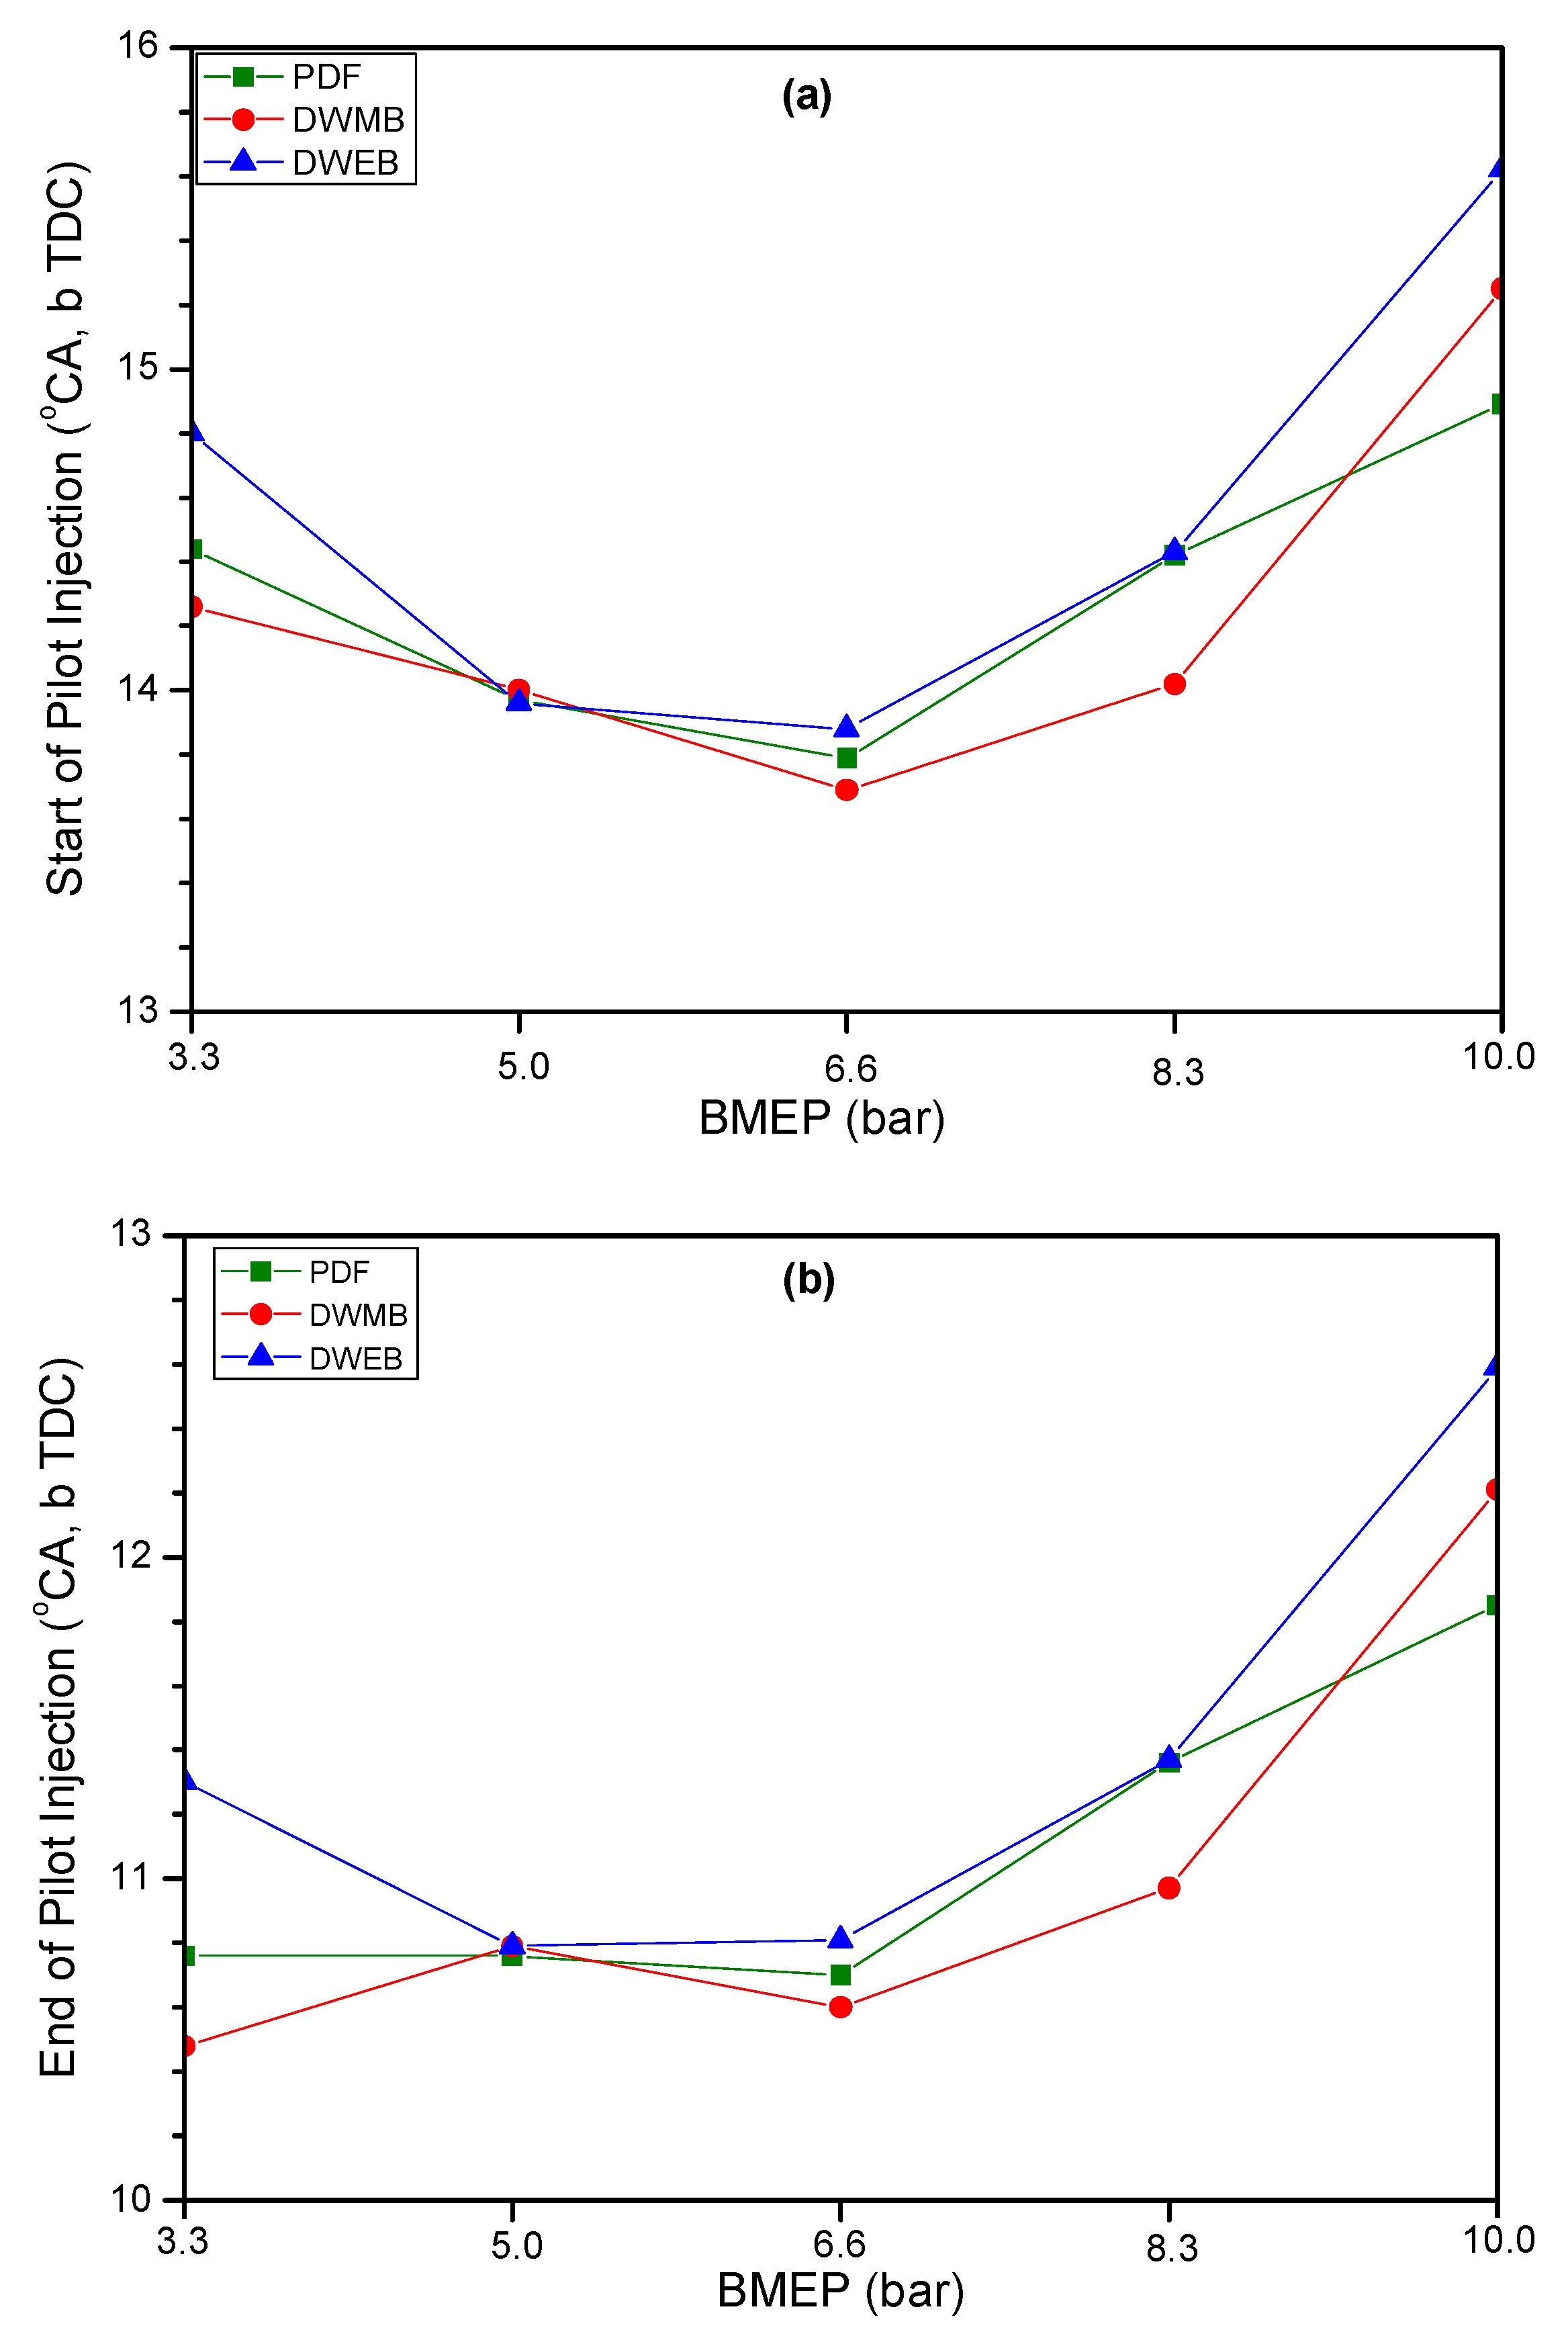
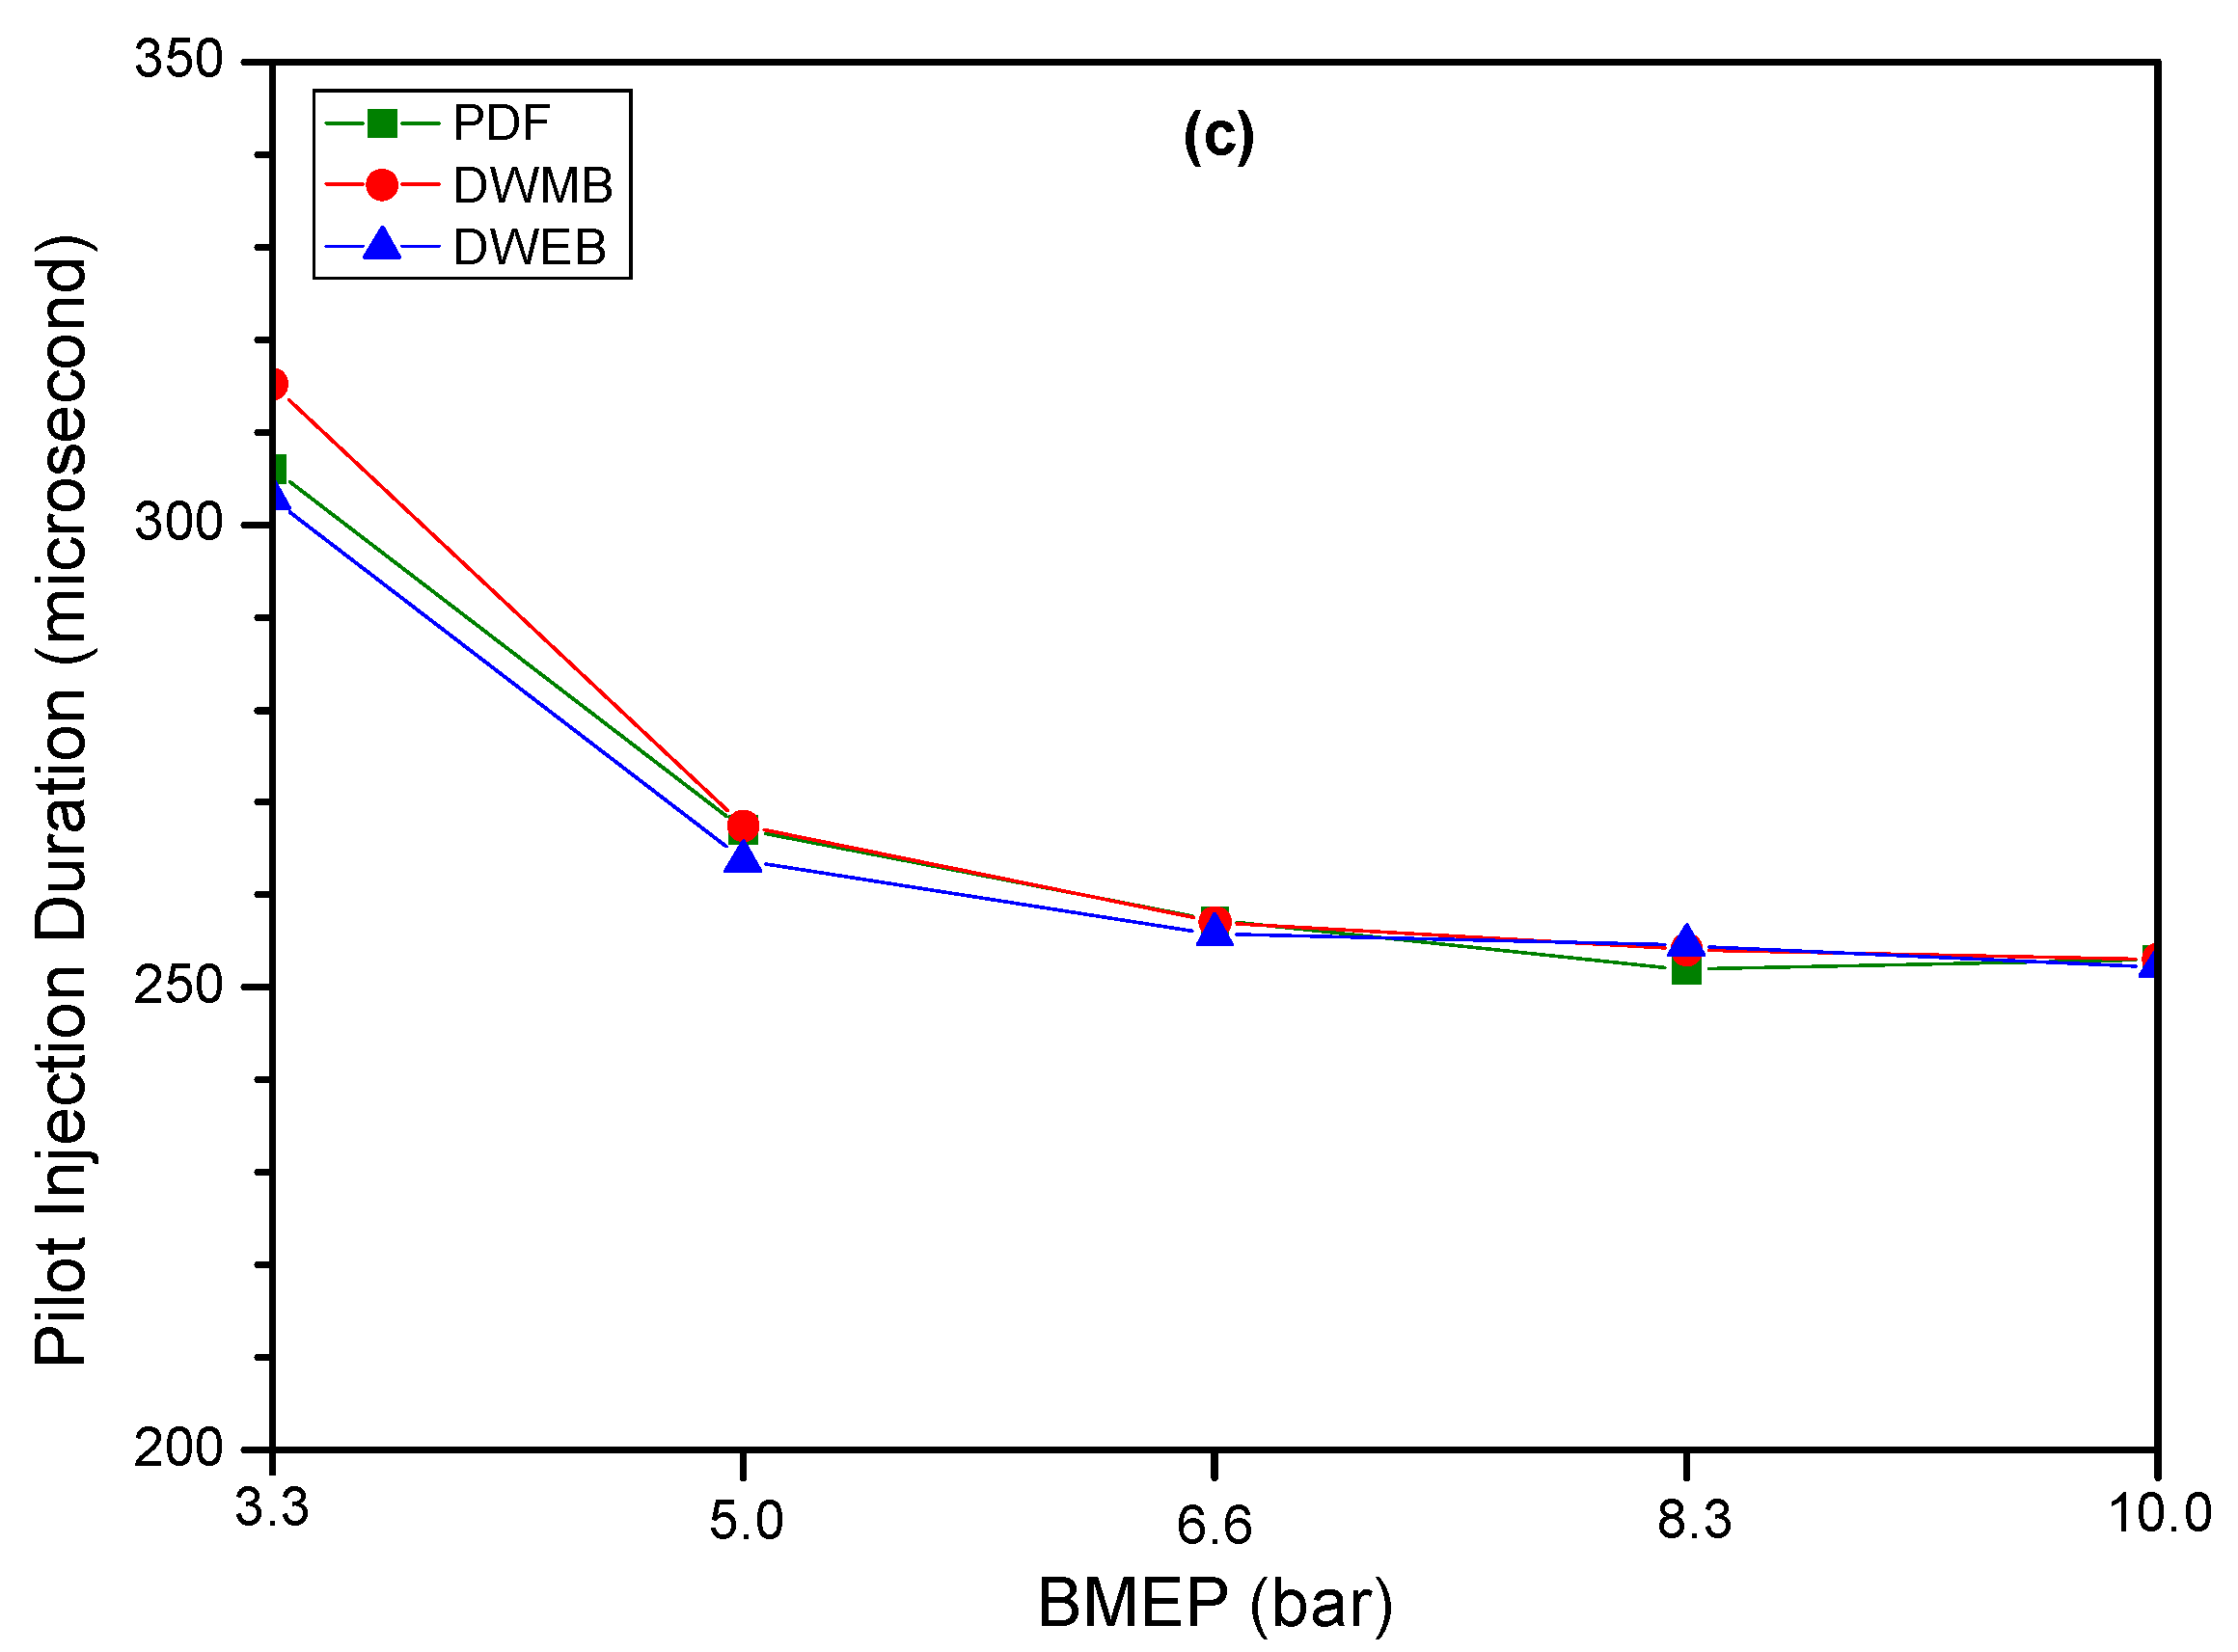
As Figure 3a illustrates, sPI of all fuels advanced up to 6.6 bar and slowed at the last two loads. Among 6.6 and 10.0 bar, the change in sPI was 1.10, 1.56, and 1.74 °CA for PDF, DWMB, and DWEB, respectively. At 3.3, 5.0, and 6.6 bar, ePI remained almost constant but advanced with BMEP. The advance in ePI timing between the last three BMEPs was 1.15, 1.61, and 1.78 °CA for PDF, DWMB, and DWEB, respectively. The similarity between slowness in sPI and advance in ePI with increasing BMEP is remarkable. While sPI and ePI timings of test fuels were very close at low BMEPs, the difference between PDF and emulsification fuels became significant with BMEP. For example, at 5.0 bar, sPI and ePI of all fuels were almost the same, while there was almost 1 °CA difference at 10.0 bar. Comparing emulsification fuels, it is seen that sPI and ePI timings of DWEB were more advanced than DWMB at all loads (except 5.0 bar). PIDs for all fuels decreased up to 6.6 bar, and then remained almost constant. Between 3.3 and 10.0 bar, the decrease in PID was 53 μs, 62.09 μs, and 50.64 μs for PDF, DWMB, and DWEB, respectively. At 3.3 bar, PIDs of emulsification fuels (especially DWMB) were slightly higher than PDF, whereas they were almost the same at higher BMEPs.
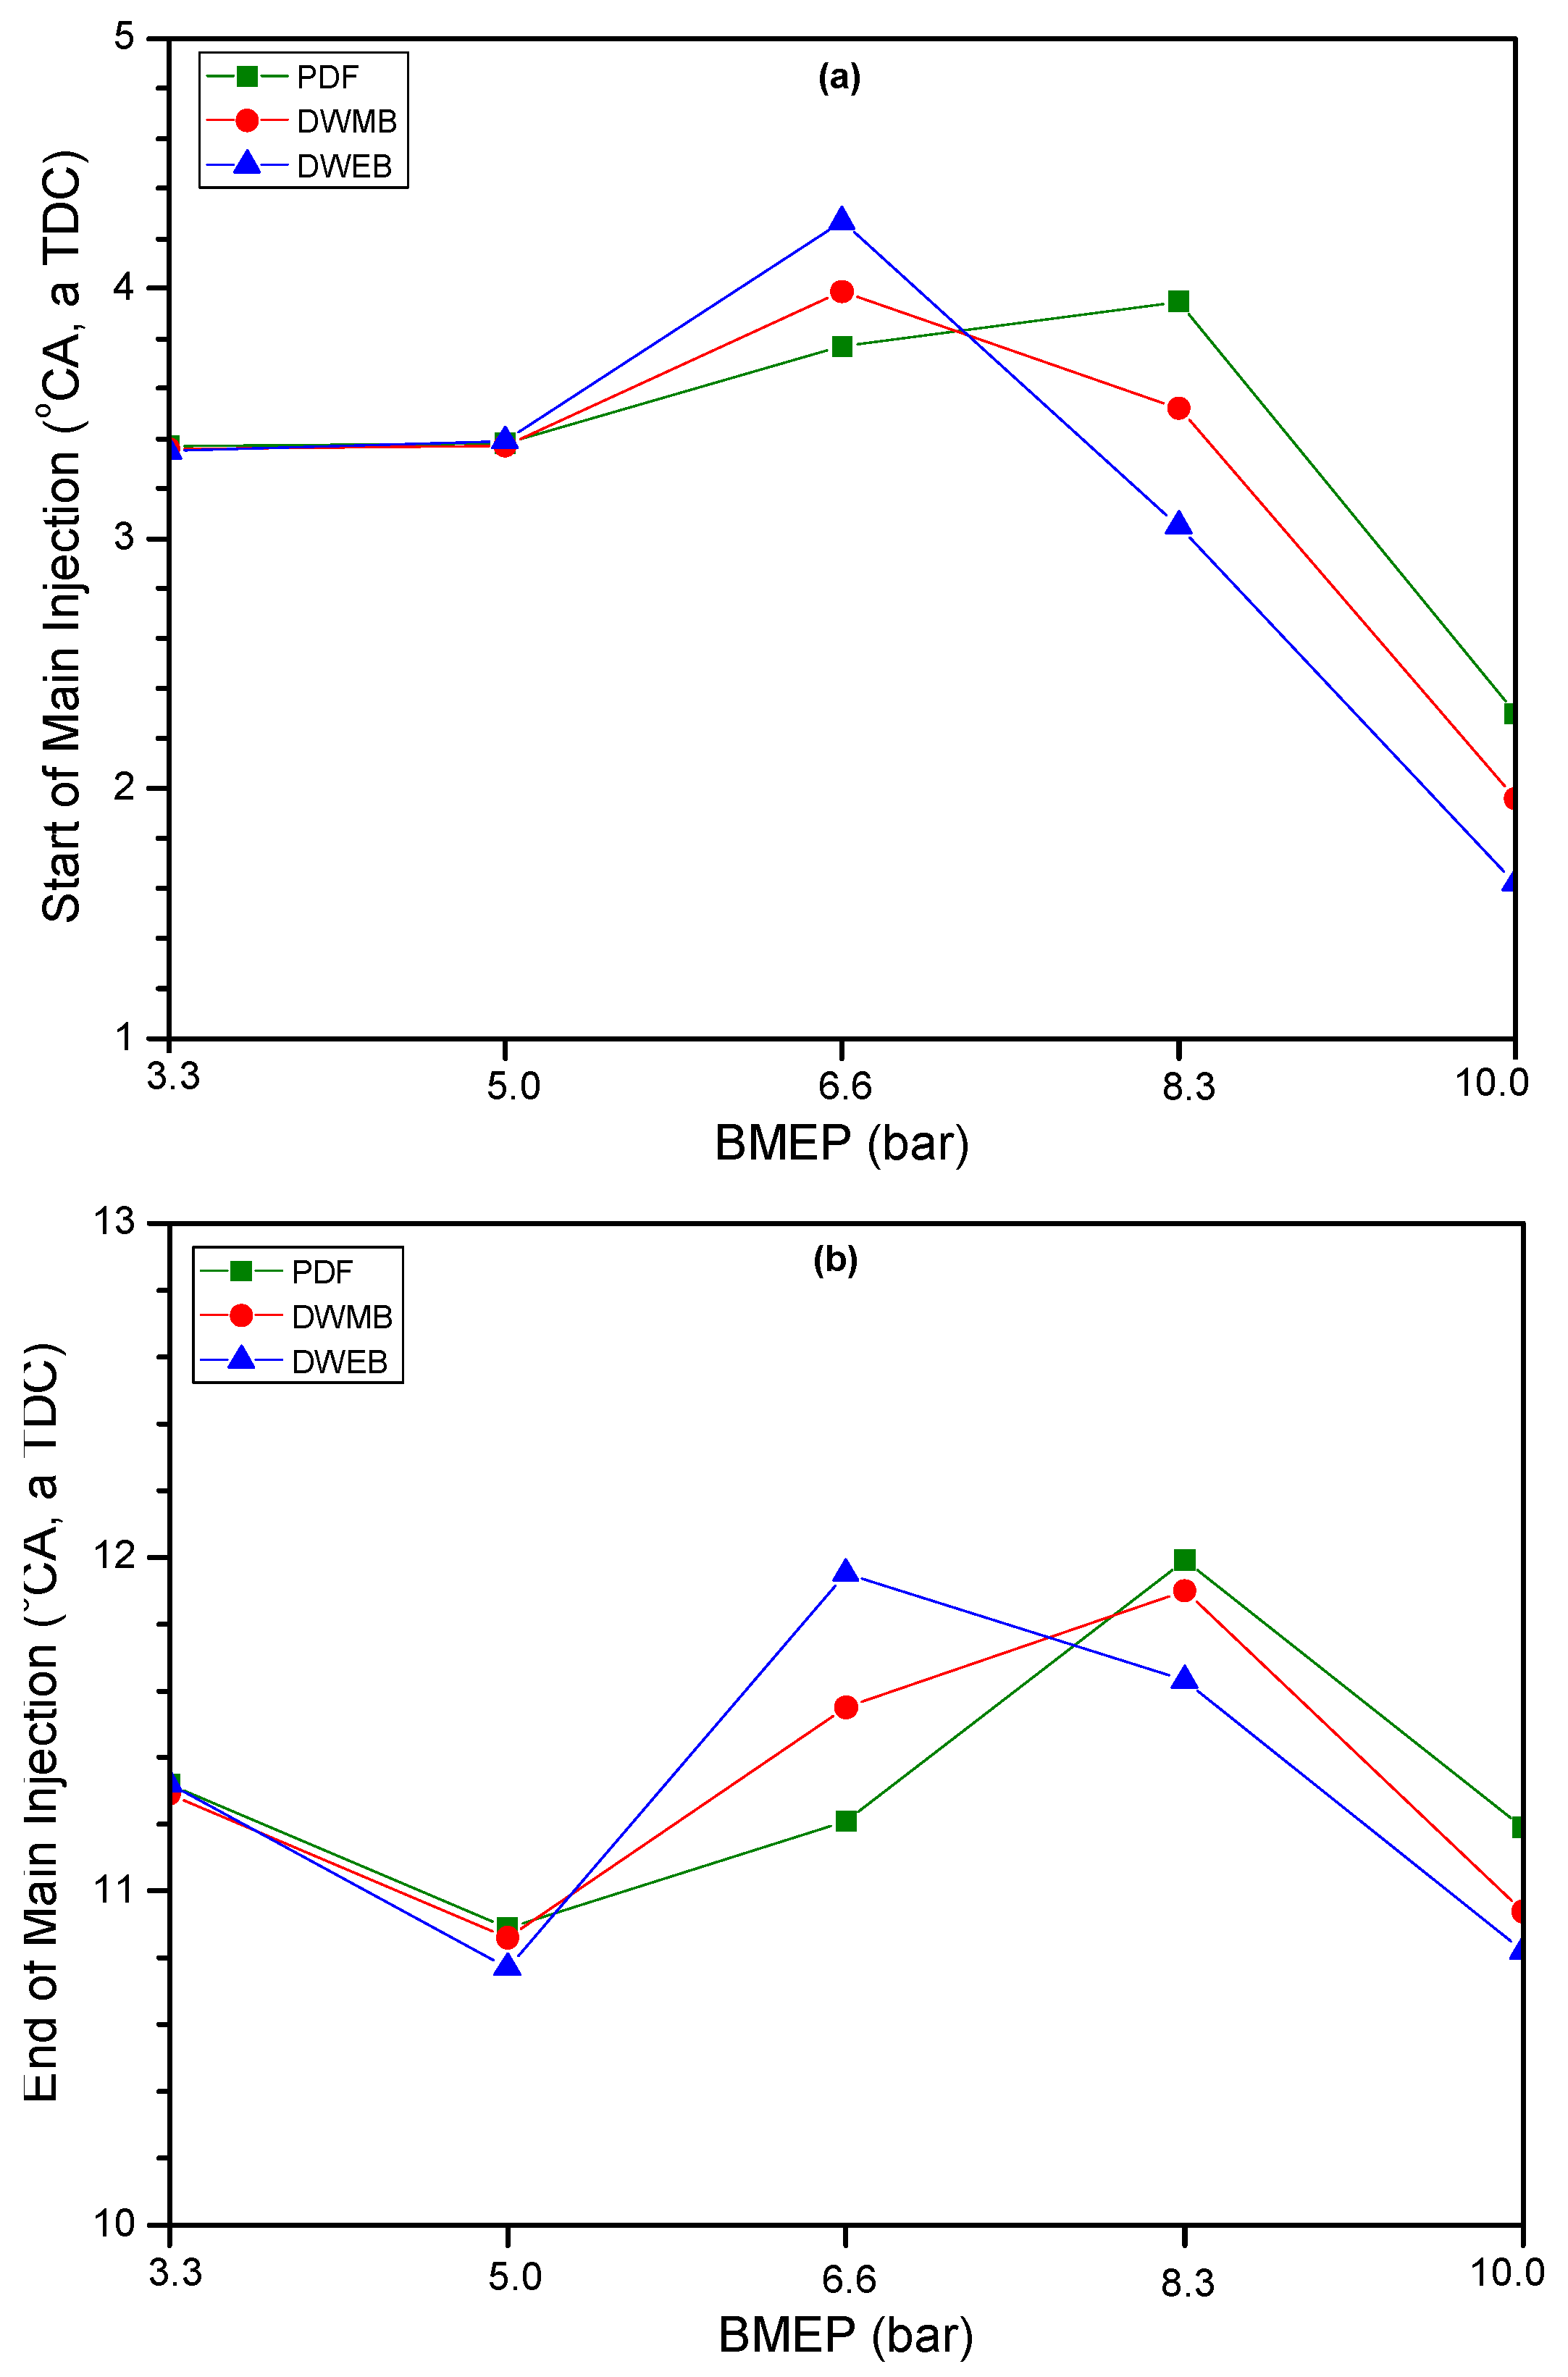
As seen in Figure 4a,b, sMI and eMI timings were generally similar. With increasing BMEP, main injection timings advanced. As load increases, more energy is required and therefore more fuel needs to be injected. To finish the combustion as close to TDC as possible, electronic control unity (ECU) has advanced sMI and eMI. At 3.3 and 5.0 bar, sMI and eMI were identical; however, as BMEP increased, main injection timings of emulsification fuels became more advanced. Since calorific values of DWMB and DWEB are lower, more fuel mass must be injected. Consequently, ECU advanced main injection timings of emulsification fuels to finish combustion of more fuel closer to TDC, where pressures and temperatures are higher. Quaternary fuels’ relatively earlier injection timings affect combustion and emission characteristics, and this will be discussed in related sections. At low BMEPs, main injection timings of emulsification fuels were very close, while as BMEP increased, sMI and eMI of DWEB were slightly more advanced than DWMB.
MIDs decreased between 3.3 and 5.0 bar and increased at higher loads. When BMEP was doubled from 5.0 to 10.0 bar, the increase in MIDs was 78.2, 87.36, and 102.38 µs for PDF, DWMB, and DWEB, respectively. As more energy must be introduced to the engine at high loads, longer MIDs are understandable. The effect of decrease in PID and increase in MID on combustion is clearly seen from the variation of peaks in cylinder pressure graphs. This can be explained by the fact that with increasing BMEP, combustion in the test engine shifts from a premixed-controlled combustion mode to a diffusion-controlled combustion mode. At 3.3 and 5.0 bar, MIDs were very close, but emulsification fuels were injected in longer durations at higher BMEPs. This situation may be explained by the fact that BSFCs of DWMB and DWEB are higher due to their relatively lower heating values, and the difference widened as load increased. Except for 5.0 bar, MIDs of DWEB were higher than DWMB at all BMEPs. Despite DWEB’s heating value being relatively higher than DWMB, its higher MIDs and their similarity with BSFC and especially BSEC should be strongly emphasized.
As seen in Figure 4d, IAs increased steadily with increasing load. Between 3.3 and 10.0 bar, IA increased 2.13 times for PDF, 2.22 times for DWMB, and 2.28 times for DWEB. Throughout all operating conditions, emulsified fuels’ IAs were higher than PDF, and this difference increased with BMEP. For example, IA of DWMB was 16.51% higher than PDF at 3.3 bar, while this difference increased to 21.64% at 10.0 bar. This may be due to quaternary fuels’ relatively lower heating contents. Also, since injection pressures increase with BMEP, the negative effect of relatively high viscosity, surface tension, and low volatility of emulsified fuels on performance may have increased, resulting in more fuel consumption.
IRs significantly increased with BMEP (Figure 4e). For example, IR of PDF increased from 13.31 mg/ms at 3.3 bar to 27.63 mg/ms at 10.0 bar, while it increased from 15.40 mg/ms to 33.36 mg/ms and from 14.96 mg/ms to 32.39 mg/ms for DWMB and DWEB fuels, respectively. Since fuel mass that needs to be injected increases with BMEP, ECU advances injection timings and increases IR (stands for injection pressure) to complete combustion as close as possible to TDC. Microemulsification fuels’ IRs were greater than PDF at all conditions. However, this difference increased with BMEP. For example, the difference between the IR of PDF and DWMB was 2.08 mg/ms at 3.3 bar and increased to 5.73 mg/ms at 10.0 bar. Due to emulsification fuels’ low calorific values, the accelerator pedal must be pressed more. In order to respond to the position of accelerator pedal, ECU has increased IRs for these fuels [41].

3.3. Combustion Characteristics

As combustion characteristics directly influence noise, vibration, performance, and emissions, their detailed analyzing is crucial. Due to split injection, there are two peaks in cylinder gas pressure curves (first peak from pilot injection and second peak from main injection).
As Figure 5 illustrates, in-cylinder gas pressures increased with BMEP. The higher injection pressures and effective swirl at high loads enhance air–fuel formation and mixture homogeneity. Since the test engine is a turbocharged engine, more air will enter cylinders with increasing BMEP, resulting in better combustion and higher temperatures–pressures. While the pressures reached at the first peak were higher for the first three BMEPs, higher pressures were obtained at the second peak at 8.3 bar (for emulsification fuels) and especially at 10.0 bar. As mentioned before, with increasing BMEP, PID decreased whereas MID significantly increased. This situation can explain the pattern change in pressure curves. Although there was no significant difference between pressures obtained at the first peak (almost the same pressures at 8.3 bar and especially at 10 bar), higher pressures were reached with emulsification fuels at the second peak (except for 3.3 bar), and this difference became more pronounced with load. This result may be emanated from earlier injection timing for quaternary fuels and also the change in IR, IA, and MID. The difference between pressures of emulsified fuels (except 3.3 bar) was considerably less than the difference between them and PDF. Especially at 10 bar, almost the same pressure curves were obtained with DWEB and DWMB.
Table 6 shows the maximum in-cylinder gas pressure (Pmax) values and crank angles (°CAPmax) at which these pressures were obtained. Although there was no significant difference between Pmax values at the first four BMEPs, higher Pmax was obtained with microemulsification fuels at 10.0 bar. This may be because more fuel was injected at higher pressures for a longer time with DWEB and DEMB. Despite the change in Pmax values, °CAPmax values were almost the same. For example, the difference between °CAPmax was just 0.6 °CA at 10.0 bar, where the greatest difference between Pmax values occurred. This can be explained by ECU modifying the injection characteristics to achieve maximum mechanical efficiency.
The higher heat release rate (HRR) was attained with increasing BMEP. The effect of the test engine’s split fuel injection strategy is clearly visible in HRR curves. The pilot injection-driven change in HRR, which decreases with increasing load and almost disappears at 10.0 bar, and also the plateau in graph, indicates that combustion in the test engine shifts from premixed-controlled combustion to diffusion-controlled combustion as BMEP increases [42]. With increasing load, combustion started at earlier crank angles for all fuels. At the first three BMEPs, the start and end of combustion were quite similar, while at 8.3 and 10.0 bar, they were earlier for emulsification fuels. This may have originated from earlier injection timings and injection pressures with these fuels. This situation may also affect the increased BSFC and reduced BTE values of emulsified fuels.
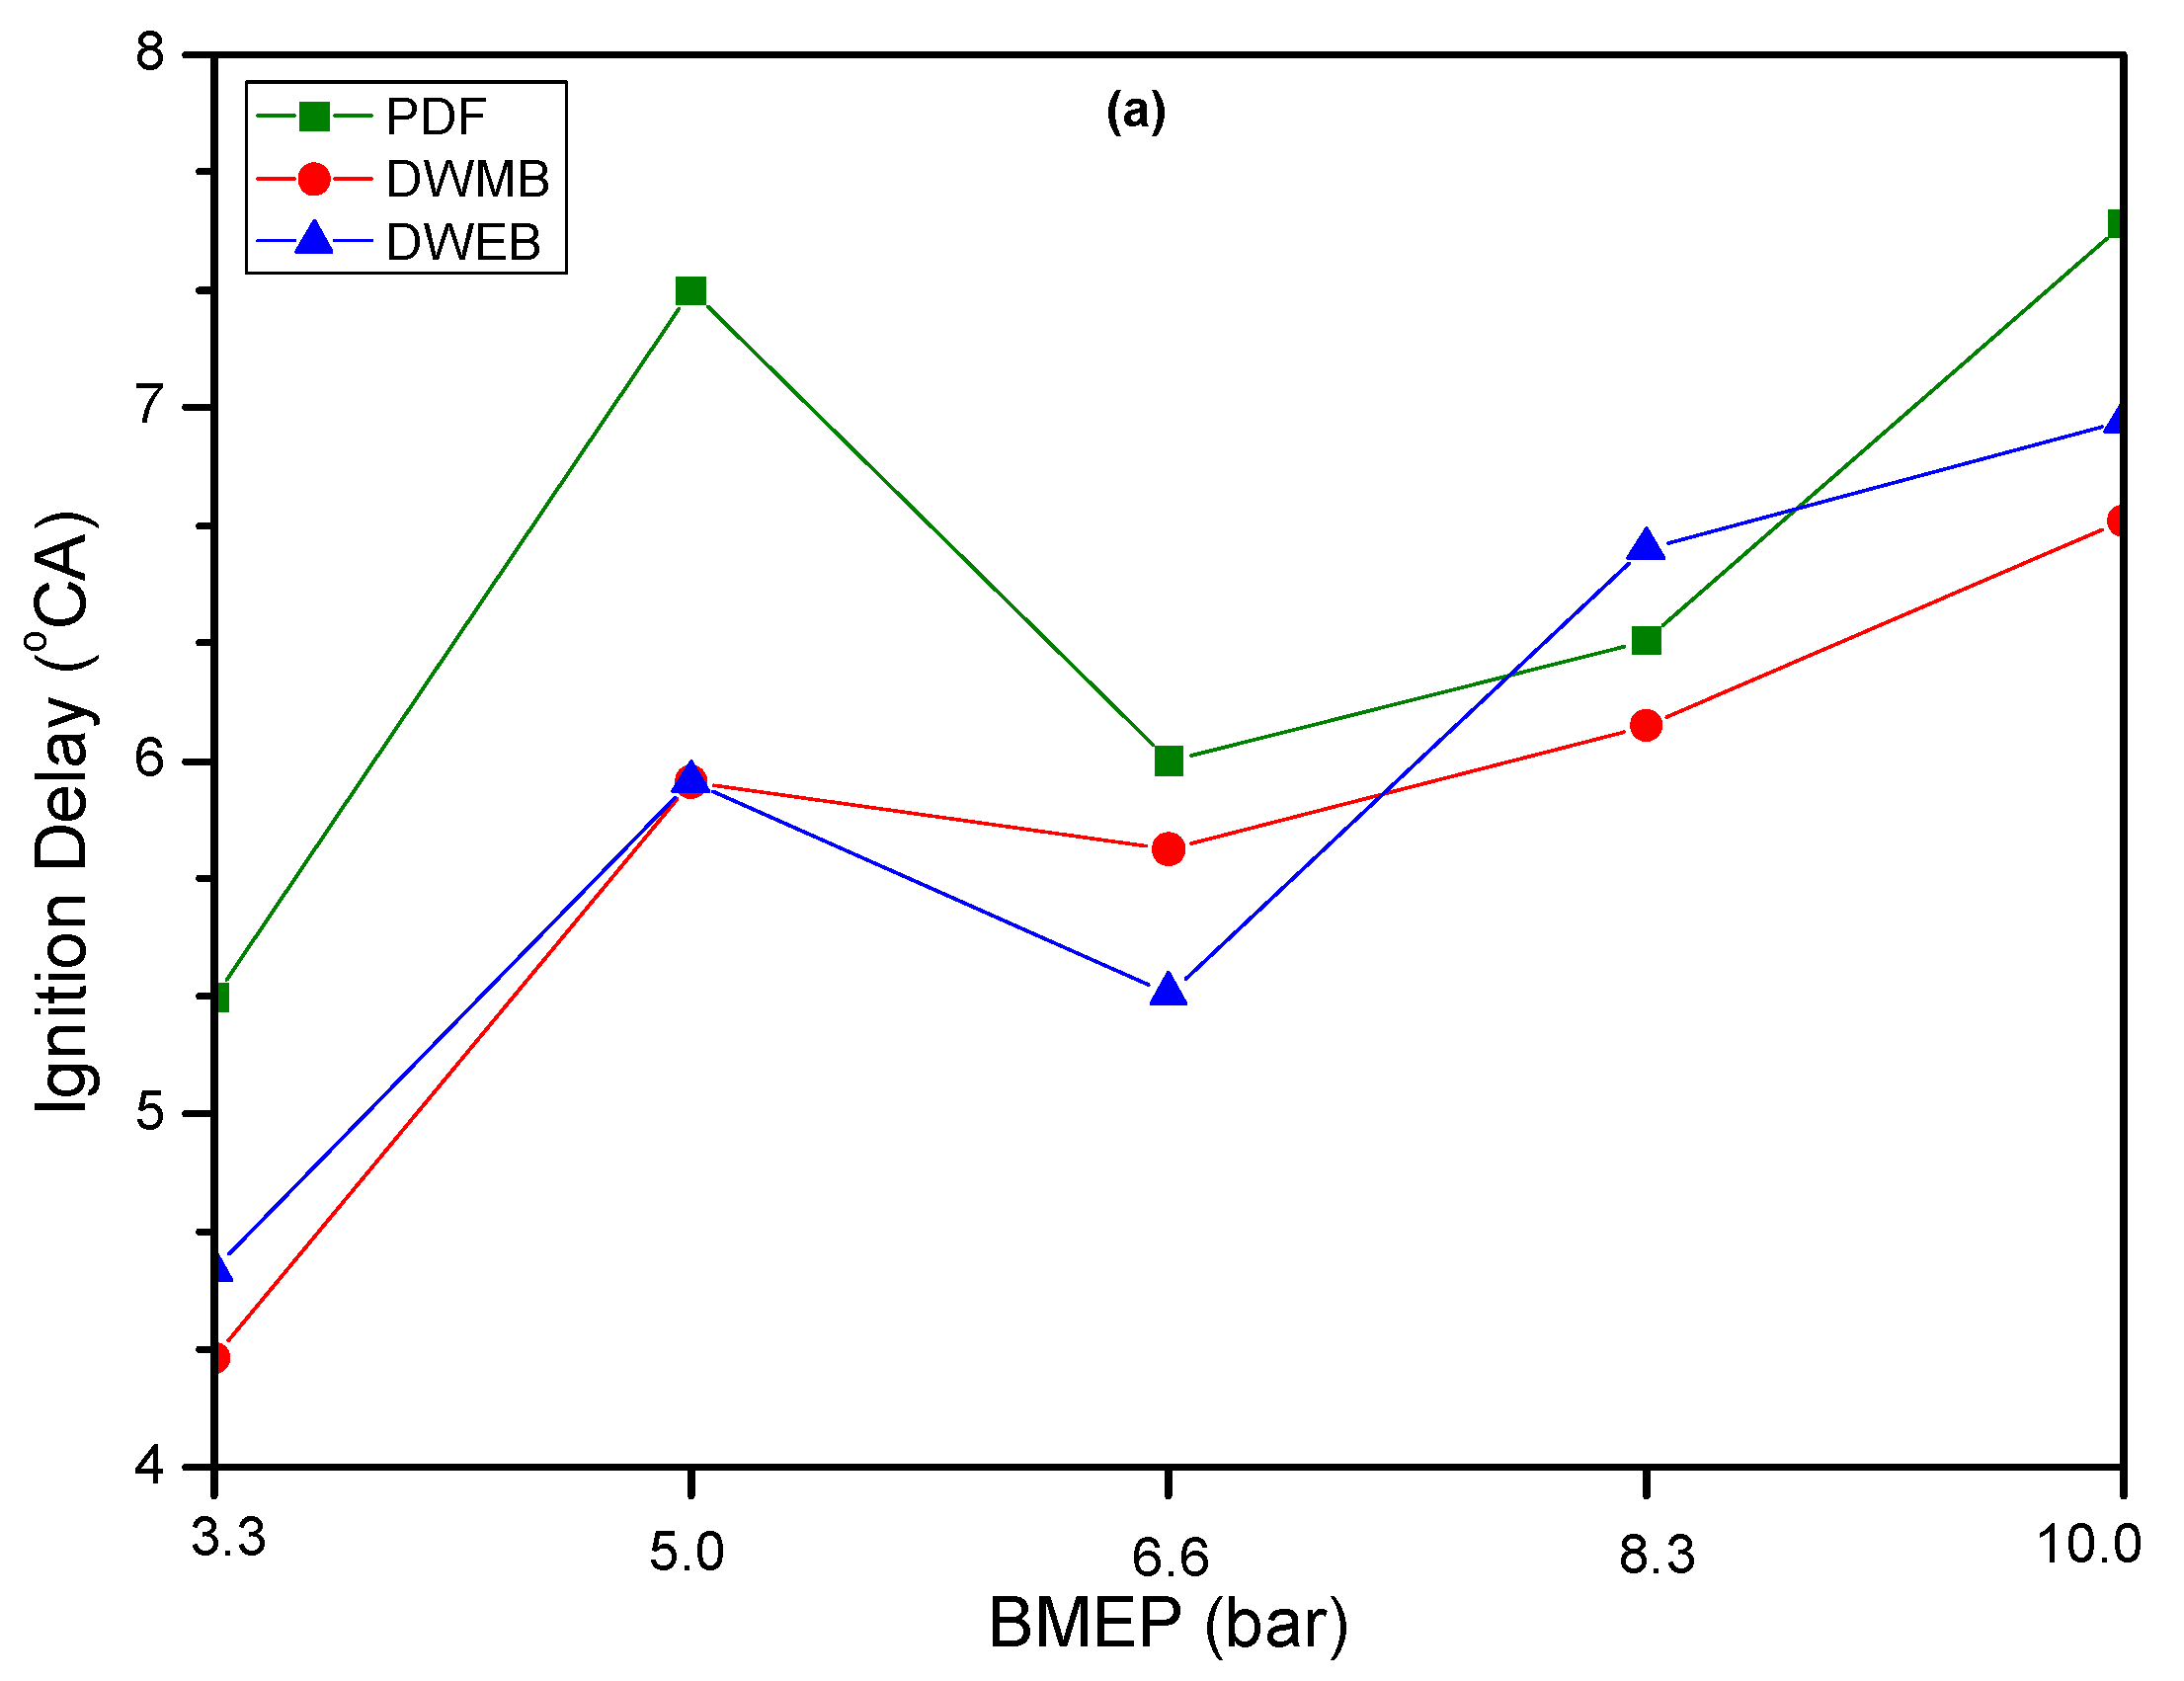
As seen in Figure 6a, ignition delay (ID) periods increased with BMEP for all fuels except the decrease at 6.6 bar. Despite parameters reducing ID, such as higher in-cylinder temperatures, injection pressures, air mass flow, and more effective swirl reached at high BMEPs, longer ID can be explained by significant increases in sMI and IA.
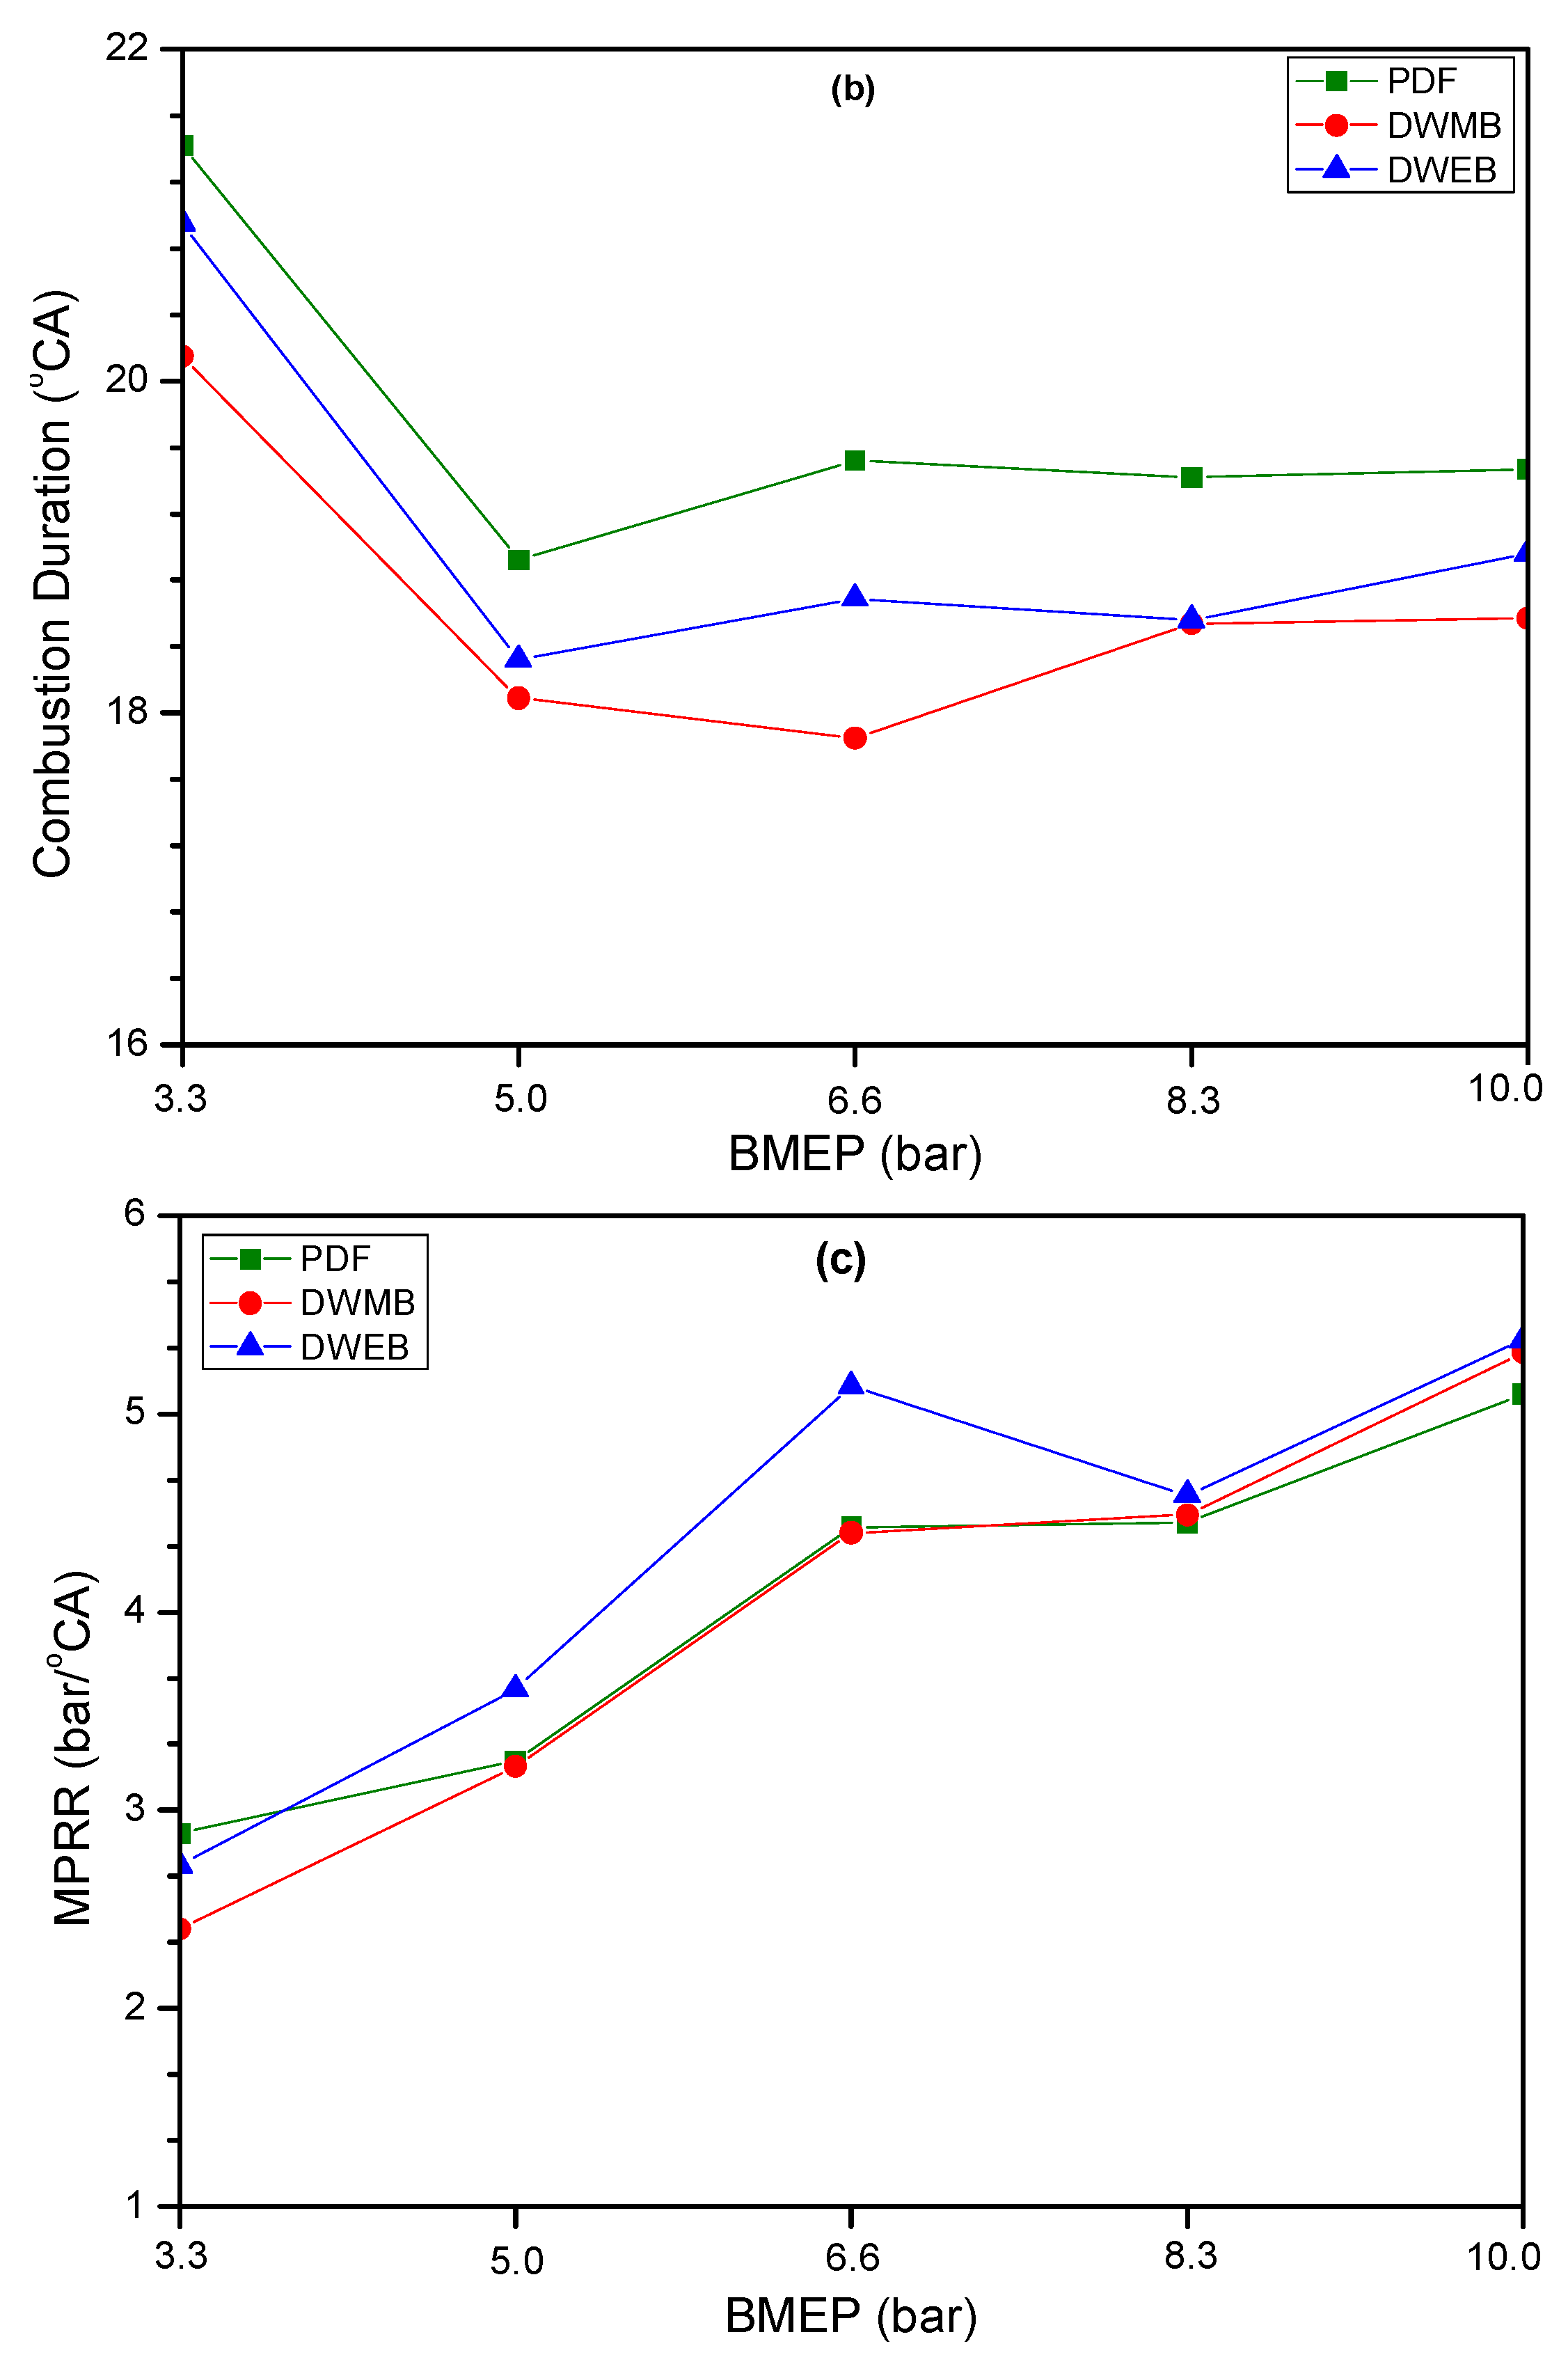
For all fuels, combustion duration (CD) values, which were maximum at 3.3 bar, decreased at 5.0 bar and then remained almost constant (Figure 6b). The eMI and MID graphs (change between 3.3 bar and 5.0 bar; see Figure 4b,c) and CD values are compatible with each other. Therefore, this pattern in CDs may be caused by the changes in main injection characteristics. Emulsification fuels’ CDs were lower than PDF at all BMEPs. Despite quaternary fuels’ higher BSFCs, their shorter CDs might be explained by earlier main injection timings and higher IRs. Also, quaternary microemulsification fuels’ inherent oxygen contents and relatively higher laminar flame speeds may have reduced their CDs. It was observed that DWMB burned slightly faster than DWEB at all loads. This situation is consistent with MID and IR results. Burning more fuel in less time significantly impacts exhaust emissions (especially NOx) [43], and this will be discussed in the next section.
The rapid increase in cylinder pressures during small crankshaft rotation angles leads to a rough running engine [44]. The maximum pressure rise rate (MPRR) of all fuels increased with BMEP (Figure 6c). MPRRs of DWEB were higher than DWMB and PDF. This is consistent with HRR, sMI-eMI timings, and MIDs. However, it should be noted that the difference between MPRRs of test fuels (excluding 6.6 bar) was less than 1 bar/°CA.

3.4. Exhaust Emission Characteristics

3.4.1. CO Emissions

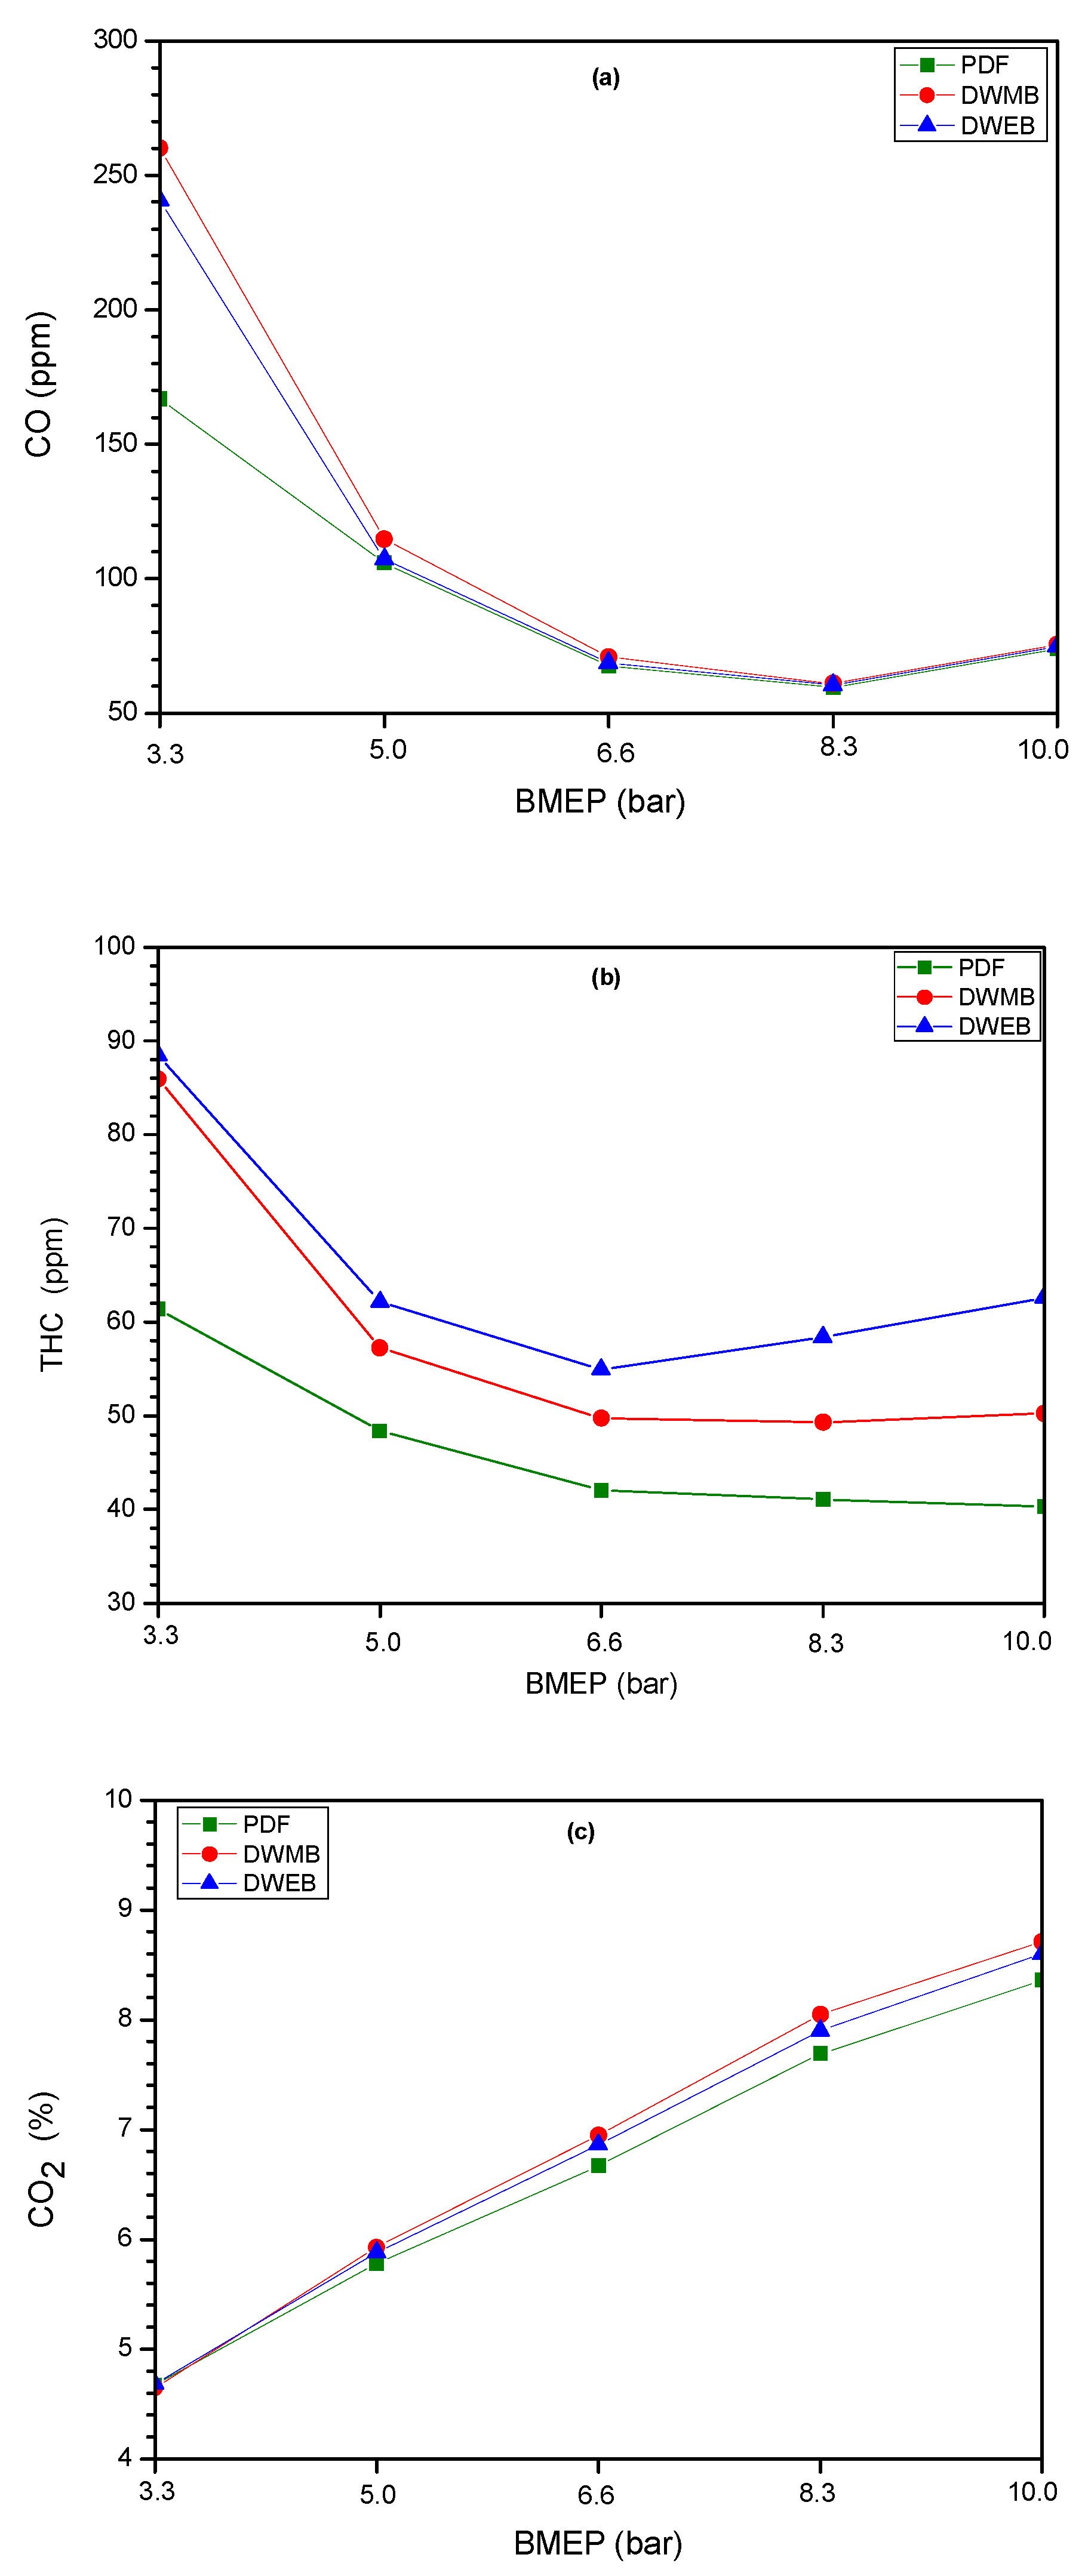
The main reasons for CO emissions are air excess ratio (λ), combustion temperature-duration, injection timing–pressure, engine operating conditions, fuel composition, and air–fuel mixing quality [45]. As Figure 7a depicts, CO emissions, which were at maximum at 3.3 bar, decreased until 8.3 bar and increased slightly at 10.0 bar. Although λ values consistently decreased (Table 7), declining CO emissions may be attributed to elevated temperatures and increased air mass. Additionally, higher injection pressures, earlier injection timing, enhanced turbulence, and improved vaporization may reduce CO. The increase at 10.0 bar may be due to decreasing CD and also the presence of highly fuel-rich zones within the combustion chamber.
The biggest difference between CO emissions was seen at 3.3 bar. This gap diminished significantly at 5.0 bar and then became nearly negligible. At low BMEPs, effects of fuel injection pressure, air mass, swirl, and gas temperatures–pressures are generally limited [46]⁠. Therefore, emulsified fuels’ relatively higher viscosity and surface tension impair atomization, resulting in larger fuel droplets and uneven fuel distribution. Moreover, due to high latent heat of evaporation of alcohols, a greater amount of thermal energy is extracted from the combustion chamber, reducing in-cylinder temperatures. Together with the low volatility of WFO ingredients of emulsified fuels, lower temperatures may hinder complete fuel evaporation and lead to poor air–fuel mixing.
These factors may explain elevated CO emissions of quaternary fuels at low BMEPs. The reducing effect of inherent oxygen contents of emulsification fuels on CO emissions was offset by their worse spray formation and poor evaporation performance. However, at high loads, superior combustion conditions diminish negative influence of physico-chemical fuel properties, resulting in similar CO emissions.
CO emissions of DWMB were slightly higher than DWEB. This difference was more pronounced at 3.3 and 5.0 bar but decreased considerably at higher BMEPs. This may be explained by DWMB’s relatively low cetane number and high latent heat of vaporization, both of which complicate evaporation and self-ignition, resulting in poor combustion [47]. Additionally, DWMB’s relatively lower λ values at low engine loads might also be influential on its higher CO emissions.

3.4.2. THC Emissions

THC emissions are generally caused by flame extinction in extremely rich or extremely poor local zones. Also, engine operating conditions, engine design parameters, and fuel properties including cetane number, viscosity, density, surface tension, and volatility significantly affect THC formation [48].
As Figure 7b illustrates, between 3.3 and 6.6 bar, THC emissions decreased, but PDF and emulsification fuels showed different trends at subsequent loads. While THC emissions from PDF continued to decline, those from emulsified fuels increased. However, in general, all fuels’ THC emissions decreased significantly between lowest and highest BMEP (34.77% for PDF, 41.56% for DWMB, and 29.24% for DWEB). This may be explained by increasing in-cylinder temperatures–pressures, more air mass, improved turbulence, high injection pressure, and earlier fuel injections, all of which enhance air–fuel mixture homogeneity within the combustion chamber.
Quaternary fuels’ THC emissions were higher than PDF at all loads. It should be strongly highlighted that the biggest difference between PDF and quaternary fuels’ emissions was observed in THC emissions. The difference between THC emissions of PDF and DWMB, which was 39.94% at 3.3 bar, decreased to 24.61% at 10.0 bar, while for DWEB it increased from 44.04% to 55.30% at corresponding BMEPs. In addition to emulsified fuels’ low cetane number and volatility, high viscosity, surface tension, and latent heat of vaporization, their glycerol contents (since WFO is not converted to biodiesel) may also lead to high THC emissions. Moreover, the effect of emulsified fuels’ shorter CDs on higher THC emissions should also be considered.
THC emissions of DWEB were higher than DWMB at all BMEPs. However, this difference was especially increased at the last two loads (from 2.93% at 3.3 bar to 24.63% at 10.0 bar). This may be due to DWEB’s relatively high viscosity and surface tension. Furthermore, DWEB was injected at earlier crank angles, with lower pressure for longer duration. This slight difference in injection characteristics may also have contributed to high THC.

3.4.3. CO2 Emissions

CO2 emission is non-toxic, but its accumulation in the atmosphere is a major cause of global warming [49]. CO2 emission is directly proportional to fuel’s carbon content, oxygen concentration in the combustion zone, and fuel consumption [50]. As given in Figure 7c, CO2 emissions of all fuels inclined dramatically with increasing load. When BMEP increased from 3.3 to 10.0 bar, CO2 emission increased 1.79 times for PDF, 1.87 times for DWMB, and 1.84 times for DWEB. Increased in-cylinder pressures–temperatures, more air and fuel mass, effective turbulence, and higher injection pressure may have been influential on this increment.
At 3.3 bar, CO2 emissions were almost the same, while the difference increased with BMEP and reached its highest value at 10.0 bar (the difference was 4.19% for DWMB and 2.87% for DWEB). Emulsification fuels’ high CO2 emissions may be explained by their high fuel consumption, high injection pressures, and longer injection durations and inherent oxygen content. Except for 3.3 bar, DWMB’s CO2 emissions were higher than DWEB, and this difference increased with BMEP. This may be due to the higher oxygen content of methanol compared to ethanol. Also, the relatively low viscosity of DWMB compared to DWEB may have improved combustion, resulting in more CO2. The consistency between THC and CO2 emissions, which are opposite to each other, is remarkable.

3.4.4. NOx Emissions

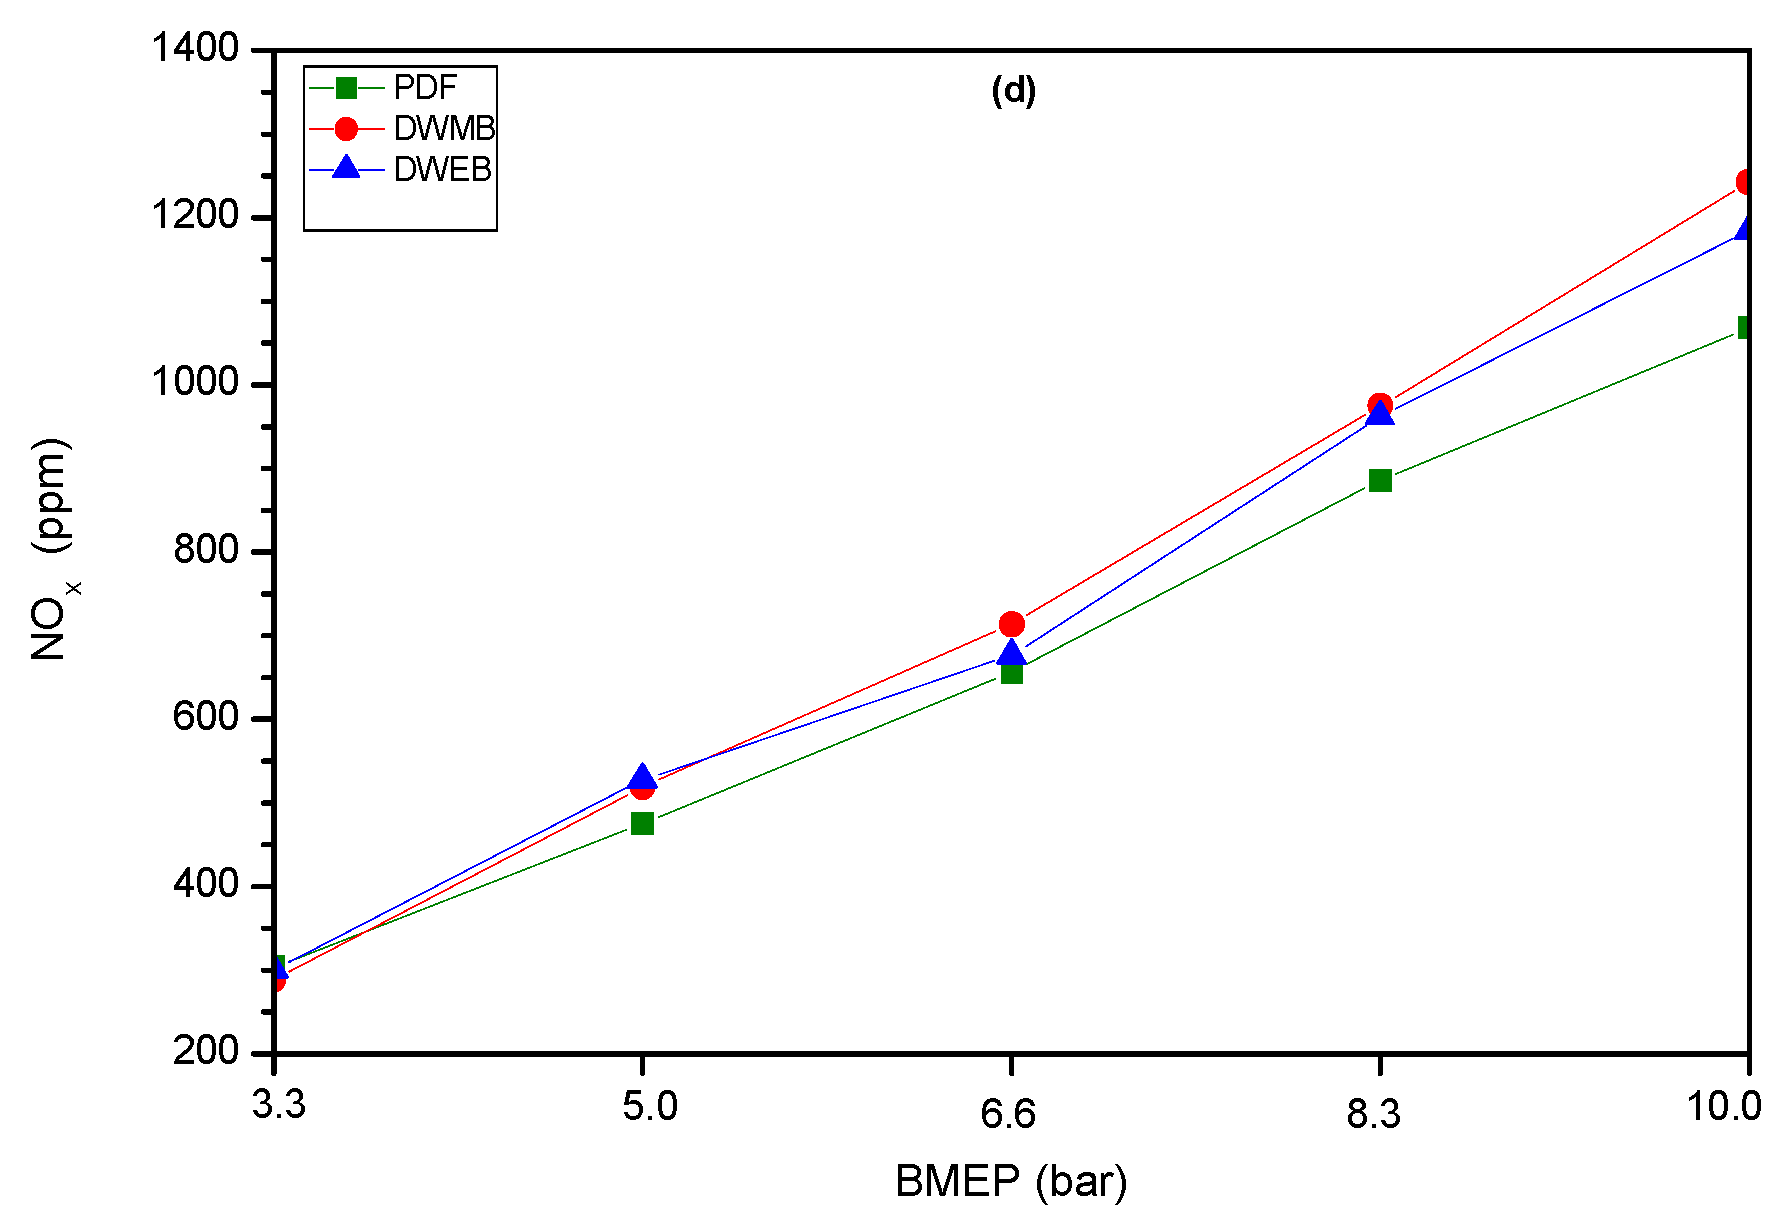
NOx emissions are the most critical emission type for diesel engines. The three main causes of NOx are combustion temperature, combustion duration, and oxygen concentration in the flame zone [51]. As Figure 7d shows, NOx emissions increased significantly with engine load. The rise in NOx emissions between highest and lowest BMEPs was 251.87%, 330.35%, and 294.33% for PDF, DWMB, and DWEB, respectively. The main reason for this dramatic rise is elevated in-cylinder temperatures at high loads. With increasing BMEP, higher air mass flow, enhanced turbulence, increased injection pressure, earlier fuel injection, and decreased CD lead to rapid energy release, promoting thermal NOx formation [52].
At 3.3 bar, NOx emissions of PDF were slightly higher than quaternary fuels, but at higher loads, emulsification fuels surpassed PDF. As BMEP increased, the difference between NOx emissions became more pronounced and was maximum at 10.0 bar. Since in-cylinder temperatures are relatively lower at low BMEPs, evaporation and combustion efficiencies of emulsified fuels will be worse due to their high latent heat of vaporization and low volatility, resulting in less NOx emissions. As BMEP increases, diesel combustion shifts to a diffusion-dominated regime where most of the fuel is injected directly into the active flame zone [53]. Since microemulsification fuels’ IAs and MIDs are higher, their usage results in prolonged overlap between ongoing combustion and fuel injection, leading to elevated in-cylinder temperatures and NOx emissions.
Due to the alcohols’ lower boiling points than PDF and WFO, emulsified fuels may undergo micro-explosion phenomena during combustion [54]. Micro-explosions enhance fuel atomization and promote more complete combustion, resulting in higher in-cylinder temperatures and NOx. The influence of CDs of quaternary fuels on their high NOx release should also be emphasized. As mentioned before, emulsified fuels had higher BSFCs but shorter CDs. When energy is released in less time (higher HRR values of emulsification fuels), NOx emissions increase significantly as explained by the Wiebe function [55]. Finally, emulsification fuels’ low cetane numbers may also have been effective in their high NOx emissions [56]. DWMB’s NOx emissions were generally higher than DWEB. The biggest difference was measured at 10.0 bar. This result can be explained by the relatively low cetane number and viscosity of DWMB.

4. Conclusions

In this study, low-viscosity quaternary microemulsification fuels’ influences on a CRDI diesel engine’s characteristics were thoroughly investigated. It was aimed to determine the potential of sustainable, easily producible multi-component hybrid fuels having biodiesel viscosity quality as alternative diesel fuel. The main findings can be summarized as follows:
  • Both emulsification fuels had higher BSFCs, and this difference increased with BMEP. At 10.0 bar, BSFC of DWMB and DWEB was 21.64% and 20.16% higher than PDF, respectively.
  • DWMB and DWEB had higher BSEC and lower thermal efficiency. For both emulsification fuels, BSECs increased by 8% on average while thermal efficiency decreased by almost the same amount. The similarity in the percentages was remarkable.
  • All fuels’ pilot and main injection timings were very close at low BMEPs. However, with increasing load, quaternary fuels’ injection timings were relatively earlier than PDF.
  • PIDs of all fuels were almost the same, but MIDs of microemulsification fuels were longer, especially at high BMEPs.
  • Quaternary fuels’ IA and IR values were higher than PDF, and this difference increased with BMEP.
  • DWMB and DWEB exhibited shorter CDs and slightly higher Pmax at elevated loads. However, °CAPmax values were similar.
  • Despite quaternary fuels’ lower cetane number, poor volatility, and high latent heat of vaporization, their IDs were shorter than PDF.
  • Microemulsification fuels’ MPRRs remained close to PDF, indicating acceptable combustion stability.
  • Although test fuels’ CO2 and NOx emissions were very close at low loads, quaternary fuels caused more emissions with increasing load. The opposite trend was observed for CO emissions.
  • Among measured emissions, the biggest difference was observed for THC. For example, at 10.0 bar, THC emission of DWEB was 55.30% higher than PDF.
  • DWMB had slightly better results than DWEB in terms of engine characteristics examined.
Although microemulsified fuels have shown inferior performance and emission results than PDF, it should be strongly emphasized that in this preliminary study, they were injected according to the ECU map adjusted for PDF. Future studies in this area should focus on improving performance–emission characteristics and engine compatibility through optimization in fuel formulation (the usage of different long-chain alcohols such as pentanol, hexanol, heptanol, etc.), an injection strategy adapted according to the physico-chemical properties of the hybrid fuels, and exhaust after-treatment technologies. Thus, emulsification fuels can also achieve engine characteristics that can compete with PDF. In conclusion, WFO-based microemulsion fuels containing bio-alcohols offer a promising path toward sustainable diesel substitution, especially from a waste management and circular economy perspective.

Funding

This research received no external funding.

Data Availability Statement

The original contributions presented in this study are included in the article. Further inquiries can be directed to the corresponding author.

Conflicts of Interest

The authors declare no conflict of interest.

Abbreviations

AbbreviationDescription
aTDCAfter Top Dead Center
BMEPBrake Mean Effective Pressure
BSFCBrake Specific Fuel Consumption
BSECBrake Specific Energy Consumption
BTEBrake Thermal Efficiency
°CACrank Angle
°CAPmaxCrank Angle Position of Maximum Pressure
CDCombustion Duration
CICompression Ignition
COCarbon Monoxide
CO2Carbon Dioxide
CRDICommon Rail Direct Injection
DWEBDiesel–Waste Frying Oil–Ethanol–n-Butanol Fuel Blend
DWMBDiesel–Waste Frying Oil–Methanol–n-Butanol Fuel Blend
ECUElectronic Control Unit
EJExajoule (1018 joules)
eMIEnd of Main Injection
ePIEnd of Pilot Injection
HCHydrocarbons
HRRHeat Release Rate
IAInjection Amount
IDIgnition Delay
IRInjection Rate
λ (Lambda)Excess Air Ratio
MIDMain Injection Duration
MPRRMaximum Pressure Rise Rate
NOxNitrogen Oxides
PDFPetroleum-Diesel
PIDPilot Injection Duration
PmaxMaximum In-Cylinder Pressure
rpmRevolutions Per Minute
sMIStart of Main Injection
sPIStart of Pilot Injection
THCTotal Hydrocarbons
TDCTop Dead Center
WFOWaste Frying Oil

References

  1. International Energy Agency (IEA)-Global Energy Reviews 2025-Global Trends. Available online: https://iea.org/reports/global-energy-review-2025/global-trends (accessed on 20 August 2025).
  2. International Energy Agency (IEA)-World Energy Outlook 2024. Available online: https://www.iea.org/reports/world-energy-outlook-2024 (accessed on 20 August 2025).
  3. Statista. Share of Renewable Energy in Electricity Generation Globally from 2010 to 2024. Available online: https://www.statista.com/statistics/489131/share-of-renewables-in-power-generation-globally/ (accessed on 20 August 2025).
  4. Energy Institute. Statistical Review of World Energy 2025 (74th Edition). Available online: https://www.energyinst.org/statistical-review (accessed on 20 August 2025).
  5. Sanli, H. Characterizing three generation biodiesel feedstocks: A statistical approach and emprical modeling of fuel properties. Waste Manag. 2025, 200, 114755. [Google Scholar] [CrossRef]
  6. Ali, M.; Shakaib, M.; Zaidi, A.A.; Javed, M.A.; Khan, S.Z.; Hassan, A.A. Performance and environmental sustainability of fish waste biodiesel on diesel engines. Sustainability 2025, 17, 5385. [Google Scholar] [CrossRef]
  7. Syed, J. Significant research on sustainable oxygenated fuel for compression ignition engines with controlled emissions and optimum performance prediction using artifical neural network. Sustainability 2025, 17, 788. [Google Scholar] [CrossRef]
  8. Gotovusa, M.; Huzjak, P.; Zadravec, I.; Zadravec, M.; Vukovic, J.P. Biodiesel from higher alcohols for removal of crude oil spills from coastal sediments. Sustainability 2024, 16, 8574. [Google Scholar] [CrossRef]
  9. Raju, V.D.; Veza, I.; Venu, H.; Soudagar, M.E.M.; Kalam, M.A.; Ahamad, T.; Appavu, P.; Nair, J.N.; Ashrafur Rahman, S.M. Comprehensive analysis of compression ratio, exhaust gas recirculation, and pilot injection in a diesel engine fuelled with tamarind biodiesel. Sustainability 2023, 15, 15222. [Google Scholar] [CrossRef]
  10. Sanli, H. An experimental investigation on the usage of waste frying oil-diesel fuel blends with low viscosity in a Common Rail DI-diesel engine. Fuel 2018, 222, 434–443. [Google Scholar] [CrossRef]
  11. Abrar, I.; Bahaskarwar, A.N. Microemulsion fuels for compression ignition engines: A review on engine performance and emission characteristics. Fuel 2019, 257, 115944. [Google Scholar] [CrossRef]
  12. Mitchell, B.J.; Zare, A.; Bodisco, T.A.; Nabi, M.N.; Hossain, F.M.; Ristovski, Z.D.; Brown, R.J. Engine blow-by with oxygenated fuels: A comparative study into cold and hot start operation. Energy 2017, 140, 612–624. [Google Scholar] [CrossRef]
  13. Kumar, H.; Kumar, H. Microemulsification-based hybrid oxygenated biofuel for CI engine locomotives: With special reference to “preparation” techniques and “performance” analysis. Environ. Sci. Pollut. Res. 2025. [Google Scholar] [CrossRef]
  14. Jin, C.; Ding, C.; Hu, J.; Geng, Z.; Li, X.; Dong, J.; Xu, T.; Liu, H. Study on the stability and properties of carbon neutral methanol in blends with diesel fuel. Fuel 2024, 374, 132453. [Google Scholar] [CrossRef]
  15. El Nagy, H.A.; Abdel-Aziz Mohamed, M. Formulation of a stable diesel microemulsion using eco-friendly ionic liquids and investigation of particle size and fuel properties as an alternative fuel. Sci. Rep. 2024, 14, 19819. [Google Scholar] [CrossRef]
  16. Abrar, I.; Arora, T.; Khandelwal, R. Bioalcohols as an alternative fuel for transportation: Cradle to grave analysis. Fuel Process. Technol. 2023, 242, 107646. [Google Scholar] [CrossRef]
  17. Zhang, Y.; Zhu, X.; Zhang, L.; Zhu, X. Preparation and characterization of microemulsion fuels from diesel and model compound of walnut shell pyrolysis oil. Fuel 2019, 243, 478–484. [Google Scholar] [CrossRef]
  18. Zheng, S.; Lv, Z.; Yang, Y.; Liu, H.; Lu, Q. Effects of n-butanol blending on soot and NO formation in biodiesel/air co-flow diffusion flame. Energy 2025, 323, 135842. [Google Scholar] [CrossRef]
  19. Zhao, D.; Wang, Y.; Liu, J. Preparation and application of diesel microemulsion. Pet. Sci. Technol. 2006, 24, 1017–1025. [Google Scholar] [CrossRef]
  20. Li, X.; Guan, C.; Yang, K.; Cheung, C.S.; Huang, Z. Impact of lower and higher alcohol additions to diesel on the combustion and emissions of a direct-injection diesel engine. Environ. Sci. Pollut. Res. 2019, 26, 21001–21012. [Google Scholar] [CrossRef]
  21. Zhang, Y.; Gao, S.; Zhang, Z.; Li, W.; Yuan, T.; Tan, D.; Duan, L.; Yang, G. A comprehensive review on combution, performance and emission aspects of higher alcohols and its additive effect on the diesel engine. Fuel 2023, 335, 127011. [Google Scholar] [CrossRef]
  22. Karabektas, M.; Yilancilar, M.S. Investigation of the effects of high-carbon alcohol addition to camelina oil methyl ester on the performance parameters and soot emission of a diesel engine. Int. J. Low Carbon Technol. 2022, 17, 206–213. [Google Scholar] [CrossRef]
  23. Appavu, P.; Ramanan, V.; Venu, H. Quaternary blends of diesel/biodiesel/vegetable oil/pentanol as a potential alternative feedstock for existing unmodified diesel engine: Performance, combustion and emission characteristics. Energy 2019, 186, 115856. [Google Scholar] [CrossRef]
  24. Wang, Y.; Chen, Y.; Chen, Y.; Chen, D.; Li, Y.; Qin, J. Microemulsion phase behavior based on biodiesel and its performance in treating oil-contaminated soil. J. Environ. Chem. Eng. 2024, 12, 112552. [Google Scholar] [CrossRef]
  25. Feng, H.; Chen, X.; Sun, L.; Ma, R.; Zhang, X.; Zhu, L.; Yang, C. The effect of methanol/diesel fuel blends with co-solvent on diesel engine combustion based on experiment ana exergy analysis. Energy 2023, 282, 128792. [Google Scholar] [CrossRef]
  26. Khan, M.M.; Hasnain, S.M.M.; Kadian, A.K.; Sharma, R.P.; Abbas, M.; Pandey, S. Reduction of fossil fuel usage and emissions of diesel engines by the application of quaternary blends and varied fuel injection pressures. ACS Omega 2024, 9, 26388–26399. [Google Scholar] [CrossRef]
  27. Cedik, J.; Pexa, M.; Holubek, M.; Mrazek, J.; Valera, H.; Agarwal, A.K. Operational parameters of a diesel engine running on diesel-rapeseed oil-methanol-iso-butanol blends. Energies 2021, 14, 6173. [Google Scholar] [CrossRef]
  28. Dimitriadis, A.; Chrysikou, L.P.; Kokkalis, A.I.; Doufas, L.I.; Bezergianni, S. Animal fats valorization to green transportations fuels: From concept to industrially relevant scale validation. Waste Manag. 2022, 143, 242–252. [Google Scholar] [CrossRef]
  29. Abrar, I.; Bhaskarwar, A.N. Mitigating exhaust emissions in CI engines using butanol-diesel-water microemulsions. Environ. Sci. Pollut. Res. 2023, 30, 30632–30643. [Google Scholar] [CrossRef]
  30. Alptekin, E.; Sanli, H.; Canakci, M. Combustion and performance evaluation of a common rail DI diesel engine fueled with ethyl and methyl esters. Appl. Therm. Eng. 2019, 149, 180–191. [Google Scholar] [CrossRef]
  31. Ooi, J.B.; Chan, X.L.; Jaliliantabar, F.; Tan, B.T.; Wang, X.; Song, C.P.; Chiong, M.C.; Hung, Y.M. Experimental study of quaternary blends with diesel/palm-oil biodiesel/ethanol/diethyl ether for optimum performance and emissions in a light-duty diesel engine using response surface methodology. Energy 2024, 301, 131782. [Google Scholar] [CrossRef]
  32. Bidir, M.G.; Narayanan, K.M.; Adaramola, M.S.; Hagos, F.Y.; Singh, R.C. Comparative study on the effects of nanoparticles in ternary fuel blends on combustion, performance, and emissions characteristics of diesel engine. Int. J. Engine Res. 2022, 24, 4509–4520. [Google Scholar] [CrossRef]
  33. Kolhe, A.V.; Malwe, P.D.; Chopkar, Y.; Panchal, H.; Ağbulut, Ü.; Mubarak, N.M.; Chowdhury, S.; Amesha, K.T.T. Performance analysis of biofuel-ethanol blends in diesel engine and its validation with computational fluid dynamics. Environ. Sci. Pollut. Res. 2023, 30, 125117–125137. [Google Scholar] [CrossRef] [PubMed]
  34. Patnaik, S.; Khatri, N.; Rene, E.R. Artificial neural networks-based performance and emission characteristics prediction of compression ignition engines powered by blends of biodiesel derived from waste cooking oil. Fuel 2024, 370, 131806. [Google Scholar] [CrossRef]
  35. Dhanasekaran, Y.; Sriramulu, J. An outcome of quaternary fuel blended Fe3O4- doped reduced graphene oxide nanocomposite on the diesel engine. Heat Transf. 2022, 51, 4741–4767. [Google Scholar] [CrossRef]
  36. Qi, D.H.; Bae, C.; Feng, Y.M.; Jia, C.C.; Bian, Y.Z. Combustion and emission characteristics of a direct injection compression ignition engine using rapeseed oil based micro-emulsions. Fuel 2013, 107, 570–577. [Google Scholar] [CrossRef]
  37. Vellaiyan, S.; Kandasamy, M.; Devarajan, Y. Optimization of bauhinia parviflora biodiesel production for higher yield and its compatibility assessment with water and di-tert-butyl peroxide emulsion. Waste Manag. 2023, 162, 63–71. [Google Scholar] [CrossRef] [PubMed]
  38. Waluyo, B.; Fatimah, Y.A.; Habibi, I.; Pertiwi, F.D.; Setiyo, M.; Marlina, E. Enhancing biodiesel-methanol blends with 1-butanol for stable and efficient fuels. Fuel 2024, 361, 130667. [Google Scholar] [CrossRef]
  39. El-Seesy, A.I.; Waly, M.S.; Nasser, A.; El-Zoheiry, R.M. Improvement of the combustion, emission, and stability features of diesel-methanol blends using n-decanol as cosolvent. Sci. Rep. 2022, 12, 18963. [Google Scholar] [CrossRef]
  40. Sanli, H.; Alptekin, E.; Canakci, M. Using low viscosity micro-emulsification fuels composed of waste frying oil-diesel fuel-higher bio-alcohols in a turbucharged-CRDI diesel engine. Fuel 2022, 308, 121966. [Google Scholar] [CrossRef]
  41. Teoh, Y.H.; How, H.G.; Peh, C.G.; Le, T.D.; Nguyen, H.T. Implementation of common rail direct injection system and optimization of fuel injector parameters in an experimental single-cylinder engine. Processes 2020, 8, 1122. [Google Scholar] [CrossRef]
  42. Agarwal, A.K.; Singh, A.P.; Maurya, R.K.; Shukla, P.C.; Dhar, A.; Srivastava, D.K. Combustion characteristics of a common rail direct injection engine using different fuel injection strategies. Int. J. Therm. Sci. 2018, 134, 475–484. [Google Scholar] [CrossRef]
  43. Wang, X.; Fan, W.; Chen, J.; Zhang, H. Experimental stduy of effect of a novel ammonia/coal co-firing mode on NOx emission under high temperature conditions. Renew. Energy 2024, 235, 121379. [Google Scholar] [CrossRef]
  44. Korkmaz, M.; Lakshmanan, R.; Falkenstein, T.; Beeckman, J.; Pitsch, H. Experimental and numerical investigation of the maximum pressure rise rate for an LTC concept in a single cylinder CI engine. In Proceedings of the 14th International Conference on Engines & Vehicles, Capri, Napoli, Italy, 15–19 September 2019; SAE Technical Paper. Volume 24, p. 0023. [Google Scholar] [CrossRef]
  45. Abed, K.A.; Gad, M.S.; El Morsi, A.K.; Sayed, M.M.; Abu Elyazeed, S. Effect of biodiesel fuels on diesel engine emissions. Egypt. J. Petroleum 2019, 28, 183–188. [Google Scholar] [CrossRef]
  46. Tarangan, D.; Sobati, M.A.; Shahnazari, S.; Ghobadian, B. Physical properties, engine performance, and exhaust emissions of waste fish oil biodiesel/bioethanol/diesel fuel blends. Sci. Rep. 2023, 13, 14024. [Google Scholar] [CrossRef] [PubMed]
  47. Alptekin, E. Evaluation of ethanol and isopropanol as additives with diesel fuel in a CRDI diesel engine. Fuel 2017, 205, 161–172. [Google Scholar] [CrossRef]
  48. Ramesh, T.; Sathiyagnanam, A.P.; De Poures, M.V.; Murugan, P. A comprehensive study on the effect of dimethyl carbonate oxygenate and EGR on emission reduction, combustion analysis, and performance enhancement of a CRDI diesel engine using a blend of diesel and Porsopis juliflora biodiesel. Int. J. Chem. Eng. 2022, 2022, 5717362. [Google Scholar] [CrossRef]
  49. Lv, J.; Yan, B.; Zhou, S.; Wu, Z.; Liu, X.; Lu, S.; Zhu, X.; Sun, Y.; Li, J.; Lin, F.; et al. Ignition, combustion and pollutant emissions characteristics of a excavated waste in low oxygen concentration and O2/CO2 atmosphere. Waste Manag. 2025, 200, 114770. [Google Scholar] [CrossRef]
  50. Jeong, J.W.; Baek, S.; Kim, Y.; Woo, S.; Lim, Y.; Lee, K. Investigation of CO2 and PN emission characteristics according to the propane content for a LPG engine. Fuel 2024, 357, 129877. [Google Scholar] [CrossRef]
  51. Berk, S.; Alptekin, E. Optimization of NOx emissions of a CRDI diesel engine using CMA-ES method. Int. J. Engine Res. 2024, 25, 2184–2203. [Google Scholar] [CrossRef]
  52. Jeong, J.W.; Kim, N.; Lee, K. Investigation of real-world NOx and NH3 emissions from various powertrain vehicles using trip analysis method. Fuel 2026, 403, 136087. [Google Scholar] [CrossRef]
  53. Moradi, J.; Banagar, I.; Mehranfar, S.; Andwari, A.M.; Könnö, J.; Gharehghani, A. Advancing combustion technologies and alternative fuels in hybrid electric vehicles: A pathway to high-efficiency, low-emission propulsion systems. Future Technol. 2023, 3, 42–54. [Google Scholar] [CrossRef]
  54. Qiu, Z.; Tian, J.; Liu, Y.; Sun, H.; Ni, Z.; Lin, Q. Expansion/micro-explosion of ethanol-biodiesel doplet doped with microparticles in oxygenated hot co-flow. Appl. Therm. Eng. 2023, 221, 119345. [Google Scholar] [CrossRef]
  55. Tipanluisa, L.; Thakkar, K.; Fonseca, N.; Lopez, J.M. Investigation of diese/n-butanol blends as drop-in fuel for heavy-duty diesel engines: Combustion, performance, and emissions. Energy Convers. Manag. 2022, 255, 115334. [Google Scholar] [CrossRef]
  56. Niknejad, M.; Hajinezhad, A.; Moosavian, S.Y. Effect of Norozak (Salvia ierrifolia) biodiesel fuel on diesel engine performance. Future Sustain. 2023, 1, 39–45. [Google Scholar] [CrossRef]
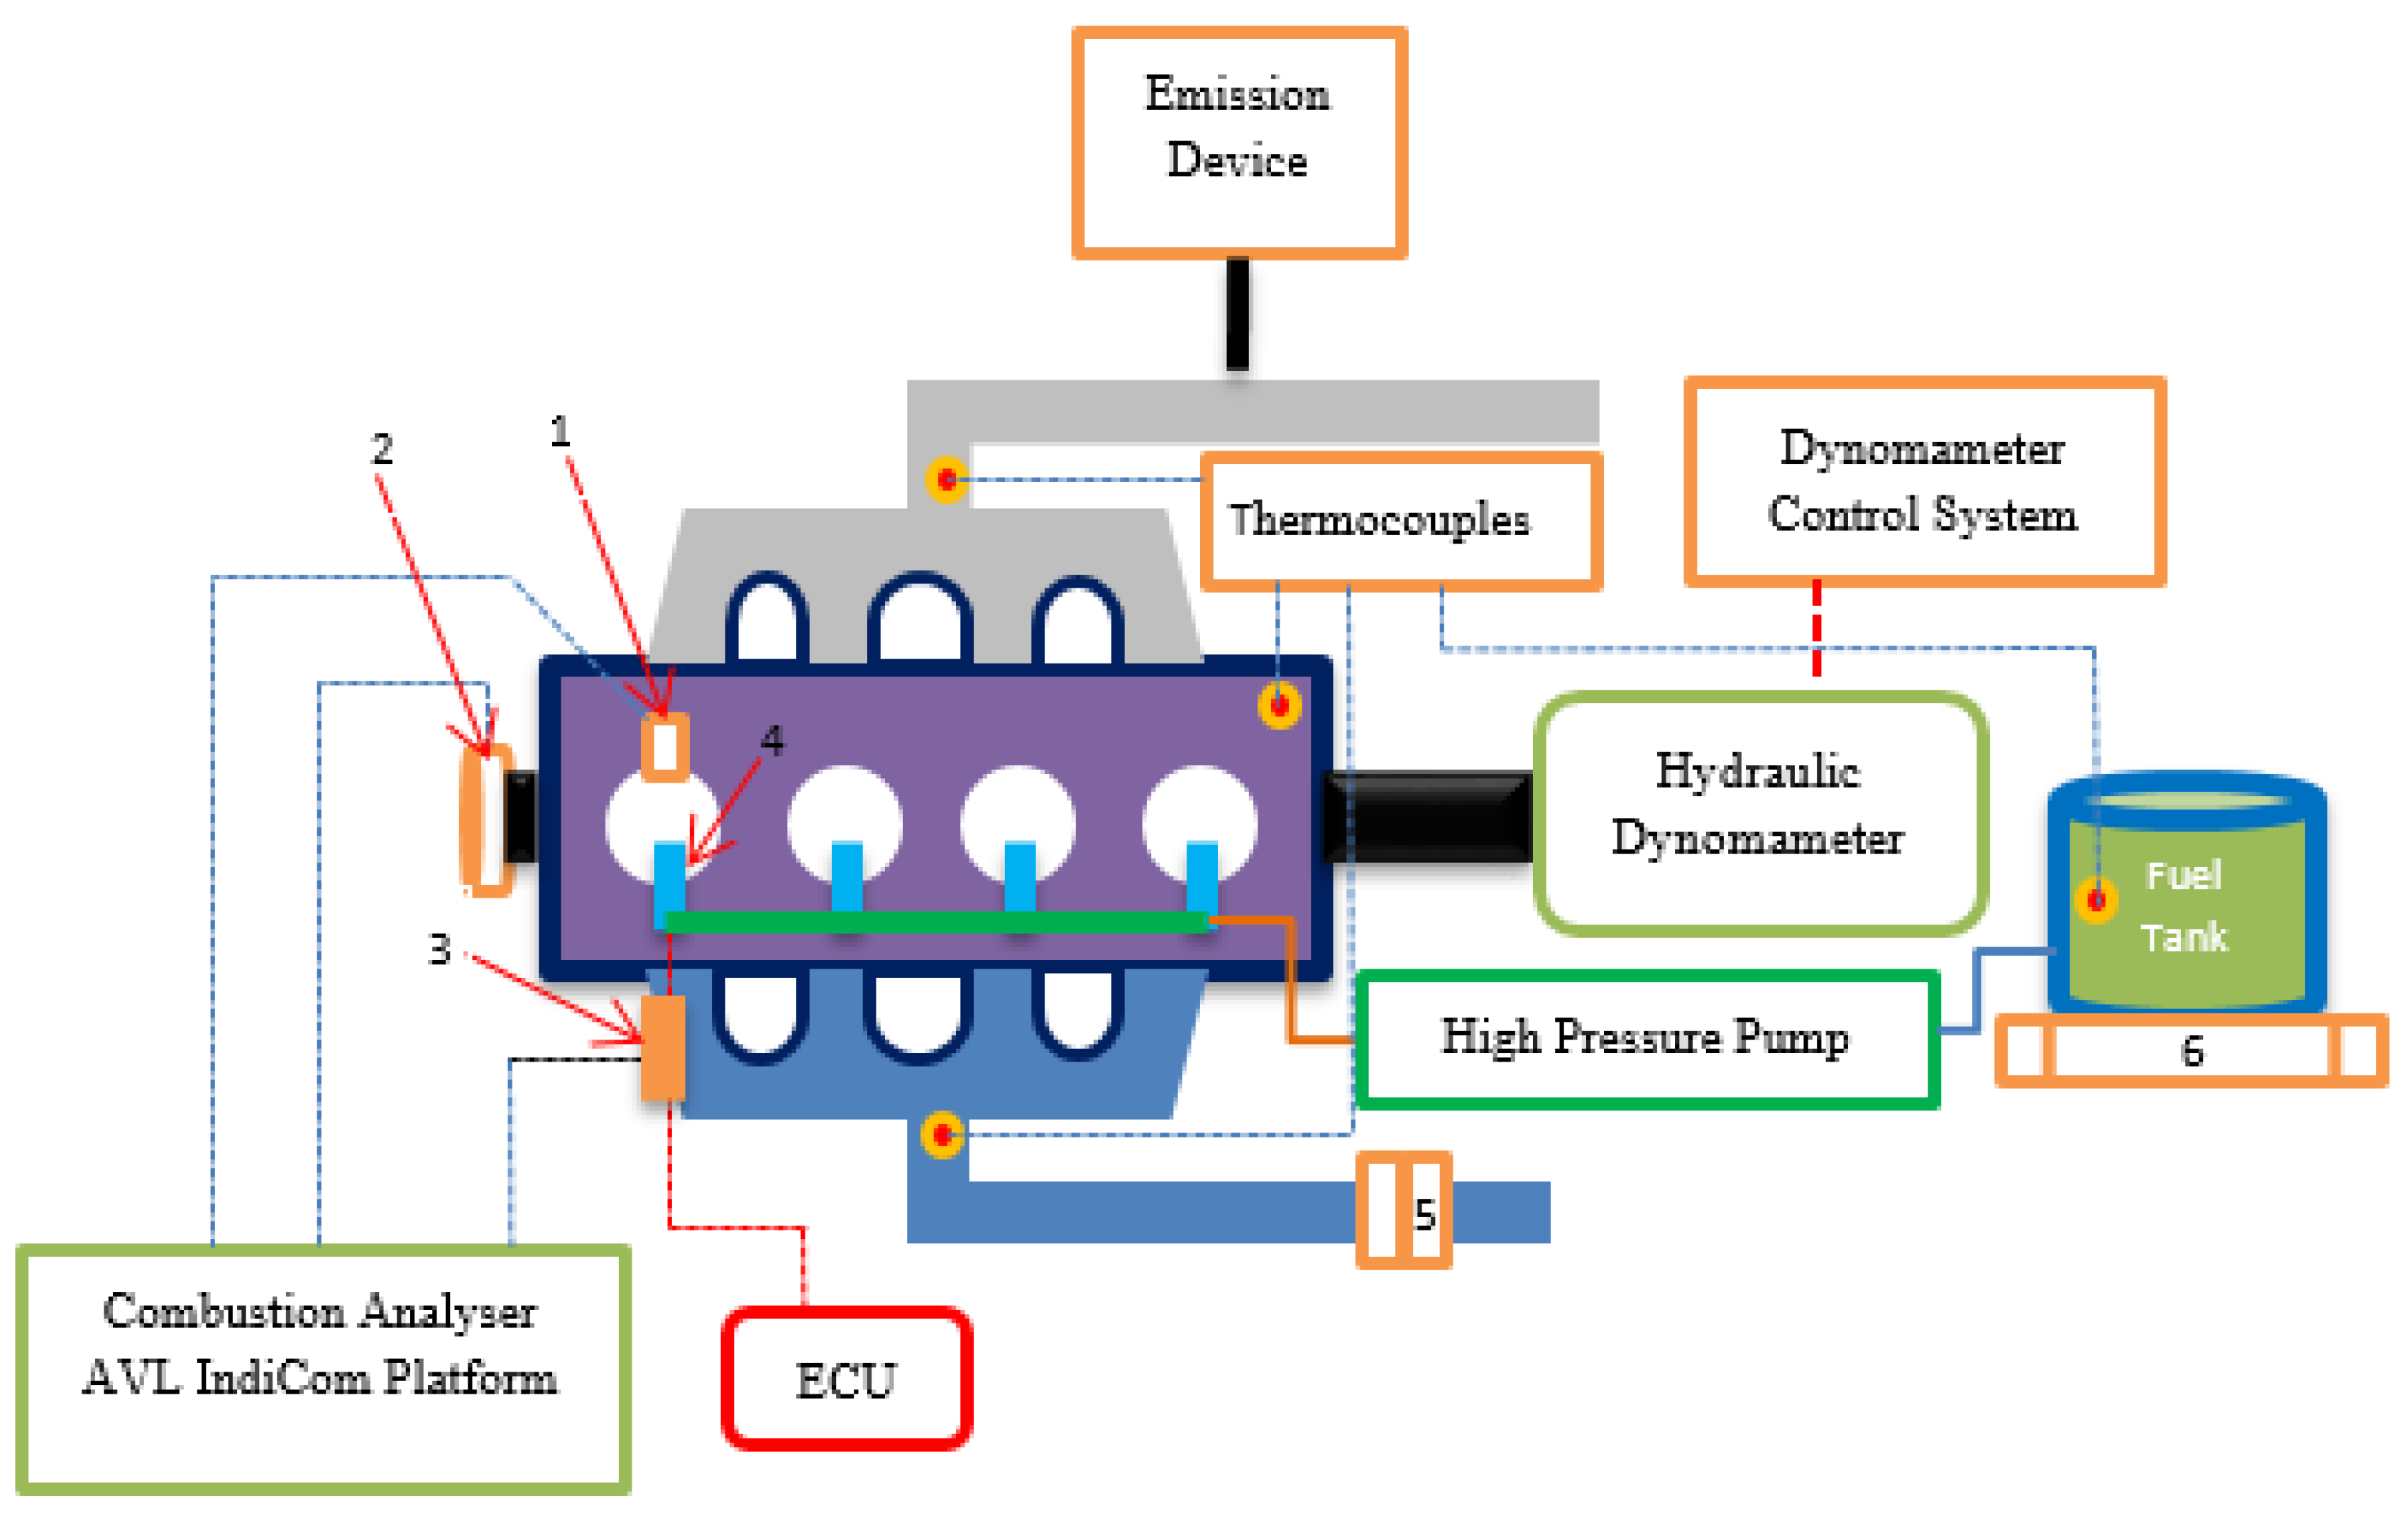
Figure 1. Schematic view of experimental setup: (1) AVL Glow-plug sensor, (2) AVL crank angle encoder, (3) current probe, (4) common Rail Injector, (5) air mass flow meter, (6) electronic scale.
Sustainability 17 08835 g001
Figure 2. Change in performance characteristics: (a) BSFC, (b) BSEC, (c) BTE.
Sustainability 17 08835 g002aSustainability 17 08835 g002b
Figure 3. Change in pilot injection characteristics: (a) sPI, (b) ePI, (c) PID.
Sustainability 17 08835 g003aSustainability 17 08835 g003b
Figure 4. Change in main injection characteristics: (a) sMI, (b) eMI, (c) MID, (d) IA, (e) IR.
Sustainability 17 08835 g004aSustainability 17 08835 g004b
Figure 5. Change in cylinder gas pressure and heat release rate.
Sustainability 17 08835 g005aSustainability 17 08835 g005b
Figure 6. Change in combustion characteristics: (a) ID, (b) CD, (c) MPRR.
Sustainability 17 08835 g006aSustainability 17 08835 g006b
Figure 7. Change in exhaust emissions: (a) CO, (b) THC, (c) CO2, (d) NOx.
Sustainability 17 08835 g007aSustainability 17 08835 g007b
Table 1. Some physico-chemical features and fatty acid distributions (%) of WFO.
PropertyUnitTest MethodValue
Viscosity (40 °C)mm2·s−1ASTM D44540.28
Density (15 °C)kg·m−3ASTM D4052925.7
Acid Valuemg KOH·g−1AOCS Cd 3d-630.28
Higher Heating ValuekJ·kg−1ASTM D24039604
C
14:0
C
16:0
C
16:1
C
18:0
C
18:1
C
18:2
C
18:3
C
20:0
C
22:0
Total
Saturation
0.189.600.173.4635.1850.000.080.160.5813.99
Table 2. The properties and specifications of materials used in the study. Some key fuel properties and chemical formulas of test fuels.
Test FuelChemical FormulaViscosity
(mm2·s−1, 40 °C)
Density
(kg·m−3, 15 °C)
Heating Value
(MJ·kg−1)
PDFC12H232.96832.645.95
DWMBC11.9H22.8O0.84.20851.240.52
DWEBC12H23O0.84.71850.841.74
Table 3. The properties and specifications of materials used in the study. Technical specifications of test engine.
Engine1.9 L, Fiat JTD
TypeDirect injection, turbocharged, intercooled, four-stroke, water-cooled, common rail.
Number of Cylinder4
Bore-Stroke82 mm–90.4 mm
Compression Ratio18.45:1
Maximum Power77 kW (at 4000 rpm)
Maximum Brake Torque205 Nm (at 1750 rpm)
Table 4. The properties and specifications of materials used in the study. Measuring instruments on the testbed.
ProductIntended Purpose
Hydraulic dynamometer (BT-190 FR)For providing engine load
Maximum Power = 100 kW
Maximum Load = 750 Nm
Crank angle encoder (AVL 365C)For detecting the crankshaft position
Air mass flow meterAVL Flowsonix-Air product
Glow-plug sensor (AVL-GH13P)For measuring the cylinder pressure
Cylinder pressure measurement system
(AVL FlexIFEM)
For signal amplification and data acquisition
Current clamp (Fluke) For receiving the injection signals
Combustion analysis program
(AVL Indicom)
For obtaining and analyzing cylinder gas pressure, heat release rate, and injection timing data
Table 5. The properties and specifications of materials used in the study. The accuracies of the measurements and the uncertainties of the calculated results.
MeasurementUnitAccuracy
Engine Speedrpm±1
Engine LoadNm±1
Temperature°C±1
Times±0.5
Air Mass Flowkg/h<±1.5%
Fuel Consumptiong<±1%
HC, CO, NOx, CO2(ppm, ppm, ppm, %)<±2%
Calculated Results Uncertainty
Brake Specific Fuel Consumptiong/kWh≤±2%
Brake Specific Energy ConsumptionJ/kWh≤±2%
Brake Thermal Efficiency%≤±2%
Table 6. Pmax and °CAPmax of the test fuels.
3.3 bar5.0 bar6.6 bar8.3 bar10.0 bar
FuelPmax
(bar)
°CAPmax
(a TDC)
Pmax
(bar)
°CAPmax
(a TDC)
Pmax
(bar)
°CAPmax
(a TDC)
Pmax
(bar)
°CAPmax
(a TDC)
Pmax
(bar)
°CAPmax
(a TDC)
PDF64.212.068.782.474.752.280.692.688.2419.8
DWMB62.932.668.272.873.892.080.692.891.5519.2
DWEB63.902.868.892.875.432.079.682.491.9519.2
Table 7. Excess air ratios (λ) for the test fuels.
3.3 bar5.0 bar6.6 bar8.3 bar10.0 bar
PDF2.602.131.841.601.39
DWMB2.552.131.851.551.40
DWEB2.672.151.841.541.43
Disclaimer/Publisher’s Note: The statements, opinions and data contained in all publications are solely those of the individual author(s) and contributor(s) and not of MDPI and/or the editor(s). MDPI and/or the editor(s) disclaim responsibility for any injury to people or property resulting from any ideas, methods, instructions or products referred to in the content.