Article

Multi-Objective Optimization Study on Capture Performance of Diesel Particulate Filter Based on the GRA-MLR-WOA Hybrid Method

1
Sino-German College of Intelligent Manufacturing, Shenzhen Technology University, Shenzhen 518118, China
2
School of Automotive Studies, Tongji University, Shanghai 201804, China
*
Author to whom correspondence should be addressed.
Sustainability 2025, 17(19), 8777; https://doi.org/10.3390/su17198777
Submission received: 28 August 2025 / Revised: 23 September 2025 / Accepted: 28 September 2025 / Published: 30 September 2025

Abstract

The diesel particulate filter (DPF) is among the most effective measures for controlling particulate emissions from diesel vehicles. Therefore, resource-efficient DPF design and operation are critical to sustainable deployment. In practical engineering, the pursuit of high filtration efficiency inevitably leads to excessively high pressure drop, which in turn impairs the fuel economy and operational reliability of the engine. To address this pair of conflicting objectives, this study introduces a hybrid GRA-MLR-WOA approach, with the initial filtration efficiency and pressure drop at an 80 g soot capture amount as the optimization objectives, to optimize the structural parameters of the DPF. Firstly, based on a computational fluid dynamics (CFD) model and orthogonal experimental design, combined with grey relational analysis (GRA), the effects of key structural parameters on filtration efficiency and pressure drop were evaluated. Secondly, Box–Behnken Design (BBD) was integrated with multiple linear regression (MLR) to establish mathematical regression models describing the relationships between structural parameters, filtration efficiency, and pressure drop. Finally, the whale optimization algorithm (WOA) was employed to obtain the Pareto frontier of the regression models. Through screening with the goal of maximizing initial filtration efficiency, the optimized DPF achieved a 46.85% increase in initial filtration efficiency and a 34.88% reduction in pressure drop compared to the original model. This study targets sustainable filtration design and proposes an optimization framework that jointly optimizes pressure drop and the initial filtration efficiency. The results provide a robust empirical basis for engineering practice and demonstrate strong reproducibility.

1. Introduction

In recent years, diesel engines have long occupied a crucial position in the transportation sector owing to their excellent power output, favorable fuel efficiency, and reliable operating performance. With the increasing severity of global environmental issues, the particulate matter (PM) emission problem generated by diesel engines while providing high power has gradually become the focus of social attention [1,2,3]. In accordance with China’s latest emission standards, the PM emission limit had been strictly established at no more than 3 milligrams per kilometer. Under the Euro VI standard, the PM emission limit for diesel vehicles is set at 0.005 g/km, with the additional introduction of real driving emissions testing requirements [4]. Faced with increasingly stringent regulatory constraints and strong public demands for environmental protection, automobile manufacturers and research institutions were actively developing and applying a variety of technical solutions to reduce PM emissions from diesel engines [5,6]. These measures include exhaust aftertreatment devices [7], alternative fuels [8,9,10], fuel additives [11], novel combustion strategies [12,13], advanced ignition strategies [14,15], and optimal design of engine structures [16].
As a mature commercial aftertreatment technology, the diesel particulate filter (DPF) has become one of the core means for controlling PM emission [17]. Its structural main body is a honeycomb ceramic substrate, composed of densely arranged parallel channels. The inlets and outlets of adjacent channels are alternately blocked, and the channels are connected through porous filter walls. When exhaust gas flows through, the soot particles contained therein are intercepted by the porous walls and gradually accumulate on the inner walls of the channels to form a dense soot layer [18]. This process leads to an increase in exhaust flow resistance and a significant rise in exhaust backpressure [19]. Excessively high-pressure drop will hinder the discharge of engine exhaust gas, thereby affecting fuel efficiency and causing potential safety hazards. As a key performance parameter, filtration efficiency reflects the proportion of particulates captured by the DPF and directly indicates its purification capacity [20]. However, it should be noted that an increase in filtration efficiency will exacerbate airflow blockage and further increase the pressure drop. These two parameters exhibit a significant conflicting relationship [21]. Given that the aforementioned performance indicators are closely associated with the internal structure of the DPF, researchers are committed to optimizing its comprehensive capture performance through structural innovation [22].
The DPF is a critical technology for controlling the emissions of internal combustion engines. With its high-efficiency filtration performance, it can reduce particulate matter (PM) emissions by over 95%. PM emissions from internal combustion engines were one of the key factors contributing to urban smog formation. Therefore, achieving optimal DPF performance holds positive significance for both environmental protection and low-carbon development. Numerical simulation has emerged as a crucial method for investigating the correlation between filter structural parameters and performance. Lupše et al. [23] employed a one-dimensional semi-analytical model to determine that the optimal capture performance of DPF can be achieved when the channels per square inch (CPSI) range from 240 to 280 1/in2. They also found that substrates with high permeability shift the optimal CPSI range toward lower values. Tan et al. [24] integrated three-dimensional numerical simulation with fuzzy grey relational analysis (FGRA). On the basis of quantifying the weight of pressure drop, they systematically analyzed the mechanism by which structural parameters of rotary DPF affect pressure drop. Their findings revealed that the diameter ratio plays a dominant role in the pressure drop at the capture–regeneration balance point. Ye et al. [25] found through three-dimensional model comparison that the filter with a structure of gradually decreasing porosity exhibits pressure drop characteristics superior to the design with uniformly increasing porosity. Xiao et al. [26] innovatively proposed an asymmetric channel wall-flow filter configuration. Verification results demonstrated that this design has significant advantages in both the utilization rate of the effective filter wall area and pressure drop control. The research outcomes collectively confirm the methodological value of synergizing numerical models and bench tests for analyzing the characteristics of DPF.
In the research field of traditional wall-flow DPF, Konstandopoulos et al. [27] pioneered the integration of Brownian diffusion and direct interception mechanisms into the packed bed theoretical framework for particulate capture in 1989. Subsequently, they further developed a dynamic prediction model for soot deposition distribution [28]. Yang et al. [29] employed numerical simulation to compare the capture characteristics of DPF based on silicon carbide (SiC) and cordierite. They were the first to capture the transition process from deep-bed filtration to cake-layer filtration and quantified the critical soot volume required for the dominant filtration mode transition in the two types of filters. Notably, this transition point exhibits material dependence but shows no correlation with exhaust gas flow rate. Wang et al. [30] developed a novel filtration model based on discrete pore size distribution, which exhibits excellent predictive capability under both clean and soot-loaded states. Experimental verification confirmed that this model has cross-fuel adaptability with a cyclic error of <1%. For catalytic coated filters, Liu et al. [31] developed a capillary statistical model that controls the prediction error of filtration efficiency within 10% in the porosity range of 30–60%. This study confirmed that high porosity, narrow pore size distribution, and directional porous structure can optimize the operating backpressure. Houston et al. [32] constructed a gas dynamics model capable of accurately predicting the permeability of particle/fiber composite materials by modifying the Kozeny–Carman equation. Excellent theoretical research has provided support for the performance optimization of DPF, significantly promoting the development of DPF.
However, adjusting a single parameter is insufficient to achieve global performance optimization, and traditional methods suffer from efficiency bottlenecks during the optimization process. Structural parameter optimization driven by intelligent algorithms has provided researchers with a novel approach. E et al. [33] integrated an adaptive variable-scale chaotic immune algorithm with a CFD model to optimize a microwave–fuel composite regeneration system for DPFs, achieving significant reductions in regeneration energy consumption. Building on this idea of intelligent optimization, Gao et al. [34] combined ANN with NSGA-III for combustion chamber structural optimization, demonstrating that machine learning can effectively capture nonlinear parameter interactions while simultaneously reducing multiple pollutant emissions. In a related study, Ozturk et al. [35] applied NSGA-II to balance acoustic attenuation and flow resistance in DPF geometries, showing that intelligent algorithms are well suited to addressing multi-objective trade-offs. Zhang et al. [36] further advanced this direction by developing a multidisciplinary design platform driven by chaotic optimization, which simultaneously improved pressure drop, regeneration efficiency, energy consumption, and thermal deformation, reflecting the growing trend toward multi-objective, multi-disciplinary integration. It should be noted that such approaches often rely on indirect coupling between CFD and simplified mathematical models, where machine learning methods play a pivotal role in enhancing predictive accuracy and computational efficiency. Extending the data-driven perspective, Seo et al. [37] and Sarkar et al. [38] developed ANN-based models for cold-start emission prediction and for dynamic monitoring of catalyst coverage, temperature fields, and outlet species concentrations, respectively, highlighting the adaptability of ML approaches under fluctuating operating conditions. In parallel, Qiang et al. [39] combined CFD simulations with a random forest algorithm and confirmed that channel density is a key structural factor regulating pressure drop, reinforcing the value of integrating ML with physics-based modeling. Collectively, these studies indicate a shift toward hybrid frameworks that combine CFD, ML, and optimization algorithms, offering both greater design accuracy and enhanced robustness for aftertreatment system optimization under complex conditions.
Existing research had advanced the optimization of DPF. However, most approaches remain dependent on large-scale datasets and exhibit limited effectiveness under practical small-sample conditions. This underscores the necessity of developing small-sample learning methods to enhance model robustness and practical applicability. At the same time, structural innovation and parameter optimization have emerged as mainstream strategies for improving DPF performance [40], yet investigations into multi-parameter coupling effects and multi-objective conflicts remain insufficient [41]. Consequently, the establishment of a multi-objective collaborative optimization framework is of critical importance for achieving comprehensive performance improvements in DPFs. Firstly, based on a CFD-model and orthogonal experimental design, sensitivity analysis of the key parameters of DPF was performed in combination with grey relational analysis (GRA). Secondly, the Box–Behnken Design (BBD) was employed to expand the dataset of screened structural parameters, and a mathematical regression model was established via multiple linear regression (MLR). Finally, the mathematical regression model was integrated into the whale optimization algorithm (WOA) to obtain the Pareto frontier for the multi-objective problem, thereby determining the optimal combination of structural parameters. This optimization approach expands the multi-objective optimization system for DPF and provides theoretical support for the improvement of comprehensive performance.

2. Methodology

2.1. Physical Model

The physical structure of the DPF is illustrated in Figure 1a, and its main structure consists of five key components: the inlet pipe, inlet expansion section, porous media filter, outlet contraction section, and outlet pipe. As the core component for particulate capture, the porous media filter adopts a wall-flow design, composed of thousands of parallel-arranged channels. The inlets and outlets of adjacent channels are alternately blocked. Particulates in the exhaust gas are intercepted by the porous walls and gradually deposited. Figure 1b further presents the details of its internal structure and the soot capture process. The main structural parameters of the DPF are listed in Table 1.

2.2. Numerical Model

In this work, GT-Power was employed to develop a mathematical model for the soot capture behavior of the diesel particulate filter (DPF). The pressure drop calculation adheres to Darcy’s Law, while the soot capture process is described using the packed bed theory, with comprehensive consideration of Brownian diffusion and direct interception mechanisms [42]. The model establishment mainly involved the pressure drop model, soot deposition model, and grid independence verification [43].
The independence verification of the grid was conducted using three different grids: 182,720 grids, 402,920 grids, and 693,440 grids. The results show that the differences between the three models were minimal. When the soot deposition reaches 2 g/L, the corresponding pressure drops of the three grids were 12,488 Pa, 12,475 Pa, and 12,466 Pa, respectively. Therefore, the model consisting of 402,920 grids was selected for the simulation.
The pressure drop is calculated using the Forchheimer equation, as follows:
p / x i = α i μ ω i ξ ρ 2 ω ω i
where, p / x i is the pressure gradient in the porous medium, with units of N/m3; α i is the viscous resistance coefficient, with units of 1/m2; μ is the molecular (laminar) dynamic viscosity of the fluid domain, with units of N·s/m2; ω i is the interstitial (local) velocity component in the porous medium calculated based on the local volume fraction, with units of m/s; and ξ is the inertial resistance coefficient, with units of 1/m.
The soot deposition model is calculated as follows:
d m c ( z ) d t = R d + v w , d l ( z ) m s 1 S c
d m d ( z ) d t = R c + v w , d l ( z ) m s 1 S d
v w , d l ( z ) = v w ( z ) 1 l e f 0 l e f v w ( z ) d z
where, md(z) denotes the soot mass in the deep filter layer at axial position z, while mc(z) represents the soot mass in the soot cake layer at the same position. Rd and Rc correspond to the soot deposition rates in the deep and cake layers, respectively. vw,dl(z) is the dimensionless wall velocity at axial position z, obtained from the local wall velocity vw(z) normalized by the integral average over the effective filter length lef. ms1 denotes the soot mass flow rate per unit area, and Sc and Sd represent the specific surface areas of the soot cake layer and the deep filter layer, respectively.
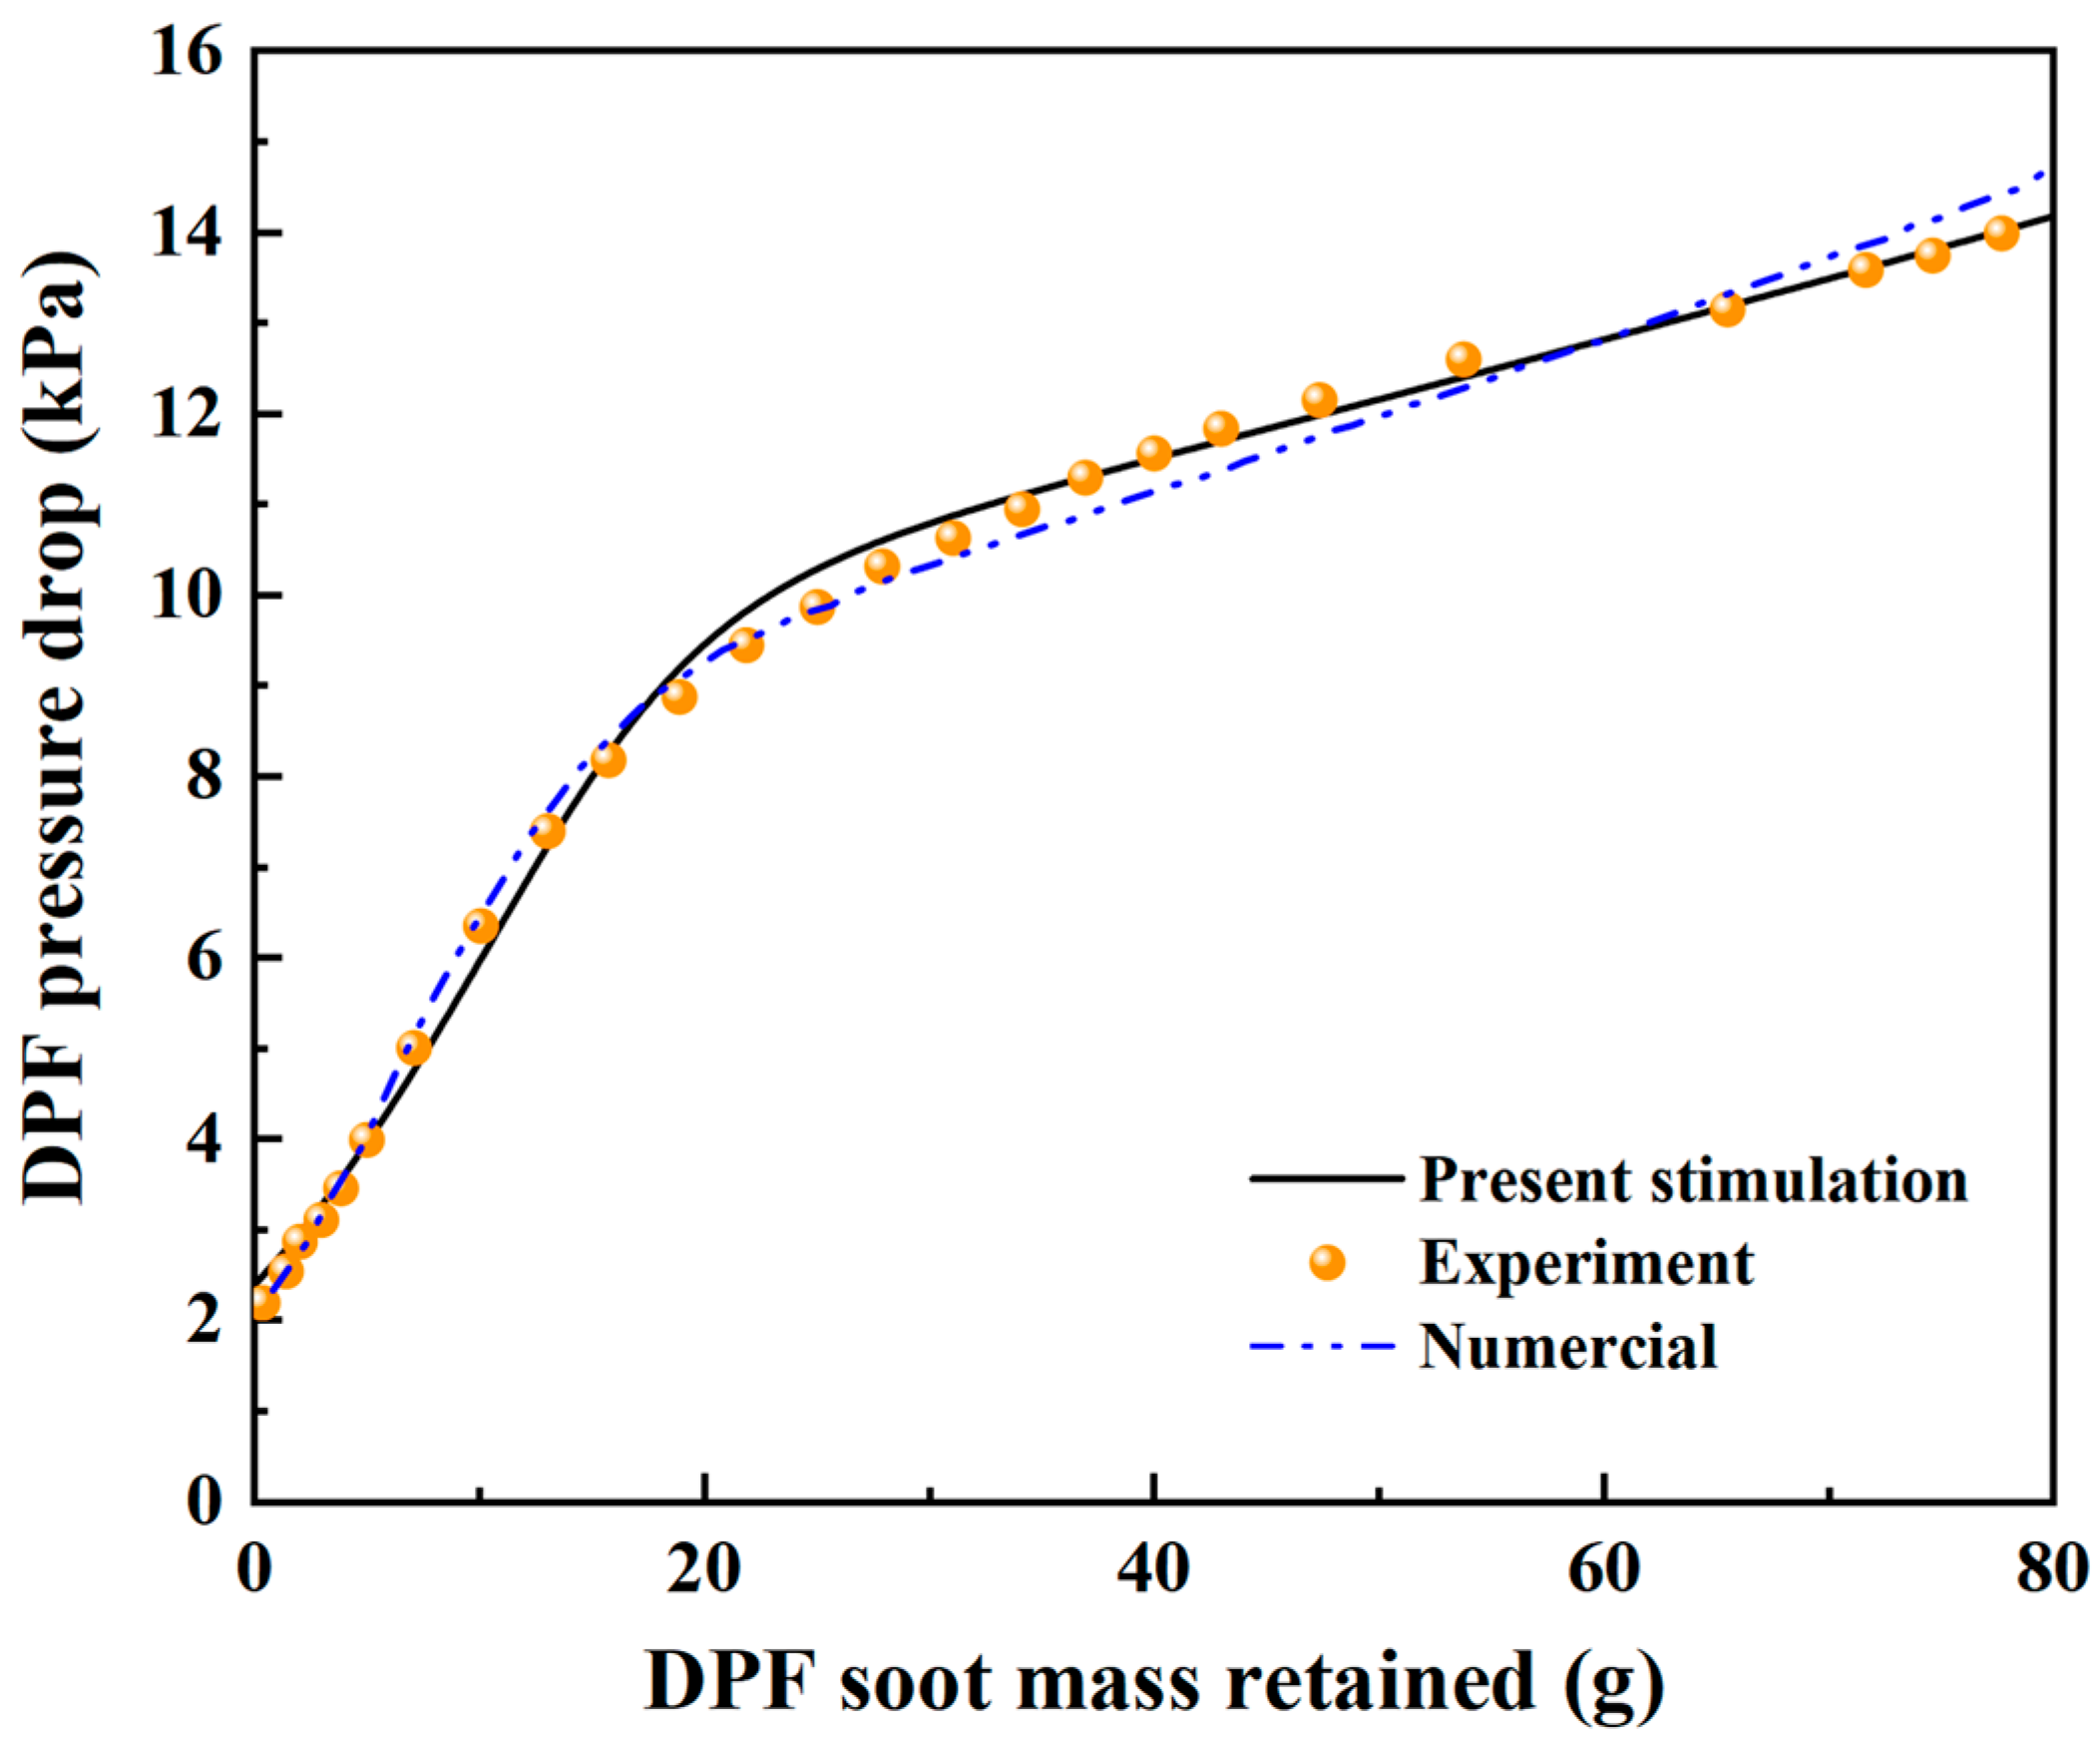
To verify the accuracy of the established model, the numerical analysis results by Lupše et al. [23] and experimental data by Konstandopoulos et al. [44] were adopted as benchmarks. Under the operating conditions of an inlet flow rate of 0.236 m3/s, a temperature of 260 °C, and a particulate mass flow rate of 18 g/h, the performance variation of a clean DPF throughout the entire soot loading process (0–80 g) was simulated. Under rated load and rated speed, the emission data of the DPF were tested under different operating conditions. Simulation verification demonstrated that, across these conditions, both pressure drop and initial filtration efficiency exhibited consistent behavior [43].
Figure 2 presents the comparison between the simulation results of this study and the literature data. It can be observed that the variation trends of the two are highly consistent, and the error is maintained at a low level below 3%. This indicates that the established model has sufficient predictive accuracy and can meet the requirements of engineering analysis.

2.3. Multi-Objective Optimization Framework of the Hybrid Method

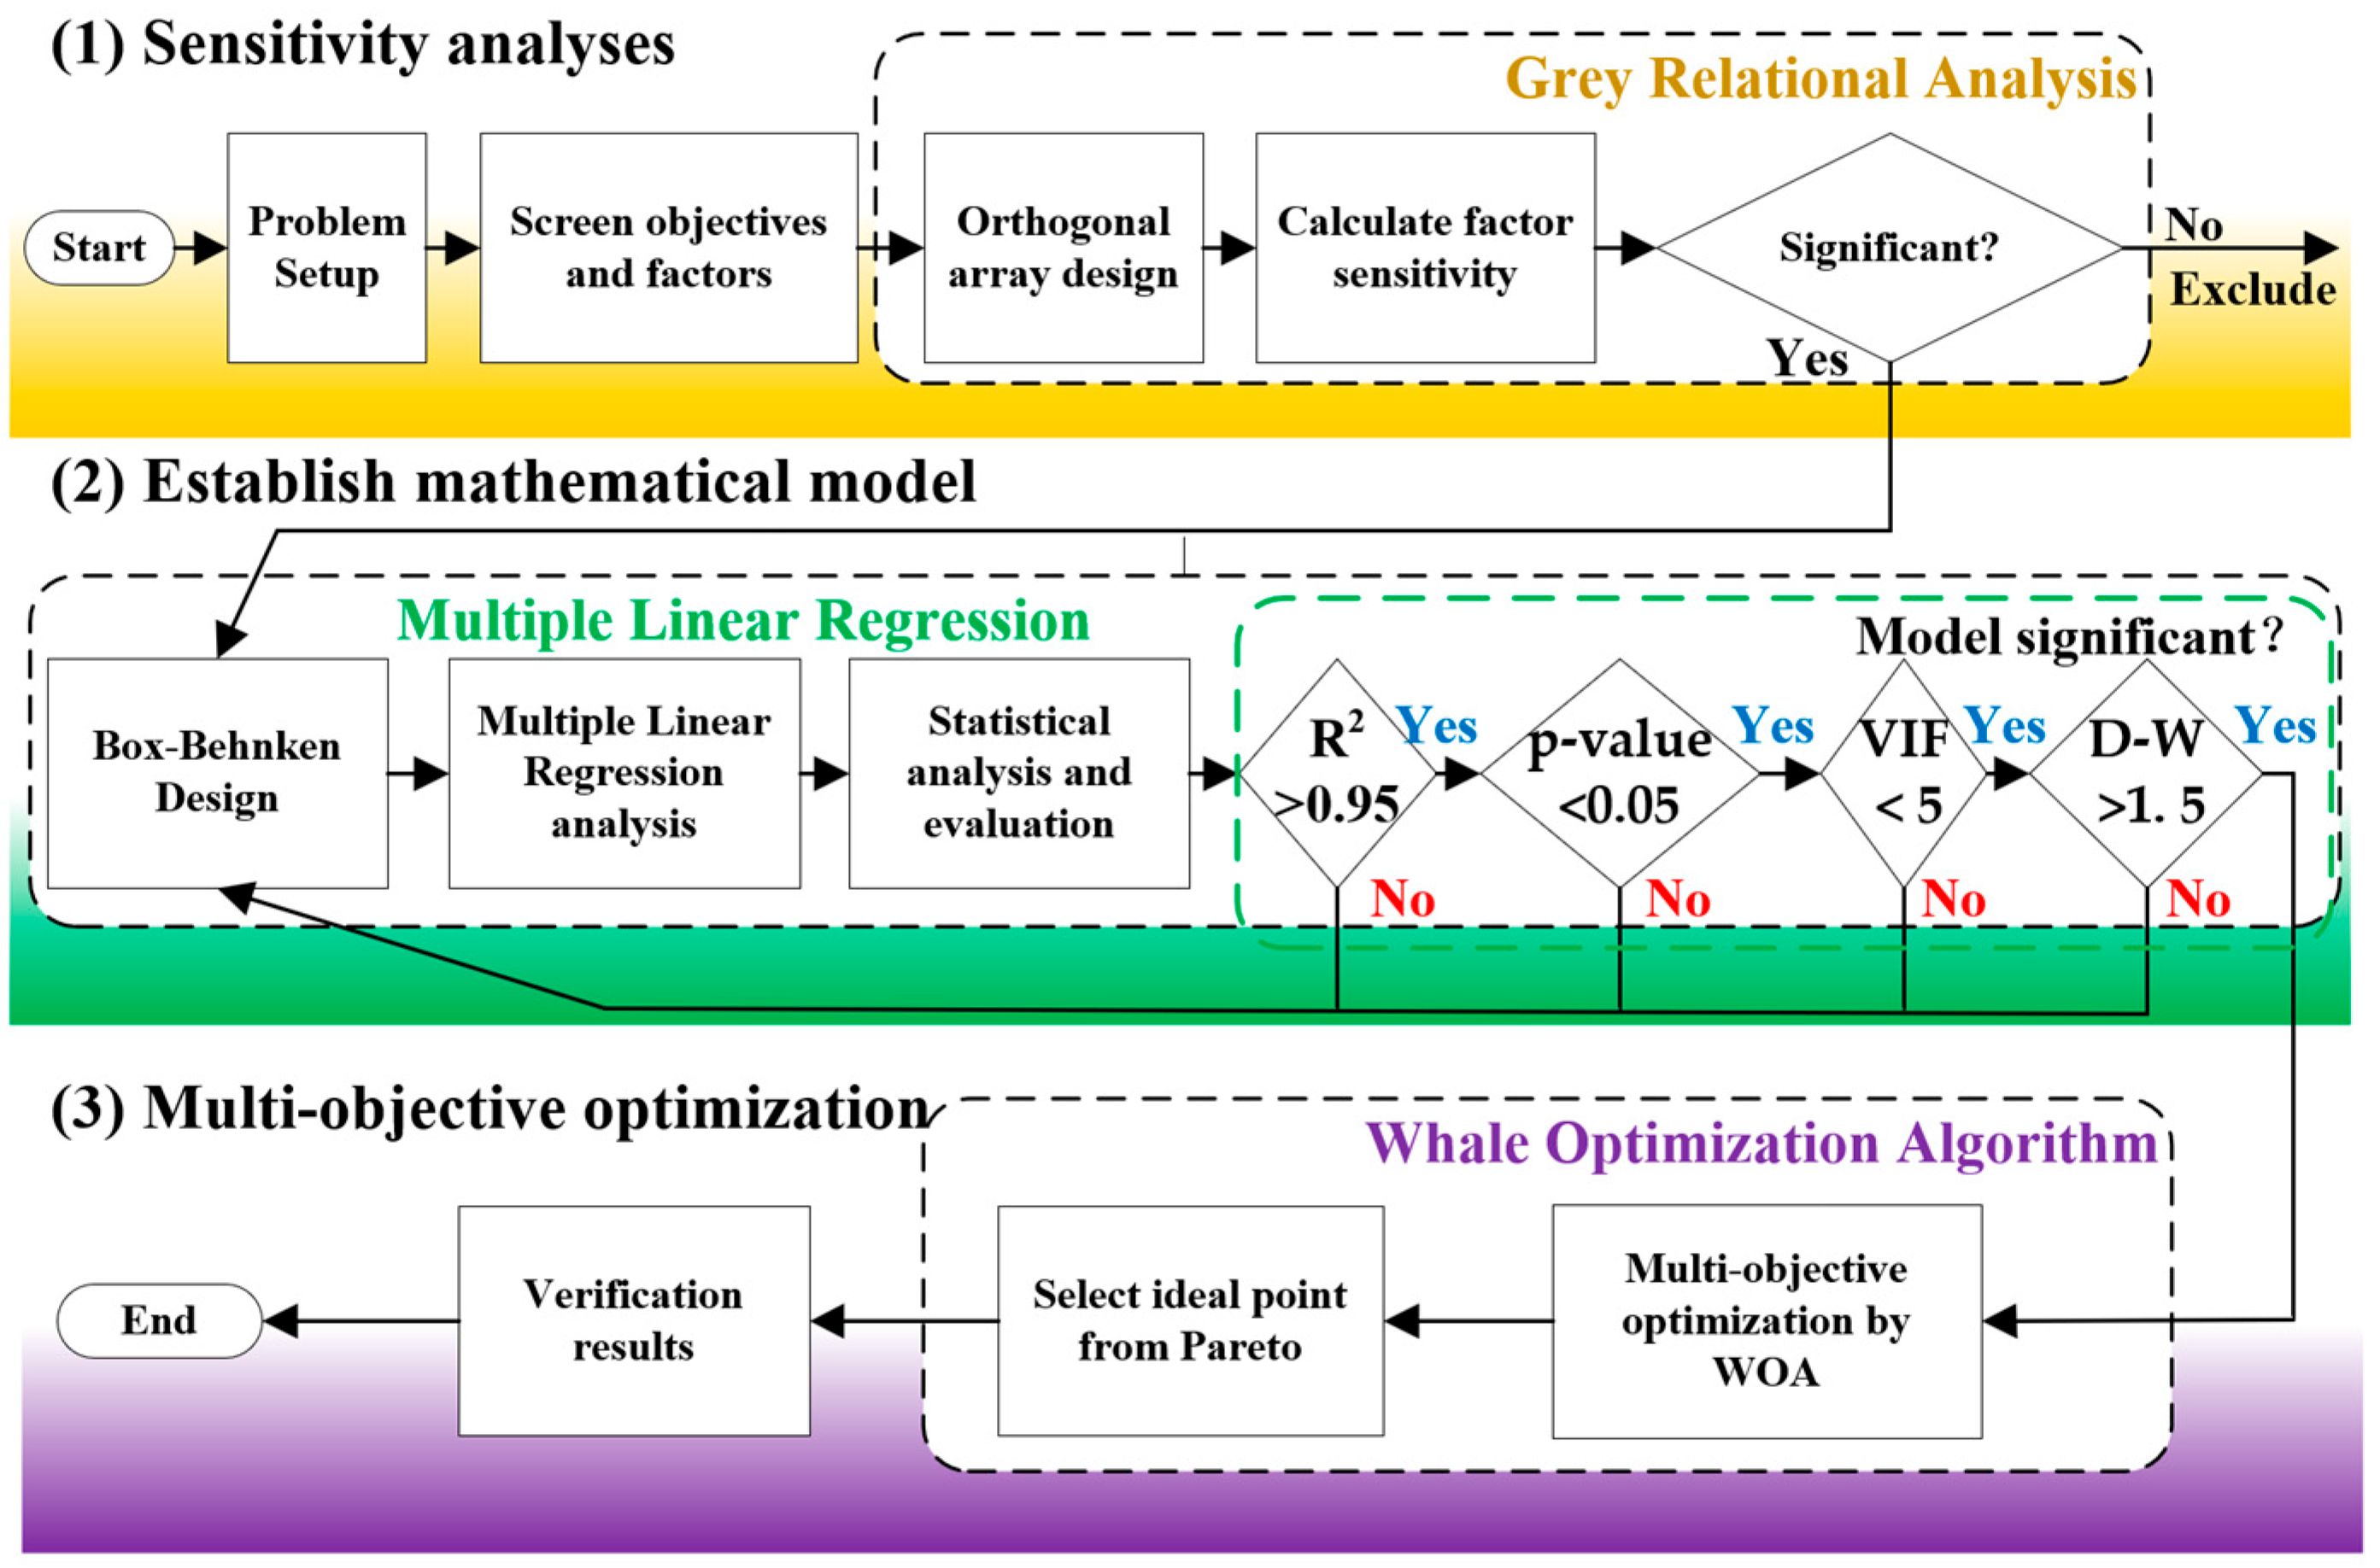
The overall optimization framework for the DPF is illustrated in Figure 3. The optimization process consists of three steps: (1) Sensitivity analysis of structural parameters based on orthogonal experimental design and GRA; (2) Establishment of the mathematical mapping relationship between structural parameters, initial filtration efficiency, and pressure drop via MLR; (3) Solution of the multi-objective problem based on the WOA. The detailed workflow is presented in Figure 3.

2.3.1. Grey Relational Analysis

GRA has been widely applied in multi-factor complex systems, owing to its advantages of low requirements on sample size, no need for data to follow a specific distribution, and effective handling of uncertain systems. To gain a more accurate understanding of the degree of influence of each factor on the system, GRA is often used for quantitative research. For the basic principles and classical calculation models of grey relational analysis, reference can be made to the relevant research by Zhang et al. [43]. In this research, the dataset was derived from CFD simulations and orthogonal experimental design. With the initial filtration efficiency and pressure drop at a soot deposition amount of 80 g (hereafter referred to as ‘pressure drop’) as the research objectives, the degree of influence of eight structural parameters—diameter (D), length (L), wall thickness (w), porosity (λ), pore diameter (d), channels per square inch (CPSI), inlet channel diameter, and inlet channel length—was evaluated. Notably, no existing research has demonstrated which of the two indicators (initial filtration efficiency or pressure drop) is more important. Therefore, a comprehensive index R3 was introduced in this study to characterize the overall degree of influence. The calculation method of the comprehensive sensitivity index R3 is shown in Equation (1), which is derived from the average of the grey relational grade of pressure drop (R1) and initial filtration efficiency (R2):
R 3 = w 1 R 1 + w 2 R 2
This study conducted a sensitivity analysis of several unequal-weight combinations, and the results showed that the overall ranking trend remained largely consistent, with only minor differences in the relative order of individual schemes. Equal weighting was found to effectively capture the overall pattern. Therefore, equal weights were assigned to the pressure drop and initial filtration efficiency, w1 = w2 = 0.5.

2.3.2. Multiple Linear Regression

MLR aims to establish a linear quantitative relationship model between one or more independent variables and dependent variables. This algorithm uses the least squares method to solve for the optimal fitting line, minimizing the sum of squared errors between the predicted values and actual values of all data points. MLR is applied in scenarios where multiple input variables exist. In this work, based on the dataset obtained from the BBD, mathematical regression equations for initial filtration efficiency and pressure drop with respect to five key structural parameters were established. Statistical diagnostics including the VIF, p-value, and Durbin–Watson test confirmed the accuracy, significance, and reliability of the prediction models, thereby providing predictive inputs for the optimization algorithm.

2.3.3. Whale Optimization Algorithm

WOA is a bio-inspired optimization algorithm that mathematically models three behaviors of humpback whales—encircling prey, spiral hunting, and random search—to balance global exploration and local exploitation [45]. Compared with traditional algorithms such as NSGA-II, Particle Swarm Optimization (PSO), and GWA, WOA demonstrates superior adaptability to small datasets. NSGA-II often suffers from local optima due to limited population diversity [46,47]. PSO shows reduced convergence efficiency under insufficient data support, and GWA exhibits weak robustness when handling small-sample uncertainties [48].
In contrast, WOA maintains strong global exploration through its bubble-net feeding mechanism and enhances local exploitation via spiral search, thereby overcoming these limitations [49]. Zhou et al. [50] employed the WOA in combination with Latin hypercube sampling to construct a surrogate model database, which achieved high convergence speed and strong global search capability with a limited number of parameters. Ma et al. [51] proposed a dynamic probability strategy to enhance the local search ability of WOA during global exploration. The results demonstrated that strategy optimization enabled high accuracy under small-data conditions. WOA exhibits strong convergence and adaptability to small datasets, making it well suited for multi-objective optimization problems aimed at maximizing filtration efficiency while minimizing pressure drop.

2.3.4. Screening of Optimization Objectives and Indicators

Structure is a critical factor influencing the overall capture performance of DPF. However, not all structural parameters exert a significant impact on capture performance; thus, screening is necessary in this study. Based on recommendations from existing research [36], this study initially selected eight candidate variables for sensitivity analysis to identify the optimal ones. Their initial values and optimization ranges are presented in Table 2.
Regulations regarding PM emission limits require DPF to maintain a high level of filtration efficiency during operation. According to the operating characteristics of DPF the filtration efficiency of a clean, porous media surface remains at a low level when a dense soot cake filtration layer has not yet formed. Therefore, initial filtration efficiency is selected as one of the optimization objectives. Furthermore, as soot clogs the micropores of the porous media and impedes exhaust gas flow, the pressure-drop generated across the DPF affects the fuel economy and operational safety of the engine. In our previously published research, filtration efficiency and pressure drop exhibit a proportional relationship with the accumulation of particulate deposits. Consequently, pursuing high initial filtration efficiency and low pressure drop involves a distinct trade-off. The initial filtration efficiency (Ei) of a clean DPF and the pressure drop (P) at a soot load of 80 mg were selected as the optimization objectives.

3. Results and Discussion

3.1. Parameter Sensitivity Analysis

To achieve efficient optimization, GRA was employed to conduct sensitivity analysis on the orthogonal experimental table of eight structural parameters of the DPF. The results of the orthogonal experimental design are presented in Table 3.
By employing the aforementioned mathematical methods, the sensitivity indices of each structural parameter to the initial filtration efficiency and pressure drop, as well as the comprehensive sensitivity index, were calculated. The results are presented in Table 4.
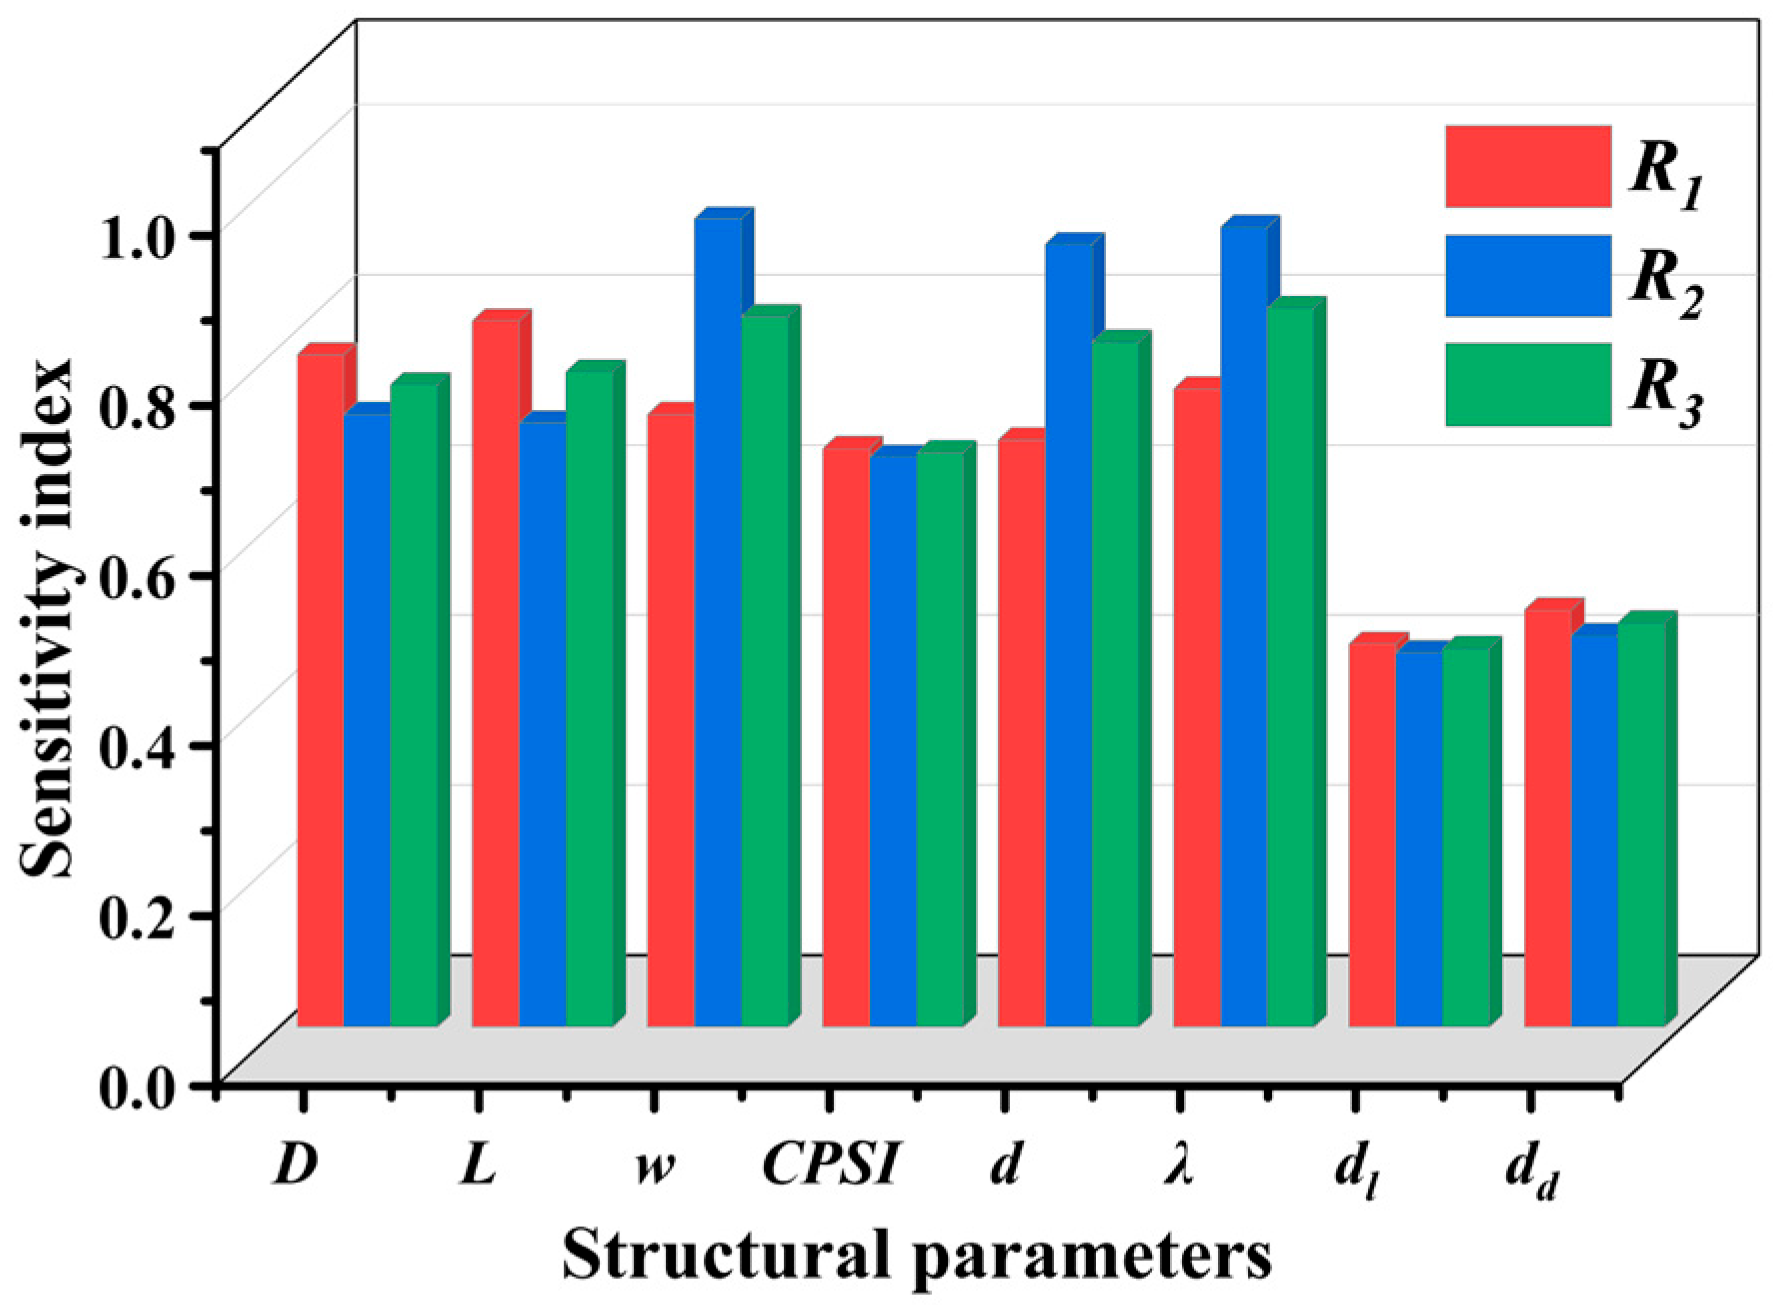
As shown in Figure 4, for pressure drop, L exerts the greatest influence, followed by D, λ, w, d, and CPSI. In contrast, dd, and dl show only minor effects. Increasing L enlarges the filtration channel volume and the surface area of the porous wall, thereby markedly reducing gas flow resistance. A similar trend is observed with D, since enlarging D does not improve the turning angle of axial flow, and the porous medium remains the dominant contributor to pressure drop, its sensitivity is lower than that of L. λ directly governs the gas flow state in the porous region by determining the effective flow volume. By comparison, w and d affect only the frictional resistance along the flow path by extending the path length or altering pore size, with w additionally constrained by λ. Their influence is therefore less pronounced than that of λ.
With respect to initial filtration efficiency, w emerges as the most critical factor, followed by λ, d, D, and L. CPSI, dd, and dl again exhibiting relatively minor impacts. An increase in w extends the particle travel distance through the filter wall, substantially improving capture probability and thus making it the dominant factor for filtration efficiency. λ influences efficiency by altering channel density: low λ generates narrower channels capable of capturing more fine particles, giving it the second-most significant effect. d directly determines the cutoff size of particles that can be intercepted—smaller d strengthens filtration of fine particles, though this effect is constrained by the distribution of λ. Enlarging D expands the total filtration area and enhances particle interception capacity. However, this benefit is limited by flow distribution uniformity, making its influence weaker than that of d. Although increasing L raises particle residence time within the channels, its contribution to efficiency improvement per unit area remains marginal, rendering L the least influential among the major parameters.
Considering the sensitivity to both initial filtration efficiency and pressure drop, the structural factors are ranked by their sensitivity in the following order: λ > w > d > L > D > CPSI > dd > dl. Analysis results indicate that parameters with significant effects on filtration performance generally exhibit a comprehensive sensitivity index above 0.7, whereas non-significant ones are typically below 0.6, demonstrating a clear threshold. Structural parameters with a comprehensive R3 > 0.7 were thus identified as the key factors influencing DPF capture performance [18]. Accordingly, w, D, L, λ, and d were selected as independent variables for the multi-objective optimization of pressure drop and initial filtration efficiency [35,39].

3.2. Regression Prediction

In the context of interactions among factors, RSM is a classical method capable of deriving mathematical regression models based on a small amount of data. BBD is an experimental design method based on RSM. It enables the construction of a quadratic regression model between factors and response variables with relatively few experimental runs, thereby efficiently analyzing both the interactions among factors and their nonlinear effects on the responses. The core principle of BBD lies in its simplified arrangement of ‘edge midpoints plus a center point’, where experimental runs are placed at the midpoints of the edges of a factorial cube. Compared with the central composite design, BBD requires fewer design points. Each factor is always set at three levels, and the design is applicable when at least three or more factors are involved. BBD was applied to design 46 multi-factor simulation experiments with five factors at three levels, comprising 20 edge-midpoint runs and 26 center point runs. The experimental design scheme can be exported via the experimental design software Design-Expert 10.0.1. All factors were within the optimization ranges, and the detailed values are presented in Table 5.
For the convenience of expression, English letters are used to represent the parameters in the following context: diameter—A, length—B, wall thickness—C, porosity—D, and pore diameter—E. Equations (6) and (7) represent the regression formula for pressure drop and the initial filtration efficiency, respectively. The formula represents the cross-influence of the corresponding multiple objective parameters.
P = + 14.052 7.4938 A 8.3094 B + 5.3344 C + 7.8113 D + 1.1888 E + 4.3775 A B 1.7925 A C 2.10 A D 0.545 A E 1.9775 B C 2.4575 B D 0.65 B E + 3.48 C D + 0.2475 C E + 0.2475 D E + 2.3138 A 2 + 3.6713 B 2 + 0.43792 C 2 + 3.3054 D 2 + 3.75 × 10 3 E 2
E i = + 65.562 + 6.9581 A + 7.2925 B + 14.874 C + 16.066 D 13.835 E + 0.065 A B + 0.0775 A C 0.215 A D + 0.365 A E + 0.1525 B C 0.3225 B D + 0.47 B E + 0.015 C D + 0.3025 C E + 1.1375 D E 0.57813 A 2 1.2573 B 2 4.3065 C 2 0.70062 D 2 + 1.4077 E 2

3.3. Statistical and Diagnostic Methods

In the accuracy evaluation of mathematical regression models, statistical methods are typically employed for assessment. In the specific analysis of this study, reliable statistical evaluations include the p-value, VIF, and D-W statistic. Among these, the p-value corresponds to the F-test result for the overall significance of the multiple regression model, and it is used to quantify the degree of relationship between the observed data and the validity of the model. When the p-value is less than 0.05 (significance level α = 0.05), the null hypothesis can be rejected at the 95% confidence level, indicating that the model is statistically significant. The VIF is a key indicator for diagnosing multicollinearity among independent variables. Its calculation is based on the auxiliary regression model of each independent variable against the remaining independent variables, reflecting the degree to which the information of the dependent variable is repeatedly explained. Generally, a VIF < 5 indicates weak multicollinearity among independent variables, which will not significantly distort the estimation accuracy of regression coefficients or the results of significance tests. The D-W statistic focuses on testing the autocorrelation of the residual sequence. By measuring the ratio of the sum of squared differences between adjacent residuals to the sum of squared residuals, it evaluates whether the residuals satisfy the independence assumption. When the D-W value is close to 2, it indicates that there is no significant autocorrelation in the residual sequence, which meets the basic requirement of multiple linear regression for residual independence. Table 6 and Table 7 present the statistical evaluation results of the initial filtration efficiency and pressure drop, respectively. According to the above criteria, the regression prediction accuracy of the initial filtration efficiency and pressure drop meets the research requirements.

3.4. Interactive Effects of Parameters

By controlling two parameters individually while keeping other parameters constant, the interactive effects between the two factors were investigated using the regression model output by MLR.
As shown in Figure 5a–f, in the mechanism governing initial filtration efficiency, w, λ, and d exert a more significant influence than overall dimensions D and L, a conclusion supported by fluid mechanics and porous media theory. According to the Darcy–Weisbach equation and the Hagen–Poiseuille law, pressure drop increases linearly with L and is inversely proportional to d4. Thus, increasing w markedly extends the penetration path and enhances particle capture probability. However, excessively low λ produces overly dense channels, leading to surface deposition on the filter wall, which offsets the benefits of higher w and simultaneously increases pressure drop. In contrast, higher λ alleviates clogging and improves permeability but weakens the interception effect associated with increased w, indicating an optimal matching region between w and λ.
The coupling of λ and d reflects a synergistic effect: smaller d enhances the sieving function of the DPF but also increases velocity and pressure drop. When combined with short L, high central velocity reduces the capture effect of the porous media domain, whereas moderate extension of L increases particle residence time but contributes little to unit-area efficiency. Overall, at the initial stage, w, λ, and d dominate filtration efficiency through their influence on permeability, flow distribution, and penetration path, exerting a substantially greater effect than D and L, and underscoring the central role of material characteristics in DPF optimization.
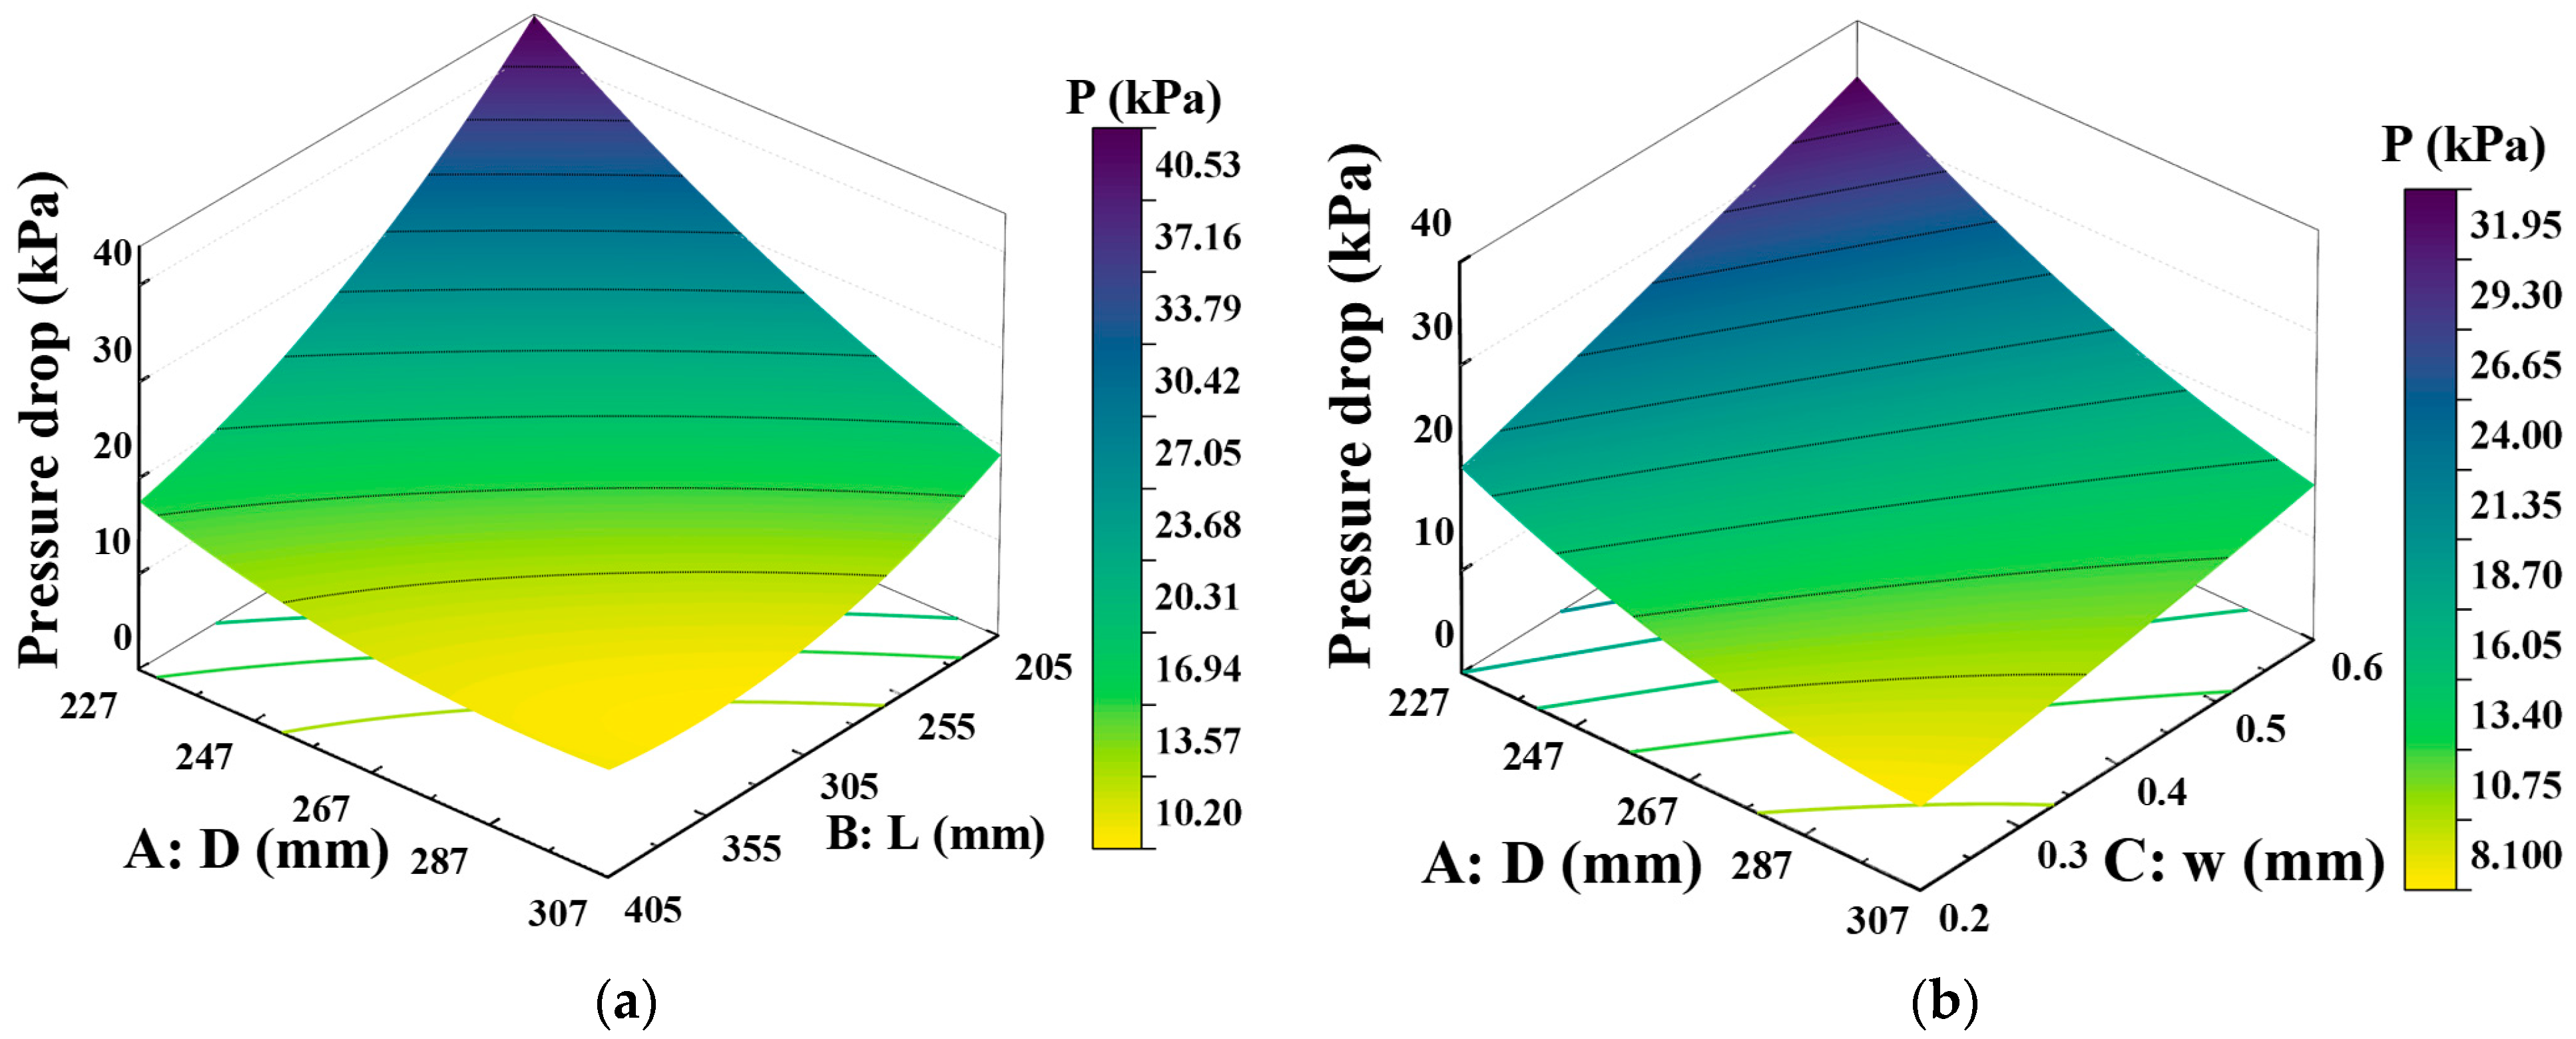
Based on the sensitivity analysis results, Figure 6 illustrates the interactive effects of the DPF structural parameters (D, L, w, and λ) on pressure drop. As shown in Figure 6a–f, the pressure drop increases approximately linearly with L. Under a constant volumetric flow rate, a reduction in D leads to a sharp rise in flow velocity, causing the pressure drop to increase exponentially. Under microporous or low-Reynolds-number conditions, the Hagen–Poiseuille law further indicates that the pressure drop is inversely proportional to the fourth power of D. Thus, even a slight decrease in D can result in a substantial increase in pressure drop. Regarding the interaction of two factors, the combination of small D and large L is most likely to cause a sharp rise in pressure drop: the increase in L accumulates frictional resistance along the flow path, while the decrease in D significantly elevates velocity, and the superposition of these effects forms the peak region of maximum pressure drop. In contrast, when a large D is combined with a long L, the velocity reduction caused by the increased D can partially offset the resistance introduced by the longer L, thereby slowing the growth rate of the pressure drop.
In addition, the interaction between D and λ mainly reflects the balance of flow capacity. A small D inherently leads to higher velocity and resistance, and a lower λ further reduces permeability, amplifying the resistance effect. Conversely, the combination of a large D with a high λ can, through the dual advantages of expanded filtration area and increased flow cross-section, effectively suppress the rise in maximum pressure drop. The relationship between w and λ demonstrates a compensatory effect: increasing w prolongs the gas penetration path but simultaneously increasing λ enlarges the flow channels, mitigating the growth in resistance and preventing an excessive rise in pressure drop.
However, the combination of low λ and a thick w will lead to the superposition of resistances—due to the long flow path and dense channels—driving up the maximum pressure drop. The interaction between L and λ is characterized by the trade-off between flow path and circulation: the high resistance caused by a long L can be partially neutralized by the low flow resistance of high λ. In contrast, when a long L is paired with low λ, the resistance will increase substantially due to the combined effects of the long flow path and blocked channels. Therefore, regarding pressure drop, the influence of the overall dimensional characteristics (D, L) is more significant than that of the filter substrate characteristics (w, λ, d).

3.5. Optimization Results of the Whale Optimization Algorithm

The purpose of optimizing with the WOA is to obtain combinations of structural parameters that can simultaneously optimize the initial filtration efficiency and pressure drop within the solution space, while avoiding extreme operating conditions. Recommended settings for the WOA are as follows: The population size is set to 50, which ensures a balance between the comprehensiveness of the search and computational efficiency; the maximum number of iterations is set to 100, which is sufficient to support the algorithm in completing the optimization process from global exploration to local exploitation; the control parameter a adopts a strategy of linearly decreasing from 2 to 0, realizing the dynamic balance between exploration and exploitation capabilities; the probability parameter p is fixed at 0.5 to balance the execution probability of the two strategies: bubble-net hunting and random search; and the spiral parameter b is set to 1, ensuring that individuals form a stable spiral movement trajectory around potential optimal solutions.
In selecting the experimental parameters, the parameter sensitivity and convergence behavior of the optimization algorithm were explicitly incorporated. Sensitivity analysis was conducted as follows. All configurations were compared within the same feasible domain and under identical constraints to avoid confounders beyond the algorithm’s hyperparameters; Stage 1 (coarse screening). The population size and the maximum number of iterations was varied over N ∈ {20, 30, 50, 80, 100} and T ∈ {50, 100, 150, 200, 300} respectively, while holding all other settings fixed. Each configuration was executed in 30 independent runs to assess run-to-run stability of the outcomes; Stage 2 (algorithmic factors). We examined the effects of the branch probability and spiral parameter with p ∈ {0.3, 0.5, 0.7} and b ∈ {0.5, 1.0, 1.5}, using N = 50 and T = 100 as the baseline configuration. The goal was to select p and b values that improve the rate of convergence while maintaining acceptable stability. For each setting, we report the standard deviation and the median of the final best objective values; Stage 3 (stability verification). The algorithm with the modified parameters was re-evaluated using 30 additional independent runs to verify stable performance. Convergence validation. An early-stopping rule was adopted: if the improvement in the objective function over 10 consecutive iterations is less than 10−3, the run is terminated early; otherwise, optimization proceeds until the maximum iteration count is reached.
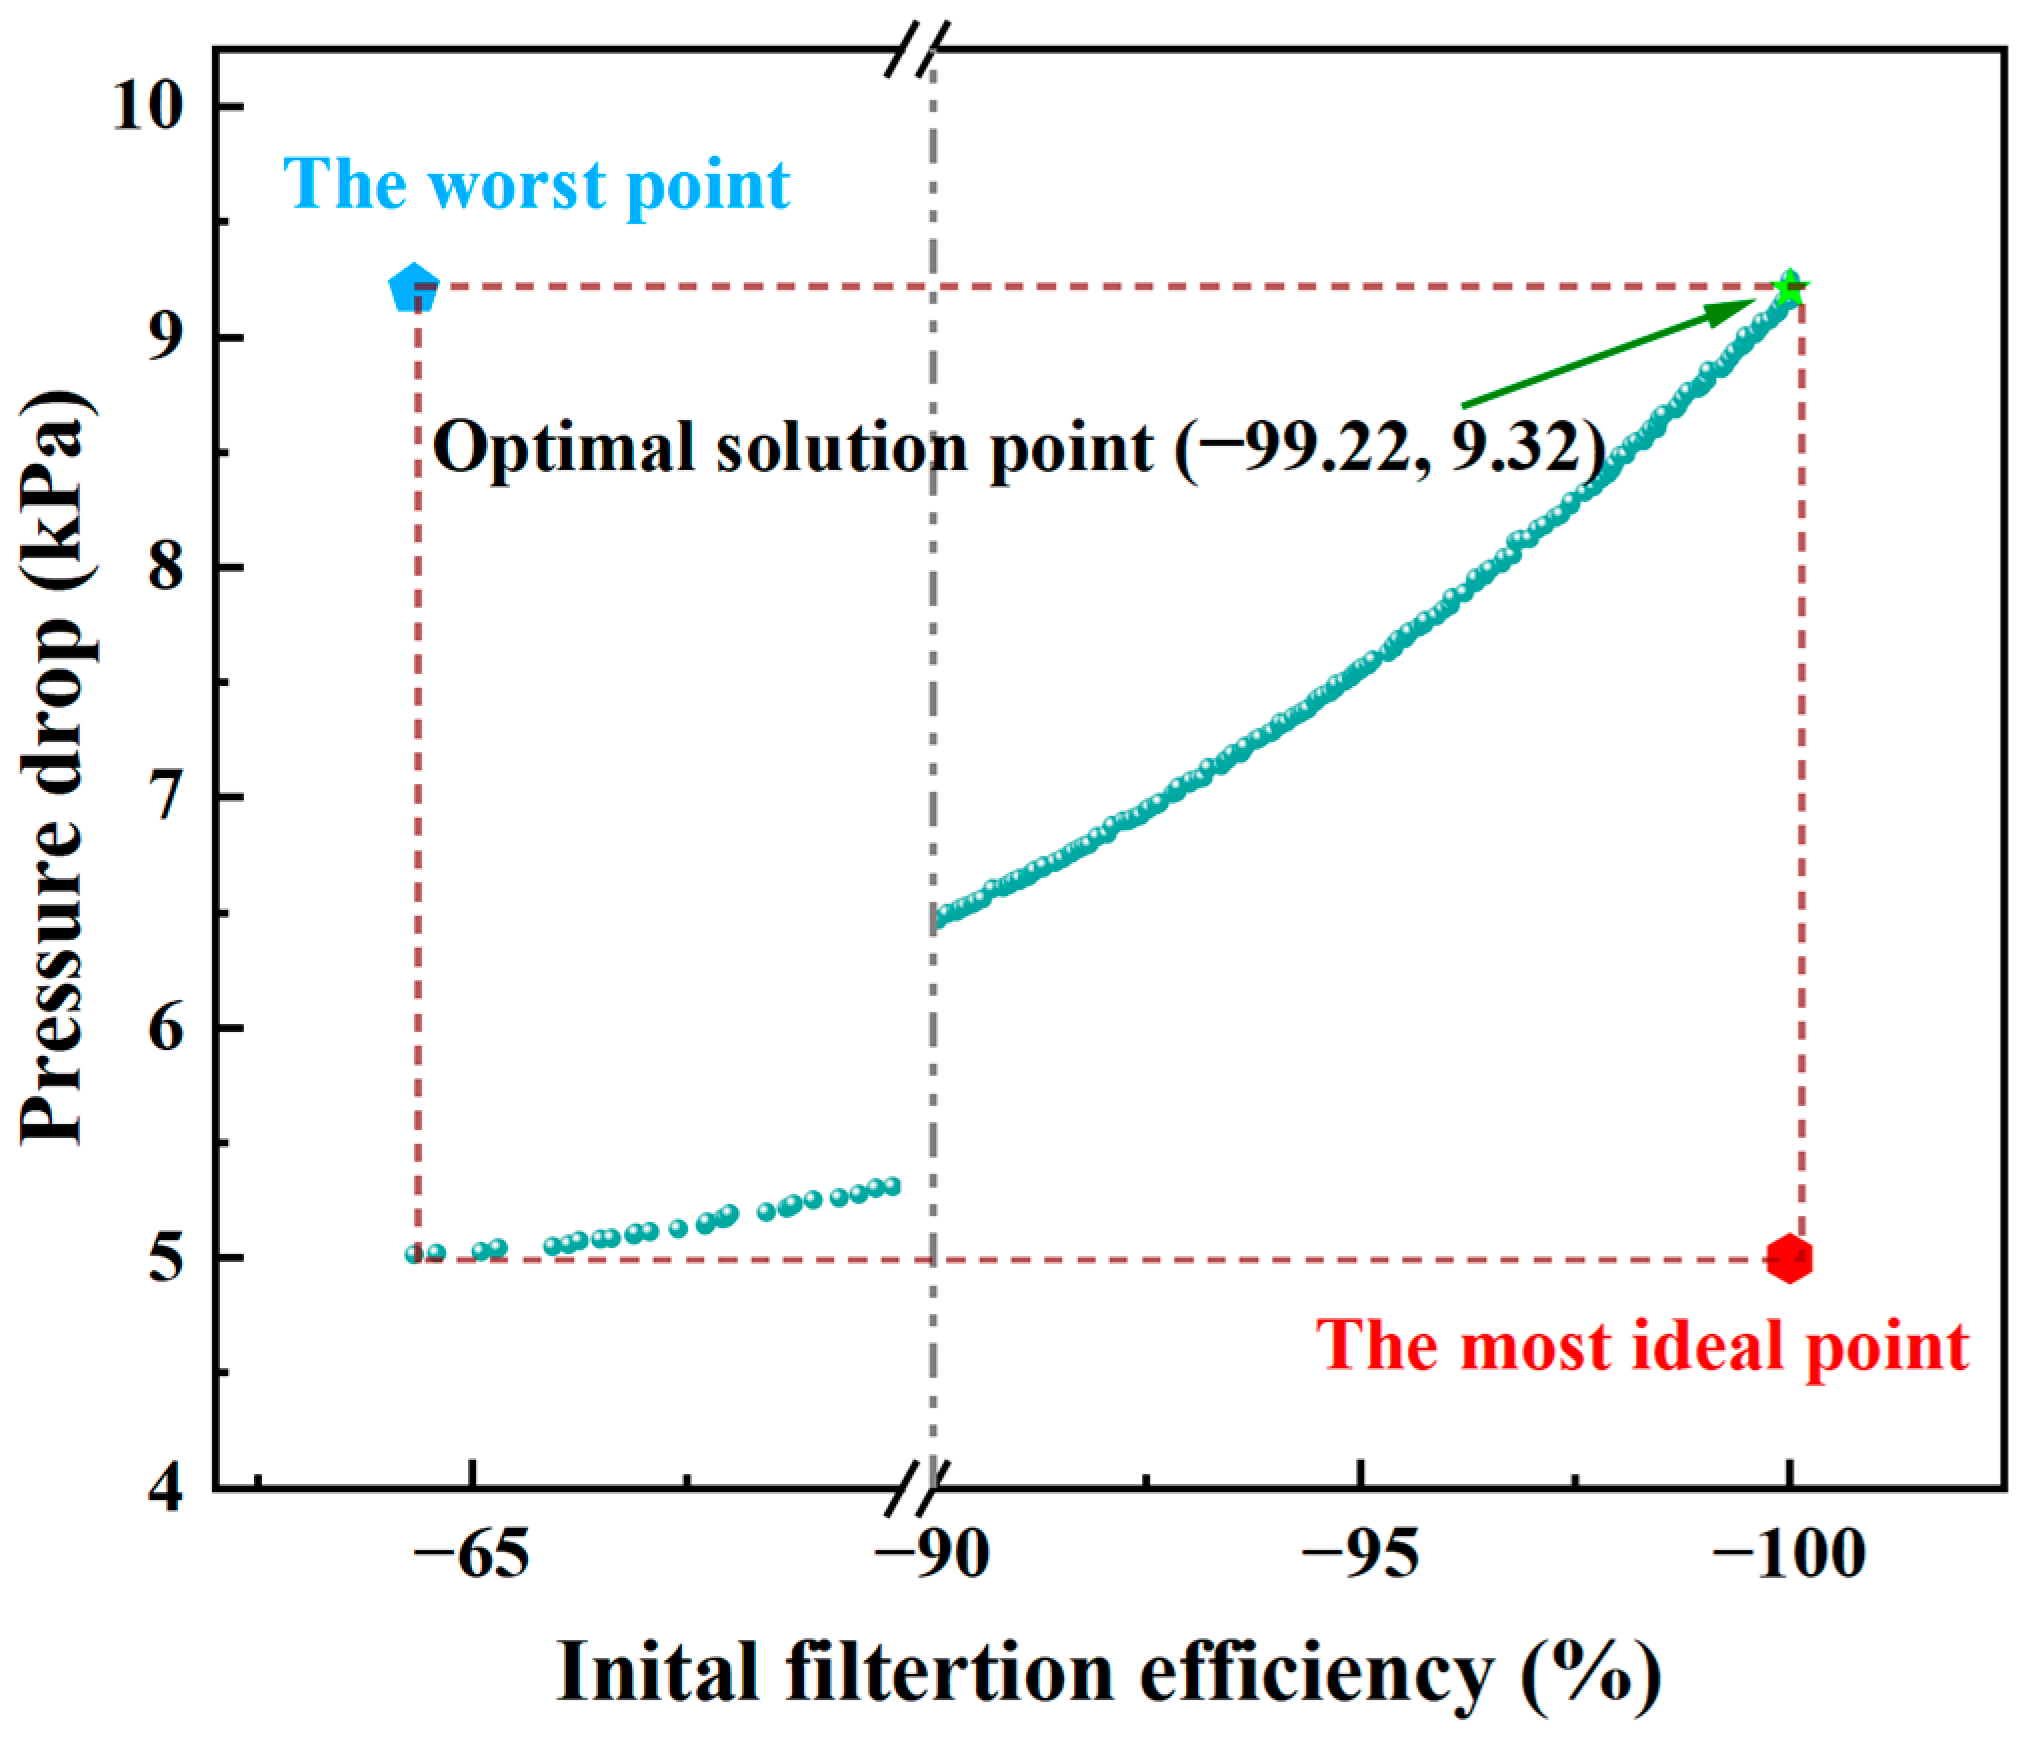
Figure 7 illustrates the Pareto frontier generated by the algorithm. Given the ongoing tightening of emission regulations, this study prioritizes the selection of solutions that ensure the DPF maintains efficient capture performance throughout its entire service life. In the process of selecting the optimal solution, different weighting factors for initial filtration efficiency and pressure drop can be applied to evaluate trade-offs. Based on the expert evaluation method, this study identified initial filtration efficiency as the central optimization criterion for determining the optimal solution. Optimal solution point is selected as the ideal solution on the Pareto frontier, as it maintains a filtration efficiency close to 100%, while exhibiting a relatively low pressure drop characteristic.
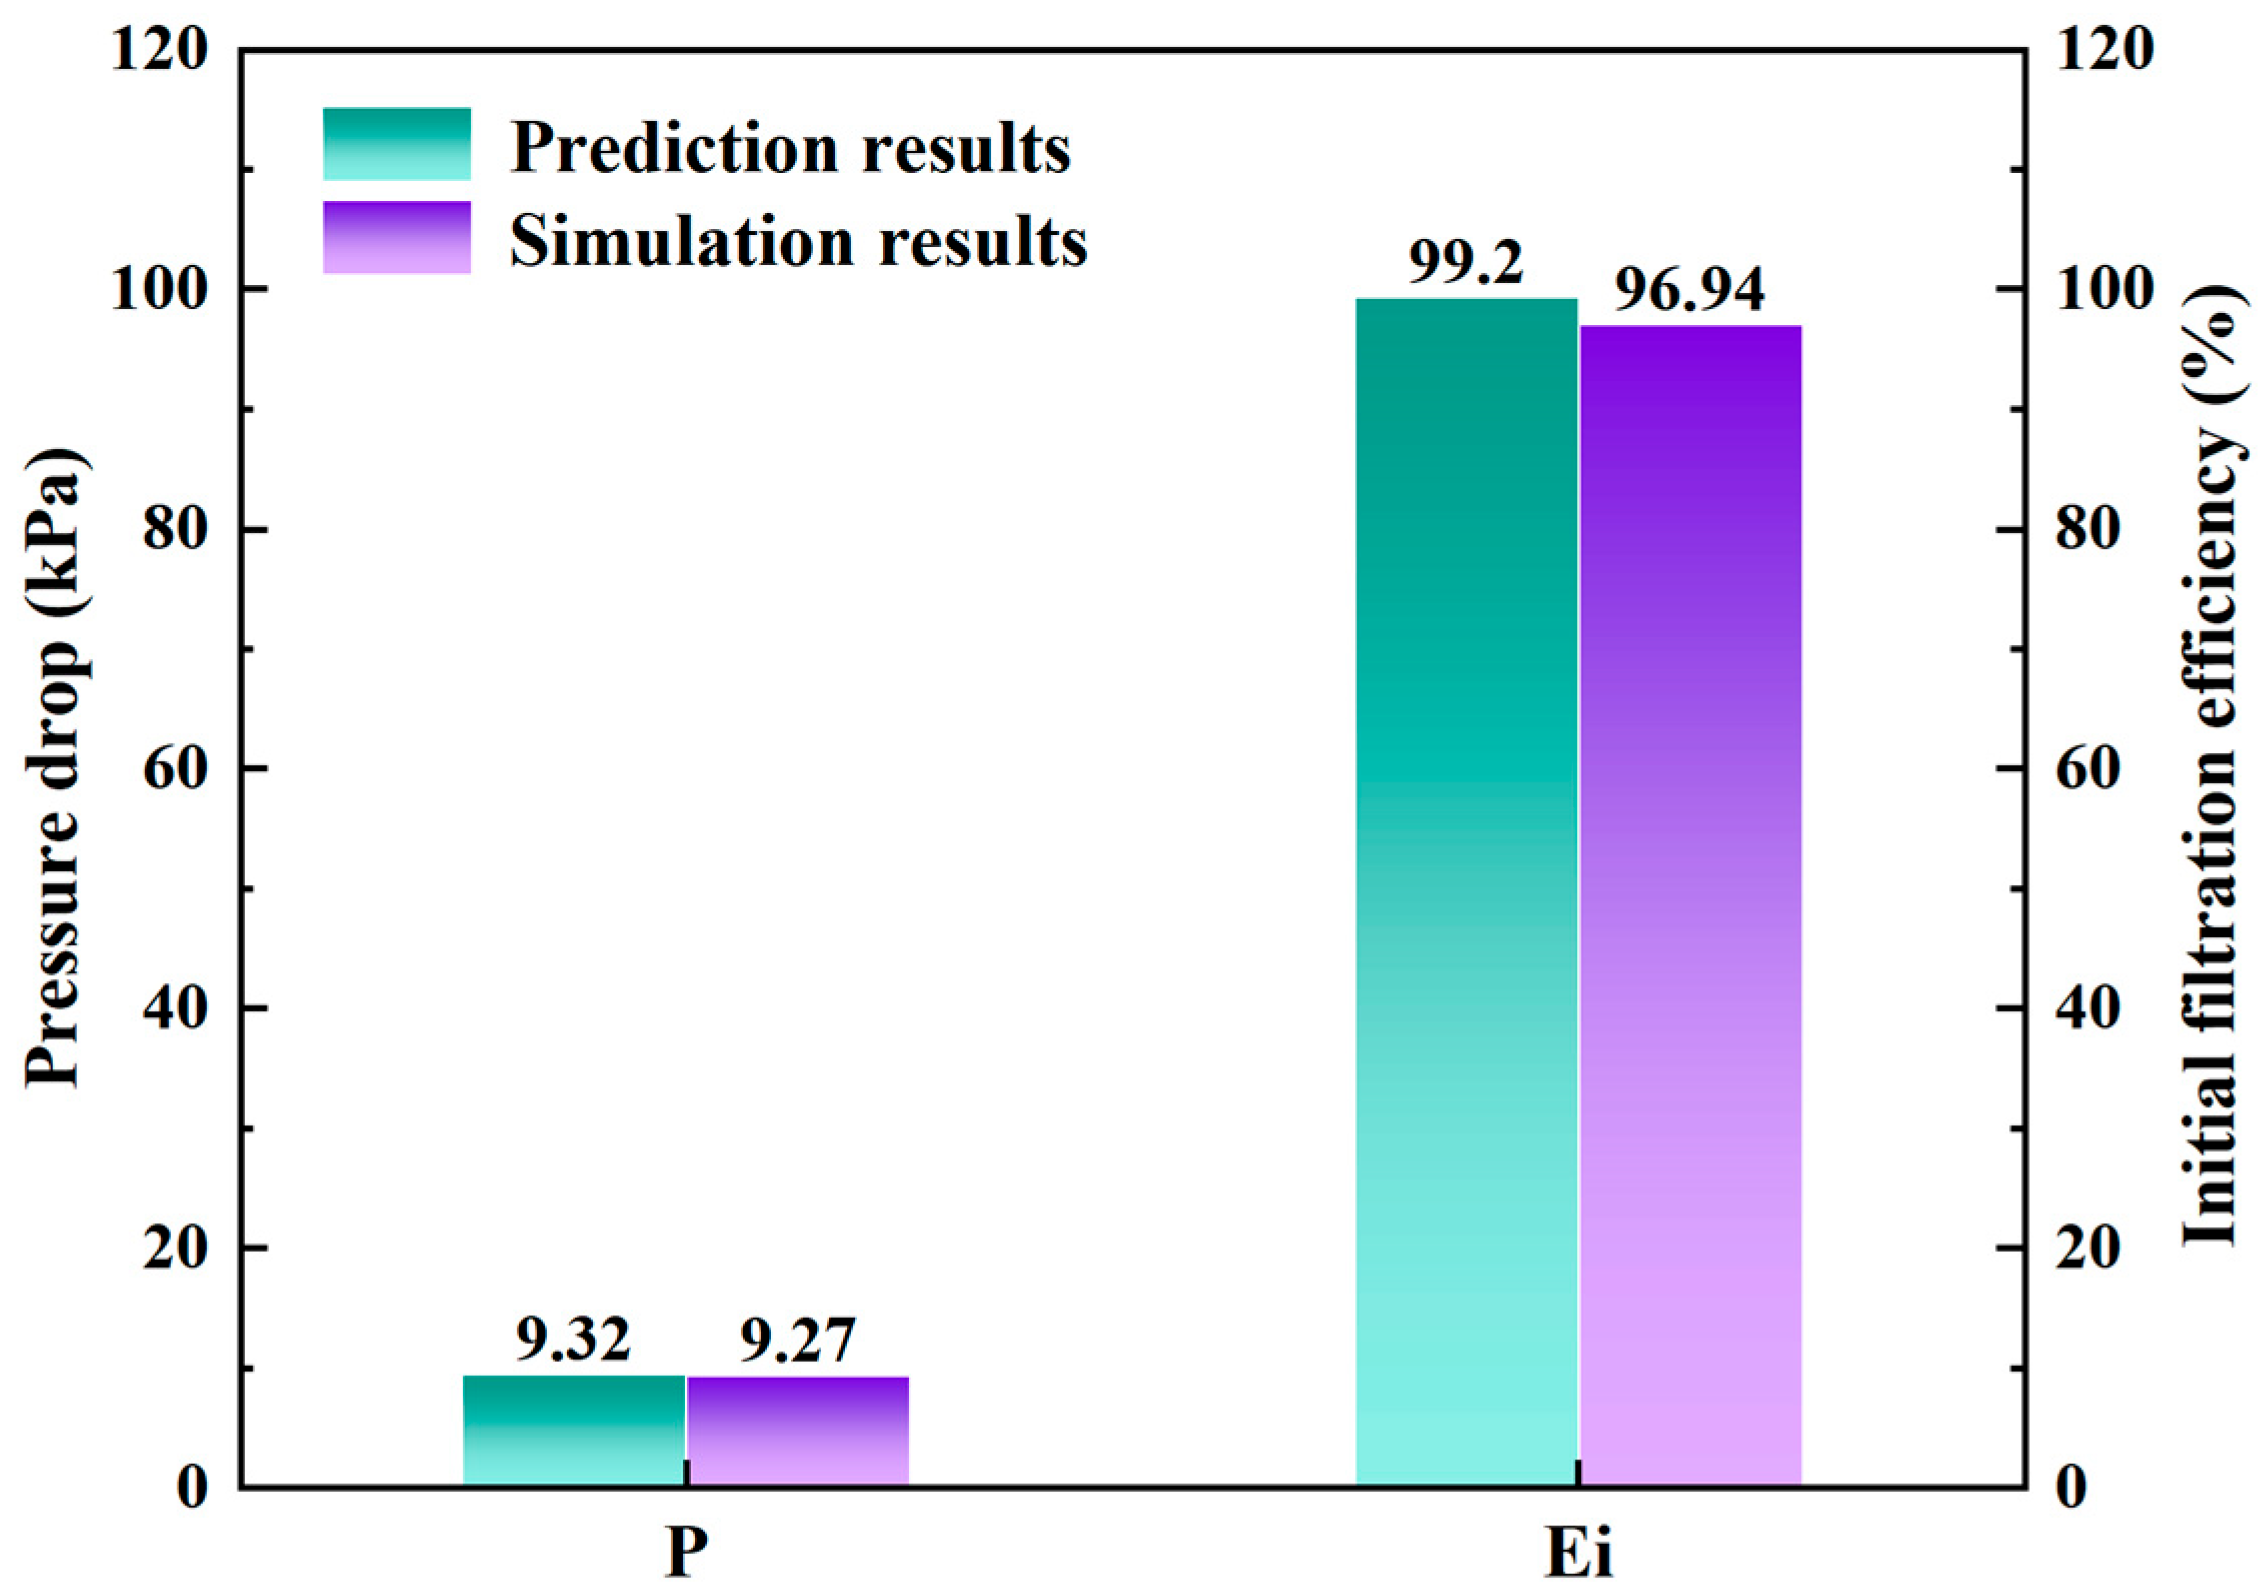
The WOA was employed to obtain the optimal solution set for the performance parameters of the DPF. Through optimal point screening, the final solution was determined with a pressure drop of 9.32 kPa and an initial filtration efficiency of 99.22%, and the corresponding optimized parameter scheme was obtained using the MLR prediction model. The comparison of structural parameters before and after optimization is presented in Table 8. The results indicate that, relative to the initial scheme, the optimized parameter configuration reduced the pressure drop by 34.27% while improving the initial filtration efficiency by 50.56%.
As shown in Figure 8, the error between the optimized prediction results and the experimental simulation results is controlled within 5%, which also verifies the reliability of the regression prediction model. Meanwhile, simulation experiments demonstrate that significant performance optimization can be achieved under the optimized parameters.
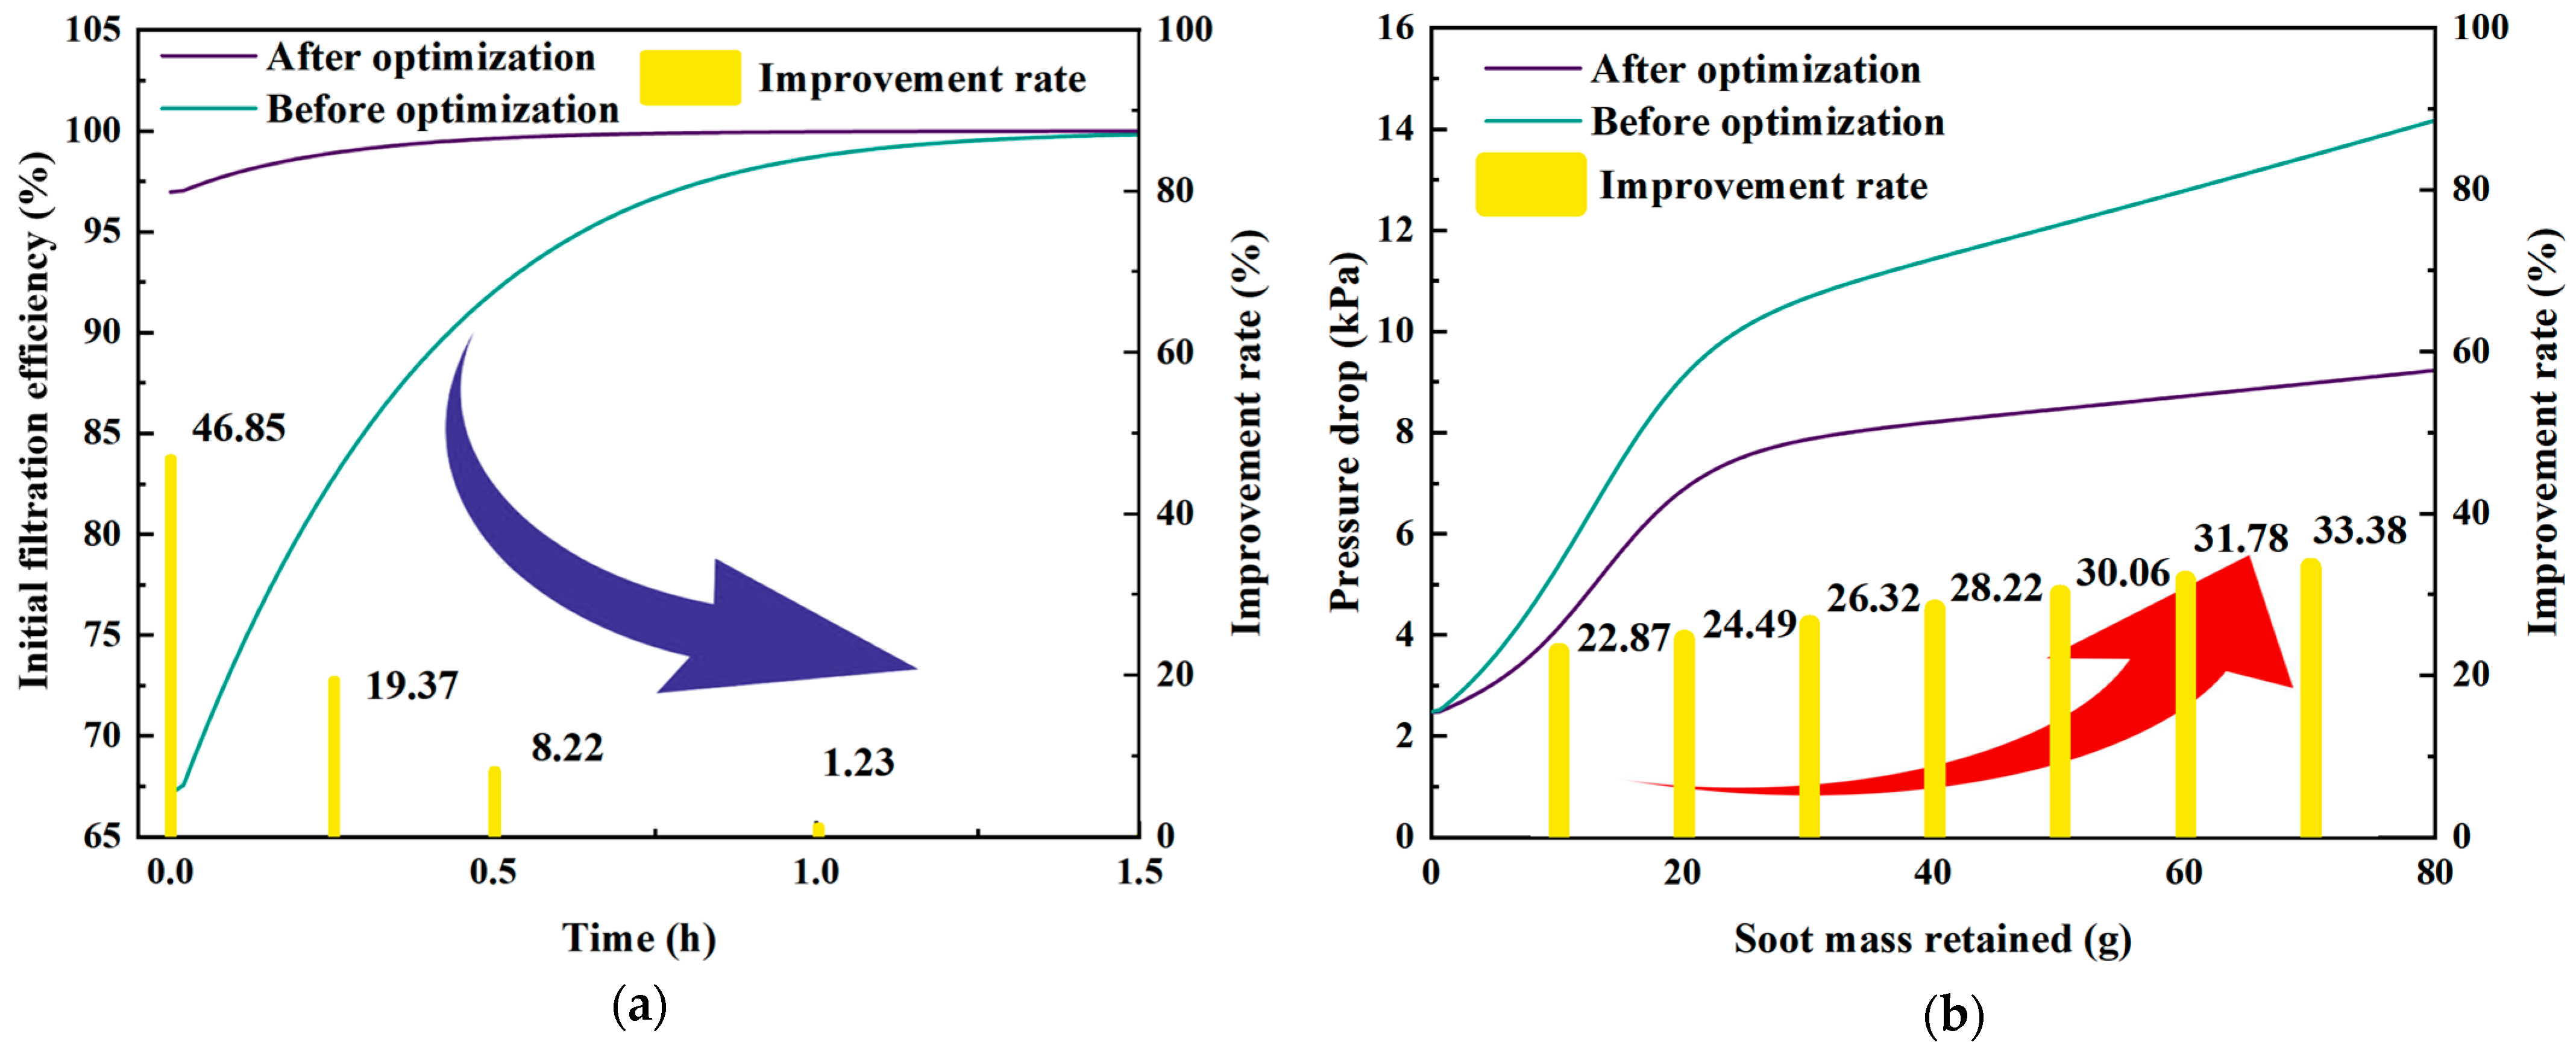
The reliability of the optimized parameters will be further tested in the engine emission loading process to verify the performance of the DPF under long-term loading conditions. The inlet boundaries of the optimization scheme were selected based on the engine emission conditions: under the operating conditions of an intake flow rate of 0.236 cubic meters per second, a temperature of 260 degrees Celsius, and a particulate mass flow rate of 18 g/h. Further analysis of Figure 9a reveals that the maximum filtration efficiency of the DPF remains stable at approximately 100% after algorithm optimization. However, in terms of initial filtration efficiency, the optimized DPF shows a significant increase of 47.10% compared with that before optimization. This improvement holds important practical significance—higher initial filtration efficiency means the DPF can still maintain effective particulate capture capability during the regeneration process. Furthermore, the data in Figure 9b indicates that the pressure drop of the optimized DPF is reduced by 34.62% compared with that before optimization. The reduction in exhaust backpressure has played a positive role in extending the vehicle’s regenerative cycle and improving fuel economy.
It should be noted that the initial pressure drop of the optimized DPF is slightly higher than that before optimization. This is because its higher initial filtration efficiency leads to more soot particles being captured, which blocks the pores of the porous medium—and this precisely reflects its better capture performance. However, it is worth noting that as the amount of soot deposition increases, the pressure drop growth rate of the optimized DPF will exceed that of the pre-optimized one. The DPF’s performance should be dynamically evaluated in combination with specific operating scenarios.

4. Conclusions

To balance the influence of DPF pressure drop and initial filtration efficiency on comprehensive performance, an MLR-based DPF prediction model and a WOA-based multi-objective optimization method are proposed. Structural parameters are screened by GRA through orthogonal experimental design. The main conclusions are as follows:
(1)
The sensitivity ranking based on GRA indicates that diameter, length, wall thickness, porosity, and pore diameter are the five key variables dominating the comprehensive performance of DPF, with their comprehensive sensitivity coefficients R3 being 0.755, 0.770, 0.835, 0.845, and 0.805, respectively. Among them, length is the most critical factor affecting initial filtration efficiency, while wall thickness is the most critical factor affecting pressure drop.
(2)
For the model in this paper, MLR is reliable. For initial filtration efficiency, the coefficient of determination R2 = 0.979 and D-W = 1.717; for pressure drop, R2 = 0.957 and D-W = 1.825; the VIF of all independent variables is <2 and p < 0.01. Under interaction, pressure drop is more sensitive to overall dimensions, while initial filtration efficiency is more sensitive to filter substrate characteristics.
(3)
The ideal solution selected from the Pareto frontier based on the principle of prioritizing emission compliance increases the initial filtration efficiency of the DPF by 46.85% compared with the baseline scheme, while reducing the pressure drop at an 80 g soot load by 34.88%. The deviation between the optimized prediction and simulation results is controlled within 5%, verifying the reliability of the hybrid optimization framework in terms of accuracy and generalization.
The GRA-MLR-WOA based multi-objective optimization strategy enhances DPF capture performance and offers an interpretable pathway to balance initial filtration efficiency and pressure drop, providing direct engineering value for energy conservation and emission reduction. Establishing a multi-objective collaborative optimization framework is of great significance for improving the overall performance of DPFs. This approach enables a rational balance between efficiency and pressure drop, clearly reveals the trade-offs among design schemes, and provides a scientific basis for engineering design and decision-making. Combined with advanced simulation and computational tools, the framework holds broad application prospects in engine emissions control and filter material design.

Author Contributions

Conceptualization, D.L.; Methodology, M.N. and Y.Z.; Software, R.D.; Validation, R.D. and W.Z.; Data curation, M.N.; Writing—original draft, M.N.; Writing—review & editing, M.N.; Funding acquisition, Y.Z. and D.L. All authors have read and agreed to the published version of the manuscript.

Funding

This study was supported by National Natural Science Foundation of China (No. 52206167).

Institutional Review Board Statement

Not Applicable.

Informed Consent Statement

Not Applicable.

Data Availability Statement

The original contributions presented in this study are included in the article. Further inquiries can be directed to the corresponding author.

Acknowledgments

This work was supported by the School of Automotive Studies, Tongji University and Sino–German College of Intelligent Manufacturing, Shenzhen Technology University through technical assistance. The authors gratefully acknowledge the resources and expertise provided by these institutions, which were instrumental in conducting the experiments described in this paper.

Conflicts of Interest

The authors declare no conflicts of interest.

References

  1. Zhou, J.; Zhang, J.; Jiang, G.; Xie, K. Using DPF to Control Particulate Matter Emissions from Ships to Ensure the Sustainable Development of the Shipping Industry. Sustainability 2024, 16, 6642. [Google Scholar] [CrossRef]
  2. Zhang, Z.; Zhong, W.; Tan, D.; Cui, S.; Pan, M.; Zhao, Z.; Zhang, J.; Hu, J. Hydrocarbon adsorption mechanism of modern automobile engines and methods of reducing hydrocarbon emissions during cold start process: A review. J. Environ. Manag. 2024, 353, 120188. [Google Scholar] [CrossRef]
  3. Rrustemi, D.N.; Ganippa, L.C.; Axon, C.J. Investigation of boost pressure and spark timing on combustion and NO emissions under lean mixture operation in hydrogen engines. Fuel 2023, 353, 129192. [Google Scholar] [CrossRef]
  4. Zhang, B.; Zuo, H.; Huang, Z.; Tan, J.; Zuo, Q. Endpoint forecast of different diesel-biodiesel soot filtration process in diesel particulate filters considering ash deposition. Fuel 2020, 272, 117678. [Google Scholar] [CrossRef]
  5. Shi, Y.; Hou, D.; Luo, Y.; Kaiqi, Z.; Yang, Y.; Ding, Z.; Cai, Y.; Li, X.; Wang, J.; Wang, J. Degradation of particulate matter utilizing non-thermal plasma: Evolution laws of morphological micro-nanostructure and elemental occurrence state. J. Environ. Chem. Eng. 2024, 12, 114772. [Google Scholar] [CrossRef]
  6. Tian, J.; Wang, L.; Xiong, Y.; Wang, Y.; Yin, W.; Tian, G.; Wang, Z.; Cheng, Y.; Ji, S. Enhancing combustion efficiency and reducing nitrogen oxide emissions from ammonia combustion: A comprehensive review. Process Saf. Environ. Prot. 2024, 183, 514–543. [Google Scholar] [CrossRef]
  7. Liu, S.; Kang, Y.; Deng, Z.; Yin, Z.; Ye, Z.; Xue, J.; Zhang, J. Study on the effect of blending hydrocarbon-based biodiesel on the performance of SCR system and urea calibration method for marine engines. Energy 2024, 292, 130473. [Google Scholar] [CrossRef]
  8. Algayyim, S.J.M.; Saleh, K.; Wandel, A.P.; Fattah, I.M.R.; Yusaf, T.; Alrazen, H.A. Influence of natural gas and hydrogen properties on internal combustion engine performance, combustion, and emissions: A review. Fuel 2024, 362, 130844. [Google Scholar] [CrossRef]
  9. Zhao, K.; Lou, D.; Zhang, Y.; Fang, L.; Tan, P.; Hu, Z. Flame propagation and NO formation characteristics of hydrogen-air mixture combustion due to dilution effect. Renew. Energy 2025, 241, 122249. [Google Scholar] [CrossRef]
  10. Xie, F.; Liang, Z.; Lai, K.; Liu, Y.; Wang, Z.; Li, X. Influence of operating parameters on hydrogen DISI engine at injection pressure-drop by experimental investigation and Taguchi method. Fuel 2024, 362, 130840. [Google Scholar] [CrossRef]
  11. E, J.; Zhang, Z.; Chen, J.; Pham, M.; Zhao, X.; Peng, Q.; Zhang, B.; Yin, Z. Performance and emission evaluation of a marine diesel engine fueled by water biodiesel-diesel emulsion blends with a fuel additive of a cerium oxide nanoparticle. Energy Convers. Manag. 2018, 169, 194–205. [Google Scholar] [CrossRef]
  12. Wang, K.; Zhang, Z.; Sun, B.; Zhang, S.; Lai, F.; Ma, N.; Ju, X.; Luo, Q.; Bao, L. Experimental investigation of the working boundary limited by abnormal combustion and the combustion characteristics of a turbocharged direct injection hydrogen engine. Energy Conv. Manag. 2024, 299, 117861. [Google Scholar] [CrossRef]
  13. Buzzi, L.; Biasin, V.; Galante, A.; Gessaroli, D.; Pesce, F.; Tartarini, D.; Vassallo, A.; Scalabrini, S.; Sacco, N.; Rossi, R. Experimental investigation of hydrogen combustion in a single cylinder PFI engine. Int. J. Engine Res. 2024, 25, 358–372. [Google Scholar] [CrossRef]
  14. Tian, J.; Liu, P.; Liu, Z.; Tang, J.; Yin, W.; Cheng, Y. Investigation on the effects of nanosecond pulsed discharge on combustion characteristics of C3H8/air mixtures using a rapid compression machine. J. Energy Inst. 2025, 119, 101983. [Google Scholar] [CrossRef]
  15. Tian, J.; Xiong, Y.; Liu, Z.; Wang, L.; Wang, Y.; Yin, W.; Cheng, Y.; Zhao, Q. Experimental study on the discharge characteristics of high-voltage nanosecond pulsed discharges and its effect on the ignition and combustion processes. Appl. Energy 2024, 374, 124011. [Google Scholar] [CrossRef]
  16. Lee, S.; Jeon, J.; Park, S. Optimization of combustion chamber geometry and operating conditions for compression ignition engine fueled with pre-blended gasoline-diesel fuel. Energy Convers. Manag. 2016, 126, 638–648. [Google Scholar] [CrossRef]
  17. You, H.; Gao, R.; Hu, P.; Liang, K.; Zhou, X.; Huang, X.; Pan, M. Sensitivity analysis of diesel particulate filters to geometric parameters during soot loading and its multi-objective optimization. Process Saf. Environ. Prot. 2022, 159, 251–265. [Google Scholar] [CrossRef]
  18. Zhang, Z.; Dong, R.; Tan, D.; Duan, L.; Jiang, F.; Yao, X.; Yang, D.; Hu, J.; Zhang, J.; Zhong, W.; et al. Effect of structural parameters on diesel particulate filter trapping performance of heavy-duty diesel engines based on grey correlation analysis. Energy 2023, 271, 127025. [Google Scholar] [CrossRef]
  19. Gao, J.; Wang, Y.; Li, X.; Wang, S.; Ma, C.; Wang, X. Catalytic effect of diesel PM derived ash on PM oxidation activity. Chemosphere 2022, 299, 134445. [Google Scholar] [CrossRef]
  20. Fang, J.; Meng, Z.; Li, J.; Pu, Y.; Du, Y.; Li, J.; Jin, Z.; Chen, C.; Chase, G.G. The influence of ash on soot deposition and regeneration processes in diesel particular filter. Appl. Therm. Eng. 2017, 124, 633–640. [Google Scholar] [CrossRef]
  21. Lu, Y.; Que, J.H.; Xia, Y.; Li, X.Q.; Jiang, Q.L.; Feng, L.Y. A comparative study of the effects of EGR on combustion and emission characteristics of port fuel injection and late direct injection in hydrogen internal combustion engine. Appl Energy 2024, 375, 123830. [Google Scholar] [CrossRef]
  22. Luo, Y.; Shi, Y.; Zhuang, K.; Ji, R.; Chen, X.; Huang, Y.; Wang, Z.; Cai, Y.; Li, X. Study on the Evolution of Physicochemical Properties of Carbon Black at Different Regeneration Stages of Diesel Particulate Filters Regenerated by Non-Thermal Plasma. Processes 2024, 12, 1113. [Google Scholar] [CrossRef]
  23. Lupše, J.; Campolo, M.; Soldati, A. Modelling soot deposition and monolith regeneration for optimal design of automotive DPFs. Chem. Eng. Sci. 2016, 151, 36–50. [Google Scholar] [CrossRef]
  24. Tan, Y.; Zheng, P.; E, J.; Han, D.; Feng, C. Effects of inlet velocity and structure parameters on the performance of a rotary diesel particulate filter for truck diesel engine based on fuzzy grey relational analysis. Chemosphere 2022, 307, 135843. [Google Scholar] [CrossRef]
  25. Ye, J.; E, J.; Peng, Q. Effects of porosity setting and multilayers of diesel particulate filter on the improvement of regeneration performance. Energy 2023, 263, 126063. [Google Scholar] [CrossRef]
  26. Xiao, G.; Li, B.; Tian, H.; Leng, X.; Long, W. Numerical study on flow and pressure drop characteristics of a novel type asymmetric wall-flow diesel particulate filter. Fuel 2020, 267, 117148. [Google Scholar] [CrossRef]
  27. Konstandopoulos, A.G. In Flow Resistance Descriptors for Diesel Particulate Filters: Definitions, Measurements and Testing; Sae World Congress & Exhibition: Thessaloniki, Greece, 2003. [Google Scholar]
  28. Jisieike, C.F.; Ishola, N.B.; Latinwo, L.M.; Betiku, E. Crude rubber seed oil esterification using a solid catalyst: Optimization by hybrid adaptive neuro-fuzzy inference system and response surface methodology. Energy 2023, 263, 125734. [Google Scholar] [CrossRef]
  29. Yang, J.; Stewart, M.; Maupin, G.; Herling, D.; Zelenyuk, A. Single wall diesel particulate filter (DPF) filtration efficiency studies using laboratory generated particles. Chem. Eng. Sci. 2009, 64, 1625–1634. [Google Scholar] [CrossRef]
  30. Wang, Y.; Ghosh, R.S.; Gong, J.; Nikodem, A.; Kutschi, S.; Zokoe, J.; Xue, E.J.; Wang, Z.; Honda, T.; Wells, A.; et al. Modeling the filtration performance of ceramic filters over transient cycles of natural gas and diesel engines. Appl. Energy 2023, 337, 120895. [Google Scholar] [CrossRef]
  31. Liu, X.; Matti Maricq, M.; Dobson, D.A. Statistical capillary tube model for porous filter media: An application in modeling of gasoline particulate filter. Sep. Purif. Technol. 2022, 286, 120393. [Google Scholar] [CrossRef]
  32. Houston, A.J.; Boubert, D.; Clyne, T.W. The Permeability of Novel Hybrid Fiber Composite Material for Use as Diesel Particulate Filters. Adv. Eng. Mater. 2020, 22, 2000562. [Google Scholar] [CrossRef]
  33. E, J.; Zhao, X.; Liu, G.; Zhang, B.; Zuo, Q.; Wei, K.; Li, H.; Han, D.; Gong, J. Effects analysis on optimal microwave energy consumption in the heating process of composite regeneration for the diesel particulate filter. Appl. Energy 2019, 254, 113736. [Google Scholar] [CrossRef]
  34. Gao, S.; Zhang, Y.; Zhang, Z.; Tan, D.; Li, J.; Yin, Z.; Hu, J.; Zhao, Z. Multi-objective optimization of the combustion chamber geometry for a highland diesel engine fueled with diesel/n-butanol/PODEn by ANN-NSGA III. Energy 2023, 282, 128793. [Google Scholar] [CrossRef]
  35. Ozturk, S.; Erol, H. Multi-objective optimization of a diesel particulate filter: An acoustic approach. Part. Sci. Technol. 2022, 40, 465–474. [Google Scholar] [CrossRef]
  36. Zhang, B.; E, J.; Gong, J.; Yuan, W.; Zuo, W.; Li, Y.; Fu, J. Multidisciplinary design optimization of the diesel particulate filter in the composite regeneration process. Appl. Energy 2016, 181, 14–28. [Google Scholar] [CrossRef]
  37. Seo, J.; Yun, B.; Kim, J.; Shin, M.; Park, S. Development of a cold-start emission model for diesel vehicles using an artificial neural network trained with real-world driving data. Sci. Total Environ. 2022, 806, 151347. [Google Scholar] [CrossRef] [PubMed]
  38. Sarkar, B.; Gundlapally, S.R.; Koutsivitis, P.; Wahiduzzaman, S. Performance evaluation of neural networks in modeling exhaust gas aftertreatment reactors. Chem. Eng. J. 2022, 433, 134366. [Google Scholar] [CrossRef]
  39. Qiang, T.P.; Peng, L.Y.; De Yuan, W.; Yuan, H.Z.; Di Ming, L. Effects of Catalyst Structural Parameters on the Performance of Exhaust Gas Aftertreatment System of Diesel Engines. Int. J. Automot. Technol. 2022, 23, 1085–1097. [Google Scholar] [CrossRef]
  40. Chen, X.; Shi, Y.; Cai, Y.; Xie, J.; Yang, Y.; Hou, D.; Fan, Y. Effect of non-thermal plasma injection flow rate on diesel particulate filter regeneration at room temperature. Carbon Lett. 2024, 34, 1075–1089. [Google Scholar] [CrossRef]
  41. Guan, B.; Zhan, R.; Lin, H.; Huang, Z. Review of the state-of-the-art of exhaust particulate filter technology in internal combustion engines. J. Environ. Manag. 2015, 154, 225–258. [Google Scholar] [CrossRef]
  42. Yin, Z.; Liu, S.; Tan, D.; Zhang, Z.; Wang, Z.; Wang, B. A review of the development and application of soot modelling for modern diesel engines and the soot modelling for different fuels. Process Saf. Environ. Prot. 2023, 178, 836–859. [Google Scholar] [CrossRef]
  43. Zhang, Z.; Dong, R.; Tan, D.; Zhang, B. Multi-objective optimization of performance characteristic of diesel particulate filter for a diesel engine by RSM-MOPSO during soot loading. Process Saf. Environ. Prot. 2023, 177, 530–545. [Google Scholar] [CrossRef]
  44. Konstandopoulos, A.G.; Kostoglou, M.; Skaperdas, E.; Papaioannou, E.; Kladopoulou, E. Fundamental Studies of Diesel Particulate Filters: Transient Loading, Regeneration and Aging, SAE 2000-01-1016. Sae Pap. 2000, 109, 683–705. [Google Scholar]
  45. Mafarja, M.M.; Mirjalili, S. Hybrid Whale Optimization Algorithm with simulated annealing for feature selection. Neurocomputing 2017, 260, 302–312. [Google Scholar] [CrossRef]
  46. Goyal, H.; Jones, P.; Bajwa, A.; Parsons, D.; Akehurst, S.; Davy, M.H.; Leach, F.C.P.; Esposito, S. Design trends and challenges in hydrogen direct injection (H2DI) internal combustion engines-A review. Int. J. Hydrogen Energy 2024, 86, 1179–1194. [Google Scholar] [CrossRef]
  47. Zhang, Z.; Hu, J.; Wang, Y.; Pan, M.; Lu, K.; Ye, Y.; Yin, Z. An artificial intelligence-based strategy for multi-objective optimization of diesel engine fueled with ammonia-diesel-hydrogen blended fuel. Energy 2025, 318, 134701. [Google Scholar] [CrossRef]
  48. Bibiloni-Ipata, S.; Vielmo-Cogo, V.; Frizzo-Prante, G.; Martinez-Boggio, S. Design and study of the effects of retrofitting diesel engines in hydrogen trucks through simulation. Int. J. Hydrogen Energy 2025, 163, 150806. [Google Scholar] [CrossRef]
  49. Ding, Y.F.; Chen, Z.J.; Zhang, H.W.; Wang, X.; Guo, Y. A short-term wind power prediction model based on CEEMD and WOA-KELM. Renew. Energy 2022, 189, 188–198. [Google Scholar] [CrossRef]
  50. Zhou, P.J.; Wen, Z.P.; Wang, Y.; Wu, Y.Z.; Wu, D.H.; Huang, R.F.; Yao, Z.F. Improving the energy performance of vortex pump based on whale optimization algorithm. Eng. Appl. Comp. Fluid Mech 2025, 19, 2441344. [Google Scholar] [CrossRef]
  51. Ma, R.Z.; Fu, K.L.; Yan, T.H. Dynamic double mutation whale differential algorithms and applications to multi-constrained global optimization engineering problems. Expert Syst. Appl. 2026, 296, 129128. [Google Scholar] [CrossRef]
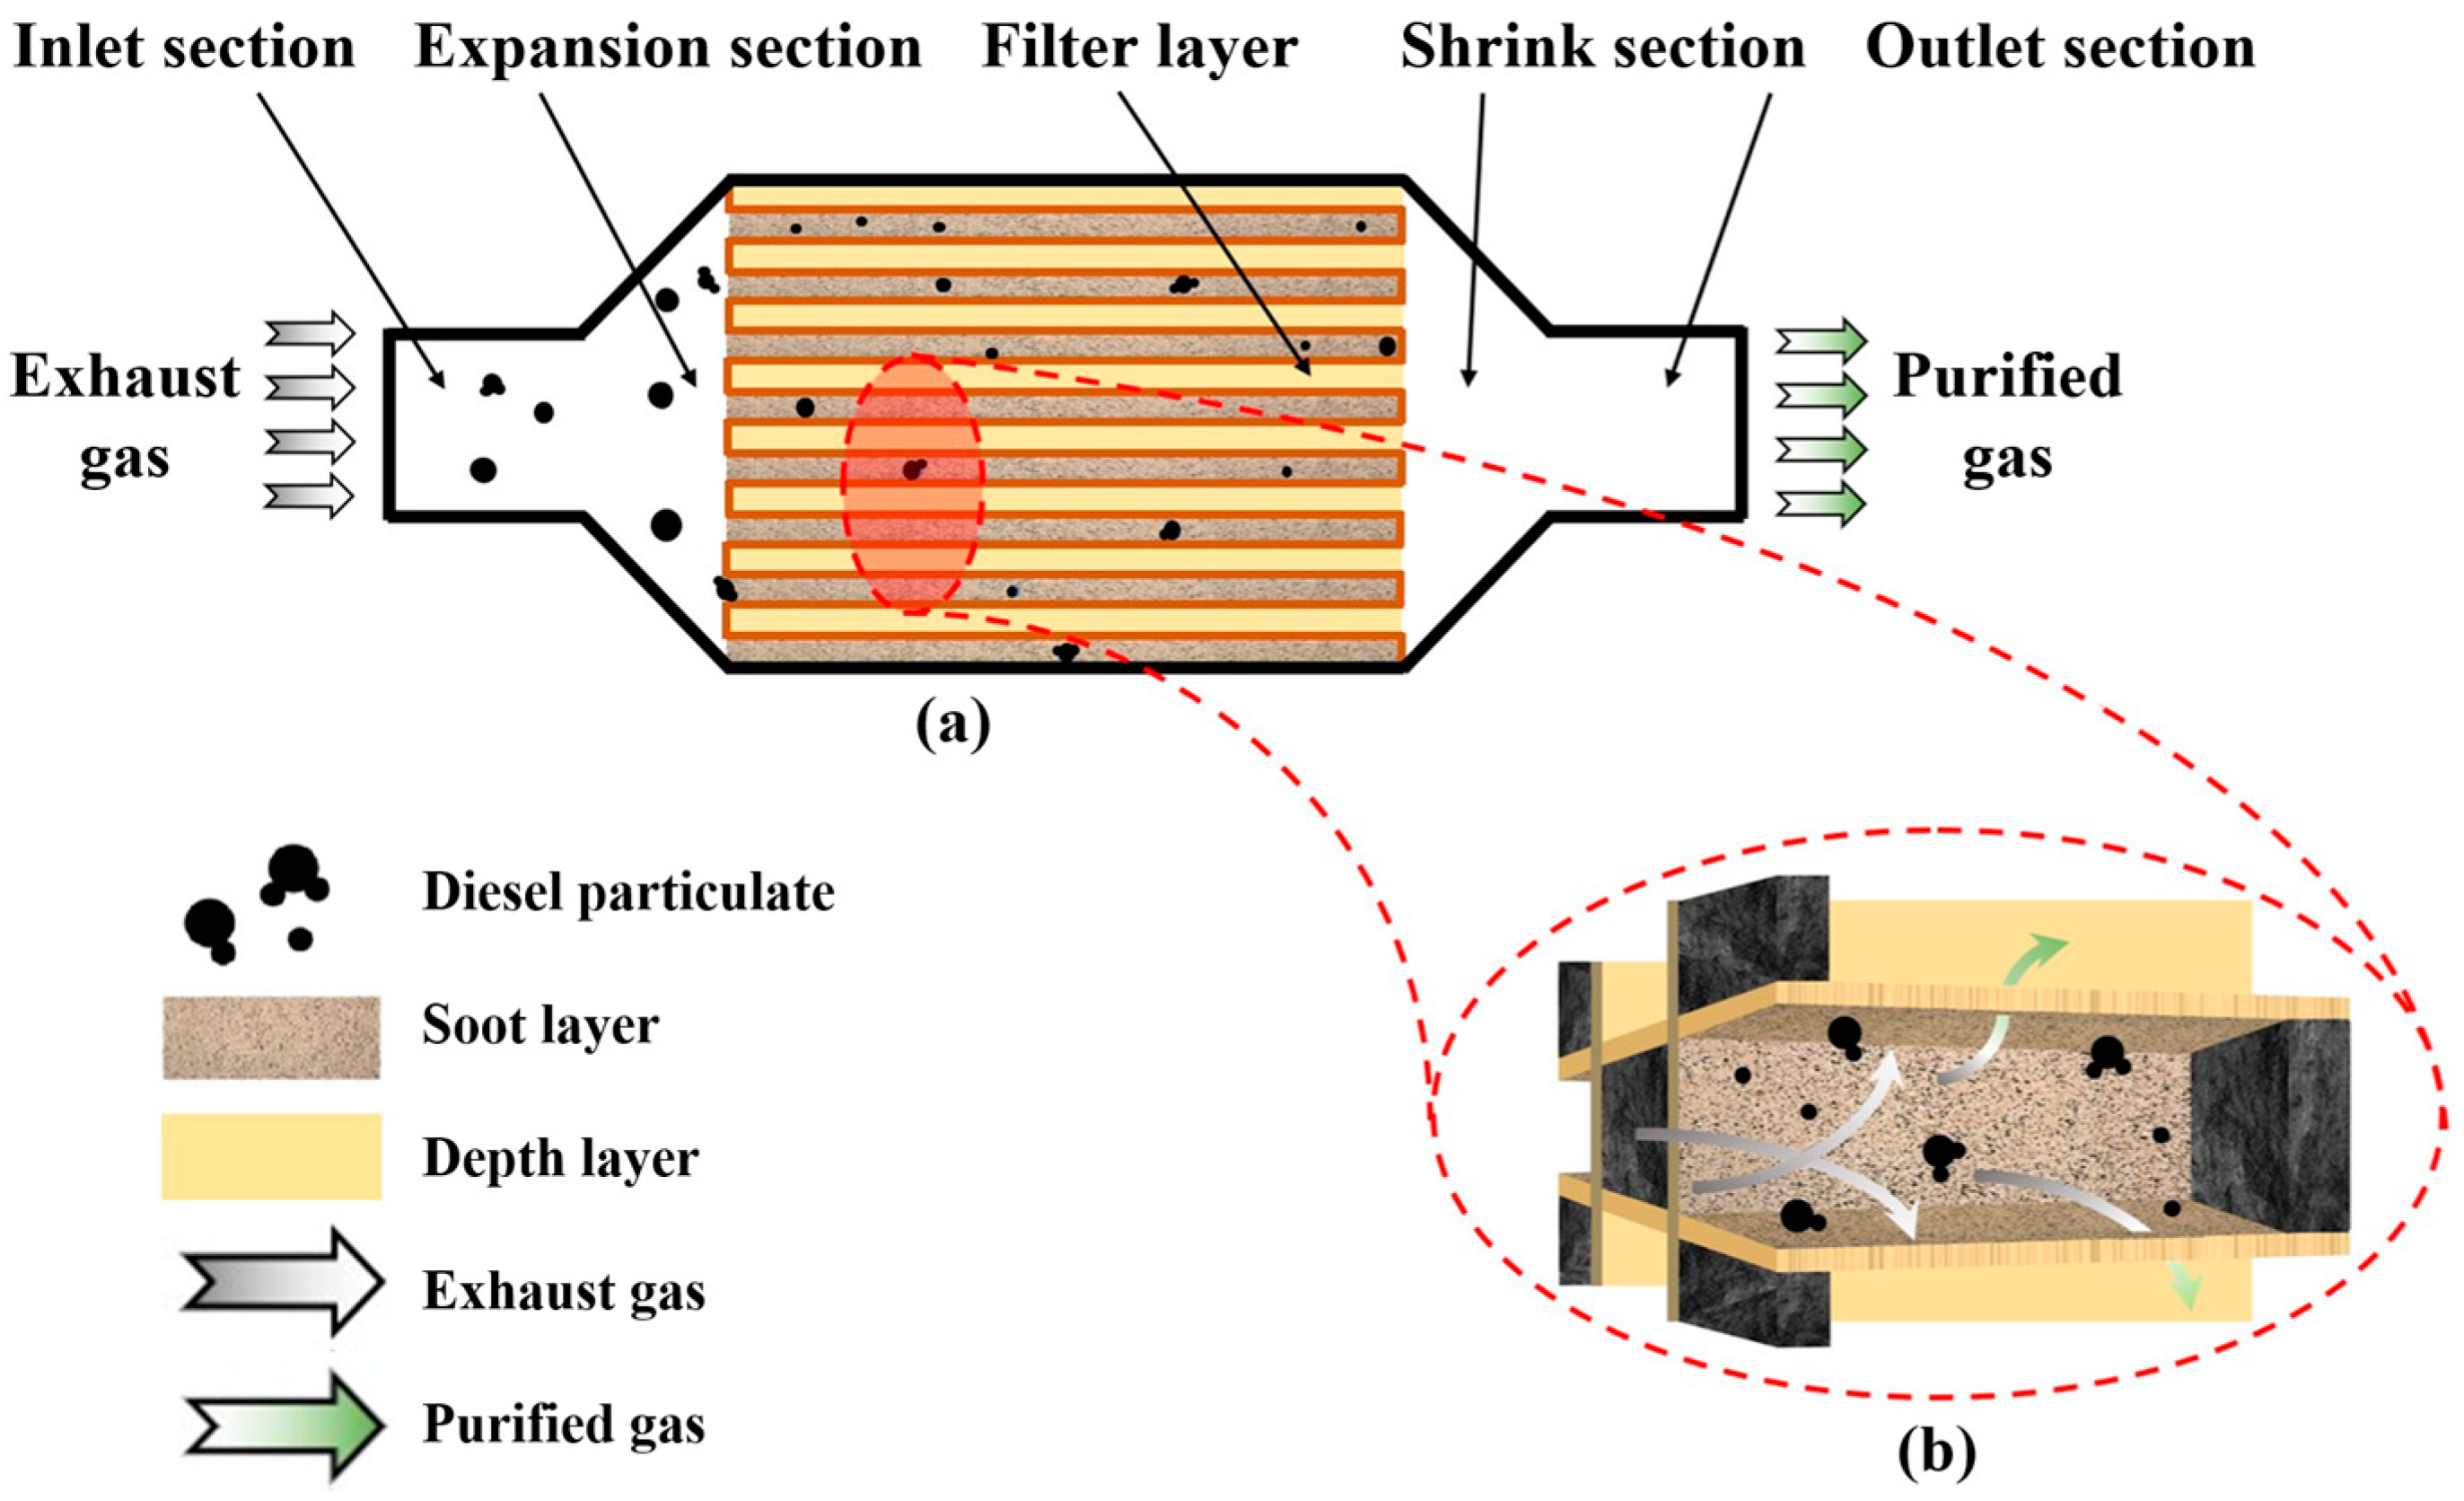
Figure 1. DPF schematic diagram: (a) Overall; (b) Single cell.
Sustainability 17 08777 g001
Figure 2. Model validation [23,44].
Sustainability 17 08777 g002
Figure 3. Multi-objective optimization framework of the hybrid method.
Sustainability 17 08777 g003
Figure 4. Sensitivity analysis results.
Sustainability 17 08777 g004
Figure 5. Interactive effects of different factors on initial filtration efficiency: (a) D and w; (b) D and λ; (c) D and d; (d) w and λ; (e) w and d; (f) λ and d.
Sustainability 17 08777 g005
Figure 6. Interactive effects of different factors on pressure drop: (a) D and L; (b) D and w; (c) D and λ; (d) L and w; (e) L and λ; (f) w and λ.
Sustainability 17 08777 g006aSustainability 17 08777 g006b
Figure 7. Distribution boundary of Pareto solution formed by WOA.
Sustainability 17 08777 g007
Figure 8. Prediction results and simulation results.
Sustainability 17 08777 g008
Figure 9. Comparison before and after optimization; (a) Initial filtration efficiency; (b) pressure drop.
Sustainability 17 08777 g009
Table 1. DPF structural parameters.
ParameterValueUnit
Diameter267mm
Length305mm
Wall thickness0.43mm
Channels per square inch1001/in2
Pore diameter24.4μm
Porosity0.5-
Table 2. Sensitivity analysis and multi-objective optimization initial values and optimization intervals.
ParameterSymbolInitial ValuesVarying Ranges
[Lower Bound, Upper Bound] [36]
Diameter (mm)D267[227, 307]
Length (mm)L305[205, 405]
Wall thickness (mm)w0.43[0.23, 0.63]
Channels per square inch (1/in2)CPSI100[50, 200]
Pore diameter (μm)d24.4[18.4, 30.4]
Porosity (-)λ0.5[0.3, 0.7]
Length of exhaust pipe (mm)dl100[50, 200]
Diameter of exhaust pipe (mm)dd133[83, 183]
Table 3. Orthogonal array design.
Serial NumberD
(mm)
L
(mm)
w
(mm)
CPSI
(1/in2)
d
(μm)
λ
(-)
dl
(mm)
dd
(mm)
P
(kPa)
Ei
(%)
12272050.235018.40.31008324.5430.80
22272050.2310024.40.520018320.5536.65
32272050.2320030.40.75013323.2044.97
42273050.635024.40.710013377.5684.60
52273050.6310030.40.32008322.6242.83
62273050.6320018.40.55018368.4479.65
72274050.435030.40.510018323.9853.57
82274050.4310018.40.720013322.1693.70
92274050.4320024.40.3508311.0651.54
102672050.635030.40.520013335.6754.63
112672050.6310018.40.71008345.3995.98
122672050.6320024.40.35018346.8253.93
132673050.435018.40.32001839.4164.90
142673050.4310024.40.510013311.5571.26
152673050.4320030.40.7508322.9074.65
162674050.235024.40.72008311.0468.55
172674050.2310030.40.31001834.5230.94
182674050.2320018.40.5501337.2372.51
193072050.435024.40.710018328.1579.97
203072050.4310030.40.3501339.0439.31
213072050.4320018.40.52008312.3386.65
223073050.235030.40.5100837.1939.97
233073050.2310018.40.7501837.7889.03
243073050.2320024.40.32001334.5045.42
253074050.635018.40.31001835.8687.43
263074050.6310024.40.55013310.8389.47
273074050.6320030.40.72008337.2780.84
Table 4. Sensitivity analysis of structural parameters.
Structural ParametersR1R2R3
D0.790.720.755
L0.830.710.770
w0.720.950.835
CPSI0.680.670.675
d0.690.920.805
λ0.750.940.845
dl0.450.440.445
dd0.490.460.475
Table 5. Structural parameter combinations based on BBD.
D (mm)L (mm)w (mm)λ (-)d (μm)P (kPa)Ei (%)
2272050.430.524.442.8548.65
3072050.430.524.416.4163.23
2274050.430.524.415.6063.98
3074050.430.524.46.6778.82
2673050.230.324.47.1930.94
2673050.630.324.413.3259.23
2673050.230.724.415.5862.07
2673050.630.724.435.6390.42
2672050.430.518.423.2473.48
2674050.430.518.49.0486.92
2672050.430.530.427.4743.72
2674050.430.530.410.6759.04
2273050.230.524.416.8738.32
3073050.230.524.46.5552.01
2273050.630.524.430.3969.07
3073050.630.524.412.9083.07
2673050.430.318.49.4664.84
2673050.430.718.424.0493.43
2673050.430.330.410.3936.48
2673050.430.730.425.9669.62
2672050.230.524.418.6437.48
2674050.230.524.46.8351.61
2672050.630.524.433.2167.96
2674050.630.524.413.4982.70
2273050.430.324.416.9440.77
3073050.430.324.46.4254.60
2273050.430.724.436.8674.45
3073050.430.724.417.9487.42
2673050.230.518.49.1361.98
2673050.630.518.417.6790.36
2673050.230.530.411.0434.38
2673050.630.530.420.5763.97
2273050.430.518.421.1874.38
3073050.430.518.48.6387.36
2273050.430.530.425.0244.87
3073050.430.530.410.2959.31
2672050.430.324.418.6539.66
2674050.430.324.46.8554.37
2672050.430.724.439.9173.56
2674050.430.724.418.2886.98
2673050.430.524.413.5265.98
2673050.430.524.414.7765.03
2673050.430.524.414.2666.14
2673050.430.524.413.5665.24
2673050.430.524.414.7165.01
2673050.430.524.413.4965.97
Table 6. Results of MLR analysis for initial filtration efficiency.
BStandard ErrorBetat-Valuep-ValueVIF
Constant−27.8856.033-−3.3630.002-
226.70.1730.0170.24010.4150.0021.005
2050.0720.0070.25210.9200.0011.005
0.4374.3693.1980.53523.2510.0081.000
0.580.3353.1980.37825.1170.0031.000
24.4−2.3060.107−0.497−21.6260.0091.000
R20.979
FF(5,39) = 370.471, p = 0.000
D-W1.717
Table 7. Results of MLR analysis for pressure drop.
BStandard ErrorBetat-Valuep-ValueVIF
Constant52.0266.878-7.2440.005-
226.7−0.1700.019−0.462−8.9850.0031.005
205−0.0760.008−0.317−10.0660.0011.005
0.4326.6773.6470.3757.3150.0101.000
0.539.0523.6470.14910.7090.0011.000
24.40.1980.1220.0841.6300.0071.000
R20.957
FF(5,39) = 68.267, p = 0.000
D-W1.825
Table 8. Comparison of optimization results.
D (mm)L (mm)w (mm)λ (-)d (μm)P (kPa)Ei (%)
Original266.73050.430.524.414.1865.90
Optimized3074050.570.5518.19.3299.22
Comparison −34.27%50.56%
Disclaimer/Publisher’s Note: The statements, opinions and data contained in all publications are solely those of the individual author(s) and contributor(s) and not of MDPI and/or the editor(s). MDPI and/or the editor(s) disclaim responsibility for any injury to people or property resulting from any ideas, methods, instructions or products referred to in the content.