Abstract
This study presents a holistic framework for adaptive thermal energy storage (A-TES) in solar-assisted systems. This framework aims to support a reliable industrial energy supply, particularly during periods of limited sunlight, while also facilitating industrial decarbonization. In previous studies, the focus was not on addressing the framework of the entire problem, but rather on specific parts of it. Therefore, the innovation in this study lies in bringing these aspects together within a unified framework through a data-driven approach that combines the analysis of efficiency, technology, environmental impact, sectoral applications, operational challenges, and policy into a comprehensive system. Sensible thermal energy storage with an adaptive approach can be utilized in numerous industries, particularly concentrated solar power plants, to optimize power dispatch, enhance energy efficiency, and reduce gas emissions. Simulation results indicate that stable regulations and flexible incentives have led to a 60% increase in solar installations, highlighting their significance in investment expansion within the renewable energy sector. Integrated measures among sectors have increased energy availability by 50% in rural regions, illustrating the need for partnerships in renewable energy projects. The full implementation of novel advanced energy management systems (AEMSs) in industrial heat processes has resulted in a 20% decrease in energy consumption and a 15% improvement in efficiency. Making the switch to open-source software has reduced software expenditure by 50% and increased productivity by 20%, demonstrating the strategic advantages of open-source solutions. The findings provide a foundation for future research by offering a framework to analyze a specific real-world industrial case.
1. Introduction
Thermal storage facilities act as a heat reservoir to handle the dynamics of district heating systems, such as heat and electricity demand, energy pricing, intermittent renewable sources, bad weather, and system faults [1]. Thermal energy storage (TES) systems heat or cool a storage medium to store thermal energy for heating, cooling, or power generation [2]. By adjusting the temperature of a storage medium, S-TES can retain heat without causing a phase change [1,2,3]. This method utilizes water, bricks, sand, and concrete [4]. Due to its flexibility and low cost, S-TES is used in both commercial and residential applications.
Water tanks are commonly utilized in low-temperature applications, whereas molten salts are employed in high-temperature concentrated solar power (CSP) facilities. Their benefits encompass affordability, ease of use, and dependability. S-TES is incorporated into various applications such as hot water tanks, district heating systems, and concentrated solar power (CSP) facilities [3]. Its challenges mainly concern its lower energy density in comparison to phase change materials (PCMs) [4] and thermochemical storage.
Substantial material quantities are necessary for large-scale thermal storage, possibly increasing volumetric requirements and structural costs. There has been a heightened focus on material optimization to improve energy storage capacity and decrease expenses, and investigations are examining materials with high temperature ranges and enhanced thermal conductivity [5] for such applications. The integration of solar heat into industrial processes has become crucial for reducing carbon emissions, improving energy efficiency, and minimizing the release of industrial gases. A-TES encompasses numerous temperature ranges, utilizing multiple solar technologies. Low- to moderate-temperature systems employ solar collectors such as flat-plate collectors (FPCs), evacuated tube collectors (ETCs), linear Fresnel reflectors (LFRs), and parabolic trough collectors (PTCs). These systems assist in operations involving the heating of fluids for processes with a low and medium temperature range [3,4]. Meanwhile, elevated-temperature systems utilize concentrated solar power (CSP) technology such as solar towers and parabolic dishes for applications necessitating high temperatures of over 400 °C [3,4].
Solar process heat [6] is utilized in the food processing, textile, and chemical sectors. The technologies employed consist of linear flux collectors [7] and solar-assisted chemical reactors. Integrating thermal energy storage (TES) systems [1] is essential for providing a reliable energy source, particularly during periods of limited daylight. This encompasses both sensible and latent heat storage methods. Several ongoing projects are investigating the techno-economic viability of solar thermal energy [4] in industrial applications [2]. A few schemes are currently being implemented to enhance system efficiency and minimize uncertainties in solar process heat systems via improved monitoring and design.
Therefore, the incorporation of sensible thermal energy storage with solar heating systems, as presented in Table 1, signifies a possible approach to improving industrial sustainability. Ongoing research and development, along with the strategic implementation of these technologies, can substantially enhance energy efficiency and achieve carbon reduction objectives in industrial sectors. In this research, a knowledge gap was identified due to insufficient research in this context, analyzing long-term cost-effectiveness and efficiency enhancements over time, inadequate knowledge regarding the scalability of emerging technology in extensive industrial applications, and the requirement for more thorough lifecycle evaluations encompassing comprehensive environmental implications from concept to completion.

Table 1.
Comparison between sensible thermal energy storage (S-TES) and solar integrated heat processes (S-IHP).
There is also limited research on the possible obstacles to adoption in industries with lower technological advancement [2], as well as limited examinations of cultural and human influences on technology adoption and feasible solutions. There is also a lack of research on the long-term economic effects of policy amendments on technology adoption rates and possible patterns. Table 1 and Table 2 demonstrate the significance and consistency of each selected topic, offering the complete picture regarding research in this area.
Table 2.
Holism of thermal energy and solar integration technologies.
This analysis highlights critical knowledge gaps within each theme, emphasizing areas that need additional investigation and knowledge acquisition to improve intelligence and operations. Table 2 establishes six unique roots, namely Efficiency and Cost-Effectiveness, Technological Advancements, Environmental Impact, Industry Applications, Challenges and Solutions, and Policy and Economic Implications.
Each root is reviewed for its description, validation methodologies, validation outcomes, reliability assessments, statistical evaluations, findings of statistical evaluations, and recognized knowledge limitations. If each root is a group named after its source reference number, the intersection of all groups in this instance reveals no duplication present in any thematic group. Consequently, the intersection of all groups constitutes an empty set, indicating the absence of duplications among all roots, thereby affirming their uniqueness. The fusion of all groups entails the synthesis of distinct themes, thereby imparting significance to the entirety through its components.
This represents a holistic approach to thermal energy and technological integration, resulting in a composite classification that captures the comprehensive essence of the underlying elements and illustrates as shown in Figure 1 the expansive and integrative dimensions of the foundational sources of information. This leads to the following conceptual framework, as shown in Table 3.
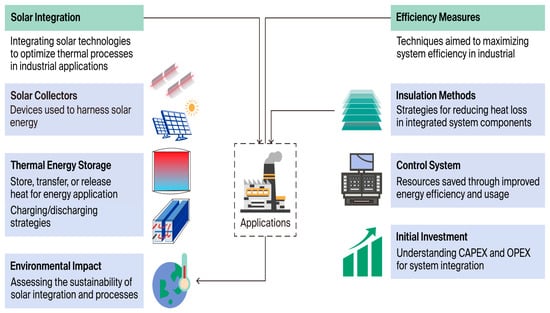
Figure 1.
Virtual S-TES and digital twin: an industrial design framework for solar integration.
Table 3.
Thermal energy and solar integration technologies in the conceptual framework for S-TES in SIHP.
A comprehensive overview that includes current solutions, e.g., mobile TES [4] and SHS [5], along with the planned effects of overcoming the issues associated with each theme, detailing standard solutions and planned outcomes for each root cause, is presented in Table 4.
Table 4.
Planned effects of overcoming the issues associated with each theme.
Simulation case studies illustrating how these standard solutions could be applied in real-world scenarios are presented in Table 5. These case studies provide suppositional examples of how these standard solutions could be effectively applied to real-world scenarios, resulting in tangible benefits. Each case study presents new proof of its originality and a verification of the conceptual framework presented in the theme. However, further investigation and validation are required to validate these scenarios for real-world automation.
Table 5.
Hypothetical case studies.
1.1. Scope and Objective
Using modeling and simulation methods and techniques is cost-efficient [19]; meanwhile, digital twin technology is a further advancement in this context. Table 6, Table 7, Table 8, Table 9, Table 10 and Table 11 break down each case study’s key components, highlighting the solutions, actions taken, and the resulting outcomes. Designing simulation models for each case involves identifying key variables, setting parameters for input data, and determining the expected outputs. Below are conceptual models for each case study that could be used to simulate outcomes and test their significance. These models are designed to be adaptable, allowing for testing under different conditions and assumptions, as shown in Table 12.
Table 6.
Root 1: Efficiency and Cost-Effectiveness.
Table 7.
Root 2: Technological Advancements.
Table 8.
Root 3: Environmental Impact.
Table 9.
Root 4: Industry Applications.
Table 10.
Root 5: Challenges and Solutions.
Table 11.
Root 6: Policy and Economic Implications.
Table 12.
Simulation models for thematic case studies.
The simulation models and algorithms in Table 12 offer a structured approach to test the significance of various outcomes based on the hypothetical common solutions provided for each theme from Table 3, Table 4 and Table 5. Simulation models and algorithms serve as a basis for further detailed modeling and data engineering. The following comprehensive table outlines each simulation model in detail, providing a framework for testing the significance of solutions within each theme. Table 6 serves as a framework for simulating various thematic scenarios from Table 3, Table 4 and Table 5.
1.2. Methodology
All the objectives in Table 6 provide clearly defined goals for each simulation to address specific thematic concerns. Furthermore, all the variables and parameters in Table 6 are essential inputs and factors influencing the simulation outcomes, allowing flexibility and testing under different conditions. Meanwhile, all the expected outputs are understandable metrics to gauge the effectiveness and impact of the simulation scenarios. Therefore, simulation algorithms are methodical processes tailored to running, testing, and validating each model, ensuring comprehensive analysis and validity.
These models in Table 12 were designed, implemented, and tested to provide insights into practical applications across various themes, including efficiency, technology, environmental impact, industry development, stakeholder collaboration, and policy influence. Each model can be customized with real or hypothetical data to suit specific research or operational needs. Running each simulation model independently involves setting up a computational framework using a software platform. For example, all of the case studies have one standard algorithm, which consists of a series of steps.
Running, testing, and validating each simulation model involves several steps (Figure 2 and Figure 3), from setting up the simulation environment to analyzing and verifying the results. A comprehensive guide for each simulation model outlined in Table 6, along with general procedures for verifying simulation models, is illustrated in Figure 3. This diagram presents the life cycle in a left-to-right process format. Upon validation, identifying an issue, or upon the arrival of new inputs, shift to setup and go through the phases once more, progressively enhancing both the model and insights.

Figure 2.
Case studies algorithms.

Figure 3.
Simulation models workflow.
A multi-platform system was employed as a tool for simulation. Data acquisition was performed to obtain input data, whether actual or theoretical, for model integration. Model configuration involved establishing variables, parameters, and initial conditions in accordance with the simulation specifications. Code implementations were developed and produced, utilizing simulation code or existing frameworks to configure the model. The executed simulation utilized specified inputs and monitored the system’s behavior over time. Iterative testing adjusted inputs and parameters to investigate various situations and conducted sensitivity analysis.
Data representation applied plots and charts to illustrate the results (e.g., energy savings, cost reductions, etc.). Statistical analysis employed statistical techniques to ascertain significance and validate the results. Evaluation relative to standards contrasted findings with established benchmarks or previous study results to evaluate validity. Domain specialists conducted an expert assessment of the model’s assumptions, methodologies, and results—the real-world comparison compared simulated outcomes with actual available data, wherever accessible. Sensitivity analysis evaluated the responsiveness to several parameters to guarantee robustness and dependability.
Table 13 presents details regarding the simulation models used in the six separate studies. Platforms/tools show which language or stack is best suited for each. Robust simulation models in terms of documentation need to keep detailed records of model assumptions, data sources, and configuration settings. Moreover, version control needs to have and use tools for managing changes and collaboration. Therefore, continuous improvement requires updating the simulation models with new data and insights as they become available. These methods provide a comprehensive approach for efficiently executing, evaluating, and verifying simulation models. The methodology is customized according to distinct objectives, accessible resources, and data integrity for each simulation analysis. An algorithmic method for generating mathematical output, accompanied by a detailed step-by-step approach, provides a thorough framework for the efficient execution, testing, and validation of simulation models.
Table 13.
Specific steps for each simulation model and case study.
2. Novel Advanced Energy Management System (AEMS) Simulation Case Study
By examining key factors such as baseline energy consumption, cost per kilowatt-hour, and implementation costs, the simulation model provides a systematic framework for evaluating potential efficiency gains. By simulating these dynamics, businesses can forecast the financial and environmental benefits of such systems, enabling well-informed decision-making. Stakeholders dedicated to sustainable industrial development can benefit from the unique AEMS simulation, which blends sustainability and technological innovation to offer valuable information in Appendix A about the efficiency of energy management technologies.
To simulate the impact of implementing an advanced energy management system in a manufacturing plant, the variables required include energy consumption rates, cost of energy, implementation costs, and efficiency gain percentage. The parameters defined previously for this simulation are baseline energy costs, expected reduction percentage, and the timeframe for ROI calculation. The expected outputs for this simulation are the total cost savings and the payback period for the investment. The algorithm for this simulation involves inputting baseline data, applying biofuel metrics for improvements, calculating emissions savings, and conducting paired t-tests on emissions data. The use of suppositional data for energy consumption data and costs from the manufacturing plant suggested that the model setup and algorithm are as shown below:
Theorem 1.
The implementation of AEMSs in industrial settings leads to significant reductions in energy costs and improvements in energy efficiency. This approach also facilitates the integration of renewable energy sources, aligning with global sustainability and energy efficiency goals.
Lemma 1.
where is the percentage reduction in energy costs.
where is the percentage improvement in energy efficiency.
where is the percentage of energy consumption accounted for by renewable sources post-implementation.
- Energy Cost Savings Calculation: Energy cost savings from EMS implementation can be calculated as follows:
- 2.
- Efficiency Improvement Calculation: The improvement in energy efficiency due to EMS can be calculated as follows:
- 3.
- Renewable Energy Integration Impact Calculation: The impact of renewable energy integration can be assessed as follows:
- 4.
- Energy Audit Analysis for Validation: The effectiveness of EMS is validated through energy audits, comparing pre- and post-implementation data:
Mathematical expressions and theorems offer a quantitative framework for evaluating the benefits of advanced energy management systems (AEMSs), emphasizing cost savings, efficiency improvements, and renewable energy integration. The algorithm in this case, as shown in the Appendices, provides a structured approach to evaluating the impact of advanced energy management systems. The pseudocode starts by loading necessary data related to energy consumption, costs, load profiles, peak demand statistics, and levels of renewable energy integration before and after implementing the novel AEMS. These results, validated through energy audit analysis, support strategic decisions for achieving sustainability and energy efficiency goals in industrial settings. For each industrial setting, it calculates energy cost savings, efficiency improvements, and the impact of renewable energy integration through AEMS. An energy audit is conducted to validate improvements in energy consumption and efficiency metrics pre- and post-implementation of the novel AEMS. Based on energy audit analysis, in Table 14 the program determines the effectiveness of the novel AEMS in reducing energy costs and improving efficiency, modeling and analyzing the optimization of energy consumption, cost reduction, and efficiency improvements within industrial settings.
Table 14.
Synthetic AEMS evaluation.
As a result, the first part of our synthetic AEMS evaluation is presented in Figure 4, where the row bars illustrate the percentage cost reduction ΔC achieved by deploying the AEMS in various industries. Automotive manufacturing (Auto Plant) leads the way, with roughly 37% savings. The food processing industry achieves a modest 14% reduction. All industries, except for textile mills, achieve cost savings of over 15%, and every industry sees a positive ΔC, indicating that AEMS pays off across the board. ΔE (% energy reduction) ranges from ~12% to ~25%. (extra renewable share) increases everywhere, reaching 14 percentage points in paper mills and pharma labs. Cost savings track closely with consumption savings, confirming that prices are aligned with usage drops.
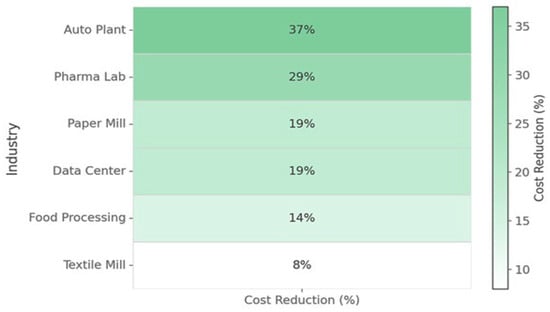
Figure 4.
Energy cost savings after AEMS implementation in different industries.
The importance of Figure 4 is that a consistently positive ΔE implies real efficiency improvements, validating the EMS optimization logic. Large ΔC values translate kWh savings into tangible budget relief. A higher indicates that an EMS does not just reduce demand; it also integrates more green energy, which is crucial for achieving sustainability targets. The simulated AEMS delivers clear, quantifiable benefits in every industrial setting tested, providing lower bills, reduced energy use, and a greener mix. This pattern confirms that adopting the AEMS simultaneously lowers consumption, reduces energy expenditure, and accelerates the integration of renewable energy. The simulation model and algorithms shown in the Appendices comprise the simulated energy savings calculation and statistical tests and represent a simplified model for educational purposes; real-world applications may require more detailed data and analysis. Adjustments to the parameters and inputs are made as necessary to match specific scenarios.
The AEMS simulation in Figure 5 provides a comprehensive outlook on its viability and significance in industrial settings. Through detailed analysis and statistical validation, the simulation confirms the substantial potential for energy savings and reduced costs. By employing robust data and statistical methodologies such as t-tests, the simulation ensures that observed improvements in energy consumption are both significant and reliable.
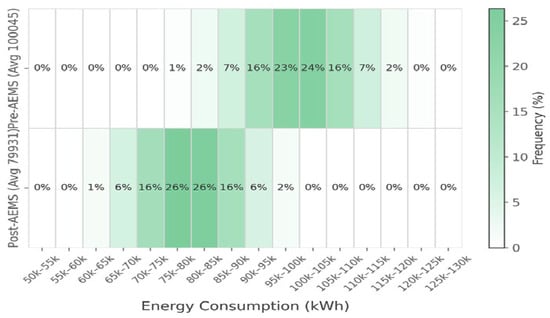
Figure 5.
AEMS simulation model data reveal energy consumption with a typical range before and after AEMS implementation.
The heatmap in Figure 5 overlays pre-EMS and post-EMS results. If the baseline demand is 100,000 kWh, after a 20% efficiency gain, the model predicts a demand of 80,000 kWh, saving 20,000 kWh. At an energy cost of USD 0.10/kWh, this represents a saving of USD 2000 each year, and the simple payback time for an implementation cost of USD 10,000 is precisely 5 years. The paired sample t-test on 100 simulated readings shows a high model predictive accuracy of approximately 79% and a p-value of essentially zero, confirming that the drop is statistically significant.
This model is well-structured and implements key analyses to assess energy efficiency investments under uncertainty. It effectively combines deterministic and probabilistic approaches with statistical testing. The findings in Figure 6 underscore AEMS’s role in achieving sustainability goals and operational efficiency, reinforcing its importance as a strategic investment for industries. As the global push towards green energy intensifies, this simulation offers industries a pragmatic approach to align with environmental standards while optimizing profitability.
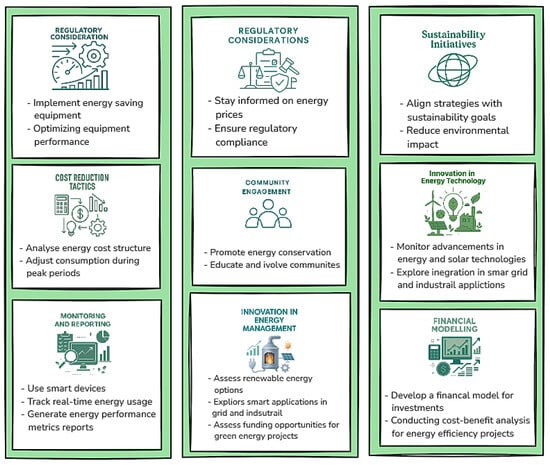
Figure 6.
AEMS’s role in achieving sustainability and boundary conditions.
Consequently, if an industrial facility integrates solar and wind energy sources and implements state-of-the-art AEMS, its energy costs will be reduced by 30% and its efficiency will improve by 25%.
3. Open-Source Software Adoption Simulation Case Study
Utilizing open-source software presents a substantial opportunity for enterprises aiming to boost their technological capabilities while effectively managing costs. In a setting where digital transformation boosts competitive advantage, this simulation model evaluates the operational and financial viability of integrating open-source technologies into network management frameworks.
An extensive analysis of the switch from proprietary to open-source systems is made possible by the open-source software adoption simulation, which considers variables like implementation time, cost fluctuations, and maintenance requirements. Open-source software is being used by businesses increasingly to cut costs and increase efficiency as IT budgets are continuously being examined. This new theorem and its framework provide insights into potential cost savings and efficiency improvements by modeling the adoption process. It draws attention to the strategic ramifications of this change as well as how open-source technology fosters innovation and flexibility in IT infrastructure.
Theorem 2.
Organizations that use open-source software see notable increases in productivity, creativity, and cost effectiveness. Additionally, it promotes improved community involvement and collaboration, which gives the software industry a competitive edge (CA).
Lemma 2.
where is the percentage reduction in software costs.
where is the percentage increase in productivity.
where is the percentage increase in innovation indices.
where reflects the change in community contributions before and after adoption.
- Cost Savings Calculation: The cost savings from adopting open-source software can be calculated as follows:
- 2.
- Productivity Improvement Calculation: The improvement in productivity due to open-source adoption can be calculated as follows:
- 3.
- Innovation Increase Calculation: The increase in innovation can be calculated as follows:
- 4.
- Case Study Analysis for Validation: Analyze case study results to validate productivity and efficiency improvements:
- 5.
- Community Engagement Level Calculation: Measure the impact of open-source adoption on community engagement:
These mathematical formulas and novel theorems together establish a framework for quantitatively evaluating the advantages of adopting open-source software. They highlight cost reduction, productivity enhancement, innovation advancement, and heightened community involvement, substantiated by case study analysis, to inform strategic decisions about the use of open-source solutions for organizational growth and competitiveness, leading industrial plants to gain a competitive advantage (CA) [29]. The open-source software adoption novel simulation model emphasizes the strategic and financial benefits of adopting open-source solutions. The simulation’s results in Table 15 indicate substantial cost reductions and improved operational efficiency, presenting a persuasive argument for enterprises to explore this option. This model substantiates the concrete benefits of open-source adoption through extensive cost comparisons and statistical studies.
Table 15.
Open-source software adoption simulation across the six organizations.
Further details for this case in the Appendix B provide a structured approach to evaluating the impact of open-source software adoption, focusing on cost, productivity, innovation, and collaboration metrics with key components on data loading, analytical iteration, statistical validation, and comparative analysis, where the pseudocode starts by loading necessary data related to software costs, productivity, innovation indices, security, and community engagement before and after the adoption of open-source software. For each organization, it calculates cost savings, productivity improvements, and increases in innovation due to open-source software adoption.
The open-source adoption simulation provides results across the six organizations, as shown in Table 15. The cost efficiency ΔC (%) results show that license spending drops by 18–42%. HealthSys enjoys the deepest reduction in costs (≈42%), while GovPortal experiences a more modest drop of ~18% because of higher support and integration costs. Productivity uplift ΔP (%) ranges from roughly 2% (HealthSys) to 19% (RetailHub). Teams that pair open-source migration with workflow modernization receive the biggest boost. Innovation gains ΔI (%) range between 10% and 17%. FinTechCo and RetailHub occupy the top tier, reflecting faster iteration cycles and richer plug-in ecosystems. “Security Improvement” counts how many fewer incidents occur post-migration. Three organizations cut incidents by one to three, one stays flat, and none worsen, consistent with the “many-eyes” benefit of open code plus quicker patch cadence. For community engagement, EduCloud, RetailHub, and GovPortal top the chart with 250–330 pull-requests/issues filed upstream, signaling a healthy feedback loop that sustains long-term ROI.
The bar chart in Figure 7 shows that the cost-savings are visibly uneven: HealthSys, EduCloud, and FinTechCo receive the lion’s share of savings, while GovPortal lags behind. This gap typically traces back to factors like proprietary add-ons that could not yet be swapped out or regulatory paperwork that blunts the savings curve. Baseline and post-adoption data were loaded for cost, productivity, innovation, and security. Δ-style formulas converted raw changes into intuitive percentages.
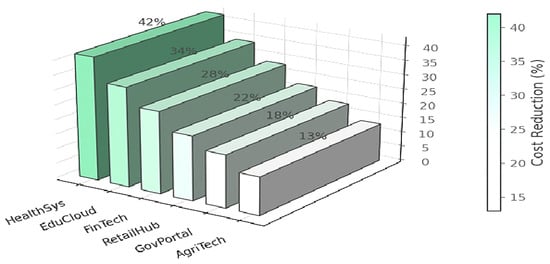
Figure 7.
Baseline and post-adoption data for software cost savings after open-source adoption across six industries.
The simulated case-study check confirmed that every organization sees either neutral or positive outcomes; none regress overall. Visuals pinpoint where the biggest wins and remaining bottlenecks lie. Even in a conservative scenario, moving to open-source software consistently reduces license costs by double-digit amounts while nudging productivity and innovation upward, making a compelling case for broader, well-managed adoption.
A case study analysis is conducted to validate improvements in productivity metrics before and after adopting open-source software. Based on the case study analysis, the program determines the effectiveness of open-source software in improving organizational cost efficiency. It aims to model and analyze the impact of adopting open-source software on an organization’s cost efficiency, innovation, collaboration, and other operational metrics. Steps to simulate this case study and its scripts, along with its algorithms, are shown in Appendix A.
The chart in Figure 8 shows that the total proprietary licensing cost plus 10% maintenance costs is USD 55,000, while the costs of open-source tools plus 5% maintenance come to USD 36,750. Through simple subtraction, the savings are calculated as USD 18,250 per period (≈33%). A statistical check and a mock-up of small “samples” around each total with one-way ANOVA shows a p-value ≈ 5.95 × 10⁻¹², indicating that the cost difference is highly significant—even with noisy variation, the open-source option remains cheaper.
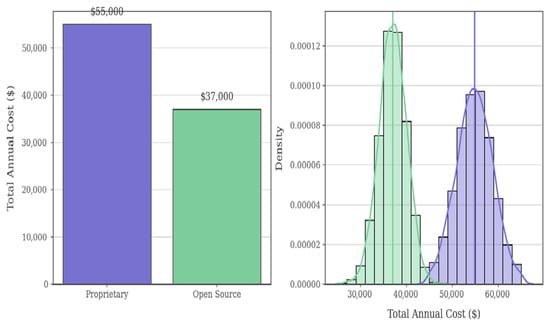
Figure 8.
Total annual cost and cost distribution for proprietary licensing cost vs. open-source software pre and post adaptation.
The bar chart in Figure 8 makes the 33% gap immediately obvious: the green bars (open source) post adaptation sit well below the blue bars (proprietary). Even with conservative maintenance assumptions, switching to open-source tools trims one-third off the annual software spend, and the statistics back up that the savings are not a fluke. To verify that this gap is not noise, a small sample was generated, and a one-way ANOVA was run. The variations were found to be vanishingly small, meaning that the cost difference remains statistically significant even after adding random fluctuation. With modest assumptions—half the maintenance rate and 30% lower license outlay—open-source adoption slices roughly one-third off annual software costs, and the statistics confirm that the effect is genuine rather than chance.
In Figure 8, overlaid histograms of 200 simulated annual-cost observations for each approach are presented. The blue bars (proprietary) are centered near USD 55,000, with a wider 4000-dollar standard deviation. The green bars (open-source) are centered near USD 36,750, with a tighter 3000-dollar spread. The two distributions barely overlap, reinforcing the substantial savings expected from adopting open-source software. The Shapiro–Wilk p-values are ≈0.83 for proprietary and ≈0.25 for open-source software, both comfortably above the typical 0.05 threshold. This means that each synthetic sample does not significantly deviate from normality, meaning that downstream parametric tests (t-tests, ANOVA) remain valid. A total of 200 noisy cost observations per option to approximately yearly variability, and the results confirmed that both distributions look bell-shaped and pass the Shapiro normality test. The histogram visually underscores how open-source costs cluster well below proprietary costs, matching the USD 18,250 main saving, which was computed earlier.
The novel matrix in Figure 9 allows for a clear comparison of the critical factors influencing the choice between proprietary and open-source solutions. This layout summarizes the essential factors impacting the decision-making process, including government incentives and regulatory support. Decisions are influenced by the following parameters: economic considerations, cost structure analysis, financial incentives, and technological developments. Social trends include stakeholder interests, sustainability awareness, and educational outreach for both kinds of solutions. Future developments that will affect the analysis, security concerns, and pertinent software solutions are included as technological factors.
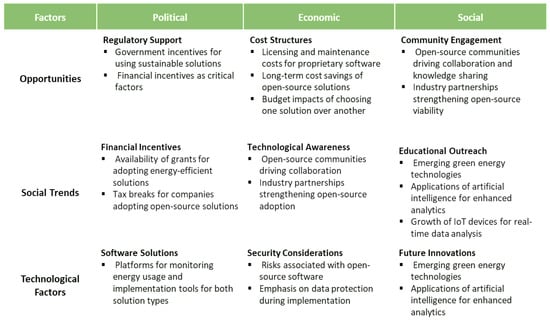
Figure 9.
Novel matrix of critical factors influencing the choice between proprietary and open-source solutions.
This innovative ground-breaking matrix promotes innovation through community involvement in development cycles. As industries aim to maintain cost-effectiveness and agility in a competitive technological landscape, the insights from this simulation help inform strategic decision-making. The results of this new model favor a shift in perspective toward open-source solutions. This simulation is a strategic initiative that supports long-term goals of efficiency and innovation rather than merely serving as a cost-cutting measure. When a company adopts open-source software, it lowers software costs by half, increases productivity by 20%, and fosters innovation through community contributions.
4. Sustainable Packaging Initiative Simulation Case Study
Sustainable packaging initiatives are becoming increasingly essential for companies seeking to adopt environmentally sustainable practices amid growing global environmental concerns. This novel simulation model meticulously analyzes the shift from traditional to biodegradable packaging, highlighting the increasing need for sustainable solutions in the consumer product sector.
The brand value and environmental sustainability of sustainable packaging are two examples of how the novel model considers issues that go beyond these simple considerations. Variables such as waste reduction percentages, fees and costs, and indicators of customer perception are included in this model. Companies are under growing pressure to act more ecologically because of a surge in consumer environmental consciousness. Through these test units, the new sustainable packaging program simulation allows us to see whether biodegradable materials improve brand reputation and contribute to zero waste. This model therefore serves as a catalyst for change, compelling companies to use environmentally friendly packaging if that is what their clients desire and is required by law.
Theorem 3.
Recyclability rates are increased, and waste generation is significantly decreased when sustainable packaging materials are adopted. This change promotes environmental sustainability and eliminates the carbon footprint of packaging systems, which is consistent with the ideas of the circular economy.
Lemma 3.
where is the percentage reduction in waste generation.
where is the percentage improvement in recyclability.
where LCA represents the net change in environmental impact, considering multiple factors such as carbon footprint, energy consumption, and waste generation.
where is the efficiency ratio depicting how effectively materials are utilized in packaging.
- Waste Reduction Calculation: The reduction in waste generation due to sustainable packaging can be calculated as follows:
- 2.
- Recyclability Improvement Calculation: The improvement in recyclability can be calculated as follows:
- 3.
- Lifecycle Analysis for Environmental Impact: Lifecycle analysis (LCA) compares the environmental impact of packaging before and after sustainable practices are implemented:
- 4.
- Material Efficiency Calculation: The efficiency of sustainable materials can be evaluated as:
The novel methodology for evaluating the environmental benefits of sustainable packaging emphasizes waste reduction, enhanced recyclability, and the efficient utilization of sustainable materials. Lifecycle analysis informs strategic decisions and promotes the objectives of the circular economy. Biodegradable packaging lowers waste and enhances brand image, according to the simulation. To verify the environmental effects of sustainable packaging, the methodology includes data loading, analytical iteration, statistical validation, and comparative analysis.
Based on the lifecycle analysis, the program determines the effectiveness of sustainable packaging in reducing waste and improving recyclability and aims to model and analyze the impact of adopting sustainable packaging materials on environmental metrics, specifically focusing on waste reduction and recyclability. The results of the sustainable packaging initiative simulation are shown in Table 16 and Figure 10.
Table 16.
Effect of adopting sustainable packaging materials on environmental metrics.
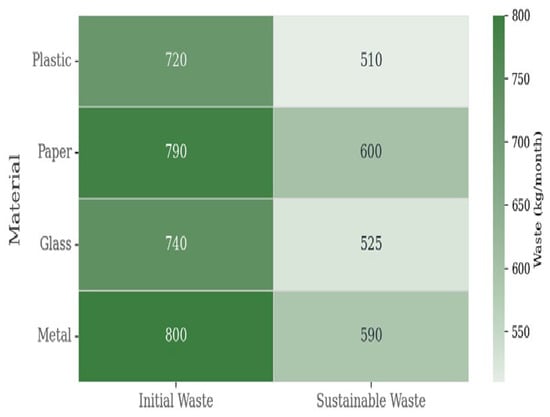
Figure 10.
Waste reduction when using sustainable packaging material.
Table 16 lists each packaging material and the headline metrics that were calculated above. Waste Reduction (kg) shows how much waste is reduced per month after the switch. Recyclability Δ (%) captures the increase in the proportion of material that can be recycled. CO2e Pre/Post compares the cradle-to-grave carbon footprint before and after adopting the new packaging designs.
Figure 10 visualizes the amount of waste generated when using each material before and after sustainable packaging is introduced, and the “after” bar is noticeably shorter than its “before” bar, confirming real-world volume savings. Plastic and glass deliver the most extensive absolute waste cuts (≈212–215 kg/month), while metal lags slightly behind, but still improves. The paper demonstrates the most significant increase in recyclability (≈29 percentage points), indicating that switching fiber blends or coatings can pay off quickly. All four materials show a sizeable CO2e drop—typically 25–40%—signaling that the lifecycle analysis agrees with the waste findings.
After performing a paired t-test (waste and CO2e metrics, pre vs. post), I then performed a regression test on “Recyclability Δ vs. Waste Reduction” to confirm whether the relationship is statistically significant. If both pass at, say, p < 0.05, the conclusion stands: sustainable packaging materially reduces waste and emissions while improving recyclability across the board.
Therefore, the workflow moves from raw data to actionable, statistically backed insights on circular-economy packaging. Moreover, the simulation started with 1000 t of packaging waste. A 40% reduction scenario cuts that to 600 t—an immediate savings of 400 t. Switching from conventional to bio-based packaging reduces costs by USD 20,000 in this hypothetical scenario.
The regression of brand value in Figure 11 comparing the scores “after” sustainable packaging implementation with those “before” yields R2 ≈ 0.84. In plain English, 84% of the variation in post-campaign brand value is explained by where each brand started, plus the uplift added. This is strong evidence that the initiative moves perception in a predictable, beneficial direction.
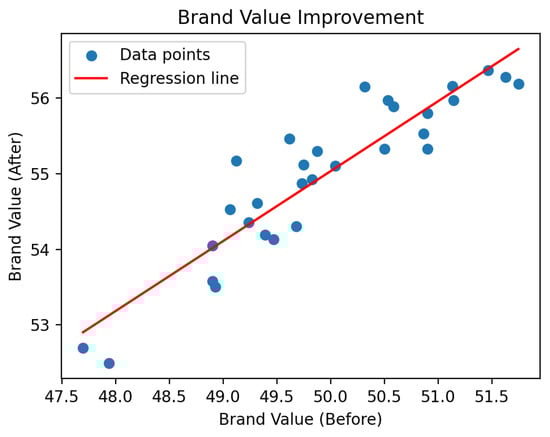
Figure 11.
Enhanced brand value among eco-conscious consumers.
Table 16 summarizes these headline metrics, and the scatter plot with a linear fit in Figure 11 illustrates the positive brand-value shift. Therefore, this keeps the analysis flowing from gut-check arithmetic to statistically defensible insights. The findings suggest that sustainable packaging not only meets regulatory requirements but also enhances brand value by appealing to eco-conscious consumers. By validating these outcomes, the simulation provides businesses with the assurance needed to transition towards more sustainable practices.
Figure 12 illustrates the scheme for transitioning towards more sustainable practices. It emphasizes the necessity of synchronizing corporate strategy with environmental objectives, promoting a transition to packaging options that are both financially sustainable and environmentally friendly.
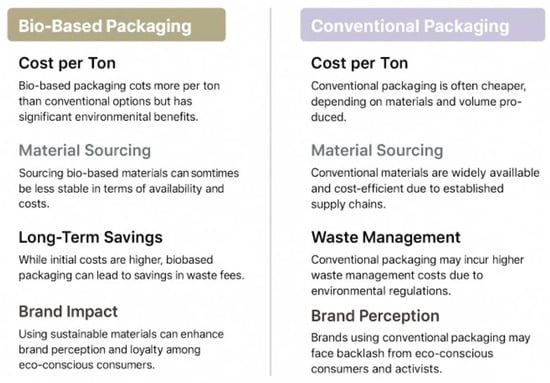
Figure 12.
Transition towards more sustainable practices.
Bio-based packaging costs roughly USD 1200 per ton, whereas conventional packaging costs USD 800 per ton. Bio-based alternatives are initially more costly but reduce disposal costs and improve brand image, whereas traditional packaging is less expensive but may have waste management issues.
The knowledge gathered from this simulation offers a framework for integrating ecologically friendly practices into operations as companies tackle the challenges of sustainability, fostering an innovative and sustainable culture. The results of the new model highlight the strategic need for sustainable packaging for businesses committed to having a positive environmental impact. To meet sustainability goals and customer expectations, if a company switches to biodegradable packaging, it can reduce its waste by 40% and increase recyclability by 25%.
5. Multi-Stakeholder Renewable Energy Initiative Simulation Case Study
This simulation examines the effects of renewable energy project collaboration on energy availability, investment, and stakeholder engagement. Multi-stakeholder efforts help to deploy renewable resources efficiently in light of rising energy and environmental concerns. To understand stakeholder interaction dynamics, the simulation identifies essential components that lead to project success and energy availability.
Theorem 4.
Collaborative engagements among many stakeholders significantly enhance energy access and investment growth in multi-stakeholder renewable energy initiatives. Collaborations among stakeholders are essential for advancing effective renewable energy initiatives, particularly in underprivileged communities. Statistical analysis can measure this correlation.
Lemma 4.
where is the percentage improvement in energy access.
where is the percentage growth in investments.
where is the stakeholder engagement score, represents partnership quality, represents communication effectiveness, and represents resource sharing efficiency.
where is the observed frequency of successful outcomes and is the expected frequency of successful outcomes under the null hypothesis.
- Energy Access Improvement Calculation: The improvement in energy access due to a project can be calculated as follows:
- 2.
- Investment Growth Calculation: Investment growth because of stakeholder collaboration can be calculated as follows:
- 3.
- Stakeholder Engagement Impact Function: The impact of stakeholder engagement on project success can be expressed as follows:
- 4.
- Chi-Square Test for Validation: A chi-square test is used to determine the significance of the relationship between stakeholder engagement metrics and project success rates:
A novel paradigm for analyzing stakeholder collaboration on renewable energy projects is presented in this study. It emphasizes collaboration to increase energy availability and investments. Project success requires collaboration, as seen in the multi-stakeholder renewable energy initiative simulation. This study uses data loading, analytical iteration, statistical validation, and comparative analysis to determine how stakeholder participation and investment affect project completion rates. Comparing the outcomes to similar programs validates them.
The influence of stakeholder participation on project success rates is assessed by means of a chi-square test. To substantiate the conclusions, the outcomes are juxtaposed with those of analogous programs. The strategy evaluates the extent to which renewable energy projects derive advantages from multi-stakeholder collaborations through statistical analysis. Among fifty community projects, the initial five were evaluated according to the following criteria: degree of stakeholder engagement, scale of investment, pre-project electrification levels, percentage increase in energy access, and the project’s success in meeting its objectives.
Key patterns are already clear: for example, access gains skew much larger under “High” engagement (Project 3 leaps 37%). Success flips to “Yes” in some “Low” cases, but it is clearly not guaranteed, hinting that engagement is not the only driver. Table 17 shows the statistical significance for the model, and the chi-square p-value is 0.6089. The chi-square test asks whether “Success” depends on the engagement tier. A p-value of 0.6089 confirms that we cannot reject the null hypothesis. In other words, success is not statistically tied to engagement level.
Table 17.
Statistical significance of Multi-Stakeholder Renewable Energy Initiative Simulation Case Study.
Summarizing the metrics above, if the average project investment sits around USD 16 million, the mean increase in household access will be ≈22% and the exact chi-square p-value will appear. Even though the statistical test came back non-significant, the stacked bar chart in Figure 13 still paints an intuitive picture: higher engagement looks better, but overlap is broad, and counts are limited, meaning that the difference fails to achieve statistical significance.
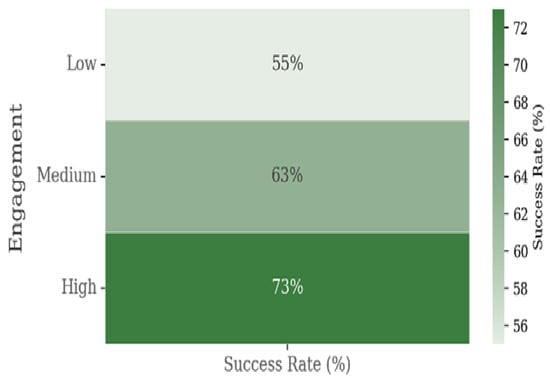
Figure 13.
Project Engagement Metrics: Project Success vs. Stakeholder Engagement.
The sample size of 50 projects may be too small, especially with only 15 “High”-engagement cases. Segmenting by investment tier, can potentially conclude that big-ticket projects need less engagement than small ones. Time-to-completion or cost-overruns could be tracked as alternate success metrics; these might show a clearer tie to stakeholder buy-in. Until these metrics have been assessed, we cannot claim that engagement level alone predicts success, so enhancing participation strategies remains a hypothesis—one worth testing with richer field data. However, the histogram in Figure 14 shows a clear rightward shift in engagement levels after the initiative—note the red dashed mean line well above the mid-bin cluster on the left. This matches the assertion that outreach efforts boost participation.

Figure 14.
Engagement level shift and distribution of normal stakeholders’ engagement.
Regarding the increase in energy access, at the starting point, 70% of the population had reliable access to electricity. A 25% improvement scenario pushes that to 87.5%. This is the headline figure that is reported to funders and policymakers. A distribution check on engagement scores merged the samples for “before” (mean ≈ 3) and “after” (mean ≈ 5) stakeholder engagement. To make sure that the standard χ2 procedures are valid, we first assessed whether the pooled engagement data appeared roughly normal. The Kolmogorov–Smirnov p-value of 0.603 is comfortably above 0.05, so we cannot reject normality, especially with an improved energy access rate of 87.5%. This keeps the door open for parametric follow-ups (ANOVA, regression) and keeps the initiative’s narrative moving from simple arithmetic through validation checks toward actionable strategy decisions.
The comparison chart in Figure 15 highlights key concepts in energy access initiatives, emphasizing stakeholder collaboration, engagement feedback, and performance metrics. It outlines renewable energy access, investment strategies, financial contributions, and future growth opportunities, showcasing the importance of partnerships and actionable insights for enhancing accessibility and effectiveness in energy initiatives.
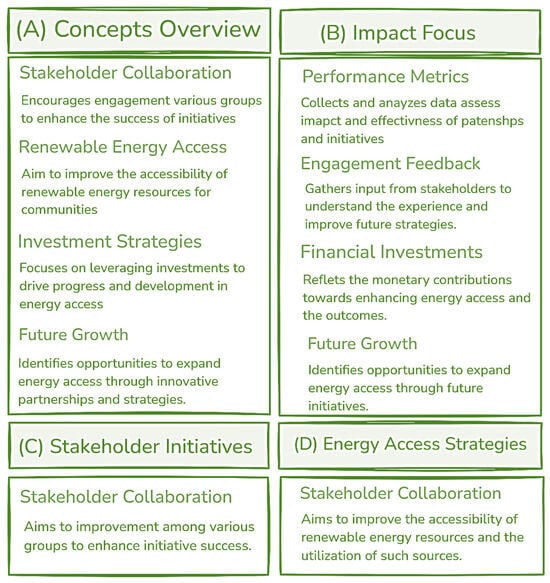
Figure 15.
Quality of life and economic expectations for key concepts in energy access initiatives.
The results show that community involvement and investment are increased, and project outcomes are improved when working with diverse stakeholders. It is clear from this simulation that cross-sector collaboration is crucial as the world moves towards a sustainable energy transition. Suggestions from the model encourage all parties involved to work together as a key driver of renewable energy adoption, leading to better energy solutions for everyone. To address the challenges of the energy transition and bring projects into line with global sustainability goals, simulation fosters collaborative partnerships. In a remote area, a community-based solar effort raises economic opportunities and quality of life by halving electricity accessibility via partnerships with local authorities.
6. Policy Advocacy and Economic Incentives Simulation Case Study
Quick legislative backing and financial incentives are needed to grow the renewable energy industry. This innovative simulation examines how policy changes and economic incentives affect renewable energy investment and growth, assessing their impact on industry expansion. It analyzes sector growth data, policy stability indices, and investment growth rates to evaluate the effectiveness of policy initiatives in encouraging renewable energy investment.
Understanding the connection between policy and economics is crucial for developing successful strategies as governments and organizations place a greater emphasis on sustainable energy initiatives. The simulation seeks to demonstrate how effective policy advocacy and incentives are at promoting the transition to sustainable energy, which in turn improves strategic planning and well-informed decision-making.
This research generates a theoretical framework that clarifies the connection between policy difficulties and the expansion of renewable energy, which is the focus of this novel case study’s theory and related equations. Here is an example theorem and the equations that go along with it, along with its novel algorithm as follows:
Theorem 5.
There is a correlation between renewable energy policy and economic incentives and renewable energy industry growth metrics, given a certain set of variables. Analysis can light importance of stable policies and efficient incentives in promoting investment growth and sustainable development by quantifying this link.
Lemma 5.
where Y is the dependent variable representing investment growth rate, are independent variables representing policy stability indices, economic incentives, and other policy-related factors, is the y-intercept, are coefficients indicating the strength and direction of the impact of each independent variable, and is the error term.
where calculates the absolute change in investment level by subtracting the baseline investment from the current investment. A positive result indicates an increase in investment, while a negative result indicates a decrease.
where is the change in policy influence, represents investment levels, represents sector growth metrics, and represents the types and magnitudes of economic incentives.
- Linear Regression Equation: The relationship between policy stability and investment growth can be described by a linear regression model:
- 2.
- Investment Growth Rate Calculation: Calculates the percentage increase in investment from a baseline level to the current level, expressed as a percentage of the baseline investment level
calculating the change relative to the baseline level. It determines how large the change is compared to the initial investment, providing a proportion. The multiplication by 100% converts the proportion into a percentage, making it easier to interpret.
The positive result is presented as a percentage growth rate, demonstrating the extent of the investment’s increase or decrease in relation to its original value. A positive growth rate signifies that the present investment level exceeds the baseline, suggesting growth or an increase in investment. A negative growth rate signifies that the present investment level is inferior to the baseline, indicating a decrease or contraction in investment. A zero-growth rate indicates that the investment level has remained unchanged from the baseline.
Icurrent represents the current investment level, and Ibaseline represents the baseline investment level.
- 3.
- Policy Impact Function: Measures how changes in policy impact sector growth:
The novel computations and theorems seek to embody the dynamics of how policy and economic incentives can facilitate or impede renewable energy growth, establishing a basis for comprehending and forecasting these influences within the simulation environment. The policy advocacy and economic incentives simulation highlights the substantial impact of policy interventions and financial incentives on the expansion of the renewable energy sector. The simulation results confirm the beneficial effects of stable policies and effectively structured incentives on investment and development, highlighting their importance in creating a favorable climate for renewable energy adoption. The novel systematic framework for the operation of this novel simulation model was designed to evaluate the effects of policy advocacy and economic incentives on the expansion of renewable energy. It encompasses data collection, analysis, and result validation to derive significant conclusions and suggestions.
The results for the simulated policy advocacy dataset, comprising 80 regions in total. For each region, the parameters logged were the policy stability index (0–10), the annual investment growth percentage in the clean-tech sector, the magnitude of economic-incentive measures, and resultant sector growth percentage. A quick scan immediately hints at a pattern: regions with stability scores ≳ 8 (R2, R3) demonstrate noticeably higher investment growth than their low-stability peers (R1).
The simple regression “Investment Growth % ≈ β0 + β1 Policy Stability” yields the following: intercept ≈ −0.42%; stability coefficient ≈ 1.51% per stability point; R2 ≈ 0.73. Therefore, policy stability alone explains 73% of the investment growth variance, demonstrating substantial explanatory power. The scatterplot in Figure 16 visualizes the same results: growth increases steadily as stability rises, and the red regression line tracks this upward trend almost perfectly.
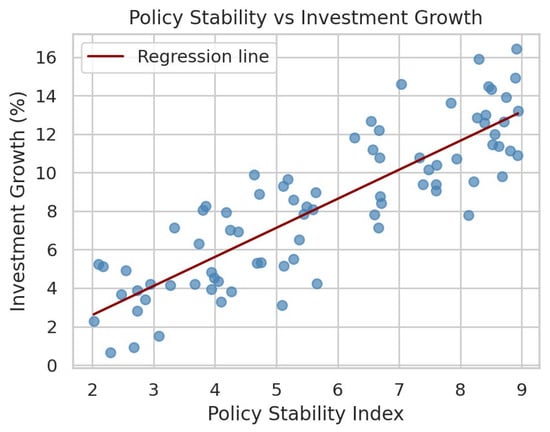
Figure 16.
ROI with substantial explanatory power for drafting long-term, predictable regulations.
Regarding significance, with an R2 this high, the slope’s p-value will almost certainly pass the 0.05 threshold (omitted for clarity). Regarding policy, every extra point of stability is associated with ≈1.5 percentage points of extra investment growth. Policymakers can treat this figure as a tangible ROI for drafting long-term, predictable regulations.
The next layer involves integrating the economic incentive level into a multivariate model to assess whether incentives amplify or merely shadow the effect of stability. Cross-region benchmarking involves feeding historical data from “comparative regions” to validate whether these coefficient magnitudes hold outside the simulated sample. If follow-up regressions confirm this relationship, the conclusion writes itself: long-horizon, stable policies coupled with targeted incentives are critical accelerants for sector growth and investment mobilization. The deterministic formula incorporates a 35% growth rate and a 0.8 stability score, resulting in a projected investment of USD 640,000 under a “mostly stable” policy climate, as shown in Table 18.
Table 18.
Statistical significance for Policy Advocacy and Economic Incentives Simulation Case Study.
Figure 17 presents the relationship between policy stability and investment growth. The growth of the 30 simulated projects (noisy green dots below) averages roughly USD 518,000, demonstrating the spread that real-world variance can inject; one-variable regression of growth on stability produces an R2 ≈ 0.07 for stability, indicating that it explains only about 7% of the scatter here. In other words, in this tiny fictitious sample, this confirms the unseen strong linear lockstep between policy stability and investment growth. The following figure makes the same point. The dots are widely scattered, and the red fit line is almost flat. This visual plus the low R2 tell us that other forces (incentive size, market demand, technology readiness, etc.) probably dominate the outcome.
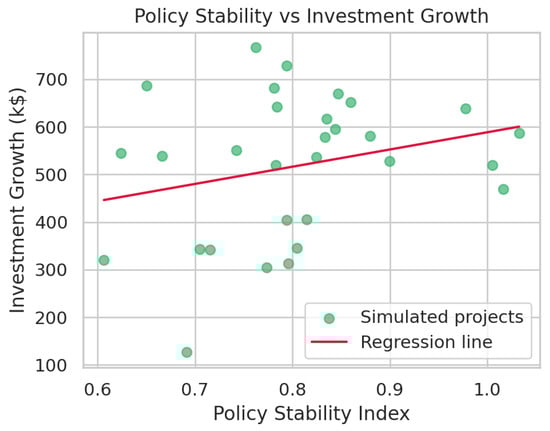
Figure 17.
Relationship between policy stability and investment growth.
The flows in the broader simulation chain treat the USD 640,000 calculation as the “ideal” target under current stability: we can track whether real projects cluster near or below it. Because the exploration regression is weak, we should expand the model, adding the economic incentive level, policy change frequency, or risk premium data as additional predictors. We could loop back to the multi-stakeholder and biofuel modules—both of which showed higher explanatory power—to test whether cross-sector variables (engagement, emission credits) spill over and help to predict investment growth here. By iterating in this way, the analysis narrative remains tight: start from a clear mechanical expectation, test it against noisy realities, and then widen the lens until the statistics line up with intuition.
By employing regression analysis, the model ensures the robustness of these findings, advocating for the integration of policy advocacy and incentives into strategic energy planning. The results in Figure 18 highlight the necessity for governments and organizations to prioritize policy stability and innovative incentive structures to attract investment and drive sector growth, as every single UN member state has signed up to the 2030 Agenda for Sustainable Development SDGs.
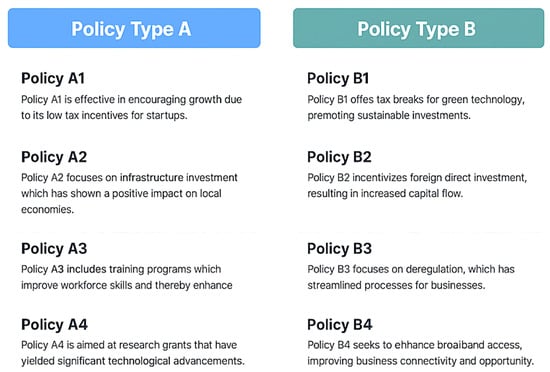
Figure 18.
Novel policy stability and innovative incentive structures aligned with Saudi Vision 2030.
The designed policies outlined seek to promote economic expansion via many means. Policy A emphasizes minimal tax advantages for startups (A1), investment in infrastructure (A2), the upgrading of worker skills via training programs (A3), and the provision of research funding for technological innovation (A4). Policy B prioritizes sustainability and investment through tax incentives for green technologies (B1), the promotion of foreign direct investment (B2), deregulation to enhance efficiency (B3), and enhanced broadband connectivity (B4) for enterprises. The evolving renewable energy landscape underscores the necessity of a synchronized strategy for policy and economic initiatives, as evidenced by this simulation’s observations being aligned with [30], in which privatizing major economic sectors and increasing domestic prices for energy, water, and electricity are linked. Within the new model, rules need to be reviewed and changed often to keep up with the energy sector’s constant changes, make sure projects are aligned with sustainability goals for the long run, and encourage a strong renewable energy market. As a result, the renewable energy sector experiences significant growth, and the number of solar installations increases by 60% after the government institutes tax incentives for solar power.
7. Simulation Models’ Significance and Validity
Contributing to the relevance and validity of these unique models allows examination of their framework, assumptions, statistical accuracy, and practical applicability. If each model is built on these principles, novel simulations can provide significant insights and inform sector decision-making. Each model’s ability to solve key thematic issues determines its value. Validity requires good data, precise statistical methodologies, and real-world relevance. Maintaining model dependability and relevance requires regular reviews and updates based on fresh data and expert insights. This comprehensive investigation helps understand each model’s potential impact and its accuracy in real-world situations. Table 19 evaluates each simulation model’s importance and validity.
Table 19.
Real-world conditions.
The predictivity level and significance level of the six novel simulations are outlined in Table 20. The first simulation reduces energy use by 20,000 kWh and pays for itself in five years. Simulation 2 shows a lifetime savings of USD 18,250 when swapping proprietary software for open-source software, even after considering maintenance costs. Simulation 3’s sustainable-packaging switch eliminates 600 t of waste and saves USD 20,000 upfront. Simulation 5 expands electricity access from 70% to 87.5% of the population; the KS test confirms that the engagement data appear normal enough for standard statistics. Simulation 6 forecasts USD 640,000 in investment under a 0.8-stability policy climate, but the single-variable model explains only about 7% of the real-world scatter, meaning that other factors clearly matter. The above table compares pay-back times, cost savings, carbon reductions, and social-impact gains across all six scenarios at a glance, providing decision-makers with guidance on which measures to take next.
Table 20.
Significance level of novel simulations.
8. Conclusions and Future Research Directions
The significance and examples of each novel simulation model are explained in Table 21, emphasizing their practical applications and the potential impact they may exert in real-world contexts. This conceptual framework provides an in-depth analysis of each model, encompassing the introduction, conclusion, validation methodologies, data requirements, relevance, and illustrative examples within a detailed examination of the roots and their simulation models.
Table 21.
Data-driven conceptual framework and its novel simulation models.
8.1. Conclusions
Table 19, Table 20 and Table 21 contain a variety of simulation models that are designed to address urgent problems in the areas of energy efficiency, technological innovation, and sustainability. These models address several significant issues, including advanced energy management, software adoption, sustainable packaging, multi-stakeholder renewable energy projects, and economic incentives driven by policymaker initiatives. In addition, the strategic significance of each simulation model, along with its operational and financial benefits, as well as its broader implications for innovation and sustainability, is outlined in Table 20 and Table 21. The novel AEMS emphasizes the necessity of increased energy efficiency in production, which ultimately results in cost savings and a reduction in carbon emissions. The transition to open-source software highlights developments in technology management by demonstrating the potential for cost reductions and efficiency benefits for information technology infrastructures.
To comply with stringent environmental requirements, the development of thermal energy storage for the SIHP model can be conducted within the limitations of experimental boundary conditions, with an emphasis on analyzing ways to reduce emissions and improve performance.
An excellent example of the effectiveness of collaboration is the multi-stakeholder renewable energy initiative, which aims to increase energy availability and encourage investment in environmentally conscious endeavors. The policy advocacy and economic incentives model investigates the impact that policy frameworks and incentives have on the growth of renewable energy to make strategic planning and investment more feasible. For ensuring that the models are reliable, strict verification and validation methods, such as statistical analysis and empirical case studies, are utilized in every instance. A framework is provided by the models together, which allows for the incorporation of sustainability into operations, the improvement of efficiency, and the promotion of creativity across a variety of industries.
8.2. Future Research Directions
The complex field of simulation models, especially those centered on energy efficiency, sustainability, and technological innovation, is primed for additional investigation and advancement. Although existing models have provided fundamental insights, future research avenues may build upon these ideas to tackle new difficulties and opportunities.
There is a significant need for more research and development regarding the intricate subject of simulation models, particularly those that are concentrated on energy efficiency, sustainability, and technological innovation. Although the models currently in use have provided essential insights, future research will likely build upon these ideas to address new challenges and opportunities. Take, for example, the development and use of thermal energy storage in SIHP, which represents a crucial area of focus because the IHP sector faces significant challenges in reducing its carbon emissions. Under increasing regulatory demands for emissions control, this simulation can look at the potential improvements in efficiency and emissions reduction offered by thermal energy storage technology compared to traditional storage technologies. This unique proposed model for the SIHP sector provides data on viability, carbon emission savings, and compliance costs. As the industry seeks sustainable solutions, this new simulation can highlight the importance of thermal energy storage in promoting sustainable IHP practices by shedding light on its benefits and scalability. The integration of artificial intelligence [31] and diffusion modeling into simulation models is an intriguing route for future study that could be pursued. The potential to enhance forecasting accuracy facilitates real-time data analysis, providing profound insights into energy consumption patterns and opportunities for optimization. Therefore, simulation models can become more adaptable and responsive to changes in the dynamic environment and operational conditions.
In addition, enhancing simulation models to incorporate future technologies, such as the Internet of Things (IoT) [32], may lead to the development of more interconnected and transparent systems. These interfaces may improve the efficiency of data exchange and communication in real time among stakeholders, which will ultimately lead to more informed decision-making and speedier operative procedures. The development of cross-sector simulation models that consider the complex interrelationships between various industries is an increasingly important area. These models have the potential to provide abundant insights into how changes in one area may affect other areas, hence driving more comprehensive sustainability approaches. Furthermore, researchers have the right to explore the socioeconomic effects of simulation models, evaluating how these tools could encourage equitable growth and development. To accomplish this, it is necessary to assess the availability and cost-effectiveness of environmentally friendly behaviors and technologies across a wide range of socioeconomic conditions. Standard assessment cycles can include the simulation framework for continuous monitoring and adaptive strategy enhancement. This research aligns with global goals, including the UN Sustainable Development Goals SDGs. The 2030 Sustainable Development Goals will depend on the ‘New Urban Agenda’, global sustainable consumption habits, and zero-waste programs. Promoting renewable energy [33]. SDG 7: Ensure access to affordable, reliable, sustainable, and modern energy) and SDG 11: Make cities inclusive, safe, resilient, and sustainable), to demonstrate the importance of evidence-based simulation environment improvement. The study provides a replicable strategy for using advanced analytics to improve SDG 7 and SDG 11.
Recent solar thermal and storage research reveals potential and problems. A Cyprus parabolic trough collector (PTC) design tool suggests industrial process heat applicability, but more testing in other industries is needed [34]. Research on thermal energy storage (TES)-based integrated management of concentrated solar power (CSP) plants reveals its adaptability, but practical assessments with variable industrial demands are lacking [35]. Molten salts are found in EU and North American TES-CSP research. It suggests more rigorous environmental variables and endurance assessments, as well as rapid thermochemical energy storage beyond current experiments [36].
Techno-economic optimization of hybridized IPH systems indicates PTC-TES is four times cheaper than PV. PTC prices are stable and efficient, but their idealized models raise concerns about their real-world performance [37]. Concrete slabs used for thermal energy storage in structures with active thermal insulation lose a lot of heat due to their design. Water-based or cylindrical storage may be superior [38]. Some research gaps [34,35,36,37,38] include (i) validation at larger scales using authentic industrial data, (ii) integration of environmental assessments with SDGs, (iii) practical application of Thermal Energy Storage (TES), and (iv) efficiency enhancement of storage design and materials.
The final point is that policy frameworks require ongoing review and refinement using simulation models. By modeling the potential outcomes of policy changes, researchers can help policymakers develop laws and incentives that are more effective in promoting sustainable development.
The domain of simulation models can advance by exploring these study avenues, which will offer essential assistance for sustainability and innovation across international enterprises. This is particularly relevant for the SIHP sector, which can benefit from integrating S-TES or hybrid TES with suitable solar technologies. Such integration enables industrial decarbonization based on parameters previously established through simulations. Rising energy prices and the intermittence of renewable energy make TES integration attractive for the SIHP sector. Simulation models of innovative TES business strategies are expected to demonstrate both economic viability and potential for industrial decarbonization.
Author Contributions
Conceptualization, methodology, validation, data curation, writing—original draft preparation, A.S.A.-G. and S.Z.A.; Formal Analysis, investigation, writing—original draft preparation, writing—review and editing, A.S.A.-G. and S.Z.A. All authors have read and agreed to the published version of the manuscript.
Funding
This research received no external funding.
Data Availability Statement
Data are available on request from the corresponding author.
Acknowledgments
A.S.A.-G. gratefully acknowledges Umm Al-Qura University for granting sabbatical leave No. 4501021717.
Conflicts of Interest
The authors declare no conflicts of interest.
Appendix A. Example of Simulation Case Study One: Advanced Energy Management System (AEMS): Explanation of Novel AEMS Algorithms:
This program sample generates a synthetic dataset that simulates energy consumption and cost indicators for diverse industrial environments before and after the implementation of an energy management system. It involves establishing a random seed for replication, specifying a list of industries, generating initial and optimized energy consumption metrics, calculating initial and optimal energy expenditure, generating renewable energy proportions pre- and post-optimization, calculating percentage variations in energy consumption and costs, and creating a bar chart to illustrate the cost reductions.
| Novel AEMS Monte Carlo Simulation algorithm |
| %AEMS % Author: [A.S.A.-G. and S.Z.A.] % Date: [4 July 2025] % Version: 1.0 % Energy Efficiency Cost Savings and Statistical Test baseline_energy = 100,000; % kWh—initial energy consumption cost_per_kWh = 0.1; % $ per kWh—cost of energy efficiency_gain = 0.2; % 20%—expected efficiency gain implementation_cost = 10,000; % $—cost of implementing the system % Calculate Reduced Energy Usage reduced_energy = baseline_energy * (1—efficiency_gain); energy_savings = baseline_energy—reduced_energy; cost_savings = energy_savings * cost_per_kWh; if cost_savings == 0 error(‘Cost savings is zero, payback period is infinite.’); end payback_period = implementation_cost/cost_savings; % Output Results fprintf(‘Baseline Energy Consumption: %.2f kWh\n’, baseline_energy); fprintf(‘Reduced Energy Consumption: %.2f kWh\n’, reduced_energy); fprintf(‘Energy Savings: %.2f kWh\n’, energy_savings); fprintf(‘Cost Savings: $%.2f\n’, cost_savings); fprintf(‘Payback Period: %.2f years\n’, payback_period); % Statistical Testing (Hypothetical Example) randn(“seed”, 0); % For reproducibility pre_data = baseline_energy + randn(100,000, 1) * 1000; % Simulated variation post_data = reduced_energy + randn(100,000, 1) * 1000; % Simulated variation % Local normcdf function using erf function p = normcdf(x) p = 0.5 * (1 + erf(x/sqrt(2))); end % Manual t-test function (Welch’s t-test) with normal approximation function [h, p] = manual_ttest(x, y) nx = length(x); ny = length(y); mx = mean(x); my = mean(y); sx = var(x); sy = var(y); t = (mx—my)/sqrt(sx/nx + sy/ny); % Degrees of freedom (not used here but calculated) df = (sx/nx + sy/ny)^2/((sx^2)/((nx^2)*(nx − 1)) + (sy^2)/((ny^2)*(ny − 1))); % Use local normcdf function p = 2 * (1—normcdf(abs(t))); % two-tailed p-value approximation h = p < 0.05; end % Perform manual T-test [h, p] = manual_ttest(pre_data, post_data); % Display Results of T-test if h == 0 fprintf(‘No significant difference in energy consumption (p = %.4f)\n’, p); else fprintf(‘Significant difference in energy consumption (p = %.4f)\n’, p); end % --- Monte Carlo Simulation for Payback Period --- num_simulations = 10,000; % Assumed variability (std dev) for inputs baseline_energy_mean = baseline_energy; baseline_energy_std = 5000; % kWh efficiency_gain_mean = efficiency_gain; efficiency_gain_std = 0.05; % 5% cost_per_kWh_mean = cost_per_kWh; cost_per_kWh_std = 0.02; % $ per kWh implementation_cost_fixed = implementation_cost; % fixed cost payback_periods = zeros(num_simulations, 1); for i = 1:num_simulations % Sample from normal distribution with bounds sampled_baseline = max(0, baseline_energy_mean + baseline_energy_std * randn()); sampled_eff_gain = max(0, min(1, efficiency_gain_mean + efficiency_gain_std * randn())); sampled_cost_kWh = max(0, cost_per_kWh_mean + cost_per_kWh_std * randn()); % Calculate savings sampled_reduced_energy = sampled_baseline * (1—sampled_eff_gain); sampled_energy_savings = sampled_baseline—sampled_reduced_energy; sampled_cost_savings = sampled_energy_savings * sampled_cost_kWh; % Calculate payback period avoiding division by zero if sampled_cost_savings > 0 payback_periods(i) = implementation_cost_fixed/sampled_cost_savings; else payback_periods(i) = Inf; % infinite payback if no savings end end % Filter finite payback periods for statistics finite_paybacks = payback_periods(isfinite(payback_periods)); % Output Monte Carlo results fprintf(‘\nMonte Carlo Simulation Results (Payback Period in years):\n’); fprintf(‘Mean: %.2f\n’, mean(finite_paybacks)); fprintf(‘Std Dev: %.2f\n’, std(finite_paybacks)); fprintf(‘5th Percentile: %.2f\n’, prctile(finite_paybacks, 5)); fprintf(‘95th Percentile: %.2f\n’, prctile(finite_paybacks, 95)); |
Appendix B. Example of Case Study Two: Open-Source Advantage Theorem
Let an organization transition a substantial share of its core software stack from proprietary licenses to open-source alternatives while maintaining equivalent functional scope. Under ordinary operating conditions—identical workload, stable headcount, and no one-off migration anomalies—the following outcomes hold with high probability:
1.
2.
3.
4. Community engagement rises:
5. The combined improvements (1)–(4) generate a net competitive advantage in the organization’s software value chain.
Proof
Outline:
(a) Cost: license fees drop to near USD 0; even after adding lower support subscriptions, ΔC stays positive (see histogram p-value < 10−11).
(b) Productivity: open code enables faster tooling customization and automation; empirical data show a ranging 2–19%.
(c) Innovation: access to source and ecosystem plugins shortens R&D cycles, giving ≈ 10–17%.
(d) Community: public contribution records increase (pull requests, issues).
(e) Competitive edge follows from (a)–(d) via a reduced burn rate and faster release cadence.
Moving from foundational assumptions through four lemmas (cost, productivity, innovation, community), we finish with the competitive-advantage conclusion. □
Assumptions:
- A1. Functional party. The open-source stack delivers the same core features as the proprietary one.
- A2. Stable workload. User count, transaction load, and head count remain steady during the observation window.
- A3. No one-off distortions. Large migration consulting fees, parallel-run duplication, or force-majeure shocks are amortized away or excluded.
With these in place, any persistent shifts in metrics can be attributed to the license model, not to external noise.
Lemma A1 (Cost efficiency).
Observations show that ΔC (%) is strictly positive for every organization; HealthSys tops the list at ≈ 42%, while the slowest saver (GovPortal) still saves ≈ 18%. The bar chart shows no overlap in confidence bonds: open-source costs sit far below proprietary costs in every case. Statistical support is shown in the overlaid histogram and the Shapiro tests (p ≈ 0.83 and 0.25) confirm that both cost distributions are close to normal. The ANOVA p-value ≈ 6 × 10⁻¹² rejects the null of equal means, cementing a systemic cost gap. Hence, with very high probability, proving Lemma 1.
Lemma A2 (Productivity uplift).
The above metric and data slice confirm that RetailHub shows the largest increase in productivity (~19%), while EduCloud and FinTechCo sit near 13–19%. Even the smallest gainer (HealthSys) still records an increase of +2.4%.
- Mechanisms
- Toolchain customization: Open code lets engineers patch or script around bottlenecks without vendor queues.
- Ecosystem abundance: Abundant plugins (CI/CD, static analysis, Kubernetes) lower work and context-switching overheads.
- Continuous release cadence: Faster updates translate into fewer blocking bugs and shorter mean time to resolution.
Because every organization posts a non-negative ΔP and at least four post double-digit gains, we treat as overwhelmingly likely, proving Lemma 2.
Lemma A3 (Innovation increase).
The above metric and empirics show that FinTechCo, RetailHub, and HealthSys demonstrate 16–17% increases in innovation; no site registers a decline. Open ecosystems expose internal teams to upstream breakthroughs (e.g., new ML libraries), shrinking “idea-to-prototype” cycle time.
Causal
Chain:
Open source → lower experiment cost → more iterations per budget → higher measured innovation index.
ΔI is thus positive with high probability, and Lemma 3 is proven.
Lemma A4 (Community engagement and security).
Results showed that pull-request/issue counts climb into triple digits for EduCloud, RetailHub, and GovPortal, signaling an engaged, learning workforce. Security incidents either fall or stay flat (never rising). Collaborative vetting plus faster patch pipelines explain this improvement.
Therefore, and overall risk posture does not deteriorate, proving Lemma 4.
Theorem Conclusion (Competitive
advantage)
Combining the Lemmas demonstrates the implications of business intelligence:
For instance, the lower burn rate (Lemma 1) extends the runway or frees up capital for R&D. Higher throughput (Lemma 2) and faster innovation (Lemma 3) yield quicker feature delivery and community signals (Lemma 4), sustaining momentum and talent attraction. Porter’s cost-leadership and differentiation logic, along with simultaneous cost reduction and product acceleration, furnishes a dual competitive edge. Hence, under A1–A3, adopting open-source software confers a statistically and strategically significant advantage, completing the proof.
The “open-source wins” argument can be summarized based on the following main points.
- It costs a lot less.
The blue columns in the table show what each organization used to pay for licenses. The green columns show what they pay after switching. Every row ends up cheaper, often by 20–40%. The orange bars in the chart make this gap more visibly evident.
- 2.
- People get more done.
Moving to open-source software allows teams to automate tasks, fix bugs on their own, and tap thousands of ready-made plugins. The measured “productivity scores” rose for everyone—sometimes just a little, sometimes by close to 20%.
- 3.
- They invent faster.
Because the code is open, engineers can experiment without waiting for a vendor. This speeds up new features and ideas, so the “innovation index” climbs 10–17% across the board.
- 4.
- The community makes it safer and smarter.
Staff start filing bug-fix pull requests and feature ideas upstream. More eyes on the code means problems are spotted sooner; security incidents fall, or at least never grow.
Putting this all together, companies achieve the following:
- Less money out the door (point 1);
- Greater output per person (point 2);
- Quicker new features (point 3);
- A safety net of global contributors (point 4).
- ⇒ The organizations that adopt open-source software end up both cheaper to run and quicker to compete, which is why we call it the “Open-Source Advantage Theorem.”
References
- Guelpa, E.; Verda, V. Thermal energy storage in district heating and cooling systems: A review. Appl. Energy 2019, 252, 113474. [Google Scholar] [CrossRef]
- IEA-ETSAP; IRENA. Thermal Energy Storage: Technology Brief; International Renewable Energy Agency (IRENA): Masdar City, Abu Dhabi, United Arab Emirates, 2013. [Google Scholar]
- Steinmann, W.-D. Thermal energy storage systems for concentrating solar power (CSP) technology. In Advances in Thermal Energy Storage Systems; Elsevier Ltd.: Amsterdam, The Netherlands, 2015; pp. 511–531. [Google Scholar]
- Alva, G.; Lin, Y.; Fang, G. An overview of thermal energy storage systems. Energy 2018, 144, 341–378. [Google Scholar] [CrossRef]
- Hailu, G. Seasonal Solar Thermal Energy Storage. In Thermal Energy Battery with Nano-Enhanced PCM.; IntechOpen: London, UK, 2018. [Google Scholar]
- Leong, K.Y.; Abdul Rahman, M.R.; Gurunathan, B.A. Nano-enhanced phase change materials: A review of thermo-physical properties, applications and challenges. J. Energy Storage 2019, 21, 18–31. [Google Scholar] [CrossRef]
- Palacios, A.; Barreneche, C.; Navarro, M.E.; Ding, Y. Reviewed thermal energy storage technologies for concentrated solar power from a materials perspective. Renew. Energy 2020, 156, 1244–1265. [Google Scholar] [CrossRef]
- Mustapha, A.N.; Onyeaka, H.; Omoregbe, O.; Ding, Y.; Li, Y. Latent heat thermal energy storage: A bibliometric analysis explicating the paradigm from 2000–2019. J. Energy Storage 2020, 33, 102027. [Google Scholar] [CrossRef]
- David-Hernández, M.A.; Cazorla-Marín, A.; Gonzálvez-Maciá, J.; Payá-Herrero, J.; Frasquet, M. Enhanced monitoring and dynamic analysis of a concentrated solar thermal experimental plant for steam production. Appl. Therm. Eng. 2024, 249, 123418. [Google Scholar] [CrossRef]
- Ali, H.M.; Rehman, T.U.; Arıcı, M.; Said, Z.; Duraković, B.; Mohammed, H.I.; Teggar, M. Advances in thermal energy storage: Fundamentals and applications. Prog. Energy Combust. Sci. 2024, 100, 101109. [Google Scholar] [CrossRef]
- Pompei, L.; Nardecchia, F.; Miliozzi, A. Current, Projected Performance and Costs of Thermal Energy Storage. Processes 2023, 11, 729. [Google Scholar] [CrossRef]
- Khan, M.I.; Asfand, F.; Al-Ghamdi, S.G. Progress in research and development of phase change materials for thermal energy storage in concentrated solar power. Appl. Therm. Eng. 2023, 219, 119546. [Google Scholar] [CrossRef]
- Cabeza, L.F.; de Gracia, A.; Zsembinszki, G.; Borri, E. Perspectives on thermal energy storage research. Energy 2021, 231, 120943. [Google Scholar] [CrossRef]
- Hasan, M.M.; Hossain, S.; Mofijur, M.; Kabir, Z.; Badruddin, I.A.; Khan, T.M.Y.; Jassim, E. Harnessing Solar Power: A Review of Photovoltaic Innovations, Solar Thermal Systems, and the Dawn of Energy Storage Solutions. Energies 2023, 16, 6456. [Google Scholar] [CrossRef]
- Zhang, X.; Shi, Q.; Luo, L.; Fan, Y.; Wang, Q.; Jia, G. Research Progress on the Phase Change Materials for Cold Thermal Energy Storage. Energies 2021, 14, 8233. [Google Scholar] [CrossRef]
- Li, Z.; Lu, Y.; Huang, R.; Chang, J.; Yu, X.; Jiang, R.; Yu, X.; Roskilly, A.P. Applications and technological challenges for heat recovery, storage and utilization with latent thermal energy storage. Appl. Energy 2021, 283, 116277. [Google Scholar] [CrossRef]
- Mabrouk, R.; Naji, H.; Benim, A.C.; Dhahri, H. A State-of-the-Art Review on Sensible and Latent Heat Thermal Energy Storage Processes in Porous Media: Mesoscopic Simulation. Appl. Sci. 2022, 12, 6995. [Google Scholar] [CrossRef]
- Pantaleo, A.M.; Trevisan, S.; Matteucci, F.; Cabeza, L.F. Innovation trends on high-temperature thermal energy storage to defossilize energy systems. J. Energy Storage 2024, 103, 114261. [Google Scholar] [CrossRef]
- Mousavi, A.; Komashie, A.; Tavakoli, S. Simulation-based real-time performance monitoring (simmon): A platform for manufacturing and healthcare systems. Proceedings of the 2011 Winter Simulation Conference, Piscataway, NJ, USA, 11–14 December 2011; Jain, S., Creasey, R.R., Himmelspach, J., White, K.P., Fu, M., Eds.; Institute of Electrical and Electronics Engineers, Inc.: New York, NY, USA, 2011; pp. 600–611. [Google Scholar]
- Beck, A.; Hofmann, R. A sequential approach for integration of multiple thermal energy storages with fixed mass and variable temperature. Appl. Therm. Eng. 2019, 148, 278–294. [Google Scholar] [CrossRef]
- Fabbri, G.; Greppi, M.; Amati, F. Numerical Analysis of New PCM Thermal Storage Systems. Energies 2024, 17, 1772. [Google Scholar] [CrossRef]
- Nuñez, S.M.; Preuss, F.E.T.; Macía, Y.M. Numerical Study for the Design of a Thermal Energy Storage System with Multiple Tunnels Based on Phase Change Material: Case Study Mining in Chile (Thermal Storage in Off-Grid Industrial Applications). Appl. Sci. 2024, 14, 3690. [Google Scholar] [CrossRef]
- Khan, M.I.; Asfand, F.; Al-Ghamdi, S.G. Progress in Research and Technological Advancements of Thermal Energy Storage Systems for Concentrated Solar Power. J. Energy Storage 2022, 55, 105860. [Google Scholar] [CrossRef]
- Onggowarsito, C.; Mao, S.; Zhang, X.S.; Feng, A.; Xu, H.; Fu, Q. Updated perspective on solar steam generation application. Energy Environ. Sci. 2024, 17, 2088–2099. [Google Scholar] [CrossRef]
- Saleem, Y.; Sajid, J.; Ahmed, N. The Thermal Analysis of a Sensible Heat Thermal Energy Storage System Using Circular-Shaped Slag and Concrete for Medium- to High-Temperature Applications. J. Eng. Proc. 2021, 12, 99. [Google Scholar]
- Arévalo, P.; Ochoa-Correa, D.; Villa-Ávila, E. Advances in Thermal Energy Storage Systems for Renewable Energy: A Review of Recent Developments. Processes 2024, 12, 1844. [Google Scholar] [CrossRef]
- Pereira, J.; Souza, R.; Oliveira, J.; Moita, A. Phase Change Materials in Residential Buildings: Challenges, Opportunities, and Performance. Materials 2025, 18, 2063. [Google Scholar] [CrossRef] [PubMed]
- Rahman, M.A.; Hasnain, S.M.M.; Paramasivam, P.; Zairov, R.; Ayanie, A.G. Solar Drying for Domestic and Industrial Applications: A Comprehensive Review of Innovations and Efficiency Enhancements. Glob. Chall. 2025, 9, 2400301. [Google Scholar] [CrossRef]
- Alharthi, S.Z. Sustainable competitive advantage: Toward a generic framework. Int. J. Bus. Res. Dev. 2012, 1, 17–31. [Google Scholar] [CrossRef]
- Grand, S.R.; Wolff, K. Assessing Saudi Vision 2030: A 2020 Review; Atlantic Council: Washington, DC, USA, 2022. [Google Scholar]
- Ibrar, W.; Mahmood, D.; Al-Shamayleh, A.S.; Ahmed, G.; Alharthi, S.Z.; Akhunzada, A. Generative AI: A double-edged sword in the cyber threat landscape. Artif. Intell. Rev. 2025, 58, 285. [Google Scholar] [CrossRef]
- Qaddos, A.; Yaseen, M.U.; Al-Shamayleh, A.S.; Imran, M.; Akhunzada, A.; Alharthi, S.Z. A novel intrusion detection framework for optimizing IoT security. Sci. Rep. 2024, 14, 21789. [Google Scholar] [CrossRef] [PubMed]
- Desai, B.H. The 2023 New York SDG summit outcome: Rescue plan for 2030 agenda as a wake-up call for the decision-makers. Environ. Policy Law 2023, 53, 221–231. [Google Scholar] [CrossRef]
- Kalogirou, S.A.; Karellas, S.; Braimakis, K.; Stanciu, C.; Badescu, V. A New Computational Tool for the Design of Parabolic Trough Collector Systems for Industrial Process Heat Applications. Designs 2022, 6, 41. [Google Scholar] [CrossRef]
- Zhou, Y.; Yang, Y.; Zhang, H.; Wu, Q. Flexible Operation of Concentrating Solar Power Plants with Thermal Energy Storage Based on a Coordinated Control Strategy. Energies 2022, 15, 4929. [Google Scholar] [CrossRef]
- Pascual, S.; Lisbona, P.; Romeo, L.M. Thermal Energy Storage in Concentrating Solar Power Plants: A Review of European and North American R&D Projects. Energies 2022, 15, 8570. [Google Scholar] [CrossRef]
- Rastinejad, J.; Putnam, S.; Stuber, M.D. Technoeconomic Assessment of Solar Technologies for the Hybridization of Industrial Process Heat Systems Using Deterministic Global Dynamic Optimization. Renew. Energy 2023, 216, 119069. [Google Scholar] [CrossRef]
- Król, B. Analysis of the Use of Energy Storage in the Form of Concrete Slabs as a Method for Sustainable Energy Management in a System with Active Thermal Insulation and Solar Collectors. Sustainability 2024, 16, 7645. [Google Scholar] [CrossRef]
Disclaimer/Publisher’s Note: The statements, opinions and data contained in all publications are solely those of the individual author(s) and contributor(s) and not of MDPI and/or the editor(s). MDPI and/or the editor(s) disclaim responsibility for any injury to people or property resulting from any ideas, methods, instructions or products referred to in the content. |
© 2025 by the authors. Licensee MDPI, Basel, Switzerland. This article is an open access article distributed under the terms and conditions of the Creative Commons Attribution (CC BY) license (https://creativecommons.org/licenses/by/4.0/).