Article

Laboratory Experiments Unravel the Mechanisms of Snowmelt Erosion in Northeast China’s Black Soil: The Key Role of Supersaturation-Driven and Layered Moisture Migration

1
College of Water Conservancy, Shenyang Agricultural University, Shenyang 110866, China
2
Key Laboratory of Soil Erosion Control and Ecological Restoration in Liaoning Province, Shenyang 110866, China
*
Author to whom correspondence should be addressed.
Sustainability 2025, 17(19), 8737; https://doi.org/10.3390/su17198737
Submission received: 18 August 2025 / Revised: 22 September 2025 / Accepted: 27 September 2025 / Published: 29 September 2025

Abstract

Snowmelt runoff is a major soil erosion trigger in mid-to-high latitude and altitude regions. Through runoff plot observations and simulations in the northeastern black soil region, this study reveals the key regulatory mechanism of water migration on snowmelt erosion. Results demonstrate that the interaction between thawed upper and frozen lower soil layers creates a significant hydraulic gradient during snowmelt. Impermeability of the frozen layer causes meltwater accumulation and moisture supersaturation (>47%, exceeding field capacity) in the upper layer. Freeze–thaw action accelerates vertical moisture migration and redistributes shallow moisture by increasing porosity. This process causes soils with high initial moisture to reach supersaturation faster, triggering earlier and more frequent erosion. Gray correlation analysis shows that soil moisture migration’s contribution to erosion intensity is layered: migration in shallow soil (0–10 cm) correlates most strongly with surface erosion; migration in deep soil (10–15 cm) exhibits a U-shaped contribution due to freeze–thaw front boundary effects. A regression model identified key controlling factors (VIP > 1.0): changes in bulk density, porosity, and permeability of deep soil significantly regulate erosion intensity. The nonlinear relationship between erosion intensity and moisture content (R2 = 0.82) confirms supersaturation dominance. Physical structure and mechanical properties of unfrozen layers regulate erosion dynamics via moisture migration. These findings clarify the key mechanism of moisture migration governing snowmelt erosion, providing a critical scientific foundation for developing targeted soil conservation strategies and advancing regional prediction models essential for sustainable land management under changing winter climates.

1. Introduction

Although annual snowfall contributes less to global freshwater fluxes compared to rainfall, it constitutes a critical hydrological process in mid-to-high latitudes and alpine regions, where snowpack accumulation and melt regulate ecosystem stability and agricultural productivity [1]. In these regions, meltwater runoff drives significant soil erosion, particularly in vulnerable cold-region ecosystems like Northeast China’s Black Soil Region, where snowmelt accounts for over 30% of annual soil loss [2,3].
Snowmelt erosion mechanistically differs from rainfall-induced erosion due to the interaction between freeze–thaw dynamics and vertical moisture redistribution. Moisture migration acts as a critical driver of soil detachment and transport [4]. The freeze–thaw cycle initiates upward moisture migration from deeper unfrozen layers toward the freezing front, driven by thermal and unfrozen water potential gradients [5,6]. This redistribution profoundly alters soil physical and hydraulic properties—including porosity, hydraulic conductivity, and aggregate stability—while reducing thermal conductivity [7]. Ice lens formation expands pore spaces during freezing, and subsequent thawing increases surface permeability, creating pathways for meltwater infiltration and runoff [8]. Crucially, moisture migration elevates the initial water content of thawed surface layers, destabilizing aggregates through cyclic ice crystallization pressures and reducing cohesion, key determinants of erosion resistance [9,10]. These changes lower the energy threshold for particle detachment, increasing soil erodibility during snowmelt [11].
Moisture redistribution also governs the spatiotemporal patterns of snowmelt runoff. During thaw phases, impermeable frozen subsoil layers impede vertical infiltration, forcing lateral movement of meltwater that exacerbates surface erosion [12]. Concurrently, ice layer melt increases soil water storage capacity, modulating runoff generation rates and introducing uncertainty in erosion magnitude [13]. The cumulative effect of cyclic moisture migration during freeze–thaw episodes progressively degrades soil mechanical properties, including reductions in cohesion and internal friction angle, though the magnitude and direction of these changes remain contentious [4,14]. The discrepancies in existing research underscore the necessity to disentangle the independent contribution of moisture migration from the broader impacts of freeze–thaw processes on erosion resistance, particularly focusing on its cumulative effects.
The Black Soil Region of Northeast China, the nation’s second-largest stable snow-covered area [15], experiences spring snowmelt synchronized with intensive freeze–thaw cycles, providing ideal conditions for snowmelt erosion. While existing studies emphasize freeze–thaw impacts on soil structure, the mechanistic role of moisture migration in modulating erosion resistance, especially its cumulative effects, remains poorly quantified. Therefore, this study aims to elucidate the mechanisms and quantify the impacts of soil moisture migration on snowmelt erosion processes through runoff plot observations and identify the dominant factors influencing snowmelt erosion magnitude under varying initial soil moisture conditions. This work establishes a mechanistic framework to quantify moisture-driven erosion processes, providing critical insights for developing climate-adaptive soil conservation strategies and enhancing predictive models of snowmelt-induced land degradation in vulnerable black soil ecosystems.

2. Materials and Methods

This study employs an integrated methodology combining field observations and controlled laboratory experiments to systematically investigate the coupling mechanisms of soil moisture migration and their regulatory control on erosional dynamics during snowmelt-induced erosion in Northeast China’s Black Soil Region. The methodology was structured into five subsections: site description, field in-situ monitoring, laboratory experimental design, measurement of indicators, and data analysis.

2.1. Site Description

The experimental system was established in a standardized 30 m × 5 m runoff plot located in the Jixing small watershed (125°29′00″ E, 42°14′00″ N), a representative snowmelt erosion zone in Jile Township, Meihekou City, Jilin Province, China. This bare standard plot, with a slope of 7° and a southeast aspect, had a surface soil thickness of 0.4–0.8 m. No crops were cultivated in this plot, and the surface vegetation coverage was less than 5%. The area experiences large daily and annual temperature variations, with distinct freeze–thaw cycles, prolonged action time, and relatively poor soil erosion resistance, making it a typical black soil region in China. During the observation period, the temperature ranged from −7.3 °C to 8.8 °C, and the air humidity fluctuated between 34% and 78%, with no precipitation occurring.
Through multiple comparative experiments, the bulk density of the soil in the runoff plot was measured to be 0.9 g/cm3, and the maximum saturated water content was 47%. The results of the soil particle size analysis for the 200 mL sample are shown in Table 1.

2.2. Field In-Situ Monitoring

This field observation campaign was implemented in the runoff plot from October 2023 to April 2024, comprehensively covering the entire process of soil pre-freezing, freezing, and snowmelt phases within the study area. Three JDWT01 multi-layer soil monitoring systems were strategically deployed at the upper slope, mid-slope, and lower slope positions of the runoff plot to continuously track soil temperature and moisture dynamics at three depths (0–5 cm, 5–10 cm, and 10–15 cm) throughout the experiment. During the snowmelt period, we supplemented these measurements by using a portable probe-type moisture meter to record surface soil moisture hourly. Meanwhile, a flow collection device at the outlet of the runoff plot was used to record hourly runoff volume.

2.3. Laboratory Experimental Design

Given the inherent complexity of field conditions during snowmelt, this study employed controlled laboratory experiments to investigate the regulatory mechanisms of initial soil moisture content on water migration and erosion processes, with a specific focus on moisture dynamics and soil structural changes induced by freeze–thaw cycles. This approach ensures that the key physical states driving erosion remain representative under controlled conditions. An indoor simulation system was established based on field topographic survey data, composed of a water supply tank, flow control valve, stabilized flow channel, 8° sloped soil trough, and test soil samples. Undisturbed soil samples from runoff plots were prepared in strict compliance with the Geotechnical Testing Method Standard (GB/T50123-2019) [16]: natural air-drying, 2-millimeter sieving, and layered compaction (three 5-centimeter layers) for bulk density control, followed by precise water volume calculation, uniform spraying, and 18-h sealed equilibration to establish five initial mass water content gradients (30%, 40%, 50%, 60%, and 70%). The experimental system features a dual soil trough structure with synchronized upper and lower slopes—the lower trough connects to a runoff collection barrel, while the upper slope replicates natural runoff patterns, with a reservoir overflow triggering mechanism enabling controlled simulation of snowmelt scouring processes.
To simulate natural freeze–thaw cycles during snowmelt erosion (nocturnal freezing/diurnal thawing), we implemented precisely controlled thermal regimes using an adjustable freeze–thaw chamber. Preconditioned soil samples in cultivation trays underwent cyclic temperature variations between −15 °C (12-h freezing) and 5 °C (12-h thawing), replicating the study area’s recorded thermal extremes. Embedded temperature probes provided real-time monitoring of soil thermal dynamics, with 30 complete cycles executed to capture cumulative effects on soil structural stability.

2.4. Measurement of Indicators

Determination of physical property indicators was conducted using a ring knife with a diameter of 6.18 cm and a height of 4 cm to sample and measure the bulk density in the iron trough after the freeze–thaw cycle. The weights of both sides of the ring knife were measured after leveling, and the moisture content of the waste soil scraped off during sampling was determined. Using the parameters of wet soil density and moisture content, the bulk density was calculated. After the determination of bulk density, permeability tests were conducted to measure the soil permeability coefficient.
Soil porosity can be determined by using an empirical formula that relies on the soil’s bulk density value. The calculation formula used is as follows:
P t % = 93.947 32.995 d
where P t represents the total porosity and d denotes the bulk density of the soil.
In this experiment, the mechanical property indicators were determined via an undrained rapid shear test using the direct shear test method. The aim was to measure the changes in cohesion (c) and internal friction angle (φ) of black soil under different freeze–thaw cycle conditions.
The porosity of the soil increases due to the influence of freeze–thaw cycles, causing the soil volume to expand. The empirical formula for the porosity and freeze–thaw ratio after freeze–thaw is as follows:
P f = V f p V f
V f p = V f V s
V s = V p V
V f = ( 1 + F ) × V
Therefore,
P f = F + p / 1 + F
In the formula, p and P f are the porosity (%) before and after soil frost heaving, respectively; V and V f are the volume (cm3) before and after soil frost heaving, respectively; V f p is the volume of the pores after frost heaving; V s is the volume of soil particles (cm3); and F is the soil frost heaving rate (%).

2.5. Data Analysis

Pearson’s correlation analysis was employed to determine the correlation between the measured soil moisture content and snowmelt erosion. The grey relational analysis was performed using SPSS 24.0 to identify the relationships among moisture transport, environmental factors, erosion volume, and soil mechanical properties, following the approach described by Fu et al. (2018) [17]. Ridge regression analysis was implemented using SPSS 24.0 to analyze the coupling effects between soil moisture transport at three soil depths and soil erosion under freeze–thaw cycles. A partial least squares regression (PLSR) model was applied to detect the primary physical and structural factors affecting variations in different soil erosion quantities. Detailed information on PLSR can be found in the study by Abdi (2010) [18]. If the variable importance in projection (VIP) value for a variable was greater than one, it was considered a significant factor influencing detachment capacity (Dc), as described by Li et al. (2017) [19]. All PLSR procedures were conducted using SIMCA 14.1.

3. Results

3.1. Soil Conditions That Produce Snowmelt Runoff

Three snowmelt events in 2024 were analyzed (Figure 1, Figure A1 and Figure A2), with the event from 16–18 February serving as a typical case (Figure 1). When the surface temperature exceeds 0 °C, snow begins to melt and generates runoff. Figure 1 illustrates the daily-scale coupling relationships among temperature, snowmelt rate, runoff, and soil moisture: the daily peak snowmelt rates (0.08, 0.92, and 0.67 cm/h) occurred at 12:30, 11:30, and 10:30 on 16, 17, and 18 February, respectively (Figure 1). Runoff peaks exhibited a consistent lag, with daily maxima of 0.9, 173, and 68 L/s recorded at 14:30, 13:30, and 10:30, respectively. Runoff generation coincided with surface soil (0–5 cm) saturation. On 16–17 February at 09:30, when surface temperature exceeded 0 °C, the gravimetric water content (GWC) reached 47–48.4% (Feb 16) and 47.5–57.4% (Feb 17), exceeding the saturation value (~47% GWC) and triggering runoff. Runoff ceased when temperatures dropped below 0 °C, and surface soil moisture decreased below saturation.
A key observation on 18 February (Figure 1) revealed that at 13:30, despite a surface temperature of 7.2 °C and a surface soil GWC of 55.6% (above saturation), runoff had ceased. This confirms that surface soil saturation (GWC ≥ 47%) is a necessary condition for runoff generation; however, other factors (e.g., rapid drainage) can prevent runoff even under saturated conditions.
Subsurface soil moisture dynamics (Table S1): GWC at 5 cm, 10 cm, and 15 cm depths showed minor increases (e.g., 10 cm: 5.2% to 5.9%; 15 cm: 6.0% to 6.3%), remaining well below saturation (~47% GWC). Moisture at 5 cm fluctuated correspondingly with the surface trend, peaking after runoff cessation. This indicates snowmelt infiltration was primarily confined to the surface soil (<5 cm).

3.2. Development Law of Black Soil Snowmelt Erosion Under Different Soil Conditions

There are significant differences in the water content of Northeast black soil at different stages. Figure 2 illustrates the changes in soil erosion caused by 20 min of snowmelt under different initial soil moisture conditions, where the color patches represent the maximum measured soil moisture content. Before the winter freeze period, the soil moisture content ranged from 22% to 41%; during the freeze–thaw period, the soil moisture content exceeded the maximum field capacity by 47% (measured value in this study area), corresponding to the ‘Field capacity’ range in Figure 2, reaching a supersaturated state with a maximum of 71% (Figure 2 ‘Water content during melt erosion’). Therefore, overall, the black soil exhibits three states of water content throughout the freeze–thaw stage: unsaturated (water content < 47%, corresponding to the 30% and 40% groups’ ‘Prefreezing moisture content’ and part of the ‘Field capacity’ range in Figure 2), saturated (water content 47–56%, the threshold for field capacity), and supersaturated (water content > 47%, corresponding to the 60–70% group’s ‘Water content during melt erosion’ range), as shown in Figure 2.
To verify the impact of natural humidity changes on erosion, controlled experiments were conducted: setting up soil with gradient humidity from 30% to 70% (covering the measured range during the freeze–thaw period, the lower part of Figure 2 presents the water content distribution of each humidity group before freezing and during the freeze–thaw period through different color blocks and labels). The dynamics of snowmelt erosion were observed (the upper part of Figure 2 presents the results in the form of an ‘erosion amount–time’ curve). During snowmelt erosion, soil with a water content of 50% experienced snowmelt erosion first, followed by soils with 60% and 70% water content, which occurred slightly later than the soil with 50% water content; soils with 40% and 30% water content showed snowmelt erosion at the 6th and 8th minutes of observation, respectively. Overall, the higher the water content in the soil, the earlier snowmelt erosion occurred, which completely matches the timing of the curve’s rise in the upper part of Figure 2 and the pattern in the lower part, ‘Water content during melt erosion,’ where the higher water content groups appear earlier.
Soils with moisture content of 60% and 70% reached their peak erosion after 2 min of erosion occurrence, followed by a downward trend in overall erosion amount; soils with 50% moisture content peaked after 3 min, with the maximum erosion amount lasting for 3 min, and then showed a downward trend; soils with 30% and 40% moisture content exhibited an overall upward trend in erosion amount, with the erosion development of 30% moisture content soil being extremely slow, remaining nearly level. After 14 min, the erosion amounts of soils with different moisture contents tended to stabilize.
As shown in Figure 2, within the first 20 min, the erosion development trends of oversaturated soils (60% and 70%) and saturated soils (the 50% group, which is close to the 47% threshold) are similar, with both curves initially rising rapidly, peaking, and then declining. In contrast, the unsaturated soils (the 30% and 40% group) show a different pattern, with their curves continuously rising or slowly climbing without a clear peak and decline. Overall, two distinctly different erosion development dynamics are observed: the ‘peak curve’ of the ‘saturated–oversaturated group’ and the ‘climbing curve’ of the ‘unsaturated group.’ However, from the perspective of erosion rate per unit time, the correlation between the erosion amounts of oversaturated and saturated soils and time is significant; after 10 min, the erosion amounts of oversaturated, saturated, and unsaturated soils all show significant correlation with time. All group curves enter a stable variation phase, with differences in slope but a clear linear relationship.

3.3. Effects of Water Transport on Soil Structure Change and Erosion Amount Change

Choosing soil moisture vertical migration (SMVM) data under freeze–thaw conditions as the base sequence and soil layer structural change data as the reference sequence, grey relational analysis was conducted to determine the soil layer structural factors closely related to SMVM. The results are summarized in Table 2. The variation in SMVM was highly correlated with changes in soil frost heaving, which was much greater than its correlation with changes in water storage space and porosity. The correlation between the variation in SMVM and porosity was similar to that of saturated soils. However, in the 5–10 cm soil layer, the correlation between variation in SMVM and porosity decreased to 0.35.
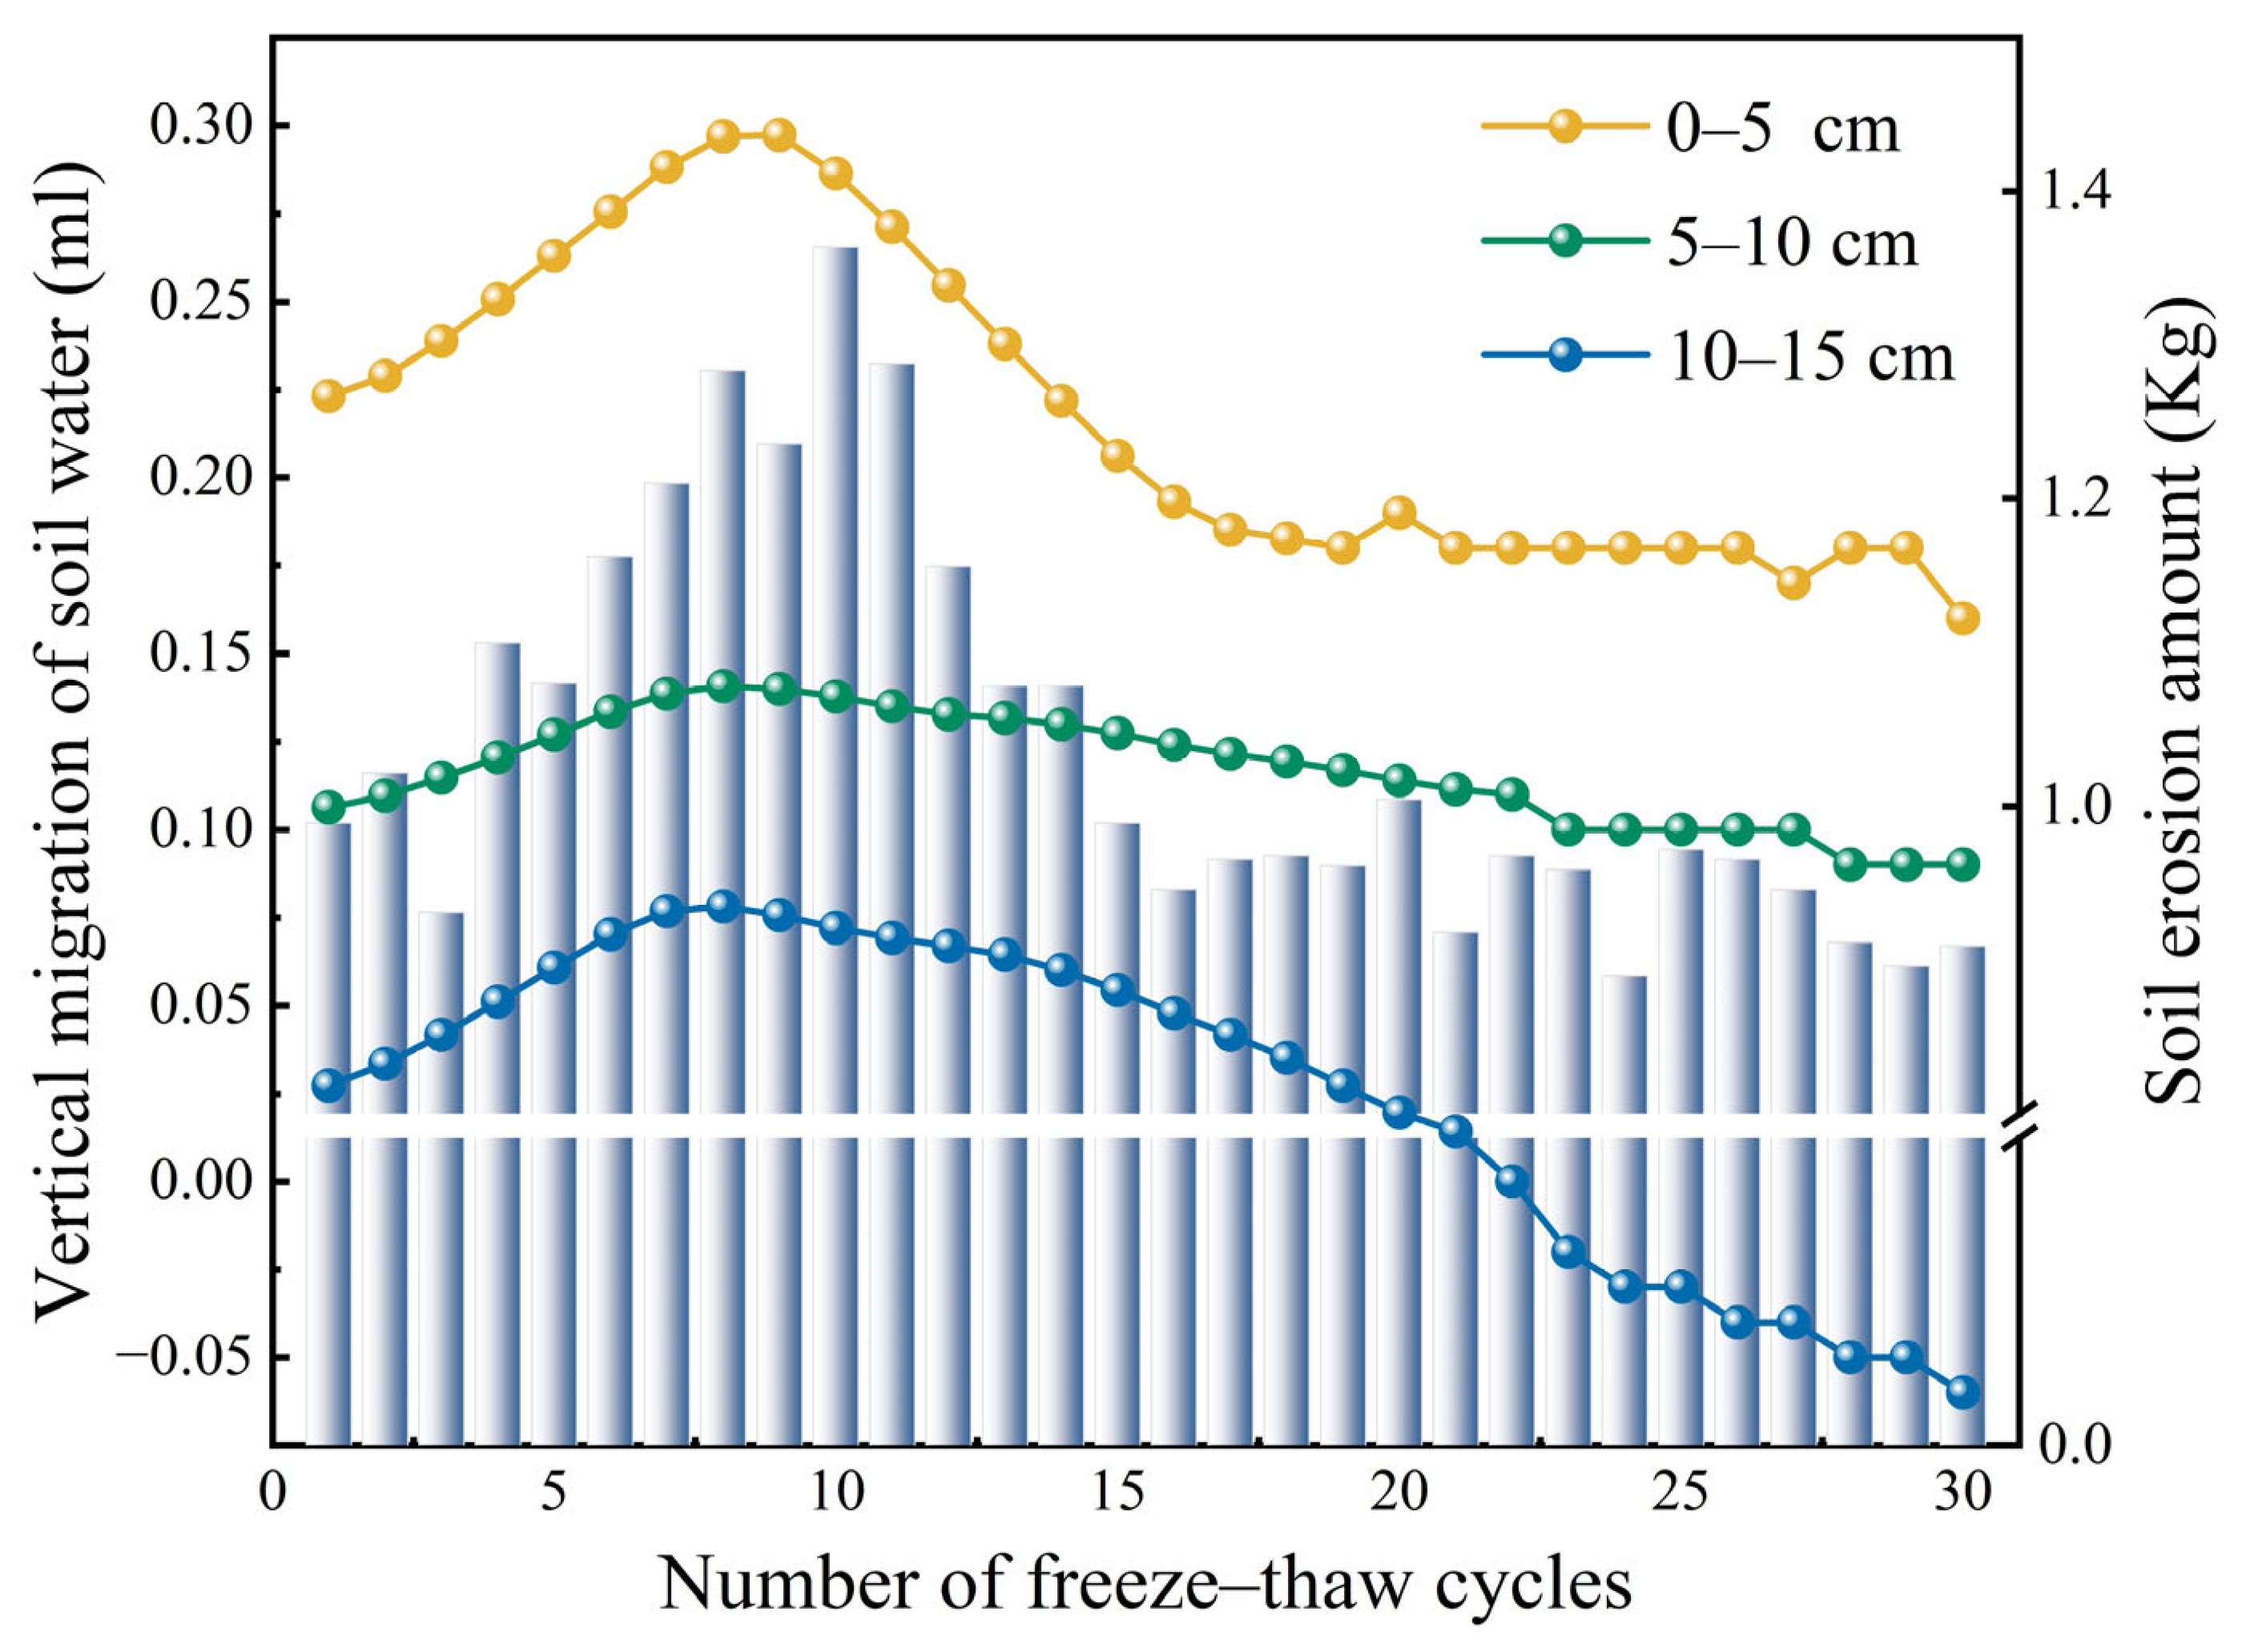
Overall, the increase in SMVM was greater in the surface soil layers than in the deeper soil layers. As shown in Figure 3, the SMVM at three depths all exhibited an increasing trend before the 9th freeze–thaw cycle. Among them, the SMVM change rate in the 0–5 cm soil layer was the highest (+0.49%), followed by +0.14 in the 5–10 cm soil layer and +0.08 in the 10–15 cm soil layer. The SMVM change rate in the 0–5 cm soil layer decreased to +0.21 after six freeze–thaw cycles and tended to be stable. The SMVM change rate in the 5–10 cm soil layer decreased uniformly over the remaining 21 freeze–thaw cycles, reaching +0.09. The SMVM change rate in the 10–15 cm soil layer also uniformly decreased over the remaining 21 freeze–thaw cycles, becoming 0 after the 23rd freeze–thaw cycle and subsequently decreasing to −0.06.
The soil erosion quantity exhibited a trend of rising, followed by decreasing, and eventually reaching stability with the freeze–thaw cycles. After the first freeze–thaw cycle, the soil erosion quantity was 0.99 kg. It reached its peak at 1.36 kg after 10 freeze–thaw cycles, then decreased to 0.95 kg after 16 freeze–thaw cycles and stabilized during the subsequent freeze–thaw cycles.
Grey relational analysis was conducted by taking the soil erosion quantity during each of the 30 freeze–thaw cycles as the reference sequence and the post-freeze–thaw SMVM data as the reference sequence. The results are shown in Figure 4. In the first 10 freeze–thaw cycles, the increase in soil erosion was highly correlated with the 0–5 and 5–10 cm SMVM data, with correlation coefficients ranging from 0.95 to 0.99. During cycles 10–16, when the soil erosion quantity decreased, the correlation with the 5–10 cm SMVM data was lower than that with the 0–5 cm SMVM data. From cycles 1–20, the correlation between soil erosion quantity and the 10–15 cm SMVM data was much lower than that with the 0–5 and 5–10 cm data and presented a U-shaped pattern, with the lowest point occurring at the 7th freeze–thaw cycle, with a correlation coefficient of 0.49. In cycles 17–30, the correlation between soil erosion quantity and the 5–10 cm SMVM data was higher than the correlation with the 0–5 cm SMVM data; nevertheless, the two values are similar, and both are higher than 0.9. The correlation between the soil erosion quantity and the 10–15 cm SMVM data gradually decreased after the 19th freeze–thaw cycle, reaching 0.33 at the 30th freeze–thaw cycle. In summary, during the increase in soil erosion, the changes in both the 0–5 and 5–10 cm SMVM contributed jointly. During the decrease in soil erosion, the contribution of the 0–5 cm SMVM change was higher than that of the 10–15 cm SMVM change. When the soil erosion quantity became stable, the contribution of the 5–10 cm SMVM change was higher than that of the 0–5 cm SMVM change. Overall, the correlation between soil erosion quantity and the 5–10 cm SMVM data was the highest at 0.95, followed by 0.92 at the 0–5 cm SMVM data, and the lowest correlation was 0.58 with the 10–15 cm SMVM data.
Based on the above data, ridge regression models were established to analyze the coupling effects between the SMVM at three soil depths and soil erosion under freeze–thaw cycles. In these models, X1 represents the SMVM at 0–5 cm soil depth, X2 represents the VSWM at 5–10 cm soil depth, and X3 represents the SMVM at 10–15 cm soil depth. The results are summarized in Table 3. The model for soil erosion at 0–5 cm soil depth exhibited a strong coupling effect with an R2 of 0.82 and statistical significance (p < 0.001), indicating that the SMVM at 0–5 cm depth significantly influenced soil loss during freeze–thaw, particularly in the supersaturated surface soil layer. The models for soil erosion at 5–10 and 10–15 cm soil depths showed relatively weaker coupling effects than that at 0–5 cm soil depth, with R2 values of 0.68 and 0.56, respectively; however, both were statistically significant (p < 0.005 and p < 0.001, respectively), suggesting that SMVM at these depths also affected soil loss during FT, with the two layers contributing to snowmelt erosion as saturated and unsaturated soils, respectively. This finding indicates that the SMVM significantly influenced soil loss during freeze–thaw by causing different saturation states in the vertical gradient of the soil. Snowmelt erosion was primarily dominated by supersaturation erosion, with contributions from saturated and unsaturated erosion processes.

3.4. The Main Soil Factors Affecting Snowmelt Erosion

The bivariate scatter plot in Figure 5 shows that during the snowmelt period, SMVM will affect soil physical properties together with freeze–thaw cycles, and the correlation with different soil physical properties that influence soil erosion is quite high. The soil unit weight at different depths was positively correlated with soil permeability in the 0–5 and 5–10 cm soil layers, whereas it was negatively correlated with soil porosity at different depths. The porosity of the 5–10 cm soil layer was significantly and negatively correlated with the soil osmotic coefficient in the 5–10 and 10–15 cm soil layers.
Table 4 provides a summary of the PLSR analysis for soil erodibility and explains the main factors influencing soil physical properties at different soil depths. The relative importance of each variable can be reasonably identified through its VIP value [20]. The important variables leading to changes in the amount of soil erosion were UWg (VIP = 1.056), Pg (VIP = 1.088), OCs (VIP = 1.327), and OCg (VIP = 1.286) (Table 4). Other variables (VIP < 1) were considered less important and are therefore not discussed in the subsequent sections [20,21].
The internal friction angle and cohesion of the soil significantly influenced the soil erosion. The contribution of the mechanical properties of different soil depths to erosion was explained through a grey relational analysis of these two soil mechanical characteristics with soil erosion. The results are shown in Table 5. In general, as the soil depth increased, the contribution of the internal friction angle to soil erosion increased, whereas cohesion showed an initial increase and then a decreasing trend with increasing soil depth. For the 0–5 and 5–10 cm soil layers, soil cohesion played a predominant role in soil erosion, with contribution values of 0.718 and 0.779, respectively, whereas for the 10–15 cm soil layer, the internal friction angle had a major impact on soil erosion, with a contribution value of 0.807.

4. Discussion

The inconsistency between the snowmelt rate and peak flow observed during the runoff plot snowmelt event in this study is similar to the findings of Fan et al. (2023) [22] in their study area, which overlaps with the runoff plot. The observational data (Figure 1) indicate that in the active freeze–thaw zone, the triggering of snowmelt runoff is determined by the supersaturated state of the surface melting soil moisture content, which far exceeds its conventional saturation point. This finding significantly differs from the viewpoint proposed by Wang et al. (2017) [23] that ‘the soil should be in a saturated state when runoff occurs.’ This difference arises from the unique physical processes in the frozen soil area. First, the freeze–thaw cycle disrupts the soil structure, significantly increasing the porosity and thickness of the surface soil [13], thereby expanding its potential water-holding capacity. Second, the formation of ice crystals during the freezing period reduces water potential, driving the migration and accumulation of unfrozen water towards the freezing front [22], resulting in the additional release of a large amount of moisture that has migrated to the surface during melting [24]. Meanwhile, key observations (Figure 1) indicate that this stage typically only forms a shallow layer of melted soil over a deep frozen soil layer with stable moisture dynamics [25,26], creating a relatively impermeable layer that severely restricts moisture infiltration. The synergistic effects of the above mechanisms lead to a rapid accumulation of liquid water content in the surface melting soil within a very short time, quickly surpassing its conventional saturation point and reaching a supersaturated state, as shown in Figure 1. Therefore, when the snowmelt water reaches supersaturated moisture content in the surface soil, it directly converts to surface runoff, and Figure 1 clearly demonstrates the high consistency between the runoff initiation time and the occurrence of the supersaturated state. In contrast, traditional saturation threshold theory does not consider the moisture migration and infiltration barrier effects caused by freeze–thaw processes. In summary, this study confirms that the surface soil supersaturated moisture content induced by freeze–thaw processes is a unique and critical threshold for snowmelt runoff occurrence in the northeastern black soil region, providing key mechanistic support for enhancing hydrological risk warning in cold regions and improving the physical mechanisms of snowmelt runoff models.
Experimental data demonstrate that initial soil moisture governs the timing and pattern of snowmelt erosion via freeze–thaw-mediated processes (Figure 2). Compared to dry soils (30–40% moisture), soils with higher initial moisture (50–70%) exhibit earlier erosion initiation, attributable to elevated pore water pressure reducing effective stress [27]. Notably, soils at 60–70% moisture display marginally delayed erosion onset relative to 50% moisture soils (Figure 2), likely due to transient cohesion from unfrozen water films during solid–liquid phase transitions [28]. Critically, under supersaturated conditions (moisture exceeding saturation) with snowmelt runoff, effective stress approaches zero, inducing quasi-liquefaction [29], resulting in complete loss of shear strength [30]. This fundamentally differs from unsaturated erosion mechanisms dominated by sequential particle detachment. Consequently, distinct erosion dynamics emerge: supersaturated/saturated soils exhibit oscillatory erosion rates from runoff-induced remolding; unsaturated soils show linear increase governed by runoff shear stress and particle mobility.
Soil moisture vertical migration (SMVM) dynamics during freeze–thaw cycles critically govern snowmelt erosion patterns. Consistent with the supersaturated runoff initiation mechanism previously described (Figure 5, Table 2), SMVM within frozen subsoil drives substantial upward moisture flux. Coupled with ice lens formation during freezing [31], this process expands subsoil porosity through frost heave, creating extensive void spaces that serve as primary reservoirs for subsequent meltwater infiltration [32]. SMVM kinetics are modulated by meltwater input and soil–water potential gradients [33]. Vertically distinct infiltration regimes emerge: deep layers remain predominantly unsaturated with high infiltration capacity, though actual infiltration rates are constrained by water-supply rates from overlying units [34]; shallow layers approach saturation where occluded pore air creates localized saturated zones, reducing infiltration capacity [4,34]. Consequently, during snowmelt, shallow-layer infiltration rates exceed deep-layer rates, while surface saturation achieves stable hydraulic conductivity [4]. These differential behaviors directly sculpt observed soil moisture profiles. Nonlinear evolution characterizes interactions between SMVM, freeze–thaw cycles, and erosion as follows: Early-stage cycles (1–10): Repeated freeze–thaw in shallow soil disrupts soil fabric and alters pore geometry, severely compromising erosion resistance. Meltwater infiltration into this structurally compromised zone may induce localized liquefaction [29,30] as effective stress → 0 and shear strength vanish, accelerating erosion. This aligns with observed supersaturation-driven liquefaction—the primary source of runoff-entrained sediment. Post-10 cycles (to 16): Increased cycling attenuates moisture-migration dynamics, reduces shear stresses, and diminishes liquefaction potential, stabilizing erosion rates. Deep soil layers exhibit greater thermal inertia, buffering thermal fluctuations and delaying meltwater penetration. This yields relatively invariant SMVM with narrow variability and hysteretic responses. Our data reveal a U-shaped correlation between deep SMVM intensity and soil erosion magnitude (Figure 4), suggesting that while deep layers contribute no direct sediment, they modulate thaw-front shear strength via moisture content variations regulated by differential thaw depths. Critically, SMVM dynamics, which are synergistically modulated by antecedent saturation (Table 2), liquefaction potential, and freeze–thaw-induced structural evolution, constitute the core physical framework for deciphering spatiotemporal complexity in seasonal frozen-ground snowmelt erosion.
The research results indicate a positive correlation between the bulk density of surface and deep soils and the permeability coefficient (Figure 5). This contrasts with the negative correlation reported by Sun et al. (2021) [35] for saturated clayey soils experiencing a freeze–thaw cycle but is consistent with observations in seasonally frozen soil regions [25]. This difference mainly arises from different moisture control methods: Sun et al. (2021) [35] maintained uniform saturation at different depths, while our study and Lu et al. (2019) [25] simulated a natural moisture gradient, where the water content in deep soils gradually decreases. Furthermore, the unique response of black soil to a freeze–thaw cycle is crucial. As indicated by studies in cold regions [36], freeze–thaw cycles significantly altered the distribution of bulk density—compacting low-density soils while loosening high-density soils. This phenomenon, combined with the oversaturated state of surface soils during the melting period (Section 3.1), explains the permeability changes we observed. The supersaturated state disrupts the pore structure, and although the soil structure is loose, it still results in a positive correlation between bulk density and permeability.
The partial least squares regression (PLSR) model determined that the infiltration coefficients of surface and deep soils, as well as the bulk density and porosity of deep soils, are the main determinants of soil erosion resistance. These findings are consistent with the traditional freeze–thaw physical mechanisms described by Liu et al. (2023) [7], Qiao et al. (2019) [37], and To et al. (2020) [38]. The freeze–thaw cycle drives soil structure degradation through synergistic processes, where changes in pore structure increase total porosity and prolong the increase in pore ratio [7], directly reducing cohesive strength; the decrease in bulk density promotes soil loosening [39], enhancing permeability and disintegration sensitivity. This difference explains why the characteristics of deep soils (bulk density, porosity) become key stabilizing factors in soil erosion resistance. The evolution of shear strength under freeze–thaw conditions is related to particle reorganization. The fragmentation of aggregates during freezing [40] causes particles to settle under gravity after thawing, blocking pores and increasing compaction while reducing the internal friction angle. Conversely, the ice expansion force can push soil particles, reducing compaction and the internal friction angle [39]. Importantly, the internal friction angle exhibits significant depth-dependent (layered) characteristics: surface soil (0–20 cm) approaches the critical internal friction angle threshold, making it prone to erosion, while deep soils maintain significantly higher internal friction angle values [41]. This layering is consistent with field observations, where a thin melting layer covers a hydrologically stable frozen substrate (Figure 1) [25], and the varying internal friction angle values with depth explain their different contributions to erosion resistance. Cohesion exhibits complex moisture-mediated behavior. Duan et al. (2023) [41] recorded that with increasing moisture, cohesion first increases and then decreases, contrasting with Oztas et al. (2003) [40], who found that cohesion monotonically decreases due to pore blockage during the wet freezing process. These differing findings may reflect the texture-dependent response of soil to moisture gradients and freeze–thaw intensity. Notably, cohesion is highly sensitive to rapid saturation events, especially in surface soils during snowmelt-induced saturation (Figure 5; Table 2). This explains why cohesion is more strongly correlated with surface erosion than the internal friction angle. This mechanism is reflected in the liquefaction phenomenon under supersaturated conditions, where cohesion approaches zero [29], allowing particles to be directly carried away. In summary, the freeze–thaw cycle reconstructs soil structure through increased porosity, selective reduction in internal friction angle with depth, and loss of cohesion regulated by rapid moisture changes (such as supersaturation), particularly in surface soils. These processes make the supersaturated hydrological state driven by moisture migration a key threshold regulating seasonal frozen soil areas’ snowmelt erosion.

5. Conclusions

This study reveals that the initiation of snowmelt erosion in seasonally frozen ground regions is governed by a critical supersaturation moisture threshold within the surface soil. This threshold is triggered by the synergistic effect of meltwater accumulation (driven by vertical soil moisture migration) and the underlying impermeable frozen layer, resulting in soil liquefaction, a complete loss of shear strength, and runoff generation.
Soil moisture status is a decisive factor controlling the soil detachment capacity (Dc). Soils with high moisture content (saturated or supersaturated) detach significantly earlier than unsaturated soils. Moreover, their erosion dynamics are fundamentally different: the former undergoes fluctuating detachment dominated by liquefaction, while the latter is characterized by progressive stripping controlled by runoff shear.
Freeze–thaw cycles modulate moisture migration and Dc by altering soil structure and hydraulic conductivity. The response of Dc to freeze–thaw frequency was nonlinear, exhibiting an initial increase, followed by a decrease, and eventual stabilization. A strong correlation (R2 = 0.82) between shallow soil moisture flux and Dc across 30 simulated cycles confirms that erosion in this context is primarily driven by supersaturation processes.
Variable importance projection (VIP) analysis identified key factors influencing Dc, including deep soil bulk density (VIP = 1.056), porosity (VIP = 1.088), permeability coefficient (VIP = 1.286), and surface soil permeability coefficient (VIP = 1.327). Critical mechanical properties included the internal friction angle of deep soil and the cohesion of surface soil.
These findings challenge the oversimplified ‘saturation threshold’ assumption in conventional erosion models and provide a crucial theoretical foundation for developing and refining process-based snowmelt erosion models, particularly the soil separation submodule. While derived from controlled laboratory simulations, our study underscores the pivotal roles of moisture dynamics and soil physical properties. Future work should integrate field monitoring across diverse slopes to quantify topography-driven heterogeneity in supersaturation and validate these mechanisms under broader spatiotemporal scales, thereby enhancing predictive tools for climate-resilient land and water management.

Supplementary Materials

The following supporting information can be downloaded at: https://www.mdpi.com/article/10.3390/su17198737/s1, Table S1: Hourly changes in soil temperature and humidity during three snowmelt events.

Author Contributions

S.Z.: Conceptualization, Investigation, Methodology, Writing—original draft, Writing—review and editing. H.F.: Data curation, Conceptualization, Funding acquisition, Investigation, Methodology, Writing—review and editing. M.L.: Conceptualization, Methodology, Writing—review and editing. All authors have read and agreed to the published version of the manuscript.

Funding

This research was funded by the National Key Research and Development Program of China (grant number 2021YFD1500701).

Institutional Review Board Statement

Not applicable.

Informed Consent Statement

Not applicable.

Data Availability Statement

Data can be obtained by emailing the corresponding author.

Acknowledgments

We gratefully thank Tianming Li and Xiaowan Yang for their help with the observation.

Conflicts of Interest

The authors declare no conflicts of interest.

Abbreviations

The following abbreviations are used in this manuscript:
VIPVariable importance in projection
GB/TGeotechnical Testing Method Standard
PLSRPartial least squares regression
SMVMSoil moisture vertical migration
FTFreeze–thaw
DcDetachment capacity
UWUnit weight
PPorosity
OCOsmotic coefficient
GWCGravimetric water content

Appendix A

Appendix A.1

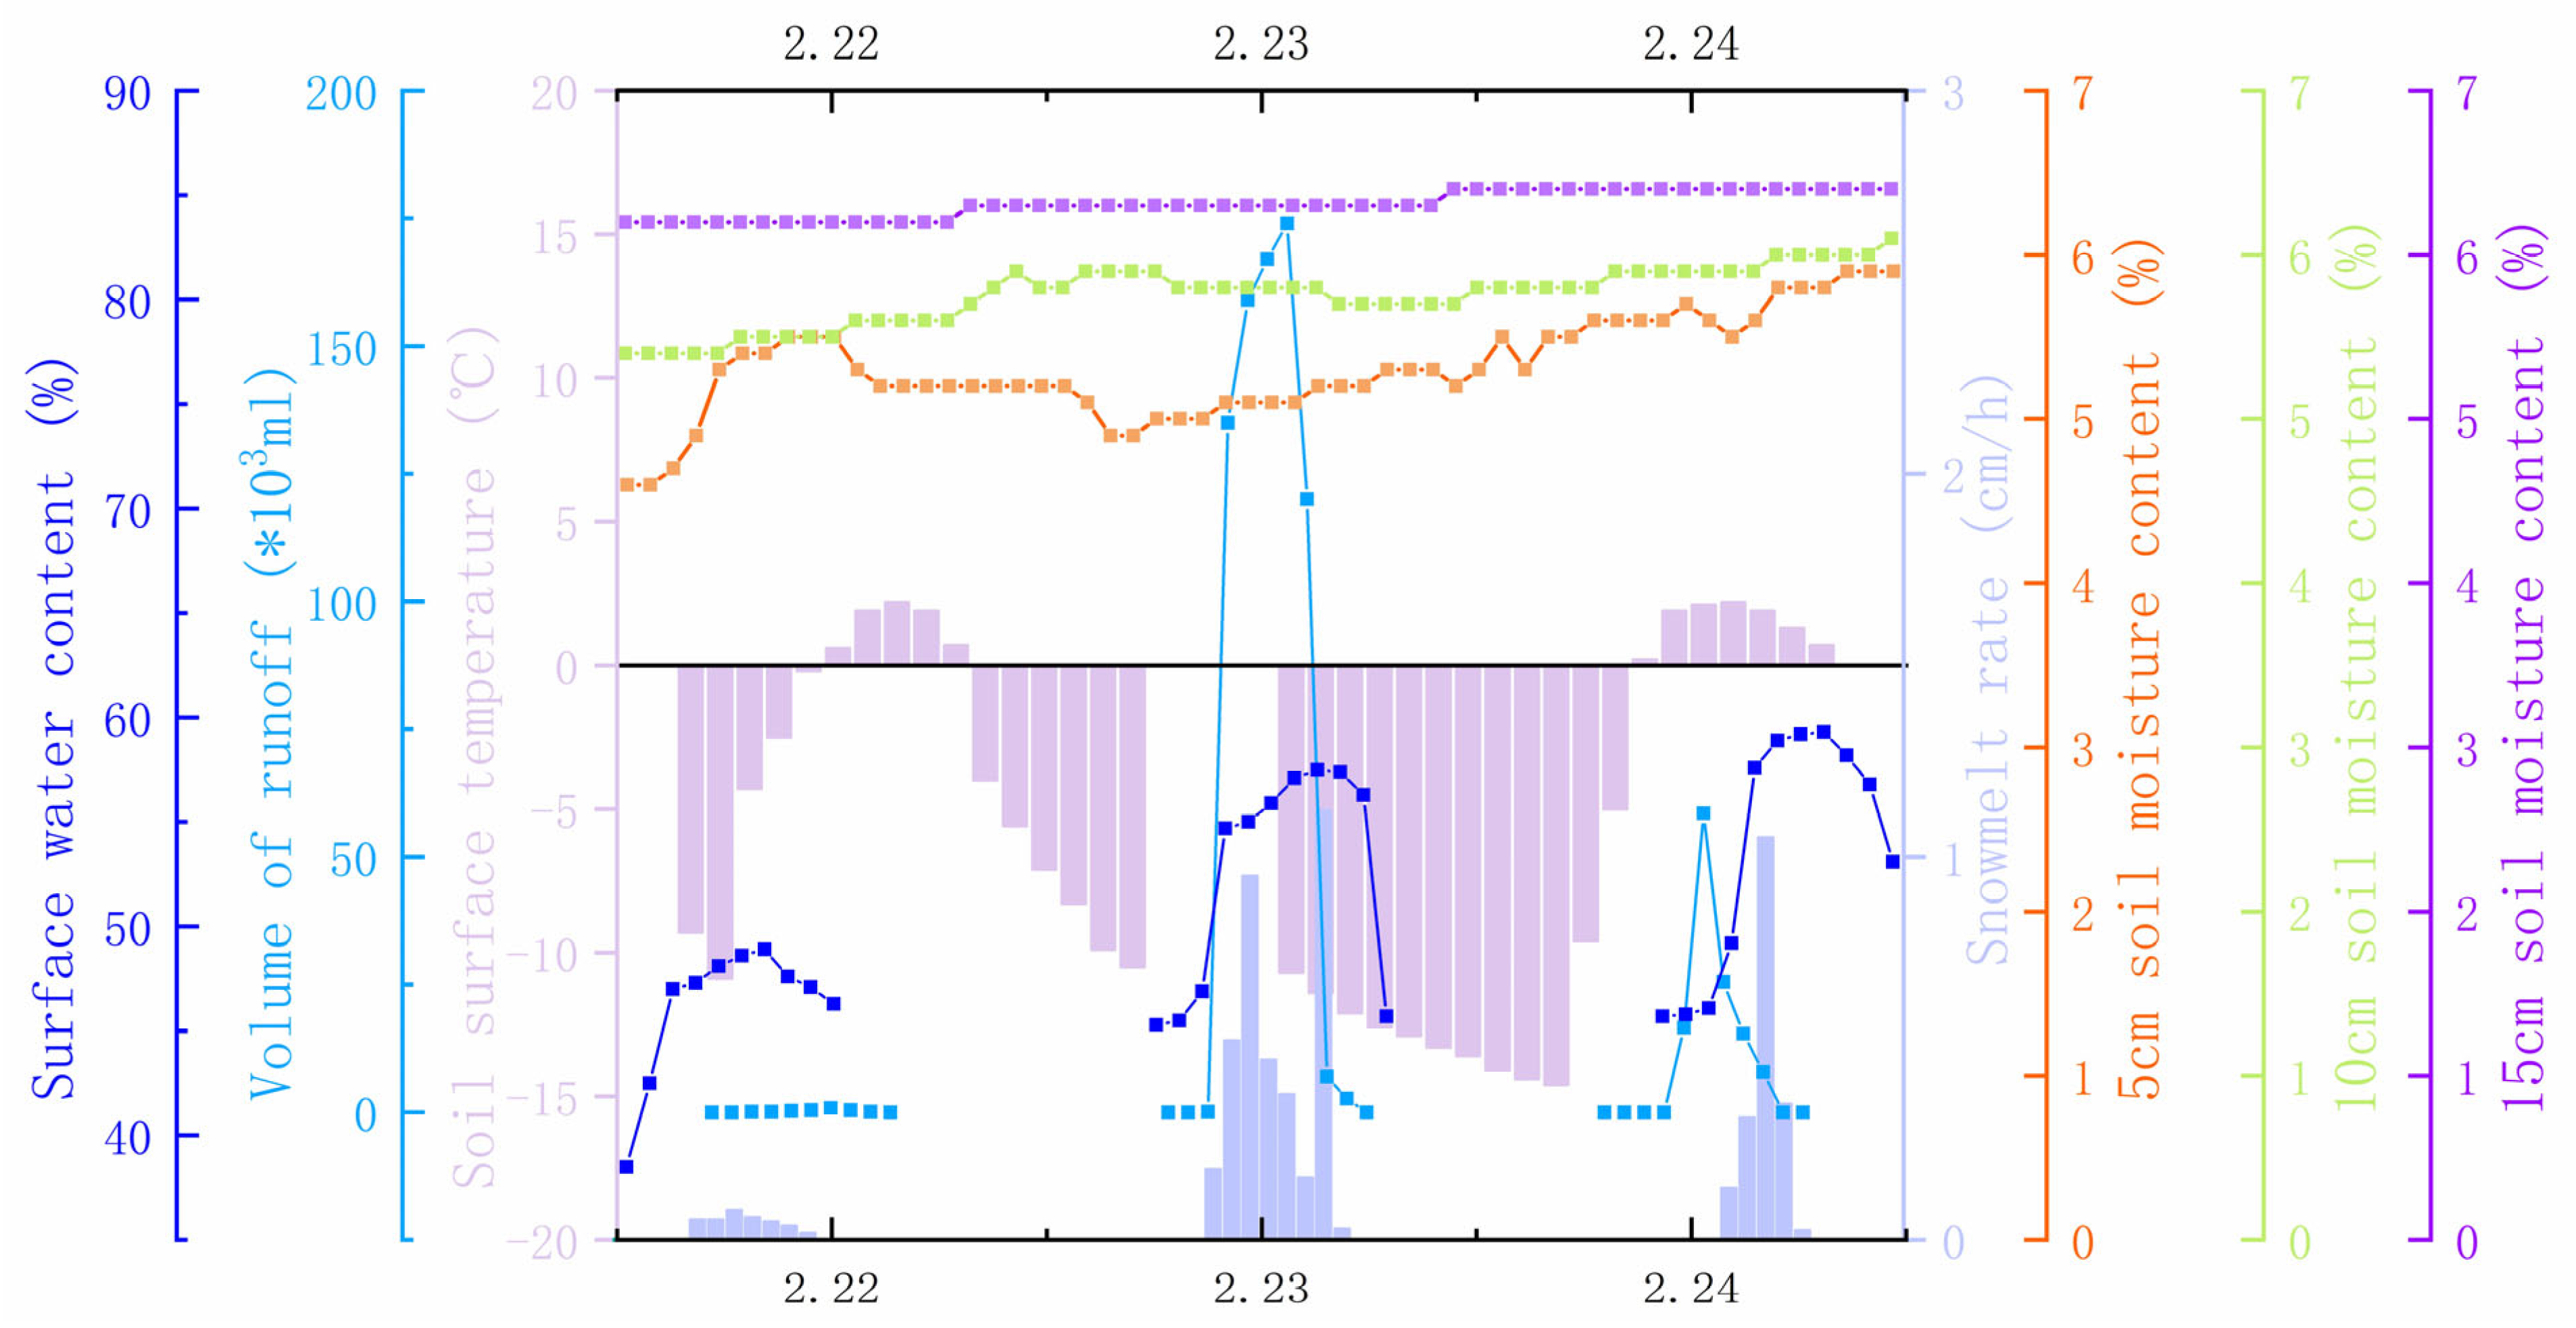
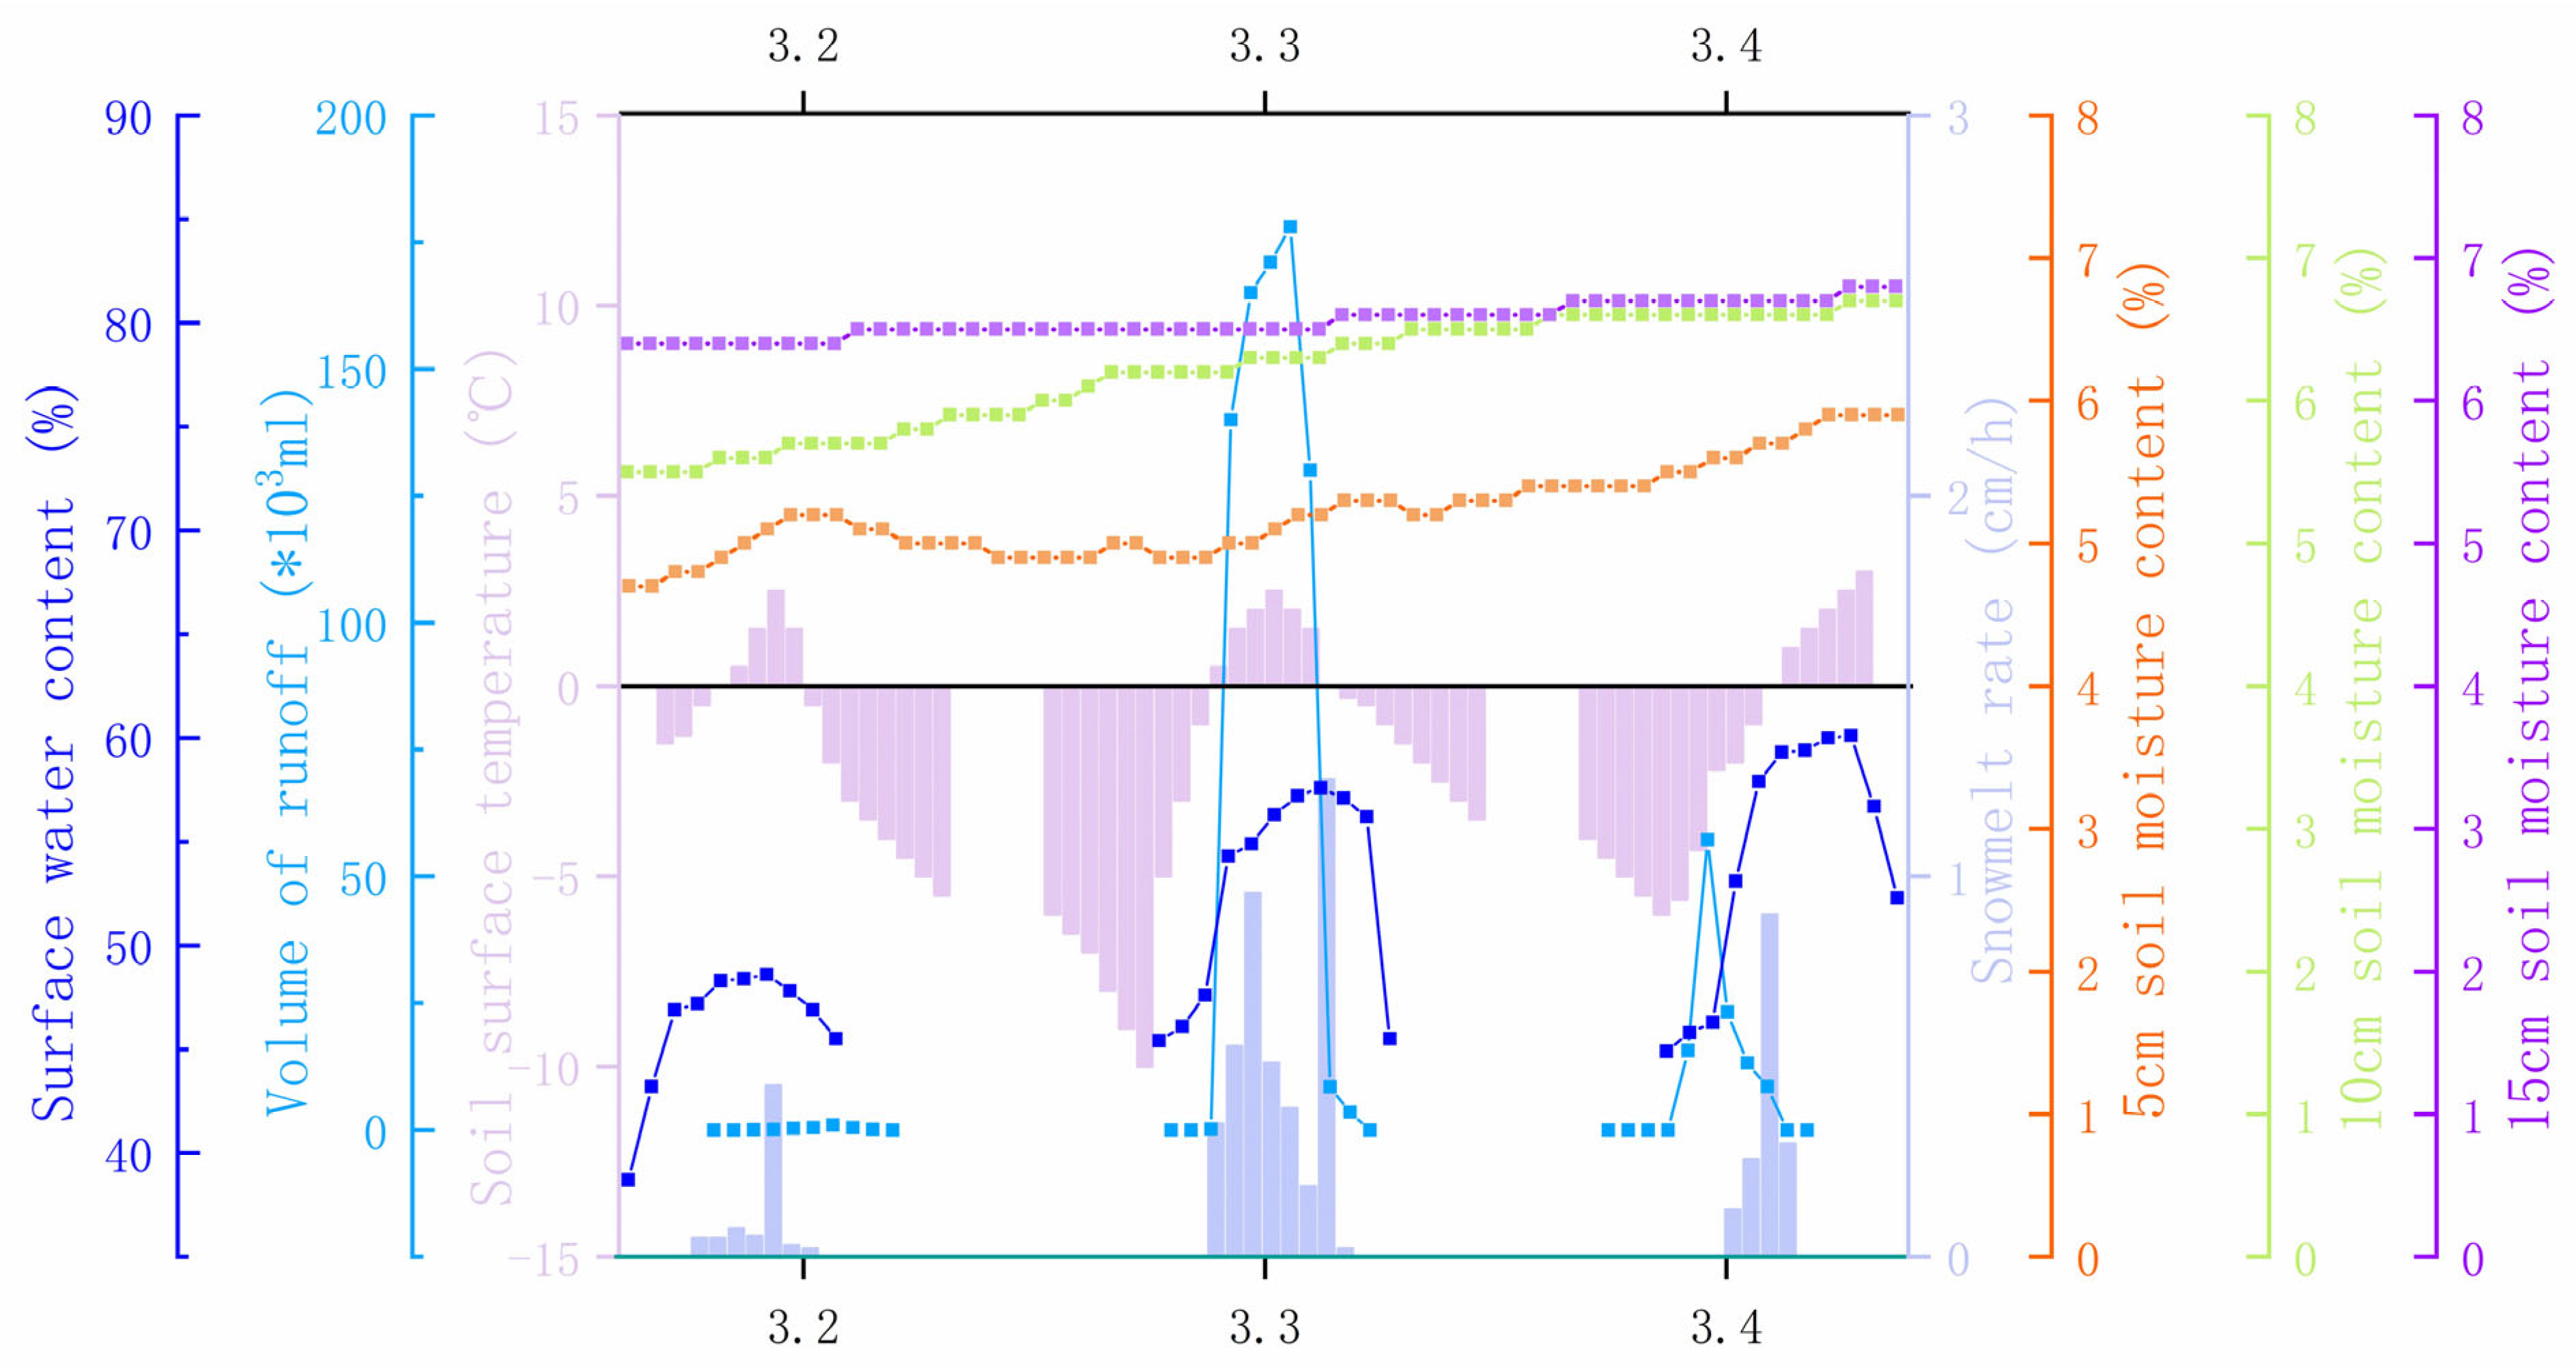
Figure A1. Changes in snowmelt rate, streamflow, surface temperature, and soil moisture content at different depths during the melting season.
Sustainability 17 08737 g0a1

Appendix A.2

Figure A2. Changes in snowmelt rate, streamflow, surface temperature, and soil moisture content at different depths during the melting season.
Sustainability 17 08737 g0a2

References

  1. Matiu, M.; Hanzer, F. Bias adjustment and downscaling of snow cover fraction projections from regional climate models using remote sensing for the European Alps. Hydrol. Earth Syst. Sci. 2022, 26, 3037–3060. [Google Scholar] [CrossRef]
  2. Bai, Q.; Zhou, L.; Fan, H.; Huang, D.; Yang, D.; Liu, H. Effects of Frozen Layer on Composite Erosion of Snowmelt and Rainfall in the Typical Black Soil of Northeast China. Water 2024, 16, 2131. [Google Scholar] [CrossRef]
  3. Zhang, X.; Ma, Y.Y.; Li, X.Y. Effects of freeze-thaw cycles and zeolite blending on black soil physical properties. Trans. CSAE 2020, 36, 144–151. [Google Scholar]
  4. Wang, L.; Zuo, X.; Zheng, F.; Wilson, G.V.; Xu, X.; Li, Z. The effects of freeze-thaw cycles at different initial soil water contents on soil erodibility in Chinese Mollisol region. CATENA 2020, 193, 104615. [Google Scholar] [CrossRef]
  5. Li, Y.; Sun, F.; Chen, Y.; Fang, G.; Li, Z.; Duan, W.; Qin, J.; Zhang, X.; Li, B. Unraveling the complexities of rain-on-snow events in High Mountain Asia. npj Clim. Atmos. Sci. 2025, 8, 118. [Google Scholar] [CrossRef]
  6. Sadiq, M.F.; Naqvi, M.W.; Cetin, B.; Ceylan, H. Role of temperature gradient and soil thermal properties on frost heave. Transp. Res. Rec. 2025, 2679, 217–226. [Google Scholar] [CrossRef]
  7. Liu, B.; Fan, H.; Jiang, Y.; Ma, R. Evaluation of soil macro-aggregate characteristics in response to soil macropore characteristics investigated by X-ray computed tomography under freeze-thaw effects. Soil Tillage Res. 2023, 225, 105559. [Google Scholar] [CrossRef]
  8. Zhou, X.; Zhu, Z.; Rezania, M. Multi-phase-field microporomechanics model for simulating ice-lens growth in frozen soil. Int. J. Numer. Anal. Methods Geomech. 2022, 46, 2307–2336. [Google Scholar]
  9. Liu, C.; Wu, Y.; Li, S. Formation mechanism of ice banding in freezing colloidal suspensions. Colloids Surf. A Physicochem. Eng. Asp. 2017, 529, 1012–1020. [Google Scholar]
  10. Geng, R.; Zhang, G.-H.; Hong, D.-L.; Ma, Q.-H.; Jin, Q.; Shi, Y.-Z. Response of soil detachment capacity to landscape positions in hilly and gully regions of the Loess Plateau. CATENA 2021, 196, 104852. [Google Scholar] [CrossRef]
  11. Kong, F.; Nie, L.; Xu, Y.; Rui, X.; He, Y.; Zhang, T.; Wang, Y.; Du, C.; Bao, C. Effects of freeze-thaw cycles on the erodibility and microstructure of soda-saline loessal soil in Northeastern China. CATENA 2022, 209, 105812. [Google Scholar] [CrossRef]
  12. Zhang, L.; Ren, F.; Li, H.; Cheng, D.; Sun, B. The influence mechanism of freeze-thaw on soil erosion: A review. Water 2021, 13, 1010. [Google Scholar] [CrossRef]
  13. Liu, B.; Ma, R.; Fan, H. Evaluation of the impact of freeze-thaw cycles on pore structure characteristics of black soil using X-ray computed tomography. Soil Tillage Res. 2021, 206, 104810. [Google Scholar] [CrossRef]
  14. Zhang, Y.-G.; Liu, S.-H.; Deng, G.; Fang, B.-X.; Zhang, Y.-Y.; Lu, Y. Effect of freeze-thaw cycles on mechanical behavior of clay-gravel mixtures. J. Mt. Sci. 2022, 19, 3615–3626. [Google Scholar] [CrossRef]
  15. Fang, H.Y.; Sheng, M.L.; Tang, Z.H.; Cai, Q.G. Assessment of soil redistribution and spatial pattern for a small catchment in the black soil region, Northeastern China: Using fallout 210Pbex. Soil Tillage Res. 2013, 133, 85–92. [Google Scholar] [CrossRef]
  16. GB/T 50123-2019; Standard for Geotechnical Testing Method. China Planning Press: Beijing, China, 2019.
  17. Fu, Q.; Hou, R.; Li, T.; Wang, M.; Yan, J. The functions of soil water and heat transfer to the environment and associated response mechanisms under different snow cover conditions. Geoderma 2018, 325, 9–17. [Google Scholar] [CrossRef]
  18. Abdi, H. Partial least squares regression and projection on latent structure regression (PLS Regression). Wiley Interdiscip. Rev. Comput. Stat. 2010, 2, 97–106. [Google Scholar] [CrossRef]
  19. Li, Z.; Xu, X.; Xu, C.; Liu, M.; Wang, K.; Yu, B. Annual runoff is highly linked to precipitation extremes in karst catchments of southwest China. J. Hydrometeorol. 2017, 18, 2745–2759. [Google Scholar] [CrossRef]
  20. Jia, S.; Li, H.; Wang, Y.; Tong, R.; Li, Q. Recursive Variable Selection to Update Near-Infrared Spectroscopy Model for the Determination of Soil Nitrogen and Organic Carbon. Geoderma 2016, 268, 92–99. [Google Scholar] [CrossRef]
  21. Mammadov, E.; Denk, M.; Riedel, F.; Kaźmierowski, C.; Lewinska, K.; Łukowiak, R.; Grzebisz, W.; Mamedov, A.I.; Glaesser, C. Determination of Mehlich 3 Extractable Elements with Visible and Near Infrared Spectroscopy in a Mountainous Agricultural Land, the Caucasus Mountains. Land 2022, 11, 363. [Google Scholar] [CrossRef]
  22. Fan, H.; Hou, Y.; Xu, X.; Mi, C.; Shi, H. Composite factors during snowmelt erosion of farmland in black soil region of northeast China: Temperature, snowmelt runoff, thaw depths and contour ridge culture. Water 2023, 15, 2918. [Google Scholar] [CrossRef]
  23. Wang, G.; Mao, T.; Chang, J.; Song, C.; Huang, K. Processes of runoff generation operating during the spring and autumn seasons in a permafrost catchment on semi-arid plateaus. J. Hydrol. 2017, 550, 307–317. [Google Scholar] [CrossRef]
  24. Jin, X.; Yang, W.; Gao, X.; Zhao, J.-Q.; Li, Z.; Jiang, J. Modeling the unfrozen water content of frozen soil based on the absorption effects of clay surfaces. Water Resour. Res. 2020, 56, e2020WR027482. [Google Scholar] [CrossRef]
  25. Lu, J.; Wang, T.-H.; Cheng, W.-C.; Yang, T.; Luo, Y. Permeability anisotropy of loess under influence of dry density and freeze–thaw cycles. Int. J. Geomech. 2019, 19, 04019103. [Google Scholar] [CrossRef]
  26. He, H.; Dyck, M.F.; Si, B.C.; Zhang, T.; Lv, J.; Wang, J. Soil freezing–thawing characteristics and snowmelt infiltration in Cryalfs of Alberta, Canada. Geoderma 2015, 5, 198–208. [Google Scholar] [CrossRef]
  27. Benard, P.; Schepers, J.R.; Crosta, M.; Zarebanadkouki, M.; Carminati, A. Physics of viscous bridges in soil biological hotspots. Water Resour. Res. 2021, 57, e2021WR030052. [Google Scholar] [CrossRef]
  28. Casagrande, A. Liquefaction and cyclic deformation of sands-a critical review. Harv. Soil Mech. Ser. Harv. Univ. Camb. Mass. 1976, 88, 10006781910. [Google Scholar]
  29. Ambraseys, N.; Sarma, S. Liquefaction of soils induced by earthquakes. Bull. Seismol. Soc. Am. 1969, 59, 651–664. [Google Scholar] [CrossRef]
  30. Terzaghi, K.; Peck, R.B. Soil Mechanics: Engineering Practice; John Wiley & Sons, Inc.: New York, NY, USA, 1948. [Google Scholar]
  31. Shi, Y.; Zhang, L.; Ma, W.; Yang, C.; Han, D.; Shang, F. Investigating unfrozen water and its components during freeze–thaw action in loess using a novel NMR technique. Eur. J. Soil Sci. 2022, 73, e13262. [Google Scholar] [CrossRef]
  32. Gulin, D.A.; Fayzullina, E.V.; Sharipova, E.I.; Sultanmagomedov, S.M.; Nasibullin, T.R. Analysis of the Stress-Strain State of the Pipeline in the Areas of Frost Heaving of the Soil Using the SCAD Software Package. IOP Conf. Ser. Earth Environ. Sci. 2021, 666, 042084. [Google Scholar] [CrossRef]
  33. Franzluebbers, A.J. Water infiltration and soil structure related to organic matter and its stratification with depth. Soil Tillage Res. 2002, 66, 197–205. [Google Scholar] [CrossRef]
  34. Li, X.K.; Li, X.; Wu, Y.; Wang, F. Experimental study on service performance of capillary barrier cover with unsaturated drainage layer. Chin. J. Geotech. Eng. 2022, 44, 189–194. [Google Scholar]
  35. Sun, B.; Ren, F.; Ding, W.; Zhang, G.; Huang, J.; Li, J.; Zhang, L. Effects of freeze-thaw on soil properties and water erosion. Soil Water Res. 2021, 16, 205–216. [Google Scholar] [CrossRef]
  36. Ghazavi, M.; Roustaie, M. The influence of freeze–thaw cycles on the unconfined compressive strength of fiber-reinforced clay. Cold Reg. Sci. Technol. 2010, 61, 125–131. [Google Scholar] [CrossRef]
  37. Qiao, J.; Zhu, Y.; Jia, X.; Huang, L.; Shao, M. Development of pedotransfer functions for predicting the bulk density in the critical zone on the Loess Plateau, China. J. Soils Sediments 2019, 19, 366–372. [Google Scholar] [CrossRef]
  38. To, P.; Agius, D.; Cussen, L. Influence of relative density of the granular base soil on filter performance. Acta Geotech. 2020, 15, 3621–3627. [Google Scholar] [CrossRef]
  39. Han, Y.; Wang, Q.; Wang, N.; Wang, J.; Zhang, X.; Cheng, S.; Kong, Y. Effect of freeze-thaw cycles on shear strength of saline soil. Cold Reg. Sci. Technol. 2018, 154, 42–53. [Google Scholar] [CrossRef]
  40. Oztas, T.; Fayetorbay, F. Effect of freezing and thawing processes on soil aggregate stability. CATENA 2003, 52, 1–8. [Google Scholar] [CrossRef]
  41. Duan, Z.; Li, Z.Y.; Wu, Y.B.; Niu, B.; Shen, R.J. Mechanical and microscopic properties of soil according to the rate of increase in pore water pressure. Soil Tillage Res. 2023, 225, 105530. [Google Scholar] [CrossRef]
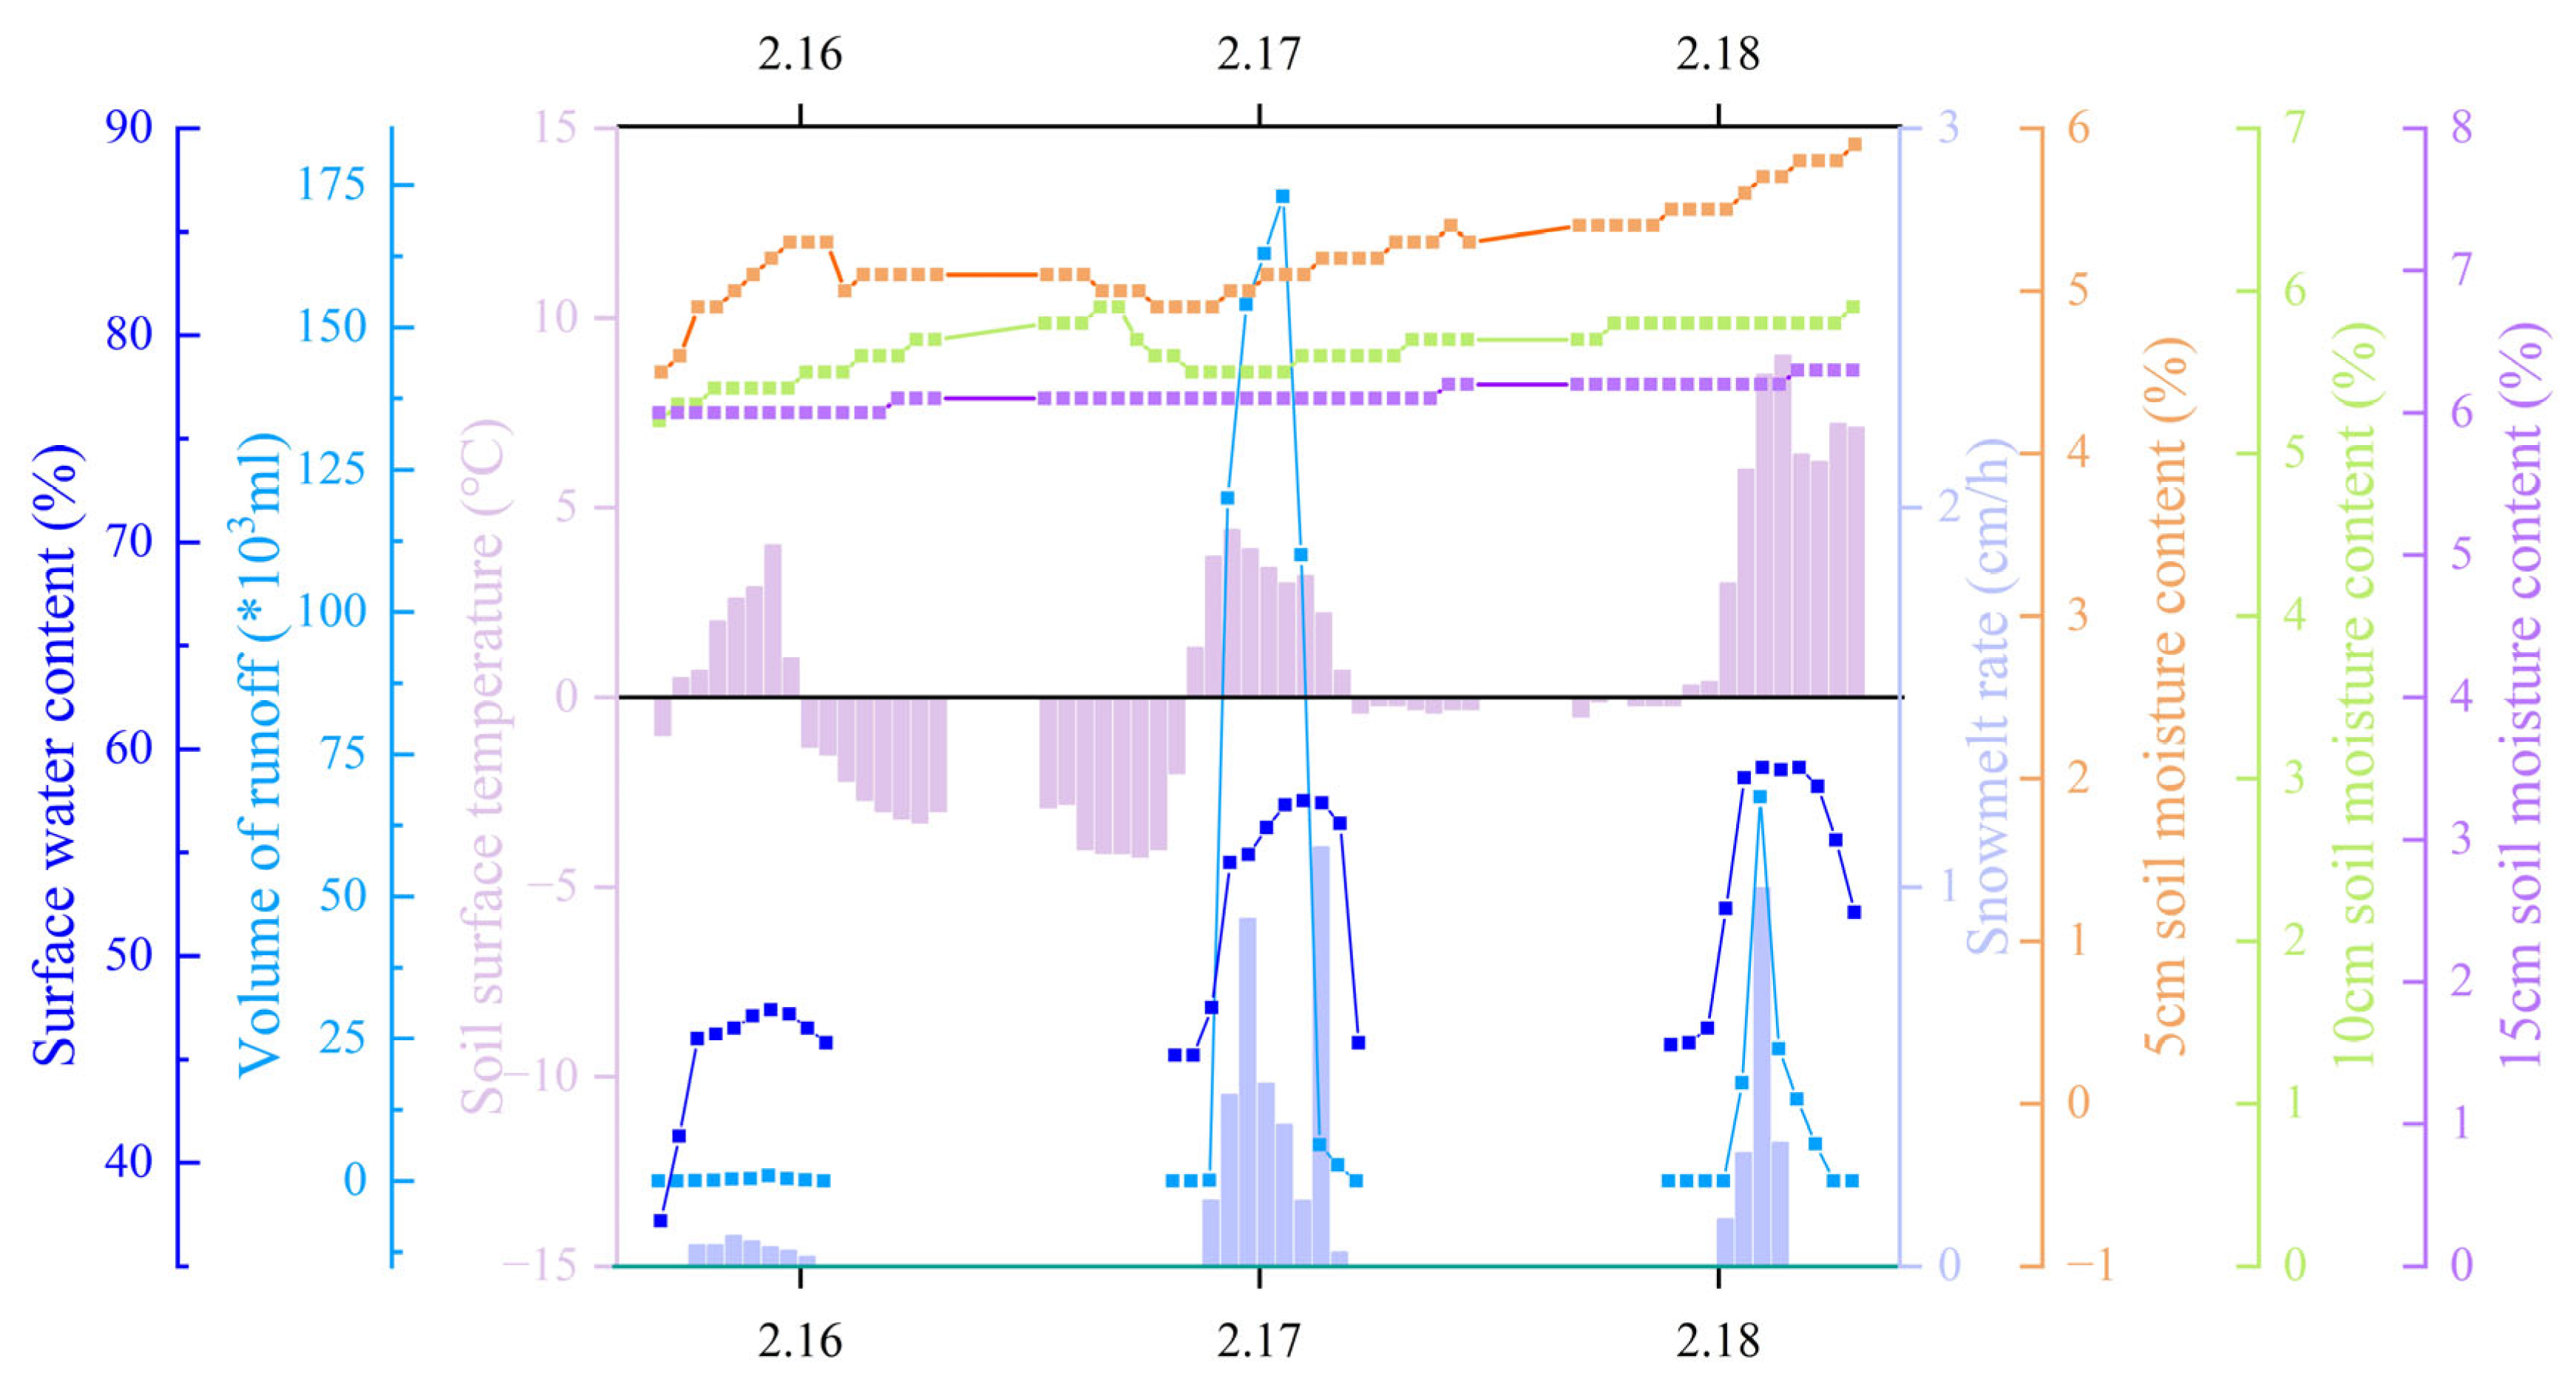
Figure 1. Changes in snowmelt rate, streamflow, surface temperature, and soil moisture content at different depths during the melting season.
Sustainability 17 08737 g001
Figure 2. Soil erosion dynamics during a 20-min snowmelt process under different initial soil moisture conditions. Black and white (transparent) dots indicate a significant (p < 0.05) and non-significant correlation with time, respectively.
Sustainability 17 08737 g002
Figure 3. Changes in SMVM and erosion volume during freeze–thaw cycles.
Sustainability 17 08737 g003
Figure 4. Contribution of SMVM changes to soil erosion quantity.
Sustainability 17 08737 g004
Figure 5. Bivariate scatter plot matrix of the measured influencing factors in the partial least squares regression (PLSR) analysis. Here, UW, P, and OC represent unit weight, porosity, and osmotic coefficient, respectively, and s, m, and g represent the 0–5, 5–10, and 10–15 cm soil layers, respectively.
Sustainability 17 08737 g005
Table 1. Soil mechanical composition.
Soil
Sample
(cm)
Medium Sand
~1.00–0.25
Fine Sand
~0.25–0.05
Coarse Silt
~0.05–0.01
Physical Sand
Particles
>0.01
Medium Silt
~0.01–0.005
Fine Silt
~0.005–0.001
Clay
<0.001
Physical Clay
Particles
<0.01
Black soil (mL)0.54.226.731.410.315.542.868.6
Table 2. Grey correlation between soil moisture vertical migration and soil layer structure.
Soil Depth (cm)Soil HeaveWater Storage SpacePorosity
0–50.950.840.47
5–100.990.930.35
10–150.990.940.60
Table 3. Ridge regression models for soil moisture and soil erosion.
Soil Depth
(cm)
Initial
Water
Content
Water
Content
Range
Connection Between SMVM and Soil Erosion AmountR2
0–50.420.58–0.72A = 0.451 + 2.692 × X10.82 ***
5–100.350.44–0.49A = 0.247 + 6.757 × X20.68 **
10–150.350.29–0.43A = 0.983 + 2.117 × X30.56 ***
Asterisks indicate statistically significant differences compared to the control group. **, p < 0.01; ***, p < 0.001.
Table 4. VIP values of the PLSR model.
ItemsUWsUWmUWgPsPmPgOCsOCmOCg
VIP0.8440.8761.0560.7660.8971.0881.3270.6441.286
where UW, P, and OC represent the unit weight, porosity, and osmotic coefficient, respectively, and s, m, and g represent the 0–5, 5–10, and 10–15 cm soil depths, respectively.
Table 5. Grey correlation between soil erosion and mechanical properties.
Soil Depth (cm)Internal Friction AngleCohesion
0–50.670.718
5–100.7220.779
10–150.8070.71
Disclaimer/Publisher’s Note: The statements, opinions and data contained in all publications are solely those of the individual author(s) and contributor(s) and not of MDPI and/or the editor(s). MDPI and/or the editor(s) disclaim responsibility for any injury to people or property resulting from any ideas, methods, instructions or products referred to in the content.